development partnerships thematic report first...
TRANSCRIPT

Development Partnerships Thematic Report
Mid-Term Review of the Uganda National Development Plan
Prepared by Delta Partnership in Association with REEV Consult for the National Planning Authority

Page | i
CONTENTS
ACRONYMS .................................................................................................... iv
EXECUTIVE SUMMARY................................................................................. vi
1. INTRODUCTION .......................................................................................... 1
1.1 Background .......................................................................................................................... 1
1.2 Situational analysis ............................................................................................................. 2
1.3 Study approach ................................................................................................................... 5
1.4 Organisation of the report .................................................................................................. 8
2 RECENT TRENDS IN UGANDA’S OVERALL DEVELOPMENT
PARTNERSHIP ....................................................................................... 10
2.1 Overview ............................................................................................................................. 10
2.2 Development assistance trends ...................................................................................... 11
2.3 The framework for partnership in Uganda ..................................................................... 19
2.4 Challenges facing government-donor relationships .................................................... 19
3 DEVELOPMENT PARTNER ALIGNMENT ........................................... 22
3.1 Overview ............................................................................................................................. 22
3.2 Mechanisms to secure development partner alignment with the NDP ..................... 22
3.3 Donor priorities and alignment with the NDP ................................................................ 24
3.4 Development partners’ contribution to NDP progress ................................................. 28

Page | ii
4 HARMONISATION, TRANSACTION COSTS AND MUTUAL
ACCOUNTABILITY ................................................................................. 31
4.1 Overview ............................................................................................................................. 31
4.2 Harmonisation and transaction costs ............................................................................. 31
4.3 Mutual accountability ........................................................................................................ 34
5 DEVELOPMENT ASSISTANCE FROM NON-TRADITIONAL
PARTNERS ............................................................................................. 36
5.1 Overview ............................................................................................................................. 36
5.2 Trends in support from non-traditional sources ............................................................ 36
5.3 Aid from non-traditional development partners and alignment with the NDP .......... 37
5.4 Key aspects of the future development partnership with non-traditional partners .. 37
6 CROSS-CUTTING ISSUES ................................................................... 39
6.1 Overview ............................................................................................................................. 39
6.2 Social protection ................................................................................................................ 39
6.3 Human rights ...................................................................................................................... 39
6.4 Democracy and political governance ............................................................................. 40
6.5 Child rights ......................................................................................................................... 41
7 CONCLUSIONS AND RECOMMENDATIONS ..................................... 42
7.1 Summary of overall findings ............................................................................................ 42
7.2 Recommendations for the remainder of the first NDP ................................................ 45
7.3 Recommendations for the next NDP ............................................................................. 48

Page | iii
Annex 1. DISTRICT REPORTS .......................................................... 50
Annex 2. AID DATA TABLES .............................................................. 60
Annex 3. Uganda’s Joint Budget Support Framework ...................... 75
Annex 4. Donor division of labour ....................................................... 81

Page | iv
ACRONYMS
FP Budget Framework Paper
BoU Bank of Uganda
CSO Civil Society Organisation
DDP District Development Plan
EAC East African Community
EPRC Economic Policy Research Centre
FBO Faith Based Organisation
GAPR Government Annual Performance Report
GDP Gross Domestic Product
GoU Government of Uganda
IFC International Finance Corporation
IGG Inspectorate of Government
JBSF Joint Budget Support Framework
JLOS Justice Law and Order Sector
LDPG Local Development Partners Group
LGDP Local Government Development Plan
LGFC Local Government Finance Commission
MDA Ministry / Department / Agency
MoAAIF Ministry of Agriculture, Animal Industries and Fisheries
MoD Ministry of Defence
MoEACA Ministry of East African Community Affairs
MoEMD Ministry of Energy and Minerals Development
MoES Ministry of Education & Science
MoFPED Ministry of Finance, Planning and Economic Development
MoGLSD Ministry of Gender, Labour and Social Development
MoH Ministry of Health
MoIA Ministry of Internal Affairs
MoICT Ministry of Information and Communications Technology
MoJCA Ministry of Justice and Constitutional Affairs
MoLHUD Ministry of Lands, Housing and Urban Development
MoTIC Ministry of Trade, Industry and Commerce
MoTWH Ministry of Tourism, Wildlife and Heritage

Page | v
MoWE Ministry of Water and Environment
MoWT Ministry of Works and Transport
MPS Ministerial Policy Statement
MTEF Medium Term Expenditure Framework
MTR Mid Term Review
NDP National Development Plan
NDR National Development Report
NPA National Planning Authority
OBT Output Based Tool
OoP Office of the President
OPM Office of the Prime Minister
PEAP Poverty Eradication Action Plan
PIP Public Investment Plan
PPP Public Private Partnership
PSFU Private Sector Foundation of Uganda
SACCO Savings and Credit Cooperative
SIP Sector Investment Plan
SMEs Small and Medium Enterprises
STA Science and Technology Agency
SWG Sector Working Group
ToR Terms of Reference
UAAU Urban Authorities Association of Uganda
UBOS Uganda Bureau of Statistics
URA Uganda Revenue Authority
Page | vi
EXECUTIVE SUMMARY
This thematic paper, which forms part of the mid-term review (MTR) of Uganda’s
National Development Plan (NDP), examines development partnerships. In the
context of a set of questions that were agreed in advance, the review focuses on:
recent overall trends in Uganda’s development partnership including trends in the
volume and direction of aid; development partner alignment with the NDP; the
progress that has been made during the NDP in improving harmonisation, reducing
transaction costs, and strengthening mutual accountability; and the growing
importance of development assistance from Uganda’s non-traditional development
partners.
In both real terms and as a percentage of GDP, development assistance has
continued to decline during the NDP period, but in nominal terms it has remained
constant and for the moment donor financing remains very important in Uganda’s
development. Finance provided “on budget” still constitutes over 20 per cent of
overall government expenditure and over 40 per cent of the development budget. In
addition there are substantial resources provided by donors outside the
government’s budget framework.
All Uganda’s main donors claim strong alignment with NDP priorities in both their
strategy documents and through their programming. These claims to some extent
reflect the broad range of NDP objectives and importantly depend on the
government’s own sector strategic investment plans and the Joint Budget Support
Framework (JBSF) aligning effectively behind the NDP. But it is clear that during the
NDP period there has been a clear re-allocation of both “on budget” and “off budget”
project aid in line with the NDP’s aim to broaden Uganda’s development strategy
from poverty reduction to structural transformation to raise growth and living
standards. Although progress against many NDP objectives has been disappointing,
donor support has been associated with important aspects of the progress that has
been made. Development assistance has continued to help underpin
implementation of key sector strategic plans. The large multilateral donors in
particular have set aside resources for some of the NDP’s core projects. The JBSF

Page | vii
has helped emphasise the achievement of results. Donor technical assistance is
helping to build the capacity required for effective NDP implementation.
At the same time the thematic paper highlights that the contribution development
partners are making to NDP implementation is severely constrained by a set of
factors that are undermining the development partnership and aid impact. A new
Partnership Policy that was intended to provide the basis for the aid relationship
during the NDP by codifying commitments on both sides of the development
partnership has not yet been finalised and agreed. Development partner concerns
about governance and corruption have become increasingly serious against the
background of a series of high profile corruption cases and persistent questions
about performance and results in the context of the JBSF. Levels of budget support,
the NDP’s preferred instrument for development assistance, have been in decline
and will almost certainly decline further.
Without a Partnership Policy in place it has been difficult for the NDP to be a focus
for progress on the wider agenda for improving aid effectiveness. Progress is slow
in increasing the use of country public financial management and procurement
systems. A decline in the use of programme based approaches (including budget
support) appears to have led to a fall in development partner use of common
arrangements and procedures. Progress made in the past in rationalising the donor
division of labour seems to have been reversed. Although the JBSF has provided a
partial framework for mutual accountability the joint memorandum of understanding
that was meant to govern the arrangement has not yet been signed.
There are risks in the medium term to the financing of the NDP if current difficulties
in the relationship between donors and government persist. Traditional development
partners could increasingly use “off budget” channels for disbursement that may be
more difficult to align with the NDP. Non- traditional partners are an increasingly
important source of finance, but still contribute less than 10 per cent of all
development finance much of which is in the form of loans. Revenue from oil which
in due course will significantly outweigh development assistance is not expected to
flow until 2018 and there are risks that production will be delayed.

Page | viii
The recommendations of this thematic paper are focused on ensuring Uganda’s
development partnership makes a strong contribution to the achievement of NDP
objectives going forward.
A key initial step will be strong government leadership to bring the Partnership Policy
back on the agenda and agree a version with development partners that provides a
robust framework for the management of aid in support of NDP implementation set in
the context of international agreements on aid effectiveness. Within the framework
of a new partnership policy the priorities should be:
Government action to improve and secure the reliability of public financial
management and procurement systems to firmly address donor concerns about
putting resources through government channels.
The identification of alternative aid modalities which, on the assumption that
budget support will continue to decline, will maintain the advantages of
programme based approaches (perhaps with enhanced fiduciary controls). Joint
funding arrangements used in the past might provide a model.
Ensuring sector working group processes work effectively to align “on budget”
and “off budget” development assistance behind the NDP. Improving the
alignment of sector strategic investment plans may need to be a starting point.
The government should consider a firmer approach to managing aid that is not
aligned with the NDP (which might involve its rejection).
The engagement of non- traditional development partners more effectively in
sector working group processes to help co-ordinate their support within the NDP
framework.
Action to accelerate the introduction of the government’s new aid management
information system to help improve aid transparency and the government’s ability
to manage development assistance in support of the NDP.
Implementation of a new division of labour exercise to address the current trend
towards an inefficient spread of effort and resources.
Ensuring effective arrangements for high level policy dialogue and mutual
accountability are in place (especially if the JBSF is dismantled).
Page | ix
Close involvement of development partners in the preparation of the next NDP to
ensure a strong understanding of government priorities and alignment of their
resources.
In addition to these findings and recommendations, the report includes the key points
from six reports that were commissioned separately alongside the core mid-term
review to assess the degree to which cross-cutting issues have been addressed
during NDP implementation. The cross-cutting reports found that development
partner support had produced some notable results during NDP implementation. In
particular, development partner support was a key reason for the improved
performance of the justice, law and order (JLOS) sector, and was critical to
maintaining immunisation programmes as GoU funding to such activities decreased.
Further, the social protection report states that social protection programmes are
highly reliant on development partner support to function. The human rights report
states that development partners were not adequately involved in the development
of the NDP, and could therefore be more substantially involved in the development of
the next NDP.

Page | 1
1. INTRODUCTION
1.1 Background
This report on development partnerships forms one part of the six parts of an
independent mid-term review (MTR) of Uganda’s National Development Plan (NDP)
2010/11 to 2014/15 commissioned by the National Planning Authority (NPA). The five
other thematic areas of the MTR are: results framework; policy and strategic direction;
institutional framework; economic management; and political economy; as well as an
overall synthesis report. Separate work has been conducted on the cross-cutting
issues of gender, environment, social protection, human rights, child rights and well-
being, and democracy and political governance which has been included in the mid-
term review thematic reports.
The terms of reference for the review emphasise the importance of highlighting the
challenges encountered during the two and a half years of implementation of the plan
and of making recommendations for the plan’s remaining period. The recommendations
are also expected to inform the development of the next NDP.
The NDP succeeded Uganda’s Poverty Eradication Action Plan (PEAP) which started in
1997 and was subsequently revised in 2000 and 2004. The PEAP, which was
developed in a participatory framework and strongly supported by Uganda’s
development partners in the framework of international debt relief initiatives, is widely
recognised for its impact in helping to sustain growth and poverty reduction over an
extended period of time. A national evaluation of the PEAP in 2008 however identified
a number of weaknesses in its approach and highlighted constraints to continued
progress including the achievability of the long term target of reducing headcount
poverty to 10 per cent by 2017. It was in this context that the first NDP was launched in
2010.
The NDP maintains the PEAP’s poverty eradication vision but with an additional
emphasis on economic transformation and wealth creation. It emphasises the
importance of planning based on strong political commitment and is intended to provide

Page | 2
a guide for all government decision-making, especially the allocation of resources,
including aid, through the medium term expenditure framework.
The NDP aims to support improved productivity in the agricultural sector while ensuring
that workforce released by these productivity gains are effectively absorbed by newer,
higher value, export focused sectors of the economy, and such development will be led
by the private sector. Maintaining macroeconomic stability is identified as critical to
providing an appropriate environment within which private sector development can
flourish. The main sources of economic growth are expected to come from the 8
‘primary growth sectors’ which are stated as agricultural development, forestry, tourism,
mining, oil and gas, manufacturing, information and communications technology (ICT)
and housing development.
The NDP identifies the required improvement in complementary sectors of the
economy; most notably energy, water, transport and financial services. The Plan
outlines the need for more trained professionals and better quality infrastructure to
increase the potential for Uganda’s health and education systems to boost Uganda’s
human capital and to provide necessary increases in the skilled workforce needed to
support economic development. Special attention is afforded to the need to tackle the
high levels of population growth, gender inequality and the impact of HIV/AIDS on
society. The NDP acknowledges and arguably identifies the key constraint to further
economic development as the enabling sector and outlines a number of improvements
required in public- sector administration and management to address the criticisms
identified in the evaluation of the PEAP. It also emphasises the role of the service
sector as a major source of employment and attempts to harness this for increased
growth.
1.2 Situational analysis
The development partnership theme of the MTR focuses exclusively on partnerships
between the Government of Uganda and its official bilateral and multilateral
development partners, often referred to as donors. Relationships with Non-
Governmental Organisations (NGOs), Civil Society Organisations (CSOs) and private
sector organisations are discussed in other thematic reports, especially the Political
Economy, Institutional Framework and Economic Management papers.
Page | 3
Donor engagement in NDP preparation
Whereas development partners were very closely consulted in the preparation of
Uganda’s PEAPs, donors were relatively detached from the preparation of the NDP.
They also provided much less technical assistance funding to support its drafting,
probably due to the more nationalistic approach to planning that was adopted. On the
part of government there was a particularly strong desire to present the NDP as very
much its own strategy. The PEAPs had been sometimes characterised as “donor
driven”1
Donors endorsed the NDP once it was published. A Joint Staff Advisory Note prepared
by the IMF and World Bank concluded that both the macro-economic framework and
sector specific plans contained in the NDP were “compatible” with the government’s
vision of structurally transforming the economy. But a number of suggestions were
made to strengthen its implementation including clearer prioritisation of investments,
actions to make growth more inclusive, the preservation of space for private sector
initiatives, and the strengthening of the legal and fiscal framework for public private
partnerships.
Development partnerships in the NDP
The NDP recognises the important role of Official Development Assistance (ODA)
provided by partner governments and international organisations in Uganda’s recovery,
growth and poverty eradication efforts in the period after 1986, and especially during
the PEAP period from 1997 onwards. Although aid as a proportion of government
expenditure has since fallen significantly as domestic revenue has increased, the Plan
also recognises that in the short to medium term development assistance continues to
1 The limited involvement and influence of development partners in the NDP’s formulation was noted in
the 2011 survey of Uganda’s progress in implementing the Paris Declaration which at the same time
observed a high degree of involvement by the private sector, local government structures, civil society
and NGOs.

Page | 4
have an important role to play. In order to establish a framework for partnership the
Plan proposes a new Partnership Policy to update the Partnership Principles that
governed the relationship between government and donors during the PEAPs
The Partnership Policy was intended to have six core elements, based on the principles
of the 2005 Paris Declaration on aid effectiveness, to ensure:
All development assistance is aligned with the objectives and priorities of the NDP;
Development partners follow a set of guidelines aimed at reducing transaction costs
including through their choice of aid modality and aid management arrangements
(with budget support the government’s preferred aid instrument);
Strong dialogue between government and development partners (and other
stakeholders) in particular through an effective line of communication between the
Local Development Partners’ Group (LDPG) and mechanisms for national co-
ordination under the leadership of the Office of the Prime Minister;
Better information on aid flows and improved aid predictability;
Strong mutual accountability between government and development partners
including through new arrangements for assessing performance against agreed
commitments; and
Progress is made in Uganda’s specific context on the global partnership for
development captured in the 8th Millennium Development Goal of developing a
global partnership for development.
In practice, although the Partnership Policy has been drafted, jointly discussed at length
and subsequently amended, a final version is yet to be approved by Cabinet or agreed
with development partners. The questions the development partnership theme is asked
to assess in relation to the implementation of the NDP require, for a large part, an
examination of the extent to which the intentions of the Partnership Policy have been
followed in the absence of a formally agreed document.
Development partnership in the PEAP evaluation
Development partnership was also one of the themes covered by the evaluation of the
PEAP in 2008. In aggregate aid increased over the PEAP period, but remained
unpredictable and volatile and towards the end falls in the level of assistance for
development may have been masked by rising humanitarian aid to address the

Page | 5
implications of conflict and displacement in Northern Uganda. The PEAP evaluation
focused on the partnership dimensions of alignment, harmonisation, transaction costs,
mutual accountability, and progress in donors providing aid through budget support as
their principal disbursement modality.
The evaluation devoted considerable space to the problem of identifying a common
understanding or definition of these aspects of partnership. It concluded in broad terms
that the PEAP made a tangible and significant contribution to partnership, particularly at
sectoral level, but that the gains made fell short of the expectations of both government
and development partners as well as the aims of the Partnership Principles. Progress
was most significant in improving dialogue and alignment between government and
development partners. Budget support increasingly became the preferred modality for
disbursing aid over much of the lifetime of the PEAP although this trend started to
reverse in the wake of Uganda’s 2006 general election as the PEAP period drew to a
close. Harmonisation between development partners improved. But there was much
less progress in reducing transaction costs in particular because of the burdens
imposed by co-ordination and dialogue processes. There was little advancement on
the issue of mutual accountability as the search for a mechanism for assessing the
performance of development partners (for example against the standards of the
Partnership Principles) proved elusive.
The recommendations of the evaluation covered: the need for stronger government
leadership in promoting the deepening of the partnership with donors; the possibility of
moving to a more contractual relationship in which commitments and obligations are
more clearly articulated; the introduction of a peer review mechanism in which
development partners monitor each other’s performance; and the establishment of a
mechanism that would remove the uncertainty associated with aid flows by donors
collectively committing to provide a guaranteed amount and making up shortfalls arising
from any individual donors not meeting their targets. There has in practice been little
progress in taking any of these recommendations forward. Not all were realistic.
1.3 Study approach
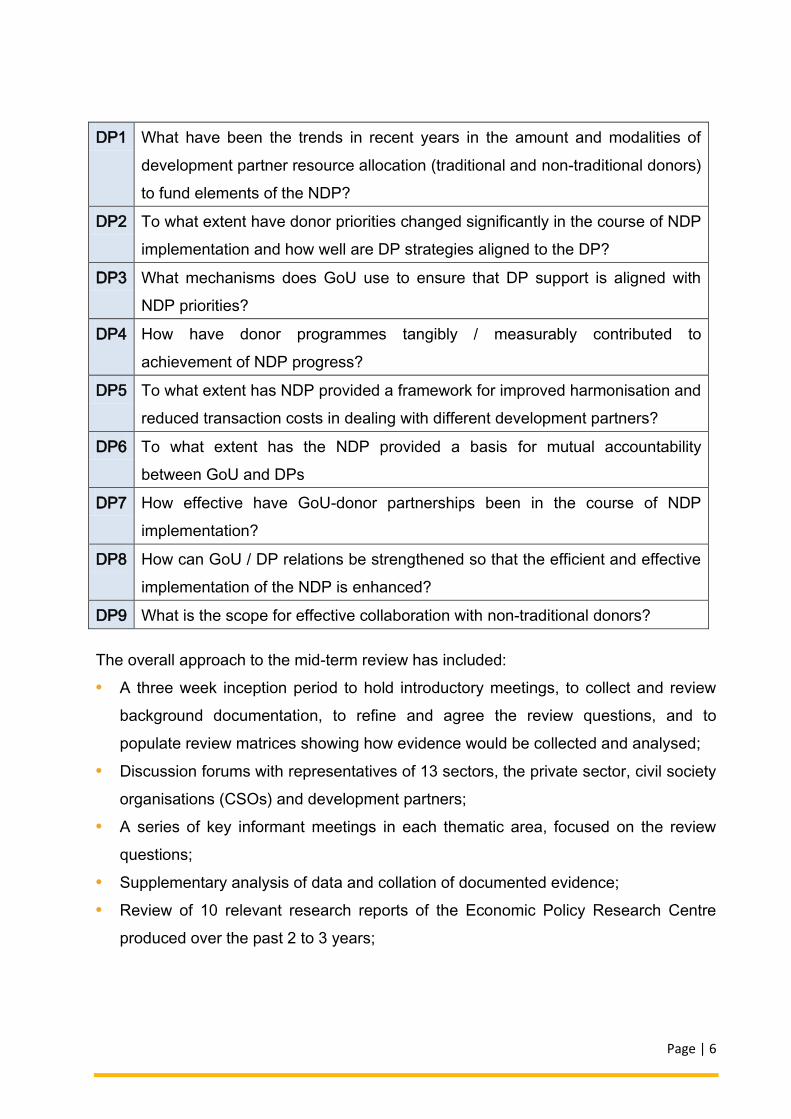
It was agreed as part of the inception report that the Development Partnerships
thematic report will cover the following review questions:
Page | 6
DP1 What have been the trends in recent years in the amount and modalities of
development partner resource allocation (traditional and non-traditional donors)
to fund elements of the NDP?
DP2 To what extent have donor priorities changed significantly in the course of NDP
implementation and how well are DP strategies aligned to the DP?
DP3 What mechanisms does GoU use to ensure that DP support is aligned with
NDP priorities?
DP4 How have donor programmes tangibly / measurably contributed to
achievement of NDP progress?
DP5 To what extent has NDP provided a framework for improved harmonisation and
reduced transaction costs in dealing with different development partners?
DP6 To what extent has the NDP provided a basis for mutual accountability
between GoU and DPs
DP7 How effective have GoU-donor partnerships been in the course of NDP
implementation?
DP8 How can GoU / DP relations be strengthened so that the efficient and effective
implementation of the NDP is enhanced?
DP9 What is the scope for effective collaboration with non-traditional donors?
The overall approach to the mid-term review has included:
• A three week inception period to hold introductory meetings, to collect and review
background documentation, to refine and agree the review questions, and to
populate review matrices showing how evidence would be collected and analysed;
• Discussion forums with representatives of 13 sectors, the private sector, civil society
organisations (CSOs) and development partners;
• A series of key informant meetings in each thematic area, focused on the review
questions;
• Supplementary analysis of data and collation of documented evidence;
• Review of 10 relevant research reports of the Economic Policy Research Centre
produced over the past 2 to 3 years;
Page | 7
• Assessment of the national development planning experiences in the four
comparator countries mentioned in the NDP itself – Kenya, Ghana, Malaysia and
South Korea;
• Visits to 12 districts / municipalities to obtain data and opinion surrounding NDP
implementation at local government level;
• Two meetings with a Technical Committee to present and get feedback on progress;
• Internal meetings to peer review the quality and robustness of analysis and
interpretation;
• Preparation of the zero draft thematic reports;
• Presentation of draft thematic findings and recommendations to the extended
management team of the NPA;
• Conduct of meetings with the NPA review manager to obtain and incorporate verbal
comments into the first draft thematic reports;
• Presentation of updated drafts reports to the Ministry of Finance, Planning and
Economic Development (MoFPED), the Extended NPA Board and the committee of
Permanent Secretaries chaired by the Cabinet Secretary;
• Incorporation of comments on the updated draft reports.
More specifically preparation of the development partnership theme report has
included:
A round table discussion with the joint Local Development Partner Group, which
included Heads of Mission;
Detailed bilateral meetings with 13 of Uganda’s main multilateral and bilateral
development partners;
A number of bilateral meetings with key officials in the National Planning Authority,
the Office of the Prime Minister and the Ministry of Finance, Planning and Economic
Development, as well as participation in overall MTR meeting with sector ministries;
A round table discussion with donor representatives in the sector working groups
covering accountability, agriculture, education, energy, health, roads and transport,
social development, and water;
Detailed involvement in MTR visits to Gulu and Amolatar Districts in Northern
Uganda (in the context of the government’s Peace, Recovery and Development
Plan).

Page | 8
The development partnership theme has also included detailed analysis of statistics
covering the volume and direction of Uganda’s aid. There are two main sources of
information about development assistance to Uganda; the data held by the Aid Liaison
Department of the Ministry of Finance, Planning, and Economic Development
(MoFPED) which is based on donor reporting in Kampala; and data published by the
OECD based on reporting from donor capitals. For a number of reasons the two data
sets are not identical. They cover different time periods – MoFPED data relates to the
Ugandan financial year while OECD data is published on a calendar year basis.
MoFPED data better captures aid from non-DAC donors. OECD data probably better
captures aid which donors provide “off budget” for example through civil society,
although MoFPED is trying hard to make its statistics fully comprehensive. The OECD
applies a strict definition of Official Development Assistance (ODA)2 which in places
may be blurred in the data collected by MoFPED.
The analysis in this report is based largely on the data collected by MoFPED. This is
the information that is built into the annual and medium term fiscal framework through
which the NDP is being implemented and, for these purposes, it is disaggregated by the
sectors that are used in budgeting making it easier to assess how donors are
supporting NDP priorities.
1.4 Organisation of the report
The remainder of this report is organised into the following sections:
Section 1 explains the context in which the development partnership thematic paper
for the mid-term review has been prepared including the background to the MTR
itself, the way in which the NDP covers development partnerships, the approach that
has been used in preparing the thematic paper, and the way in which the paper has
been organised.
2 OECD DAC defines official development assistance as financial flows from official agencies, which are
administered with the promotion of the economic development and welfare of developing countries as
their main objective; and which are concessional in character and convey a grant element of at least 25
per cent (calculated at a rate of discount of 10 per cent).

Page | 9
Section 2 presents an overview of recent trends in the development partnership,
including trends in the volume and direction of aid;
Section 3 considers the question of development partner alignment with the NDP
and the contribution development partnership has made to the NDP’s progress;
Section 4 considers progress against the objectives of harmonisation, reduced
transaction costs and mutual accountability;
Section 5 examines the role of Uganda’s non-traditional development partners;
Section 6 looks at the cross-cutting issues; and
Section 7 draws together the main conclusions and makes recommendations.

Page | 10
2 RECENT TRENDS IN UGANDA’S OVERALL DEVELOPMENT
PARTNERSHIP
2.1 Overview
This section explains key recent trends in Uganda’s overall development partnership. It
answers the review question about the effectiveness of government and donor
partnerships during the course of the NDP. It also answers the review question covering
recent trends in the amount and modalities of development assistance that have been
provided to support the NDP. It provides an introduction to sections 3 and 4 which cover
other detailed aspects of the development partnership.
The assessment of the strength of development partnerships during NDP
implementation in this thematic paper is based in part on the specific questions about
alignment, mutual accountability, harmonisation, and transaction costs that the paper is
asked to answer.
These questions have been set in the context of the Paris (2005), Accra (2008) and
Busan (2011) international agreements on aid effectiveness and development
partnership. The Paris Declaration and Accra Agenda for Action in particular focus on
five core principles for effective development which emphasise the importance of:
developing countries setting their own strategies for poverty reduction, improving their
institutions and tackling corruption (ownership); donor countries aligning behind these
objectives and using local systems (alignment); donor countries coordinating,
simplifying procedures and sharing information to avoid duplication (harmonisation);
developing countries and donors shifting their focus to development results (results);
and donors and development partners both being accountable for these results (mutual
accountability)
The 2005 Paris Declaration established a monitoring system to assess its
implementation. In addition to the fieldwork carried out for the review, material for
judgements in this thematic paper is provided by the 2011 Paris Declaration survey of
progress. This updated an earlier assessment in 2008, and also measured progress
against a 2005 baseline. The findings cover the first year of the NDP period. The

Page | 11
review could not replicate the detailed data collection exercise required to update
survey, although where possible information has been collected to assess likely
directions after 2010/11.
It is important, however, to introduce the discussion about the strength of partnership
with a more general narrative that captures significant recent trends and events,
including trends in the volume and direction of development assistance.
2.2 Development assistance trends
As explained in the introduction to this report, analysis of trends in Uganda’s
development assistance is based largely on data provided by the Aid Liaison
Department of the MoFPED. Annex 2 presents the MoFPED data that has been
analysed focusing in particular on the first two completed years of the NDP (2010/11
and 2011/12) and drawing comparison with the two preceding years. Annex 2 also
captures the key aspects of OECD data focusing in particular on 2011 and 2012. The
data in Annex 2 cover total aid flows, the allocation of assistance between budget
support and project aid, the sector allocations of assistance using the sector definitions
captured in the government’s MTEF, and the allocation of assistance between
development partners.
Aid to Uganda has been provided in recent years in a global context in which after
growing significantly in both real and nominal terms following the 2005 Gleneagles
agreement development assistance has subsequently been affected by global
recession. Nominal aid levels continued to rise until 2011 but then fell in 2012. In real
terms aid levels started to fall in 2011.
For Uganda the key points to highlights are:
Year to year volatility in expenditure, for example as major programmes commence
and conclude or as partners adjust disbursements in response to issues affecting
the wider development partnership, make it difficult to draw categorical conclusions
about trends.
But in total in the first two years of the NDP, MoFEPD estimate that Uganda
received aid averaging US$ $1,377 million per annum compared to an annual
average of US $1,434 million in the preceding two years. 62 per cent of the

Page | 12
resources provided under the NDP have been included on budget as part of the
government’s medium term expenditure framework and 38 per cent have been
provided off budget3.
Aid is still important but much less significant in Uganda’s economic framework than
it was through the 1990s and the first decade of the new millennium. Although in
2011/12 development assistance was still the equivalent of 6.9 per cent of GDP the
same figure in 2008/09 was 7.1 per cent and during much of the PEAP was around
15 per cent. “On budget” aid in 2011/12 was 21.7 per cent of total government
expenditure and 43.2 per cent of development expenditure (where it is counted in
the government’s budget estimates). The data shows these proportions can vary
significantly on a year to year basis as a consequence of spikes or troughs in total
government expenditure (e.g. as macro-economic controls are tightened or
weakened) but during much of the PEAP “on budget” aid was around 50 per cent of
total government expenditure.
In the first two years of the NDP, MoFEPD reported that aid was provided by a total
of 31 donors. 71 per cent of the amount disbursed was provided by just 6 of these
partners (IDA, ADF, EU, USAID, the UK’s DFID and Norway). The remaining 25
provided just 29 per cent. This is illustrated in Chart 1 below.
Chart 1: Trends in Aid by Donor (source MoFPED)
3 OECD data show disbursements averaging $ 1654 million p.a. in 2010 and 2011, down from an
average of $1695 million p.a. in the two preceding years. The differences between MoFPED and OECD
data highlight severe shortcomings in aid transparency.

Page | 13
On average grant inflows amounted to 48.6 per cent of total ODA to Uganda over
the period FY 2008/09 to FY 2011/12, of which 54.1 per cent was in form of budget
support. Loans amounted to 51.4 per cent of total ODA, of which 75.9 per cent was
in form of project support loans and only 24.1 per cent was in form of budget
support. This is illustrated in Chart 2 below.
Chart 2: Trends in Aid by Type and Channel (source MoFPED)
0.00%5.00%
10.00%15.00%20.00%25.00%
IDA
USA
AD
F
EU UK
ITA
LY
NO
RW
AY
CH
INA
IREL
AN
D
GLO
BA
L FU
ND
OTH
ERS
HIP
C
FYs 2008/09- 2009/10 FYs 2010/11- 2011/12
FYs 2008/09 - 2011/12
IDA 20%
USA 15%
ADF 11%
EU 10%
UK 6%
ITALY 5%
NORWAY 4%
CHINA 3%
IRELAND 3%
GLOBAL FUND
3%
OTHERS 17%
HIPC 3%
FYs 2008/09 - 2011/12
IDA 19%
USA 17%
ADF 11%
EU 10%
UK 6%
ITALY 0%
NORWAY 5%
CHINA 5%
IRELAND 3%
GLOBAL FUND
2%
OTHERS 18%
HIPC 4%
FYs 2010/11- 2011/12

Page | 14
Although overall aid disbursements appear to have stayed fairly constant support
provided “on budget” has increased (from an annual average of US$ 810 million
immediately preceding the NDP to an annual average of US$ 854 million during its
first two years. Disbursements of “off budget” on the other hand have fallen, from an
annual average US$ 624 million to an annual average of US$ 523 million comparing
the periods immediately before and after the introduction of the NDP. This is
illustrated in Chart 3 below.
Chart 3: Trends in Project Support (Budget v Actual Disbursements)
Source: Approved Estimates of Revenue and Expenditure (Recurrent and Development) FY 2008/09,
FY 2009/10, FY 2010/11, FY 2011/12, FY 2012/13, MoFPED.
Note: Full disbursement data is not yet available for 2012/13.
Budget support inflows have declined over the years. Budget support (including debt
relief) fell from US$ 334 million in 2008/09 to US$ 275 million in 2011/12 (i.e. from 23
0.00 200.00 400.00 600.00
FY 2008/09
FY 2009/10
FY 2010/11
FY 2011/12
Project Support by Type (USD m)
Loans Grants
0.0 100.0 200.0 300.0
FY 2008/09
FY 2009/10
FY 2010/11
FY 2011/12
Budget Support by Type (USDm)
Grants incl HIPC Loans
0.00
200.00
400.00
600.00
800.00
1000.00
FY 2008/09FY 2009/10FY 2010/11FY 2011/12FY 2012/13
Am
ou
nt
(US$
m)
Project Support Excl. Security
Budget Actual

Page | 15
per cent to 19 per cent of total aid). Budget support disbursements in 2012/13 after ten
months of the financial year (up to the end of April 2013) were just US$ 67 million (the
issues explaining this low level of disbursement are discussed below). This is illustrated
in Chart 4 below.
Page | 16
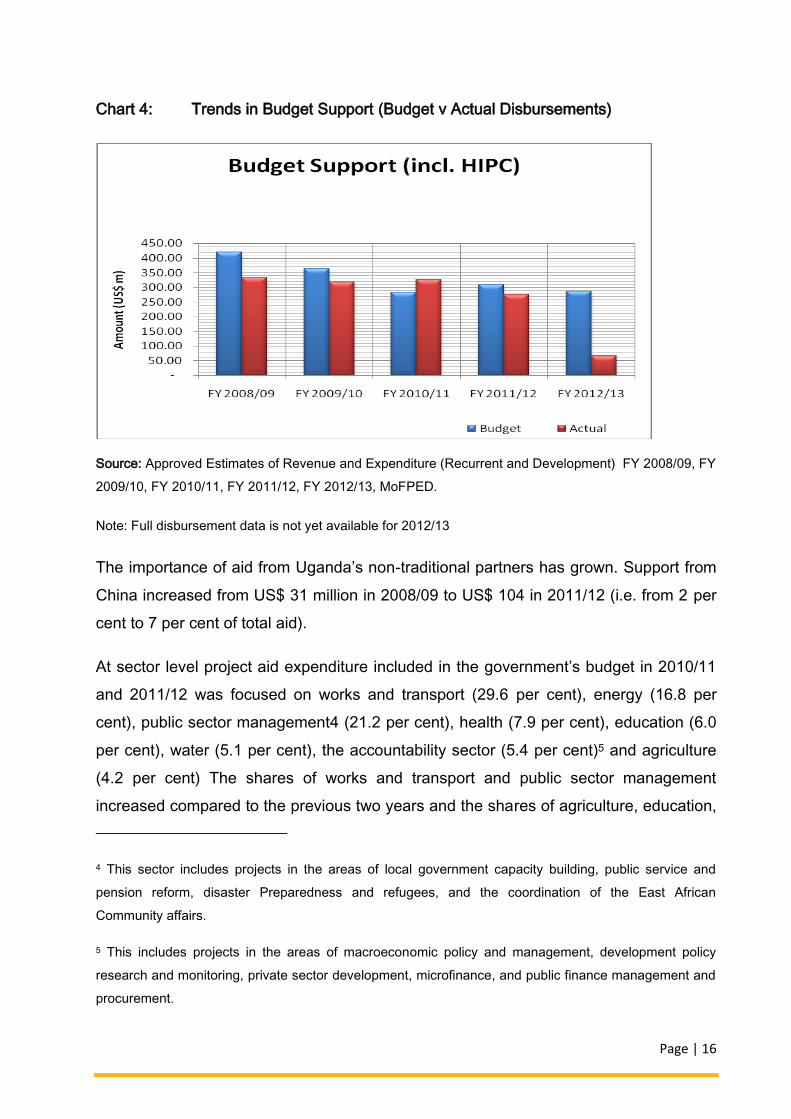
Chart 4: Trends in Budget Support (Budget v Actual Disbursements)
Source: Approved Estimates of Revenue and Expenditure (Recurrent and Development) FY 2008/09, FY
2009/10, FY 2010/11, FY 2011/12, FY 2012/13, MoFPED.
Note: Full disbursement data is not yet available for 2012/13
The importance of aid from Uganda’s non-traditional partners has grown. Support from
China increased from US$ 31 million in 2008/09 to US$ 104 in 2011/12 (i.e. from 2 per
cent to 7 per cent of total aid).
At sector level project aid expenditure included in the government’s budget in 2010/11
and 2011/12 was focused on works and transport (29.6 per cent), energy (16.8 per
cent), public sector management4 (21.2 per cent), health (7.9 per cent), education (6.0
per cent), water (5.1 per cent), the accountability sector (5.4 per cent)5 and agriculture
(4.2 per cent) The shares of works and transport and public sector management
increased compared to the previous two years and the shares of agriculture, education,
4 This sector includes projects in the areas of local government capacity building, public service and
pension reform, disaster Preparedness and refugees, and the coordination of the East African
Community affairs.
5 This includes projects in the areas of macroeconomic policy and management, development policy
research and monitoring, private sector development, microfinance, and public finance management and
procurement.
Page | 17
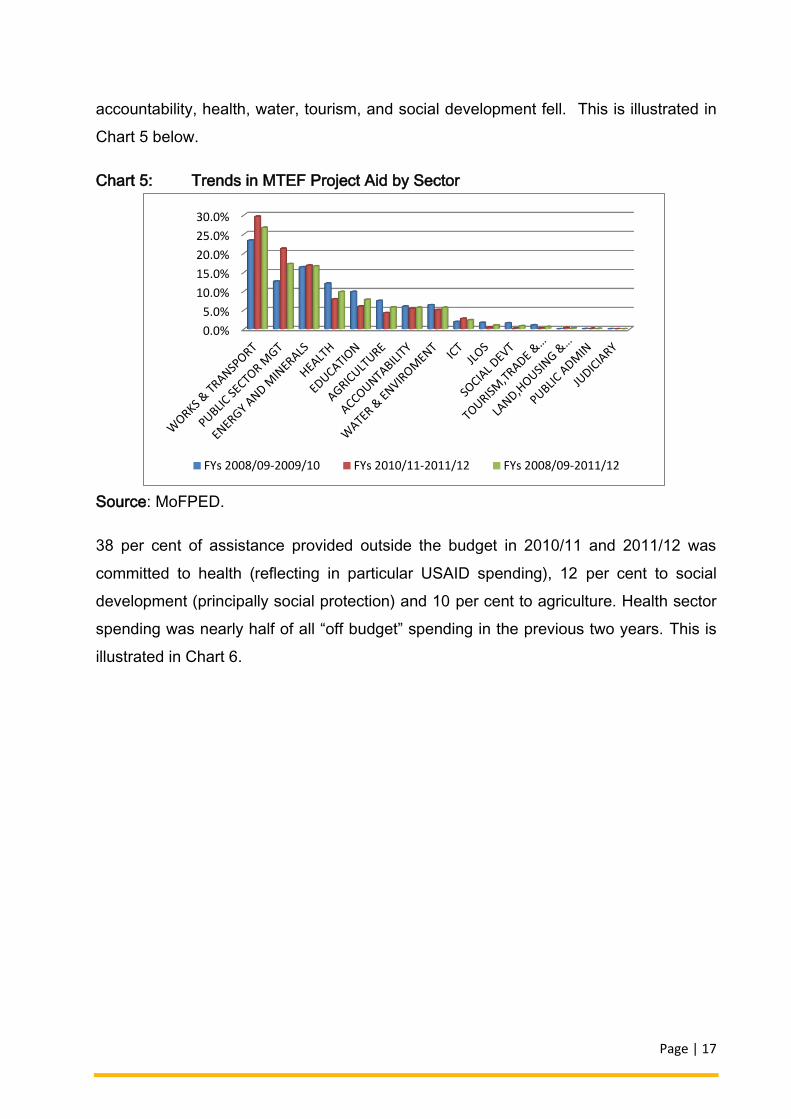
accountability, health, water, tourism, and social development fell. This is illustrated in
Chart 5 below.
Chart 5: Trends in MTEF Project Aid by Sector
Source: MoFPED.
38 per cent of assistance provided outside the budget in 2010/11 and 2011/12 was
committed to health (reflecting in particular USAID spending), 12 per cent to social
development (principally social protection) and 10 per cent to agriculture. Health sector
spending was nearly half of all “off budget” spending in the previous two years. This is
illustrated in Chart 6.
0.0%
5.0%
10.0%
15.0%
20.0%
25.0%
30.0%
FYs 2008/09-2009/10 FYs 2010/11-2011/12 FYs 2008/09-2011/12

Page | 18
Chart 6: Trends in Non-MTEF Project Aid by Sector
Footnote: * Support that could not be aligned to Government Sectors.
Source: MoFPED.
There are major and consistent gaps between the disbursement estimates that
donors provide before the Uganda financial year commences and actual
disbursements once the year gets underway. As Charts 3 and 4 below indicate this
is a problem that affects both budget support and project aid. In the case of project
aid implementation delays, for example related to procurement are one major cause.
The unpredictability of budget support is closely related to development partner’s
assessment of results and performance however, the Joint Budget Support
Framework has been designed in a way that is supposed to address unpredictability
in disbursements (see Annex 3)6.
6 Donor practices resulting in poor predictability of budget support and shortcomings in the financial
information provided for budgeting and reporting have consistently attracted low markings in
assessments of Uganda’s public financial management systems using the Public Expenditure and
Financial Accountability (PEFA) Measurement Framework – most recently in 2012.
0.0%5.0%
10.0%15.0%20.0%25.0%30.0%35.0%40.0%45.0%50.0%
FYs 2008/09-2009/10 FYs 2010/11-2011/12 FYs 2008/09-2011/12

Page | 19
2.3 The framework for partnership in Uganda
As already highlighted, the Partnership Policy that was intended to provide a framework
for effective relationships between government and donors during the implementation of
the NDP has not yet been finalised and agreed. In its absence relationships have been
framed principally by established sector working group processes (linked to the budget)
that bring together government, bilateral and multilateral donors and other actors at
sector level7, and by the Joint Budget Support Framework (JBSF) which since 2007/08
has provided the structure in which general and sector budget support is managed. The
JBSF has become the principal focus for high level policy dialogue with joint meetings
scheduled between budget support donors and both the Implementation Co-ordination
Steering Committee in which permanent secretaries meet to oversee government
performance and the Ministerial level Policy Co-ordination Committee which is chaired
by the Prime Minister. Annual disbursement decisions are linked to a Joint Assessment
Framework (JAF) of actions and indicators.
Meanwhile, non-traditional and bilateral donor support has been minimal over the NDP
period but appears to offer opportunity in filling the funding gaps for the rest of the
current NDP period and the next NDP. Most of the non-traditional donor support is not
under budget support and not normally bound by JAF arrangements.
2.4 Challenges facing government-donor relationships
Within the above framework for partnership, the relationship between government and
donors has arguably become increasingly difficult in recent years as consequence of:
Issues raised around the conduct of the elections in both 2006 and 2011.
Development partner questions about results and performance, focused on a set of
problems that have been regularly discussed in policy dialogue, but on which little
progress has been made. These issues include unease about budget planning and
implementation as a result of: budgets not reflecting the allocations proposed for
priority areas in the NDP; the significant underfunding of front line service delivery
7 This includes the framework for the implementation of the Peace Recovery and Development
Programme (PRDP) in Northern Uganda.

Page | 20
and infrastructure maintenance; and persistent supplementary budgets that favour
public administration (including State House). They also include perpetual concern
about the government’s low revenue performance.8
A number of very high profile cases revealing significant misappropriation of public
funds especially since the 2006. The resources involved have included Global
Health Funds, finance set aside for the Commonwealth Heads of Government
Meeting (CHOGM) in 2007, and Government Pensions. At the end of 2012 a major
fraud was revealed by the Auditor General involving the misappropriation of 14
million Euros of aid financing from Denmark, Ireland, Norway and Sweden and a
further £1.3 million from DFID. The resources had been set aside for the peace
recovery and development programme (PRDP) in Northern Uganda. Government
employees working principally in OPM, but also in MoFPED and the Bank of
Uganda, are under investigation.
Although aggregate aid flows have not fallen as a consequence of these difficulties in
the relationship between government and donors they help explain some of the volatility
in aid disbursements and in particular why in recent years budget support has usually
been much less than initially predicted.
At the time of writing this report all budget support donors including the World Bank,
had frozen their budget support disbursements in the wake of the OPM fraud. The first
step in the decision to lift this freeze is linked to a high level action matrix that requires
the government to return misappropriated funds, to take administrative and legal action
against those involved in the fraud, and to strengthen financial systems to close
loopholes. Dialogue between government and donors on this matrix is being managed
by MoFPED rather than OPM. Subsequently disbursement decisions will depend on
performance against the Joint Assessment Framework. There are clear indications that
a number of donors are unlikely to release the funds they have held back. All budget
8 Successive Donor Statements at the Annual Budget Workshop in recent years have each covered
much the same ground.

Page | 21
support donors are currently considering whether they will continue to use this
instrument going forward (9).
The Partnership Policy has not advanced as foreseen in the NDP. OPM reportedly
presented a draft policy for Cabinet approval in mid - 2012 but it has not yet been tabled
for Cabinet discussion. Donors engaged actively in Partnership Policy discussions
through to the middle of 2011 and in DFID’s case provided technical assistance to help
in its preparation but government enthusiasm to put it in place seems to have
decreased. There is a need to revive discussions on the issue at the technical level for
it to be informed by more recent donor and government thinking.
9 It is estimated that in total $270 million is affected by the freeze which includes resources from the
World Bank, the EU, DFID, Denmark, Germany, Sweden, Austria and Belgium. Ireland has already
decided to withdraw budget support it had pledged prior to the fraud. The Netherlands and Norway had
stopped providing budget support prior to 2012/13.

Page | 22
3 DEVELOPMENT PARTNER ALIGNMENT
3.1 Overview
This section examines donor alignment with the NDP. It answers the review question
about the mechanisms that the government has used to ensure that development
partners’ support is aligned with NDP priorities. It also answers the review questions on
the extent to which donor strategies are aligned to the NDP and the extent to which
their priorities have changed as a response. Finally it considers how far donor
programmes have measurably contributed to the achievement of NDP progress.
3.2 Mechanisms to secure development partner alignment with the NDP
The Sector Working Group (SWG) and budgeting processes which existed prior to the
NDP have continued, as they were under the PEAP, to be a key mechanism for
ensuring that development partner support is aligned with national planning priorities.
Development partners are particularly active in 9 of the 16 main sector working groups10
that exist under the current structure as well as in the cross cutting groups that have
been established for HIV/AIDS and for gender. These meet at least quarterly. In parallel
with these groups development partners maintain their own sector arrangements to co-
ordinate and share information. The larger sector working groups, such as those for
health and education, break in to smaller groups at technical level to cover key sub-
sectors.
Dialogue in SWGs, and through the stages of the budget process, provides an
opportunity for development partners to engage in the design, implementation and
monitoring of Sector Strategic Investment Plans and the preparation of annual and
medium term budgets (including the public investment plan). These processes typically
include a major sector review towards the end of each calendar year as the annual
budget preparation process gets underway, and a preparation of an annual sector
10 These are the Sector Working Groups for Agriculture, Water and Environment, Energy and Mineral
Development, Works and Transport, Accountability, Social Development, Health, Education and Justice,
Law and Order.
Page | 23
performance report at the same time. The latter feeds in to the Government’s Annual
Performance Report (GAPR) process which is overseen by OPM. Sector planning,
budgeting and dialogue in turn gives government scope to influence the way in which
donor resources (both on and off budget) support the implementation of the priorities
set out in sector plans.
Discussions with a small sample of development partners who lead or support donor
engagement in different sectors, however, reveals concern about variation in the quality
of discussion in Sector Working Groups and a sense that technical discussions may
have been more productive in recent years than higher level policy dialogue (including
in annual reviews). In other meetings with development partners it was noted that the
quality of dialogue on the budget deteriorated significantly in 2010/11, especially in the
run up to national elections. Donors (as well as civil society) were not invited to
participate in the national budget workshop for the 2011/12 budget that took place in
March 2011. On the issue of aligning discussions in sector working groups with NDP
priorities, development partners observed during interviews that while the MoFPED
consistently attends sector working group meetings, the NPA participation has been
inconsistent and weak, possibly arising from the failure of the NDP to restructure the
SWGs.
The JBSF has also offered a structure for aligning development partners behind NDP
priorities by providing the means for ensuring the results used by development partners
to trigger disbursement of general and sector budget support are linked to NDP
objectives. A Memorandum of Understanding that was intended to formalise the
arrangement is not yet in place, but Annex 3 explains how the JBSF has operated in
practice.
Over time the actions and indicators included in the Joint Assessment Framework (JAF)
for the JBSF have increasingly been drawn from the GAPR process, agreed sector
strategic plans and government Ministerial Policy Statements, with limited direct links to
the NDP. The JAF assessment has been co-ordinated and discussed alongside the
Page | 24
government’s own annual review in the context of a joint meeting of the high level
Policy Co-ordination Committee.11
The links between budget support decisions and the achievement of NDP objectives
depend upon the extent to which the NDP provides the framework for sector strategic
plans and the GAPR. It is relevant that the JAF has been criticised for being overly
complex. The versions that have been used up to 2012/13 have contained a very large
number of actions and indicators that may have served to blur the strategic line of sight
to the NDP. The quality of dialogue in the JBSF has also raised concerns.
Development partners have consistently raised questions on a key set of recurring
issues on which they feel little progress is made from year to year. Divergent views
about performance have rarely been resolved.12
3.3 Donor priorities and alignment with the NDP
The 2011 survey of Uganda’s progress in implementing the Paris Declaration
concluded that there was high degree of alignment of aid flows with national priorities,
although the indicator used in making this judgement did not capture off budget project
support, for example provided directly to recipient NGOs or project implementers.13 The
survey also observed good progress in the co-ordination of development partner
technical assistance with national priorities and strategies.
The interviews carried out with development partners for this thematic paper suggest
that development assistance has continued to be closely aligned to the NDP as it has
11 In 2012/13 however the JAF assessment was separated from the government’s own annual review of
performance because of the budget support freeze imposed as a consequence of the misappropriation of
donor funds for the PRDP. At the time of preparing this draft no joint meeting of the PCC had taken place
since early 2012.
12 The JAF review process allows for divergence in the assessments of government and development
partners.
13 As a proxy for alignment this Survey used an indicator that measured the percentage of aid disbursed
by donors for the government sector that is included in the annual budget for the same fiscal year. In
2010 the estimate for this indicator was 96 per cent. The indicator takes no account of off budget
financing.

Page | 25
been implemented. In particular all development partners claimed that their strategies
and programmes are aligned to the NDP and highlighted that their strategy documents
emphasise the importance of the NDP in providing a framework for assistance.
However, it can be argued that this perspective reflects the broad range of NDP
objectives and priorities (“intertwining economic growth and poverty eradication”) that
permits donors to claim alignment across a range of strategic approaches and activities.
In looking in more detail at development partner conclusions on alignment the following
observations can be made:
The alignment of development assistance is linked to the coverage and quality of
sector strategies. There is still concern that not all sectors have effectively aligned
their sector strategic plans to the NDP. In some quarters there is also concern that
the JAF which determines budget support disbursements is not well aligned to the
NDP because of weaknesses in the link between the NDP and the GAPR process in
which the JAF is principally developed and reviewed.
There are particular challenges in assessing the alignment of “off budget” resources
because, although they may be reviewed in sector working group processes, they
are less likely to be factored in to sector plans and included in monitoring and
evaluation frameworks. (This point was emphasised during the district visits to Gulu
and Amolatar which are discussed in Annex 1).
Although a number of development partners adjusted their strategic planning cycle
to align it with the NDP (including the World Bank, Africa Development Bank and
USAID), most were constrained from doing so by existing arrangements and by
internal institutional requirements.14
Few donors have been able to indicate a long term financial envelope that might
better facilitate NDP programming. The exceptions include the World Bank, Africa
Development Bank, DFID and the EU.
Constraints on alignment have been imposed in a number of cases by restrictions
on the use of the resources available to development partners, in particular because
14 The UK DFID prepared a new Country Plan in 2010 covering the Period 2010/11 – 2014/15 but this
cycle was determined by UK election patterns rather than the time-period of the NDP.

Page | 26
they are drawn from vertical funds with specific purposes. The US programme in
Uganda for example draws resources from a number of vertical initiatives in
Washington some of which have been created by Congress (for example on human
rights and investing in people) and some of which have been created by Presidential
initiative (such as “empower Africa trade” and “feed the future as well as global
health initiatives covering malaria HIV/AID and the saving of mothers lives).
But there is some evidence that in the allocation of support donors collectively have
started to reflect the NDP’s aim to broaden Uganda’s development strategy from
poverty reduction to structural transformation that increases growth and living
standards. At sector level although combining both on budget and off budget
support, the health sector has continued to be the largest recipient development
assistance, its share of expenditure has declined from an average of 31 per cent in
the two years before the NDP to 27 per cent during the first two years of its
implementation. The project aid share of works and transport on the other hand has
increased from 14 per cent in the two years preceding the NDP to 17 per cent during
its implementation, and the share of energy has increased from 10 per cent to 12
per cent.
As already discussed in earlier, if “on budget” project aid is examined separately the
transport and energy sectors are already the largest recipients. And these aid
expenditure shares would have been even higher if development partners had been
able to spend resources in line with the planning figures they provided to MoFPED
(This problem reflects wider difficulties in implementing projects in these sectors
including the impact of delays in procurement).
The data available on the engagement of development partners at sector level
shows that although there are still many more donors engaged in the social sectors
than are engaged in infrastructure, the number of donors working in infrastructure is
increasing, despite constraints imposed by the scale of resources required to
participate effectively in infrastructure investment. The agriculture sector has
significantly the largest concentration of development partners.
And a number of the development partners engaged in infrastructure15 have
specifically aligned their support for investments that are identified as national core
15 The World Bank, the Africa Development Bank, the EU and Japan.

Page | 27
projects which are essential to “unlock binding constraints” to growth, focusing on
those in irrigation, energy and road transport.
The framework for monitoring the Paris Declaration assesses alignment in a number of
different dimensions in addition to the alignment of aid flows with national priorities.
These dimensions include the reliability of country public financial management and
procurement systems; donors’ use of these systems; the predictability of aid; and the
extent of aid untying.
In this wider context, the 2011 Paris survey noted some improvement in the use of
Uganda’s public financial management and procurement systems for aid
disbursements, especially government audit and government financial reporting
systems,16 although the change was small. The use of parallel project implementation
units for programme execution had declined considerably. And by the time of the survey
95 per cent of Uganda’s aid was untied. The survey, however, also reported a
disturbing decline in the reliability of public financial management systems (despite
reforms) because of human resource and institutional capacity constraints. The poor
predictability of aid was identified as a particular and continuing cause for concern.
Section 2 has highlighted that through a longer period of NDP implementation the poor
predictability of aid has persisted as a major problem. The misappropriation of aid
funds at the end of 2012 suggests the reliability of public financial management
systems has also remained a difficult issue, although one of the commitments the
government has made in the wake of the OPM scandal is to address the system
loopholes that were exploited. There are clearly risks that the gains that have been
made in the use of government public financial management and procurement systems
and in reducing the number of parallel project implementation units will be rolled back if
concerns about the reliability of government systems are not addressed.
16 This improvement did not apply to systems for budget execution.
Page | 28
3.4 Development partners’ contribution to NDP progress
The results framework theme paper for the NDP review concludes that performance
against the majority of NDP objectives and targets has so far been disappointing.
Judgements about development partners’ contribution to NDP progress need to be set
in this context. Although there is scope for debate about counterfactual outcomes in the
event that development partners had not been involved, they arguably cannot be
absolved from at least partial sharing responsibility for under-performance in sectors
where they are particularly active. The impact of poor aid information flows and
unpredictability in disbursement on macro-economic management also needs to be
carefully weighed.
More positively it is possible to identify a number of ways in which development
partners have helped underpin the progress that has been made. In particular:
The JBSF has supported the government’s focus on performance and results in the
context of the GAPR framework. The pre-conditions for budget support that have
been included in the JAF have re-enforced the importance of service delivery
funding, budget credibility, effective procurement, domestic revenue generation, the
performance of public servants and sound financial management in achieving
results. Indicators and actions at sector level have helped emphasise the
importance to the achievement of NDP goals of a key set of results in health,
education, transport, and water and sanitation focused especially on the health of
women and children, education quality, infrastructure maintenance, and access to
safe water and sanitation respectively.
In the health sector development partner participation in sector working group
processes and both “off budget” and “on budget” development partner support
(especially for commodities) have been directly associated with improvements under
the NDP in increasing the proportion of deliveries that take place in health facilities,
increasing child immunisation (with DP3), increasing the proportion of health
facilities without drug stock outs and increasing the number of couple years of
protection through contraception programmes.
In education, although NDP performance has been disappointing overall,
development partner engagement in sector working group processes has re-
enforced the JBSF focus on improving education quality. A number of donors, such

Page | 29
as the AfDB have increased their support for vocational training and skills
development in line with NDP objectives.
Development partner support in the roads sector, especially from the World Bank,
European Union, AfDB and Japan has helped secure recent improvements in the
proportion of both paved roads and unpaved roads that are in fair to good condition.
This investment is set to increase over the remaining period of the current NDP
especially as a result of projects which are already underway or in the pipeline for
example to link Northern Uganda to South Sudan, to link Western and Northern
Uganda and to further improve the urban network around Kampala.
Development partner support has helped underpin the progress that has been made
in implementing the NDP’s national core projects. Support from AfDB, Japan and
the IFC helped to finance the Bujugali hydro-power project which was completed
during the early stages of the NDP. Finance from AfDB has been secured to
rehabilitate the Doho, Agoro, and Mubuku rice irrigation schemes and AfDB finance
is in place to complete the rehabilitation of the Olweny swamp rice irrigation project.
Japan has supported the pre-feasibility study for the Ayago hydro- electric power
project. Donor funded technical assistance has helped underpin the development of
capacity that is essential for effective NDP implementation. Important successes
include: the FINMAP programme that is supporting improvements in the public
financial management systems (although FINMAP has had some weaknesses); the
support that is being provided in the justice, law and order sector which overall has
secured major improvements in access to justice and more specifically supported
major reforms on issues central to economic development such as the enforcement
of contracts and the settlement of commercial disputes; and the support that has
been provided to establish strong capacity in OPM to manage the monitoring and
evaluation of government performance – however, it should be noted that NPA holds
the view that the M&E role is only a periphery component under the OPM’s
constitutional mandate of coordination of implementation but the mandate of the
NPA.
DFID has provided funding for an NDP Trust Fund managed by the World Bank
which has focused on the design and implementation of policies in key areas
including rural electrification, tourism, education quality, public investment
management, the implementation of agricultural policy, and the management of

Page | 30
water resources. However, the lack of involvement of the NPA in the management
of this fund has resulted in complaints from the NPA.
Donor funding (which is an estimated 70 per cent of total expenditure) has been
central to the progress that has been made in the rehabilitation and development of
northern Uganda under the Peace, Recovery and Development Plan (PRDP).
Implementation of the PRDP started in 2009 in the wake of nearly 20 years of
conflict and is now in a second phase that will run to 2015. Although the PRDP
currently runs in parallel to the NDP it is an integral part of the government’s
planning framework. The vision from 2015 onwards is that it will be absorbed more
fully integrated in the next NDP.

Page | 31
4 HARMONISATION, TRANSACTION COSTS AND MUTUAL
ACCOUNTABILITY
4.1 Overview
This section addresses the review questions covering the extent to which the NDP has
provided a framework for improved harmonisation and reduced transaction costs in
dealing with development partners. It also addresses the question covering the extent
to which the NDP has provided a basis for mutual accountability between government
and development partners.
4.2 Harmonisation and transaction costs
The NDP anticipated that a key focus for the Partnership Policy would be improved
harmonisation between development partners which would help reduce government’s
transaction costs. It was particularly expected that greater use of joint programme
based approaches in the provision of aid (especially budget support) would be a basis
for greater use of uniform disbursement and accountability rules, common indicators
and reporting systems and more joint missions and analytical work. It was also hoped a
better division of labour would reduce the number of individual donors operating in each
sector, and agreement on key mechanisms such as a closed season on donor missions
during the particularly busy time of budget preparations would further reduce the burden
on government.
In contrast the 2011 Paris survey reports a decline in the proportion of development
assistance provided through programme based approaches from 66 per cent in
2007/08 to 49 per cent in 2010/11. This fall reflects a decline in importance of budget
support, although the scale of the reduction also suggests a wider decline in
programme approaches. Development partner concerns about governance and
performance which have helped trigger falling levels of budget support have been
explained earlier and may also explain the wider decline of aid provided in joint
programme approaches , for example through pooled funds. These concerns have
increased further as the NDP has been implemented. More generally budget support is

Page | 32
under greater scrutiny in donor countries than it has been in the past sense with views
changing about its wider role.
The Paris survey also reported that in 2010/11 just 24 per cent of missions were
conducted jointly. This was only a marginal improvement on previous years and far
short of the target that had been set.17 There was better progress in the harmonisation
of analytical work but still only a little more than half of country analytical work was
undertaken jointly. The interviews conducted during fieldwork for the review suggest
little change in these patterns as the NDP has been implemented. It has not been
possible to enforce a closed season on the donor missions during key budget
preparation missions as had been hoped.18
Between 2006 and 2008 development partners in Uganda engaged in a major exercise
focused on rationalising their individual sector engagement and improving the division
of labour based on their comparative advantages. The exercise started in the context of
the Uganda Joint Assistance Strategy.19 At first it attracted strong government
leadership. Although this leadership became less evident over time the process
resulted in important changes as a significant number of donors cut back on the sector
spread of their activities. The allocation of the lead donor roles became clearer.
Development partners have continued to monitor the breadth of their individual
engagement. The information that is available makes it clear that over the last few
years the momentum for rationalisation has not been maintained and in practice there
has been substantial drift in the opposite direction. Table A below shows the number of
donors engaged in each of Uganda’s main sectors (as defined for budget purposes)
17 Although this indicator only covers overseas missions and does not for example capture co-ordinated
“in country missions” such as those conducted through the Joint Budget Support Framework.
18 The review team conducted its own fieldwork during this period and was made very aware of the high
workloads in government as the budget is finalised. One development partner was known to have
organised annual aid talks at the same time.
19 The UJAS was in place between 2005 and 2009 as a shared policy document outlining ways in which
donors would harmonise their individual efforts and fully align their activities in order to help achieve the
objectives of the PEAP. The initial 7 UJAS partners comprised the ADB, Germany, Netherlands, Norway,
Sweden, UK and the World Bank. Subsequently Austria, Belgium, Denmark, Ireland, and the European
Commission signed up.

Page | 33
comparing 2008/09 and 2011/12. Over this period there have been increases in donor
engagement in all sectors apart from Health, HIV/AIDS and Lands and Housing. Annex
4 presents more detailed analysis. It highlights that all of Uganda’s main development
partners appear to be engaging in this process of de-concentration.
Table A: Donor Division of Labour; 2008/09 and 2011/12: Source, World Bank
Sectors and Subsectors Active DPs
2008/09
Active DPs
2011/12
1. Security 3 4
2. Roads and Transport 5 9
3. Agriculture 13 19
4. Education 11 14
5. Health 16 15
6. Water and the Environment
6.1 Water and Sanitation
6.2 Environment/Climate Change
8
7
5
9
11
7. Justice, Law and Order 10 13
8. Accountability
8.1 Public Financial Management
8.2 Anti- corruption
6
3
1
11
9
5
9. Tourism, Trade and Industry 8 12
10. Information, Communication and Technology 3 4
11. Energy and Mineral Development 6 10
12. Lands and Housing 3 2
13. Social Development 11 13
14. General Public Administration 2 3
15. Public Sector Management
15.1 Decentralisation
15.2 Public Service Reform
6
4
4
7
2
16. Parliament 5 8
Cross Cutting
1. HIV/AIDS
2. Gender
18
10
14
16

Page | 34
It is difficult to be sure why progress that was made around 5 years ago has been
reversed so quickly. One possibility is that reporting has not been provided on a
consistent basis, although there is no reason to believe this is the case. Another is that
the wider view of development priorities set out in the NDP has encouraged
development partners to move into new sectors without at the same time cutting back
their engagement in sectors where they have previously been working. A third is that
the decline of budget support as a disbursement modality has led donors to drift in to
new sectors to disburse the resources they have set aside for Uganda. Since in the
past humanitarian aid has frequently provided the outlet for uncommitted programme
resources this trend could have been exacerbated by the sharp fall in Uganda’s
humanitarian needs once conflict in the North subsided. The NDP appears therefore not
so far to have been associated with improved harmonisation and reduced transaction
costs, although the key factors explaining trends in harmonisation and transaction costs
probably lie outside the framework of the NDP itself.
It is also worth noting that the issue of transaction costs is one where little rigorous work
has been done to assess costs against key benefits and to map out ways in which
government and development partners individually and together can best address what
all seem to agree is a significant problem20. Although it seems clear that the re-
allocation of development assistance from budget to other programme modalities or
projects will increase both government and development partner transaction costs
(including staff costs) it would be useful to have more analysis of the detail of this that
for example addressed concerns about the high transaction costs of the JBSF (which
include a large technical unit financed by a World Bank trust fund), or which looked in
more detail at incremental changes in costs as different modalities are engaged or
donor fragmentation increases.
4.3 Mutual accountability
The NDP anticipates the establishment of new mechanisms through which there will be
mutual assessment by government and development partners of the implementation of
their commitments on aid. These mechanisms were to be spelt out in the Partnership
20 This is a gap discussed at some length in the PEAP evaluation.
Page | 35
Policy. The Partnership Policy draft that has been presented to Cabinet proposes a
monitoring framework with indicators that will be reviewed annually and independently
evaluated every three years.
In the absence of an agreed Partnership Policy the JBSF has offered a more limited
structure for mutual accountability. The JBSF has provided a context for policy dialogue
and for government accountability for the achievement of targets including in its own
performance assessment framework. Within the JBSF the government is also held
accountable for its commitment to the underlying principles governing the relationship
between the government and development partners (peace and stability, democracy,
human rights and the rule of law/access to justice) and for meeting essential pre-
conditions for the provision of budget support covering macro-economic policy, fiscal
policy, public financial management, the fight against corruption, its commitment to
poverty reduction and growth, and the quality of dialogue.
Development partners are in turn held accountable for a set of commitments in the final
section of the JAF. In the absence of an agreed Partnership Policy these have focused
on reducing aid conditionality and increasing the predictability of aid, although the JAF
for 2011/12 (the assessment of which has been delayed by the current budget support
freeze) also tentatively included indicators on transparency and accountability. In
practice for the 2010/11 JAF (the last reviewed) targets for the agreed indicators could
not be agreed and they were therefore not assessed.
In summary the NDP has influenced the mutual accountability framework provided by
the JBSF through its impact on the underlying principles, pre-conditions for budget
support and individual sector objectives, indicators and targets, but it has not been able
so far to achieve its objective of putting in place a wider monitoring framework that
would for example more fully embrace development partners commitments on aid
effectiveness. No progress has been made on the NDP’s proposal to explore the
possibility of introducing the type of development partner accountability mechanisms
being used in other countries such as independent monitoring by a local panel of
experts.

Page | 36
5 DEVELOPMENT ASSISTANCE FROM NON-TRADITIONAL
PARTNERS
5.1 Overview
This section examines Uganda’s relationship with its non –traditional development
partners. It describes the main features of the assistance that non-traditional partners
provide and discusses the opportunities for using this assistance more effectively to
support the NDP. It addresses the review question covering the scope for more
effective collaboration with non-traditional partners.
5.2 Trends in support from non-traditional sources
The importance of aid from Uganda’s non-traditional development partners has
increased steadily in recent years, but currently amongst the group of emerging donors
collectively known as the BRICKS21 only China and South Korea have committed
significant support. The government’s data on aid flows suggests that the finance
received from these sources is still less than 10 per cent of all development assistance.
Table B provides details. In FY 2011/12 MOFPED recorded aid of $104 million from
China, compared to $31 million of aid recorded from the same source in 2008/09. South
Korea’s engagement is very new and much smaller. Support of just over $1 million was
recorded in FY 2011/12.
Table B: Trends in Development Assistance from Non-Traditional Partners ($m.)
Donor / Creditor FY 2008/09 FY 2009/10 FY 2010/11 FY 2011/12
China 31.45 14.61 41.48 103.80
South Korea - - - 1.40
Total 31.45 14.61 41.48 105.20
Source: Ministry of Finance, Planning and Economic Development
21 This group comprises Brazil, Russia, India China, Korea and South Africa.

Page | 37
Support provided by non-traditional partners, particularly China and South Korea, is in
the form of project aid and is both on budget and off-budget. .
5.3 Aid from non-traditional development partners and alignment with the NDP
Although project grants are normally managed outside Government systems (off-
budget), they contribute to the implementation of NDP priorities. Uganda receives grant
aid from China which is provided as resources in kind, either through technical
assistance or “turnkey” construction of infrastructure like new office buildings and the
Nelson Mandela sports stadium. The provision of health teams linked to the China-
Uganda Friendship hospital in Kampala is an example of technical assistance extended
to Uganda.
Across its programme China can claim significant alignment with the priorities set out in
the NDP. The loans include two key investments to support important infrastructure
development, namely; the construction of the Kampala-Entebbe Express and the
construction of the national IT backbone. China has raised the prospect of a further loan
to support the construction of the Karuma hydro power project which is one of the
national core projects specifically identified in the NDP as central to the achievement of
its objectives.
5.4 Key aspects of the future development partnership with non-traditional partners
Going forward support from Uganda’s non- traditional partners is expected to continue
to grow in significance. Assistance from China is predicted to increase above current
levels. Although South Korea’s programme is likely to remain relatively modest, there
are indications that other emerging development partners such as India may offer
support in the future, for example for investment in energy.22
There are aspects of the support received from non- traditional partners that make it
particularly attractive to Uganda’s government. Support from non –traditional partners,
for example is less likely to be subject to conditions related to governance and human
rights. There is also substantial scope to use non –traditional assistance to contribute
22 The government has convened preliminary discussions with the EXIM Bank of India about the
possibility of investing in the energy sector.

Page | 38
very directly to NDP goals, for example as a consequence of a preference for financing
infrastructure investments that may exploit non –traditional partners’ comparative
advantages.
At the same time, however, there are a number of aspects of support from non-
traditional sources that require careful management to secure its full advantages. The
key points to note are:
A high proportion of support from non-traditional sources is provided as loans rather
than grants. Although these are concessional they may offer less concessionality
than loans from other sources such as the World Bank and Africa Development
Bank. They may not, for example, qualify under OECD rules as official development
assistance.23
A high proportion of assistance from non-traditional sources continues to be tied
reducing its flexibility.
The likely scale, as well as the nature, of assistance from non-traditional partners
means that it in many respects it should be viewed as complementary to assistance
from more traditional sources rather than support that will displace it. There is a
case for government encouraging greater co-operation between traditional and non-
traditional development partners.
It has so far proved difficult to engage non-traditional partners in the structures that
have been established for co-ordinating donor assistance in the context of the
government’s development objectives. Although it may continue to be difficult to
engage non- traditional partners in joint high level arrangements for policy dialogue
there may be greater scope for securing their involvement in sector working group
processes.
There is significant scope to improve the transparency of assistance from non-
traditional partners in a way that can improve its integration with other sources of
development finance. There are concerns that in the past information about the
scale of support has only been partial and that future plans have often been closely
guarded.
23 Chinese loans for example are typically provided at interest rates of 2-3 per cent with a 20 year
repayment period.

Page | 39
6 CROSS-CUTTING ISSUES
6.1 Overview
This section outlines issues related to development partnership that have been taken
from a series of six cross-cutting reports that were separately commissioned alongside
the NDP mid-term review. The section is organised in such a way that there is a sub-
section for each of cross-cutting theme in which relevant issues are discussed.
6.2 Social protection
The social protection report notes that while social protection is clearly mentioned in the
NDP, the national focus during NDP implementation has been on economic growth and
production, with social development on the fringes. The report states that this can be
seen in budget allocations and consultations with various ministries and districts in
identifying national priorities. Secondly, the report states that the heavy reliance upon
donor funding and the limited GoU financial commitment raises concerns over the
sustainability of existing social protection interventions. The report recommends
formulating a strategy to bolster, publicise and expand the Senior Citizen Grant (SCG)
(a pilot cash transfer programme) in the remaining period of this NDP. The report also
states that social protection should be included more explicitly as a part of the national
growth strategy in the next NDP with clear budgets and implementation plans to
operationalise it.
6.3 Human rights
The human rights report recognises that formulation of the current NDP was highly
consultative. However, it is claimed that the process was not inclusive enough to
involve the participation of all levels of society, including the poor and vulnerable. It is
further asserted that the current NDP has not provided enough acknowledgment of the
contribution made by civil society / non state actors. For example, a lot of human
development work has been done by civil society in Uganda (often funded by
development partners) which has gone unrecognised. This includes health, education,
human rights, conflict resolution, access to justice such as legal aid services to mention
but a few.

Page | 40
In view of the above, it is recommended that the development of the next NDP should
go through a process of effective consultation involving all levels of society and
development partners. There is need therefore, to start the preparations for the next
plan now as this will ensure that that all the stakeholders are consulted in good time for
the NDP to be owned as widely as possible. Furthermore, the Government must
provide enough room at the table for non-state actors who have greatly contributed to
the human development that Uganda now experiences. This would ensure inclusive
planning and appropriate identification of the relevant areas of prioritisation within the
plans.
6.4 Democracy and political governance
The democracy and political governance report indicates that the development partner
support to JLOS has been critical to the improved performance in the sector as most of
the sector’s key initiatives have been supported by development partners. However,
there are some challenges of transparency and accountability. For example, it is
asserted that there is no proper mechanism for mutual accountability.
The report also indicates that civil society and the private sector have not played a
strong role in NDP implementation, and that government has not created an enabling
environment to facilitate such participation. CSOs and the private sector should be
partners in NDP implementation. NPA should coordinate the activities of CSOs to
create impact and ensure that NGO engagement is linked to national plans and
programmes. Development partners should effectively track aid money being
channelled through national and international NGOs to ensure it is linked to national
plans and programmes.
The report also makes a number of recommendations to address institutional
constraints to the involvement of key stakeholders. These include formulation of
concrete strategies to open up civil society space for their full participation in national
development; improvement of the accountability of national institutions by providing
support for the strengthening of public financial management systems along with
oversight bodies such as the Auditors General, government inspectorates, anti-
corruption agencies, and civil society organisations including media; and access of

Page | 41
information to CSOs and media as vanguards of democracy if they are to educate the
citizens and hold government to account.
6.5 Child rights
The child rights report recognises that while children’s welfare issues have been
prioritised in the NDP, child rights have not been prioritised during the past few years.
Particularly, with regards to immunisation programme that has been perpetually
underfunded by government. The funding challenges for routine immunisation have
continued during the implementation of the NDP. According to the Ministry of Health,
the reduction in the share of the health sector within the national budget has resulted in
reduced funding allocations to the Uganda National Expanded Programme
Immunisation (Ministry of Health, 2012a). That notwithstanding, the health sector has
been and continues to be a major recipient of off-budget donor support, including
funding for the immunisation programme. The largest proportion of vaccine costs are
met by development partners (94 per cent). However, overtime development partners
have become increasingly concerned with the efficiency of the immunisation
programmes and have in a number of instances suspended support. For instance,
immunisation activities were affected during 2011/12 due to delays in signing the
Memorandum of Understanding between GAVI and the Ministry of Health.

Page | 42
7 CONCLUSIONS AND RECOMMENDATIONS
This section summarises the main conclusions of this thematic paper and makes
recommendations that address the review questions covering the ways in which
Government / Development Partner relations can be strengthened so that efficient and
effective implementation of the NDP is enhanced.
7.1 Summary of overall findings
Recent trends in Uganda’s overall development partnership
In both real terms and as a percentage of GDP, development assistance has continued
to decline during the NDP period, but in nominal terms it has remained constant and for
the short to medium term, donor financing remains very important in Uganda’s
development. Finance provided “on budget” still constitutes over 20 per cent of overall
government expenditure and over 40 per cent of the development budget. In addition
there are substantial resources provided by donors outside the government’s budget
framework. This “off budget” support constitutes over one third of all donor financing.
The contribution development partners are making to the NDP has been constrained by
a set of factors that together serve to undermine the development partnership and the
impact of aid. In particular:
The NDP’s aim to manage development assistance in the context of a new
Partnership Policy that would codify commitments on both sides of the development
partnership has not yet been fulfilled. A policy has been drafted and presented to
Cabinet but there appears at present to be little momentum to take it forward.
Development partners concerns about governance and corruption have become
increasingly serious in the context of a series of high profile corruption cases and
donor questions about performance and results, highlighted by a set of persistent
problems dominating dialogue in the JBSF. The imposition of a freeze on budget
support towards the end of 2012 in the wake of a major fraud involving theft of donor
finance for the peace, recovery and development programme in northern Uganda
may have been a watershed. Levels of budget support, the NDP’s preferred

Page | 43
instrument for development assistance, although still significant, have been in
decline and will almost certainly decline further.
Development Partner Alignment
Development partners were not as closely involved in the preparation of the NDP as
they were previously in the preparation of successive Poverty Eradication Action Plans
(PEAPs). But all Uganda’s main donors claim strong alignment with NDP priorities in
both their strategy documents and through their programming.
These claims to some extent reflect the broad range of NDP objectives and importantly
depend on the government’s own sector strategic investment plans and the Joint
Budget Support Framework aligning effectively behind the NDP. They are also in part
weakened by persistent under-spending against commitments and the channelling of
major resources “off budget” which are more difficult to manage in line with government
priorities. Nonetheless it is clear that:
During the NDP there has been a clear re-allocation of both “on budget” and “off
budget” project aid in favour of infrastructure and energy investments in line with the
NDP’s aim to broaden Uganda’s development strategy from poverty reduction to
structural transformation to raise growth and living standards. Although health has
been the largest single sector recipient of project aid during the NDP period (23 per
cent) the share of infrastructure and energy together has risen from 21 per cent in
the two years prior to the NDP to 29 per cent during its implementation.
Although progress against many NDP objectives has been disappointing donor
support has been associated with important aspects of the progress that has been
made. Development assistance has continued to help underpin the implementation
of a number of key sector strategic plans. The large multilateral donors in particular
have set aside resources for some of the NDP’s core projects. The Joint Budget
Support Framework has helped emphasise the achievement of results. And a
number of donor technical assistance programmes are building the capacity
required for effective NDP implementation (e.g. through improved financial
management, and monitoring and evaluation).

Page | 44
Harmonisation, transaction costs and mutual accountability
Without a Partnership Policy in place it has been difficult for the NDP to be a focus for
progress on the wider agenda for improving aid effectiveness. Although donors still
participate actively in sector working group and budget processes the quality of
dialogue is under scrutiny and donor engagement appears less influential than in the
past. Progress is slow in increasing the use of country public financial management
and procurement systems as the reliability of these systems is questioned. A decline in
the use of programme based approaches (including budget support) appears to have
led to a fall in development partner use of common arrangements and procedures.
Commitments to better co-ordination between donors through a more rational division
of labour based on comparative advantage seem no longer important and progress that
was made in rationalising individual donor engagement at sector level seems to have
been reversed. Although the JBSF has provided a partial framework for mutual
accountability, the quality of dialogue in the JBSF is portrayed as weak. Targets for
development partner accountability have been difficult to agree. The joint memorandum
of understanding that is meant to govern the JBSF has not been signed.
Development assistance from non-traditional partners
Support from non-traditional partners is growing in importance and likely to continue to
grow further, but currently it still constitutes less than 10 per cent of all Uganda’s
support from donors. Much of the aid from non –traditional partners is provided as loans
which have less concessionality than grant aid. Much of it is still tied. In the past non-
traditional partners have also not fully engaged in the processes established for donor
co-ordination and alignment with government priorities. At the same time, however,
support from non-traditional sources has important advantages for the government over
the assistance it receives from traditional partners. The provision of support for large
infrastructure investments may be one particular area in which non-traditional partners
have a comparative advantage. China in particular has demonstrated its willingness to
set aside finance for key NDP investments.

Page | 45
7.2 Recommendations for the remainder of the first NDP
Going forward there are risks to the financing of the NDP if current difficulties in the
relationship between donors and government persist. Traditional development partners
are expected to stay engaged but might fragment in their approaches and could
increasingly use off budget channels that may be more difficult to align with the NDP.
Non-traditional development partners are an increasingly important source of finance
but still provide a relatively small proportion of donor finance. In due course
government revenue from the commercial exploitation of Uganda’s oil resources could
total around $2 - $3 billion per year during peak production. At the top of this range this
is approximately double current levels of development assistance. But revenue from oil
is not expected to start to flow until 2018 at the earliest and there are significant risks
that production will be delayed beyond this point.
From the current starting point, ensuring that Uganda’s development partnerships make
a strong contribution to the achievement of NDP objectives going forward will require
action by both government and donors.
A key initial step will be strong government leadership to reassess, review, update and
finalise the draft Partnership Policy to provide a robust framework for the management
of aid in support of NDP implementation. The draft needs revision, to take cognisance
of changing aid architecture, both at the international and national levels. For instance,
at the national level there are diverse views on the primacy of budget support (which
appear to be increasingly shared by both government and development partners), but
this should be possible without compromising the basic principles on which international
agreements to enhance the impact of aid are based.24 An agreed framework for the
management of aid in Uganda will re-affirm both parties’ commitment to these principles
and reduce the risk they become peripheral and not at the centre of the relationship.
The monitoring framework envisaged for the Partnership Policy will provide a basis for
assessing each party’s performance
24 The current draft of the Partnership Policy highlights the principles of alignment, managing for results,
accountability, value for money, transparency and predictability, reducing transaction costs, co-ordination
and inclusivity.

Page | 46
Within the framework of a new partnership policy it is possible to identify a number of
aspects of the relationship between government and donors that require immediate
attention to improve the impact of aid. In particular:
Government action to improve and secure the reliability of public financial
management and procurement systems is essential to firmly address donor
concerns about putting resources through government channels and to address the
risk that off budget support (which is more difficult to align to the NDP) increases.
Existing reform efforts need to be accelerated and expanded to quickly close gaps.
The September 2012 Public Financial Management Performance Report (“PEFA”)
highlights the key weaknesses that need to be addressed.
In a context in which it seems inevitable that budget support in its current form is
likely to continue to diminish, government and development partners need to work
together to identify alternative aid modalities that both maintain the advantages of
programme based approaches while including controls that effectively protect
resources against fiduciary risks. There are joint donor funding arrangements that
have been used in the past in a number of sectors that might be revived and
adapted.
Joint funding arrangements may be especially valuable for the funding of large
transformational investments e.g. in transport and energy that will help both large
and small donors invest in these areas and guard against the risk that project
funding becomes fragmented and scattered. In the context of the NDP there is a
strong case for development partners prioritising funding for infrastructure projects
that have been well appraised and are ready for implementation.
Within sector working group processes, government and development partners
should work together to improve the alignment of sector strategic investment plans
with NDP priorities. This should include the alignment of both “on budget” and “off
budget” development assistance. The government should consider a firmer
approach to managing aid that is not aligned with the NDP (which might involve its
rejection). The government should be able to say “no” to assistance which does not
support national priorities and which will not be reflected in the government budget.
The government should attempt to bring maximum aid into its budget.
Government and Uganda’s development partners also need to work together to
engage non-traditional development partners more effectively in sector working

Page | 47
group processes to help co-ordinate their support within the NDP framework. There
is scope for traditional and non-traditional patterns to work much more closely
together than at present (perhaps in arrangements where grant finance is blended
with loan finance).
MoFEPD needs to accelerate the introduction of its new aid management system to
help improve aid transparency and the government’s ability to more effectively
manage development assistance in support of its plans. Development partners in
turn need to address concerns about their aid reporting and management, especially
by providing more comprehensive and timely information, including about their “off
budget” support, and by keeping this information up to date as plans change.
Government should lead a new donor division of labour exercise that will address
the apparent trend towards an inefficient spread of effort and resources. The NDP
can help provide a framework for this exercise.25
Government should emphasise on linkage of all ODA to the NDP priorities. All the
donor funded programmes must be linked to the NDP and no resources should be
allowed in the country unless they are linked to the implementation of the NDP
priorities. Government therefore should improve on project appraisal, selection and
design and avoid supply driven interventions.
Government, in collaboration with development partners, needs to consider the
future of high level dialogue and the mutual accountability framework. The Paris
Declaration commitment to mutual accountability highlights the importance of
performance assessment and strong policy dialogue. The institutional structure
established for government performance assessment in the Office of the Prime
Minister should probably be reassessed with a view of developing a more robust
framework for mutual accountability in the context of implementing the NDP,
encompassing all development partners. The framework should bind both parties
accountable to each other. Government as well as development partners should be
sanctioned for poor performance and be incentivised for good performance.
25 This will need to take account of government concern in some sectors that rationalisation of donor
engagement will lead to a small number of development partner exerting too much influence.

Page | 48
Create an institutional arrangement for the PIP to efficiently guide the direction of aid
to finance the NDP. This should include a Development Committee to make key
decisions.
Ensure mandatory assessment of sector preparedness for project implementation
before sanctioning a new project. The assessment may include among others
readiness and comprehensiveness of project designs, arrangements for land
acquisition / access in case of infrastructure projects, commitment to provide
counterpart funding, readiness to meet disbarment triggers etc. This will go a long
way to address the problem of under-spending against commitments. The low
absorptive capacity by MDAs has undermined the contribution that development
partners are making to the NDP.
7.3 Recommendations for the next NDP
Much of this agenda will continue to be relevant as the next NDP is designed and
implemented. But there are three additional recommendations that are specifically
relevant for the next NDP.
The first is that development partners should be more closely engaged in its preparation
than they were in the preparation of the current plan. Closer consultation with donors
will provide a basis for detailed discussions over government expectations about the
way in which aid should be aligned behind NDP objectives including both the modalities
for delivering aid and its sector focus. Development partners will have the opportunity to
be clear about likely levels of aid as the next NDP is implemented and Uganda’s case
for aid begins to diminish. There will be scope to establish a greater shared
understanding than exists in the context of the current NDP.
Second, as the next NDP is implemented it will be essential to look forward to the future
of aid when oil production begins and revenue from oil becomes part of the
government’s financing framework. As that point is reached Uganda’s case for aid will
begin to change very quickly. The need for financial support will recede sharply
(subject to the details of its plans for using oil revenue alongside other sources of
finance to support its macro-economic and development objectives). But the case
should still be strong for technical assistance that continues to support the design of

Page | 49
policies focused on growth and poverty reduction and which helps to build capacity and
institutions required for implementation and transformation.
The third is that in order to help take forward its “Vision 2040” the Government should
commence a dialogue with development partners on how they might support the longer
term agenda which this document sets out including its plan of social transformation.

Development Partnerships Thematic Report - 22 October 2013 Page | 50
Annex 1. DISTRICT REPORTS
Gulu district, 28 - 29 May, 2013
This summarises meetings with a number of local government officials and a sample
of development partners in Gulu district.
Overview of development partner support in Gulu
Gulu district is heavily supported by development partner funding. Gulu is the most
populous town in Northern Uganda and the second most populous in the country. As
such, many development partners, non-government organisations (NGOs) and
agencies have programme offices permanently located in there.
At the time of the insurgency of the Lord’s Resistance Army (LRA) there were large
numbers of internally displaced people (IDPS) in Gulu district as the northern region
as a whole became the focus of a major humanitarian response. Although
humanitarian aid was largely delivered directly in IDP camps some of this support
was channelled through district government structures. In the wake of the 2006
ceasefire IDPS slowly started to return home and the nature of external assistance
started to change from emergency assistance to peace-building and socio-economic
development. The Peace, Recovery and Development Plan (PRDP) was developed
as a government framework for action and funding to consolidate peace and security,
and to lay the ground for recovery and development in the North. The PRDP is now
in a second phase that will run until 2015.
Programmes and scale of funding
The United States Agency for International Development (USAID), UN agencies
(including UNICEF, UN Women, UNFPA and WHO), the World Bank, Japanese
International Corporation Agency (JICA) and the African Development Bank are all
actively visible development partners in the district contributing a combination of
direct funding, off-budget support and resources though central government for
district programmes. A number of other bilateral partners are less visible but
delivering support through central funding of the PRDP. In addition there are a
number of NGOs and implementing partners that have offices and programmes in

Development Partnerships Thematic Report - 22 October 2013 Page | 51
Gulu; these include VSO, CARE International, War Child Holland, Concern
Worldwide, and World Vision.
The largest development partner in the region is USAID who give an estimated 15bn
UGX (US$5.7m) annually, all of which is channelled outside the district budget. Their
support is primarily in water, roads, education and health. One of the major
programmes in the district is Nudeil – the Northern Uganda Development of
Enhanced local Government Infrastructure and Livelihood programme. This
programme is jointly sponsored by USAID and central government and has seen the
construction of 112 boreholes and 136 new classrooms in the district.
The United Nations Population Fund (UNFPA) 5-year programme of support to the
district totals US$13m. Their primary focus is on reproductive health, gender equality
and gender-based violence prevention and education.
UNICEF’s presence in Gulu district has transitioned from an emergency response
unit to a development programme in the last 6-7 years. They have 3 areas of focus:
keeping women and children alive (through Water, Sanitation and hygiene,
HIV/AIDS, and malaria prevention); providing and promoting education (through safe
schools, and curriculum development); ensuring justice for children (through the
Orphan and Vulnerable Children protection, and birth registration programmes).
VSO in Gulu is working primarily in the area of secure livelihoods. They work with
implementing partners to support national initiatives and post-conflict recovery and
development in northern Uganda. They currently have 3 major projects: a Youth
Development and Vocational Training programme funded by DFID (as part of the
Northern Uganda Youth Development Centre); The Youth Employment and Local
Governance project (funded by private philanthropists - Greg and Sue Dyke); and a
Job Creation and Skills Training programme funded by the European Commission.
The value of VSO programmes in the district increased from £1.2m in 2012 to £3.4m
in 2013 and may increase further in the years ahead
Funding arrangements
Support for development programmes is administered in numerous ways which can
be categorised as ‘on-budget’ – which includes direct support from central
government, and funding from development partners to government for specific
Development Partnerships Thematic Report - 22 October 2013 Page | 52
activities and programmes - and ‘off-budget’ support which refers to donor funds
which are channelled through NGOs or implementing organisations.
For example as discussed above USAID, Gulu’s largest single donor disburses all of
its support “off budget” outside government systems
UNICEF on the other hand contributes funding directly to local government. This is
carefully managed through a rolling annual work plan that monitors progress against
targets and objectives in the District Development Plan. UNFPA also give direct
funding to Local Government, although this type of support is a fraction of their
overall district spend – in 2012 they gave perhaps 300m UGX (US $120,000) as
direct district funding. The majority of UNFPA finance is implemented through
partners and subcontractors and does not go directly through the government
systems.
As another example VSO are currently channelling none of the finance they
administer through local government and reported a definite move away from funding
local government directly
Peace, Recovery and Development Plan (PRDP)
The Government launched the PRDP In 2007, after nearly twenty years of conflict in
Northern Uganda. It was expected that the Government would contribute 30 per cent
of PRDP funding while donor support would make up the remaining 70 per cent. The
PRDP has been presented as a framework in which all new projects in the region
should align.
Progress and challenges of the PRDP
In Gulu district officials reported substantial progress under the PRDP in building
health facilities, boreholes, community access roads, classrooms and housing and
sanitation facilities linked to schools and district health services.
The PRDP however has been greatly affected by the scandal involving the
misappropriation of donor funding that was uncovered at the end of 2012. As a
consequence a number of donors have frozen their PRDP financing (alongside
budget support). Local Government officers in Gulu reported repeatedly during the
Development Partnerships Thematic Report - 22 October 2013 Page | 53
visit that programmes have been postponed or cancelled as a result. An atmosphere
of mistrust now pervades among implementing partners, donors, and recipients.
Donor alignment and planning
It is very difficult to assess the contribution that donor funded programmes have
made to wider NDP progress from local government monitoring and evaluation
systems. If external funding is mixed in with government funds it is not possible to
specifically apportion impact or results to the donors that have contributed. Where
donors have implemented specific projects/programmes there is nothing at the
local/district level that distinguishes the contribution that donors have made
specifically to the sector. Only the overall progress of the sector is assessed.
Alignment to NDP objectives and progress
The issue of meeting the objectives of the MDGs came up on numerous occasions
when talking to both district officials and development partners. From the point of
view of local government there was a sense that meeting these targets and
objectives was more important than meeting the NDP objectives because these are
international targets that will impact on the amount of funds allocated in the next
donor funding cycle. Development partners are particularly keen on measuring
progress towards the MDGs because they continue to be the yardstick against which
progress in reducing poverty is assessed.
However both UNFPA and UNICEF highlighted that their programmes are set in the
context of the UN Development Assistance Framework for Uganda (UNDAF). The
UNDAF is in turn directly linked with the NDP. UNICEF reported that UNICEF
country managers and representatives from various Central Ministries conduct field
visits twice annually to assess progress against objectives and alignment to the NDP.
One development partner discussed how they are disconnected from the process of
assessing NDP progress because everything is managed at their head office in
Kampala. They submit their quarterly progress report to the head office for it to be
analysed and formatted centrally. They receive little feedback
Alignment of donor programmes with District Planning processes

Development Partnerships Thematic Report - 22 October 2013 Page | 54
On-budget support by development partners is aligned with the relevant sector plans
and budgets and subject to the same district planning and results monitoring
processes as government funded activities. There is a budget line in the district
budget for donor contributions.
Both UNFPA and UNICEF reported that they share work plans and budgets with the
local government offices and the sector heads in order to support the district planning
process. In addition, the indicators on which UNICEF reports are supplied by the
local government and align with the district development plan.
Strengthening GoU / DP relations to improve effective implementation of the NDP
Local government officials emphasised that donors should liaise with local
government, not just central government, prior to setting up their programme in the
district to ensure there is a suitable and relevant home for their work-plan. It was also
suggested that local governments should provide an analysis of priority projects (that
directly relates to the NDP) that they then send out to the donor communities. This
would reduce duplication, ensure NDP objectives are being met, and help fill some of
the gaping holes in district service delivery and development.
At district level it is also felt that poor coordination between local government and
central government makes the relationship with development partners in the district
harder. Progress reports between government offices are not shared and
communication lines are poor. Co-ordination of donors on the ground might improve
if districts were better informed of central government planning and had more control
over their own budgets.
Local government officials believe there is scope for donors to adapt their processes
to make it easier to work with local government. Donors come in with their own rules
and conditions that are often too rigid, and unrealistic for the context on the ground.
For example, a World Bank funded infrastructure project requires national registered
engineers to support the work. There are very few registered engineers in Northern
Uganda (they are all overseas or in Kampala) and so the district is unable to access
this type of funding although they feel they have very good engineers that are not
registered.

Development Partnerships Thematic Report - 22 October 2013 Page | 55
Numerous respondents stated that donors arrive with their own agenda and 5-year
country plans that are created in discussions with the central government in Kampala
and are not discussed with the district. They do not always address the gaps that are
a reality at the district level, and certain areas receive considerably more funding
than others e.g. health, water and education.
Development partner coordination and harmonisation
Development partner coordination with local government is managed through a
series of regular meetings. There are quarterly sector meetings which are attended
by all implementing partners, donors and relevant sector officials. At these meetings
attendees discuss progress, challenges, and harmonisation issues. In addition there
is an annual district budget conference where donors declare their budget and
priorities for the coming year. In terms of harmonisation between donors there are a
few examples of on-the-ground collaboration, such as VSO and UNICEF working
together closely in the training of teachers, but generally the majority of donor
coordination seems to happen in Kampala at a central level.
From the point of view of district officers Memoranda of Understandings are the main
method of coordination and harmonisation; they lay out the roles, funds,
commitments and obligations and the targets they are aiming to reach. They allow for
easy mapping of donor support across sectors and projects.
Capacity of districts to absorb increased levels of development partner funding
directly
District officials expressed confidence in their ability to absorb more external funding
but they acknowledged that there was a ceiling that would be reached where they
would begin to struggle to effectively administer donor support. It was noted that
although Gulu receives a large amount of additional funding through the PRDP they
are not allocated extra administrative resources to manage the utilisation of this
finance (for example compared to districts which are not within the PRDP).
Infrastructure and livelihoods were identified as areas where they had the capacity to
administer more help.

Development Partnerships Thematic Report - 22 October 2013 Page | 56
Donor partners expressed concerns about district level capacity and district planning
processes. In current circumstances they did not that local government could
manage additional funding.
Amolatar district, 30 - 31 May, 2013
This summarises meetings with a number of local government officials and a sample
of development partners in Gulu district.
Overview of development partner support
Amolatar is a relatively new district, established in 2007. As in other districts a large
part of donor funding is channelled through central government26, especially support
for activities that fall under the Peace Recovery and Development Programme
(PRDP) for Northern Uganda. Amolatar has little support that is directly channelled
in to its budget by development partners. USAID provides the majority of off-budget
development partner support through various implementing partners such as Plan
Uganda, and SURE. Overall there is a very limited presence in the district of
development partners and no donors, international NGOs, or implementing partners
have offices there.
Funding arrangements
Direct development partner support to the Local Government budget
The district has a number of direct budget revenue streams from development
partners but the amounts are relatively small. GIZ gave 54.7m UGX (US$20,000) in
direct funding in 2012 for PRDP projects. The Global Fund gives 5.5m UGX
(US$2,000) annually for water and sanitation projects.
Donor /Government partnership programmes
USAID provides significant off-budget support through implementing partners such
as SURE (medicine management), and Plan Uganda (child rights). USAID also
26 This includes sector budget support that for example is channelled by central government into service
delivery at district level through conditional and unconditional grant. It also includes centrally channelled
funding for PRDP projects.

Development Partnerships Thematic Report - 22 October 2013 Page | 57
supports programmes such as Nu-Hites - the Northern Uganda Health Integration to
Enhance Services and the Community Agriculture Infrastructure Improvement
Programme (CAIIP). Implementing partners are supposed to work alongside the
district officials and planners to ensure the programmes have ownership and buy-in
from the communities.
The Danish International Development Agency (DANIDA) has provided off budget
resources that are integral to the development of community access and district
roads, and infrastructure and maintenance in the district.
UNICEF had been giving extensive off-budget support (2bn UGX annually) to the
district but withdrew in 2009 because it was felt that their impact was too small and
their approach across the region was too scattered. This left a big financial gap for
the district which has struggled to maintain the progress they had been making in the
areas supported.
In addition to support for PRDP activities (see below) the district currently receives
special programme grants from a few central government organisations that are in
partnership with donors. For example, the district receives 12.7m UGX annually from
the Ministry of Health and USAID under their Neglected Tropical Diseases (NTD)
programme. The NTD focuses on drug administration, treatment, mapping and
training in diseases such as onchocherciasis, lymphatic filariasis and
schistosomiasis.
Peace, Recovery and Development Plan (PRDP)
The PRDP is a Government framework initiated in 2008 and covering 44 districts in
Northern Uganda. The Government of Uganda contributes 30 per cent of the funds
while donors contribute 70 per cent. PRDP projects are developed in line with the
NDP objectives and are aligned to sector budgets and targets.
Progress and challenges of the PRDP
PRDP funding is fundamental to Amolatar’s social and economic progress
particularly in the construction and maintenance of core infrastructure such as roads,
health facilities and schools. The progress of the PRDP is severely threatened by the

Development Partnerships Thematic Report - 22 October 2013 Page | 58
mismanagement of funds in the Office of the Prime Minister which has led to many
international donors freezing support. Local Government officials are unsure on how
they will manage without this funding support.
Donor alignment to planning processes
Memoranda of Understanding are the fundamental way of ensuring alignment of
donor funding to district development planning processes. These should provide for
implementing partners to submit their work plans to the Local Government in
advance, so that they can work together to ensure they are feeding into the
objectives and targets that are laid out in the district plan. Local Government officers
will work to ensure that the district plan is consistent with National Development Plan
objectives. Unfortunately processes do not always function is this way– see below.
Strengthening GoU / DP relations for improved implementation of the NDP
There have been on-going problems with implementing partners in the district. A
number regularly by-pass local government arrangements and liaise directly with
stakeholders, for example by paying cash to those who attend their meetings without
agreeing this with local government officers. Some implementing partners will turn up
in the district unannounced and start work with the community or building new
facilities without first talking to the local government. Relationships with a number of
implementing partners are strained.
There needs to be better communication between Local and Central Government,
and with the implementing partners. The lines of communication and responsibility
are not clear and are confused when there are different funding mechanisms and
structures.
Development partner coordination and harmonisation
With the little funding that the district receives, they are particularly keen to ensure
coordination between implementing partners especially to minimise duplication.
Ideally local government should review work plans and have scope to advise one
partner if they feel that there is significant overlap with the work of another. It is a
concern that in the past where local government has requested that efforts are
shifted to another area these requests have frequently been ignored.

Development Partnerships Thematic Report - 22 October 2013 Page | 59
The Local Government office in Amolatar hosts a variety of forums and review
meetings for implementing partners to provide a platform for discussing plans and
review progress, however these meetings are poorly attended and clearly not a
priority for partners.
Capacity of districts to absorb increased levels of development partner funding
The district has the capacity to absorb more funding but only if the funding is secure
and released on time. They have previously wasted time on procurement, and other
preparations linked to funding that has been promised only for it not to materialise.
Their resources are limited and need to be carefully managed, there is not enough
slack in their resources to allow for time to be wasted in this way.

Development Partnerships Thematic Report - 22 October 2013 Page | 60
Annex 2. AID DATA TABLES
Table 1: Overall Development Assistance by Type (USD m)
Type FY
2008/09
FY
2009/10
FY
2010/11 FY2011/12
Actual Actual Actual Actual
MTEF Project Support
(excluding security) 432.95 534.59 444.95 662.37
Budget Support (including HIPC) 334.33 318.61 326.00 275.39
Non-MTEF Project Support 558.87 688.29 566.86 478.96
TOTAL ODA 1,326.15 1,541.49 1,337.81 1,416.72
Source: Ministry of Finance, Planning and Economic Development
Table 2: Overall Development Assistance by Type as a percentage of GDP
Type
FY
2008/09
FY
2009/10 FY 2010/11 FY2011/12
MTEF Project Support
(excluding security)
2.3 per
cent
3.5 per
cent 2.4 per cent
3.2 per
cent
Budget Support (including HIPC)
1.8 per
cent
2.1 per
cent 1.8 per cent
1.4 per
cent
Non-MTEF Project Support
3.0 per
cent
4.5 per
cent 3.1 per cent
2.3 per
cent
TOTAL ODA
7.1 per
cent
10.1 per
cent 7.3 per cent
6.9 per
cent
Source: Ministry of Finance, Planning and Economic Development
Table 3 (a): Development Assistance by Type as a percentage of Total Expenditure
Type FY 2008/09
FY
2009/10 FY 2010/11 FY 2011/12
MTEF Project Support 22.5 per cent
16.6 per
cent 9.7 per cent 15.3 per cent
Budget Support 17.4 per cent
9.9 per
cent 7.1 per cent 6.4 per cent

Development Partnerships Thematic Report - 22 October 2013 Page | 61

Development Partnerships Thematic Report - 22 October 2013 Page | 62
Table 3 (b): Development Assistance by Type as a percentage of Total Development
Expenditure
Type FY 2008/09
FY
2009/10 FY 2010/11 FY 2011/12
MTEF Project Support 43.4 per cent
31.9 per
cent
20.0 per
cent 30.5 per cent
Budget Support 33.5 per cent
19.0 per
cent
14.6 per
cent 12.7 per cent
Source: Ministry of Finance, Planning and Economic Development
Table 4: A Comparison of Planned and Actual Budget Support by Type (USD m)
Type
FY 2008/09 FY 2009/10 FY 2010/11 FY 2011/12
Budget Outturn Budget Outturn Budget Outturn Budget Outturn
Loans 111.0 117.0 100.0 120.9 100.0 101.7 50.7 48.7
Grants incl
HIPC 309.0 217.4 263.1 197.0 182.4 224.3 260.0 226.7
Grand Total 419.93 334.33 363.11 317.91 282.40 326.00 310.69 275.39
Source: Approved Estimates of Revenue and Expenditure (Recurrent and
Development) FY 2008/09, FY 2009/10, FY 2010/11, FY 2011/12, Ministry of
Finance, Planning and Economic Development
Table 5: A Comparison of Planned and Actual MTEF Project Aid by Sector (USD m)
SECTOR
FY 2008/09 FY 2009/10 FY 2010/11 FY 2011/12
Budget Actual Budget Actual Budget Actual Budget Actual
Accountability
78.5
30.0
52.5
27.6
39.7
33.7
46.4
26.1
Agriculture
39.9
51.2
45.8
21.0
35.5
33.9
57.1
13.0
Education
70.5
36.2
65.2
58.9
64.9
16.3
71.4
49.7
Energy And Minerals
128.7
35.0
152.0
123.0
116.2
108.1
87.6
77.6

Development Partnerships Thematic Report - 22 October 2013 Page | 63
Health
158.1
9.5
131.5
106.8
42.2
20.1
84.4
67.0
ICT
-
18.3
-
-
-
29.2
-
1.2
JLOS
8.8
-
6.7
16.1
2.9
2.1
0.6
2.3
Land, Housing &
Urban Development
-
0.0
-
-
-
2.3
0.6
1.3
Judiciary
-
-
0.6
-
-
-
-
-
Public Admin
-
0.0
-
0.3
-
1.0
-
0.2
Public Sector Mgt
89.2
51.2
101.3
70.5
80.8
62.8
116.0
171.9
Security
-
-
-
-
52.5
62.8
56.3
75.7
Social Devt.
1.8
0.1
2.7
14.8
1.1
-
0.9
1.7
Tourism, Trade &
Industry
2.7
8.9
3.3
1.0
3.5
1.5
2.4
0.6
Water & Environment
32.6
34.0
22.2
27.3
52.6
15.9
54.3
40.2
Works & Transport
216.8
158.4
156.7
67.4
155.3
118.0
190.2
209.7
Total MTEF Project
827.8
433.0
740.5
534.6
647.3
507.7
768.1
738.1
Source: Approved Budget Estimates and Expenditure (Recurrent and Development;
and Annual Performance Reports, FY 2008/09, FY 2009/10, FY 2011/12,Ministry of
Finance, Planning and Economic Development

Development Partnerships Thematic Report - 22 October 2013 Page | 64
Table 6: Percentage breakdown of Budget Support by Type
Budget Support
FYs 2008/09-
2009/10
FYs 20010/11-
2011/12
FYs 2008/09 -
2011/12
Loans 36.5 per cent 25.0 per cent 31.0 per cent
HIPC/Debt Relief 13.8 per cent 17.7 per cent 15.7 per cent
General Budget Support
Grants 23.2 per cent 28.4 per cent 25.7 per cent
Sector Budget Support
Grants 26.5 per cent 28.9 per cent 27.6 per cent
Source: Ministry of Finance, Planning and Economic Development
Table 7: MTEF project aid by sector - percentage expenditure
SECTOR
FYs 2008/09-
2009/10
FYs 2010/11-
2011/12
FYs 2008/09-
2011/12
Actual Actual Actual
Works & Transport 23.3 per cent 29.6 per cent 26.7 per cent
Public Sector Mgt 12.6 per cent 21.2 per cent 17.2 per cent
Energy and Minerals 16.3 per cent 16.8 per cent 16.6 per cent
Health 12.0 per cent 7.9 per cent 9.8 per cent
Education 9.8 per cent 6.0 per cent 7.8 per cent
Agriculture 7.5 per cent 4.2 per cent 5.7 per cent
Accountability 6.0 per cent 5.4 per cent 5.7 per cent
Water & Environment 6.3 per cent 5.1 per cent 5.7 per cent
ICT 1.9 per cent 2.7 per cent 2.3 per cent
JLOS 1.7 per cent 0.4 per cent 1.0 per cent
Social Devt. 1.5 per cent 0.2 per cent 0.8 per cent
Tourism, Trade & Industry 1.0 per cent 0.2 per cent 0.6 per cent
Land, Housing & Urban
Devt. 0.0 per cent 0.3 per cent 0.2 per cent
Public Admin 0.0 per cent 0.1 per cent 0.1 per cent
Judiciary 0.0 per cent 0.0 per cent 0.0 per cent
Source: Ministry of Finance, Planning and Economic Development

Development Partnerships Thematic Report - 22 October 2013 Page | 65
Table 8: Percentage Expenditure of Non-MTEF project aid by sector
SECTOR
FYs 2008/09-
2009/10
FYs 2010/11-
2011/12
FYs 2008/09-
2011/12
Health 46.2 per cent 38.1 per cent 42.5 per cent
Agriculture 4.6 per cent 10.9 per cent 7.5 per cent
Social Development 2.2 per cent 12.0 per cent 6.7 per cent
Public Sector Management 7.5 per cent 5.7 per cent 6.7 per cent
Energy & Minerals 3.9 per cent 6.1 per cent 4.9 per cent
Accountability 4.7 per cent 3.6 per cent 4.2 per cent
Water& sanitation 3.0 per cent 4.8 per cent 3.8 per cent
Education 3.6 per cent 4.0 per cent 3.8 per cent
Justice Law and Order incl.
Governance 1.8 per cent 4.2 per cent 2.9 per cent
Roads, Works & Transport 1.5 per cent 3.3 per cent 2.3 per cent
Security 0.9 per cent 0.6 per cent 0.7 per cent
Trade and Tourism 0.3 per cent 0.7 per cent 0.5 per cent
Public Administration 0.8 per cent 0.0 per cent 0.4 per cent
Humanitarian 8.1 per cent 2.5 per cent 5.5 per cent
Support that could not be
aligned to MTEF sectors 11.0 per cent 3.3 per cent 7.5 per cent
Source: Ministry of Finance, Planning and Economic Development;
Development partners’ Annual submission, May, 2009, 2010, 2011,
2012, and February 2013
Notes: Support that could not be aligned go Government MTEF sectors includes
primarily support for private sector development (including financial sector
deepening).
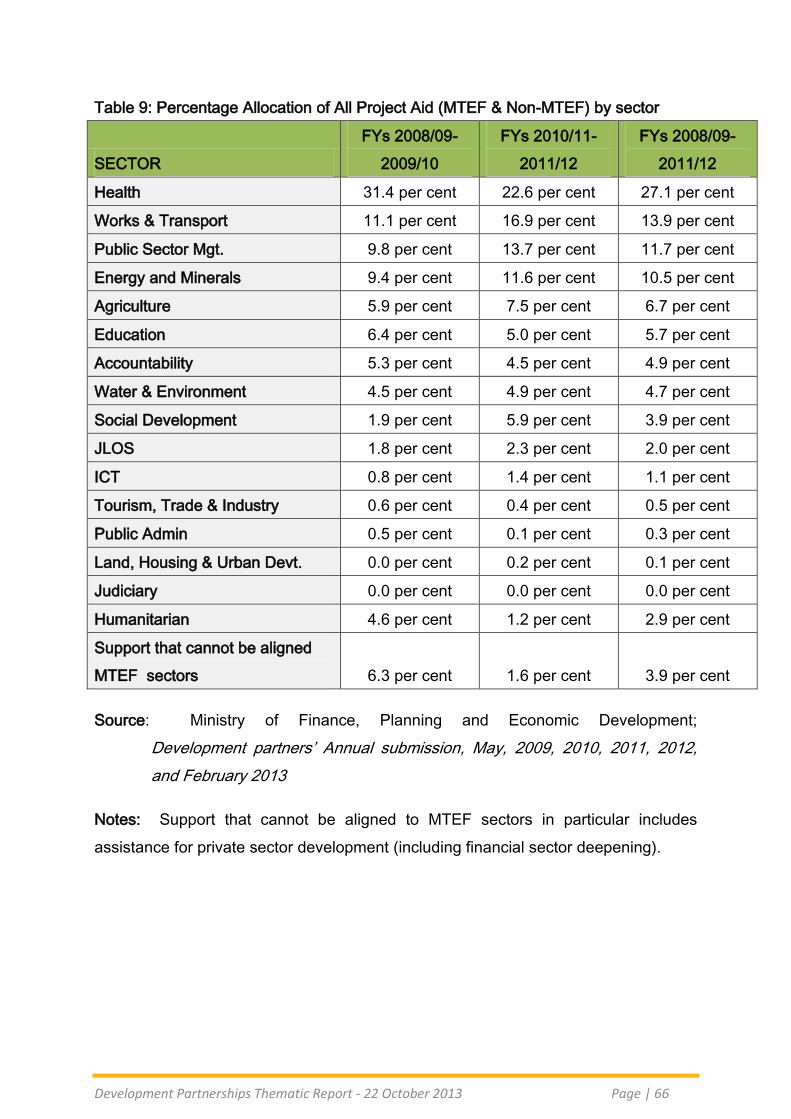
Development Partnerships Thematic Report - 22 October 2013 Page | 66
Table 9: Percentage Allocation of All Project Aid (MTEF & Non-MTEF) by sector
SECTOR
FYs 2008/09-
2009/10
FYs 2010/11-
2011/12
FYs 2008/09-
2011/12
Health 31.4 per cent 22.6 per cent 27.1 per cent
Works & Transport 11.1 per cent 16.9 per cent 13.9 per cent
Public Sector Mgt. 9.8 per cent 13.7 per cent 11.7 per cent
Energy and Minerals 9.4 per cent 11.6 per cent 10.5 per cent
Agriculture 5.9 per cent 7.5 per cent 6.7 per cent
Education 6.4 per cent 5.0 per cent 5.7 per cent
Accountability 5.3 per cent 4.5 per cent 4.9 per cent
Water & Environment 4.5 per cent 4.9 per cent 4.7 per cent
Social Development 1.9 per cent 5.9 per cent 3.9 per cent
JLOS 1.8 per cent 2.3 per cent 2.0 per cent
ICT 0.8 per cent 1.4 per cent 1.1 per cent
Tourism, Trade & Industry 0.6 per cent 0.4 per cent 0.5 per cent
Public Admin 0.5 per cent 0.1 per cent 0.3 per cent
Land, Housing & Urban Devt. 0.0 per cent 0.2 per cent 0.1 per cent
Judiciary 0.0 per cent 0.0 per cent 0.0 per cent
Humanitarian 4.6 per cent 1.2 per cent 2.9 per cent
Support that cannot be aligned
MTEF sectors 6.3 per cent 1.6 per cent 3.9 per cent
Source: Ministry of Finance, Planning and Economic Development;
Development partners’ Annual submission, May, 2009, 2010, 2011, 2012,
and February 2013
Notes: Support that cannot be aligned to MTEF sectors in particular includes
assistance for private sector development (including financial sector deepening).

Development Partnerships Thematic Report - 22 October 2013 Page | 67
Table 10: Total Aid by Donor (Budget Support + MTEF and NON-MTEF Project)
DONOR /
CREDITOR
FY 2008/09
Actual (US $)
FY 2009/10
Actual (US $)
FY 2010/11
Actual (US $)
FY 2011/12
Actual (US $)
ACBF 0.10 1.08 1.08 0.36
ADF 105.72 194.75 125.28 170.63
Austria 8.31 11.43 12.73 10.66
BADEA 2.03 - - -
Belgium 9.31 20.84 19.96 6.59
China 31.45 14.61 41.48 103.80
Denmark 27.02 42.30 30.29 32.94
Egypt - - 0.02 0.02
EU 189.41 110.83 168.47 108.94
France 1.03 1.22 - -
GEF 3.61 0.10 1.01 1.62
Germany 23.60 26.49 31.42 32.46
Global Fund 1.68 98.06 4.39 42.58
IBRD 0.49 0.06 0.45 -
Iceland - 3.08 2.10 0.06
IDA 257.59 337.19 254.71 267.81
IDB - - 0.09 1.09
IFAD 13.77 19.19 25.35 11.82
Ireland 37.93 56.75 39.77 49.98
Italy 255.04 0.07 - -
Japan 7.16 28.10 4.74 2.87
S. Korea - - - 1.40
NDF 1.59 4.67 5.02 4.53
Netherlands 22.90 32.23 32.70 -
Norway 28.92 41.83 44.40 104.05
OPEC - - 0.04 0.21
Spain - - - 7.55
Sweden 37.11 33.73 16.68 27.22
UK 66.69 103.96 97.75 74.92
UNAIDS - 0.08 - -
UNDP - 5.32 17.89 13.95

Development Partnerships Thematic Report - 22 October 2013 Page | 68
UNFPA - 13.42 1.92 4.25
UNICEF - - 41.60 27.72
USA 149.73 209.70 213.38 247.95
WFP - 83.95 55.00 -
TOTAL 1,282.19 1,495.05 1,289.72 1,358.00
HIPC 43.96 45.87 47.93 58.72
Grand TOTAL 1,326.15 1,540.92 1,337.66 1,416.72
Source: Ministry of Finance, Planning and Economic Development
Table 11: Top Ten Donors - Percentage allocation of Total Aid by Donor (Budget
Support + MTEF and Non-MTEF Project)
DONOR /
CREDITOR
FYs 2008/09-
2009/10
Actual
FYs 2010/11-
2011/12
Actual
FYs 2008/09 -
2011/12
IDA 20.75 per cent 18.97 per cent 19.88 per cent
USA 12.54 per cent 16.75 per cent 14.60 per cent
ADF 10.48 per cent 10.74 per cent 10.61 per cent
EU 10.47 per cent 10.07 per cent 10.28 per cent
UK 5.95 per cent 6.27 per cent 6.11 per cent
Italy 8.90 per cent 0.00 per cent 4.54 per cent
Norway 2.47 per cent 5.39 per cent 3.90 per cent
China 1.61 per cent 5.27 per cent 3.40 per cent
Ireland 3.30 per cent 3.26 per cent 3.28 per cent
Global Fund 3.48 per cent 1.71 per cent 2.61 per cent
Others 16.93 per cent 17.70 per cent 17.30 per cent
HIPC 3.13 per cent 3.87 per cent 3.50 per cent
Source: Ministry of Finance, Planning and Economic Development
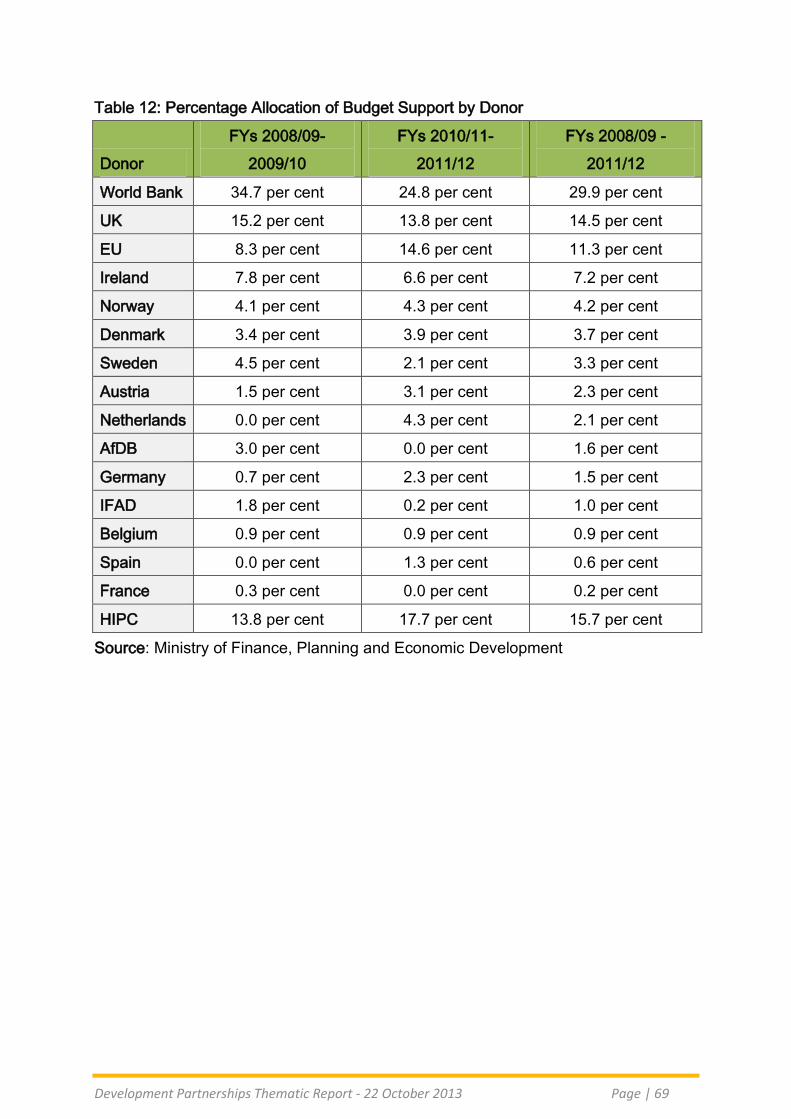
Development Partnerships Thematic Report - 22 October 2013 Page | 69
Table 12: Percentage Allocation of Budget Support by Donor
Donor
FYs 2008/09-
2009/10
FYs 2010/11-
2011/12
FYs 2008/09 -
2011/12
World Bank 34.7 per cent 24.8 per cent 29.9 per cent
UK 15.2 per cent 13.8 per cent 14.5 per cent
EU 8.3 per cent 14.6 per cent 11.3 per cent
Ireland 7.8 per cent 6.6 per cent 7.2 per cent
Norway 4.1 per cent 4.3 per cent 4.2 per cent
Denmark 3.4 per cent 3.9 per cent 3.7 per cent
Sweden 4.5 per cent 2.1 per cent 3.3 per cent
Austria 1.5 per cent 3.1 per cent 2.3 per cent
Netherlands 0.0 per cent 4.3 per cent 2.1 per cent
AfDB 3.0 per cent 0.0 per cent 1.6 per cent
Germany 0.7 per cent 2.3 per cent 1.5 per cent
IFAD 1.8 per cent 0.2 per cent 1.0 per cent
Belgium 0.9 per cent 0.9 per cent 0.9 per cent
Spain 0.0 per cent 1.3 per cent 0.6 per cent
France 0.3 per cent 0.0 per cent 0.2 per cent
HIPC 13.8 per cent 17.7 per cent 15.7 per cent
Source: Ministry of Finance, Planning and Economic Development

Development Partnerships Thematic Report - 22 October 2013 Page | 70
Table 13: Top Ten Donors - Percentage allocation of MTEF Project Support by
Donor
DONOR /
CREDITOR
FYs 2008/09-
2009/10
FYs 2010/11-
2011/12
FYs 2008/09 -
2011/12
IDA 38.1 per cent 33.7 per cent 35.7 per cent
ADF 19.0 per cent 24.8 per cent 22.1 per cent
EU 8.9 per cent 9.9 per cent 9.5 per cent
China 4.8 per cent 13.1 per cent 9.2 per cent
Global Fund 10.3 per cent 4.2 per cent 7.1 per cent
Norway 1.1 per cent 5.5 per cent 3.4 per cent
IFAD 2.2 per cent 3.3 per cent 2.8 per cent
Netherlands 4.9 per cent 0.6 per cent 2.6 per cent
Japan 3.6 per cent 0.6 per cent 2.0 per cent
Sweden 2.0 per cent 0.2 per cent 1.1 per cent
Others 5.1 per cent 4.7 per cent 4.9 per cent
Source: Ministry of Finance, Planning and Economic Development
Table 14: Top Ten Donors - Percentage allocation of NON-MTEF Project Support by
Donor
Donor
FYs 2008/09-
2009/10
FYs 2010/11-
2011/12
FYs 2008/09 -
2011/12
USA 28.87 per cent 44.13 per cent 35.83 per cent
Italy 20.45 per cent 0.00 per cent 11.12 per cent
EU 12.81 per cent 7.59 per cent 10.43 per cent
UK 4.92 per cent 7.67 per cent 6.17 per cent
WFP 6.73 per cent 5.26 per cent 6.06 per cent
ADF 7.76 per cent 2.08 per cent 5.17 per cent
Norway 2.67 per cent 5.87 per cent 4.13 per cent
Germany 3.65 per cent 4.52 per cent 4.05 per cent
DANIDA 3.26 per cent 3.54 per cent 3.39 per cent
UNICEF 0.00 per cent 6.63 per cent 3.02 per cent
OTHERS 8.89 per cent 12.71 per cent 10.63 per cent
Source: Ministry of Finance, Planning and Economic Development

Development Partnerships Thematic Report - 22 October 2013 Page | 71
Table 15: Development Assistance by Donor for the period 2008 - 2011 (USD m)
Category Donor 2008 2009 2010 2011
DAC Countries,
Total
Total
1,627.57
1,761.80
1,717.68
1,590.25
1,003.29
1,009.91
1,042.84
1,008.38
DAC Countries,
Total
Australia
1.08
1.79
2.52
10.89
Austria
15.75
12.66
14.38
14.59
Belgium
17.03
22.16
29.22
14.93
Canada
16.25
16.85
5.75
6.45
Denmark
57.14
77.69
81.22
68.79
Finland
5.61
4.57
5.85
4.89
France
21.05
17.19
4.06
3.46
Germany
37.84
60.06
41.08
62.39
Greece
0.27
0.22
0.19
0.20
Iceland .. .. ..
3.32
Ireland
76.99
63.19
57.71
59.30
Italy
12.40
8.95
11.40
13.01
Japan
57.01
54.05
71.24
57.12
Korea
0.68
1.24
1.88
2.41

Development Partnerships Thematic Report - 22 October 2013 Page | 72
Luxembourg
1.62
1.04
0.27
0.79
Netherlands
82.85
45.01
36.65
14.86
New Zealand
0.16
0.20 .. ..
Norway
74.98
67.32
71.45
80.97
Spain
38.15
13.96
5.43
2.99
Sweden
64.07
52.65
43.29
41.41
Switzerland
3.76
3.34
1.01
1.40
United
Kingdom
65.75
118.90
180.12
146.22
United States
352.88
366.87
378.13
397.96
Multilateral, Total
624.29
751.77
674.65
579.51
Multilateral
AfDB
0.73
0.68 .. ..
AfDF
111.68
111.21
101.55
140.09
BADEA .. .. ..
0.03
EU
Institutions
258.89
128.04
128.94
169.68
GAVI
17.32
8.28
7.96
12.54
Global Fund
7.24
46.92
57.21
26.02
IBRD
1.36
1.26
0.94
1.12

Development Partnerships Thematic Report - 22 October 2013 Page | 73
IDA
180.70
396.34
328.63
177.99
Nordic
Dev.Fund ..
3.98
7.94
5.35
OFID .. .. ..
0.21
UNAIDS
0.65
1.02
1.02
1.00
UNDP
12.92
12.34
5.79
4.67
UNFPA
6.45
7.23
6.83
6.22
UNICEF
22.48
22.17
20.18
23.29
UNPBF .. ..
0.61
6.83
WFP
3.88
12.29
7.06
3.20
WHO .. .. ..
1.29
Non-DAC
Countries, Total ..
0.13
0.19
2.35
Non-DAC
Countries
Czech
Republic .. .. ..
0.02
Kuwait
(KFAED) .. .. ..
2.04
United Arab
Emirates ..
0.13
0.19
0.30
Source: OECD WEBSITE

Development Partnerships Thematic Report - 22 October 2013 Page | 74
Table 16: Percentage Development Assistance by Donor
DONOR 2008 - 2009 2010 - 2011 2008 - 2011
United States 21.2 per cent 23.5 per cent 22.3 per cent
IDA 17.0 per cent 15.3 per cent 16.2 per cent
EU Institutions 11.4 per cent 9.0 per cent 10.2 per cent
United Kingdom 5.4 per cent 9.9 per cent 7.6 per cent
AfDF 6.6 per cent 7.3 per cent 6.9 per cent
Norway 4.2 per cent 4.6 per cent 4.4 per cent
Denmark 4.0 per cent 4.5 per cent 4.3 per cent
Ireland 4.1 per cent 3.5 per cent 3.8 per cent
Japan 3.3 per cent 3.9 per cent 3.6 per cent
Sweden 3.4 per cent 2.6 per cent 3.0 per cent
OTHERS 19.3 per cent 15.9 per cent 17.6 per cent
Source: OECD WEBSITE

Development Partnerships Thematic Report - 22 October 2013 Page | 75
Annex 3. Uganda’s Joint Budget Support Framework
Goal
The stated objective of the JBSF, which has been in place since 2007/2008, is to
reduce poverty in Uganda through support to the implementation of the
Government’s poverty eradication policies within the framework of the NDP.27
The JBSF building blocks
The basic building blocks of the JBSF have been:
A joint assessment framework (JAF) of agreed actions and indicators which
together with a set of underlying principles and preconditions, provide the basis
for decisions about performance and budget support disbursements;
An institutional structure in which these decisions can be made which draws on
the government’s own established structures for setting policy and budgets, and
monitoring performance; and
A timetable (intended to be focused on the provision of predictable budget
finance) in which decisions about performance in year N-1 are made in year N
and are the basis for budget support commitments in year N+1.
The performance framework
The underlying principles of budget support are a set of shared commitments that
are viewed as fundamental to the development partnership. They comprise: the
commitment to peace and stability in Uganda and the region; the commitment to
democracy; the commitment to human rights; and the commitment to rule of law and
access to justice.
The preconditions for budget support capture the government’s commitment to an
overall policy framework in which resources are managed effectively and efficiently
27 This goal is included in the JBSF Memorandum of Understanding which has been drafted, although not
signed.
Development Partnerships Thematic Report - 22 October 2013 Page | 76
to achieve agreed objectives. These have been focused on: the implementation of
sound macro- economic policies; the government’s commitment to economic growth
and poverty alleviation; and the implementation of policies that will strengthen public
financial management including procurement systems and the fight against
corruption.
The specific indicators and actions in the JAF have been focused on a set of results
which are viewed as crucial to Uganda’s social, economic and political governance.
These are aligned as closely as possible to the content of the government’s own
performance monitoring system. Joint assessment frameworks this far have focused
on specific sector targets and actions in health, education and transport alongside
cross cutting indicators and actions covering areas such as funding of service
delivery, budget credibility, audit, procurement, domestic revenue generation and the
performance of public servants.
The institutional structure
The JBSF has aimed to use existing government structures for dialogue and
consultation. These structures include:
the cabinet level policy co-ordination committee (PCC) where designated
meetings have been joined by high level development partner representatives;
the permanent secretary level implementation co-ordination steering committee
(ICSC) where designated meetings have been joined by senior development
partner representatives to facilitate policy level decisions under the JBSF;
the inter- ministerial technical implementation co-ordination committee which
supports the ICSC and where development partners participate to facilitate
budget support monitoring and implementation;
joint sector working groups which support the process of monitoring performance
at sector level as well as identifying annual sector joint assessment framework
targets.
In addition the JBSF has used the Government’s Annual Performance Report
(GAPR) as well as other key documents for setting and monitoring targets, especially
annual ministerial policy statements, to provide the principal inputs for the design
and review of successive JAFs.

Development Partnerships Thematic Report - 22 October 2013 Page | 77

Development Partnerships Thematic Report - 22 October 2013 Page | 78
The timetable
The JBSF timetable is focused on the aligning appraisal, consultation, decisions, and
disbursements with the budget cycle. The important milestones have been:
The production of the GAPR for the preceding financial year
(November/December) in a process in which at a working level development
partners’ participate;
Submission of Development Partners’ response to this in form of an annual JAF
appraisal for the preceding year (December/January);
A high level meeting of the PCC and JBSF donor heads of mission to discuss this
JAF appraisal (December/ January);
The annual budget workshop at which based on the JAF appraisal for the
preceding year development partners are expected to confirm their budget
support commitments for the following year (March/April);
Finalisation of the JAF matrix for the following year and endorsement at a joint
meeting of the ICSC and JBSF donor heads of mission (May/June).
Issues
In many respects the JBSF has worked as intended to align donor budget support
behind first, the objectives of the NDP as reflected in sector strategic investment
plans and ministerial policy statements; second the government’s own systems and
institutions for monitoring performance; and the third the budget cycle.
The JBSF performance framework however has been criticised for the layers of
conditionality represented in the underlying principles, the budget support
preconditions, and the JAF matrix. Concerns have also been raised about the
multiple actions and indicators contained in the JAF matrix itself which arguably
undermine efforts to focus on central policy priorities and makes overall performance
assessments difficult.
At the same time the JBSF has been implemented in an increasingly fragile context
as the relationship between government and donors has become progressively more
difficult as a consequence of:

Development Partnerships Thematic Report - 22 October 2013 Page | 79
Development partner concerns about events surrounding the 2011 election and
large unbudgeted defence expenditures later the same year.
Development partner questions about results and performance, focused on a set
of problems that have been regularly discussed in policy dialogue, but on which
little progress has been made. These issues include unease about budget
planning and implementation as a result of: budgets not reflecting the allocations
proposed for priority areas in the NDP; the significant underfunding of front line
service delivery and infrastructure maintenance; and persistent supplementary
budgets that favour public administration (including State House). They also
include perpetual concern about the government’s revenue performance.
A major fraud that was revealed by the Auditor General at the end of 2012
involving the misappropriation of 14 million Euros of aid financing from Denmark,
Ireland, Norway and Sweden and a further £1.3 million from DFID. The
resources had been set aside for the peace recovery and development
programme (PRDP) in Northern Uganda. Government employees working
principally in OPM, but also in MoFEPD and the Bank of Uganda, are under
investigation.
These problems have made it difficult for development partners to maintain their
commitment to the provision of predictable resources and the formula in which
performance in year N-1 determines budget support disbursements in year N+1. In
practice policy concerns have led to disbursement delays and adjustments in year as
development partners have highlighted the continuous process for assessing the
underlying principles and budget support pre-conditions. The government has
claimed that these delays and adjustments have not always been clearly
communicated.
The OPM fraud led to JBSF processes being effectively suspended at the end of
2012. All budget support donors including the World Bank formally announced to the
government that their budget support was frozen. At the time of preparing this draft
report the first step in the decision to lift this freeze is linked to a high level action
matrix that requires the government to return misappropriated funds, to take
administrative and legal action against those involved in the fraud, and to strengthen
financial systems to close loopholes. Subsequently disbursement decisions will
Development Partnerships Thematic Report - 22 October 2013 Page | 80
depend on the assessment of the underlying principles, budget support
preconditions and the 2011/12 JAF that was finalised in the middle of 2011. There
are clear indications that a number of donors are unlikely to release the funds they
have held back. All budget support donors are currently considering whether they will
continue to use this instrument going forward

Development Partnerships Thematic Report - 22 October 2013 Page | 81
Annex 4. Donor division of labour
Table 17: Donor engagement by Sector (2008)
Sectors and subsectors
AfDBIM
F
World Bank EC
Austria
Belgium
Denmark
France
Germany
Iceland
IrelandItaly
Japan
Netherlands
Norway
Sweden
UKUSA
UNAIDS
UNDPUNEP
UN-FAO
UNFPA
UNHCR
UNICEF
UN-IDO
UN-IFAD
UNIFEM
UN-OHCHR
UN WHO
World Food Program
me
Active DPs in FY2008/09 1
1. Security × × × 3
2. Roads and Transport × × × × × 5
3. Agriculture × × × × × × × × × × × × × 13
4. Education × × × × × × × × × × × 11
5. Health × × × × × × × × × × × × × × 14
6. Water and Environment 0
6.1 Water and sanitation × × × × × × 6
6.2 Environment/Climate change × × × × 4
7. Justice, Law and Order × × × × × × × × × × 10
8. Accountability × × × × × 5
8.1 Public Financial Management 3 × × × × 4
8.2 Anti Corruption 3 × × 2
9. Tourism, Trade and Industry × × × × × × × × 8
10. ICT × × × 3
11. Energy and Mineral Development × × × × 4
12. Lands and Housing × × × 3
13. Social Development × × × × × × × × × × × 11
14. General Public Administration × 1
15. Public Sector Management 0
15.1 Decentralisation × × × × × × 6
15.2 Public Service Reform × × × × 4
16. Parliament × × × × × 5
Cross cutting issues
5.CC HIV/AIDS × × × × × × × × × × × × × × 14
13.CC Gender × × × × × × × × × × 10
DP active in sectors in FY2008/091 6 1 15 4 1 1 8 1 1 4 7 5 7 2 5 7 8 8 0 9 0 4 7 1 7 6 3 1 8 3 6

Development Partnerships Thematic Report - 22 October 2013 Page | 82
Table 18: Donor engagement by Sector (2012)
Sectors and subsectors
AfDB
Aga Khan Development N
etwork
IMF
World Bank EC
Austria
Belgium
Canada
Denmark
France
Germany
Iceland
IrelandItaly
Japan
South Korea
Netherlands
Norw
ay
Spain
Sweden
UK
USA
UNAIDS
UNDP
UNCDF
UN-FAO
UNFPA
UNH
CR
UNICEF
UN-IDO
UN-IFAD
UNW
OM
EN
UN-O
HCHR
UN-W
HO
International Organization for M
igration
International Atomic Energy Agency
World Food Program
me
Active DPs in FY2011/12
1. Security × × × × 4
2. Roads and Transport × × × × × × × × × 9
3. Agriculture × × × × × × × × × × × × × × × × × × × 19
4. Education × × × × × × × × × × × × × × 14
5. Health × × × × × × × × × × × × × × × 15
6. Water and Environment × × × × × 5
6.1 Water and sanitation × × × × × × × × × 9
6.2 Environment/Climate change × × × × × × × × × × × 11
7. Justice, Law and Order × × × × × × × × × × × × × 13
8. Accountability × × × × × × × × × × × 11
8.1 Public Financial Management × × × × × × × × × 9
8.2 Anti Corruption × × × × × 5
9. Tourism, Trade and Industry × × × × × × × × × × × × 12
10. ICT × × × × 4
11. Energy and Mineral Development × × × × × × × × × × 10
12. Lands and Housing × × 2
13. Social Development × × × × × × × × × × × × × 13
14. General Public Administration × × × 3
15. Public Sector Management × × × × 4
15.1 Decentralisation × × × × × × × 7
15.2 Public Service Reform × × 2
16. Parliament × × × × × × × × 8
Cross cutting issues
5.CC HIV/AIDS × × × × × × × × × × × × × × 14
13.CC Gender × × × × × × × × × × × × × × × × 16
DP active in sectors in FY2011/12 8 1 18 9 2 2 10 3 7 5 11 1 8 3 2 6 4 11 13 12 8 4 8 10 10 3 3 9 9 7 6 6IFAD: