development of tools for assessing genotoxicity - about4676/obj/2539_ca_object... · 2 science...
TRANSCRIPT
SCHO0207BMBG-E-P
Development of tools for assessinggenotoxicityScience Report – SC030102/SR

Science Report Development of tools for assessing genotoxicity2
The Environment Agency is the leading public body protecting andimproving the environment in England and Wales.
It’s our job to make sure that air, land and water are looked after byeveryone in today’s society, so that tomorrow’s generations inherit acleaner, healthier world.
Our work includes tackling flooding and pollution incidents, reducingindustry’s impacts on the environment, cleaning up rivers, coastalwaters and contaminated land, and improving wildlife habitats.
This report is the result of research commissioned and funded by theEnvironment Agency’s Science Programme.
Published by:Environment Agency, Rio House, Waterside Drive, Aztec West,Almondsbury, Bristol, BS32 4UDTel: 01454 624400 Fax: 01454 624409www.environment-agency.gov.uk
ISBN: 978-1-84432-678-5
© Environment Agency – February 2007
All rights reserved. This document may be reproduced with priorpermission of the Environment Agency.
The views and statements expressed in this report are those ofthe author alone. The views or statements expressed in thispublication do not necessarily represent the views of theEnvironment Agency and theEnvironment Agency cannot accept any responsibility for suchviews or statements.
This report is printed on Cyclus Print, a 100% recycled stock,which is 100% post consumer waste and is totally chlorine free.Water used is treated and in most cases returned to source inbetter condition than removed.
Further copies of this report are available from:The Environment Agency’s National Customer Contact Centreby emailing:[email protected]
Author(s):Cheung V and Galloway T
Dissemination Status:Publicly available
Keywords:Genotoxicity, Crassostrea gigas, Arenicola marina
Research Contractor:University of PlymouthDrake Circus, Plymouth PL4 8AATel: 01752 232900
Environment Agency’s Project Manager:Richard Owen, Rio House, Waterside Drive, Aztec West,Almondsbury, Bristol BS32 4UD
Science Project Number:SC030102
Product Code:SCHO0207BMBG-E-P

Science Report Development of tools for assessing genotoxicity 3
Science at the Environment AgencyScience underpins the work of the Environment Agency. It provides an up-to-dateunderstanding of the world about us and helps us to develop monitoring tools andtechniques to manage our environment as efficiently as possible.
The work of the Environment Agency's Science Group is a key ingredient in the partnershipbetween research, policy and operations that enables the Environment Agency to protectand restore our environment.
The science programme focuses on five main areas of activity:
• Setting the agenda, by identifying where strategic science can inform ourevidence-based policies, advisory and regulatory roles;
• Funding science, by supporting programmes, projects and people in responseto long-term strategic needs, medium-term policy priorities and shorter-termoperational requirements;
• Managing science, by ensuring that our programmes and projects are fit forpurpose and executed according to international scientific standards;
• Carrying out science, by undertaking research – either by contracting it out toresearch organisations and consultancies or by doing it ourselves;
• Delivering information, advice, tools and techniques, by makingappropriate products available to our policy and operations staff.
Steve Killeen
Head of Science
Science Report Development of tools for assessing genotoxicity4
Executive Summary
BackgroundIn addition to the measurement of sets of single-substance standards, known asEnvironmental Quality Standards (EQSs), or Environmental Assessment Levels(EALs), the aqueous environment is protected by measurements of biological effect.Ecotoxicological tests and bioassays are also employed to determine the toxichazard posed by chemicals and environmental samples. The Environment Agencycurrently uses such tests within its Direct Toxicity Assessment (DTA) programme toset toxicity targets for selected effluent discharges to surface waters.
Aims and objectivesA limitation of DTA tests and bioassays is that they usually measure acute toxicityand lethality and, as such, provide little information regarding sub-lethal biologicaleffects, particularly at the genetic level. This report presents the results of a series ofresearch and development studies, which aimed to coordinate laboratory and fieldexposure studies between the Environment Agency and the University of Plymouth.
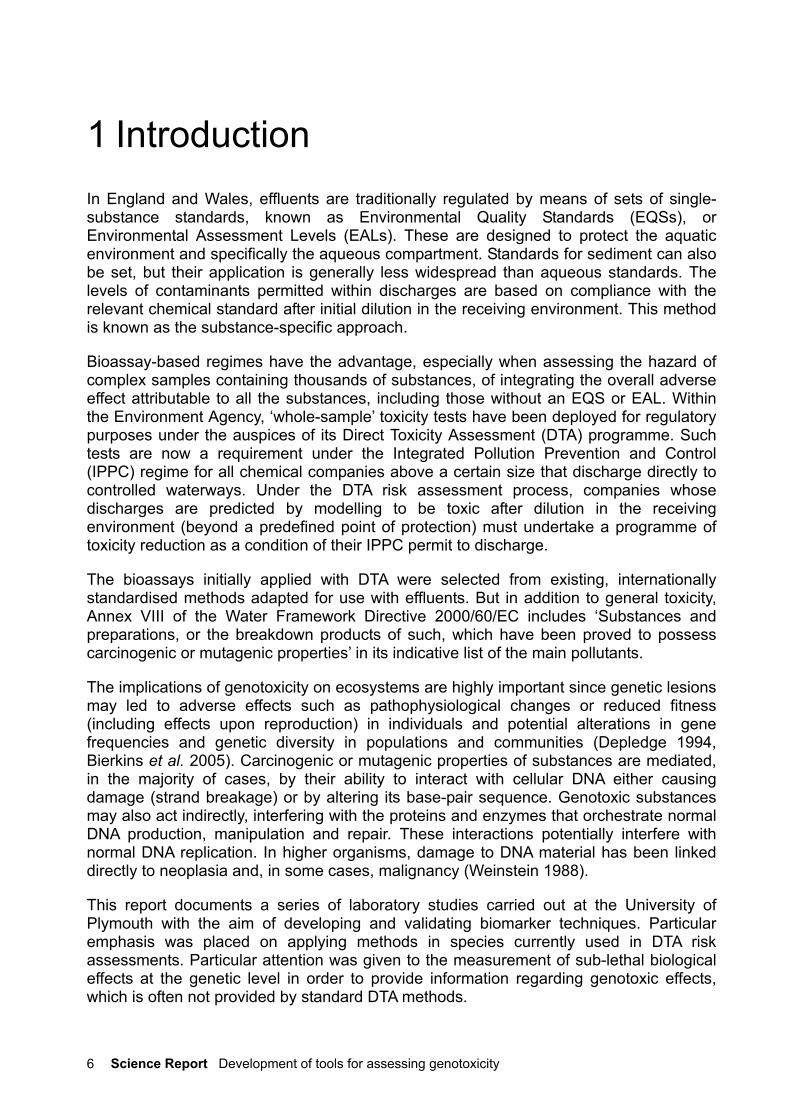
Conclusions and recommendationsInvestigations were carried out to assess the potential for biomarkers of genotoxicityto be applied in association with currently employed DTA methods in the sametarget species. The conclusions and recommendations from this report are asfollows:
• The chromosome aberration (CAb) assay was successfully developed andvalidated against reference mutagens in the embryo-larval stages of thePacific oyster, Crassostrea gigas.
• The CAb assay was successfully applied to test the genotoxic potential ofwhole effluents and sediment elutriates using the embryo-larval stages of C.gigas.
• As a method for routine monitoring of environmental samples, the CAb assayis somewhat laborious compared with some DTA methods. In addition, fullytrained and experienced staff are required to observe and analyse thechromosomes. This restricts the testing of numerous water samples forgenotoxic potential. But compared with other methods (Ames andGreenScreen® assays), it appeared to be the most sensitive in terms ofdetecting genotoxicity.
• The induction of metallothionein, inhibition of acetylcholine esterase activity,and ferric reducing antioxidant power may be useful measures of sub-lethalbiological effects. Further optimisation and validation is required for thesemethods in Arenicola marina. Cause–effect relationships can only beextrapolated with additional inter-discipline data.
• Initial results indicate that other methods for detecting genotoxic effects suchat the Comet assay can be applied in species such as A. marina. Applicationof this method requires further optimisation and validation.

Science Report Development of tools for assessing genotoxicity 5
ContentsScience at the Environment Agency 3Executive Summary 4Contents 51 Introduction 6
1.1 Structure of this report 7
2 Determination of chromosome aberrations 82.1 Cell cycle kinetics 8
2.2 Validation studies 13
2.3 Application – effluents and sediment elutriates 21
2.4 Conclusions and recommendations 24
3 Habitats Directive study 263.1 Metallothionein induction 26
3.2 Acetylcholinesterase activity 28
3.3 Ferric reducing antioxidant power (FRAP) assay 30
3.4 Conclusions and recommendations 32
4 Work under the National Marine Monitoring Programme 344.1 Comet assay 34
5 Publications and presentations 37List of abbreviations 38References & Bibliography 39
Appendix I University of Plymouth protocols 42Appendix II OysteR Embryo Chromosome Aberrations (ORCA) assay: method
development and validation 55
Science Report Development of tools for assessing genotoxicity6
1 IntroductionIn England and Wales, effluents are traditionally regulated by means of sets of single-substance standards, known as Environmental Quality Standards (EQSs), orEnvironmental Assessment Levels (EALs). These are designed to protect the aquaticenvironment and specifically the aqueous compartment. Standards for sediment can alsobe set, but their application is generally less widespread than aqueous standards. Thelevels of contaminants permitted within discharges are based on compliance with therelevant chemical standard after initial dilution in the receiving environment. This methodis known as the substance-specific approach.
Bioassay-based regimes have the advantage, especially when assessing the hazard ofcomplex samples containing thousands of substances, of integrating the overall adverseeffect attributable to all the substances, including those without an EQS or EAL. Withinthe Environment Agency, ‘whole-sample’ toxicity tests have been deployed for regulatorypurposes under the auspices of its Direct Toxicity Assessment (DTA) programme. Suchtests are now a requirement under the Integrated Pollution Prevention and Control(IPPC) regime for all chemical companies above a certain size that discharge directly tocontrolled waterways. Under the DTA risk assessment process, companies whosedischarges are predicted by modelling to be toxic after dilution in the receivingenvironment (beyond a predefined point of protection) must undertake a programme oftoxicity reduction as a condition of their IPPC permit to discharge.
The bioassays initially applied with DTA were selected from existing, internationallystandardised methods adapted for use with effluents. But in addition to general toxicity,Annex VIII of the Water Framework Directive 2000/60/EC includes ‘Substances andpreparations, or the breakdown products of such, which have been proved to possesscarcinogenic or mutagenic properties’ in its indicative list of the main pollutants.
The implications of genotoxicity on ecosystems are highly important since genetic lesionsmay led to adverse effects such as pathophysiological changes or reduced fitness(including effects upon reproduction) in individuals and potential alterations in genefrequencies and genetic diversity in populations and communities (Depledge 1994,Bierkins et al. 2005). Carcinogenic or mutagenic properties of substances are mediated,in the majority of cases, by their ability to interact with cellular DNA either causingdamage (strand breakage) or by altering its base-pair sequence. Genotoxic substancesmay also act indirectly, interfering with the proteins and enzymes that orchestrate normalDNA production, manipulation and repair. These interactions potentially interfere withnormal DNA replication. In higher organisms, damage to DNA material has been linkeddirectly to neoplasia and, in some cases, malignancy (Weinstein 1988).
This report documents a series of laboratory studies carried out at the University ofPlymouth with the aim of developing and validating biomarker techniques. Particularemphasis was placed on applying methods in species currently used in DTA riskassessments. Particular attention was given to the measurement of sub-lethal biologicaleffects at the genetic level in order to provide information regarding genotoxic effects,which is often not provided by standard DTA methods.

Science Report Development of tools for assessing genotoxicity 7
1.1 Structure of this report
The following three chapters of this report describe genotoxicity studies carried out in thefollowing areas:
• determination of chromosome aberrations in the Pacific oyster, Crassostrea gigas– cell cycle kinetics, validation studies, application to effluents and sedimentelutriates;
• assays based on the lugworm, Arenicola marina, using sediment samplescollected by the Environment Agency from Seal Sands on Teesside as part of itswork under the Habitats Directive – metallothionein induction, acetylcholineesterase activity and ferric reducing antioxidant power (FRAP);
• application of the Comet assay to Arenicola marina in sediment samples collectedby the Environment Agency from the River Thames as part of the National MarineMonitoring Programme.
The aim, method, results and observations for each study are presented within thechapters, with conclusions and recommendations on the topic covered given for thewhole chapter. The final chapter lists the publications prepared as a result of thisEnvironment Agency Science Group project.
Appendix 1 presents the standard operating protocols (SOPs) used at the University ofPlymouth and Appendix 2 the results of a series of experiments carried out by theEnvironment Agency’s National Laboratory Service to develop and validate the OysteREmbryo Chromosome Aberrations (ORCA) assay.

Science Report Development of tools for assessing genotoxicity8
2. Determination of chromosomeaberrations
The metaphase chromosome aberration (CAb) assay is one of several cytogenetic teststhat uses light microscopy to identify genetic lesions such as clastogenesis in mitoticallydividing cells (Scott et al. 1990). Analysis of CAbs has been considered importantbecause of their known role in the induction of malignancies, congenital abnormalitiesand foetal wastage (Natarajan et al. 1994, Tucker and Preston 1996). It is thus one of thestandard tests employed within a battery of methods for assessing genotoxicity ofpharmaceuticals in mammalian systems. Genotoxic agents produce structuralchromosomal aberrations by a variety of mechanisms with the end-point being adiscontinuity in the chromosomal DNA, which is usually observed during metaphase. Theassay has more recently been applied in aquatic organisms to study the impact ofgenotoxic agents released into the aquatic environment (Jha 2004).
Larvae of the Pacific oyster, Crassostrea gigas, are used in standardised developmentalbioassays in the UK to assess the hazard of complex industrial effluents from thechemical industry as part of Direct Toxicity Assessment within the IPPC regime. They arealso used routinely within the UK National Marine Monitoring Programme carried out tofulfil OSPAR1 obligations.
The aims of the studies described in this chapter were to:
• optimise, develop and validate the CAb assay in the early life stages of C. gigas;
• apply the CAb assay in C. gigas in order to quality the genotoxic potential of industrialeffluents.
2.1 Cell cycle kinetics
Aim: To establish the cell cycle kinetics of Crassostrea gigas early life stages.
The average generation time (AGT) of the embryo-larval cells of C. gigas was not known.It was therefore necessary to calculate it before undertaking cytogenetic studies.Temperature is known to have an influence upon the rate of cell division and thus rates ofembryonic development. The aim of this initial study was therefore to determine theproliferation rate index (PRI) and the AGT in the embryo-larval stages of C. gigas at twodifferent temperatures, 15 and 20°C.
2.1.1 MethodsC. gigas embryo-larvae were collected by the strip spawning of adult oysters. A broodstock of conditioned C. gigas was supplied from a culture maintained at Guernsey SeaFarms. At least two males and two females were strip spawned as described by Thain
1 1992 Oslo and Paris Convention on the protection of the marine environment of theNorth-East Atlantic

Science Report Development of tools for assessing genotoxicity 9
(1991) and their gametes resuspended in separate vessels containing ~50 ml artificialseawater (20 ± 2°C). Before fertilisation, the gametes were checked both qualitativelyand quantitatively. Viable eggs from one female were fertilised as described by in theASTM standard guide (ASTM 1992). The embryos were resuspended in artificialseawater and incubated at a maximum density of 100 embryos per ml for 12 hours at therespective temperatures (15 or 20 ± 2°C) in the dark before the first treatments wereexposed to 5-bromodeoxyuridine (BrdU).
A stock solution of BrdU was made up with filtered seawater at a concentration of 1.0 x10⁻⁴ M and stored in a 500 ml amber glass bottle, which was further protected fromphoto-activation by covering with aluminium foil. The embryo-larvae were exposed to aworking solution of 1.0 x 10⁻⁵M BrdU for periods of 4, 6, 8 and 12 hours at eachtemperature (15 or 20ºC) before fixing. To synchronise the time at which the sampleswere fixed (when the embryo-larvae were 24-hours old), the times of addition of BrdUwere staggered.
The methods of slide preparation, chromosome staining and chromosome analysis arepresented in Appendix I. These were adopted from earlier studies by Harrison and Jones(1982) and subsequently modified by others (e.g. Jha et al. 1996, 2000). When theembryo-larvae were 24-hours old and had received 1.0 × 10⁻⁵ M BrdU exposure for 4, 6,8 or 12 hours, they were poured through a 30 µm nylon mesh sieve and treated with0.025 per cent colchicine solution (w/v) dissolved in seawater, hypotonic solutions andfixed as per the protocol described in Appendix I. Metaphase spreads were thenprepared.
Sister chromatid differential (SCD) staining was conducted to allow the number of cellcycles that the metaphases had passed through to be identified. SCD staining wascarried out following a procedure developed by Goto et al. (1975), with somemodifications introduced by Jha et al. (1996). A 0.025 per cent (w/v) of Hoechst 33258solution was prepared in phosphate-buffered saline (PBS) in an amber glass 250 mlbottle and stored in the dark at room temperature until ready for use. The slides with thechromosome spreads were arranged in glass coplin jars and rinsed twice with distilledwater to remove any dust or artefacts that might have attached to the surface of theslides. The distilled water was drained away, replaced with 0.025 per cent Hoechstsolution and the slides incubated in the dark for 20 minutes at room temperature. Theslides were then rinsed twice with distilled water and allowed to air-dry. A few drops ofPBS were added to each slide and coverslips applied. The slides were then placed on ahot plate maintained at 55°C and simultaneously exposed to black light (F18W-BLBlights; Sylvania, UK) for 25 minutes. The slides were rinsed a further twice, allowing thecoverslips to slide off in the process and air-dried. The slides were then stained with 10per cent Giemsa solution, and coverslips mounted with DPX as per the staining protocolfor CAbs described in Appendix I.
Metaphase spreads were examined using a bright field microscope (Olympus Polyvar),at a magnification of ×1000 (with oil immersion). To determine the cell cycle kinetics, atleast 100 cells per replicate were examined and classified as first (M1), second (M2) orthird or subsequent (M3+) division cells. The cells were classed by taking note of thepattern of staining for the metaphase cell being examined.

Science Report Development of tools for assessing genotoxicity10
• Cells in M1 consisted of chromosomes that were stained dark throughout thespread, with the staining of the sister chromatids of each chromosome being ofequal depth of staining.
• Cells in M2 consisted of chromosomes that were stained differentially and of a‘harlequin’ appearance.
• Cells in M3 consisted of a mixture of chromosomes that were differentially stainedand chromosomes that consisted of sister chromatids which were both lightlystained.
The PRI was calculated using the following equation, which is based on the methodproposed by Lamerti et al. (1983):
PRI = [(1 × M1) + (2 × M2) + (3 × M3)] Number of cells scored
Once the PRI had been calculated, the generation time (GT) could be calculated usingthe following equation as proposed by Ivett and Tice (1982).
GT = hours in BrdU PRI
During attempts to score the chromosomes for PRI, it was noted that there were very fewmetaphase spreads present (approximately 1–20 metaphases per slide) compared withpast observations of a minimum of approximately 200 metaphases per slide when similarexperiments were conducted with Mytilus edulis embryo-larval cells. Of the metaphasespresent, many of the chromosomes were not condensed adequately and thus thestaining was of poor quality. It was noted that many of the larvae had developed into theprodissoconch stage (‘D-shell’ larvae). From previous experience it had been concludedthat, ideally, the samples should be treated with colchicine at the trochophore stage whencells are still dividing rapidly and a shell has not yet formed. Figure 2.1 illustrates themorphology of the eggs and embryo-larval stages of C. gigas. The experiments weretherefore repeated with a modification to the periods of exposure to BrdU (2, 4, 6 and 8hours) and the timing of the harvesting of the embryo-larvae reduced to 20-hours oldpost-fertilisation. A further repeat experiment was conducted at 20°C for further validationof the cell kinetics at this temperature.

Science Report Development of tools for assessing genotoxicity 11
Figure 2.1 Morphology of eggs, embryos and larvae from C. gigas
2.1.2 Results and observationsFollowing a repeat of the cell cycle kinetics where the cells were harvested at 20 hourspost-fertilisation, it was observed that chromosomes in metaphase spreads were plentifulfor scoring and well condensed. Figure 2.2 illustrates the SCD staining, allowing theidentification of cells that have passed through 1,2 and 3/3+ cell cycles.
From the PRI, it was calculated that the AGT of the early life stages from C. gigasincubated at 15ºC was 2.64 hours (Table 2.1). Embryo-larvae incubated at the highertemperature of 20°C resulted in a faster AGT of 2.47 hours, and 2.57 hours when theexperiment was repeated (Table 2.1). From this result, one cell cycle for all subsequentexperiments was considered to be approximately 2.5 hours.
Unfertilisedegg
Fertilisedeggs (1 h)
Unfertilisedeggs
Earlyembryos
(2 h)
x200 x200
x200 x200
x100 x200
Trochophorelarva (12 h)
D-shelllarvae(24 h)
x200 x200
x200 x200
x100 x200

Science Report Development of tools for assessing genotoxicity12
X1000 mag.
M2
X1000 mag.
M3X1000 mag.
M1
X1000 mag.
M2
X1000 mag.
M2
X1000 mag.
M3
X1000 mag.
M3X1000 mag.
M1
X1000 mag.
M1
Figure 2.2 Metaphase chromosome spreads from C. gigas early life stages thathave passed through 1 (M1), 2 (M2) or 3/3+ (M3) cell cycles showingsister chromatid differential staining
Table 2.1 PRI and AGT calculated for C. gigas embryo-larvae
Temperature(°C) Hours in BrdU Replicate M1 M2 M3 Total cells PRI GT15 2 A 59 22 19 100 1.60 1.25 2.64 15°C15 2 B 70 19 11 100 1.41 1.4215 4 A 79 4 20 103 1.43 2.8015 4 B 59 23 18 100 1.59 2.5215 6 A 22 63 16 101 1.94 3.0915 6 B 22 51 27 100 2.05 2.9315 8 A 15 42 43 100 2.28 3.5115 8 B 22 35 44 101 2.22 3.6120 2 A 71 15 14 100 1.43 1.40 2.47 20°C20 2 B 61 8 31 100 1.70 1.1820 4 A 23 27 50 100 2.27 1.7620 4 B 61 12 29 102 1.69 2.3720 6 A 14 48 38 100 2.24 2.6820 6 B 15 45 40 100 2.25 2.6720 8 A 19 53 29 101 2.10 3.8120 8 B 24 45 31 100 2.07 3.8620 2 C 52 18 30 100 1.78 1.12 2.57 20°C20 2 D 60 19 21 100 1.61 1.2420 4 C 57 6 37 100 1.8 2.2220 4 D 54 10 36 100 1.82 2.2020 6 C 29 39 32 100 2.03 2.9620 6 D 28 31 41 100 2.13 2.8220 8 C 29 43 28 100 1.99 4.0220 8 D 27 44 29 100 2.02 3.96
AGT per Temp.

Science Report Development of tools for assessing genotoxicity 13
2.2 Validation studies
Aim: To validate the CAb in C. gigas early life stages using reference mutagens
In order to validate the CAb assay in the target species, experiments were performed toevaluate the genotoxic effects of two reference mutagens on the embryo-larval stages ofC. gigas. The genotoxins used were:
• methylmethanesulfonate (MMS) – a direct acting alkylating agent;
• benzo(a)pyrene (B(a)P– a pro-mutagen considered to require metabolicactivation.
2.2.1 MethodsEmbryo-larval stages of C. gigas were collected as described in Section 2.1.1. Theembryo-larvae were allowed to grow overnight in clean seawater and exposed to MMS atthe following nominal concentrations, based upon similar concentrations used by Jha etal. (1996, 2000):
• 1.0 × 10⁻³ M = 1 mM• 1.0 × 10⁻⁴ M = 0.1 mM• 1.0 × 10⁻⁵ M = 0.01 mM• 1.0 × 10⁻⁶ M = 1 µM• 1.0 × 10⁻⁷ M = 0.1 µM
The nominal concentrations for B(a)P dissolved in dimethylformamide (DMF) were:
• 1.0 × 10⁻⁵ M = 0.01 mM• 1.0 × 10⁻⁶ M = 1 µM• 1.0 × 10⁻⁷ M = 0.1 µM• 1.0 × 10⁻⁸ M = 0.01 µM
In addition, seawater controls were run and, for the B(a)P exposures, a 0.5 per cent DMFcontrol was run in parallel. The embryo-larval samples were exposed for 1.5 cell cyclesfor the determination of CAb induction at the end of the initial incubation period (in cleanseawater), as suggested by Scott et al. (1990). The exposures were terminated (i.e. thesamples removed from the test agent and immersed in colchicine) at 20 hours post-fertilisation.
At 20 hours post-fertilisation, the samples were treated with colchicine, hypotonics andfixed in Carnoy’s fixative as described in Appendix I (SOP for CAbs). The following day,chromosome spreads were prepared. They were subsequently stained for analysis andcoverslips mounted in DPX as described in Appendix I for chromosome preparation andstaining.
During attempts to score the chromosomes for CAbs, sister chromatid exchanges(SCEs) and PRI, it was noted that there were relatively few metaphase spreads present(approximately 40–50 metaphases per slide) compared with past observations of aminimum of approximately 200 metaphases per slide. Of the metaphases present, many

Science Report Development of tools for assessing genotoxicity14
of the chromosomes were not condensed adequately and thus the staining was of poorquality. This was the case in both negative control samples, as well as those exposed toMMS.
It is likely that, during periods of manipulation of the embryo-larvae (e.g. at the start of theexperiment during strip spawning and determination of fertilisation rate and embryo-larvaldensity, and at the later stages during colchicine and hypotonic treatments), roomtemperature was high (approximately 28–30°C) due to the ambient weather conditionsand enough to cause accelerated cellular proliferation. This resulted in many of thelarvae reaching, or developing close to, the ‘D-shell’ stage, where cellular proliferation isslowed and metaphase spreads are difficult to prepare (Figure 2.1 shows D-shell larvae).This experiment was therefore repeated to reduce the total time of incubation.
It was also proposed that the protocol for exposure be amended to ensure earlierharvesting of the chromosomes. In addition to the problems with poor quality metaphasespreads, this protocol cannot be linked directly with standard Oyster Embryo-Larval(OEL)toxicity tests carried out by the Environment Agency where the samples are exposedfrom the 32-cell stage of the embryos. With this in mind, two simultaneous exposureswere attempted. In the second attempt, the following timescales were applied to allowcomparison between:
• long-term (early) exposure for the full period;
• pulse exposure for 1.5 and 2 cell cycles (for Cabs and SCEs respectively) as perthe previous attempt.
Figures 2.3 and 2.4 illustrate the exposure scenarios for the long-term and pulseexposures respectively.

Science Report Development of tools for assessing genotoxicity 15
Figure 2.3 Validation studies: long-term (early) exposure of C. gigas to MMS
0 h, fertilise gametes18:30
06:30
Post- fertilisation
12 h
Add BrdU
Add MMS for CAbs,SCEs and PRImeasurements
13:30 19 h
2 ce
ll cy
cles
08:30 14 h
~1 h (32-cell stage)~19:30
Time

Science Report Development of tools for assessing genotoxicity16
Figure 2.4 Validation studies: pulse exposure of C. gigas to MMS
2.2.2 Results and observationsHarvesting the cells at 19 hours post-fertilisation resulted in good quality and quantitiesof metaphase chromosome spreads. Figures 2.5 and 2.6 show the results of the twomethods (long-term and pulse exposures). These suggest that a ‘pulse’ exposure as iscarried out in standard mammalian CAb assays is more appropriate.
0 h, fertilise gametes18:30
06:30
Post-fertilisation
12 h
Add BrdU; add MMS for SCEsand PRI
Add MMS for CAbs09:45
13:30 19 h
2 ce
ll cy
cles
1.5
cell
cycl
es
08:30 14 h
Time

Science Report Development of tools for assessing genotoxicity 17
In the ‘long-term’ exposure, there was a poor dose–response relationship and insufficientdividing cells could be used for analysis at the highest dose (1.0 × 10⁻³ M). This protocolalso allows time for damaged cells to induce DNA repair, which may result in either error-prone or error-free repair, both of which may mask the gross levels of DNA damageinduced. Furthermore, cellular toxicity may result in a delay in the cell division. Theadvantage of undertaking a pulse exposure is that this allows quantification of DNAlesions that have occurred during a single cell division without the opportunity for cells torepair. The results of the pulse exposure provide a significant dose-dependent increasein the frequency of chromosome aberrations.
Statistical analysis of the data using chi-squared (λ2) test indicates that there is nosignificant difference (P >0.05) between the MMS treated samples compared with thecontrol in the ‘long-term’ exposure. In contrast, the data from the ‘pulse’ exposureshowed there was a statistically significant increase in the two highest concentrations ofMMS (1.0 × 10⁻⁴ M and 1.0 × 10⁻³ M) compared with the seawater (SW) control (Table2.2).
0
1
2
3
4
5
6
7
SW Control 1.0x10⁻⁷M 1.0x10⁻⁶M 1.0x10⁻⁵M 1.0x10⁻⁴M
Treatment
% A
berr
ant C
ells
0
1
2
3
4
5
6
7
Tota
l Abe
rrat
ions
% Aberrant cellsTotal Aberrations
% Aberrant cells R2 = 0.2248
0
1
2
3
4
5
6
7
SW Control 1.0x10⁻⁷M 1.0x10⁻⁶M 1.0x10⁻⁵M 1.0x10⁻⁴M
Treatment
% A
berr
ant C
ells
0
1
2
3
4
5
6
7
Tota
l Abe
rrat
ions
% Aberrant cellsTotal Aberrations
% Aberrant cells R2 = 0.2248
Figure 2.5 Chromosome aberrations induced in C. gigas embryo-larvae following‘long-term’ exposure to MMS

Science Report Development of tools for assessing genotoxicity18
0
5
10
15
20
25
30
SW Control 1.0x10⁻⁷M 1.0x10⁻⁶M 1.0x10⁻⁵M 1.0x10⁻⁴M 1.0x10⁻³M
Treatment
% A
berr
ant C
ells
0
5
10
15
20
25
30
Tota
l Abe
rrat
ions
% Aberrant cellsTotal Aberrations
% Aberrant cells R2 = 0.6271
0
5
10
15
20
25
30
SW Control 1.0x10⁻⁷M 1.0x10⁻⁶M 1.0x10⁻⁵M 1.0x10⁻⁴M 1.0x10⁻³M
Treatment
% A
berr
ant C
ells
0
5
10
15
20
25
30
Tota
l Abe
rrat
ions
% Aberrant cellsTotal Aberrations
% Aberrant cells R2 = 0.6271
Figure 2.6 Chromosome aberrations induced in C. gigas embryo-larvae following‘pulse’ exposure to MMS
Table 2.2 Application of chi-squared test to ‘pulse’ MMS exposure
Test Z-value Level of significance(P-value)
SW control vs. 1.0 × 10⁻⁷ M MMS 0 >0.05SW control vs. 1.0 × 10⁻⁶ M MMS –0.421 >0.05SW control vs. 1.0 × 10⁻⁵ M MMS –1.745 >0.05SW control vs. 1.0 × 10⁻⁴ M MMS –2.264 <0.05SW control vs. 1.0 × 10⁻³ M MMS –5.223 <0.001

Science Report Development of tools for assessing genotoxicity 19
0
2
4
6
8
10
12
SW Control DMF SolventControl
1.0x10⁻⁸M 1.0x10⁻⁷M 1.0x10⁻⁶M 1.0x10⁻⁵M
Treatment
% A
berr
ant C
ells
0
2
4
6
8
10
12
Tota
l Abe
rrat
ions
% Aberrant cellsTotal Aberrations
% Aberrant cells R2 = 0.7171
0
2
4
6
8
10
12
SW Control DMF SolventControl
1.0x10⁻⁸M 1.0x10⁻⁷M 1.0x10⁻⁶M 1.0x10⁻⁵M
Treatment
% A
berr
ant C
ells
0
2
4
6
8
10
12
Tota
l Abe
rrat
ions
% Aberrant cellsTotal Aberrations% Aberrant cellsTotal Aberrations
% Aberrant cells R2 = 0.7171
Figure 2.7 Chromosome aberrations induced in C. gigas embryo-larvae following‘pulse’ exposure to B(a)P
Table 2.3 Application of the chi-squared test to B(a)P exposure
Test Z-value Level of significance(P-value)
SW control vs. DMF solvent 0 >0.05SW control vs. 1.0 × 10⁻⁸ M B(a)P –0.421 >0.05SW control vs. 1.0 × 10⁻⁷ M B(a)P –2.020 <0.05SW control vs. 1.0 × 10⁻⁶ M B(a)P –2.693 <0.01SW control vs. 1.0 × 10⁻⁵ M B(a)P –2.020 <0.05

Science Report Development of tools for assessing genotoxicity20
Figure 2.7 shows the results of the exposures to the pro-mutagen B(a)P. Statisticalanalysis of the data using the chi-squared test indicates that the solvent has nosignificant effect on the induction of CAbs. There were significant differences (P <0.05)between the MMS treated samples compared with the control and in the three highestconcentrations of B(a)P (≥1.0 × 10⁻⁷ M) compared with the seawater control (Table 2.3).However, there were fewer aberrations at the highest concentration than expected. Itwas also noted during the scoring of the chromosomes that there were fewer dividingcells at the highest dose. This suggests that the lower frequency at 1.0 × 10⁻⁵ M was dueto cytotoxicity and that a reduction in the frequency of aberrations was thereforeobserved due to the lack of dividing cells as opposed to a reduction in the induction ofaberrations. Furthermore, it can be postulated that the highest dose may have exceededa toxicity threshold beyond which the cells were not able to metabolise the parent B(a)Pcompound.
Figure 2.8 illustrates the morphology of normal and aberrant metaphase cells. It wasnoted that chromatid type aberrations were more common than chromosome typeaberrations in both MMS and B(a)P treatments.
x1000 mag.
x1000 mag.
x1000 mag.
x1000 mag.
x1000 mag.
(a)(b)
(c) (d)
x1000 mag.
x1000 mag.
x1000 mag.x1000 mag.
x1000 mag.
x1000 mag.x1000 mag.
(a)(b)
(c) (d)
Figure 2.8 Metaphase chromosome spreads from C. gigas embryo-larvae: (a) twonormal cells; (b) a chromatid type break; (c) a chromatid type break;(d) a highly damaged aberrant cell

Science Report Development of tools for assessing genotoxicity 21
2.3 Application – effluents and sediment elutriates
Aim: To employ the CAb assay in C. gigas early life stages in order to test thegenotoxic potential of whole effluents and sediment elutriates
After the validation studies, a series of exposures were carried out on whole effluentdischarges and elutriates prepared from sediments collected close to these discharges.
Final effluents were collected from two locations by the site operators and sedimentswere sampled from mudflats below each effluent discharge by Environment Agency staffin September 2004. Seawater elutriates were prepared by Environment Agency staff andfrozen on-site.
Both effluents and elutriates were sent to the laboratories at the University of Plymouth.The thawed samples were tested with the CAb assay in C. gigas embryo-larvae toevaluate their genotoxic potential. Chemical analyses of the samples were conducted bythe Environment Agency’s National Laboratory Service.
In addition to the CAb assay, parallel studies were conducted to test the same samplesfor genotoxicity and general toxicity using methods such as the Ames test, theGreenScreen® assay and the Oyster Larval Development assay. These have beendescribed elsewhere by Cahill et al. (2004) and Thain (1991).
2.3.1 MethodsEmbryo-larval stages of C. gigas were collected as described in Section 2.1.1. Theembryo-larvae were allowed to grow overnight in clean seawater and exposed to effluentor elutriate samples at 0, 6.25, 12.5, 25.0, 50.0 and 100 per cent based on similarconcentrations used in standard toxicity tests in DTA.
The embryo-larval samples were exposed for 1.5 cell cycles for the determination of CAbinduction at the end of the initial incubation period (in clean seawater) as described inSection 2.2.1. The exposures were terminated (i.e. the samples removed from the testagent and immersed in colchicine) at 19 hours post-fertilisation.
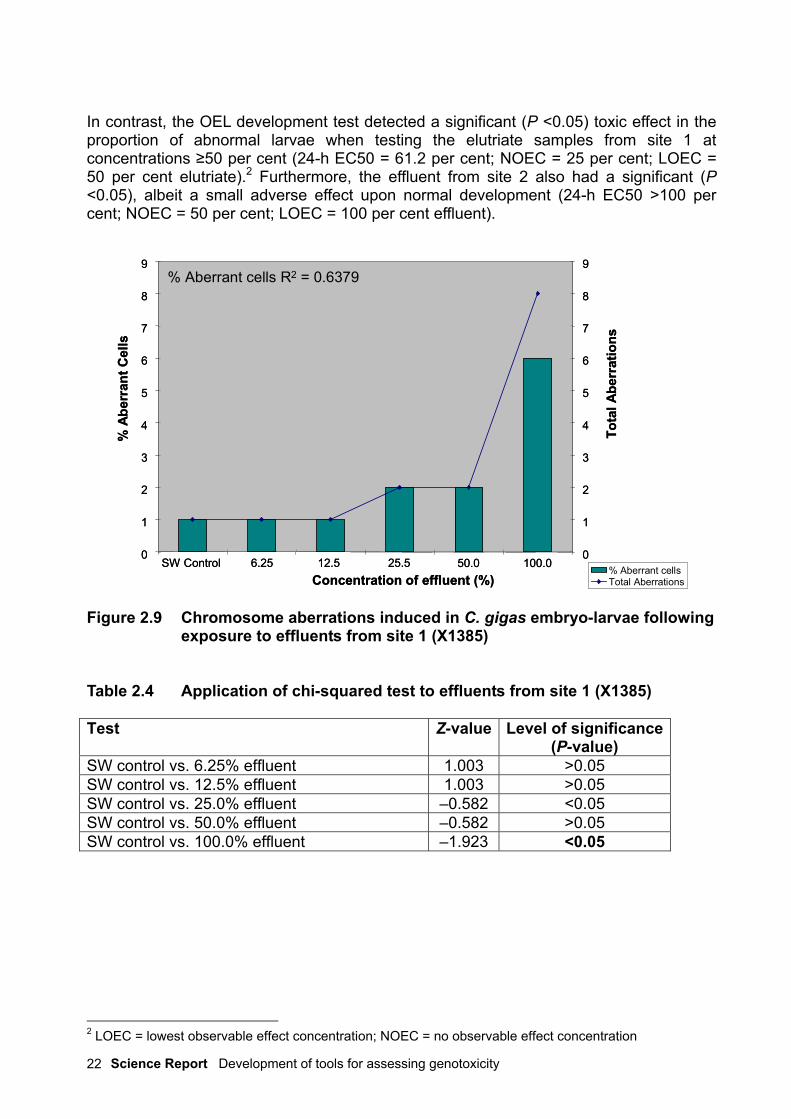
2.3.2 Results and observationsHarvesting the cells at 19 hours post-fertilisation resulted in good quality and quantitiesof metaphase chromosome spreads. Statistical analysis of the data using the chi-squaredtest indicates that the effluents from site 1 (X1385) had no significant effect on theinduction of CAbs, with the exception of the samples exposed to 100 per cent effluent (P<0.05) (Table 2.4). A dose-dependent increase in the frequency of aberrant cells wasobserved in this treatment (R2 = 0.6379), as shown in Figure 2.9.
No significant increases in the induction of CAbs was detected in any of the samplesexposed to effluents from site 2 (Figure 2.11), elutriates from site 1 (Figure 2.10) and site2 (Figure 2.12). No genotoxic effects for any of the whole effluent or elutriate sampleswere detected using the Ames test or the GreenScreen assay.
Science Report Development of tools for assessing genotoxicity22
In contrast, the OEL development test detected a significant (P <0.05) toxic effect in theproportion of abnormal larvae when testing the elutriate samples from site 1 atconcentrations ≥50 per cent (24-h EC50 = 61.2 per cent; NOEC = 25 per cent; LOEC =50 per cent elutriate).2 Furthermore, the effluent from site 2 also had a significant (P<0.05), albeit a small adverse effect upon normal development (24-h EC50 >100 percent; NOEC = 50 per cent; LOEC = 100 per cent effluent).
0
1
2
3
4
5
6
7
8
9
Concentration of effluent (%)
% A
berr
ant C
ells
0
1
2
3
4
5
6
7
8
9
Tota
l Abe
rrat
ions
% Aberrant cellsTotal Aberrations
% Aberrant cells R2 = 0.6379
SW Control 6.25 12.5 25.5 50.0 100.00
1
2
3
4
5
6
7
8
9
Concentration of effluent (%)
% A
berr
ant C
ells
0
1
2
3
4
5
6
7
8
9
Tota
l Abe
rrat
ions
% Aberrant cellsTotal Aberrations
% Aberrant cells R2 = 0.6379
SW Control 6.25 12.5 25.5 50.0 100.0
Figure 2.9 Chromosome aberrations induced in C. gigas embryo-larvae followingexposure to effluents from site 1 (X1385)
Table 2.4 Application of chi-squared test to effluents from site 1 (X1385)
Test Z-value Level of significance(P-value)
SW control vs. 6.25% effluent 1.003 >0.05SW control vs. 12.5% effluent 1.003 >0.05SW control vs. 25.0% effluent –0.582 <0.05SW control vs. 50.0% effluent –0.582 >0.05SW control vs. 100.0% effluent –1.923 <0.05
2 LOEC = lowest observable effect concentration; NOEC = no observable effect concentration

Science Report Development of tools for assessing genotoxicity 23
% Aberrant Cells R2 = 0.4667
0
1
2
3
4
5
6
7
8
9
SW Control 6.25 12.5 25.0 50.0 100.0
Concentration of Elutriate (%)
% A
berr
ant C
ells
0
1
2
3
4
5
6
7
8
9
Tota
l Abe
rrat
ions
% Aberrant cellsTotal Aberrations
% Aberrant Cells R2 = 0.4667% Aberrant Cells R2 = 0.4667
0
1
2
3
4
5
6
7
8
9
SW Control 6.25 12.5 25.0 50.0 100.0
Concentration of Elutriate (%)
% A
berr
ant C
ells
0
1
2
3
4
5
6
7
8
9
Tota
l Abe
rrat
ions
% Aberrant cellsTotal Aberrations
% Aberrant Cells R2 = 0.4667
Figure 2.10 Chromosome aberrations induced in C. gigas embryo-larvae followingexposure to elutriates from site 1 (X1472)
0
1
2
3
4
5
6
7
8
9
Concentration of effluent (%)
% A
berr
ant C
ells
0
1
2
3
4
5
6
7
8
9
Tota
l Abe
rrat
ions
% Aberrant cells R2 = 0.665
SW Control 6.25 12.5 25.5 50.0 100.0
% Aberrant cellsTotal Aberrations
0
1
2
3
4
5
6
7
8
9
Concentration of effluent (%)
% A
berr
ant C
ells
0
1
2
3
4
5
6
7
8
9
Tota
l Abe
rrat
ions
% Aberrant cells R2 = 0.665
SW Control 6.25 12.5 25.5 50.0 100.0
% Aberrant cellsTotal Aberrations
Figure 2.11 Chromosome aberrations induced in C. gigas embryo-larvae followingexposure to effluents from site 2 (X1386)

Science Report Development of tools for assessing genotoxicity24
0
1
2
3
4
5
6
7
8
9
SW Control
6.25 12.5 25.0 50.0 100.0Concentration of Elutriates (%)
% A
berr
ant C
ells
0
1
2
3
4
5
6
7
8
9
Tota
l Abe
rrat
ions
% Aberrant cellsTotal Aberrations
% Aberrant Cells R2 = 0.0171
0
1
2
3
4
5
6
7
8
9
SW Control
6.25 12.5 25.0 50.0 100.0Concentration of Elutriates (%)
% A
berr
ant C
ells
0
1
2
3
4
5
6
7
8
9
Tota
l Abe
rrat
ions
% Aberrant cellsTotal Aberrations% Aberrant cellsTotal Aberrations
% Aberrant Cells R2 = 0.0171
Figure 2.12 Chromosome aberrations induced in C. gigas embryo-larvae followingexposure to elutriates from site 2 (X1471)
2.4 Conclusions and recommendations
This series of studies has demonstrated that it is possible to use the metaphase cellsfrom the early life stages of C. gigas to detect genotoxic effects by means of the CAbassay. As observed in other marine invertebrate species such as Mytilus edulis andPlatynereis dumerilii, the karyotype and morphology of the chromosomes from C. gigashave shown C. gigas to be a suitable test species.
Since C. gigas is already used in routine DTA, there is potential for the CAb assay to beused for detecting sub-lethal biological effects at the cytogenetic level. However, due tothe cell cycle kinetics and timing of the protocol, a reduced temperature of ~20°C is themaximum temperature at which the embryo-larvae should be incubated. The standardtemperature for the OEL development test is ~24°C; at this temperature, the embryo-larvae develop too quickly and the metaphase chromosome spreads are of poor qualityfor examination.
The dose-dependent responses to two mutagens (MMS and B[a]P) have validated theresponses in the species and the method has been successfully applied to test bothwhole effluents and sediment elutriates. When compared with two other methods, theAmes test and GreenScreen assay, the CAb assay was able to detect genotoxic effectsnot quantified by the other in vitro methods. However, the maximum concentration ofwhole samples that the GreenScreen assay is able to test is 50 per cent, thus limiting itstest range. An advantage of employing the CAb assay in C. gigas is that it is an in vivomethod and thereby takes into account the bioavailability of contaminants in wholesamples and the metabolic activation that occur in whole organisms, thus increasing theenvironmental relevance. But the CAb is relatively laborious and, as indicated by the
Science Report Development of tools for assessing genotoxicity 25
records presented in Appendix II, requires some practice and fully trained personnel inorder to interpret the samples.

Science Report Development of tools for assessing genotoxicity26
3. Habitats Directive studyAim: To apply a series of biochemical biomarkers to Arenicola marina used inassessing the direct toxicity of sediments
Within Europe, natural habitats are continuing to deteriorate and an increasing number ofwild species face a serious threat mainly as a result of development and agriculturalintensification. The EC Habitats Directive introduces robust protection for those habitatsand species considered of European importance. Its aim is to promote biodiversity byrequiring Member States to take measures to maintain/restore natural habitats and wildspecies at/to a favourable conservation status. In applying these measures, MemberStates are required to take account of economic, social and cultural requirements andregional and local characteristics.
As part of work to fulfil the requirements of the Habitats Directive in the UK, theEnvironment Agency conducted a field survey in an area of the Tees estuary called SealSands. The primary aim of the study was to collect indigenous Nereis (ragworm) from 20sampling points and to measure body burden contaminants (metals and organics).During the sampling programme, insufficient indigenous animals were found for theapplication of biomarker studies.
In addition, the Environment Agency performed whole sediment assays in the laboratoryfrom the same 20 sites using the lugworm, Arenicola marina. The end-points measuredwere lethality, cast formation and bioaccumulation; the results are presented by Johnsonet al. (2004).
Due to the inadequate number of indigenous animals, some of the A. marina used in thesediment bioassays were frozen and used for a variety of biomarker end-points, i.e.measurements of metallothionein induction, acetylcholinesterase activity and ferricreducing antioxidant power. These experiments are described in this chapter.
The animals were exposed to sediment samples at the Environment Agency’slaboratories for 10 days. Subsequently, five individuals from each treatment (with theexception of site number 12 where only three individuals were provided) were transferredto clean artificial seawater for 24 hours to allow the animals to eject their gut contents.The animals were then snap-frozen in liquid nitrogen and stored at –20°C until neededfor biomarker measurements.
3.1 Metallothionein induction
Metallothioneins (MTs) are widely distributed low molecular weight (6–7 kDa forvertebrates), cysteine-rich, metal-binding proteins thought to be present in most if not allanimals (Livingstone 1993). MTs are thought to have several functions due to their highmetal affinity and ability to chelate essential (Zn, Cu) and non-essential metals (Cd, Hg,Ag). This includes intracellular regulation of endogenous metals and detoxification ofexcess levels of pollutant metals. Other roles include general stress responses, e.g.temperature stress and free radical scavenging.

Science Report Development of tools for assessing genotoxicity 27
Detoxification of metals occurs by metal-mediated transcriptional activation of MT genes,increased MT synthesis resulting in sequestration of free metals by binding to MT. MTinduction in response to cellular concentrations of metal ions forms the premise for theuse as a biomarker for metal exposure. Hormones such as progesterone andglucocorticoids can also induce MT synthesis; therefore, variations may occur betweenspecies, reproductive condition, diet and season. MT in fish is considered as a generalstress response due to metals. In molluscs (particularly mussels), MTs are specificallyinvolved in responses to heavy metals and considered as a biomarker of exposure toheavy metal pollution (Viarengo et al. 1999).
3.1.1 MethodsThe MT concentration in total tissue was determined by a spectrophotometric methodusing 5,5-dithiobis-2-nitrobenzoic acid (DTNB) based on a method described byViarengo et al. (1997). The following modifications were made to this method duringpreparation of the sample.
The samples were prepared by grinding approximately 1 g wet weight of whole tissue toa fine powder in liquid nitrogen before adding 3 ml ice-cold 1 mM dithiothreitol (DTT) and30 µl phenylmethylsulphonylfluoride (PMSF) solution. The mixture was sonicated (3 × 15seconds) at 40 per cent output power and a further 30 µl PMSF added. The resultingsuspension was subjected to ultracentrifugation at 100,000g and 4°C for 70 minutes, andthe cytosolic fraction in the resulting supernatant stored at –80°C until analysis. Theabsorbance of the samples was read at 412 nm and the MT levels quantified bycomparison with a reduced glutathione standard. A full description of the protocol can befound in Appendix I (Determination of Metallothionein).
3.1.2 Results and observationsFigure 3.1 shows the mean levels of MT determined in the whole tissue of A. marina.One-way analysis of variance (ANOVA) demonstrated a significant higher level of MT insamples exposed to sediments from site number 15 compared with the levels measuredin the samples exposed to the two reference sediments. Samples exposed to sedimentsfrom site number 9 had a significantly higher level of MT compared with those exposed toreference II sediments. These results suggest that metal exposure may have been higherat these two sites than the other locations.

Science Report Development of tools for assessing genotoxicity28
0
2
4
6
8
10
12
14
16
1 2 3 4 5 6 7 8 9 10 11 12 13 14 15 16 17 19 20
Referen
ce I
Referen
ce II
Site Number
Mea
n M
etal
loth
ione
inC
once
ntra
tions
(ug/
gw
et ti
ssue
)
# *
*
0
2
4
6
8
10
12
14
16
1 2 3 4 5 6 7 8 9 10 11 12 13 14 15 16 17 19 20
Referen
ce I
Referen
ce II
Site Number
Mea
n M
etal
loth
ione
inC
once
ntra
tions
(ug/
gw
et ti
ssue
)
0
2
4
6
8
10
12
14
16
1 2 3 4 5 6 7 8 9 10 11 12 13 14 15 16 17 19 20
Referen
ce I
Referen
ce II
Site Number
Mea
n M
etal
loth
ione
inC
once
ntra
tions
(ug/
gw
et ti
ssue
)
# *
*
Error bars represent 2 SEM (standard error of the mean)# = statistically significant difference compared with reference I sediments* = statistically significant difference compared with reference II sediments
Figure 3.1 Mean metallothionein concentrations determined in whole tissue of A.marina following 10 days exposure to sediments from Seal Sands
3.2 Acetylcholinesterase activity
The acute toxicity of organophosphates (OPs) or carbamates is due to the inhibition ofacetylcholinesterase (AChE), a serine hydroxylase found in the central and peripheralnervous systems. Other cholinesterases exist in plasma, the erythrocyte membrane andother tissues, although their function is unknown. AChE acts in the neuromuscularjunction to cleave and inactivate the neurotransmitter acetylcholine. Reactions ofOP/carbamate compounds with the enzyme results in the formation of either aphosphoryl or carbaryl intermediate, both of which are resistant to subsequent hydrolysis,leading to inactivation of the enzyme. As a consequence, the build-up of AChE at thesynapse results in overstimulation and depolarisation of the post-synaptic membrane.
In vertebrates, inhibition of AChE in the parasympathetic and central nervous systemsand at neuromuscular junctions leads to an acute cholinergic syndrome characterised bymuscle weakness, bronchoconstriction, convulsions and, ultimately, respiratory paralysisand death by asphyxiation (Marrs 1996). In invertebrates, the localisation andclassification of cholinesterases is broader, with various forms present in different tissuetypes, involving both excitatory and inhibitory sensory function and possibly detoxificationreactions (Habig and Di Guilio 1991). Symptoms may be apparent at anything from 10–100 per cent inhibition and can include a general depression of behaviour and sensoryfunction, decreased body weight, hypothermia and disruption of other atonomicprocesses (Grue et al. 1990). The onset and duration of symptoms and susceptibility to

Science Report Development of tools for assessing genotoxicity 29
the toxic effects of OP/carbamates will vary between species as there are numerousdifferent molecular forms of cholinesterase, each with its own characteristics of inhibitionand reactivation.
AChE activity is measured using the substrate analogue acetylthiocholine iodide, whichis converted to thiocholine. The reaction of thiocholine with the chromogenic substratedithionitrobenzoic acid (DTNB) leads to the formation of a yellow anion, nitrobenzoicacid, which absorbs strongly at 405 nm.
3.2.1 MethodsAChE activity was determined in whole tissue samples using a method described byGalloway et al. (2002). A full description of the method is given in Appendix I. In brief,whole tissue samples were ground to a fine powder in liquid nitrogen and resuspended inhomogenising buffer. Following centrifugation, samples or buffer blanks (50 µl) wereincubated in 96-well microtitre plates with 150 µl DTNB and the endogenous reactionmeasured at 405 nm for 5 minutes at 30-second intervals. Following the addition of 50 µl3 mM acetylthiocholine iodide (ACTI), the absorbance was measured for 5 minutes at30-second intervals. The results were expressed as specific activity (µ moles substratehydrolysed per minute per mg relative to the total protein in the sample). Total proteinwas determined using a commercial kit (BioRad) with bovine serum albumin (BSA) asthe standard.
3.2.2 Results and observationsNegligible amounts of endogenous activity occurred in these samples. Figure 3.2 showsthe mean levels of AChE activity determined in the whole tissue of A. marina. One-wayANOVA indicated that there was no significant statistical difference between the samplesexposed to sediments from the 20 sites and the reference sediments, suggesting that nobiological effects were caused by OP or carbamate exposure.

Science Report Development of tools for assessing genotoxicity30
0
5
10
15
20
25
1 2 3 4 5 6 7 8 9 10 11 12 13 14 15 16 17 19 20
Referen
ce I
Referen
ce II
Site Number
Mea
n AC
hEAc
tivity
(um
olAC
T/m
in/m
g pr
otei
n)
0
5
10
15
20
25
1 2 3 4 5 6 7 8 9 10 11 12 13 14 15 16 17 19 20
Referen
ce I
Referen
ce II
Site Number
Mea
n AC
hEAc
tivity
(um
olAC
T/m
in/m
g pr
otei
n)
Error bars represent 2 SEM
Figure 3.2 Mean acetylcholinesterase activity determined in whole tissue of A.marina following 10 days exposure to sediments from Seal Sands
3.3 Ferric reducing antioxidant power (FRAP) assay
It is widely documented that oxidative stress has the potential to cause harmful effects inthe marine environment. Oxidative stress may occur if the balance between thegeneration of reactive oxygen intermediates (ROIs) associated with aerobic processesexceeds the defensive processes that have evolved in all organisms to limit the extent ofoxidative damage.
Oxidative damage can affect lipids, proteins and genetic material leading to reducedmetabolic activity and, ultimately, to cell death. Increased exposure to ROIs may:
• be chemically induced and associated with anthropogenic contaminants;
• result from photo-oxidative stress from ultraviolet radiation;
• result from hyperbaria from photosynthetically generated oxygen by algalsymbionts (zooxanthellae).
Many marine invertebrates may be exposed to more than one of the above situations, insome cases simultaneously. Special adaptive mechanisms to ameliorate oxidant stresshave evolved to cope with the extreme conditions that may be encountered in aquatichabitats.
Antioxidant defences take many forms and the study of oxidative stress has typicallymeasured individual specific responses such as the antioxidant enzymes superoxidedismutase and catalase, or measured the concentration of low molecular weight

Science Report Development of tools for assessing genotoxicity 31
antioxidants such as ascorbate, glutathione, tocopherols and uric acid in differentbiological tissues. However, medical and environmental researchers sought a simplemeans of quantifying the net antioxidant status of a sample, i.e. an index of its ability toresist oxidative damage.
The ferric reducing antioxidant potential (FRAP) assay described by Benzie and Strain(1996, 1999) is quick, reproducible and does not require expensive or technicallydemanding equipment. Antioxidants in the sample are used as reductants in a redox-linked colorimetric assay employing a stoichiometric excess of the easily reduced oxidantferric tripyridyltriazine [Fe(III)-TPTZ]. At low pH, reduction to the ferrous form, which hasan intense blue colour, can be monitored by measuring the change in absorbance at 593nm. The reaction is non-specific in that any half reaction that has a lower redox potentialunder reaction conditions than that of the ferric/ferrous half reaction, will drive the ferric[Fe(III)] to ferrous [Fe(II)] reaction. The change in absorbance is therefore related directlyto the combined reducing power of the electron-donating antioxidants present in thereaction mixture. The assay is suitable for measurements using many types of biologicalsample including tissue homogenates or haemolymph.
3.3.1 MethodsThe FRAP of whole tissue homogenate was determined using the method described byBenzie and Strain (1996). A full description of the method is given in Appendix I (FRAPAssay). In brief, whole tissue samples were ground to a fine powder in liquid nitrogenand resuspended in homogenising buffer at a 1:5 ratio (w/v). The homogenate wascentrifuged and the supernatant used for determining FRAP. Working FRAP reagent wasprepared from 300 mM acetate buffer, 10 mM 2,4,6-tripyridyl-s-triazine (TBTZ) in 40 mMHCl and 20 mM FeCl3.6H2O mixed at a 10:1:1 ratio. Supernatant (50 µl) from eachsample was transferred to wells (in duplicate) in a 96-well plate, to which 200 µl of freshlyprepared FRAP reagent was added. The absorbance of the samples was readimmediately at 593 nm and again after 10 minutes incubation at 25°C. The change inabsorbance (∆A593nm) was calculated and the FRAP quantified by comparison with arange of FeSO4.7H2O standard solutions.
3.3.2 Results and observationsFigure 3.3 shows the mean FRAP determined in the whole tissue of A. marina. Bartlett’stest for variance indicated that there was a statistically significant difference amongst thestandard deviations at the 95.0 per cent confidence level. Therefore, the non-parametricKruskal–Wallis test was applied to compare the medians between samples. This testdemonstrated a significant higher FRAP in samples exposed to sediments from sitenumbers 5 and 15 when compared with the levels measured in the samples exposed tothe two reference sediments. These results suggest that oxidative stress, possibly dueto contaminants in the sediments was higher at these two sites than the other locations.

Science Report Development of tools for assessing genotoxicity32
0
20
40
60
80
100
120
140
1 2 3 4 5 6 7 8 9 10 11 12 13 14 15 16 17 19 20
Referen
ce I
Referen
ce II
Site Number
Mea
n FR
AP
# *
# *
0
20
40
60
80
100
120
140
1 2 3 4 5 6 7 8 9 10 11 12 13 14 15 16 17 19 20
Referen
ce I
Referen
ce II
Site Number
Mea
n FR
AP
0
20
40
60
80
100
120
140
1 2 3 4 5 6 7 8 9 10 11 12 13 14 15 16 17 19 20
Referen
ce I
Referen
ce II
Site Number
Mea
n FR
AP
# *
# *
Error bars represent 2 SEM# = statistically significant difference compared with reference I sediments* = statistically significant difference compared with reference II sediments
Figure 15 Mean FRAP determined in whole tissue of Arenicola marina following10 days exposure to sediments from Seal Sands)
3.4 Conclusions and recommendations
These initial results indicate that the measurements of MT, AChE activity and FRAP canbe used in whole tissue samples of A. marina.
The Habitats Directive study originally considered the possibility for applying biomarkersin indigenous samples of Nereis, but the distribution and density of this species was notconsistent between sampling sites and, in many of the sites, it was absent due to thedistribution of Enteromorpha in the area. It was therefore necessary to measurebiological effects in A. marina that had been exposed to the sediments in laboratoryconditions. For a more robust study, more individuals were required from each of thetreatments; in this study, n = 5 (n = 3 at site number 12; n = 0 from site 18).
There were significant effects on the level of MT measured in the whole tissues of A.marina exposed to sediments from sites 9 and 15. But without a full set of data detailingthe chemical analysis of the sediments and/or body burden of the organisms, it is difficultto deduce any cause–effect relationships. The FRAP results also indicated that therewas a biological effect in samples exposed to sediments from site 15, in addition to site5.
Further investigations to qualify and quantify the contaminants from these sites arerecommended in order to identify the agents likely to be causing the biological effectsobserved.
Science Report Development of tools for assessing genotoxicity 33
None of the sites detected detrimental effects on survival, using A. marina in DTA tests,with the exception of site 12. Sediments from sites 13 and 18 measured reduced feedingrates, while animals exposed to sediments from sites 3, 12, 13 and 15 resulted inreduced biomass. However, many other factors should have been considered in thisstudy such as particle size distribution and organic carbon concentrations in thesediments. Further studies are required to fully validate the biomarkers measured in A.marina as a test species.

Science Report Development of tools for assessing genotoxicity34
4. Work under the National MarineMonitoring Programme
Aim: To assess the genotoxic potential of sediments using the ‘Comet assay’ inArenicola marina
The National Monitoring Plan (NMP) was initiated in the late 1980s to coordinate marinemonitoring in the UK between a number of organisations including the EnvironmentAgency’s precursors. It is now called the National Marine Monitoring Programme(NMMP).
The biological effects monitoring included within this programme indicated that biologicaleffects are greatest in estuaries known to be contaminated. The initial survey provided auseful overview of the spatial distribution of contaminants in UK waters and highlightedlocations where biological effects methods should be focused.
As part of the ongoing monitoring for the NMMP, sediment samples were collected byEnvironment Agency staff from the River Thames. The primary aim was to test the wholesediments using A. marina and measuring the standard end-points of lethality and castformation (Johnson, 2004). In addition, the Comet assay was carried out to measureDNA strand breaks caused by exposure of the animals to contaminants that may havebeen present in the sediment samples. This rest of this chapter discusses the workinvolving the Comet assay.
4.1 Comet assay
The Comet assay or single-cell gel electrophoresis assay is a rapid, versatile and easy-to-use tool for collecting data on DNA strand breakage and has been widely performedon vertebrates and invertebrates.
The assay measures the electrophoretic migration of relaxed or fragmented DNA awayfrom the nuclei of cells immobilised in agarose gel. It requires only small samples of anyeukaryotic cell population and allows the quantitation of single cells, allowingheterogeneity and subcellular population responses to be examined.
The assay has been reported to be a good indicator of general DNA damage inorganisms for which further studies could then be focused to elucidate the nature of theDNA lesions and the mechanisms from which they have been induced (Birmelin et al.1998, Mitchelmore and Chipman 1998a, Mitchelmore and Chipman, 1998b, Mitchelmoreet al. 1998, Steinert 1999).
4.1.1 MethodsTo extract haemocytes and coelomocytes from A. marina, the body wall of the animalswas perforated using the tip of a 200 µl pipette. The animals were then placed inindividual chilled 25 ml beakers placed on ice while the cells extruded from the bodycavity for 10 minutes. Samples of cell suspension were then collected from the beakers
Science Report Development of tools for assessing genotoxicity 35
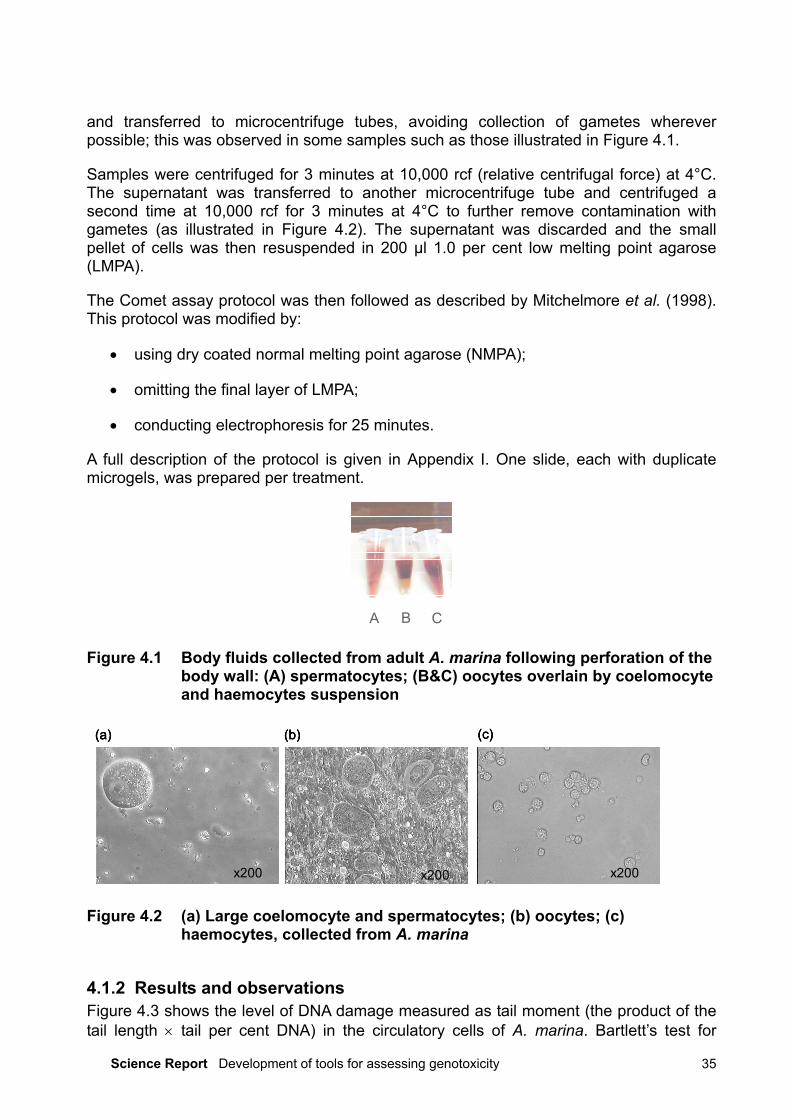
and transferred to microcentrifuge tubes, avoiding collection of gametes whereverpossible; this was observed in some samples such as those illustrated in Figure 4.1.
Samples were centrifuged for 3 minutes at 10,000 rcf (relative centrifugal force) at 4°C.The supernatant was transferred to another microcentrifuge tube and centrifuged asecond time at 10,000 rcf for 3 minutes at 4°C to further remove contamination withgametes (as illustrated in Figure 4.2). The supernatant was discarded and the smallpellet of cells was then resuspended in 200 µl 1.0 per cent low melting point agarose(LMPA).
The Comet assay protocol was then followed as described by Mitchelmore et al. (1998).This protocol was modified by:
• using dry coated normal melting point agarose (NMPA);
• omitting the final layer of LMPA;
• conducting electrophoresis for 25 minutes.
A full description of the protocol is given in Appendix I. One slide, each with duplicatemicrogels, was prepared per treatment.
A B CA B C
Figure 4.1 Body fluids collected from adult A. marina following perforation of thebody wall: (A) spermatocytes; (B&C) oocytes overlain by coelomocyteand haemocytes suspension
x200
(a)
x200
(b)
x200
(c)
x200
(a)
x200x200
(a)
x200
(b)
x200
(b)
x200
(c)
x200x200
(c)
Figure 4.2 (a) Large coelomocyte and spermatocytes; (b) oocytes; (c)haemocytes, collected from A. marina
4.1.2 Results and observationsFigure 4.3 shows the level of DNA damage measured as tail moment (the product of thetail length × tail per cent DNA) in the circulatory cells of A. marina. Bartlett’s test for

Science Report Development of tools for assessing genotoxicity36
variance indicated that there was a statistically significant difference among the standarddeviations at the 95.0 per cent confidence level. Therefore, the non-parametric Kruskall-Wallis test was applied to compare the medians between samples. This test indicatedthat there was no significant increase in the level of DNA damage in the A. marinaexposed to sediments from the two sites compared with the reference sediment. In fact,there was a significantly lower level of DNA damage in animals exposed to the sedimentsfrom site X1349 compared with the reference sediments.
Tail
Mom
ent
TreatmentRef X1332 X1349
0
10
20
30
40
50
60
Tail
Mom
ent
TreatmentRef X1332 X1349
0
10
20
30
40
50
60
Figure 4.3 Tail moment measured with the Comet assay in circulatory cells fromA. marina exposed to sediments from the River Thames
4.1.3 Conclusions and recommendationsThe difference in sexual maturity of the A. marina may have influenced the level ofcontamination of the cell suspensions collected from the samples from the RiverThames. Therefore, further optimisation is required for obtaining a single cell suspension.However, samples that appeared to have no gamete contamination produced cells whichcould be stained with ethidium bromide and measured using an image analysis system(Komet v. 5.0; Kinetic Imaging). In addition, studies of in vitro and in vivo exposures ofthe organisms to known genotoxins are required to validate the methodology in thisspecies.
These initial results indicate that it is possible to apply the Comet assay in A. marina butthat further research and development of the method is required.
Science Report Development of tools for assessing genotoxicity 37
5 Publications and presentationsThe work described in this report formed the basis for the following articles andconference papers.
Peer reviewed publications
Cheung V V, Jha A N, Owen R, Depledge M H and Galloway T S, 2006 Development ofthe in vivo chromosome aberration assay in oyster (Crassostrea gigas) embryo-larvae forgenotoxicity assessment. Marine Environmental Research, 62, Suppl. 1, S278-282.
Cheung V V, Depledge M H and Jha A N, 2006 An evaluation of the relative sensitivity oftwo marine bivalve mollusc species using the Comet assay. Marine EnvironmentalResearch, 62, Suppl. 1, S301-305.
Cheung V V, Simpson P, Knight A W, Cahill P A, Charles A K, Depledge M H, Owen Rand Galloway T S The application of prokaryotic, eukaryotic, cytogenetic and directtoxicity assays to evaluate the toxicity of industrial effluents in England and Wales. [inpreparation]
Book chapters
Cheung V V, Galloway T S and Depledge M H (2004) Chemical disruption of biologicalphenomena [online]. In Encyclopedia of Life and Sustainable Development. Oxford:EOLSS Publishers and UNESO Publishing. Available from: http://www.eolss.net[Accessed 2 August 2006]
Conference presentations
Cheung V V, Sanger R C, Browne M A, Dissanayake A, Brown R J, Galloway T S, Jha AN and Depledge M H, 2003 An evaluation of the relative sensitivity of two bivalve molluscspecies as bioindicator organisms for environmental monitoring. International Union ofBiological Sciences, Hong Kong, December 2003.
Cheung V V, Depledge M H and Jha A N, 2004 The relative sensitivity of cyto- andgenotoxic biomarkers in two marine bivalve mollusc species. Society for ExperimentalBiology, Edinburgh, Scotland, March 2004.
Cheung V V, Owen R, Depledge M H and Galloway T S, 2005 Optimisation andvalidation of an in vivo genotoxicity test using the embryo-larval stages of the Pacificoyster, Crassostrea gigas. SETAC-Europe. Lille, France, May 2005.
Cheung V V, Simpson P, Knight A W, Cahill P A, Charles A K, Depledge M H, Owen Rand Galloway T S, 2005 A comparison of prokaryotic, eukaryotic, cytogenetic and directtoxicity assays to evaluate the toxicity of industrial effluents. Pollution Responses inMarine Organisms, Alessandria, Italy, June 2005.

Science Report Development of tools for assessing genotoxicity38
List of abbreviationsAChE acetylcholinesteraseACTI acetylthiocholine iodideAGT average generation timeANOVA analysis of varianceASW artificial seawaterBSA bovine serum albuminB(a)P benzo(alpha)pyreneBrdU 5-bromodeoxyuridineCAb chromosome aberrationCI confidence intervalDMF dimethylformamideDNA deoxyribonucleic acidDTA Direct Toxicity AssessmentDTNB 5,5-dithiobis-2-nitrobenzoic acidDTT dithiothreitolFRAP ferric reducing antioxidant powerGT generation timeIPPC Integrated Pollution Prevention and ControlLMPA low melting point agaroseNMPA normal melting point agaroseMMS methylmethanesulfonateMT metallothioneinOP organophosphatePMSF phenylmethylsulphonylfluoridePRI proliferation rate indexrcf relative centrifugal forceSCD sister chromatid differential (staining)SD standard deviationSEM standard error of the meanSW seawaterv/v volume/volumew/v weight/volume

Science Report Development of tools for assessing genotoxicity 39
References & BibliographyAmerican Society of Testing and Materials (ASTM), 1992 Standard guide for conducting
static acute toxicity tests starting with embryos of four species of saltwater bivalvemolluscs. In Annual Book of ASTM Standards, pp. 377-393. West Conshohocken,PA: ASTM.
Benzie I F F and Strain, J J, 1996 The ferric reducing ability of plasma (FRAP) as ameasure of ‘antioxidant power’: the FRAP assay. Analytical Biochemistry, 239, No.1, 70-76.
Benzie I F F and Strain J J, 1999 Ferric reducing/antioxidant power assay: directmeasure of total antioxidant activity of biological fluids and modified version forsimultaneous measurement of total antioxidant power and ascorbic acidconcentration. Methods in Enzymology, 299, 15-27.
Bierkins J, Brits E and Verschaeve L, 2005 Environmental monitoring for genotoxiccompounds. In Environmental Toxicity Testing (ed. S. Loibner), pp. 229-256. BocaRaton, FL: CRC Press.
Birmelin C, Mitchelmore C L, Goldfarb P S and Livingstone D R, 1998 Characterisation ofbiotransformation enzyme activities and DNA integrity in isolated cells of thedigestive gland of the common mussel, Mytilus edulis L. ComparativeBiochemistry and Physiology A: Molecular and Integrative Physiology, 120, No. 1,51-56.
Cahill P A, Knight A W, Billinton N, Barker M G, Walsh L, Keenan P O, Williams C V,Tweats D J and Walmsley R M. 2004 The Greenscreen genotoxicity assay: ascreening validation programme. Mutagenesis, 19 No. 2 105 –119.
Depledge M H, 1994 Genotypic toxicity – implications for individuals and populations.Environmental Health Perspectives, 102, 101-104.
Galloway T S, Millward N, Browne M A and Depledge M H, 2002 Rapid assessment oforganophosphorous/carbamate exposure in the bivalve mollusc Mytilus edulisusing combined esterase activities as biomarkers. Aquatic Toxicology, 61, Nos. 3–4, 169-180.
Goto K, Akematsu T, Shimazu H and Sugiyama T, 1975 Simple differential Giemsastaining of sister chromatids after treatment with photosensitive dyes andexposure to light and mechanisms of staining. Chromosoma, 53, 223-230.
Grue C E, Tome M W, Swanson G A, Borthwick S M and Deweese L R, 1990 On thequality of prairie-pothole wetlands for adult and juvenile waterfowl following aerialapplication of insecticides. Abstracts of Papers of the American Chemical Society,199, 152-AGRO.
Habig C and Di Guilio R T, 1991 Biochemical characteristics of cholinesterases in aquaticorganisms. In Cholinesterase Inhibiting Insecticides (ed. P. Mineau), pp. 19-34.Amsterdam: Elsevier.
Science Report Development of tools for assessing genotoxicity40
Harrison F L and Jones I M, 1982 An in vivo sister-chromatid exchange assay in thelarvae of the mussel Mytilus edulis – response to 3 mutagens. Mutation Research,105, No. 4, 235-242.
Ivett J L and Tice R R, 1982 Average generation time: a new method of analysis andquantitation of cellular proliferation kinetics. Mutagenesis, 4, 358.
Jha A N, 2004 Genotoxicological studies in aquatic organisms: an overview. MutationResearch: Fundamental and Molecular Mechanisms of Mutagenesis, 552, Nos. 1–2, 1-17.
Jha A N, Hutchinson T H, Mackay J M, Elliott B M and Dixon D R,1996 Development ofan in vivo genotoxicity assay using the marine worm Platynereis dumerilii(Polychaeta: Nereidae). Mutation Research: Environmental Mutagenesis andRelated Subjects, 359, No. 2, 141-150.
Jha A N, Cheung V V, Foulkes M E, Hill S J and Depledge M H, 2000 Detection ofgenotoxins in the marine environment: adoption and evaluation of an integratedapproach using the embryo-larval stages of the marine mussel, Mytilus edulis.Mutation Research: Genetic Toxicology and Environmental Mutagenesis, 464, No.2, 213-228.
Johnson I, Girling A, Crane M and Simpson P. 2004 Assessment of the value ofbiological effects measures within the EU habitats and birds directives and habitatregulations. Technical report WRc-Plc.
Lamberti L, Bigatti P P and Ardito G, 1983 Cell kinetics and sister chromatid exchangefrequency in human lymphocytes. Mutation Research, 120, 193-199.
Livingstone D R, 1993 Biotechnology and pollution monitoring – use of molecularbiomarkers in the aquatic environment. Journal of Chemical Technology andBiotechnology, 57, No. 3, 195-211.
Marrs T,1996 Organophosphate anticholinesterase poisoning. Toxic SubstanceMechanisms, 15, 357-388.
Mitchelmore C L and Chipman J K, 1998a Detection of DNA strand breaks in brown trout(Salmo trutta) hepatocytes and blood cells using the single cell gel electrophoresis(Comet) assay. Aquatic Toxicology, 41, Nos. 1–2, 161-182.
Mitchelmore C L and Chipman J K, 1998b DNA strand breakage in aquatic organismsand the potential value of the Comet assay in environmental monitoring. MutationResearch: Fundamental and Molecular Mechanisms of Mutagenesis, 399, No. 2,135-147.
Mitchelmore C L, Birmelin C, Livingstone D R and Chipman J K, 1998 Detection of DNAstrand breaks in isolated mussel (Mytilus edulis L.) digestive gland cells using the‘Comet’ assay. Ecotoxicology and Environmental Safety, 41, No. 5, 51-58.
Natarajan A T, Tucker J D and Sasaki Y F, 1994 Monitoring cytogenetic damage in vivo.In Methods to Assess DNA Damage and Repair: Interspecies Comparisons (eds.R G Tardiff, P H M Lohman and G N Wogan), pp. 95-116. Chichester, UK: Wiley.

Science Report Development of tools for assessing genotoxicity 41
Scott D, Dean B J, Danford N D and Kirland D J, 1990 Metaphase chromosomeaberration assays in vitro. In Basic Mutagenicity Tests. UKEMS RecommendedProcedures (ed. D J Kirkland), pp. 62-86. Cambridge, UK: Cambridge UniversityPress.
Steinert S A, 1999 DNA damage as a bivalve biomarker. Biomarkers, 4, No. 6, 492-496.
Thain J E, 1991 Biological effects of contaminants: oyster Crassostrea gigas embryobioassay. ICES Techniques in Marine Environmental Sciences No. 11.Copenhagen: International Council Exploration of the Sea.
Tucker J D and Preston R J, 1996 Chromosome aberrations, micronuclei, aneuploidy,sister chromatid exchanges, and cancer risk assessment. Mutation Research:Reviews in Genetic Toxicology, 365, Nos. 1–3, 147-159.
Viarengo A, Ponzano E, Dondero F and Fabbri R, 1997 A simple spectrophotometricmethod for metallothionein evaluation in marine organisms: an application toMediterranean and Antarctic molluscs. Marine Environmental Research, 44, No. 1,69-84.
Viarengo A, Burlando B, Cavaletto M, Marchi B, Ponzano E and Blasco J, 1999 Role ofmetallothionein against oxidative stress in the mussel Mytilus galloprovincialis.American Journal of Physiology: Regulatory Integrative and ComparativePhysiology, 277, No. 6, R1612-R1619.
Weinstein I B, 1988 The origins of human cancer: molecular mechanisms ofcarcinogenesis and their implications for cancer prevention and treatment–twenty-seventh G.H.A Clowes Memorial Award Lecture. Cancer Research, 48, No. 15,4135-4143.

Science Report Development of tools for assessing genotoxicity42
Appendix I – University of PlymouthprotocolsThe following protocols used for measuring biomarkers at the University of Plymouth arepresented:
• Preparation of metaphase chromosomes from embryo-larva of Myrilus edilis orCrassostrea gigas for the determination of chromosome aberrations (CAbs)
• Determination of metallothionein (MT) in marine invertebrate tissue
• Acetylcholinesterase activity
• Determination of total protein: BioRad Bradford assay
• Ferric reducing antioxidant power (FRAP) assay
• Comet assay

Science Report Development of tools for assessing genotoxicity 43
Preparation of metaphase chromosomes from embryo-larvae ofMytilus edulis or Crassostrea gigas for the determination ofchromosome aberrations (CAbs)
Preparation of embryo-larvae1. Spawn at least two pairs of adult bivalves as per protocol for embryo-larval
development test. Check viability of gametes (seawater held at 20 ± 2°C).2. Allow eggs to be fertilised as per protocol for embryo-larval development test.
Determine fertilisation rate 1 hour after addition of sperm to egg suspension. Age zerois taken to be the time at which >90 per cent eggs are fertilised. If this fertilisation rateis not achieved within 3 hours of placing sperm and eggs together, the gametesshould be discarded and alternative adults should be used for spawning.
3. Allow embryos to grow in clean seawater at a maximum density of 20 embryos per mlseawater for M. edulis and 100 embryos per ml seawater for C. gigas, for 14 hourspost-fertilisation (15°C for M. edulis; 20°C for C. gigas).
4. Exposure of the embryos to the test solution should be for 1.5 cell cycles: one cellcycle is approximately 4 hours for M. edulis; and approximately 2.5 hours for C.gigas. Therefore if testing M. edulis, the exposure should commence at 14 hourspost-fertilisation and be terminated at 20 hours post-fertilisation. If testing C. gigas,the exposure should commence at 15 hours 15 minutes post-fertilisation and beterminated at 19 hours post-fertilisation.
5. Sieve the embryo suspension from each through separate 30 µm nylon sieves (theembryos should remain on the sieve).
6. Immerse the embryos (within the sieve) into 0.025 per cent (w/v) solution ofcolchicine for 30 minutes (NB Colchicine is dissolved in seawater) held at roomtemperature, e.g. 25 mg in 100 ml seawater.
7. Immediately transfer the embryos (within the sieve) into a series of hypotonicsolutions. These are made of 0.56 per cent KCl solution, e.g. 5.6 g in 1 litre distilledwater. Hypotonic solutions are made up to the following ratios:
Seawater : KCl solution(a) 2 : 1(b) 1 : 1(c) 1 : 2(d) 1 : 3
The embryos are transferred into the hypotonic solutions following the sequenceabove (from a to d) for 10 minutes in each solution at room temperature. Carefullytransfer the embryo-larvae into 1.7 ml siliconised microcentrifuge tubes from thesurface of the sieves using plastic Pasteur pipettes.
8. Centrifuge for 5 minutes at 2000 rpm (revolutions per minute).9. Using a pipette, remove and discard the supernatant to leave a loose pellet of
embryo-larvae.10. Add cold (4°C) Carnoy’s fixative (acetic acid: methanol in a ratio of 1:3 v/v), drop by
drop to the embryos.11. Allow the embryos to settle out down in the microcentrifuge tube (approximately 20
minutes), remove the Carnoy’s fixative using a pipette and replace with freshCarnoy’s fixative. Repeat once more. Leave overnight before preparing chromosomespreads.

Science Report Development of tools for assessing genotoxicity44
Preparation of metaphase chromosome spreads1. Once again remove the Carnoy’s fixative using a pipette and replace with fresh cold
(4°C) Carnoy’s fixative. Resuspend the embryo-larvae by gently pipetting with plasticPasteur pipettes. Add approximately 4–5 drops of the fixed embryo-larvae suspensionto a microscope slide, ensuring even distribution over the slide surface.
2. Add approximately 4–5 drops of 60 per cent (v/v) glacial acetic acid to the slide.3. Place onto a hot plate set at 40°C and allow the slide to dry while rotating the slide by
hand to ensure an even distribution of the chromosomes.4. Check the spreading of the metaphases with a phase-contrast microscope at ×400
total magnification. Store the slides at room temperature in a dust-free environmentovernight to allow the chromosomes to adhere to the slides.
Staining of the chromosomes1. Rinse each slide with distilled water.2. Arrange the slides in a coplin jar/staining trough.3. Immerse the slides in 10 per cent Giemsa solution (e.g. 10 ml in 90 ml Giemsa buffer)
at room temperature and allow to stain for 15 minutes.4. Remove the slides from the stain and rinse twice in distilled water.5. Allow to air-dry at room temperature.6. Once dry, mount coverslips onto the slides with DPX. Place 3–4 drops of DPX
mountant on the slide and apply a coverslip avoiding trapped air bubbles.7. The DPX mountant should be allowed to dry thoroughly before slide analysis under
the microscope.
Scoring of chromosomes1. Examine complete metaphase spreads (± 2 chromosomes from 2n) for CAbs at a
total magnification of ×1000 (with oil immersion). NB. 2n in M. edulis = 28chromosomes; 2n in C. gigas = 20 chromosomes. Score 100 metaphase cells foraberrations as defined by Scott et al. (1990).
2. Present results as percentage of aberrant cells and total frequencies of aberrations.

Science Report Development of tools for assessing genotoxicity 45
Determination of metallothionein (MT) in marine invertebrate tissue
STAGE 1 – Preparation of tissue
1. Grind up frozen tissue in a cold mortar with liquid nitrogen.2. Place approximately 1 g of ground tissue in a 10 ml beaker. Record the exact wet
weight of the sample.3. Add 3 ml of cold 1 mM DTT and 30 µl PMSF solution. Stir with spatula. Keep sample
on ice at all times.4. Sonicate for 3 × 15 seconds (40 per cent duty cycle, output control 4), placing 10 ml
beaker inside a 50 ml beaker containing ice in case of the smaller beaker breaks.5. Add another 30 µl PMSF solution.6. Ultracentrifuge at 55,000 rpm at 4°C for 70 minutes.7. Transfer 550 µl of the supernatant (avoiding lipid surface layer) into three eppendorf
tubes. Freeze at –80°C for a maximum of 7 days before stage 2 (purification of MT).
Stage 1 reagents:1 mM DTT = 7.71 mg made up fresh in 50 ml distilled water0.1 mM PMSF solution = 17.4 mg in 10 ml ethanol
STAGE 2 – Purification of MT
NB Keep samples on ice at all times.1. Set the centrifuge up before starting to get the temperature down to 4˚C:
Set key: univSpeed: 2000 rpmTime: 12 minutesTemp: 4˚C Excess temp: 25˚CEnsure that the correct Number (rotor radius) has been entered.Close lid to allow temperature to be maintained.
2. Take the samples out of the freezer and allow them to thaw in an eppendorf rack onice.
3. Prepare relevant number of nalgene centrifuge tubes (label and arrange in rack).4. To each centrifuge tube add: 500 µl of thawed sample (cytosolic fraction/supernatant),
500 µl of –20°C absolute ethanol (keep this in the freezer until needed) and 40 µlchloroform. Mix using vortex.
5. Centrifuge at 6,000g (7,000 rpm) for 12 minutes.6. Pour the supernatant into a new centrifuge tube (pellet can be discarded). To this
supernatant, add three times its volume of –20˚C absolute ethanol = i.e. 3 ml vortex.7. Place the samples in a test tube rack, cover with parafilm (or put lids on if available)
and place in –20°C freezer for 1 hour.8. Meanwhile, take Na2-P buffer out of fridge and place on a magnetic mixer (NB It may
have started to freeze at fridge temperatures).9. Take samples out of freezer, centrifuge at 6,000g for 12 minutes.10. Make washing buffer, store at –20°C.11. Pour away supernatant, then wash the pellet (and sides of tubes) using 2 ml of
washing buffer (wash two times with 1 ml each time). Vortex the mixture.12. Centrifuge at 6,000g for 12 minutes.13. Meanwhile, make standard curve, with GSH solution.
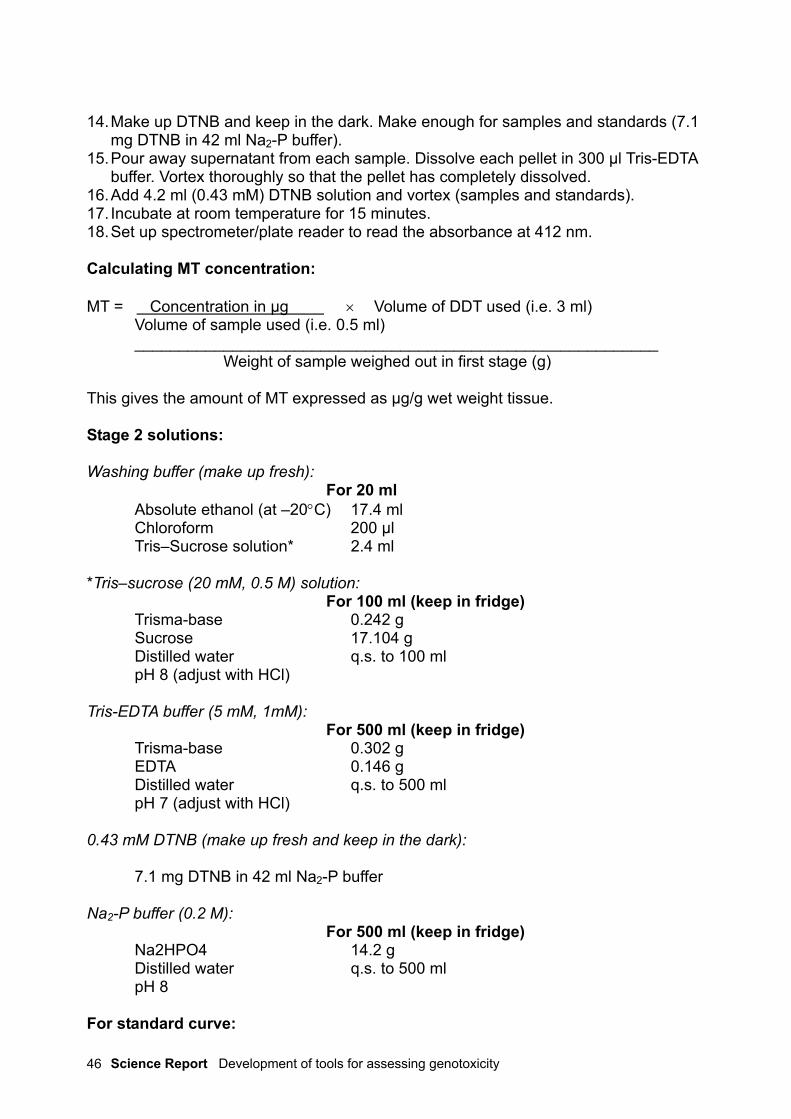
Science Report Development of tools for assessing genotoxicity46
14. Make up DTNB and keep in the dark. Make enough for samples and standards (7.1mg DTNB in 42 ml Na2-P buffer).
15. Pour away supernatant from each sample. Dissolve each pellet in 300 µl Tris-EDTAbuffer. Vortex thoroughly so that the pellet has completely dissolved.
16. Add 4.2 ml (0.43 mM) DTNB solution and vortex (samples and standards).17. Incubate at room temperature for 15 minutes.18. Set up spectrometer/plate reader to read the absorbance at 412 nm.
Calculating MT concentration:
MT = Concentration in µg × Volume of DDT used (i.e. 3 ml)Volume of sample used (i.e. 0.5 ml)___________________________________________________________ Weight of sample weighed out in first stage (g)
This gives the amount of MT expressed as µg/g wet weight tissue.
Stage 2 solutions:
Washing buffer (make up fresh):For 20 ml
Absolute ethanol (at –20°C) 17.4 mlChloroform 200 µlTris–Sucrose solution* 2.4 ml
*Tris–sucrose (20 mM, 0.5 M) solution:For 100 ml (keep in fridge)
Trisma-base 0.242 gSucrose 17.104 gDistilled water q.s. to 100 mlpH 8 (adjust with HCl)
Tris-EDTA buffer (5 mM, 1mM):For 500 ml (keep in fridge)
Trisma-base 0.302 gEDTA 0.146 gDistilled water q.s. to 500 mlpH 7 (adjust with HCl)
0.43 mM DTNB (make up fresh and keep in the dark):
7.1 mg DTNB in 42 ml Na2-P buffer
Na2-P buffer (0.2 M):For 500 ml (keep in fridge)
Na2HPO4 14.2 gDistilled water q.s. to 500 mlpH 8
For standard curve:
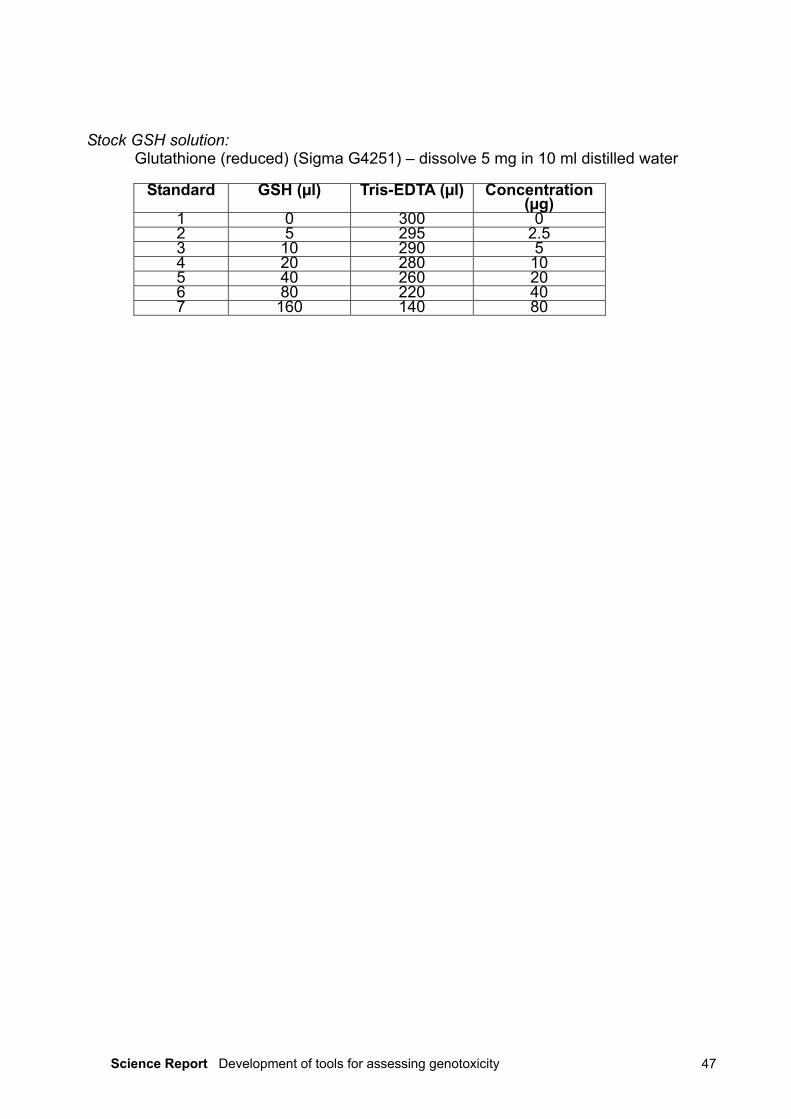
Science Report Development of tools for assessing genotoxicity 47
Stock GSH solution:Glutathione (reduced) (Sigma G4251) – dissolve 5 mg in 10 ml distilled water
Standard GSH (µl) Tris-EDTA (µl) Concentration(µg)
1 0 300 02 5 295 2.53 10 290 54 20 280 105 40 260 206 80 220 407 160 140 80

Science Report Development of tools for assessing genotoxicity48
Acetylcholinesterase activity
Tissue preparation1. Grind up frozen tissue in a cold mortar with liquid nitrogen.2. Dilute with a 1:5 w/v ratio of homogenisation buffer (0.1 M Tris-HCl, pH 7.2, 0.25 M
sucrose). Centrifuge at 10,000 rpm for 10 minutes. Retain supernatant and store onice.
Reagents1. Prepare the phosphate buffer solution by dissolving:
• 7.584 g NaHPO4 (Sigma S-5136)• 1.8 g KH2PO4 (Sigma P-8416)
In 1 litre of distilled water, make a 50 mM solution and adjust pH to 7.4. Alternatively,dissolve a saline buffer tablet (Sigma P 4417) in 200 ml of distilled water. This makesa 10 mM solution. Adjust pH to 7.4
2. Dissolve 0.043 g of ACTI (Sigma A-5751) in 50 ml of distilled water in a smokedamber bottle (to protect solution from the light) and place on ice. This produces a 3.0mM solution.
3. Dissolve 0.0107 g of DTNB (Sigma-D8130) in 100 ml phosphate buffer in a smokedamber vial to produce a 270 µM solution and place on ice.
Determination of acetylcholinesterase activity1. Prepare the microtitre plate reader as follows:
• Absorbance at ∆A405nm• Run time 5 minutes at 30 second intervals.
Performing the assayThere may be some non-enzymic (endogenous) reaction between the sample and theDTNB, which may interfere with the analysis. To control for this, a pre-incubation ofDTNB and sample is performed before adding ACTI (see below). The use of a multi-pipette or repeat dispenser for the addition of ACTI is recommended as the reactionproceeds quickly. Pipette the reagents into a microtitre plate in the following order:
Addition Blank SampleHaemolymph - 50 µl
Buffer 50 µl -DTNB 150 µl 150 µlRecord A405nm of endogenous reaction for 5 minute at 25°CACTI 50 µl 50 µl
Record A405nm for 5 minute at 25oC
1. Press ‘read’ on KC4.2. Results are recorded as ∆A405nm/minute.3. Results are expressed as specific activity (µ moles substrate hydrolysed per minute
per mg total protein).

Science Report Development of tools for assessing genotoxicity 49
Determination of total protein: BioRad Bradford assay
Prepare protein standards1. Start with a BSA standard solution of 2 mg/ml (Sigma P0834). Prepare standards as
follows, mixing well with a vortex:
Standard(mg/ml)
Stock (µl) Buffer (µl)
0 (blank) 0 1000.2 10 900.6 30 701.0 50 501.4 70 30
2. Dilute BioRad (catalogue no. 500-0006) Bradford reagent 1 in 5 with distilled water(e.g. 5 ml + 20 ml distilled water).
3. Prepare microtitre plate reader:• Wavelength setting is 595 nm, single wavelength
4. Pipette 4 µl standards, blanks and samples into microtitre plate. Add 200 µl BioRadprotein reagent. Incubate at 18-25°C for 10—30 minutes.
5. Place plate in reader and press ‘read’ on SOFTMAX PRO.6. Results are expressed as mg/ml, correcting for original dilution
Calculation of specific activityEnzyme activity can be standardised by volume or tissue weight, but the preferredmethod is to express units of activity relative to total protein.one unit = amount of enzyme that hydrolyses 1 µmole ACTC per minute per mg protein
AChE activity (units) = ∆A405 × VolT × 1000 (1.36 × 10⁴) × light path × VolS × [protein]
= µmol ACTC per minute per mg protein
where:
∆A405 = change in absorbance (OD) per minute, corrected for spontaneous hydrolysisVolT = total assay volume (DTNB + sample in ml)1.36 × 104 = extinction coefficient of TNB (per M per cm)light path = microplate well depth (1 cm)VolS = sample volume (in ml)[protein] = concentration of (mg/ml)
NB The only variables are ∆A405 and [protein]; all other factors are constant for eachexperimental format

Science Report Development of tools for assessing genotoxicity50
Ferric reducing antioxidant power (FRAP) assay
The FRAP assay provides a direct measure of the total antioxidant status of a sample.Antioxidants in the sample reduce ferric [Fe(III)] TPTZ to ferrous [(FeII)] TPTZ, which hasa strong absorbance at 593 nm.
Materialssodium acetate, C2H3O2Na.3H2Oglacial acetic acid2,6,6-tripyridyl-s-triazine (TBTZ) (Fluka 93285)HClFeCl3.6H2O (Sigma F2877)
Optional standardsFeSO4.7H2O Sigma F7002L-+-ascorbic acid ultra pure MerckUric acid BDHBSA fraction V SigmaTrolox Aldrich 23881-3
Equipmentspectrophotometer or microtitre plate reader0.5 ml cuvettes or microtitre plates capable of holding 300 µl per wellneedlessyringeseppendorf tubes for collection of samples
Preparation of FRAP reagent1. 300 mM acetate buffer:C2H3O2Na.3H2O (molecular weight = 136.1) 3.1 gglacial acetic acid 16 mlMake up to 1 litre with distilled water and adjust pH to 3.6.
2. 10 mM TBTZ in 40 mM HCl:TBTZ (molecular weight = 312.3) 312 mgHCl (1 molar) 4 ml
Make up to 100 ml with distilled water.
3. 20 mM FeCl3.6H2O (molecular weight = 270.3) 0.54 gMake up to 100 ml with distilled water.
Prepare FRAP reagent fresh as required by mixing the above in the ratio 10:1:1.
4. Standards:FeSO4.7H2O (molecular weight = 278)1000 µM = 27.8 mg/100 ml
Prepare standard curve from 0 to 1000 µM

Science Report Development of tools for assessing genotoxicity 51
Concentration(µM)
Volume of 1mMFeSO4.7H2O (µl)
Volume of distilled water(µl )
0 0 100050 50 950100 100 900200 200 800400 400 600800 800 200
1000 1000 0
5. Sample preparation:• Grind whole tissue to a fine powder in liquid nitrogen.• Transfer approximately 1 g of tissue to chilled 10 ml beakers.• Add physiological saline to each sample at a ratio of 1:5 (w/v) tissue: physiological
saline.• Centrifuge the homogenates at 1,000 rpm for 10 minutes. Discard any particulate
matter prior to assay.• Use the supernatant for subsequent analysis.
6. To perform assay:• Add 200 µl FRAP reagent and 50 µl sample, standard or buffer to a plastic cuvette
or microtitre plate and mix well.• Start recording the absorbance at 593 nm immediately (time 0).• Incubate for 10 minutes at 25°C.• Take a reading every 15 seconds or monitor continuously. There is no need to
record for longer than 6 minutes.
7. Calculate FRAP using the following equation:
10 – 0 minute ∆A593nm test sample × FRAP value of standard* (µM)10 – 0 minute ∆A593nm standard
* Blank corrected signal given by 100 µM FeSO4.7 H2O (FeII) is equivalent to a FRAPvalue of 100 µM.

Science Report Development of tools for assessing genotoxicity52
Comet assay
Preparation of Kenny’s salt solution (for LMPA)Ingredients per 1000 ml:
Final concentration WeightNaCl 0.4 M 23.37 gKCl 9 mM 0.6709 gK2HPO4 0.7 mM 0.12194 gNaHCO3 2 mM 0.16802 gq.s. to 1,000 ml distilled water
Low melting point agarose (LMPA) (1.0 per cent)To make 1.0 per cent LMPA, dissolve 10 mg/ml Kenny’s salt solution by heating in amicrowave for 1–2 minutes at full power until dissolved. Aliquot 2 ml samples intomicrocentrifuge tubes and store in a refrigerator at 4°C. When required, melt immediatelybefore use.
Preparation of TAE solution (for NMPA)Ingredients per 1000 ml:
Final concentration WeightTris-Acetate 40 mM 7.248 gEDTA 1 mM 2 ml 0.5 M solutionq.s. to 1,000ml distilled water
Normal melting point agarose (NMPA) (1.0 per cent)To make 1.0 per cent NMPA, dissolve 1.0 g/100 ml TAE solution by heating in amicrowave for 1–2 minutes at full power until dissolved. Store in a refrigerator at 4°C.When required, melt immediately before use.
Lysing solutionIngredients per 1,000 ml:
Final concentration WeightNaCl 2.5 M 146.4 gNa2EDTA 100 mM 37.2 gTris Base 10 mM 1.2 gNaOH to pH 10 (approximately 8.0 g)N-Lauroyl-sarcosine 1 per cent 10 gAdd pure water to give a final volume of 890 ml.Filter sterilise, store at 4°C and adjust to room temperature before using.
Added immediately prior to use:TRITON X100 1 per cent (e.g. 0.5 ml per 50 ml)DMSO 10 per cent (e.g. 5 ml per 45 ml)
Electrophoresis bufferFinal concentration Weight
NaOH 1 N 40.0 gq.s. to 1,000 ml with distilled water, filter sterilise. Store at room temperature.
EDTA 200 mM

Science Report Development of tools for assessing genotoxicity 53
If using 0.5 M EDTA solution, dilute 0.5 M Na2EDTA solution by 2.5 times, e.g. 1 ml EDTAplus 1.5 ml millipore water (i.e. water previously passed through a 0.45 µm milliporefilter). Store at room temperature.
Make up electrophoresis buffer immediately prior to use. Use freshly madeelectrophoresis buffer for each set of gels run. For 1-litre electrophoresis buffer, mix 300ml 1N NaOH, 5 ml 200 mM EDTA and 695 millipore water.
Neutralisation bufferFinal concentration Weight
TRIS 0.4 M 48.44 gq.s. to 1,000ml with distilled water. Adjust to pH 7.5 using concentrated HCl acid. Store atroom temperature.
Ethidium bromide staining solutionPreparation of stock ethidium bromide solution:Stock solution is made up of 2.0 mg/ml ethidium bromide in distilled water (giving a 5xdilution), e.g. 0.5 ml ethidium solution + 2ml distilled water. Store at room temperature inthe dark.
Working solution = 0.05 ml of 2.0 m/ml stock + 4.95 ml distilled water (giving a 100xdilution of the stock solution). Store at room temperature in the dark.
Procedure1. Bring LMPA and NMPA to melting point by microwaving or holding in a water bath.2. Label slides with diamond pen.3. Dip slides into molten NMPA and wipe excess from underside of slide. Dry slides in
an incubator at 40°C for a minimum of 2 hours (can be prepared the previous day).4. Centrifuge cells for 3 minutes at 200g.5. Remove supernatant from centrifuged cells. Resuspend cells in 180µl LMPA by gently
pipetting. (NB There should be no more than ~10,000 cells per sample).6. Apply two drops of 85 µl LMPA/cell suspension on top of the base layer of NMPA
(thus providing two replicates per cell sample).7. Apply 22 × 22 coverslips and return to ice/fridge for at least 10 minutes.8. Prepare the working lysing solution (add Triton X-100 and DMSO together).9. Gently slide off coverslips and place slides in coplin jars/staining trough.10. Add lysing solution to fully immerse slides.11. Incubate for 1 hour at 4°C in the dark to lyse the cells.12. Meanwhile make up electrophoresis buffer and pour into the electrophoresis
chamber. Check the chamber is completely horizontal beforehand.13. Run tap water through the electrophoresis chamber to maintain temperature.14. Remove slides from the lysing solution and rinse in distilled water three times for 2
minutes.15. Transfer slides into the electrophoresis chamber (preferably with the labelled end
towards the anode), ensuring the gels are completely covered with theelectrophoresis buffer.
16. Allow the slides to incubate in the alkaline electrophoresis buffer for 20 minutes toallow the DNA to unwind.
17. Turn on power supply and set to 20 V and 300 mA (may need to adjust volume ofbuffer). Run for 30 minutes. NB The voltage will only reach 17 V at 300 mA.

Science Report Development of tools for assessing genotoxicity54
18. Remove slides from electrophoresis chamber, add ~5 drops of neutralisation bufferand leave for 5 minutes. Repeat a further twice.
19. If the slides are not to be analysed within 24 hours, then fix (dehydrate) for 5 minutesin 100 per cent methanol. To rehydrate, apply 100 µl distilled water (on each area ofagarose) and apply coverslip – allow to rehydrate for 10 minutes before adding stain.
20. For analysis within 24 hours, apply 40 µl ethidium bromide stain (working solution) toeach replicate, apply coverslips, and store in airtight containers in the fridge.
21. Analyse at least 50 cells per replicate (100 cells per slide).
Evaluation of DNA damage1. For visualisation of DNA damage, observations should be made of fluorochrome-
stained DNA using a 20× or 40× objective (depending on the cell size) on afluorescent microscope. NB Avoid analysing cells at the edges of the gel, where it hasbeen observed that high levels of damage can be seen.
2. There are several image analysis systems commercially available for quantification ofdata, e.g. Komet analysis system developed by Kinetic Imaging Ltd and Comet AssayII developed by Perceptive Instruments.
It is also possible to analyse comets quantitatively without image analysis software. Ascheme has been developed by Andrew Collins and colleagues (University of Oslo,Norway) for visual scoring based on five recognisable classes of comet, from class 0(undamaged, no discernible tail) to class 4 (almost all DNA in tail, insignificant head).Each comet is given a value according to the class it is put into, so that an overall scorecan be derived from each gel.

Science Report Development of tools for assessing genotoxicity 55
Appendix II – OysteR EmbryoChromosome Aberrations (ORCA)assay: method development andvalidationThis appendix presents the aims, method, results and learning points of four experimentsconducted at the Environment Agency’s Waterlooville Laboratory on:
• 1 July 2004• 27 July 2004• 3 August 2004• 10 August 2004.
Learning points are given in italics.

Science Report Development of tools for assessing genotoxicity56
Experiment 1: 1 July 2004
AimTo attempt oyster embryo chromosome extraction and staining procedures at theBiological Effects Laboratory at Waterlooville.
Method1. Conditioned adult oysters were supplied by GSF (Batch No. Arch 04/01 5/5). Oysters
arrived on the day of the test.
2. Oysters exposed to reference seawater (filtered artificial seawater (ASW)) at adensity of 100 embryos per ml; 2 litres of oyster suspension was prepared.
3. Oyster embryos were incubated at 24°C in glass beakers for ~4 hours during earlydevelopment to promote development to 16–32 cells. Once they had reached 16–32cells, oyster embryos were inoculated from their developmental density (6,000embryos/ml) to their test density (100 embryos/ml). Oyster embryos were thenincubated at this density for 20 hours at 20°C.
4. After 20 hours, oyster embryos were exposed to colchicine and subsequent isotonicsolutions as per the Plymouth method, but using three treatments of test solutionvolume: 500, 250 and 100 ml (50,000, 25,000 and 10,000 nominal embryosrespectively). This was done to investigate the minimum amount of test solutionrequired to yield enough embryos for slide production/scoring.
5. Fixed embryos were left for between 3 days and 3 weeks before slide preparation andstaining
6. A standard zinc reference test was performed alongside the mesh-based chambers,but the exposure duration was extended to 24 hours to allow for development oflarvae to D-stage.
Results/Learning pointsHarvesting of embryos from test solutions using meshes and microcentrifuge tubes wassuccessful.
Colchicine and hypotonic solutions should be poured into the centre of the mesh tubesand allowed to fill the crystallising dishes, rather than adding meshes to crystallisingdishes previously filled with colchicine or hypotonic solutions. This minimises thepresence of bubbles in the underside of the mesh.
Staining was successful. Good chromosome staining was observed in a few cells underoil immersion (×1000).
Spent Giemsa stain must be disposed of in a non-chlorinated waste solvents bottle. Itshould be possible to obtain one from the NLS.
Mounting of slides using DPX was reasonably successful. If too much DPX is used, theslides take too long to dry (layer is too thick). If too little is used (layer is too thin),subsequent observation under oil immersion becomes difficult as a large amount of oil is

Science Report Development of tools for assessing genotoxicity 57
needed to obtain the correct focal conditions. There also seem to be fewer bubblesforming under the cover slips when less DPX is used.
Continued practising with DPX and oil immersion is necessary to strike the correctbalance between DPX thickness, drying time and ease of observation under oilimmersion. It may also be possible to experiment with different immersion oils withgreater viscosity.
After 20 hours, the majority of oyster embryos had partially formed shells. This resulted inpoor disaggregation of cells after hypotonic treatments and staining, and poorchromosome spreads. Not many cells could be scored individually as many were‘clumped’. The presence of shells was probably the result of two factors:
• total development time was ~24 hours (including early development time andexposure time);
• early development was conducted at 24°C promoting rapid cell division anddevelopment.
Future exposures should be timed from fertilisation rather than inoculation. They shouldbe conducted at a single temperature only (20°C). This would make it more likely thatgood spreads would be prepared from the exposures.
Slides that were prepared within a few days of fixing in Carnoy’s gave better spreadsthan those prepared after the same batch of embryos had been stored for an additionaltwo weeks in Carnoy’s.
This may be the result of cells becoming too ‘brittle’ after extended storage in Carnoy’sfixative. Recommend that slides are prepared within a week of fixing in Carnoy’s or within48 hours if possible.
At this early stage, there seemed to be no difference in the quality of slides producedfrom 500, 250 or 100 ml of test solution.
It is too soon to recommend a preference for one volume of test solution over another.However, 250 ml seems a reasonable compromise in the short term. This density shouldbe used in forthcoming exposures and until more information is available with which tomake decisions.

Science Report Development of tools for assessing genotoxicity58
Experiment 2: 27 July 2004
AimTo repeat chromosome extraction and staining procedure detailed as experiment 1,specifically to improve the quality of chromosome spreads through use of a shortenedexposure duration
MethodNominal exposure timetable developed as detailed below:
Date TimeTime post-fertilisation
(hours: minutes)Activity
27 July 16:45 0 Oyster eggs fertilised28 July 09:00 16:15 Exposure to test substance28 July 12:45 20:00 Colchicine28 July 13:15 20:30 Hypotonic 128 July 13:25 20:40 Hypotonic 228 July 13:35 20:50 Hypotonic 328 July 13:45 21:00 Hypotonic 4
28 July 13:55 21:10 Centrifuge and Carnoy’sfixative
1. Conditioned adult oysters were supplied by GSF (Batch no. Arch 04/03 7/7). Oystersarrived on the day of the test
2. Oysters were fertilised and grown on in reference seawater (filtered ASW) at 20°C ata density of 6,000 embryos per ml. Three batches of oyster egg suspension wereprepared using different females.
3. Oyster eggs were fertilised at 17:00 (27 July 2004, 15 minutes behind nominalschedule). Sperm quality was poor on initial inspection. All subsequent timings arebased on time from fertilisation.
4. Oyster embryos were gently resuspended at 30–45 minute intervals and examinedfor the presence of polar bodies. No polar bodies were present until18:30, 1.5 hourspost-fertilisation, although one embryo had three cells at this point.
5. Oyster embryos were inoculated into ASW at test density (100 embryos/ml) at 19:30(2.5 hours post-fertilisation); embryos were at 1–4 cells at this stage with ~90–95 percent fertilisation rate. Three 250 ml replicates were prepared. Embryos were thenincubated at 20°C in the dark for a further 17.5 hours.
6. At 20 hours post-fertilisation, embryos were exposed to colchicine and subsequentisotonic solutions as per the Plymouth method. Embryos were spun out of suspensionand fixed in Carnoy’s.
7. Slides were prepared and fixed the same week.

Science Report Development of tools for assessing genotoxicity 59
Results/learning pointsNominal exposure timetable worked reasonably well. Fertilisation was 15 minutes behindschedule, but later treatments were delayed to accommodate this.
No evidence of D-shells in embryos exposed for 20 hours at 20°C.
Quality of chromosome spreads was poor. Although no D-shells were present, celldisaggregation did not occur during slide preparation, resulting in ‘clumping’ and poorresolution of cells.
Neat glacial acetic acid was used for slide preparation, rather than the 80 per centsolution. This may have contributed to the poor chromosome spreads.

Science Report Development of tools for assessing genotoxicity60
Experiment 3: 3 August 2004
Aim:To repeat chromosome extraction and staining procedure (detailed in experiments 1 and2) to:
• determine reason for poor quality of chromosome spreads;• trial methodology and response of oyster embryos after exposure to genotoxic
reference substance MMS for 1.5 cell cycles.
MethodNominal exposure timetable developed as detailed below:
Date TimeTime post-fertilisation
(hours: minutes)Activity
03 August 16:45 0 Oyster eggs fertilised04 August 09:00 16:15 Exposure to test substance04 August 12:45 20:00 Colchicine04 August 13:15 20:30 Hypotonic 104 August 13:25 20:40 Hypotonic 204 August 13:35 20:50 Hypotonic 304 August 13:45 21:00 Hypotonic 4
04 August 13:55 21:10 Centrifuge and Carnoy’sfixative
1. Conditioned adult oysters were supplied by GSF (Batch no: unknown). Oystersarrived on the day of the test.
2. Oysters were fertilised and grown-on in reference seawater (filtered ASW) at 20°C ata density of 6,000 embryos per ml. Three batches of oyster egg suspension wereprepared using different females.
3. Oyster eggs were fertilised at 16:55 (03 August, 10 minutes behind nominalschedule). All subsequent timings are based on time from fertilisation.
4. Oyster embryos were gently resuspended at 30–45 minute intervals and examinedfor the presence of polar bodies.
5. Oyster embryos were inoculated into ASW at test density (100 embryo/ml) at 19:15 (2hours 20 minutes post-fertilisation); embryos were at 1–4 cells at this stage with ~90–95 per cent fertilisation rate. Ten 250ml replicates were prepared (25,000 embryosper replicate).
6. Embryos were then incubated at 20°C in the dark for a further 17 hours, until exposedto the test substance.
7. Oyster embryos were exposed to four concentrations of MMS (in ASW) in duplicate:
• 1.0 × 10-3 = 1 mM

Science Report Development of tools for assessing genotoxicity 61
• 1.0 × 10-4 = 0.1 mM• 1.0 × 10-5 = 0.01 mM• 1.0 × 10-6 = 0.001 mM
7. Exposure was scheduled to begin at 09:10 until 12:55 (3 hours 45 minutescorresponding to 1.5 cell cycles, as previously calculated by V. Cheung).
8. MMS concentrations were based on those used previously by V. Cheung and areknown to induce CAbs and aberrant cells in oyster embryos. On the evening of 3August, 500 ml of each test solution was prepared by serial dilution of the 1 mM testsolution (prepared by dissolving 50.65mg of MMS in 500 ml of ASW). Test solutionswere stored at 4°C in the dark until required on 4 August.
9. Exposure to test solutions began at 10:00 (50 minutes behind schedule in order tobring test solutions up to temperature). As a result, oyster embryos were onlyexposed to MMS for 2 hours 55 minutes (~0.9 cell cycles).
10. At 20 hours post-fertilisation, embryos were exposed to colchicine and subsequentisotonic solutions as per the Plymouth University method. Some difficulty wasencountered due to the length of time it took to transfer the embryos from the testsolutions to the colchicine (it took 30 minutes to put all replicates into Colchicine). Asa result, some replicates were exposed to MMS and colchicine for less or more timethan others.
11. Embryos were spun out of suspension and fixed in Carnoy’s.
12. Slides were prepared and fixed the same week.
Results/learning pointsNominal exposure timetable worked reasonably well. MMS exposures were delayed astest solutions were not up to test temperature when required.
Chromosome spreads of better quality, but still some clumping. It was possible todistinguish some individual disaggregated cells along ‘lines across slides’. There was noobvious evidence of CAbs, or aberrant cells across the MMS concentration range.
The appearance of ‘lines across slides’ of disaggregated cells may be evidence ofimproved disaggregation after more vigorous or repeated slide swirling during initial slidepreparation. In previous experiments, large numbers of slides were preparedsimultaneously and each slide may not have been swirled sufficiently to disaggregate thecells. In subsequent experiments, it will be important to swirl slides more frequently or forlonger than at present to ensure that cells are disaggregated and distributed evenlyacross slides.
The lack of obvious CAbs or aberrant cells may be the result of a number of factors:• the interval between MMS test solution preparation and exposure;• the curtailed MMS exposure duration (only ~0.9 cells cycles);• the problems encountered when transferring replicates to colchicine to MMS.

Science Report Development of tools for assessing genotoxicity62
MMS degrades in solution and the overnight storage period, although short, could haveresulted in MMS concentrations below nominal. In future experiments, solutions of MMSshould be prepared on the day of the test.
As the MMS exposures were ~0.9 cell cycles, there may have been a reduction in assaysensitivity as fewer cells had entered metaphase.
The inefficiency of transfer from test solutions to MMS affected the exposure duration ofcertain replicates to MMS and colchicine. In future exposures, timing of the exposure totest solutions and colchicine should be undertaken using smaller discrete groups(maximum size 4–5 replicates), which can be managed more easily than the overallgroup.
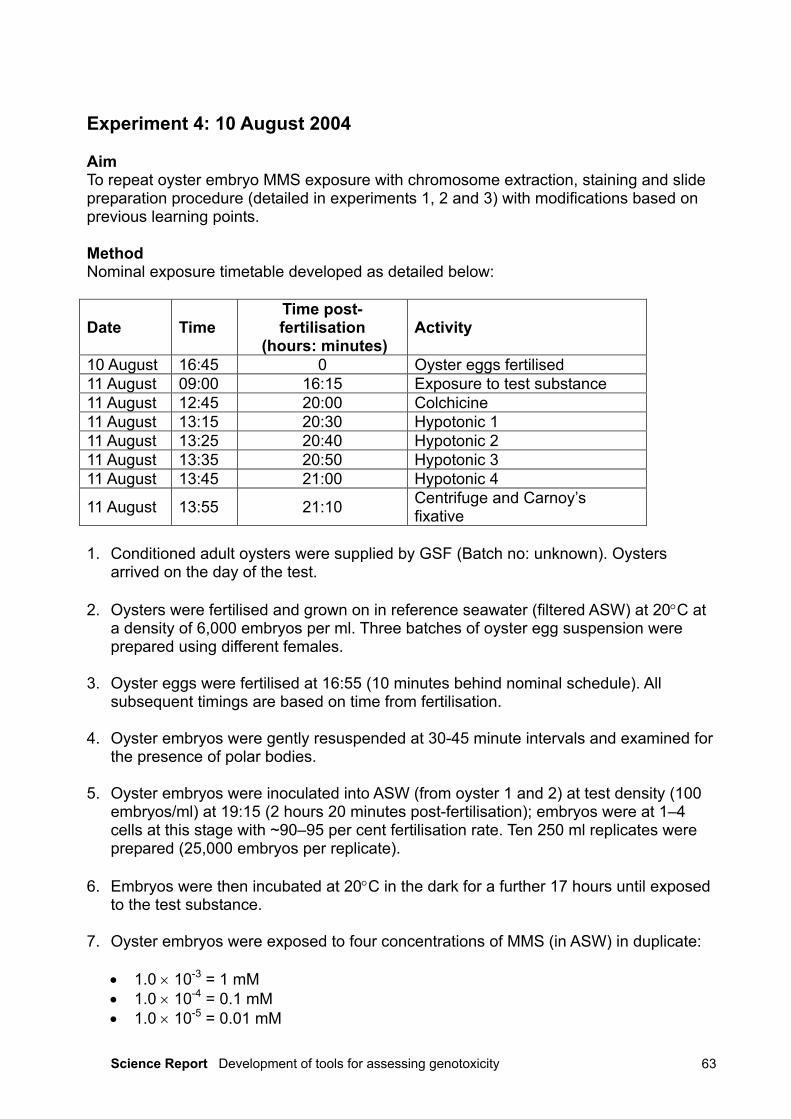
Science Report Development of tools for assessing genotoxicity 63
Experiment 4: 10 August 2004
AimTo repeat oyster embryo MMS exposure with chromosome extraction, staining and slidepreparation procedure (detailed in experiments 1, 2 and 3) with modifications based onprevious learning points.
MethodNominal exposure timetable developed as detailed below:
Date TimeTime post-fertilisation
(hours: minutes)Activity
10 August 16:45 0 Oyster eggs fertilised11 August 09:00 16:15 Exposure to test substance11 August 12:45 20:00 Colchicine11 August 13:15 20:30 Hypotonic 111 August 13:25 20:40 Hypotonic 211 August 13:35 20:50 Hypotonic 311 August 13:45 21:00 Hypotonic 4
11 August 13:55 21:10 Centrifuge and Carnoy’sfixative
1. Conditioned adult oysters were supplied by GSF (Batch no: unknown). Oystersarrived on the day of the test.
2. Oysters were fertilised and grown on in reference seawater (filtered ASW) at 20°C ata density of 6,000 embryos per ml. Three batches of oyster egg suspension wereprepared using different females.
3. Oyster eggs were fertilised at 16:55 (10 minutes behind nominal schedule). Allsubsequent timings are based on time from fertilisation.
4. Oyster embryos were gently resuspended at 30-45 minute intervals and examined forthe presence of polar bodies.
5. Oyster embryos were inoculated into ASW (from oyster 1 and 2) at test density (100embryos/ml) at 19:15 (2 hours 20 minutes post-fertilisation); embryos were at 1–4cells at this stage with ~90–95 per cent fertilisation rate. Ten 250 ml replicates wereprepared (25,000 embryos per replicate).
6. Embryos were then incubated at 20°C in the dark for a further 17 hours until exposedto the test substance.
7. Oyster embryos were exposed to four concentrations of MMS (in ASW) in duplicate:
• 1.0 × 10-3 = 1 mM• 1.0 × 10-4 = 0.1 mM• 1.0 × 10-5 = 0.01 mM
Science Report Development of tools for assessing genotoxicity64
• 1.0 × 10-6 = 0.001 mM
8. Exposure was scheduled to begin at 09:10 until 12:55 (3 hours 45 minutescorresponding to 1.5 cell cycles, as previously calculated by V. Cheung).
9. On the morning of 10 August, 500 ml of each test solution was prepared by serialdilution of the 1 mM test solution (prepared by dissolving 55.065 mg of MMS in 500ml of ASW).
10. Exposure to test solutions began at 9:40 (30 minutes behind schedule due to a delaypreparing the test solutions). As a result, oyster embryos were only exposed to MMSfor 3 hours 15 minutes (~1.3 cell cycles). Exposure took place in 300 ml crystallisingdishes containing ~250 ml of test solution. Test organisms were contained within eachdish by a polypropylene tube with a 30 µm mesh bottom. This tube allowed theoysters to be transferred to the colchicine and hypotonic solutions relatively easily.However, using these tubes resulted in the (physical) density that the oystersexperienced of >100 per ml though the aqueous density remained at 100 per ml.
11. At 20 hours post-fertilisation, the embryos were exposed to colchicine andsubsequent isotonic solutions as per the Plymouth University method. The replicateswere spit into three groups of four replicates, with colchicine and hypotonic timingsbased on these groups. No problems with timings were encountered.
12. Two aliquots of control oysters were allowed to develop at 20°C for an additional 24hours beyond the 20 hours experiment:• one exposed in mesh tubes at a density equivalent to the test (>100 per ml);• one exposed at 100 embryos per ml.
This was to investigate whether:• the oysters would develop into normal D-shaped larvae if given sufficient time;• containment within mesh tubes (at a density >100 per ml) influenced normal
development.
13. Embryos were spun out of suspension and fixed in Carnoy’s. Two speeds were used(5 minutes) – the standard speed of 2,000 rpm used in previous experiments and anincreased speed of 5,000 rpm. One replicate from each test concentration was spunat each speed; the remaining control replicate was spun at the standard speed. Theincreased speed was to counter the embryos swimming up the relatively shortmicrocentrifuge tubes and being discarded with the supernatant. This initialexperiment would investigate if subsequent slide preparation was affected.
14. Slides were prepared and fixed the same week.
Results/learning pointsMMS exposures were delayed as test solutions were not ready when required, resultingin exposure duration <1.5 cell cycles
Ensure that fume cabinets, volumetric flasks and weighing boats are prepared on the daybefore exposures, in order that test solutions can be prepared without delay on the dayof exposure.

Science Report Development of tools for assessing genotoxicity 65
Normal development of oysters after a further 24 hours exposure at 20°C is detailed intable 1 below.
Percentage ‘D-shaped’Development time (hourspost-fertilisation) Exposure
type1 2 3 4
Mesh(SD)
20 Beaker 0 0 0 0 0Beaker 37.0 28.6 28.4 29.6 30.9 (4.1)
24 Mesh tube 5.1 8.7 13.8 9.1 9.18 (3.6)Beaker 56.3 62.0 47.4 39.8 51.38
(9.78)44 Mesh tube 74.0 64.9 61.5 69.9 67.58
(5.50)SD = standard deviation
There are significant differences (P <0.05, see statistical analysis at end of this appendix)between the development of oysters in beakers and those in tubes at both time points. At24 hours, development was better in the beakers but, at 48 hours, development wasbetter in the mesh tubes.
Mesh tubes do not affect the normal development of oysters and, in fact, may improvedevelopment over longer time periods.
Increased centrifuge speed produced better pellets in the microcentrifuge tubes, with thelarvae less likely to swim up into the supernatant.
Slides do not store well in the vertical (as used by current slide boxes). Vertical storageresults in a gradual migration of DPX towards the bottom of the slide, producing avariable thickness of DPX across the slide and associated difficulties focussing onchromosomes.
Investigate alternative storage boxes that store slides on the horizontal rather than thevertical.
Chromosome spreads are of a much better quality than obtained in previousexperiments. On initial inspection, there appeared sufficient numbers of metaphases withcomplete chromosome compliments (20 ± 2) on each slide to allow a proper CAassessment (see table below).

Science Report Development of tools for assessing genotoxicity66
MMS(mM) Replicate Slide
Vernierpositionlabel to
left (X, Y)
Chromosomecompliment
(n)Comments
A 1 750, 1040 15 Incomplete –normal
A 1 750, 1043 20 Complete –normal
A 1 750, 1078 9 Incomplete –normal
A 1 751, 1150 20 Complete –normal
A 1 751, 116 20 Complete –normal
Control
A 1 611, 116 20 Complete –normal
A 1 462, 1092 17 Incomplete –normal
A 1 449, 1092 20 Complete –normal
A 1 445, 1092 19 Complete –normal
A 1 381, 1092 19 Complete –normal
A 1 320, 1092 20 Complete –normal
0.001
A 1 343, 1092 16 Incomplete –normal
A 1 431, 940 20 Complete –normal
A 1 461, 940 20 Complete –normal
A 1 461, 940 16 Incomplete –normal
A 1 362, 940 17 Incomplete –normal
A 1 325, 940 20 Complete –normal
A 1 158, 939 20 Complete –normal
A 1 158, 940 20 Complete –normal
0.01
A 1 150, 9400 13 Incomplete -normal
A 1 432, 940 20 Complete –normal
0.1
A 1 551, 950 20 Complete –normal

Science Report Development of tools for assessing genotoxicity 67
A 1 546, 950 20 Complete –normal
A 1 440, 950 - Aberrant
A 1 551, 946 20 Complete –normal
A 1 551, 946 20 Complete –normal
A 1 551, 946 20 Complete –normal
A 1 551, 946 20 Complete –normal
A 1 209, 951 - Aberrant
A 1 366, 1077 20 Complete -normal
A 1 482, 969 20 Complete –normal
A 1 482, 962 20 Complete –normal
A 1 475, 1065 - Aberrant
1.0
A 1 140, 1112 - Aberrant
There was also some evidence of aberrant cells and CAbs at the highest MMSconcentrations (0.1 and 1 M). However, it was difficult to score chromosomes definitivelyfor aberrations because of their small size.
The only means to improve the magnification of the current high-power light microscopeis to use a magnifying C-mount and view images via the computer. One should beobtained (either a X2 or zooming) in order to allow slides to be scored with accuracy.
No assessment of cytotoxicity has been undertaken to date.
Mitotic index is the simplest means of assessing this. This method should be attemptedas soon as possible, as this can be achieved without the magnification required forscoring chromosomes.

Science Report Development of tools for assessing genotoxicity68
Statistical analysis of oyster development in controls and mesh tubes
Two-sample t-test and confidence interval (CI): A 24-B, A 24-T
Two-sample t-test for A 24-B vs A 24-T
N Mean SD SEMA 24-n 4 0.3144 0.0434 0.022A 24-t 4 0.0919 0.0359 0.018
Difference = µA 24-B –µA 24-T
Estimate for difference: 0.2225
95 per cent CI for difference: (0.1500, 0.2949)
t-test of difference = 0 (vs not =): t = 7.90; P = 0.001 (DF = 5)
Two-sample t-test and CI: A 44-B, A 44-T
Two-sample t-test for A 44-B vs A 44-T
N Mean SD SEMA 44-n 4 0.542 0.114 0.057A 44-t 4 0.7439 0.0751 0.038
Difference = µA 44-B – µA 44-T
Estimate for difference: –0.2015
95 per cent CI for difference: (–0.3771, –0.0258)
t-test of difference = 0 (vs not =): t = –2.95; P = 0.032 (DF = 5)

Science Report Development of tools for assessing genotoxicity 69
We are The Environment Agency. It's our job to look after yourenvironment and make it a better place – for you, and for futuregenerations.
Your environment is the air you breathe, the water you drink andthe ground you walk on. Working with business, Government andsociety as a whole, we are making your environment cleaner andhealthier.
The Environment Agency. Out there, making your environment abetter place.
Published by:
Environment AgencyRio HouseWaterside Drive, Aztec WestAlmondsbury, Bristol BS32 4UDTel: 0870 8506506Email: [email protected]
© Environment Agency
All rights reserved. This document may be reproduced withprior permission of the Environment Agency.