development of test protocols for international space ... of test protocols for international space...
TRANSCRIPT

44th International Conference on Environmental Systems ICES-2014-216 13-17 July 2014, Tucson, Arizona
Development of test protocols for International Space Station particulate filters
Robert D. Green1 NASA Glenn Research Center, Cleveland, OH, 44135
R. Vijayakumar.2 Aerfil Corp., Liverpool, NY,
and
Juan H. Agui3 NASA Glenn Research Center, Cleveland, OH, 44135
Air quality control on the International Space Station (ISS) is a vital requirement for maintaining a clean environment for the crew and the hardware. This becomes a serious challenge in pressurized space compartments since no outside air ventilation is possible, and a larger particulate load is imposed on the filtration system due to lack of gravitational settling . The ISS Environmental Control and Life Support System (ECLSS) uses a filtration system that has been in use for over 14 years and has proven to meet this challenge. The heart of this system is a traditional High-Efficiency Particulate Air (HEPA) filter configured to interface with the rest of the life support elements and provide effective cabin filtration. Over the years, the service life of these filters has been re-evaluated based on limited post-flight tests of returned filters and risk factors. On earth, a well designed and installed HEPA filter will last for several years, e.g. in industrial and research clean room applications. Test methods for evaluating these filters are being developed on the basis of established test protocols used by the industry and the military. This paper will discuss the test methods adopted and test results on prototypes of the ISS filters. The results will assist in establishing whether the service life can be extended for these filters. Results from unused filters that have been in storage will also be presented to ascertain the shelf life and performance deterioration, if any and determine if the shelf life may be extended.
Nomenclature C = power law coefficients for porous zone momentum source term S = porous source momentum source term v = velocity i = directional tensor index α = permeability of porous medium ρ = density of fluid (air) µ = viscosity
I. Introduction he ISS filters are bacterial filter elements (BFE) and contain pleated borosilicate HEPA media in a rectangular
aluminum frame (outside dimensions of 29” x 4”x 4.375”). The HEPA media is covered with a Nomex screen at the inlet and an aluminum mesh screen at the outlet. The BFEs were fabricated by Flanders Corp. under a subcontract to Hamilton Sundstrand (HS), who supplied them to the ISS Program. There are a total of 21 of these filters used in 1 Project Scientist, Fluid Physics and Transport Branch, 21000 Brookpark Rd, MS 77-5. 2 President, Aerfil, Liverpool, N.Y. 3 Aerospace Engineer, Fluid Physics and Transport Branch, 21000 Brookpark Rd, MS 77-5.
T
https://ntrs.nasa.gov/search.jsp?R=20140017054 2018-05-29T08:03:26+00:00Z

International Conference on Environmental Systems
2
the US segment of the ISS; the JEM and ESA Columbus modules also use HEPA-rated filters but of a different design. The BFE filters were originally specified for a 1 year replacement but a testing and analysis study indicated the lifetime could be extended to 2 years [1]. Presently, the BFE replacement intervals are based on location. Lab/Node 2/Node 3 BFEs are replaced at 2.5 years, airlock BFEs are replaced at 2 years, Node 1 BFEs are replaced at 5 years [2]. The present inventory of ISS HEPA filters stored on the ground in environmentally controlled conditions is nearing the 10 year shelf/age life recommended by the filter manufacturer. Extending the shelf life is a concern, as deterioration of the resin binder in the media, oxidation or loss of volatile constituents in the sealing adhesive, and crystallization of the glass fiber media are potential failure mechanisms for stored filters [3]. In addition, the service life of the ISS filters may be impacted by the frequent vacuuming of the inlets of installed filters to remove the large particle loading due to the microgravity environment and resulting lack of large particulate gravitational settling. Post-flight leak testing of returned filter units may need to be performed to assess any degradation due to vacuuming of the filter surface.
Filters were supplied by the contractor, Hamilton Sundstrand (now United Technologies Aerospace Systems, UTAS), in two phases: 1997 thru 1999 and 2003 thru 2004. In October 2012, the BFE inventory included 47 units that had exceeded the 10-year “use life” (where use life is defined as in-service life + shelf life) and 54 units that would exceed the 10-year “use life” in 2013/2014. Testing was conducted in 2012 on 7 BFEs that were taken out of controlled storage and indicated performance was still the same as the original acceptance testing for media tensile strength, 0.3-micron particle removal efficiency, random vibration, pressure drop, and proof pressure. A decision was made in early 2013 to go forward with an extension plan developed by Boeing/THC Systems, namely to increase the use life from 10 years to 22 years. Hamilton Sundstrand recommends that any extension in the filter storage not be based on analysis only, and therefore proposes filter testing as part of any process to increase shelf life. Thus, a test method/protocol for testing ISS filters is necessary to provides higher confidence in extending the use life of present BFE stock, or provide acceptance criteria for procurement of additional BFE stock.
In January 2014, it was announced at the Heads of Space Agencies Summit on Exploration, that the ISS vehicle design life has been extended from 2020 to 2024 [4], and the ISS partners have discussed the potential of certifying ISS for use through 2028. This extension of the ISS design life further exemplifies the need to address the ISS BFE inventory issue to accommodate an extra 4 years or more of ISS operation. In this work, we provide a preliminary test methodology for leak testing to evaluate shelf life of the ISS bacterial filters, including demonstration of the protocol, and discussion of preliminary data on a prototype filter unit.
II. Experimental Test Methods
A. Discussion of Standards The filter industry has developed a comprehensive set of filter testing standards for certifying HEPA filters. Hi-
efficiency filtration became of interest to the military, after World War 1, in order to protect troops from poisoned gas attacks [5]. The Mil-Standard 282 [6] is the first HEPA filter standard developed based on a thermally generated Di(2-Ethylhexyl) Phthalate (DOP) smoke cloud as the challenge aerosol. Even though it was initially thought this challenge aerosol consisted of monodisperse 0.3 micron droplets [7], later measurements determined it to be a poly-disperse aerosol with mean diameter of 0.23 microns [8]. Mil-Std 282, the initial version issued in 1952 with a last update in 1956, has become the industry standard [5]. Mil-Std 282 specifies the aerosol particle size indirectly by measurement of degree of polarization of a scattered light beam, with a polarization angle of 29° corresponding to a particle distribution meeting the standard. Filter testing equipment manufacturers have since developed aerosol generators using both “cold” and “hot” methods that generate identical distributions using DOP and the alternative oils, Di(2-Ethylhexyl) Sebacate (DOS) and Poly-Alpha Olefin (PAO).
Subsequent standards have been developed by industry to further define filter testing standards for the broader range of HEPA applications. We will briefly discuss here those applicabile to our proposed ISS BFE filter testing. The Institute of Environmental Sciences and Technology’s IEST-RP-CC001.5 specification [9] is an overall standard describing the types of HEPA filters (Types A thru K) and construction materials and requirements, but also describes the performance requirements (e.g. filter resistance or pressure drop) and need to perform both efficiency and leak test as part of penetration testing. The IEST-RP-CC034.3 specification [10] discusses the HEPA leak testing, in particular, the choices of tests, aerosol oils, and recommended test procedures and scan test methods, uniformity of the challenge aerosol, and guide for aerosol particle detector which is dependent on filter type. The IEST-RP-CC007.2 [11] provides similar test methodology for Ultra Low Penetration Air (ULPA) filters, not the subject of this paper, but does provide the component breakdown of typical filter test systems and appropriate

International Conference on Environmental Systems
3
recommendations. Finally, ASHRAE 52.2-20 [12] is a test method standard for the broader air filter application area, and not just restricted to HEPA and ULPA filters; applicable to our application are the requirements for air velocity and aerosol distribution uniformity of the test measurement system.
The following sections discuss our implementation of the relevant portions of these standards to apply to our ISS BFE specific application.
A challenge aerosol produced from either Di (2-Ethylhexyl) Sebacate (DOS), Di(2-Ethylhexyl) Phthalate (DOP), or Poly-Alpha Olefin (PAO) is injected upstream of the filter system and allowed to mix with the airstream. Due to environmental and occupational safety concerns with DOP [9], we have chosen to utilize PAO in all proposed ISS filter leak testing. Using a Laskin nozzle aerosol generator at the prescribed pressure to produce an injection of challenge aerosols with a tighly controlled particle size distribution, samples of the aerosol are measured from the airstream through probes, both upstream and downstream.
B. Test article: The ISS filters are bacterial filter elements (BFE) and contain pleated borosilicate HEPA media in a rectangular
aluminum frame with outside dimensions of 73.7 cm x 10.2 cm x 11.1 cm (29 in. x 4 in. x 4.375 in.); an image of this filter is in Figure 1. The HEPA media is covered with a Nomex screen at the inlet and an aluminum mesh screen at the outlet. Each filter has a metal stamped label on one side of the aluminum frame, as shown in Figure 2, with the serial number, measured penetration (= 1 – capturing efficiency) rating, volumetric flow for efficiency test, and pleated HEPA media lot.
The efficiency requirement for the ISS bacterial HEPA filter is 99.9% efficiency at 0.3 microns at a volumetric flow rate of 1980 liters/min (70 cfm) [13]. This specification is not a standard HEPA efficiency specification but likely utilizes HEPA filter Type C media to meet this requirement [9].
C. Design of Test Duct The design of the test setup required significant planning due the unconventional geometry of the ISS Bacterial
Filter. A picture of a bacterial filter engineering unit (i.e. a flight-like prototype that was not flown) is shown in Figure 3. The large width and large aspect ratio of the filter surface complicated the design of an entrance duct to provide the flow uniformity and characteristics required for efficiency and leak testing, without resorting to the use of very large duct sections. For example, a large blower matching the long dimension of the filter unit would require very large ducting with lengths of ducts of the order of the several times the lateral dimensions of the blower, followed by reducers and flow restrictors to interface with the rectangular area of the filter and match its lower flow rating. With these constraints in mind, the design phase was driven by the objective to develop a functional but compact duct geometry with associated components and features that would provide well-dispersed particle flow upstream of the inlet face of the filter. Another goal was to make the test stand portable so that it can be feasibly transported and make it accessible to different parties within the agency (and outside) for the purpose of testing relevant filters. Initial guidance in the design of the test duct was provided by the industrial standards discussed in the preceding section. Additionally, during the pre-design stage some modeling was performed in order to gain insight into the flow behavior of different flow configuration concepts. Computation Fluid Dynamics (CFD) modeling was used to assess the steady-state internal flow field. Three-dimensional computational grids with 1 cm nominal tetrahedral element size were used with the standard κ-ε (kinetic energy and dissipation) turbulence model for the main flow field. The flow from the blower was a prescribed velocity inlet condition, while the exhaust flow from the filter was a pressure boundary condition at the outlet at ambient pressure. The filter was modeled as a porous zone given by equation 1 for a source term in the momentum equation that is dependent on viscous and inertial losses through the porous medium [14].
���
��� � iii vvCvS ��
221 (1)
Where μ is the molecular viscosity of the fluid, α is the permeability of the porous medium, C2 is the inertial resistance factor, v is the velocity component, and the subscript i corresponds to the directional component in three dimensions. This relation is applicable to perforated plates, screens, and porous media such fibrous media. With a

International Conference on Environmental Systems
4
lack of known properties for the porous medium (the fibrous HEPA filter), equation 1 can be represented by a simple function of flow velocity from empirical testing of the filter media as given by Reference 14.
� �i
Ci vvCS 1
01 (2)
Note that a simple parametric pressure-flow test is required to arrive at the two power-law coefficients in the filter flow-through (or filter-normal) direction.
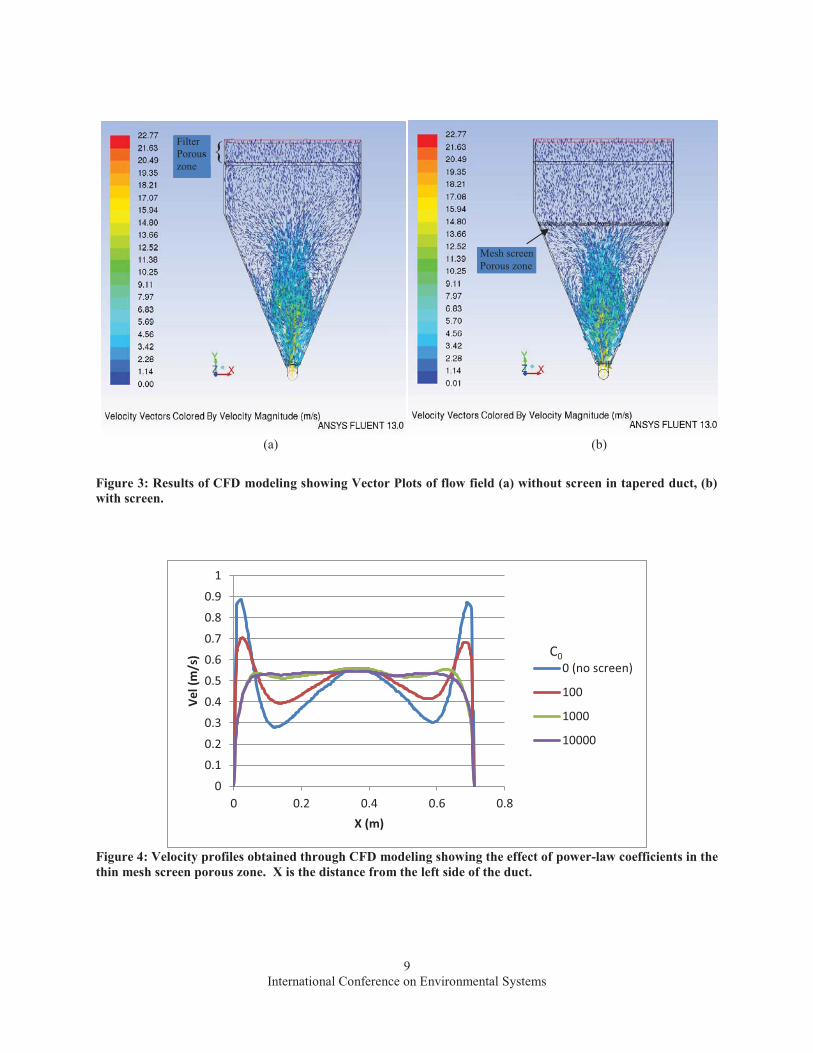
It became apparent from this analysis that in order to interface reasonable (non-industrial) size duct components to the large aspect ratio of the filter surface some level of flow curvature would be unavoidable. Therefore a key aspect of the design was to minimize or mitigate the flow curvature. Also another important aspect to consider in the design was that leak testing requires that the test duct be operated in blow down mode with the filter at the end of the duct to allow for the scanning of the back face of the filter element. It was determined that the optimal configuration, which was subsequently adopted, was one in which the flow is expanded through a tapered duct section from the outlet dimensions of a small blower to the filter width. In this case, the incoming flow is required to spread laterally quickly in order to properly mix the aerosol throughout the growing width of the tapered duct. A 3x3 wire mesh screen was also added near the end of the tapered section to break up any flow curvature and further enhance mixing, followed by a straight section to further develop and mix the flow. The screen was also modeled with CFD as a porous zone in the flow field using viscous and inertial losses, as prescribed by the same equation used for the filter. The results of this model clearly show that the screen had a disruptive effect on flow recirculation. Figure 3 compares vector plots of the flow field with and without the introduction of the porous zone which simulates the wire mesh screen at the mouth of the tapered section. As strong secondary flow region is quite evident in the flow without the screen in Fig. 3a. This is a consequence of the dual effect of flow expansion through the tapered section and the flow resistance from the filter at the top of the duct - which has a tendency to lead to flow recirculation. The second vector plot in Fig. 3b shows that the secondary flow is significantly suppressed when the porous zone is incorporated. Figure 4 gives associated velocity profiles in the region above the tapered duct and before the filter. The profile in the absence of the wire screen, shows high velocities in the center flow accompanied by velocity depressions just to the sides of the central flow, and then very high velocity shear layers in the near wall regions. When the porous zone is imposed the velocity profile tends to flatten out, with significant suppression of the near wall shear layers, with increasing porous zone resistance. Therefore, the modeling strongly suggests the use of the wire mesh screen to reduce secondary flow effects and provide a more uniform velocity profile approaching the filter.
It was also decided that the test duct should be oriented in an upright configuration. An upright duct configuration with the filter at about chest height has an ergonomic benefit and mitigates the settling, or associated stratification, of the aerosols on the duct walls that would be produced by a horizontal duct configuration.
D. Hardware Description A schematic of the final test setup is shown in Figure 5. The test duct is the main central hardware of the test
stand. The flow is provided by a centrifugal blower at the inlet of the test duct located at the bottom. The main flow (as indicated by the large arrow) is from the bottom to the top of the duct sections. A honeycomb flow straightener, discussed later, is positioned directly at the blower outlet. The flow is expanded through the tapered duct section. A 3x3 open area (i.e. 3 square mesh openings per inch) stainless steel wire mesh screen located near the top of the tapered section is used to disrupt the potential flow recirculation, specifically in the flow between the screen and the filter station. The filter is stationed at the top end of the duct sections with the inlet filter surface facing down into the flow. A commercial Laskin Nozzle aerosol generator as specified by the IEST-RP-CC034.3 standard [10] is used to introduce the aerosol flow at the start of the flow expansion. As mentioned earlier, polyalphaolefin (PAO) reagent is used with one Laskin nozzle activated to produce low toxicity aerosol dispersion with a median particle size of 245 nm and a geometric standard deviation of 1.65. The aerosol generator produces much more than is required for the smaller non-industrial sized duct geometry, so a by-pass line was use to limit the amount of aerosol in the supply line to the test duct (recommended in Ref. 9). The expanding flow in the tapered section helps to redistribute the aerosol as it is transported further downstream. Above the filter outlet, essentially the exhaust of the test duct, an exhaust vent hood is used to vent any of the aerosols that leak out or penetrate through the filter. The by-pass aerosol flow is also vented out through this hood. A commercial aerosol photometer is used to measure the leakage of aerosols through the filter. A small level of penetration (less than one percent) is expected through the filter element consistent with its characteristic particle penetration specification. Any large or peak measurements are indicative of leak points or regions around the filter

International Conference on Environmental Systems
5
element with compromised bonding material. To check and locate leaks, a hand-held scanner nozzle connected to the inlet of the photometer is used to traverse the whole surface of the filter. The upper straight duct section is removed to access the back face of the filter for the scanning operation. A scanning protocol, discussed later, was established to ensure inspection of the complete filter surface. A picture of the assembled test duct mounted on a rolling cart together with a picture of the photometer is shown if Figure 6. The ISS bacterial filter is mounted on the first straight duct section of the test duct, while the second straight section is not included in the pictured setup.
E. Flow Quality and Aerosol UniformityAssessment Before the duct sections were assembled for the final test configuration, velocity surveys were conducted at the
open end of the tapered duct section. During this assessment it was discovered that flow skewness or deviation from the centerline was being produced by the centrifugal blower inside the duct sections. Consequently, a honeycomb panel with fine hexagonal openings was introduced immediately after the outlet of the blower to redirect the flow. After some initial flow tests, the flow straightener was positioned in an optimal position and orientation to better center the incoming velocity profile.
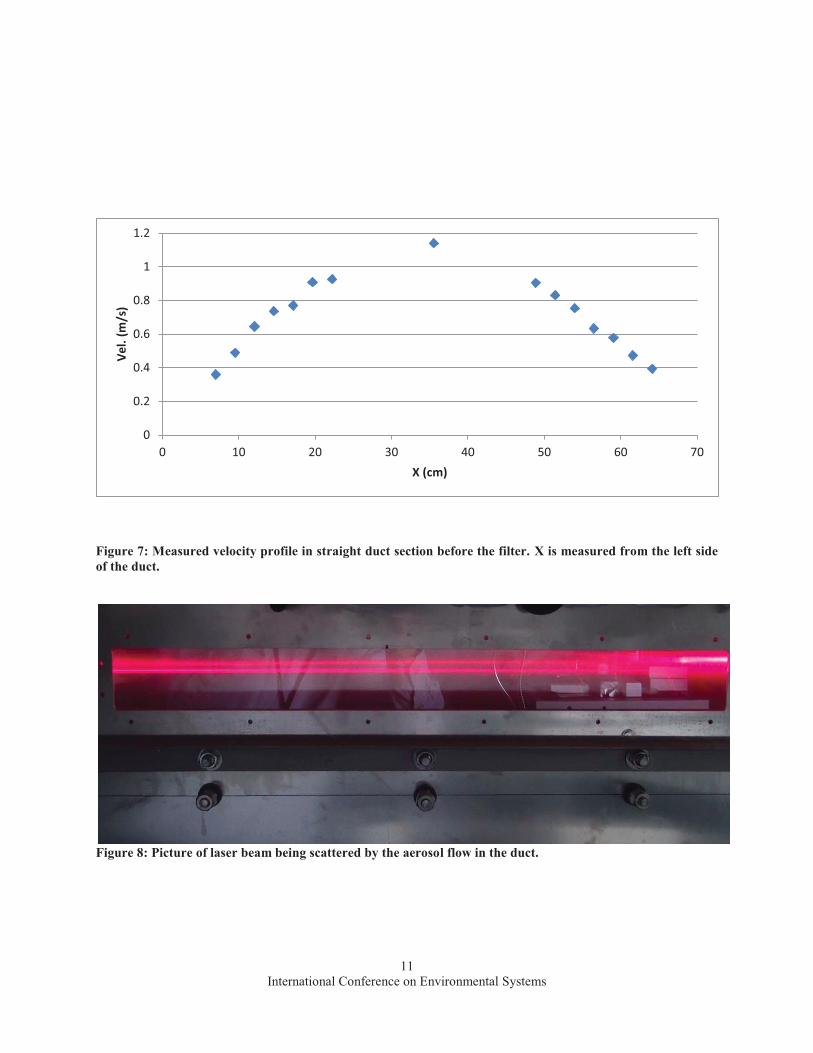
Figure 7 shows a velocity profile taken after final assembly with a hot-wired based velocity probe through ports just upstream of the filter. The profile is symmetric and parabolic in nature and does not show any inflection points that may indicate secondary flow effects. The level of aerosol spreading throughout the width of the duct was initially checked by imaging the light scattering off an incident laser beam across the duct cross section. Figure 8 show an image taken with a laser beam transmitted from a side window on the duct and imaged through the long window on the front of the duct. The fact that the laser beam is seen throughout the cross section of uniform intensity and without any gaps is a good indication that the aerosols have spread effectively throughout the duct volume. Therefore, the flow appears to have spread and mixed sufficiently for leak testing.Later, we characterized the aerosol concentration uniformity more extensively by measuring the aerosol concentration with the aerosol photometer at 15 separate locations over the cross-section of the filter; the largest variance from the “reference” concentration (measured at center) was 10% at the wall of the short dimension; this is within the 15% specified by Reference 12.
The flow uniformity obtained with this test duct setup is sufficient for filter leak testing, the main objective of this work. For the purpose of filter penetration or efficiency tests, better flow uniformity will need to be achieved. For future work, this can be accomplished through longer straight sections and better performing flow conditioners and straighteners.
III. Results In our development of a testing methodology for the BFE, we tested 2 different specimens. BFE filter #1 in this
study is a specimen returned from ISS after approximately one year of installed operation; this particular specimen underwent destructive evaluation of the pleated media and protective screen, and as such, a number of compromised areas were clearly visible (see Figure 9). BFE filter #2 was utilized for ground-based engineering development testing and appeared in nearly pristine condition with no visible signs of use.
Leak testing of BFE filter #1 To perform the leak testing for filter #1, we performed a slow scan with the photometer by slowly sweeping (2
cm/sec) the handheld probe down the long dimension of the filter, covering approximately one half the cross section, then sweeping the remainder of the cross-section in the reverse direction; this technique is the common practice in industry. During the sweep, we typically observed penetration readings in the 0.5-2.0% except for spikes up to 20-45% when the probe encountered known damaged sections. We repeated the scan, but this time, interrupted the scan when the photometer reading spiked, to simulate discovery of a leak. We held the probe stationary over the section, approximately 12 mm (½ in.) from the filter media surface and recorded the reading. Table 1 contains the readings we measured along the longest length of the filter, where the left hand edge is the zero position. These readings correspond well with the known visibly damaged sections which are marked with red circles in Figure 9; the peak reading indicated 40-50% leakage. We did observe low or zero penetration readings for several visibly damaged sections (circled but not numbered) in Figure 9, likely due to these areas being patched with cellophane tape to prevent further fraying of the filter media. We also noted a much higher reading at the left hand edge (zero

International Conference on Environmental Systems
6
position) of the filter. This is not a known damaged section and, indicates possible leakage where the filter media is bonded to the frame on the left hand edge.
All in all, this testing shows the capability to locate leak paths in a filter, and the aerosol photometer is sensitive enough to easily detect and specifically locate worn or damaged sections of an ISS BFE.
Leak testing of BFE filter #2 For this particular BFE, we performed two scan tests, one test was an “out and back” scan with the photometer
probe placed over approximately one half of the narrow dimension of the BFE. The probe head was wide enough to overlap the out and back scans. In this test, the efficiency values measured in the 3rd decimal range but portions of the scan resulted in values as high as 0.1-0.2%. Possible reasons include picking up ambient particulates in the lab atmosphere or leakage past the seal where the filter is mounted to the test duct section.
In the second test, we performed a scan down the center of the BFE, again along the narrow dimension, where the probe head was not wide enough to scan the edges of the BFE. In addition, the probe was held close to the filter media, less than 12 mm from the media pleats. The results were significantly lower (<0.001) with only a few incidental readings in the 0.01 range.
IV. Conclusion Presently, the inventory of ISS bacterial filters for the ISS Air Revitalization System are nearing the end of their
specified shelf life, and a means of testing to confirm whether the shelf life can be extended is of interest to the ISS Program. A filter test setup was designed and built to meet industry testing standards. A CFD analysis was performed to initially determine the optimal duct geometry and flow configuration. Both a screen and flow straighter were added to the test duct design to improve flow uniformity and face velocity profiles were subsequently measured to confirm. Flow quality and aerosol mixing assessments show that the duct flow is satisfactory for the intended leak testing. Preliminary leak testing was performed on two different ISS filters, one with known perforations and one with limited use, and results confirmed that the testing methods and photometer instrument are sensitive enough to detect and locate compromised sections of an ISS BFE.
This work is focused on developing test protocols for testing the ISS BFE filters, but the methodology is general enough to be extended to other present and future spacecraft filters, These techniques for characterizing the test duct and perform leak testing can be applied to conducting acceptance testing and inventory testing for future manned exploration programs with air revitalization filtration needs, possibly even for in-situ filter element integrity testing for extensively long-duration missions. We plan to address the unique needs for test protocols for crewed spacecraft particulate filters by preparing the initial version of a standard, to be documented as a NASA Techmical Memorandum (TM), that can potentially be submitted to IEST and ASHRAE for consideration as a new standard for spacecraft applications.
Acknowledgments This work was funded by the Advance Exploration System’s Air Resource Recovery and Environmental
Monitoring Project (ARREM) and is gratefully acknowledged. We also would like to thank Conner Zipfel. (NASA GRC summer intern, Univ. of Maryland) for performing the aerosol uniformity measurements.
References
1. J. L. Perry, “International Space Station Bacteria Filter Element Service Life Evaluation”, NASA TM 2005-213846, (2005). 2. J. L. Perry, e-mail dated 03/26/2014. 3. M.W. First, “Aging of HEPA Filters in Service and in Storage”, Journal of the American Biological Safety Association, 1(1),
1996. 4. http://www.whitehouse.gov/blog/2014/01/08/obama-administration-extends-international-space-station-until-least-2024. [last
accessed on 03/04/2014]. 5. M. E. Pierce, “Comparison of Filtration Efficiency Measurements between TSI Model 8160, TSI Model 3140, and ATI 100P
Filter Test Stands”, International Society for Nuclear Air Treatment Technologies (ISNATT), 29th Nuclear Air Cleaning and Treatment Conference, Cincinnati, Ohio, July 17-19, 2006.
6. MIL-STD-282-1956, “Department of Defense Test Method Standard: Filter Units, Protective Clothing, Gas-Mask Components and Related Products: Performance Test Methods”, 1956 .

International Conference on Environmental Systems
7
7. V.K. LaMer, D. Sinclair, “Portable Optical Instrument for the Measure of Particle Size in Smokes, the ‘OWL’, an Improved Homogeneous Aerosol Generator”, OSRD 1668, Office of Technical Services, Springfield, VA, August 1943.
8. W. Hinds, M. First, D. Gibson, and D. Leith, “Size Distribution of ‘Hot DOP’ Aerosol Produced by ATI Q-127 Aerosol Generator”, Proceedings of the 15th Nuclear Air Cleaning Conference, Boston, MA, August 7-10, 1978.
9. IEST-RP-CC001.5, “HEPA and ULPA Filters”, Institute of Environmental Sciences and Technology, Arlington Heights, IL, 2009.
10. IEST-RP-CC034.3, “HEPA and ULPA Filter Leak Tests”, Institute of Environmental Sciences and Technology, Arlington Heights, IL, 2009.
11. IEST-RP-CC007.2, “Testing ULPA Filters”, Institute of Environmental Sciences and Technology, Arlington Heights, IL, 2007.
12. ASHRAE Standard 52.2-20, “Method of Testing General Ventilation Air-Cleaning Devices for Removal Efficiency by Particle Size”, American Society of Heating, Refrigerating and Air-Conditioning Engineers, Atlanta, GA, 2012.
13. V. Margiott, “Summary of Test Results of the Bacteria Filter and Prefilter Screen Testing”, Hamilton Sundstrand internal memorandum, June 16, 1992.
14. “ANSYS Fluent User’s Guide,” Release 15.0, ANSYS, Inc.

International Conference on Environmental Systems
8
Figure 1: Top view of ISS Bacterial Filter Element (BFE) in shipping case. Nomex screen has been removed to view pleated HEPA media.
Figure 2: Example of identification plate mounted on each BFE aluminum frame providing serial number, measured results of flow and efficiency testing, and HEPA media lot number.
International Conference on Environmental Systems
9
Figure 4: Velocity profiles obtained through CFD modeling showing the effect of power-law coefficients in the thin mesh screen porous zone. X is the distance from the left side of the duct.
0
0.1
0.2
0.3
0.4
0.5
0.6
0.7
0.8
0.9
1
0 0.2 0.4 0.6 0.8
Vel (
m/s
)
X (m)
0 (no screen)
100
1000
10000
C0
Mesh screen Porous zone
Filter Porous zone
s {
(a) (b)
Figure 3: Results of CFD modeling showing Vector Plots of flow field (a) without screen in tapered duct, (b) with screen.

International Conference on Environmental Systems
10
Figure 6: Test setup hardware (a) test duct stand and (b) aerosol photometer
(a)
(b)
Pressurized air
Aerosol photometer
Vent Hood
scanner
Location of honeycomb flow straightener
Location of screen
Figure 5: Test setup schematic (large blue arrows indicates main flow direction, green arrows for aerosol source flow, and red arrows for sampling flows to the photometer).
International Conference on Environmental Systems
11
Figure 7: Measured velocity profile in straight duct section before the filter. X is measured from the left side of the duct.
Figure 8: Picture of laser beam being scattered by the aerosol flow in the duct.
0
0.2
0.4
0.6
0.8
1
1.2
0 10 20 30 40 50 60 70
Vel.
(m/s
)
X (cm)

International Conference on Environmental Systems
12
Figure 9: (a) Outlet view and (b) Inlet view of destructively tested BFE. Red circled areas indicate destructively tested points where pleated media and cover screen has been compromised, and are numbered corresponding to locations in Table 1.
Table 1. Measured penetration data for BFE units taken with the aerosol photometer.
Test point Location (in cm from LHS) Measured penetration (%)
1 0 (left edge) 18-20% 2 5 0.0018-0.0021 3 10 0.0008 4 16.8 55.0, 52.4 5 20.3 0.64-0.66 6 28 6.80-7.00 7 34.3 19.0-23.9 8 36.5 47.9-48.5 9 45.7 0.0000 10 58.4 0.0000 11 73.7 (right edge) 0.54, 0.82, 0.93
(a)
(b)
1
8
10 11
2 3
4
5 7
11
6
9