development of simple correlation to evaluate … = estimated value of y when x = 0 b = regression...
TRANSCRIPT

International Journal of Science and Research (IJSR) ISSN (Online): 2319-7064
Index Copernicus Value (2013): 6.14 | Impact Factor (2013): 4.438
Volume 4 Issue 4, April 2015
www.ijsr.net Licensed Under Creative Commons Attribution CC BY
Development of Simple Correlation to Evaluate
Formation Volume Factor for Nigerian Crude Oil
Nkemakolam Chinedu Izuwa1, Obidiegwu Martins Uzodinma
2
1Department of Petroleum Engineering,
2Department of Polymer and Textile Engineering, Federal University of Technology, Owerri
Abstract: Accurate reservoir fluid characterization is vital to understanding the flow behavior in the reservoir and proper
quantification of reservoir productivity. This study developed a correlation for formation volume factor for Niger Delta crude oil and
evaluated the necessity of using locally developed correlation in evaluation of the formation volume factor (Bo). Reservoir fluid data
collected from Niger Delta were used to develop correlation for Bo. The result from the model was used to match Laboratory PVT
derived Bo and also compared it with existing universal models. The new model had better prediction of Bo. The new correlation can be
used for a quick prediction of Bo in the absence of laboratory PVT data.
Keywords: formation volume factor, correlation, crude oil, least square, regression
1. Introduction
In the absence of laboratory measured Pressure – Volume –
Temperature (PVT) data, property correlation can be used
for material balance calculations ranging from simple
estimation to detailed studies of reservoir performance. The
empirical relationships of reservoir fluid properties like
bubble point pressure (Pb), solution gas oil ratio (Rs), fluid
formation volume factor (FVF), and viscosity can be used to
predict the laboratory data.
Correlation of physical properties of a system implies
finding a relationship between the parameter of the given
system. In PVT property correlation, effort is made to find
the relationship which exists between the physical properties
of crude oil. The empirical analysis involves predicting the
unknown parameter s from the known ones. Physical
properties of crude oil such as the reservoir temperature, API
gravity, reservoir pressure, gas gravity and molecular weight
of stock tank oil can be used through correlations to predict
other PVT parameters like solution gas-oil ratio (Rs),
viscosity (𝜇𝑂 ), formation volume factor (FVF) and bubble
point pressure (Pb).Therefore PVT correlations are those
empirical relationships or expressions for Pb, Rs, 𝜇𝑜 , Bo
and Bg.
Among the PVT correlations currently in use in the
petroleum industry, Standing (1947) enjoys the widest
popularity. He developed correlations for formation volume
factor, formation pressure , bubble point pressure Pb and
solution gas- oil ratio using Californian crude oil and gas
systems. Lasater (1958) published correlation on bubble
point pressure developed from 158 experimental data points.
The correlation works best in temperature range of 1000F –
2580F and pressure range of 130 – 7000Psi the correlation
was presented in graphical and empirical forms. Cronquist
(1973) worked on Gulf coast reservoir and developed a
dimensionless PVT correlation. Vazquez et al (1980)
developed empirical equations for solution gas oil ratio,
formation volume factor for oil at various pressures and
temperature.
Obomanu and Okpobori (1987) in their work developed a
correlation for oil formation volume factor and solution gas
oil ratio for Nigerian crude oil. Mohmond et al (1992) used
regression analysis to obtain correlation for bubble point
pressure and the oil formation volume factor for United
Arab Emirates crude oil. Although standings correlation has
gained popularity in petroleum industry, local correlations
compete favorably. Generalized correlation claims to have
general applicability, this might not be true because of the
effect of the composition, parafinicity, and non-hydrocarbon
oil behavior on crude oil. This work applied multiple
regression analysis which uses the least square method to
develop correlation for crude oil formation volume factor for
crude oil with API gravity in the range of 150 – 35
0. It can
predict B0 for live crude oil.
PVT Parameters obtained in the laboratory after rigorous
detailed and rather expensive PVT laboratory analysis could
be readily predicted quickly and within acceptable accuracy
with the help of empirical equations. Correlations can be
used to predict PVT data when no fluid samples are
available especially during the early life of the reservoir.
Therefore, in absence of laboratory test, need has always
arisen to have fairly accurate correlations of reservoir fluid
properties for field measurements. Correlations can also be
used in place of PVT laboratory analysis when fluid samples
are absent, lab analysis is too expensive and when there are
failures associated with the laboratory works.
2. PVT Properties and Oil Recovery
Pressure-Volume-Temperature (PVT) analysis data for
petroleum reservoir fluids is routinely applied in the
petroleum industry to obtain the following;
Estimate of initial reservoir fluid in place and also the
estimate of recoverable reserve using material balance
equation.
Prediction of past and future reservoir performance
analysis
Design of enhanced oil and gas recovery schemes.
Evaluation of strength of water drive
Paper ID: SUB153297 1821

International Journal of Science and Research (IJSR) ISSN (Online): 2319-7064
Index Copernicus Value (2013): 6.14 | Impact Factor (2013): 4.438
Volume 4 Issue 4, April 2015
www.ijsr.net Licensed Under Creative Commons Attribution CC BY
The formation volume factor of a hydrocarbon is very much
related to the volumetric behavior of the reservoir fluid. The
volumetric behavior must be determined as a function of
pressure and temperature in the laboratory or using
correlation. The accuracy with which the pressure volume
parameters, compressibility factor and thermal expansion
coefficient values may be determined is solely a function of
the accuracy of the measuring devices employed.
CHARACTERISTICS OF CRUDE OIL
Crude oils from Nigeria are generally classified into three
groups depending on its API gravity. They are
Blend crudes; have API gravity lying between 26 o and
350.
Light crudes: have API gravity of 35o and above.
Medium crudes: these crudes are very heavy with API
gravity between 15 to 26o.
Nigerian crude oil have very low non-hydrocarbon content,
with nitrogen-carbon dioxide ratio content usually below 1%
and sulphur content hardly exceeding 0.5%. Table 1 shows
typical mole composition of various Nigerian crudes.
Table 1: Mole Composition of Reservoir Fluids WELL 1 WELL 2 WELL 3 WELL 4 WELL 5 WELL 6
Components Mol % Mol % Mol % Mol % Mol % Mol %
N2 0.14 0.04 0.19 0.07 0.21 0.10
CO2 0.07 0.18 0.13 0.62 0.38 0.43
C1 5.98 34.22 34.1 44.31 37.49 54.52
C2 0.21 1.46 0.84 2.94 0.36 5.03
C3 0.59 0.51 0.20 2.55 3.60 6.65
i C4 0.63 0.42 0.04 1.04 0.97 2.28
n C4 0.27 1.30 0.06 1.22 1.97 4.35
I C5 0.65 1.10 0.02 0.55 1.05 2.27
n-C5 0.39 0.91 0.02 0.55 1.00 2.08
C6 1.44 3.10 0.06 1.45 1.82 2.87
C7+ 89.63 56.76 64.33 44.70 48.70 19.42
Total 100% 100% 100% 100% 100% 100%
M. Wt of fluid 386.1 154.4 175.4 119.1 124.9 60.4
M. Wt. of C7+ 425.8 252.0 263.2 238.0 231.1 193.1
API 15.8 18.4 23.6 28 5 31 9 40.5
The Approach Used
The approach used for the correlation of reservoir volume
factor for crude oil was based on multiple regression
analysis
3. Regression Analysis
Regression analysis used the concept of dependent and
independent variables to express relationship between the
system parameters. This could be explained using two
forms; simple linear regression and multiple regressions.
Simple Linear Regression: Two variables are used to explain
the relationship between a dependent and independent
variables. The aim is to determine the dependent variable.
Let Y be the dependent variable and X independent variable.
To predict the values of Y based on the values of X, the least
square method is used. This mathematical method is
designed to produce the best fitting straight line based on the
fact that it minimizes the squared sum of the residuals (i.e.
the squares of the vertical deviations as of the vertical
deviations about the line).
The equation:
Y = A+BX (1)
Where
Y = average predicted value
A = estimated value of Y when X = 0
B = regression coefficient of X
X = any value of independent variable
It is assumed that those variables are linearly related. Least
square approach tries to estimate the constant A and B using
the criterion.
where n = number of observation.
The criterion satisfied by least square fit is
∑(residual)2 =∑
ni=1(Y-Yc)i
2 (4)
Is a minimum value
Y and Yc are observed and calculated values respectively.
Multiple Regression: In this regression, the dependent
variable can only be explained adequately by more than one
independent variable. Assuming there is linear relationship
between the dependent and independent variables. Then,
Y=A+B1X1+ B2X2+ B3X3+…………+ BnXn (5)
Where
A=Intercept
Bi = Regression coefficient of Xi
n = Number of independent variables.
In multiple regressions with n independent variables, there
are n+1 unknown equation to be solved simultaneously to
get regression coefficient and the intercept of regression
function.
Paper ID: SUB153297 1822
International Journal of Science and Research (IJSR) ISSN (Online): 2319-7064
Index Copernicus Value (2013): 6.14 | Impact Factor (2013): 4.438
Volume 4 Issue 4, April 2015
www.ijsr.net Licensed Under Creative Commons Attribution CC BY
Yn
i=1 Xn = a nni=1 + b1 X1Xn
ni=1 + b2 X2Xn
ni=1 +⋯ bn Xn
2ni=1 (6)
Precision of the estimated regression can be obtained by
partitioning of some of squares. The total sum of squares
about the mean of the (observed) dependent variable Y
denoted by TSS, that is the variation of the observation from
overall means (Yi – Y) can be partitioned into two
component. TSS is the deviation of the observation from the
mean; it is the corrected sum of squares of the dependent
variable Y.
1) One of the partitions of TSS is SSR, sum of squares due
to regression is the deviation of the predicted value of the
ith observation from the mean. This is given as Yci – Y.
2) The next part is that unaccounted for by the independent
variable which is the deviation of the ith observation
from its predicted or fitted value Yi – Yci devoted as sum
of squares about regression SSE.
Thus
TSS = SSR + SSE
Or
Having obtained this partitioning, the ratio of explained
variation in the dependent variable (sum of squares due to
regression) to total variation in dependent variable Y, is a
measure of the degree of correlation. This ratio is called the
coefficient of determination R2.
The square root of this ratio R is correlation coefficient. This
is a less powerful measure of the degree of correlation,
another way of assessing how useful the correlation will be
as a predictor is to see how much of TSS has fallen into SSR
and how much into SEE. If all the observation lie on the
regression then SSE = 0 and R = 1.
When R = 0, it does not necessarily mean that there is no
correlation between the two variables but rather they can be
related to a perfectly curvilinear fashion and not a linear one.
Standard error of estimate (SSE) is another measure used to
determine the extent of correlation. This is simply the
standard deviation of actual Y values from the predicted Yc
values.
Mathematical expressed by
Mathematically as:
RS =f(P,GG,API,T) (10)
Similarly, the correlation of oil formation factor, Bo has
been achieved by expressing Bo as empirical functions of
solution gas-oil ratio, Rs, gas gravity (GG),oil gravity (OG)
and reservoir temperature.
Mathematically, it can be expressed as Bo = f
(RS,GG,OG,T) these parameters can correlated through
regression analysis using least square method.
Use of Least Square Method To Express PVT Parameters
Least square method is a technique used to present data
which contains statistical variation. In the prediction of Bo
and Rs from pressure, gas gravity GG, API gravity, reservoir
temperature, oil gravity OG, Bo and RS may be closely
represented as a function of above named parameters by
multiplied regression analysis. In other to convert to
multiple regressions, geometric regression is used to remove
the fraction sign. The multiple regression is used.
Series of simultaneous equations are formed from this
analysis. The equations are used to form matrix to determine
the coefficient of regression. Therefore, from the prediction
of the RS and Bo at any time, we can use given crude oil
properties such as Bo, RS, pressure, API gravity, oil gravity,
gas gravity and reservoir temperature to generate empirical
equation that can do the prediction for low and medium API
gravity oil for Nigerian crudes.
Oil Formation Volume Factor
This property of crude oil is affected to a great extent by the
API gravity of the crude oil. For this reason formation
volume factor is (Bo) is considered for both medium and
low API gravity crudes.
The API gravity range used is between 15o and 35
o API. The
following empirical relationships were used:
To formulate the two equations above, regression analysis is
used to determine the values of a, b, B in each case.
4. Discussion of Result
Correlation model for Bo prediction for API between 15o
and 30o was developed from data collected from different
fields. Significance test for regression coefficient at
significance level of 5% shows that F critical value is less
than F calculated and it is presented in table, therefore, we
can conclude from this test that we are 95% confident that
there is correlation between the variables. The population
multiply determination coefficient, R2 = 0.
The correlation coefficient for this equation is 0.919 which
means that the sum of squares about regression (SSE) is very
small i.e. is the unexplained variation by regression. The
average percentage error, standard error of estimate and
average absolute percentage error are within tolerance and
Paper ID: SUB153297 1823
International Journal of Science and Research (IJSR) ISSN (Online): 2319-7064
Index Copernicus Value (2013): 6.14 | Impact Factor (2013): 4.438
Volume 4 Issue 4, April 2015
www.ijsr.net Licensed Under Creative Commons Attribution CC BY
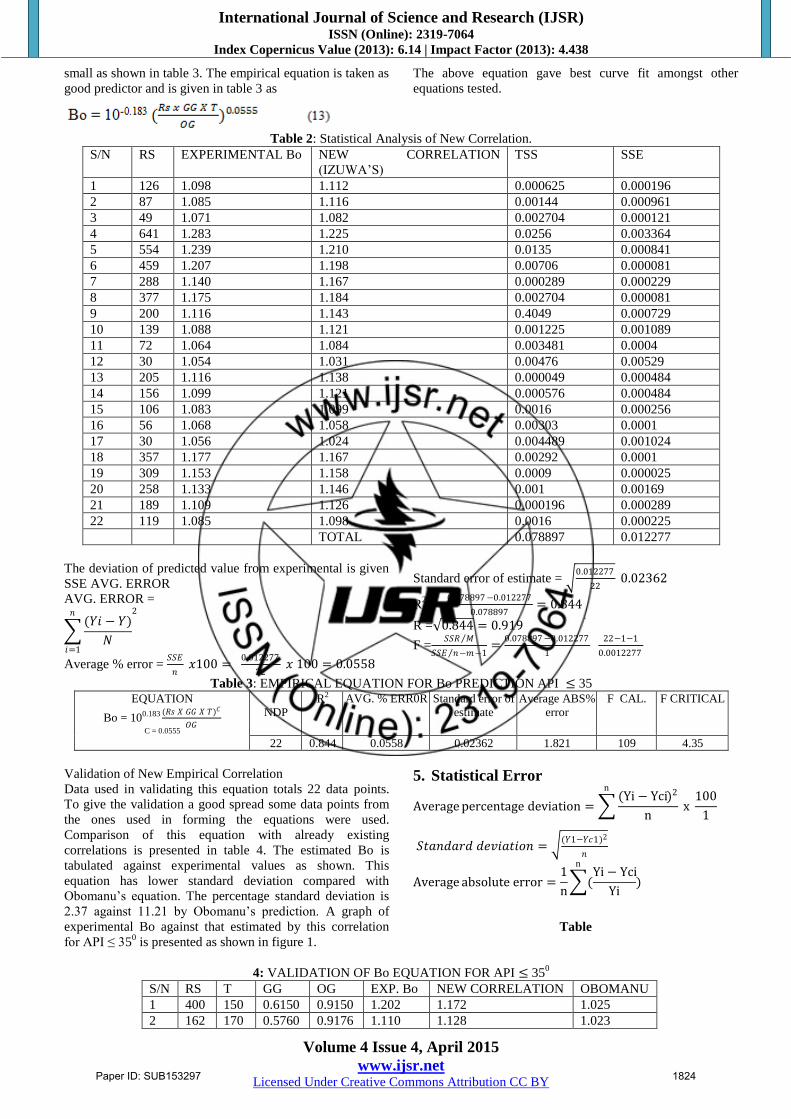
small as shown in table 3. The empirical equation is taken as
good predictor and is given in table 3 as
The above equation gave best curve fit amongst other
equations tested.
Table 2: Statistical Analysis of New Correlation.
S/N RS EXPERIMENTAL Bo NEW CORRELATION
(IZUWA’S)
TSS SSE
1 126 1.098 1.112 0.000625 0.000196
2 87 1.085 1.116 0.00144 0.000961
3 49 1.071 1.082 0.002704 0.000121
4 641 1.283 1.225 0.0256 0.003364
5 554 1.239 1.210 0.0135 0.000841
6 459 1.207 1.198 0.00706 0.000081
7 288 1.140 1.167 0.000289 0.000229
8 377 1.175 1.184 0.002704 0.000081
9 200 1.116 1.143 0.4049 0.000729
10 139 1.088 1.121 0.001225 0.001089
11 72 1.064 1.084 0.003481 0.0004
12 30 1.054 1.031 0.00476 0.00529
13 205 1.116 1.138 0.000049 0.000484
14 156 1.099 1.121 0.000576 0.000484
15 106 1.083 1.099 0.0016 0.000256
16 56 1.068 1.058 0.00303 0.0001
17 30 1.056 1.024 0.004489 0.001024
18 357 1.177 1.167 0.00292 0.0001
19 309 1.153 1.158 0.0009 0.000025
20 258 1.133 1.146 0.001 0.00169
21 189 1.109 1.126 0.000196 0.000289
22 119 1.085 1.098 0.0016 0.000225
TOTAL 0.078897 0.012277
The deviation of predicted value from experimental is given
SSE AVG. ERROR
AVG. ERROR =
(𝑌𝑖 − 𝑌)
𝑁
𝑛
𝑖=1
2
Average % error = 𝑆𝑆𝐸
𝑛 𝑥100 =
0.012277
22 𝑥 100 = 0.0558
Standard error of estimate = 0.012277
22 0.02362
R2 =
0.078897−0.012277
0.078897= 0.844
R = 0.844 = 0.919
F =𝑆𝑆𝑅 𝑀
𝑆𝑆𝐸 𝑛−𝑚−1 =
0.078897−0.012277
1
22−1−1
0.0012277
Table 3: EMPIRICAL EQUATION FOR Bo PREDICTION API ≤ 35 EQUATION
Bo = 100.183 (𝑅𝑠 𝑋 𝐺𝐺 𝑋 𝑇)𝐶
𝑂𝐺
C = 0.0555
NDP
R2 AVG. % ERR0R Standard error of
estimate
Average ABS%
error
F CAL. F CRITICAL
22 0.844 0.0558 0.02362 1.821 109 4.35
Validation of New Empirical Correlation
Data used in validating this equation totals 22 data points.
To give the validation a good spread some data points from
the ones used in forming the equations were used.
Comparison of this equation with already existing
correlations is presented in table 4. The estimated Bo is
tabulated against experimental values as shown. This
equation has lower standard deviation compared with
Obomanu’s equation. The percentage standard deviation is
2.37 against 11.21 by Obomanu’s prediction. A graph of
experimental Bo against that estimated by this correlation
for API ≤ 350 is presented as shown in figure 1.
5. Statistical Error
Average percentage deviation = (Yi − Yci)2
n
n
x 100
1
𝑆𝑡𝑎𝑛𝑑𝑎𝑟𝑑 𝑑𝑒𝑣𝑖𝑎𝑡𝑖𝑜𝑛 = (𝑌1−𝑌𝑐1)2
𝑛
Average absolute error =1
n (
Yi − Yci
Yi)
n
Table
4: VALIDATION OF Bo EQUATION FOR API ≤ 350
S/N RS T GG OG EXP. Bo NEW CORRELATION OBOMANU
1 400 150 0.6150 0.9150 1.202 1.172 1.025
2 162 170 0.5760 0.9176 1.110 1.128 1.023
Paper ID: SUB153297 1824

International Journal of Science and Research (IJSR) ISSN (Online): 2319-7064
Index Copernicus Value (2013): 6.14 | Impact Factor (2013): 4.438
Volume 4 Issue 4, April 2015
www.ijsr.net Licensed Under Creative Commons Attribution CC BY
3 126 170 0.5760 0.9176 1.098 1.112 1.025
4 87 170 0.5830 0.9176 1.085 1.09 1.025
5 641 154 0.6880 0.8810 1.283 1.225 1.028
6 554 154 0.6390 0.8810 1.239 1.21 1.027
7 459 154 0.6380 0.8810 1.207 1.198 1.027
8 200 154 0.6350 0.8810 1.116 1.143 1.026
9 205 160 0.5640 0.9125 1.116 1.138 1.026
10 156 160 0.5640 0.9125 1.099 1.121 1.025
11 106 160 0.565 0.9125 1.083 1.099 1.025
12 58 160 0.5620 0.9125 1.068 1.058 1.029
13 30 160 0.575 0.9125 1.056 1.024 1.025
14 23 127 0.7300 0.9607 1.047 1.006 1.025
15 357 144 0.577 0.9206 1.177 1.167 1.026
16 309 144 0.577 0.9206 1.153 1.158 1.026
17 258 144 0.573 0.9206 1.133 1.146 1.026
18 189 144 0.576 0.9206 1.1090 1.127 1.026
19 119 144 0.582 0.9206 1.085 1.099 1.026
20 34 189 0.577 0.9240 1.037 1.040 1.051
21 328 170 0.598 0.885 1.171 1.178 1.178
22 46 141 0.6310 0.9090 1.048 1.047 1.052
Average percentage deviation 0.056 1.257
Standard deviation 0.0237 0.1121
Figure 1: Correlation between Experimental and Correlated Values
Based on Figure 1 the predicted value can be converted to
the laboratory value using the correlation 𝑌 = 0.856𝑥 +0.1602
14. Where, x is the predicted value.
Universal Formation Volume Factor Correlation versus the
New Correlation. Further comparative evaluation of PVT
correlations used for Bo prediction was ran to test the
validity of the new equation. This data was not part of data
used in the development of the correlation.
Table 5: Well and Field data used for the Program Property Well 1 Well 2 Well 3 Well 4 Well 5
Paper ID: SUB153297 1825

International Journal of Science and Research (IJSR) ISSN (Online): 2319-7064
Index Copernicus Value (2013): 6.14 | Impact Factor (2013): 4.438
Volume 4 Issue 4, April 2015
www.ijsr.net Licensed Under Creative Commons Attribution CC BY
API 21.97 21.97 21.97 21.97 21.97
GOR 277 277 192 146 101
Υg 0.5670 0.5770 0.5790 0.5830 0.5890
P(psia) 2148 1792 1442 1082 724
TO 155 155 155 155 155
Psep(Psia) 155 155 155 155 155
Tsep (oF) 100 100 100 100 100
Z 0.0 0.0 0.0 0.0 0.0
Table 6: Data obtained from laboratory experiment Properties Experimental Values
Well 1 Well 2 Well 3 Well 4 Well 5
Density(lb/ft3) 51.2728 51.5481 52.2610 52.7887 53.1930
Bo(rb/stb) 1.1590 1.1450 1.1290 1.110 1.0960
Viscosity μ(cp) 0.534 0,550 0.573 0,600 0.649
Bubble point pressure Pb 2015 1715 1442 1082 724
Solution GOR (SCF/STB) 277 237 192 146 101
Table 7: Result obtained from the Program. Well Lab result Standing’s correlation Vasquez & Beggs Izuwa’s (new correlation)
Predicted value error % error Predicted value error % error Predicted value error % error
1 1.1590 1.404 -0.245 21.14 1.0633 0.957 8.26 1.1553 0.0037 0.32
2 1.1450 1.249 -0.104 9.08 1.0632 0.0818 7.14 1.1556 -0.0106 9.26
3 1.290 1.1745 -0.455 4.03 1.0030 0.0660 5.85 1.1326 -0.0176 0.32
4 1.1110 1.129 -0.018 1.62 1.0625 0.0485 4.37 1.1159 -0.0196 0.014
5 1.0960 1.09827 -0.0023 0.21 1.0619 0.0341 3.11 1.0940 0.0020 1.82
Standing’s mean error (%) = 7.22
Vasquez and Beggs mean error (%) = 5.746
Izuwa’s mean error (%) = 2.28
Figure 2: Monograph for obtaining experimental Bo form the new correlation
Paper ID: SUB153297 1826

International Journal of Science and Research (IJSR) ISSN (Online): 2319-7064
Index Copernicus Value (2013): 6.14 | Impact Factor (2013): 4.438
Volume 4 Issue 4, April 2015
www.ijsr.net Licensed Under Creative Commons Attribution CC BY
Figure 2 is an alternative to using equation 14. Once the
estimate is made with equation 13 the equivalent value of
laboratory measurement is read from the graph following the
arrow.
6. Conclusion
A new correlation for oil formation volume factor has been
developed. From this work it appears reasonable to conclude
that least square approach is a useful tool in correlation of
physical properties of crude oil because it minimizes the
sum of squares of the deviation. From the test for regression
coefficient, we are 92% confident that the variables
correlate.
Comparison of available PVT correlation from the literature
such as Standing (1947), Vasquez and Beggs (1980) and
Owolabi shows that no universal correlation exits and that
data from local regions should be used to develop local
correlations. The new correlation predicted the experimental
Bo better than the other correlations used in the study. This
implies that the Bo obtained from this model will give better
evaluation of reservoir performance when applied in
material balance evaluation.
References
[1] Ahmad, T., 2007, “Equation of State and PVT
Analysis”, Gulf Publishing Company, Houston, Taxas
[2] AL-Marhoun, M.A., 1988, “PVT Correlations For
Middle East Crude Oils”, JPT May 1988. 650-666
[3] Lasater, J. A., Bubble Point Pressure Correlation”
Trans. AIME 213, 379-381, 1958.
[4] Obomanu, D. A. and Okpobori, G. A., “Correlating the
PVT Properties of Nigerian Crudes” Trans. AIM vol.
109, 214-224, 1987.
[5] Glaso, O., 1980, “ Generalized Pressure-Volume-
Temperature Correlations”, JPT, May 1980
[6] Standing, M. B., 1947, A Pressure –Volume –
Temperature Correlation for Mixtures of California Oil
and Gases”, Drilling & Production Practice, API.
[7] Vasquez, M. E. and Beggs, H. D., 1980 “Correlations
for Fluid Physical Property Prediction”, JPT June 1980
Paper ID: SUB153297 1827