development of shallow viscous oil reserves in north slope
TRANSCRIPT

Development of Shallow Viscous Oil Reserves in North Slope
ID Number: DE-FC26-01BC15186
Quarterly Progress Report
Reporting Period Start Date: 1-1-2003
Reporting Period End Date: 3-31-2003
Submitted to the
U.S. Department of Energy
Kishore K. Mohanty
Department of Chemical Engineering
University of Houston
4800 Calhoun Road
Houston, Texas 77204-4004
July, 2003
1

Disclaimer
This report was prepared as an account of work sponsored by an agency of the United States
Government. Neither the United States Government nor any agency thereof, nor any of their
employees, makes any warranty, express or implied, or assumes any legal liability or
responsibility for the accuracy, completeness, or usefulness of any information, apparatus, or
process disclosed, or represents that its use would not infringe privately owned rights. Reference
herein to any specific commercial product, process, or service by trade name, trademark,
manufacturer, or otherwise does not necessarily constitute or imply its endorsement,
recommendation, or favoring by the United States Government or any agency thereof. The views
and opinions of authors expressed herein do not necessarily state or reflect those of the United
States Government or any agency thereof.
2

Abstract
North Slope of Alaska has huge oil deposits in heavy oil reservoirs such as Ugnu, West Sak
and Shrader Bluff etc. The viscosity of the last two reservoir oils vary from ~30 cp to ~3000
cp and the amount in the range of 10-20 billion barrels. High oil viscosity and low formation
strength impose problems to high recovery and well productivity. Water-alternate-gas
injection processes can be effective for the lower viscosity end of these deposits in West Sak
and Shrader Bluff. Several gas streams are available in the North Slope containing NGL and
CO2 (a greenhouse gas). The goal of this research is to develop tools to find optimum
solvent, injection schedule and well-architecture for a WAG process in North Slope shallow
sand viscous oil reservoirs. In the last quarter, we have developed streamline generation and
convection subroutines for miscible gas injection. The WAG injection algorithms are being
developed. We formulated a four-phase relative permeability model based on two-phase
relative permeabilities. The new relative permeability formulations are being incorporated
into the simulator. Wettabilities and relative permeabilities are being measured. Plans for the
next quarter includes modeling of WAG injection in streamline based simulation, relative
permeability studies with cores, incorporation of complex well-architecture.
3

TABLE OF CONTENTS
Page
Cover Page 1
Disclaimer 2
Abstract 3
Table of Contents 4
Executive Summary 6
Introduction 7
Experimental 8
Results and Discussion 11
Technology Transfer 21
Conclusions 21
Plans for Next Reporting Period 21
References 22
4

List of Graphical Materials
Page
Fig. 1 Oil saturation from Strator at 0.28 PV injection of CO2 into C16. 12
Fig. 2 Oil saturation from UTCOMP at 0.28 PV injection of CO2 into C16. 12
Fig. 3 Oil Saturation at 0.47 PVI. 13
Fig. 4. Oil saturation from Strator at 0.33 PV of 50-50 injection of PBG and NGL into Shrader
oil. 14
Fig. 5. Oil saturation from UTCOMP at 0.33 PV of 50-50 injection of PBG and NGL into
Shrader oil. 14
Fig. 6. Gas saturation from Strator at 0.33 PV of 50-50 injection of PBG and NGL into Shrader
oil. 15
Fig. 7. Gas saturation from UTCOMP at 0.33 PV of 50-50 injection of PBG and NGL into
Shrader oil. 15
Fig. 8. Second non-aqueous liquid saturation from Strator at 0.33 PV of 50-50 injection of PBG
and NGL into Shrader oil. 16
Fig. 9. Second non-aqueous liquid saturation from UTCOMP at 0.33 PV of 50-50 injection of
PBG and NGL into Shrader oil. 16
Fig. 10 Optical and AFM images of adsorbed material on a mica after oil and decalin treatment.
17
Fig. 11 Optical and AFM images of adsorbed material on a mica after oil and cyclohexane
treatment. 18
Fig. 12 Optical and AFM images of adsorbed material on a mica after oil and toluene treatment.
20
5
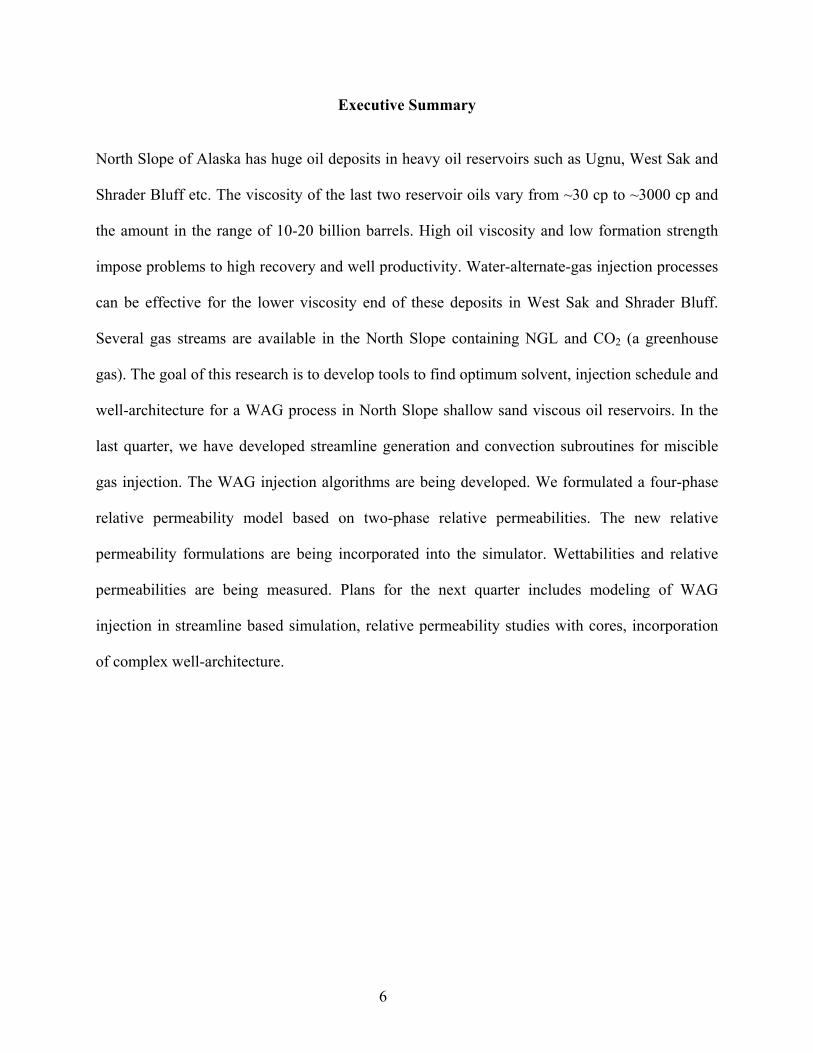
Executive Summary
North Slope of Alaska has huge oil deposits in heavy oil reservoirs such as Ugnu, West Sak and
Shrader Bluff etc. The viscosity of the last two reservoir oils vary from ~30 cp to ~3000 cp and
the amount in the range of 10-20 billion barrels. High oil viscosity and low formation strength
impose problems to high recovery and well productivity. Water-alternate-gas injection processes
can be effective for the lower viscosity end of these deposits in West Sak and Shrader Bluff.
Several gas streams are available in the North Slope containing NGL and CO2 (a greenhouse
gas). The goal of this research is to develop tools to find optimum solvent, injection schedule and
well-architecture for a WAG process in North Slope shallow sand viscous oil reservoirs. In the
last quarter, we have developed streamline generation and convection subroutines for miscible
gas injection. The WAG injection algorithms are being developed. We formulated a four-phase
relative permeability model based on two-phase relative permeabilities. The new relative
permeability formulations are being incorporated into the simulator. Wettabilities and relative
permeabilities are being measured. Plans for the next quarter includes modeling of WAG
injection in streamline based simulation, relative permeability studies with cores, incorporation
of complex well-architecture.
6

Introduction
North Slope of Alaska has huge oil deposits in heavy oil reservoirs such as Ugnu, West
Sak and Shrader Bluff etc (Foerster et al., 1997). These reservoirs overlie existing productive
reservoirs such as Kuparak and Milne Point. The viscosity of the West Sak and Shrader Bluff
oils vary from ~30 cp to ~3000 cp and the amount is approximately 16 billion barrels. High oil
viscosity and low formation strength impose problems to high recovery and well productivity.
These challenging reservoirs are the largest undeveloped accumulations in North America. With
even modest recoveries, reserves must be considered substantial (a few billion barrels).
Waterflood pilots have been attempted in both West Sak starting in 1984 and Shaeder
Bluff in 1991 (Bidinger & Dillon., 1995). Initial well productivity of approximately 300 BOPD
in a ~19 API oil is considered low by North Slope standards. The goal of this research is develop
the new technology to increase the well productivity as well as the reservoir recovery efficiency.
Water-alternate-gas injection processes and modern well architectures can be effective in
recovery of the low viscosity (<100 cp) of these deposits in West Sak and Shredder Bluff.
Several gas streams are available for the WAG process in the North Slope that contain NGL and
CO2. The disposal of (of a few trillion cubic feet of) CO2 will be an added benefit because CO2 is
a greenhouse gas and the sequestration of a significant amount of greenhouse gas is a challenge
for the mankind in the twenty first century.
This report summarizes our results for the period of January 2003 through March 2003.
The five tasks for the project are: (1) Compositional model, (2) Relative permeability, (3)
Reservoir simulator, (4) Well Architecture, and (5) WAG optimization. We worked on Tasks 2
and 3 in this quarter; the activities are described in the next section.
7

Experimental
Several North Slope gas streams may be available for injection into shallow sands
reservoirs in the North Slope, e.g., Prudhoe NGL, Kuparak NGL, Prudhoe lean gas. Prudhoe gas
streams contain a significant amount of CO2. CO2 cannot be put into potential gas pipelines and
is a greenhouse gas. However, mixtures of CO2 and NGL can make effective miscible injectants
for shallow viscous reservoirs. The complicating issue in the displacement calculations of these
gases is the presence of L1-L2-V phases. Three fluid phases, i.e. a vapor and two liquid phases,
have long been observed in hydrocarbon and CO2 mixtures (Meldrum & Nielsen 1955; Mohanty
et al. 1995). Three hydrocarbon phases occurs at relatively low temperatures and pressures. The
shallow sands temperature is about 60-100 °F and pressure about 1200-1800 psi. Thus a
compositional simulator is needed that can handle three hydrocarbon phases and water for WAG
flood simulations. We have installed a version of UTCOMP, a finite-difference based, three-
dimensional, equation-of-state compositional simulator (Courtesy: Prof. Gary Pope, University
of Texas) which can incorporate three hydrocarbon phases (Chang et al., 1990).
The computational time required for simulation of four phases during WAG floods of 3-
D reservoirs is prohibitively expensive in traditional finite difference simulators. If large grid
blocks are used, then numerical dispersion is large and the results are not accurate. In contrast,
streamline method is much faster. Compared with conventional finite difference simulation,
streamline simulation is much younger in terms of commercial usage. While finite difference
simulation was commercialized in 1960’s, the streamline simulation was used in commercial
simulators in the 1990’s (Osako et al., 2003).
We have developed a streamline simulator (Strator) based on compositional simulation of
UTCOMP (Chang, 1990). Strator was developed for waterflood last quarter. It has been
confirmed that the streamline method is much faster than conventional finite-difference method.
8

Waterflood alone is not effective to be used to recover Shrader viscous oil due to high viscosity
of the oil. Slim tube experiments carried out by Mohanty et al. (1992) and Khataniar et al. (1999)
showed that solvent flooding was effective because certain solvents were miscible with the
viscous oil and thus oil viscosity was reduced. Therefore, in the past three months, Strator was
extended for gas injection.
Instead of mapping water saturation from 1D solutions, we map overall compositions of
hydrocarbon components for gas injection. The true time step is derived in the next several
paragraphs.
At T (the nth time step), the total cumulative injection of component i is
iniinri
npi
nIi NNNN ,,,, −+= , (1)
where is the total cumulative injection of component i at the nth time step, the total
cumulative production of component i at the nth time step, is the initial amount of
component i, and is total amount of component i still remaining in the reservoir at the nth
time step.
nIiN ,
npiN ,
iniiN ,
nriN ,
Similarly for the (n+1)st time step, we have
iniin
rin
pin
Ii NNNN ,1
,1
,1
, −+= +++ . (2)
The total cumulative injection of component i at the (n+1)th time step, , can be written as 1,+nIiN
1,
1,
1,
+++ ∆+= nIi
nI
nIi
nIi TzQNN , (3)
where is the solvent injection rate at the (n+1)th time step, z1+nIQ i,I is overall composition of
component i in the solvent, and 1+∆ nT is the true time step at the (n+1) time step. The total
cumulative production of component i at the (n+1)th time step, , can be found as 1,+npiN
9

14
2
1,,
,,1
,1
, 2+
=
+++ ∆
++= ∑ n
j
npj
npj
pjinp
npi
npi T
ffxQNN , (4)
where is the production fractional flow of phase j at the nth time step, is the
production fractional flow of phase j at the (n+1)th time step, Q is production rate at the
(n+1)th time step, and is composition of component i in phase j in the production fluid. So,
from Eqs. 2 to 4, we get
npjf ,
1,+npjf
1+np
pjix ,,
∑=
+++
++
+−
−+−=∆
4
2
1,,
,,1
,1
,,1
,,1
2j
npj
npj
pjinpIi
nI
nPi
nIi
nriinitin
ffxQzQ
NNNNT . (5)
The true time step is incremented by the above ∆Tn+1 in the (n+1)st time step.
The two key issues for modeling fluid flow are wettability and four-phase relative
permeability. A four-phase relative permeability model has been formulated. This new
formulation is being incorporated into the compositional simulator. Adsorption of Shrader Bluff
dead oil components on a mica surface has been imaged by an atomic force microscope. Mica is
chemically similar to sandstone, but its surfaces are planar. Effect of solvents (cyclohexane,
toluene and decalin) has been studied. These solvents are commonly used to clean cores. The
mica plates were put in brine solution for a day before aging in viscous oil for three days at
80°C. The samples were dipped in three different solvents, cyclohexane, toluene and decalin, for
a day and dried before probing by tapping mode in air.
10

Results and Discussion
Reservoir Simulation
After Strator was extended, we used a simple case to test the code. At 700 psi and
69.38oF, CO2 was injected into a reservoir with C16. At 0.28 PVI, values of oil saturation
obtained from Strator and UTCOMP are compared in Figs. 1 and 2, which show that the front
generated by using Strator is sharper than that by using UTCOMP. The speed of solvent
movement in the diagonal direction predicted by using Strator is faster than its counterpart by
using UTCOMP while the results are comparable. Therefore, numerical dispersions from Strator
are smaller than those from UTCOMP. Simulations were run by using Strator and 70 by 70 grid
blocks for the above case. Oil saturation at 0.47 PVI is shown in Fig. 3, which indicates a lot of
viscous fingers.
11

0
0.1
0.2
0.3
0.4
0.5
0.6
0.7
0.8
0.9
1
5 10 15 20
2
4
6
8
10
12
14
16
18
20
Fig. 1 Oil saturation from Strator at 0.28 PV injection of CO2 into C16.
0
0.1
0.2
0.3
0.4
0.5
0.6
0.7
0.8
0.9
1
5 10 15 20
2
4
6
8
10
12
14
16
18
20
Fig. 2 Oil saturation from UTCOMP at 0.28 PV injection of CO2 into C16.
12

Fig. 3 Oil Saturation at 0.47 PVI
Simulations were run for 50-50 injection of PBG and NGL into a reservoir with Shrader viscous
oil. Oil, gas, and second non-aqueous liquid saturations are shown in Figs. 4-9, which indicates
that four phases can be simulated by Strator. This simulations show viscous fingering in these
gasflood even with 20x20 grids. These simulations take a 366-MHz Pentium II computer 5
minutes and 21 seconds to run up to 1.2 PV by using Strator and about two hours to run up to 0.6
PV by using UTCOMP. Therefore, the speedup factor is about 43 in this case.
13

0
0.1
0.2
0.3
0.4
0.5
0.6
0.7
0.8
0.9
1
5 10 15 20
2
4
6
8
10
12
14
16
18
20
Fig. 4 Oil saturation from Strator at 0.33 PV of 50-50 injection of PBG and NGL into
Shrader oil.
0
0.1
0.2
0.3
0.4
0.5
0.6
0.7
0.8
0.9
1
5 10 15 20
2
4
6
8
10
12
14
16
18
20
Fig. 5 Oil saturation from UTCOMP at 0.33 PV of 50-50 injection of PBG and NGL into
Shrader oil.
14

0
0.1
0.2
0.3
0.4
0.5
0.6
0.7
0.8
0.9
1
5 10 15 20
2
4
6
8
10
12
14
16
18
20
Fig. 6 Gas saturation from Strator at 0.33 PV of 50-50 injection of PBG and NGL into
Shrader oil.
0
0.1
0.2
0.3
0.4
0.5
0.6
0.7
0.8
0.9
1
5 10 15 20
2
4
6
8
10
12
14
16
18
20
Fig. 7 Gas saturation from UTCOMP at 0.33 PV of 50-50 injection of PBG and NGL into
Shrader oil.
15

0
0.1
0.2
0.3
0.4
0.5
0.6
0.7
0.8
0.9
1
5 10 15 20
2
4
6
8
10
12
14
16
18
20
Fig. 8 Second non-aqueous liquid saturation from Strator at 0.33 PV of 50-50 injection
of PBG and NGL into Shrader oil.
0
0.1
0.2
0.3
0.4
0.5
0.6
0.7
0.8
0.9
1
5 10 15 20
2
4
6
8
10
12
14
16
18
20
Fig. 9 Second non-aqueous liquid saturation from UTCOMP at 0.33 PV of 50-50
injection of PBG and NGL into Shrader oil.
16

Relative Permeability
1. Decalin-washed Oil-treated mica surface
Fig. 10(a) is an optical image of the decalin-washed mica surface with the size about 200 µm
x 200 µm. Fig. 10(b) is a 10 µm x 10 µm height image with a data scale (height) of 50 nm at the
far right. For decalin-washed surfaces, the images show the crude oil component adsorption
along preferred lines for both mica and glass (not shown here) surfaces. Fig. 10(c) is the 3-D
image of the 10 µm x 10 µm height image shown in Fig. 10(b).
(a) (b)
(c) Fig. 10 Optical and AFM images of adsorbed material on a mica after oil and decalin treatment.
17
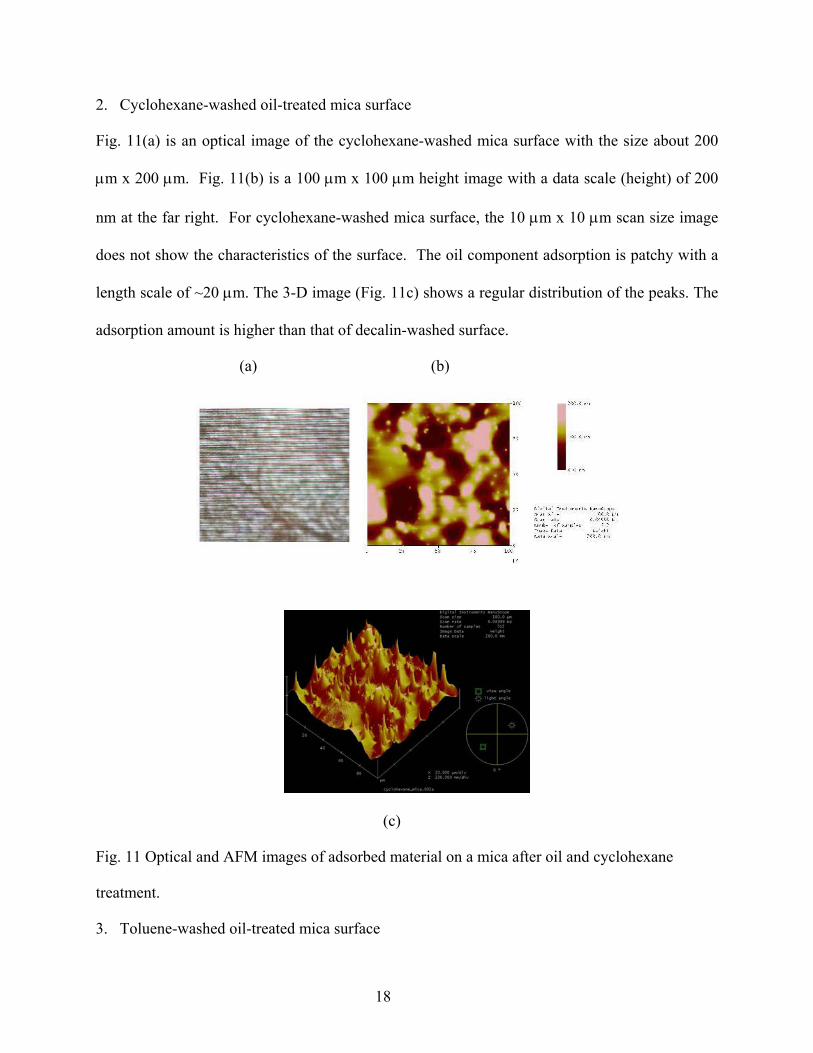
2. Cyclohexane-washed oil-treated mica surface
Fig. 11(a) is an optical image of the cyclohexane-washed mica surface with the size about 200
µm x 200 µm. Fig. 11(b) is a 100 µm x 100 µm height image with a data scale (height) of 200
nm at the far right. For cyclohexane-washed mica surface, the 10 µm x 10 µm scan size image
does not show the characteristics of the surface. The oil component adsorption is patchy with a
length scale of ~20 µm. The 3-D image (Fig. 11c) shows a regular distribution of the peaks. The
adsorption amount is higher than that of decalin-washed surface.
(a) (b)
(c)
Fig. 11 Optical and AFM images of adsorbed material on a mica after oil and cyclohexane
treatment.
3. Toluene-washed oil-treated mica surface
18

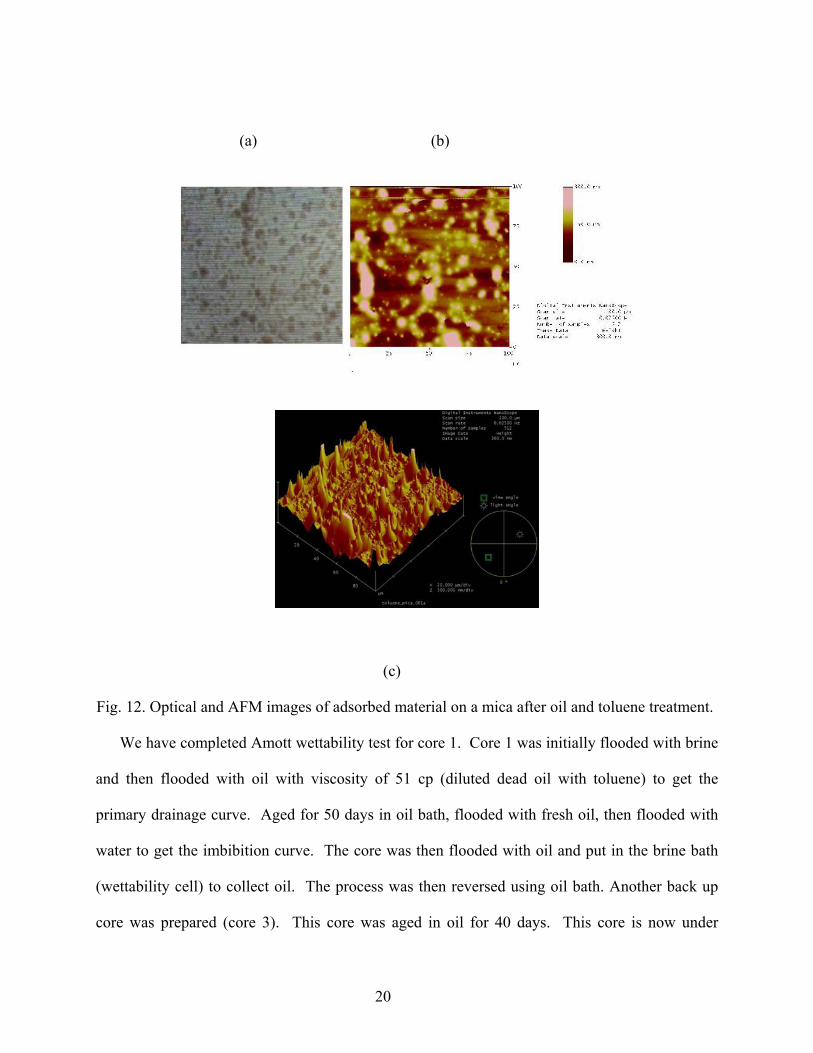
Fig. 12(a) below is the optical image of the mica surface after aging with brine, oil and
washed with toluene. This image (about 300 µm x 300 µm) shows the deposition of oil
components after washed by toluene. Compared to the image of decalin-washed mica surface,
this image shows a denser population of dark spots. Fig. 12(b) below shows a 100 µm x 100 µm
height image of toluene washed mica surface with the data scale of 300 nm. The 3-D image
(Fig. 12c) also shows a regular distribution of the peaks. The oil components are adsorbed on
patchy region of length scale ~10 µm.
Toluene and decalin are both aromatic and dissolve asphaltenes better than cyclohexane.
When mica is aged with first brine and then oil, some oil components get adsorbed on the solid
surface. Washing with solvents removes the bulk oil and perhaps some of the adsorbed
components. AFM images show that the amount left behind on the solid surface is the largest in
case of cyclohexane, intermediate for toluene and the least for decalin. These components are
responsible for making the core surface mixed-wet.
19
(a) (b)
(c)
Fig. 12. Optical and AFM images of adsorbed material on a mica after oil and toluene treatment.
We have completed Amott wettability test for core 1. Core 1 was initially flooded with brine
and then flooded with oil with viscosity of 51 cp (diluted dead oil with toluene) to get the
primary drainage curve. Aged for 50 days in oil bath, flooded with fresh oil, then flooded with
water to get the imbibition curve. The core was then flooded with oil and put in the brine bath
(wettability cell) to collect oil. The process was then reversed using oil bath. Another back up
core was prepared (core 3). This core was aged in oil for 40 days. This core is now under
20

testing for its wettability indices using the Amott wettability cell. Live oil and promising solvent
(gas mixtures) are being prepared. Core flood of live oil using solvent at high pressure will be
performed in weeks.
Technology Transfer
We have submitted two abstracts to SPE Fall conference on the basis of this work; they
have been accepted.
Conclusions
• A streamline simulator is being developed for compositional WAG flood. It has been
validated for waterflooding and gasflooding (Task 3).
• A four-phase relative permeability model has been formulated. The new formulation is
being incorporated into the compositional simulator. Surface force and adsorption of
Shrader Bluff dead oil components on a mica surface after washing with three solvents
have been imaged by an atomic force microscope. (Task 2).
Plans for Next Reporting Period
• Evaluate effect of complex well-architecture (Task 4)
• Streamline modeling for WAG flood (Task 3)
• Relative permeability studies with mixed-wet core (Task 2)
21

References
Bidinger, C. R. & Dillon, J. F., “Milne Point Shrader Bluff: Finding the Keys to Two Billion
Barrels,” SPE 30289, International Heavy Oil Symposium, Calgary, June 19-21, 1995.
Chang, Y., Pope, G. A. and Sepehrnoori, K., "A Higher Order Finite-Difference Compositional
Simulator," J. Petrol. Sc. & Eng., 5, 35-50, 1990.
Foerester, C. et al., “West Sak Field Development: Analysis of a Marginal Project,” SPE 37946,
SPE Hyd. Econ. & Eva., Dallas, March 16-18, 1997.
Khataniar, S., Kamath, V. A., Patil, S. L., Chandra, S. & Inaganti, M. S., “CO2 and Miscible Gas
Injection for Enhanced Recovery of Shraeder Bluff Heavy Oil,” SPE 54085, SPE
International Thermal Operations and Heavy Oil Symposium, Bakersfield, CA, March 17-19,
1999.
Meldrum, A. H. and Nielsen, R. F., "A Study of Three-Phase Equilibria for Carbon Dioxide-
Hydrocarbon Mixtures," Producers Monthly, August 1955, 22-35.
Mohanty, K. et al., “Role of Three-Hydrocarbon –Phase Flow in a Gas Displacement Process,”
SPE Reservoir Engineering, 214-221, August 1995.
Osako, I., Datta-Gupta, A., and King, M.J., “Timestep Selection during Streamline Simulation
via Transverse Flux Correction. Paper SPE 79688 to be presented at the 2003 SPE Reservoir
Simulation Symposium to be held in Houston, Feb. 3-5 (2003).
22