development of novel electroactive nanofluids for flow cells
TRANSCRIPT
Development of novel electroactive nanofluids for flow cells
Daniel Rueda García
ADVERTIMENT. La consulta d’aquesta tesi queda condicionada a l’acceptació de les següents condicions d'ús: La difusió d’aquesta tesi per mitjà del servei TDX (www.tdx.cat) i a través del Dipòsit Digital de la UB (diposit.ub.edu) ha estat autoritzada pels titulars dels drets de propietat intel·lectual únicament per a usos privats emmarcats en activitats d’investigació i docència. No s’autoritza la seva reproducció amb finalitats de lucre ni la seva difusió i posada a disposició des d’un lloc aliè al servei TDX ni al Dipòsit Digital de la UB. No s’autoritza la presentació del seu contingut en una finestra o marc aliè a TDX o al Dipòsit Digital de la UB (framing). Aquesta reserva de drets afecta tant al resum de presentació de la tesi com als seus continguts. En la utilització o cita de parts de la tesi és obligat indicar el nom de la persona autora. ADVERTENCIA. La consulta de esta tesis queda condicionada a la aceptación de las siguientes condiciones de uso: La difusión de esta tesis por medio del servicio TDR (www.tdx.cat) y a través del Repositorio Digital de la UB (diposit.ub.edu) ha sido autorizada por los titulares de los derechos de propiedad intelectual únicamente para usos privados enmarcados en actividades de investigación y docencia. No se autoriza su reproducción con finalidades de lucro ni su difusión y puesta a disposición desde un sitio ajeno al servicio TDR o al Repositorio Digital de la UB. No se autoriza la presentación de su contenido en una ventana o marco ajeno a TDR o al Repositorio Digital de la UB (framing). Esta reserva de derechos afecta tanto al resumen de presentación de la tesis como a sus contenidos. En la utilización o cita de partes de la tesis es obligado indicar el nombre de la persona autora. WARNING. On having consulted this thesis you’re accepting the following use conditions: Spreading this thesis by the TDX (www.tdx.cat) service and by the UB Digital Repository (diposit.ub.edu) has been authorized by the titular of the intellectual property rights only for private uses placed in investigation and teaching activities. Reproduction with lucrative aims is not authorized nor its spreading and availability from a site foreign to the TDX service or to the UB Digital Repository. Introducing its content in a window or frame foreign to the TDX service or to the UB Digital Repository is not authorized (framing). Those rights affect to the presentation summary of the thesis as well as to its contents. In the using or citation of parts of the thesis it’s obliged to indicate the name of the author.

Development of novel
electroactive nanofluids
for flow cells
Doctoral Thesis by Daniel Rueda García


Development of novel
electroactive nanofluids for
flow cells Memòria presentada per optar al grau de doctor per la
Universitat de Barcelona
Programa de doctorat en nanociències
Autor: Daniel Rueda García
Directors: Prof. Dr. Pedro Gómez Romero and Dr. Deepak Dubal
Tutor: Prof. Dr. Pere Lluís Cabot Julià
Tesi realitzada a l’Institut Català de Nanociència i
Nanotecnologia, al grup de Novel Energy-Oriented Materials


A scientist in his laboratory is not a mere technician: he is also a child
confronting natural phenomena that impress him as though they were
fairy tales. – Marie Curie
The force of the temptation which urges us to seek for such evidence
and appearances as are in favour of our desires, and to disregard those
which oppose them, is wonderfully great. In this respect we are all,
more or less, active promoters of error. In place of practising
wholesome self-abnegation, we ever make the wish the father to the
thought: we receive as friendly that which agrees with, we resist with
dislike that which opposes us; whereas the very reverse is required by
every dictate of common sense. – Michael Farady


Page | i
Acknowledgements
I want to thank in first place all the people at the ICN2 who I have worked,
talked and laughed with over these years, but in special to Marcos for our gaming
sessions.
Second, to all my group mates in the novel energy-oriented materials group
who have helped and guided me in my first days to the current people with whom
I have a tremendous, but also exciting, project to face. I must highlight Zahilia, who
has been there since my first day to almost the end of my PhD, helping me in
everything I could need and shearing really good and nerdy moments.
Third, to Dr. Deepak P. Dubal, an old postdoc in our group and one of my
thesis directors who not only helped and showed me a lot of things, but also became
a reference for me. Also, to Prof. Fritz Huguenin, who gave me invaluable technical
lessons and at the same time treated me as a friend.
Fourth, to my family, and especially to my parents who have given me the
opportunity to keep studding all these years and made me the person who I am
today.
Fifth, to my partner: Marta, your support has encouraged me every day to
always do my best and overcome myself.
And finally, to the person who believed in me, who bet on me not one or
two, but three times! (Bachelor’s degree, Master, and PhD). Pedro, thanks to you, I
could start my career as a scientist. But more important, you have showed me what
a scientist should be: a researcher, a teacher and a popular communicator. Not only
explaining to me the importance of each of them, but also by your example.

Page | ii

Page | iii
Abstract
Development of novel electroactive nanofluids for flow cells
Flow cells are on their way to become a key player for electrical energy storage
(EES) thanks to their suitability as load-levelling devices thus contributing to the
development of smart grid and to offset the intermittency of renewable energy sources.
Until recently flow cells have been limited to Redox Flow Batteries (RFB), where energy
storage is given by the redox reactions of dissolved ions. Very recently, new types of
“flowable” electrodes have been proposed making use of capacitive storage mechanism
(Electrochemical Flow Capacitors or EFCs). Our group has been one of the pioneering
labs in this type of novel flow cells based on electroactive nanofluids. The present thesis
aimed at harnessing the activity of well-known electroactive species (quinones,
graphene, polyoxometalates, LiFePO4) in novel electroactive nanofluids. An important
part of our strategy has been the design of hybrid formulations and systems which could
combine faradaic (redox) and capacitive (double-layer) storage mechanisms in order to
improve the performance of the resulting flow cells.
We make an extended review and perspective of the electrochemical flow cell
technology and their possible lines of evolution in the introduction of this thesis. With this
we introduce the state of the art, the issues to solve and the different solutions proposed.
Moreover, we also show our point of view and prospective for this technology and
electrical energy storage in general.
In the chapter 4, the electrochemical fundamentals of quinones in lithium-organic
electrolytes are studied. Quinones electrochemical mechanisms have been widely
studied in aqueous media. In this work we study them in an organic electrolyte in an
attempt to take advantage of the greater solubility and wider potential windows available
in this media. We found and describe in detail several issues preventing the reversible
functioning of quinones in Li+ organic electrolytes which in turn preclude their use in flow
cells under those conditions.
Chapter 5 describes the synthesis, characterization and electrochemical
performance of hybrid materials based on reduced graphene oxide (rGO) and
polyoxometalates dispersed in an aqueous H2SO4 electrolyte in order to produce a
nanofluid. These nanofluids feature low viscosity and show an ultrafast electrochemical
Page | iv
response. We demonstrated their functioning as energy storage fluids with full charge
and discharge of all solid material dispersed.
In chapter 6 a new kind of rGO nanofluid is presented. Instead of using
conventional surfactants, we dissolved an aromatic molecule able to stabilize rGO in an
aqueous electrolyte. With this approach we achieved a great increase in the stability of
the nanofluid. Furthermore, this new nanofluid also showed a great charge transfer
capability, as demonstrated by its enabling of the redox activity of LiFePO4 nanoparticles.
Thus, thanks to the presence of rGO in the nanofluid, electrons could reach the dispersed
nanoparticles and thus be effectively and fully charged and discharged, something not
possible in nanofluids containing only LiFePO4 nanoparticles.
Graphene synthesis has been also deeply studied as part of this thesis as is
shown in the chapter 7. As a result, a new method for the production of graphene by
electrochemical exfoliation of graphite has been developed and patented. The patent, a
summary of the results obtained and the state of the art of the electrochemical exfoliation
method of graphene are presented in this thesis as the last chapter describing research
work carried out within the framework of this thesis.

Page | v
Table of Contents
Acknowledgements ...................................................................................... i
Abstract ........................................................................................................ iii
Table of Contents ........................................................................................ v
List of Publications ...................................................................................... 1
List of Acronyms ......................................................................................... 3
Chapter 1. Introduction ................................................................................ 7
1.1 General introduction ........................................................................ 9
1.2 To flow of not flow. A perspective on the evolution of flowable
electroactive materials and devices for large-scale energy storage ....... 17
Chapter 2. Motivation and Objectives ....................................................... 45
2.1 Motivation ........................................................................................ 47
2.2 Objectives ....................................................................................... 49
Chapter 3. Experimental Methods ............................................................... 51
3.1 Electrochemical techniques ............................................................. 53
3.1.1 General fundamentals ...................................................................... 53
3.1.2 Cyclic Voltammetry ......................................................................... 59
3.1.3 Chronoamperometry ....................................................................... 66
3.1.4 Galvanostatic Cyclic with Potential Limitation ....................................... 67
3.1.5 Potentiostatic Electrochemical Impedance Spectroscopy ........................ 68
3.2 Spectroscopic Techniques .............................................................. 75
3.2.1 Energy Dispersive X-ray Spectroscopy ............................................... 75
3.2.2 X-ray Photoelectron Spectroscopy ..................................................... 76
3.2.3 Raman Spectroscopy ...................................................................... 77
3.2.4 Ultraviolet-Visible Absorption Spectroscopy ......................................... 78
3.3 Transmission Electron Microscopy ................................................. 79
3.3.1 Selected Area Electron Diffraction ..................................................... 80
3.4 Scanning Electron Microscopy ........................................................ 82
3.5 X-ray Diffraction .............................................................................. 82

Page | vi
3.6 Specific Surface Area ..................................................................... 83
3.7 Rheology ......................................................................................... 85
3.8 Materials Preparation ...................................................................... 85
3.8.1 Reduced Graphene Oxide ................................................................ 85
3.8.2 Reduced Graphene Oxide-Polyoxometalate ......................................... 85
3.8.3 Lithium Iron Phosphate ................................................................... 86
3.8.4 Electrochemical Exfoliated Few Layers Graphene ................................. 86
3.8.5 Graphene Film Preparation .............................................................. 87
Chapter 4. Molecular Flowing Systems. Quinones in Organic Electrolytes
....................................................................................................................... 91
4.1 Context ............................................................................................ 93
4.2 Introduction ........................................................................................................ 94
4.3 Experimental Section ...................................................................... 96
4.4 Results and Discussion .................................................................... 97
4.5 Conclusions ..................................................................................... 114
Chapter 5. Hybrid Nanofluids Made of Reduced Graphene Oxide and
Polyoxometalates ........................................................................................ 119
5.1 Context............................................................................................. 121
5.2 Introduction ...................................................................................... 122
5.3 Experimental Section ....................................................................... 123
5.4 Results and Discussion .................................................................... 124
5.5 Conclusions ..................................................................................... 136
Chapter 6. From hybrid Nanofluid to hybrid cells. The rGO/DABA-
LiFePO4 system ........................................................................................... 141
6.1 Context............................................................................................. 143
6.2 Introduction ..................................................................................... 144
6.3 Experimental Section ....................................................................... 148
6.4 Results and Discussion .................................................................... 151
6.5 Conclusions ..................................................................................... 161
Chapter 7. New and improved cell and method for the production of
graphene by electrochemical exfoliation of graphites .............................. 165

Page | vii
7.1 Context............................................................................................. 167
7.2 State of the art ................................................................................. 167
7.3 Patent .............................................................................................. 170
7.4 Results ............................................................................................. 178
Chapter 8. Conclusions .............................................................................. 191
Appendix. Resumen en Castellano ............................................................. 199

Page | viii

Page | 1
List of Publications
The following publications have been published or submitted directly related to the
research carried out during this thesis:
Article: Rueda-García, D., Benages-Vilau, R., Gómez-Romero, P*. To Flow or
not to Flow. A perspective on the evolution of flowable electroactive materials
and devices for large-scale energy storage. Submitted Journal of Power Sources.
Article: Rueda-García, D., Dubal, D. P., Hugenin, F. & Gómez-Romero, P*.
Hurdles to organic quinone flow cells. Electrode passivation by quinone reduction
in acetonitrile Li electrolytes. J. Power Sources 350, 9–17 (2017). Doi:
10.1016/j.jpowsour.2017.03.048
Article: Dubal, D. P., Rueda-Garcia, D., Marchante, C., Benages, R. & Gomez-
Romero*, P. Hybrid Graphene-Polyoxometalates Nanofluids as Liquid Electrodes
for Dual Energy Storage in Novel Flow Cells. Chem. Rec. 1–10 (2018).
Doi:10.1002/tcr.201700116
Article: Rueda-Garcia, D. et al. Battery and supercapacitor materials in flow
cells. Electrochemical energy storage in a LiFePO4 / reduced graphene oxide
aqueous nanofluid. Electrochim. Acta 281, 594–600 (2018). Doi:
10.1016/j.electacta.2018.05.151
Article: Rueda-García D. et al. From thermal to electroactive graphene
nanofluids. Energies 12(23), 4545 (2019). Doi: 10.3390/en12234545
European Patent application: Rueda-García D. and Gomez-Romero P.
Electrolytic cell and procedure for the preparation of graphene by means of
electrochemical exfoliation. Application No./Patent No. 18382798.9 – 1108 (date
of filing 12-11-18). Presently in PCT.
In addition to these articles, the author of this thesis is a co-author in the following articles
as a result of various collaborative works/projects:
1. Lima, G., Dubal, D. P., Rueda-garcía, D., Gomez-Romero, P. and Huguenin, F.
Energy harvesting from neutralization reactions with saline feedback.
Electrochim. Acta 275, 145–154 (2018). Doi: 10.1016/j.electacta.2018.04.075
2. Ivana, Š. et al. Comparison of insulin determination on NiNPs/chitosan-MWCNTs
and NiONPs/chitosan-MWCNTs modified pencil graphite electrode.
Electroanalysis 1–11 (2018). doi:10.1002/elan.201800483
3. Šišoláková, I. et al. Influence of a polymer membrane on the electrochemical
determination of insulin in nanomodified screen printed carbon electrodes.
Bioelectrochemistry 130, (2019). Doi: 10.1016/j.bioelechem.2019.06.011

Page | 2

Page | 3
List of Acronyms
AC – Alternate current
AQ – Anthraquinone
BQ – Benzoquinone
CE – Counter electrode
CP – Cyclic Polarization
CV – Cyclic Voltammetry
DABA - 3,4-diaminobenzoic acid
DC – Direct current
EDL – Electrical double layer
EDX – Energy Dispersive X-ray Spectroscopy
EFC – Electrochemical flow capacitors
GCPL – Galvanostatic Cyclic with Potential Limitation
HENFs – Hybrid Electroactive Nanofluids
IHL – Inner Helmholtz layer
IL – ionic liquid
LFP – LiFePO4
MBQ – Methyl-p-benzoquinone
NPs – nanoparticles
NQ – 1,4-naphthoquinone
OHL – Outer Helmholtz layer
PEIS – Potentiostatic Electrochemical Impedance Spectroscopy
POMs – Polyoxometalates
RE – Reference electrode
RFB - Redox flow battery
RGO – reduced graphene oxide
SAED – Selected Area Electron Diffraction
SCs – Supercapacitors

Page | 4
SEM – Scanning Electron Microscopy
SSA – Specific Surface Area
SSFC – Semi-solid flow cells
TEATFB - tetraethylammonium tetrafluoroborate
TEM – Transmission Electron Microscopy
WE – Working electrode
XPS – X-ray Photoelectron Spectroscopy
XRD – X-ray diffraction
Z – Impedance
Zj – Imaginary component of Impedance
Zr – Real component of Impedance
From the perspective “To Flow or not flow”
TEMPO - 2,2,6,6- tetramethylpiperidine 1-oxyl
2,7-AQDS - anthraquinone-2,7-disulfonic acid
BQDSH2 - 1,2-dihydrobenzoquinone-3,5-disulphonic acid
AQDS - 9,10-anthraquinone-2,7-disulfonic acid (AQDS)/BQDS
BP – Benzophenone
DBB - 1,4-di-tert-butyl-2,5-dimethoxybenzene
TEATFSI - tetraethylammonium bis(trifluoromethylsulfonyl)imide
TEAPF6 - tetraethylammonium hexaflorophosphate
EC - ethylene carbonate
PC - propylene carbonate
EMC - Ethyl methyl carbonate
2,6-DHAQ - 2,6-dihydroxyanthraquinone
2,6-DBEAQ - 4,4-((9,10-anthraquinone-2,6-diyl)dioxy)dibutyrate
Viologen - 1,1′-Dimethyl-4,4′-bipyridinium dichloride
LiTFSI - Lithium bis(trifluoromethanesulfonyl)imide
KB – Ketjen black
CB – Carbon black

Page | 5
MCM - Mesoporous carbon microspheres
RVC – Reticulated vitreous carbon
DMC - Dimethyl carbonate
DOL - 1,3-dioxolane
DME - 1,2-dimethoxyethane
DMTS - dimethyl trisulfide
SWNTs - single wall nanotubes
BMPL NTf2 - N-butyl-N-methyl pyrrolidiniumbis- (trifuoromethylsulfonyl) amide

Page | 6

Desing of novel electroactive nanofluids for flow cell
Chapter 1. Introduction Page | 7
CHAPTER 1
INTRODUCTION

Desing of novel electroactive nanofluids for flow cell
Chapter 1. Introduction Page | 8

Desing of novel electroactive nanofluids for flow cell
Chapter 1. Introduction Page | 9
1.1 General Introduction
The world’s energy model is changing. The growing energy demand, a global
awareness of climatic change and the search for more efficient energy models
(combustion models show mean values of 20-25% of energy efficiency) are boosting this
inescapable change. Almost 27% of the worldwide electrical energy generated in 2017
was from renewable energy sources1. And by 2040, worldwide energy demand is
expected to increase by 40%2; due mainly to the economic growth of countries like India,
China and Africa. In contrast, the demand for energy in developed countries is expected
to fall: the EU (-15%), USA (-3%) and Japan (-12%) due to the implantation of more
efficient energy models3.
Efficiency is probably the most significant challenge, and thus a strong increase in
electric systems/devices at the expense of fuel engine systems/devices is expected,
leading to a 90% rise in electric power demand from today to 20402 and the emergence
of smart grids as the key solution to face this challenge4. A smart grid allows several
energy sources to be managed efficiently, saving energy when it is not needed and
providing energy when it is necessary. Neither the demand for energy nor the production
of energy from renewable sources is constant so devices able to store and provide large
amounts of energy intermittently are necessary. Presently, flow cells constitute the
energy storage technology that would contribute the most to make this possible and with
efficiency5. Unlike conventional batteries, energy density is effectively detached from
power density in flow cells: energy is proportional to the size of the external reservoir, so
they allow a modular design, good scalability and flexible operation. Furthermore, as the
electroactive materials are solutions, flow cells don’t suffer the memory effects and phase
changes of conventional batteries caused by their use of solid active materials. Such
materials suffer a loss of capacity in each process of charge/discharge, which makes
conventional batteries bad candidates for the long-term intermittent storage and
provision of energy.
Flow cells can be the load-levelling devices to enable a smart grid to manage a more
efficient use of the energy produced, but currently we need more than energy: we also
need power. Time in P=E/t becomes a critical point, energy must be provided in short
periods of time and that’s a problem for batteries because of the sluggish diffusion of
ions in comparison with electron transport. A battery is an electro-ionic device in which
each electron that moves from one electrode to the other must be compensated by an
ion in order to keep the charge neutrality in the electrodes. Thus, ion mobility, which
determines the current of the device, is the limiting step in batteries. In conventional solid
Desing of novel electroactive nanofluids for flow cell
Chapter 1. Introduction Page | 10
batteries the slower process is the ion diffusion though the solid active materials which
depends on the crystal structure and morphology of the materials. Ion diffusion trough
the solid material frequently implies phase changes that can lead to volume variations in
the material that create defects in the crystal structure of the active material. These
defects block the channels of ion diffusion preventing the ions from reaching part of the
active site and therefore the capacity of the battery is reduced. In a battery a redox
reaction takes place: in one electrode there is oxidation and in the other reduction. As a
redox process takes place at a specific potential, the potential of a battery is constant
(fixed by the redox process taking place). Although the slower step is the ion diffusion
though the solid active materials, the diffusion of ions and the associated resistance
through the whole cell can also have a huge impact on the battery's performance if it is
not optimized particularly in respect of distance between the electrodes, pressure applied
to them, electrolyte chosen and the separator used.
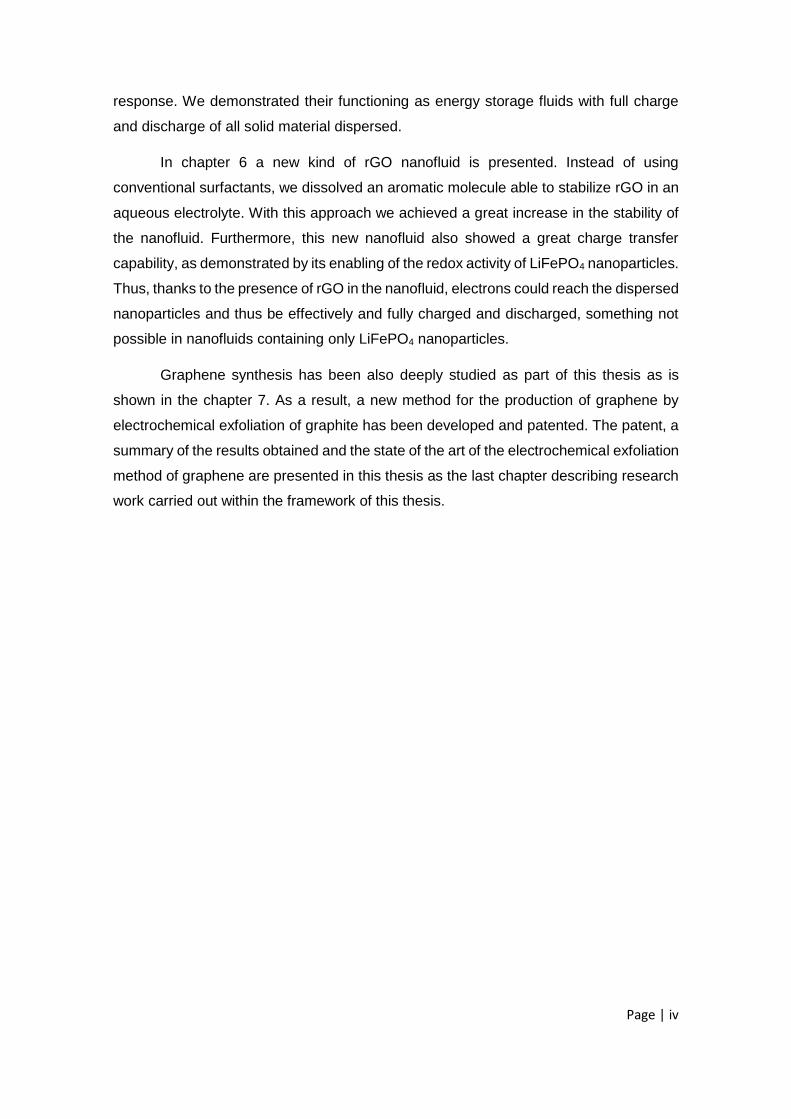
On the other hand, we have supercapacitors (SCs) devices that can be charged and
discharged very quickly and cycled hundreds of thousands of times but that cannot store
large amounts of charge. SCs store charge by a pure electrostatic mechanism. When
the electrodes are polarized, the ions of the electrolyte balance the electrodes' charge,
but only at the surface. Thus, energy storage in SCs is only at the surface and therefore
the capacity of SCs is notability smaller than batteries, which store energy though all the
bulk material. But, thanks to the fact that charge is only stored on the electrode surface,
with SCs there’s no ion diffusion though the material and as a result, SCs deliver notably
higher power in comparison with batteries because the slower step of ion diffusion
though the solid active materials is avoided. Furthermore, cyclability is also improved in
SCs because defects generated in the active material are minimised due to the activity
of ions at the electrode surface.
Fig.1 Potential evolution in a battery and in a SC.

Desing of novel electroactive nanofluids for flow cell
Chapter 1. Introduction Page | 11
Thus, it is highly desirable to combine a supercapacitor and a battery in the same
device in order to get the large capacity of the batteries and the large power of the
capacitors simultaneously6 with the grand challenge to reach values similar to those of
the fuels shown in the Ragone plot, Figure 2, but in this case with better energy efficiency
and without toxic emissions.
Fig.2 Ragone plot with Specific Energy and Power for different energy storage devices. .
Reprinted from ref 6 with permission of the corresponding author Pedro Gómez-Romero.
A hybrid system would allow faster charges and discharges given a device with
large energy and power density. However, to achieve this synergy, it is necessary not
only to create hybrid materials/solutions, but also to optimize the design of the
electrochemical cells. Indeed, a hybrid device can be achieved without hybrid materials,
simply by combining different kinds of non-hybrid materials in each electrode (e.g. battery
material in one electrode and a capacitor material in the other). Therefore, cell design
appears again as fundamentally important in the design of the device6.
Flow cell design (Fig. 3) usually consists of an electrochemical cell where the
electroactive solutions flow through a pump system to the electrochemical cell and are
oxidized/reduced, if it works as battery or charged/discharged if it works as a capacitor.
The solutions and electrodes/current collector are separated by a selective ion
membrane if the system works as battery and just by a physical separator if it works as
a capacitor.

Desing of novel electroactive nanofluids for flow cell
Chapter 1. Introduction Page | 12
Fig.3 General flow cell scheme
The electroactive solutions are stored in external reservoirs, making flow cell
capacity proportional to the size of the reservoirs (and of course to the concentration of
the electroactive solutions). Power (P = I·V) depends on the number of cells (in series,
which improves V, in parallel, which improves I) and the area of the electrodes (larger
area, larger I), so power and capacity are effectively decoupled, since increasing the
reservoir size without increasing the area of the current collectors only increases the
capacity but not the power. It is also critical to find a flow rate and channel design for the
electrochemical cell that allow ions to pass though the membrane efficiently and also
maintain efficient contact between the active species and the current collectors 7–12.
These features make flow cells ideal systems for coupling to energy production
from intermittent renewable sources. Furthermore, thanks to the module design of the
flow cells, they can be perfectly adjusted to any kind of intermittency, storage and power
need, and are able to store the surplus energy produced during high activity production
and return it when renewable sources stop producing energy. This would be very
expensive with conventional batteries because repeated cycling decreases their
capacity.
Flow cells based on the redox process have been widely studied since their
invention by Thaller in 197413 and were originally called redox flow batteries (RFBs).

Desing of novel electroactive nanofluids for flow cell
Chapter 1. Introduction Page | 13
However, flow cells based on capacitive energy storage mechanisms are relatively
recent and are nowadays referred to as electrochemical flow capacitors (EFCs).
RFBs are usually classified according to the electroactive species (metal ions,
molecules, complexes…) and its physical state inside the flow cell (liquid, solid, gas,
slurry…). However, the channel structure/design, material, position and shape of the
electrodes, kind of membrane and type of flow of the electrochemical cell are not
normally considered. Consequently, flow cell design or configuration is not reflected in
general classifications, cells used to be optimized for each case studied.
The main types of RFBs are: all-liquid, metal anode, hydrogen anode, oxygen
cathode and semi-solid. As the name implies, in the all-liquid RFB, the electroactive
species are completely dissolved in the electroactive fluid that flows in the cell and store
the charge outside it. This kind of RFB works with ions, molecules and complexes, and
can also work with water or polar organic solvents, which require a significant electrolyte
concentration due to the large ionic resistance of the organic polar solvents, however,
larger potential windows can be used in comparison with water. This helps to increase
the energy of the battery, E=Q·V (energy E, charge Q and V potential). Semi-solid flow
cells (SSFC) are based on carbon slurries combined with redox active materials. This
approach allows a notable increase of energy density, but negatively affects the final
efficiency of the devices due to the high energy needed to flow the high viscous slurries
used. High viscosity is associated to the high concentration of solid needed in principle
to get good electrical percolation, with carbon particles transferring electrons from the
current collector to the redox active particles. Slurries can also be formulated without the
addition of a redox active species, in which case they are used as electrodes for
electrochemical flow capacitors (EFC).
Power and energy are completely decoupled in the all-liquid, semisolid RFB,
hydrogen anode and oxygen cathode, but not in the metal anode because in this RFB
an increase of the current collector (power) implies an increase in the amount of active
solid metal material (capacity).
Finally, there are the nanofluids, a new topic that has appeared very recently in
the field of flow cells These fluids are based on stable dispersions of nanoparticles into
an electrolyte with the aim of improving the energy density due to the large energy
density of a solid active material in comparison with a solution, but without the large
viscosity derived from the addition of large solid particles into an electrolyte.
However, large viscosity would only be a drawback in cases when flowing is
unavoidable. Systems with large viscosity can be very interesting thanks to their potential
for large energy density. Thus, we could pose the question: To flow or not to flow?

Desing of novel electroactive nanofluids for flow cell
Chapter 1. Introduction Page | 14
We tried to explore and answer this question in this thesis, but specially in the
following perspective, which completes this introduction with an extended analysis of the
state of the art of the flow cell technology.
References
1. Janet L., S., Jay, R. & Freyr, S. Renewables 2018-Global status report. A
comprehensive annual overview of the state of renewable energy.
Advancing the global renewable energy transition-Highlights of the
REN21 Renewables 2018 Global Status Report in perspective. (2018).
doi:978-3-9818911-3-3
2. OECD/IEA. 2018 World Energy Outlook: Executive Summary. 11 (2018).
3. International Energy Agency. World Energy Outlook. Electron. Power 23,
329 (2014).
4. Amin, M. Energy: The smart-grid solution. Nature 499, 145–147 (2013).
5. Zaghib, K., Mauger, A. & Julien, C. M. Rechargeable lithium batteries for
energy storage in smart grids. Rechargeable Lithium Batteries (Elsevier
Ltd., 2015). doi:10.1016/B978-1-78242-090-3.00012-2
6. Dubal, D. P., Ayyad, O., Ruiz, V. & Gómez-Romero, P. Hybrid energy
storage: the merging of battery and supercapacitor chemistries. Chem.
Soc. Rev. 44, 1777–1790 (2015).
7. Dennison, C. R. et al. Effects of flow cell design on charge percolation
and storage in the carbon slurry electrodes of electrochemical flow
capacitors. J. Power Sources 247, 489–496 (2014).
8. Aaron, D. S. et al. Dramatic performance gains in vanadium redox flow
batteries through modified cell architecture. J. Power Sources 206, 450–
453 (2012).
9. Li, X. Modeling and simulation study of a metal free organic-inorganic
aqueous flow battery with flow through electrode. Electrochim. Acta 170,
98–109 (2015).

Desing of novel electroactive nanofluids for flow cell
Chapter 1. Introduction Page | 15
10. Watt-Smith, M. J., Ridley, P., Wills, R. G. A., Shah, A. A. & Walsh, F. C.
The importance of key operational variables and electrolyte monitoring to
the performance of an all vanadium redox flow battery. J. Chem. Technol.
Biotechnol. 88, 126–138 (2013).
11. Nikiforidis, G., Cartwright, R., Hodgson, D., Hall, D. & Berlouis, L. Factors
affecting the performance of the Zn-Ce redox flow battery. Electrochim.
Acta 140, 139–144 (2014).
12. Leung, P. K., Ponce De Leon, C. & Walsh, F. C. The influence of
operational parameters on the performance of an undivided zinc-cerium
flow battery. Electrochim. Acta 80, 7–14 (2012).
13. Thaller, L. H. Electrically rechargeable redox flow cells. (1974).
Report/Patent Number: NASA-TM-X-71540, E-7922

Desing of novel electroactive nanofluids for flow cell
Chapter 1. Introduction Page | 16
Desing of novel electroactive nanofluids for flow cell
Chapter 1. Introduction Page | 17
1.2 To flow or not to flow. A perspective on
the evolution of flowable electroactive
materials and devices for large-scale energy
storage
Abstract
Massive energy storage is needed in order to match the steadily increasing share
of intermittent renewable generation. Yet, no present technology is truly up to that task.
Redox Flow Batteries were first postulated for high-capacity stationary storage but their
limited energy density represents a serious drawback. In addition to new chemistries,
new cell designs and new concepts are necessary and some have been proposed in
recent years revolving around the idea of effective large-scale storage. From semi-solid
to semi-liquid, to liquid metals or to nanofluids electrodes labels and concepts abound
and are beginning to conform a constellation of competing technologies, each with their
pros and cons. This perspective overview intends to relate and compare these concepts
and technologies and to ponder the remaining gaps that still need to be addressed and
filled in order to develop massive and cost-effective electrochemical energy storage.
Broader context
Energy storage has never been a key piece of our global energy cycle. Until now.
The 20th Century witnessed the use of Li-ion batteries (LIBs) as the ultimate technology
to just feed consumer electronics. But now we are witnessing a Cambrian explosion of
energy storage variety, with demands that range from tiny, set-and-forget
supercapacitors, to wearables, to EV batteries to high power storage. This is resulting in
a feverish search for better LIBs, for beyond LIBs, for hybrid supercapacitors or for novel
flow cells. The latter are the ones better suited for stationary applications to begin
bridging the gap between our hastily growing needs of storage and our meagre overall
present capacity. Indeed, global energy demand is expected to increase over this
century1. And by all accounts an increasing contribution to this energy will be generated
by sustainable technologies1. Redox Flow Batteries (RFBs) were the first to be

Desing of novel electroactive nanofluids for flow cell
Chapter 1. Introduction Page | 18
postulated as the fittest for high-power stationary applications but their drawbacks are
multiple and new concepts are popping up: semi-solid, semi-liquid and fully liquid
electrodes are being proposed and the question arises as to whether alternative
concepts and designs, in addition to battery chemistries, could be instrumental in finally
finding the silver bullet (or the many lead pellets) needed for massive energy storage.
Maybe to answer this grand challenge we should not go with the flow.

Desing of novel electroactive nanofluids for flow cell
Chapter 1. Introduction Page | 19
General overview
Renewable energy generation is advancing at a steady pace worldwide. Energy
storage must catch up quickly in all its forms through a variety of biological, chemical or
electrochemical vectors. Figure 1 shows some of these technologies on a plot that
underscores the nominal power and discharge time for each of them. Pumped
hydroelectric power used to be the only one with practical implementation in the GW
scale, and although many pilot plants and demonstrators have been built for other
technologies their consolidation is being excruciatingly slow.
Fig.1 Various energy storage technologies depicted as a function of their nominal power and discharge
time. Mechanical (yellow), magnetic (light grey) thermal (orange) chemical (purple), electrochemical
(green) and electrophysical (blue-green) technologies are included.
Among batteries, Redox Flow Batteries (RFBs) have been postulated as the ones
better suited for high capacity stationary applications. Yet, their drawbacks are multiple
and new concepts are popping up: semi-solid, semi-liquid and fully liquid electrodes are
being proposed
That is why there is still plenty of room for new concepts, new materials and new
devices in the field of energy storage. New materials but also new types of materials
have been reported to go beyond well-established state of the art Redox Flow Batteries
like the “All-Vanadium” system. From nanofluids to pastes, from flowable to stationary
dispersions the field is blooming with new concepts and ideas. This introduction is an
attempt to relate these apparently dispersed approaches and analyze possible or
desirable evolution of the materials and devices developed

Desing of novel electroactive nanofluids for flow cell
Chapter 1. Introduction Page | 20
Actually, many of the newcomers to the take-off runway of storage technologies are
essentially old concepts that were never fully developed due to a lack of technical means
to address their drawbacks combined with a lack of specific niche applications. Lithium-
Sulfur batteries or Flow Cells are two major examples.
Redox flow batteries (RFBs) were the first example of flow cells and were
introduced by Thaller in 19742 with Fe(III)/Fe(II) and Cr(II)/Cr(III) solutions as cathode
and anode fluids respectively. More recently, flow cells based on capacitive energy
storage mechanisms have been proposed and are nowadays referred to as
electrochemical flow capacitors (EFCs). Finally, there are the electroactive nanofluids, a
new topic that has appeared very recently. These liquid materials are based on stable
dispersions of nanoparticles into a liquid electrolyte with the aim of improving the energy
density in comparison with electroactive solutions.
Generally speaking, we could highlight two main characteristics that will
determine the overall performance of a flow cell, namely, the nature of the electrolyte
and the physical state of the electroactive materials, Figure 2 summarizes the main
advantages and drawbacks of each.
Fig. 2 Schematic diagram summarizing the performance of flowable electroactive systems
Aqueous electrolytes would provide large power density due to their greater ion
mobility. And when metal ions are used as electroactive redox materials almost infinite
cyclability could be reached but a thermodynamically limited voltage and low energy
density related to low solubility limits would be expected. On the other hand, organic
electrolytes would allow work with high voltages and large concentrations of organic
redox active molecules thus would provide large energy density, but because this large

Desing of novel electroactive nanofluids for flow cell
Chapter 1. Introduction Page | 21
concentration would promote spurious reactions that would limit the cyclability and
efficiency of the cell, finally because the reduced mobility of the ions into organic
electrolytes would also limit the power density of a flow cell with an organic electrolyte.
Solved active species into the electrolyte have an energy density limitation imposed by
the solubility, the cyclability would depend on the stability of the solved active species
which used to be more reactive when are solved, but the low viscosity and the continuous
flux of current would provide good efficiency to the flow cell. Moreover, thick pastes or
slurries would penalize the flow cell efficiency due to i) the extra high energy needed for
pumping the heavily viscous pastes and ii) the variable current derived from an
intermittent flow needed for the effective utilization of the electroactive particles in the
paste.
Power and energy are completely decoupled in the all-liquid and semisolid RFB,
which allows for a modular design that could be perfectly adapted to any kind of
harvesting and power supply demand, thus are a perfect technology to be coupled to
renewable energy sources.
All liquid RFB
There is one clear predominant chemistry related to RFB technology in research
and applications, Vanadium RFBs are the most prominent example of that technology
and have been deeply studied over the years to the point that, in recent years, research
has been focused more on cell optimization than in the chemistry. Indeed, Vanadium
RFB is the predominant RFB used in engineering studied about flow cells research. As
a proof of it the present year papers published are mainly focus on two topics, first
development3,4 and performance5 of the membrane, and second cell improvement:
corrosion6, temperature7,8 and plane cell voltage9,10 effects on the performance of RFB.
Vanadium RFB has an energy density of 40Wh·L-1 and a specific energy of 25Wh·Kg-1,
operate between 1.6 and 1.3V 11, but corrosion issues, solubility limited up to 1.5-1.8M7
and the high price of vanadium, has promoted research on alternative RFBs.
Unfortunately, up today no better chemistry for RFBs than the Vanadium have been
found when is considered the overall performance of the flow cell (capacity, efficiency,
cyclability and stability).
Inorganic solved active materials were the first chemistries studied in RFB,
starting with the first RFB based on Fe/Cr chemistry published by Thaller, L.H in 19742.
Cell voltage is 1.18V with a specific energy of 15Wh·Kg-1 12, Fe3+/Fe2+ redox couple
shows good reversibility and fast kinetics working in acid electrolyte. However, the slow

Desing of novel electroactive nanofluids for flow cell
Chapter 1. Introduction Page | 22
kinetics of Cr3+/Cr2+ usually requires an elevated operation temperature (~65ºC)13 or
catalysts like Bi o Bi/Pb on carbon11, which significantly increases the cost. Meanwhile,
the low redox potential of Cr3+/Cr2 may cause H2 evolution, which limits the coulombic
efficiency and cycle life11,13,14. Most recent publications have been about cross
contamination through the membrane and system optimization15 .
After Fe/Cr came the halogen RFB, based on a soluble metal ion in the anodic
side and in general Br2 in the cathodic side, with Zn/Br and V/Br being the most relevant
examples but with the drawback of the generation of Br2 possibly leading to corrosion
problems. Many other redox couples have been tried over time standing out:
polysulfide/Br, Zn/Cr, Zn/Mn, or Zn/halogen, but none of them could improve the
performance of the vanadium RFB11–14,16. Only the ZnI2 couple has shown a clear
improvement with an energy density of 166 Wh·L-1 brought about by utilizing an
ambipolar electrolyte, where both cationic and anionic ions from a single soluble
compound are both energy-bearing redox active species, the electrolyte eliminated the
need for non-active counter ions and a high concentration ZnI2 of 5.0 M was
demonstrated17. Nevertheless, I2 precipitation and high viscosity are important issues to
be solved for a practical application of the system.
Redox active ambipolar electrolytes are one of the most prominent solutions for
RFB technology as recently shown by Xiaohong Zhang and col. who used a synthetic
ambipolar electrolyte a highly water-soluble (up to 1.2 M) artificial bipolar molecule
containing cathode-active ferrocene moiety and anode-active bipyridinium moiety18.
They achieved 4000 cycles of this ambipolar electrolyte with a 75% capacity retention
and an efficiency of > 99.8%, breaking the traditional cyclability limit of 100 cycles of the
redox organic active species. Although their ambipolar electrolyte could reach 1.2 M, the
study was done at a concentration of 0.5M of the ambipolar electrolyte supported by 1M
of NaCl. Thus, the amazing stability demonstrated would need to be verified under high
concentration conditions in order to apply this solution in real devices.

Desing of novel electroactive nanofluids for flow cell
Chapter 1. Introduction Page | 23
Fig. 3 “Artificial bipolar” molecules for SORFB application. (a) Schematic demonstration of the
existence form of a general “artificial bipolar” molecule in a charged SORFB. (b) Representative redox-
active molecules for the design of the “artificial bipolar” molecule. (c) A proposed bipolar Fc-bipy3+ for
SORFB18. Reprinted from Journal of Power Sources, 417, Zhu, Y. et al, Enhanced cyclability of organic
redox flow batteries enabled by an artificial bipolar molecule in neutral aqueous electrolyte, 83-89,
Copyright (2019), with permission from Elsevier.
While ambipolar electrolytes are the most recent advance in the redox organic
active species for RFB, a large variety of organic molecules have been studied as active
redox species: single organic molecules, organic polymers, organic radicals and organic
frameworks. The use of organic redox couples in aqueous or non-aqueous electrolytes
is a promising approach for reducing the overall cost in the long-term, since these
materials can be low-cost and abundant in comparison with large part of metals. The
performance of such redox couples can be tuned by modifying their chemical structure.
In recent years, significant developments in organic redox flow batteries has taken place
with the introduction of new groups of highly soluble organic molecules, capable of
providing a cell voltage and charge capacity comparable to conventional metal-based
systems or even better19,20.
Organometallic compounds and hybrid inorganic/organic systems have also
been proposed and studied. Recently Aurore Lê et al. assembled a full and high soluble
Fe complexes RFB21 stable hundreds of cycles with a volumetric capacity superior to 10
Ah·L-1. In addition to improved solubility, metal complexes haven also been used to shift
the potential of the active redox specie22,23 or increase the potential window of the RFB24.
The most common inorganic-organic approach is the combination of one of each species
in each side of the redox battery, like the recent anthraquinone-2,7-disulfonic acid /KI
RFB showed by Wonmi Lee et al. in which they proved that the addition of ethylene glycol
increases the solubility of 2,7-AQDS and the redox activity of KI25 but only 10 cycles
were done in this study. Another recent work based on the combination of inorganic-
organic RFB was the optimization cell performed by Amirreza Khataee and col. of a
quinone/Br RFB26 , which studied the effect of electrode thickness, flow rate, membrane
Desing of novel electroactive nanofluids for flow cell
Chapter 1. Introduction Page | 24
thickness and concentration of redox active species. An increase of 12% in power
density was achieved by cell optimization, however the performance of the cell was not
better than the common Vanadium RFB.
Despite the fact that organic compounds have been relatively recent topics of
RFB research they have assumed enormous importance and relevance because of their
low equivalent weights, fast kinetics, wide window of electrochemical stability, flexibility
and tuneability, and as just mentioned above, their complexes also allow their tuneability
to be extended to metal ions. Consequently, current research in flow cells is now more
focused on organic compounds than on inorganic metal ions19,20.
In spite of poor solubility of organic compounds in water, a large amount of
research has been done on water soluble organic compounds due to the fact that water
is cheap, abundant, eco-friendly, safe and has a great ionic conductivity leading to great
power density in comparison with polar organic solvents, which excel in cell voltage and
energy density but are weaker in terms of cost, safety and power density27. An example
of the large complex organic compounds developed to work in aqueous electrolytes is
the work done by Tino Hagemann et al. In their study they presented a RFB that employs
a TEMPO containing copolymer as catholyte and the viologen derivative N,N-dimethyl-
4,4-bipyridinium dichloride as anolyte in an aqueous sodium chloride solution, which
delivered a cell voltage of 1.3V and after cell optimization work in which the proper
membrane, electrolyte concentration and flow rate were determined, after 100 cycles
they achieved coulombic efficiencies of up to 95%, an energy efficiency of 85% and an
energy density of 3.8Wh·L-1. However, from 100 to 400 cycles the capacity of the system
decreased from 44 mAh to 2.8 mAh28. More simple molecules have been also studied
with quinones probably the most studied organic molecules for RFB because of its good
kinetics in water, low molecular weight, low cost and high energy density (2 moles of
electrons per mole of quinone). However, as a variable, cell optimization has been shown
to be as important as the redox active materials or the electrolyte. An example of
quinones aqueous RFB cell optimization is the work done by Cao and col. in which they
used nitrogen-doped porous graphene (NPG) as a highly efficient cathodic
electrocatalyst for the redox reaction of 1,2-dihydrobenzoquinone-3,5-disulphonic acid
(BQDSH2), showing 6.7 times higher rate constant and much lower peak potential
separation values compared to those of a glassy carbon electrode. Furthermore, a 9,10-
anthraquinone-2,7-disulfonic acid (AQDS)/BQDS RFB with NPGs as the cathodic
BQDS/BQDSH2 catalyst exhibited a maximum power density of ca. 62.4 mW cm-2, about
3.3 times higher than that of the pristine RFB without NPGs, and a minimal discharge
capacity fade during the cycling test upon 100 cycles29.

Desing of novel electroactive nanofluids for flow cell
Chapter 1. Introduction Page | 25
Low energy density is one of the most important issues concerning RFBs.
Increasing the working voltage and specific capacity are the two possible lines of action
for improvement. Higher voltages can be achieved by electrode engineering through
molecular design whereas higher concentrations of active species would lead to greater
capacities
A recent review30 has summarized the many efforts along this line in recent years.
Design new molecules with large potentials (electron-withdrawing groups tend to
increase redox potentials and electron-donating groups tend to reduce redox potential)
high solubility (alkane groups are usually the worst option and the amide groups are
usually the best option); and high electrochemical activity and low chemical reactivity
(promote steric repulsions).
For example, Wang et al substituted BP for electron-donating groups (4,4-
dimethylbenzophenone) and obtained a cell open-circuit voltage of 2.97 V with DBB as
cathode and working with 5mM concentration of actives species and 0.5M of TEAPF6,
they obtained an average discharge capacity of 52.1 mAh·L-1, and an average coulombic
efficiency of 72% over 95 cycles31.
And what about organic electrolytes for these electroactive organic molecules?
The higher concentrations allowed by organic solvents could seem an obvious solution
to the low energy density affecting liquid flow cells. Yet, most frequently, these systems
have shown low stability and poor cyclability32. For example, Huang et al.'s studied a 3V
RFB based on 2e- redox process by phenothiazine catholyte and anthraquinone (AQ)
anolyte in acetonitrile tetraethylammonium tetrafluoroborate (TEABF) 1M, but only 20
cycles where possible despite working with 0.05M active materials33. In another report,
X. Wei et al. reported record energy densities of188Wh·L-1, using half-cell based on Li
metal anode and a 2M TEMPO solution in 2.3 M LiPF6 /EC-PC-EMC cathode. However
their system presented serious stability problems and was only subject to 20 cycles34.
Rueda-Garcia et al have shown the occurrence of irreversible reactions
(dimerization, polymerization and other intermolecular reactions) in specific quinones
with organic electrolytes due to the formation of radicals and the influence of steric
hindrance on the kinetics of those reactions35. Paradoxically, the high concentrations
which could allow for increased specific capacity and energy density also lead to the
detrimental spurious reactions which dramatically reduce the energy density upon
cycling20. Thus, unwanted. irreversible and spurious reactions are probably the reason
why most studies on organic solvents are performed with small concentrations and just
a few cycles.
Steric hindrance has great potential for solving the problem of stability as Rueda-
Garcia et al. proved by studding the electrochemical reversibility of different size

Desing of novel electroactive nanofluids for flow cell
Chapter 1. Introduction Page | 26
quinones in a Li-CH3CN electrolyte35 or as shown by David G. Kwabi who functionalized
the 2,6-dihydroxyanthraquinone (2,6-DHAQ) with highly alkali-soluble carboxylate
terminal groups. The resulting negative electrolyte material 4,4-((9,10-anthraquinone-
2,6-diyl)dioxy)dibutyrate (2,6-DBEAQ) was six times more soluble than 2,6-DHAQ at pH
12. Additionally, symmetric cell under Ar atmosphere with 0.1M cycling 2,6-DBEAQ on
both sides of the cell demonstrated a remarkable capacity fade rate of <0.01%/day and
<0.001%/cycle36.
On the other hand, radicals can be stabilized and harnessed for energy storage
(for example, by electron-withdrawing groups, donating groups or conjugation near the
radical locus). And again, steric hindrance can significantly increase shelf-life by
physically blocking bond formation37.
Indeed, radicals have also been used as organic active redox materials, with
TEMPO being the most studied, radical compounds have a great potential as shown by
Bo Hu et al. In this study, TEMPO and 1,1′-Dimethyl-4,4′-bipyridinium dichloride
(viologen) radicals were functionalized with 3-(trimethylammonium) and 3-
(trimethylammonium)propyl respectively to provide steric and charge repulsion between
them and used as 0.5M catholyte and anolyte respectively in 0.5M aqueous NaCl . The
cell showed 1.38V and a remarkable 97.48% capacity retention after 500 cycles under
Ar atmosphere38. In addition, Xinyu Li reported another work based on a
TEMPO/viologen RFB under Ar atmosphere in which they showed an improvement of
cell performance by a capacity increase of 16.7%, and an energy efficiency improvement
of nearly 20%. These were achieved by using nitrogen-doped three-dimensional
reduced graphene oxide current collectors instead of carbon paper39 showing again the
great importance of cell optimization as a critical variable.
The electrolyte also plays a very important role in the chemical stability of the
organic redox active species as shown by X. Wang and col. who tested the cyclability of
a RFB based on benzophenone (BP) and 1,4-di-tert-butyl-2,5-dimethoxybenzene (DBB)
with 4 different acetonitrile electrolytes. They found clear differences with
tetraethylammonium bis(trifluoromethylsulfonyl)imide (TEATFSI) being the best option,
although coulombic, voltage and energy efficiencies of the battery were 97%, 46% and
44%, respectively after 50 cycles40. Wang et al. published a work in which they also
studied the effects of the electrolyte in a RFB based on BP and DBB as the anode and
cathode active species respectively. They used as base electrolyte acetonitrile 1M
hexafluorophosphate (TEAPF6) and mixed it with other more viscous polar organic
solvents finding that the best ionic conductivity and also solubility of the BP and DBB
was with the base electrolyte because it was the less viscous41.

Desing of novel electroactive nanofluids for flow cell
Chapter 1. Introduction Page | 27
Thus, low viscosity is not only important for optimal flowing but also for improved
ionic conductivity and in some cases even for increased solubility of active species.
But there is one viscosity value even more important than that of the solvent, the
viscosity of the whole fluid itself. Because, in addition to metal ions or molecular species,
researchers are beginning to put lots of other materials, such as carbons or solid phase
nanoparticles or clusters into base electrolytes, leading to new intriguing materials which
bring about the question of whether to flow or not to flow.
Semi-solid flow battery (SSFB) and electrochemical flow
capacitors (EFC)
As discussed above, solubility limits and chemical reactions between the active
species have a negative effect on the energy density and stability of RFBs. A possible
solution is the use of solid redox-active particles dispersed in the electrolyte instead of
molecules42. The high density of these particles means larger energy density and solid
particles are almost chemically inert in comparison with free dissolved molecules
However, due to the large size of those particles their diffusion to the current collectors
is sluggish so an electrically conductive medium is needed to effectively charge and
discharge them fully. Carbon slurries, which are pastes made of carbon particles usually
with surfactants and a high viscosity, have been used as such effective electrical
conductive media. Solid particles of a variety of active redox phases can be mixed into
the carbon slurry to get anolyte and catholyte of the SSFB. Yet-Ming Chiang and col.
developed a first so-called semi-solid battery in 201143, they tested 3 different
configurations based on Ketjen black (KB) in 1M LiPF6 slurry: LiCoO2 and Li4Ti5O12 (2.35
V average discharge voltage) delivered 397 Wh·L−1 (168 Wh·kg−1); LiNi0.5Mn1.5O4 and
Li4Ti5O12 (3.2 V average discharge voltage) delivered 353 Wh·L−1 (150 Wh·kg−1); and
LiCoO2 –graphite (3.8 V average discharge voltage) delivered 615 Wh·L−1 (309 Wh·kg−1).

Desing of novel electroactive nanofluids for flow cell
Chapter 1. Introduction Page | 28
Fig. 4 Schematic diagram of a SSFB (a) and picture of typical electroactive paste(b)43. Reprinted
from Duduta, M. et al. Adv. Energy Mater. 1, 511–516 (2011)
with permission from John Wiley & Sons, Inc.
It is also possible to use just the carbon slurries on their own to store energy by
a purely capacitive mechanism, as it was introduced by Gogotsi and col. with their so-
called Electrochemical Flow Capacitor (EFC)44.
Carbon slurry is the key ingredient in both approaches as it enables good
electrical and ionic conductivity, which are mandatory in both SSFBs and EFCs. The
coexistence of different physical phenomena in suspension is not trivial and leads to
complex behavior. The primary source of complexity of the SSFB and EFC is the
competition between multiple phenomena (electrochemistry plus particle dynamics plus
suspension dynamics) and quantifying the dynamics between parameters is as important
as measuring a specific parameter (like active material content, carbon content, salt
concentration, C-rate, channel depth, and so on). Monte Carlo simulations have been
carried out in order to quantify the dynamics between parameters and
detect generalizations regardless of type of cell setup45.
The electrochemical characterization of various carbon slurries by Campos et al.,
showed that those slurries containing intermediate-sized spherical particles exhibited the
highest capacitances and rate capabilities, and the longest self-discharge time for EFC
operations. This can be attributed to improved percolation through the particle network,
increased surface area and more favourable diffusion of ions through the pore-structure
of the particles. Rheological measurements showed that slurries with spherical particles
had, in general, lower viscosities than suspensions with anisometric particles.46
In addition to shape, carbon activation can also have a great influence on
performance. For example, Boota et al. found that a flowable electrode composed of
carbon spheres previously activated at 1000ºC for one hour yielded the highest
capacitance (in comparison with 800, 900 and 950ºC), rate performance, and lowest

Desing of novel electroactive nanofluids for flow cell
Chapter 1. Introduction Page | 29
equivalent series resistance values. These suspension electrodes showed a specific
capacitance of 139 F·g-1 when tested in a static configuration47.
Surfactants can also play an important role in the properties of slurries. Madec et
al. demonstrated that the rheological and electrical properties of Li4Ti5O12/Ketjen
Black/PC-LiTFSI suspensions can be improved with respect to SSFB systems if a non-
ionic surfactant, i.e., the iso-octylphenylether of polyoxyethylene or Triton X-100 (TX), is
added to the formulation. By decreasing the attractive interactions between the carbon
black primary aggregates, TX allowed the formation of suspensions with higher
electronic conductivity, unchanged stiffness at low shear rates, lower viscosity at high
shear rates, improved stability over time at rest, and their suspensions showed energy
densities of 63 Wh·kg-1 (87 Wh·L-1)48. Lee et al found that the use of surfactants for EFC
systems effectively enhanced the volumetric energy density of the system; however, as
the viscosity reduction is closely related to the decreased power performance, a careful
balance between the viscosity and system resistance is required as a function of carbon
concentration. However, a high concentration of surfactant was found to cause visible
micelles formation. Moreover, they also found that flow operation showed a notably
higher resistance in comparison with continuous non-flow operation. The different results
for non-flow and flow operation related to particle sedimentation and the charge gradient
in space as a function of time49.
Nevertheless, non-spherical particles, like (KB) show different behavior
compared with spherical particles as shown by Narayanan et al. in shear step
experiments. Their study revealed a two timescale response. The immediate effect of
decreasing the shear rate was an increase in both viscosity and electronic conductivity.
In a much slower secondary response, both quantities changed in the opposite direction,
leading to a reversal of the initial change in the conductivity. Stepwise increases in the
shear rate led to similar responses in the opposite direction. This remarkable behavior is
consistent with a picture in which agglomerating KB particles can stick directly on
contact, forming open structures, and then slowly interpenetrate and densify. The fact
that spherical CB particles show the opposite slow response suggests that the fractal
structure of the KB primary units plays an important role. The fast and slow transient
responses to a change in shear rate clearly indicate that KB agglomerates exhibit two
build up (breakup) mechanisms after decreasing (increasing) the shear rate. The fast
response was attributed to open agglomeration, and the slower response was ascribed
to an interpenetration of the fractal-like KB units. The combination of these processes
leads to a shear- and time-dependent agglomerate structure that gets frozen in on
cessation of flow, with a higher pre-shear leading to a stronger gel with a lower electronic
resistance, both critical to SSFB performance. An implication of these findings is that for

Desing of novel electroactive nanofluids for flow cell
Chapter 1. Introduction Page | 30
SSFBs operated in the absence of flow, a high pre-shear (through fast pumping or
stirring) would be the best for minimizing the electronic resistance and maximizing the
yield stress. For SSFBs operated in continuous flow, a high flow rate would minimize the
electronic resistance50.
New materials specifically designed for electrical percolative slurries have been
proposed, for example, by Tian et al. who developed a simple spray-drying technique to
produce mesoporous carbon microspheres with average particle sizes of 5 µm, high BET
surface areas of 1150-1267 m2·g-1, large pore volumes of 2-4 cm3·g-1 and controllable
mesopore sizes of 7-30 nm. The resulting MCM suspension electrode showed excellent
stability and a considerably high capacitance of 100 F·g-1 and good cycling (86% of initial
capacitance after 10000 cycles) under static conditions51. Again, as with RFBs, cell
optimization is very important in order to take full advantage of the active materials.
Akuzum et al. showed that a large improvement in cell performance could be obtained
with 3D porous current collectors. With a reticulated vitreous carbon foam current
collector with 45 pore per inch (ppi) (0.55 mm of pore size) they obtained the highest
areal (290 W·m-2) and gravimetric (580 W·kg-1) power density values among all studied
configurations, including the highest amount of Carbon Black addition (6 wt%) for the
study. The addition of 45 ppi (0.55 mm) RVC into the EFC cell resulted in an almost 10
fold increase in power density and a 2 fold increase in gravimetric capacity, with just 5%
of loss in coulombic efficiency under flow vs static and no significant difference in specific
capacity between flow or static conditions52.
Electroactive slurries do not live by carbon alone. Several types of battery
materials have been tested in combination with carbon slurries. Lithium intercalation
compounds such as LiCoO2, LiNi0.5Mn1.5O4, Li4Ti5O12 LiMn2O4, LiFePO4; but also
precipitation–dissolution chemistries (Li–sulfur, Mn–sulfur; as well as hybrid
electroplating-polymer systems like Zn/polyaniline or MnO2/Polypyrrole53. In many cases,
the studies have sought to extrapolate the well-known lithium ion battery chemistry onto
the SSFBs. An example is the work done by Liu et al. in which they used LiMn2O4 and
activated carbon slurry electrodes, with 1M Li2SO4, under static conditions achieving 23.4
Wh·kg-1, 50 W·kg-1 and an excellent coulombic efficiently after 1000 cycles54. A large
number of these types of studies use Li anodes which allow a notable increase of
capacity at the expense of energy and power coupling in the cell. An example of the
large capacities obtained is provided by the work by Hamelet et al. with a LiFePO4/LiPF6
EC-DMC/Li redox flow system that showed power density performances higher than 328
mW·cm-2 at 104 mA·cm-2 and an energy density of 50 Wh·kg-1 under static conditions55.
Li-O2 battery research has also studied this kind of system, which has been shown as a
promising solution for solving the high instability of Li-O2 technology56. Additionally,

Desing of novel electroactive nanofluids for flow cell
Chapter 1. Introduction Page | 31
systems based on Li ion technology but without metallic Li have been proposed. Chen
et al. published a remarkable work based on monodispersed Si−C nanocomposite with
ultrathin graphitic carbon coating catholyte coupled with highly concentrated LiI (5.0 M)
in 0.2 M LiClO4 1,3-dioxolane (DOL)/ 1,2-dimethoxyethane (DME) (volume ratio 1:1).
The system showed a stable cycle life of 60 cycles with a high Coulombic efficiency,
above 90%, and more than 1200mAh·g-1 of reversible capacity under static conditions57.
A new approach to Li SSFB was recently reported by Li et al. they developed a
semiliquid Li metal anode (SLMA) based on homogenous colloidal dispersion of Li
microparticles (up to 40% vol) in a polymer/carbon composite matrix that provides for
both ionic and electronic conductivity. By using Li6.4La3Zr1.4Ta0.6O12 (LLZTO) solid
electrolyte they studied the stripping/plating of the paste Li metal anode in comparison
with planar Li foil58. They found a big improvement in the performance of the semiliquid
Li metal anode which showed, at 65ºC, a stable Li deposition, with a resistance of ca.
100 Ω·cm-2 for an SLMA/LLZTO/SLMA cell at 1mA·cm-2. According to these researchers,
the corresponding cell based on Li foil (Li foil/LLZTO/Li foil) showed a resistance between
4000-5000 Ω·cm2 at just 0.1mA·cm-2.
Although Li has been the main character in SSFBs (as in conventional solid
batteries) it is important to look for alternatives since lithium can be considered an energy
critical element. In this respect, sodium is the logical alternative but only a proof of
concept regarding its use in SSFBs has been carried out. Ventosa et al. created a full
SSFB based on a NaxNi0.22Co0.11Mn0.66O2 cathode, a NaTi2(PO4)3 anode and 1.3 wt%
conductive additive dispersed in 0.5M NaPF6 in ethyl carbonate/dimethyl carbonate
(EC:DMC) as electrolyte. This system provided 2 V and only 9 Wh·L-1 and 6Wh·Kg-1
because experiments were done with dilute suspensions. However authors claimed that
a 30 vol% of active material in the suspensions would deliver 150 Wh·L-1 59.
Despite its name, SSFBs usually work in static conditions; once the material in
the electrochemical cell is charged, it is replaced by fresh uncharged material. This is
because, as it was shown above, the electrical connectivity between the particles is
notably reduced under flow conditions. However, working in static conditions with the
slurry resting on the current collectors could be considered alike a solid battery electrode.
For high energy density slurries, a high load of active material is needed and thus, high
viscosity is obtained which penalizes the efficiency of the process because high energy
is needed in order to flow the viscous slurry. A possible solution to this problem, which
keeps high energy density without increasing the viscosity, is to use shuttle molecules
that deliver the charge from electrochemical cells to the active materials, which are
stored in external reservoirs. This approach was used by Qizhao Huang et al. Who
charged and discharged LiFePO4 with 1,10-dibromoferrocene and ferrocene as shuttle

Desing of novel electroactive nanofluids for flow cell
Chapter 1. Introduction Page | 32
molecules60. Recent works have focused on the complementation of the shuttle
molecules solution with the Li-S chemistry, G. Li et al. evaluated dimethyl trisulfide
(DMTS) as a multi-electron redox mediator for discharging and charging a solid sulfur
cathode without any conductive additives. Using a Li metal anode, they got 3.83 Ah·L-1
on the initial cycles and 3.23Ah·L-1 after 40 cycles61. Full SSFB was developed by Juezhi
Yu and col. using LiFePO4 as cathode material and LiTi2(PO4)3 as anode material with
[Fe(CN)6]4−/[Fe(CN)6]3− and S2−/S22− as the redox mediators in the catholyte and anolyte
respectively. The cell revealed an anodic and cathodic volumetric capacity up to 305 and
207 Ah·L-1 for LiFePO4 and LiTi2(PO4)3 respectively and an excellent Coulombic
efficiency after 55 cycles62.
Finally, we should also mention the development of slurry batteries without
carbon. As an example, the recent work published by Z. Jin et al63 made use of
conductive polymers. They synthesized polymer microparticles based on
polyhydroquinone (PHQ) for the cathode and naphthalene-1,4,5,8-tetracarboxylic acid
dianhydride-ethylene diamine (PI1) copolymer for the anode. They prepared an all-
polymer flow cell based on 1M micropolymer concentration and 2M sulfuric acid (7.8
mPa·s for PHQ and 3.1mPa·s for PI1). The cell delivered 0.8V and an initial discharge
capacity of 8.95 Ah·L-1 at 5 mA·cm-2, (4.95 Ah·L−1 at 20mA·cm-2 ), a loss in capacity of
0.36% per cycle (0.1% at 20mA·cm-2) and Coulombic efficiency of 87% (ca. 100% at
20mA·cm-2).
From 2D-confined liquids to Nanofluids
The presence of solvent molecules in solids is not a new discovery. But with few
exceptions those solvent molecules, with water as the most paradigmatic example, do
not constitute a separate phase from the solid. In 2D-Materials with nanoconfined liquids,
could constitute a first stage into developing materials with an “internal electrolyte” as
recently discussed by Augustin and Gogotsi64. It should be noted though that even if an
improved ion diffusion is provided within a single 2D particle, the inter-particle and
particle to bulk conduction properties would also remain a challenge.
Alike liquid crystals, 2D- Materials with nanoconfined fluids could be considered
as a first stage in a conceptual line that goes from dense crystalline solids to electroactive
solutions (figure 5). Or conversely, they could be described as the final stage in the
extensively studied sol-gel process (indeed, many of the examples of these type of
materials are well-known gels such as V2O5· nH2O). On the other extreme of this

Desing of novel electroactive nanofluids for flow cell
Chapter 1. Introduction Page | 33
conceptual line we could find electroactive solutions, like the ones used in RFBs, and
sols, i.e. solid nanoparticles dispersed in a liquid.
Nanofluids are, by definition, stable dispersions of nanoparticles (NPs) in a base
liquid medium (i.e. sols) which constitute materials with flowing as a primary
characteristic. As such, nanofluids feature much lower viscosities than SSFBs, albeit
also lower loadings of the solid phase. Electroactive Nanofluids (ENFs) constitute a novel
type of materials which could be considered to lie halfway between pure solutions used
in RFBs and the pastes conforming SSFBs. They represent an opportunity to increase
the energy density with respect to the former by increasing substantially the nuclearity of
the electroactive species, while maintaining a lower viscosity for effective flowing with
respect to the latter. The primary challenge in working with nanofluids is to push forward
the “solubility limit” of dispersed nanoparticles, which was initially precluding the
formulation of practical and stable dispersions with superior energy density per liter of
fluid. This apparent drawback is not an unsurmountable intrinsic barrier and, in this
respect, nanofluids with 70 wt% (30 vol%) of solids in alkaline aqueous electrolytes and
with a viscosity below 26 cP at room temperature have been recently reported65.
Another challenge for nanofluids is to assure the total utilization of all the
electroactive particles dispersed, whether through flowing or by enhanced electron-
transfer. The percolation necessary for this was demonstrated by Yet-Ming Chiang and
col by aggregation of conducting nanoparticles at ∼1 vol % concentration in a lithium
polysulfide half-flow cell66. Similarly, stabilized graphene nanofluids have also been
shown to be instrumental in providing the mechanisms to allow for this enhanced electron
transfer in charge-discharge experiments67,68.
Nanofluids are a very recent topic and currently there are few publications about
them. Most are focused on thermal properties69 and only a handful of them are related
to electroactive nanofluids. As with RFB and SSFB, nanofluids can work though a
capacitive or faradic mechanism.
Some of the early works on electroactive nanofluids were merely centered on the
reduction of the electrolyte resistance in solid supercapacitors. For example, Kong et al.
reported an increased ionic conductivity upon addition of single wall nanotubes
(SWCNTs) in ILs of N-butyl-N-methyl pyrrolidiniumbis- (trifuoromethylsulfonyl) amide
(BMPL NTf2) which formed a stable nanofluid electrolyte and, consequently, decreased
the internal resistance of a conventional 5V supercapacitor, leading to higher
capacitance, higher energy and power densities, compared to the pure IL system70.
Similarly, Vardhan et al. improved the capacitance of MnCO3 by the addition of a small
amount of SiOx NPs (15nm) into the electrolyte, in 0.1 M Mg(ClO4)2. An enhancement of
60% in the capacitance was observed using the electrolyte with the SiOx NPs in

Desing of novel electroactive nanofluids for flow cell
Chapter 1. Introduction Page | 34
comparison with the same electrolyte without NPs71. On the other hand, and along the
line of the EFC discussed in the previous section, capacitive nanofluids can also be
designed as active materials themselves, providing much lower viscosities than slurries
while keeping the ability to charge dispersed solid nanoparticles. Thus, nanofluids made
of rGO dispersed in aqueous H2SO4 have been shown to act as capacitive flowing
electrodes themselves, with full utilization of the active material and showing fast charge
transfer and low viscosity72.
Concerning electroactive nanofluids with faradaic activity, recent work has shown
how to take advantage of a combination of the capacitive graphene species mentioned
above with redox-active clusters or NPs. Thus, it has been shown how to harness the
redox activity of polyoxometalates (POMs) in nanofluids made of hybrid rGO-POM
nanoparticles dispersed in aqueous H2SO468. Furthermore, rGO has also been shown to
enable the reversible and full cycling of conventional battery materials such as LiFePO4
dispersed as nanoparticles in the fluid67. Along this line of hybrid faradaic-capacitive
nanofluids, a recent report by Lobato and col. has studied the effect of adding graphene
derivatives to a conventional Vanadium RFB fluid73.
On the other hand, faradaic nanofluids can also be formulated with just redox-
active nanoparticles or clusters. Thus, Timofeeva and col. published a remarkable paper
in which they functionalized iron oxide NPs (30-50 nm) with 3-(trihydroxysilyl)- 1-propane
sulfonic acid obtaining stable electrochemically active colloids (~125 nm) with up to 70
wt% solids in 5.5 M LiOH, with high specific capacity (176 mAh·g-1) and low viscosity
(<30 cP) with minimal shear dependence (±2 cP). Additionally, excellent colloidal stability
(>2 weeks at rest) was demonstrated65. In another pioneering previous work, Timofeeva
and col. prepared stable nanofluids with TiO2 loadings up to 50 wt % and low viscosity
(4.33 cP) by grafting surfactant molecules. Thus, 3-(trihydroxysilyl)-1-propanesulfonic
acid (SIT) forming (Ti-O)3-Si-(CH2)3-SO3− bonds were used to modify the surface of
titania nanoparticles with negatively charged sulfonate groups74. However, this approach
partially suppressed the electrochemical activity of the Ti (III)/Ti (IV) pair (22% less than
in pristine TiO2), which could be due to the blockage of active sites by the graft or due to
a competing H2 evolution reaction, which was observed at an early onset, most likely due
to the acidic nature of the surface graft, resulting in the localized accumulation of [H+].
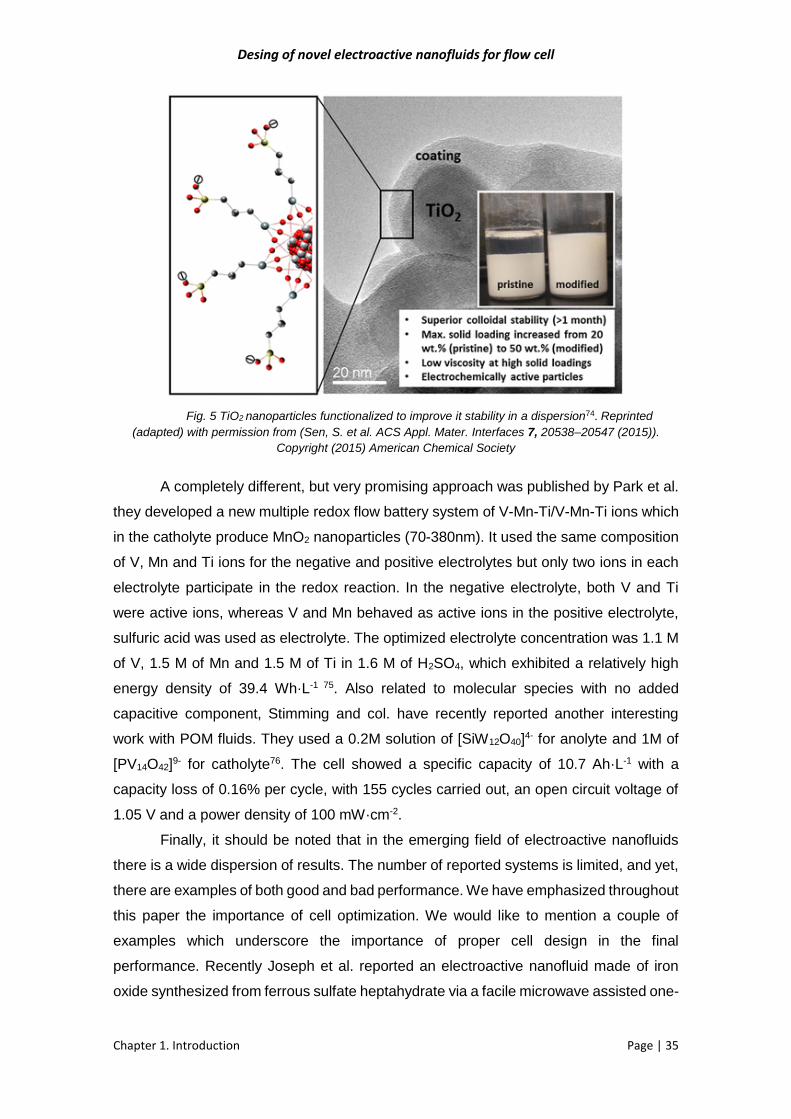
Desing of novel electroactive nanofluids for flow cell
Chapter 1. Introduction Page | 35
Fig. 5 TiO2 nanoparticles functionalized to improve it stability in a dispersion74. Reprinted
(adapted) with permission from (Sen, S. et al. ACS Appl. Mater. Interfaces 7, 20538–20547 (2015)).
Copyright (2015) American Chemical Society
A completely different, but very promising approach was published by Park et al.
they developed a new multiple redox flow battery system of V-Mn-Ti/V-Mn-Ti ions which
in the catholyte produce MnO2 nanoparticles (70-380nm). It used the same composition
of V, Mn and Ti ions for the negative and positive electrolytes but only two ions in each
electrolyte participate in the redox reaction. In the negative electrolyte, both V and Ti
were active ions, whereas V and Mn behaved as active ions in the positive electrolyte,
sulfuric acid was used as electrolyte. The optimized electrolyte concentration was 1.1 M
of V, 1.5 M of Mn and 1.5 M of Ti in 1.6 M of H2SO4, which exhibited a relatively high
energy density of 39.4 Wh·L-1 75. Also related to molecular species with no added
capacitive component, Stimming and col. have recently reported another interesting
work with POM fluids. They used a 0.2M solution of [SiW12O40]4- for anolyte and 1M of
[PV14O42]9- for catholyte76. The cell showed a specific capacity of 10.7 Ah·L-1 with a
capacity loss of 0.16% per cycle, with 155 cycles carried out, an open circuit voltage of
1.05 V and a power density of 100 mW·cm-2.
Finally, it should be noted that in the emerging field of electroactive nanofluids
there is a wide dispersion of results. The number of reported systems is limited, and yet,
there are examples of both good and bad performance. We have emphasized throughout
this paper the importance of cell optimization. We would like to mention a couple of
examples which underscore the importance of proper cell design in the final
performance. Recently Joseph et al. reported an electroactive nanofluid made of iron
oxide synthesized from ferrous sulfate heptahydrate via a facile microwave assisted one-

Desing of novel electroactive nanofluids for flow cell
Chapter 1. Introduction Page | 36
step route in 1-butyl-4-methylpyridinium chloride. They achieved an efficiency of the
charge–discharge process greater than 94% after 100 cycles. However the system only
yielded a very low discharge capacity of 0.01 mAh·g-1 77. We believe that this modest
result is not an intrinsic characteristic of the material, but most likely related to a simple
cell design with very small effective area (both of the distant current collectors and
membrane), leading to poor electronic and ionic transport.
Similarly, the work by Qi et al is a perfect example of the importance of a proper
cell design and the electronic percolation issue of solid dispersions. They prepared a full
electrochemical cell based on 0.5 vol% LiCoO2 suspension as cathode and 1 vol%
Li4Ti5O12 suspension as anode in (EC) and (EMC) with EC:EMC = 3:7 by volume ratio
with 1.2 M lithium hexafluorophosphate (LiPF6). Both dispersions where in different
reservoirs with magnetic stirring and an Al wire as current collector78. Poor Coulombic
efficiency was obtained (1.58%) which was justified as due to a low concentration of
particles. But low concentration should lead to low charge, not to a large difference
between charge and discharge. In our opinion this work is an example of the high
difficulty to get a good electrical percolation in this kind of dispersions. In this particular
work a non-optimized cell design was used, with Al wire used as current collector
probably providing a small active area. Furthermore, the electroactive oxide particles
used probably had a poor electrical conductivity, making it necessary to modify them with
conductive coating or to add conducting additives to the nanofluid.
Conventional electrochemical cells are just fine for studying and exploiting the
electrochemistry of simple molecular species. Yet, in the context of complex materials,
electrodes and components, their integration into an efficient device will be key to
success. In the same way that a great cell with a bad chemistry will be no good, we
should also realize that a great battery chemistry could easily be ruined by a bad cell
design. And in this context, nanofluids and nanopastes emerge as bold examples of the
need of a joint development of materials chemistries and cell designs.

Desing of novel electroactive nanofluids for flow cell
Chapter 1. Introduction Page | 37
Perspective and prospective
When it comes to storing large amounts of charge in a battery you can apparently
go for using large amounts of active material externalized out of the electrochemical cell
or choose a highly concentrated active material. The first approach is the one taken in
RFBs whereas the second is characteristic of Li-ion batteries, where ca. 80% of the
electrode mass corresponds to active materials. But, why not both? What prevents the
design of cells with extensive and at the same time intensive electrode materials?
RFBs have undergone a relatively modest evolution from their initial Cr and Fe
ions into the, now mature, all-Vanadium technology, with hybrid systems such as Zn-Br2
next-in-queue for development. But further breakthroughs of the type provided by
ambipolar electrolytes or with highly concentrated solutions are still needed to overcome
the poor energy density associated to low solubility limits. Isn’t there any highly soluble
electroactive species to play with in this respect? Or, even better, wouldn’t it be great to
count with a bulk electroactive liquid? a pure flowing substance able to reversibly
exchange one or maybe two electrons per molecule? As a matter of fact, such a
compound exists. We call it water. But again, reversible Fuel Cells are far from being
problem-free. Poor kinetics derived from the need of a triple-phase –boundary
(electrode-electrolyte-gas) ruins their great thermodynamics. Another unsolved problem
is that low temperature Fuel Cells still need to get freed from their well-known platinum
addiction.
Actually, none of the electrochemical energy storage technologies explored so
far is problem-free. Instead, they all feature complementary advantages and drawbacks.
Indeed, many different designs and systems somewhat in between conventional RFBs
and conventional solid (Li-ion) batteries have been recently proposed. Among them, the
flowing shuttle concept or SSFBs or nanofluids or fluid-confining 2-D materials. Yet, all
of them present serious drawbacks. For example, 2D-confined liquids could suffer
precisely from over-confinement of the liquid electrolyte in the bulk solid electrode
structure, whereas the electronic conductivity of nanofluids could be hindered by the low
concentration of solid nanoparticles dispersed in the liquid phase. On the bright side,
electroactive fluids and pastes present the advantages of fast ion diffusion, high specific
power and tolerance for volume expansion when compared with conventional solid
electrodes, because in the latter only a small fraction of the active material is in direct
contact with the electrolyte, thus ions have to diffuse from the electrode-electrolyte
interphase through the solid electrode material to the active sites. That is a slow process
that in addition can lead to defects on the crystalline structure of the active material due
to the volume expansion associated to the intercalation of ions. On the other hand, solid
Desing of novel electroactive nanofluids for flow cell
Chapter 1. Introduction Page | 38
active materials present larger energy densities and larger electrical conductivity in
comparison with electroactive fluids or pastes thanks to the direct and constant contact
of the particles that conform the electrode.
It seems clear then that improving the electrolyte accessibility to the active
electrode sites without loss of electrical conductivity would be key to improving power
and cyclability without loss of capacity and energy density. But that is easier said than
done, and unexpected difficulties frequently arise. For instance, the nanoconfinement of
liquids in 2D solids was proposed to improve ionic transport; yet, it facilitates the
electrodes exfoliation upon repeated cycling64. But this apparent detrimental
consequence could be turned into an advantage within the framework of novel designs
of electrodes and devices.
Fig 6. Schematic comparative diagram of several of the stages going from a compact solid
electrode material to a dilute nanofluid and a RFB solution. Orange polyhedral denote a generic extended
solid phase; blue segments, solvent molecules, open circles, generic ions and red circles electroactive
ions.
In this context, the field could evolve towards the design of electroactive bulk
nanopastes (Figure 6) which could work as effectively as thick solid electrodes and
which, in the best case, would not need to be pumped. This type of alternative design
could strongly contribute to lower the manufacturing cost of batteries, and this would be
most important within the upcoming framework of battery gigafactories. After all, pastes
are well known by the industry when it comes to primary conventional cells. Why not then
for rechargeable ones?
The race is on for the development of the ultimate solution in order to make
massive energy storage possible. And while none of the contenders seems to have
reached optimal performance, both flowing and non-flowing designs could make it; in
Desing of novel electroactive nanofluids for flow cell
Chapter 1. Introduction Page | 39
which case the answer to the title’s question would be to flow AND not to flow, with the
various chemistries and cell designs possibly addressing different needs for different
niche applications.
Flowing systems could keep breaking records for the energy density of their fluids
while nanopaste electrodes could be designed as extra-thick or massive electrodes
inaugurating a battery revolution resting more on the integration of materials and
components in the devices than on the nature of the materials and components
themselves. This means there are plenty of opportunities for interdisciplinary research
involving materials chemistry, surface science, nanoscience, electrochemistry and
engineering. There is plenty of room at the interface.
References
1. Davis, S. J. et al.. Science (80-. ). 360, eaas9793 (2018).
2. Thaller, L. H. (1974). Report/Patent Number NASA-TM-X-71540, E-7922
3. Bhushan, M., Kumar, S., Singh, A. K. & Shahi, V. K. J. Memb. Sci. 583,
1–8 (2019).
4. Abdiani, M. et al. J. Power Sources 424, 245–253 (2019).
5. Nguyen, T. D. et al. ChemSusChem 12, 1076–1083 (2019).
6. Nourani, M. et al. J. Electrochem. Soc. 166, A353–A363 (2019).
7. Yang, Y., Zhang, Y., Liu, T. & Huang, J. J. Power Sources 415, 62–68
(2019).
8. Trovò, A. et al. Appl. Energy 240, 893–906 (2019).
9. Lim, H., Yi, J. S. & Lee, D. ChemSusChem 12, 1459–1468 (2019).
10. Lim, H., Yi, J. S. & Lee, D. J. Power Sources 422, 65–72 (2019).
11. Soloveichik, G. L. Chem. Rev. 115, 11533–11558 (2015).
12. Huang, Q. & Wang, Q. Chempluschem 80, 312–322 (2015).
13. Park, M., Ryu, J., Wang, W. & Cho, J. Nat. Rev. Mater. 2, (2016).
14. Pan, F. & Wang, Q. Molecules 20, 20499–20517 (2015).

Desing of novel electroactive nanofluids for flow cell
Chapter 1. Introduction Page | 40
15. Sun, C., Zhang, H., Luo, X. & Chen, N. Ionics. 25, 4219–4229 (2019).
16. Ponce de León, C., Frías-Ferrer, A., González-García, J., Szánto, D. A. &
Walsh, F. C. J. Power Sources 160, 716–732 (2006).
17. Li, B. et al. Nat. Commun. 6, 1–8 (2015).
18. Zhu, Y. et al. J. Power Sources 417, 83–89 (2019).
19. Winsberg, J., Hagemann, T., Janoschka, T., Hager, M. D. & Schubert, U.
S. Angew. Chemie - Int. Ed. 56, 686–711 (2017).
20. Leung, P. et al. J. Power Sources 360, 243–283 (2017).
21. Lê, A. et al. Acta 301, 472–477 (2019).
22. Chang, Z., Henkensmeier, D. & Chen, R. J. Power Sources 418, 11–16
(2019).
23. Trudgeon, D. P. et al. J. Power Sources 412, 44–54 (2019).
24. Robb, B. H., Farrell, J. M. & Marshak, M. P. Joule 0, (2019).
25. Lee, W., Permatasari, A., Kwon, B. W. & Kwon, Y. Chem. Eng. J. 358,
1438–1445 (2019).
26. Khataee, A., Dražević, E., Catalano, J. & Bentien, A. J. Electrochem. Soc.
165, A3918–A3924 (2018).
27. Chen, R. ChemElectroChem 6, 603–612 (2019).
28. Hagemann, T. et al. J. Power Sources 378, 546–554 (2018).
29. Cao, J., Zhu, Z., Xu, J., Tao, M. & Chen, Z. J. Mater. Chem. A 5, 7944–
7951 (2017).
30. Ding, Y., Zhang, C., Zhang, L., Zhou, Y. & Yu, G. Chem. Soc. Rev. 47,
69–103 (2018).
31. Huo, Y., Xing, X., Zhang, C., Wang, X. & Li, Y. RSC Adv. 9, 13128–13132
(2019).
32. Wei, X. et al. ACS Energy Lett. 2, 2187–2204 (2017).
33. Huang, J. et al. Adv. Sustain. Syst. 2, 1700131 (2018).

Desing of novel electroactive nanofluids for flow cell
Chapter 1. Introduction Page | 41
34. Wei, X. et al. Adv. Mater. 26, 7649–7653 (2014).
35. Rueda-García, D., Dubal, D. P., Hugenin, F. & Gómez-Romero, P. J.
Power Sources 350, 9–17 (2017).
36. Kwabi, D. G. et al. Joule 2, 1894–1906 (2018).
37. Armstrong, C. G. & Toghill, K. E. Electrochem. commun. 91, 19–24
(2018).
38. Hu, B. et al. Chem. Commun. 54, 6871–6874 (2018).
39. Li, X., Li, J., Huang, C. & Zhang, W. Electrochim. Acta 301, 240–250
(2019).
40. Wang, X. et al. Int. J. Electrochem. Sci. 13, 6676–6683 (2018).
41. Wang, X., Xing, X., Huo, Y., Zhao, Y. & Li, Y. RSC Adv. 8, 24422–24427
(2018).
42. Qi, Z. & Koenig, G. M. Review Article: Mater. Process. Meas. Phenom.
35, 040801 (2017).
43. Duduta, M. et al. Adv. Energy Mater. 1, 511–516 (2011).
44. Presser, V. et al.. Adv. Energy Mater. 2, 895–902 (2012).
45. Shukla, G. & Franco, A. A. J. Phys. Chem. C 122, 23867–23877 (2018).
46. Campos, J. W. et al. Electrochim. Acta 98, 123–130 (2013).
47. Boota, M. et al.. J. Electrochem. Soc. 161, A1078–A1083 (2014).
48. Madec, L. et al. Chempluschem 80, 396–401 (2015).
49. Lee, J., Weingarth, D., Grobelsek, I. & Presser, V. Energy Technol. 4, 75–
84 (2016).
50. Narayanan, A., Mugele, F. & Duits, M. H. G. Langmuir 33, 1629–1638
(2017).
51. Tian, M. et al. J. Power Sources 364, 182–190 (2017).
52. Akuzum, B. et al. J. Electrochem. Soc. 165, A2519–A2527 (2018).

Desing of novel electroactive nanofluids for flow cell
Chapter 1. Introduction Page | 42
53. Hatzell, K. B., Boota, M. & Gogotsi, Y. Chem. Soc. Rev. 44, 8664–8687
(2015).
54. Liu, H., Liao, L., Lu, Y. C. & Li, Q. Adv. Energy Mater. 7, (2017).
55. Hamelet, S. et al. J. Electrochem. Soc. 159, A1360–A1367 (2012).
56. Ruggeri, I., Arbizzani, C. & Soavi, F. Carbon N. Y. 130, 749–757 (2018).
57. Chen, H., Lai, N. C. & Lu, Y. C. Chem. Mater. 29, 7533–7542 (2017).
58. Li, S. et al. Joule 3, 1637–1646 (2019).
59. Ventosa, E. et al. Chem. Commun. 51, 7298–7301 (2015).
60. Huang, Q., Li, H., Grätzel, M. & Wang, Q. Phys. Chem. Chem. Phys. 15,
1793–1797 (2013).
61. Li, G. et al. J. Power Sources 378, 418–422 (2018).
62. Yu, J., Fan, L., Yan, R., Zhou, M. & Wang, Q. ACS Energy Lett. 3, 2314–
2320 (2018).
63. Yan, W. et al. Nat. Commun. 10, 2513 (2019).
64. Augustyn, V. & Gogotsi, Y. Joule 1, 443–452 (2017).
65. Sen, S., Chow, C. M., Moazzen, E., Segre, C. U. & Timofeeva, E. V. J.
Appl. Electrochem. 47, 593–605 (2017).
66. Fan, F. Y. et al. Nano Lett. 14, 2210–2218 (2014).
67. Rueda-garcia, D. et al. Electrochim. Acta 281, 594–600 (2018).
68. Dubal, D. P., Rueda-Garcia, D., Marchante, C., Benages, R. & Gomez-
Romero, P. Chem. Rec. 1–10 (2018). doi:10.1002/tcr.201700116
69. Sadeghinezhad, E. et al. Energy Convers. Manag. 111, 466–487 (2016).
70. Kong, C. Y., Qian, W. Z., Zheng, C. & Fei, W. J. Mater. Chem. A 3,
15858–15862 (2015).
71. Vardhan, P. V., Idris, M. B., Manikandan, S., Rajan, K. S. & Devaraj, S. J.
Solid State Electrochem. 22, 1795–1800 (2018).

Desing of novel electroactive nanofluids for flow cell
Chapter 1. Introduction Page | 43
72. Dubal, D. P. & Gomez-Romero, P. 2D Mater. 3, 031004 (2016).
73. Lobato, J., Mena, E. & Millán, M. ChemistrySelect 2, 8446–8450 (2017).
74. Sen, S. et al. ACS Appl. Mater. Interfaces 7, 20538–20547 (2015).
75. Park, S., Lee, H. J., Lee, H. & Kim, H. J. Electrochem. Soc. 165, A3215–
A3220 (2018).
76. Friedl, J. et al. Energy Environ. Sci. 11, 3010–3018 (2018).
77. Joseph, A. et al. Chem. Commun. 55, 83–86 (2019).
78. Qi, Z., Liu, A. L. & Koenig, G. M. Electrochim. Acta 228, 91–99 (2017).

Desing of novel electroactive nanofluids for flow cell
Chapter 1. Introduction Page | 44

Desing of novel electroactive nanofluids for flow cell
Chapter 2. Motivation and Objectives Page | 45
CHAPTER 2
MOTIVATION AND
OBJECTIVES

Desing of novel electroactive nanofluids for flow cell
Chapter 2. Motivation and Objectives Page | 46

Desing of novel electroactive nanofluids for flow cell
Chapter 2. Motivation and Objectives Page | 47
2.1 Motivation
The search for new and improved electrical energy storage systems is nowadays
one of the biggest challenges of science and technology in order to complete a
sustainable energy model and reduce our dependence of fossil fuels.
Batteries are the obvious candidates for this task. But what batteries? Some cells
like LIBs bet on condensed, concentrated, intensive materials, concentrated inside
enclosed electrodes, whereas others, namely, RFB rest on extensive amounts of active
materials stored outside the electrochemical cell.
On the other hand, from the point of view of storage mechanism, current
technologies fall mainly in one of two categories: batteries and SCs, which have opposite
advantages and drawbacks. Thus, a combination of both technologies could lead to new
hybrid technology with the strength of both but without their drawbacks.
SCs are commonly based on carbon electrodes and take advantage of their large
active area, electrical conductivity and low price. As a newcomer to the family of carbons,
graphene is not the cheapest member of the clan, but, for the same reason, it holds the
greatest promise and potential to display new properties and applications.
Thanks to its great electrical conductivity and surface area graphene could lead
to a new generation of SCs and novel energy storage devices. Few-layer graphene
materials, for instance, could break the distinction between intercalation and adsorption
mechanisms for energy storage, and could thus work as an ideal hybrid material.
But from the electrochemical point of view and according to relevant literature,
graphene has excelled as a purely capacitive material.
The present Thesis stems from two main motivations,
1.- Couldn’t it be possible to design more energy-intensive materials within the
framework of extensive devices? That is, how to design flowing materials and flow cells
with higher energy density.
2.-How could we develop hybrid electroactive (flowing) systems combining or
merging capacitive with faradaic activity.
In addition to graphene, in order to develop hybrid materials or systems with
enhanced capacity, two active redox candidates have been chosen: quinones and
polyoxometalates (POMs).

Desing of novel electroactive nanofluids for flow cell
Chapter 2. Motivation and Objectives Page | 48
Quinones have been deeply studied as electroactive specie for RFBs because of
their good kinetics, tuneability and low cost. However, studies have been mainly limited
to aqueous electrolytes. We wanted to explore the possible use of quinones in organic
solvents in order to take advantage of two factors: i) their greater solubility and ii) their
larger voltage range in these media, both factors converging to get solutions with a larger
energy density. In addition, quinones could match graphene perfectly well in a hybrid
configuration, since both are aromatic compounds and a strong π-π interaction, possibly
leading to effective charge transfer between them, could be anticipated.
POMs are ideal model clusters which have been used previously in our group for
the development of solid hybrid electrodes and, as such, were ideally suited for extending
their study to flowing systems. In the same, well-known category, LiFePO4 is one of the
most extensively studied faradaic (battery) materials and it could provide again a perfect
benchmark material. Furthermore, in addition to their similarities (well-known compounds
studied in solid electrodes) these two materials provided radically different starting
points, i.e. a molecular cluster 1nm in diameter vs. a larger nanoparticulate solid phase.
Finally, concerning the specific motivations for the choice of our materials, we
decided to go for the synthesis of truly few-layers graphene by electrochemical
exfoliation of graphite in order to be able to produce well-known, controlled materials
beyond the uncertainty of commercial ones.

Desing of novel electroactive nanofluids for flow cell
Chapter 2. Motivation and Objectives Page | 49
2.2 Objectives
The general objective of the Thesis was to explore new hybrid flowing systems
which could eventually contribute to increase the energy density of flow cells.
The specific objectives targeted and pursued to contribute to that general
objective were:
1.- Study the use of quinones in organic electrolytes to understand their
electrochemical behavior.
2.-Explore the use of complex hybrid nanofluids for the harnessing of their
electrochemical properties as energy storage devices.
3.- Demonstrate the possible use of hybrid systems, i.e. combining capacitive and
faradaic electrodes, alike Li-ion capacitors but within the framework of flow Cells
4.- Study the effect of Graphene (specifically in this work rGO) on the electrochemical
cycling of well-known redox and faradaic materials.
5.- Develop an improved method for the controlled synthesis of few-layers graphene by
means of electrochemical exfoliation of graphite
Despite the apparently very diverse nature of these objectives and the
associated research works presented in this Thesis, it is important to note how all of
them fully address the questions raised in the above motivation text, delving at the
intersection between questions 1 and 2 above.

Desing of novel electroactive nanofluids for flow cell
Chapter 2. Motivation and Objectives Page | 50

Desing of novel electroactive nanofluids for flow cell
Chapter 3. Experimental Methods Page | 51
CHAPTER 3
EXPERIMENTAL
METHODS

Desing of novel electroactive nanofluids for flow cell
Chapter 3. Experimental Methods Page | 52

Desing of novel electroactive nanofluids for flow cell
Chapter 3. Experimental Methods Page | 53
3.1 Electrochemical Techniques
3.1.1 General Fundamentals
Electrical energy storage can involve two clear different mechanisms: faradaic,
associated to redox processes and capacitive, associated to electrostatic interactions
between electrode and electrolyte. Capacitive mechanisms will always be present, but
faradic only in the presence of active redox species and will take place simultaneously
with the capacitive mechanism. Therefore, it is important to keep in mind that when the
electrochemical performance or nature of any material or device is characterized, a
capacitive signal will always be present and also that in the study of any redox system
there will always be a capacitive contribution. Knowing this and understanding both
mechanisms, it is possible to understand and design or adjust models that fit and explain
the results obtained and also to use the proper characterization technique. Additionally,
it is possible to know or identify the weak points of the material or device in order to
improve its performance.
There are mainly two kinds of electrochemical techniques: potentiostatic and
galvanostatic used to control the voltage or the current and measure the current or the
voltage, respectively. It is important to point out that voltage and current cannot be
controlled independently at the same time (when we control one of them we measure
the response of the other) and that the resistance of the system, which is usually constant
during the experiments, can change if there is a variation of the experimental setup,
although it will not change due to the current or voltage applied. Finally, despite the fact
that faradaic and capacitive processes deliver direct current (DC), it is possible to apply
alternate current (AC) or voltage to them, which is the base of impedance techniques. In
this case, the resistance of the system turns into impedance (Z), which has an imaginary
component that depends on the frequency applied and the circuit element (resistance,
capacitor or inductance) through which current flows. Therefore, in this technique the
impedance of system is measured as a function of the frequency applied in a fixed
current or voltage1.
A capacitive energy storage mechanism is based on the charge accumulation on
the surface of the electrode. With electrodes in contact with an electrolyte this is possible
due to reorganization of the ions of the electrolyte near the electrode in order to balance
the charge injected into the electrode with the charge stored at its surface. Polarization
of two electrodes will force the movement of electrons (e-) from one electrode to the other,

Desing of novel electroactive nanofluids for flow cell
Chapter 3. Experimental Methods Page | 54
therefore one electrode will be charged negatively and the other positively but this is only
possible if the charge neutrally is kept at any moment which is what the electrolyte ions
do at the electrolyte-electrode interface.
Fig.1 Scheme of EDL and potential profile.
Thus, polarized electrodes in contact with an electrolyte generate what is called
an electrical double layer (EDL) when the ions are organized at the electrode’s surface
storing charge, which is a fast, reversible, efficient and purely electrostatic process (no
chemical reactions). Ions can store charge at the electrode’s surface in two different
states. Firstly, there is adsorption on the electrode’s surface, which means the ions are
not solvated by the solvent: this first layer of ions is known as the inner Helmholtz layer
(IHL) and is ca. 0.2nm thick. Secondly, there are the solvated ions that also contribute to
charge storage at the electrode’s surface. These define the outer Helmholtz layer (OHL)
which has a thickness compressed between 1-10nm. Both layers, IHL and OHL define

Desing of novel electroactive nanofluids for flow cell
Chapter 3. Experimental Methods Page | 55
the Stern layer (Figure 1), which is the distance at which ions store charge. Beyond the
Stern layer, there is a region limited by the diffusive layer, where ions are moved mainly
by diffusion (concentration gradient) to the electrode. Behind the diffusive layer is the
bulk electrolyte2,3.
A redox reaction involves two processes: one of them is an oxidation process that
produces electrons that are consumed by the other process, which is reduction. As a
result, there can’t be an oxidation without a reduction or a reduction without an oxidation.
However, special considerations have to be taken into account in the case of a redox
reaction in an electrochemical cell. Common redox reactions take place when the
reagents come into contact and the electrons are spontaneously transferred from one
species to the other. However, this is not possible in an electrochemical cell: indeed,
electrochemical cells are specifically designed in order to avoid the direct reaction. The
purpose of an electrochemical cell is to allow the flow of electrons produced by a redox
process through an external circuit or to induce a current in the external circuit in order
to induce a redox process into the electrochemical cell. That is only possible if the redox
processes take place at different and separated electrodes only connected by the
external circuit. In order for oxidation and reduction processes to take place at the
respective electrodes, ions that maintain electrical neutrality in the electrodes are needed
and thus, the electrodes must be in contact with an electrolyte, therefore EDL will be
generated, that’s the reason why when a redox process takes place in an
electrochemical cell, a capacitive process also inevitably takes place at the same time4.
Redox processes take place at the electrodes because there is a proper
difference between the Fermi levels of the electrodes and the active species, as shown
in Figure 2. For a reduction process, the Fermi level of the electrode must be higher than
the species in order to be reduced and electrons will move from the electrode to active
species where electrons are in a lower energy state. Of course, the active species must
be able to receive an electron in order to be reduced. For oxidation it is the opposite
case: the Fermi level of the electrode must be lower than the species to be oxidized so
that the electrons can move from the active species to the electrode in order to be in a
lower energy state. Electrons introduced into the electrode in which the oxidation takes
place circulate through the external circuit to the other electrode where would be moved
into the species that would be reduced5,6.

Desing of novel electroactive nanofluids for flow cell
Chapter 3. Experimental Methods Page | 56
Fig.2 Scheme oxidation and reduction process by an electrode.
It is important to explain that initially, two equal electrodes both have the same
Fermi however if there’s an active species with a higher Fermi’s level in one electrode
and a different active species with a lower Fermi’s level in the other electrode, a
spontaneous electrochemical process will take place until one of the active species is
consumed. When voltage is induced between two electrodes there is a modification of
Fermi levels: an increase in the negative electrode and a reduction in the positive
electrode. Thanks to this modification, it is possible to induce a non spontaneous
electrochemical process by adjusting the Fermi levels of the electrodes, as shown in
Figure 3.
Fig.3 Scheme of induced redox process by a voltage application on the electrodes.
When the Fermi level of the electrode and the active species are equal, a dynamic
equilibrium takes place between the reduction and oxidation processes and both
processes take place at the same velocity and consequently, the net current measured
is 0, as shown in Figure 4. An electrochemical species with very negative equilibrium
potential has a very high Fermi level and is thus a very effective reducing agent as it can

Desing of novel electroactive nanofluids for flow cell
Chapter 3. Experimental Methods Page | 57
be oxidized very easily. Similarly, an electrochemical species with a very positive
equilibrium potential makes an effective oxidizing agent because it can be reduced very
easily as its low fermi level can be easily filled.
Fig.4 Scheme of an active redox species in equilibrium the electrode potential.
If voltage applied into the electrode is reduced with respect to the equilibrium
voltage, the reduction process is favoured until a point in which would be the only
electrochemical process, no oxidation would take place into the electrode. Logically, if
the voltage is increased with respect to the equilibrium voltage, the same happens with
the oxidation process. The currents produced can be described by the following Butler–
Volmer equation(single step with n electrons transferred)1,4,5,7:
𝑗 = 𝑗𝑜 𝑒𝑥𝑝 (𝑛𝛼𝑎𝜂𝐹
𝑅𝑇) − 𝑒𝑥𝑝 (−
𝑛𝛼𝑐𝜂𝐹
𝑅𝑇)
where:
- j = electrode current density (A·m-2)
- jo = exchange current density (A·m-2) (current in the absence of net electrolysis and at
zero overpotential)
- T = temperature (K)
- n = number of electrons involved into the redox process
- F = Farady constant (C·mol-1)
- R = universal gas constant (J·K-1·mol-1)
- η = overpotential (E-Eeq) (V)
- αa = anodic charge transfer coefficient.
- αc = cathodic charge transfer coefficient

Desing of novel electroactive nanofluids for flow cell
Chapter 3. Experimental Methods Page | 58
*Valid for concentrations between 0.01 to 0.1M9
The charge transfer coefficients are the fraction of the interfacial potential at an
electrode-electrolyte interface that helps in lowering the free energy barrier for the
electrochemical reaction. Thus, they define the overpotential needed to activate the
reaction and are related by: αa = 1 - αc. Therefore, the transfer coefficient is related to the
kinetic constants of the electron transfer for the oxidation and reduction processes by
the equations:
𝑘𝑟 = 𝑘𝑠𝑒𝑥𝑝 −𝛼𝑛𝐹𝜂
𝑅𝑇 𝑘𝑜 = 𝑘𝑆𝑒𝑥𝑝
(1−𝛼)𝑛𝐹𝜂
𝑅𝑇
where ks is the standard heterogeneous rate constant. Large values for ks indicate that
following the application of an applied potential, the equilibrium between Ox and Red will
be re-established quickly. Small values for ks indicate slow kinetics and longer time
requirement for equilibrium8.
Furthermore, it is important to take into account that the equilibrium potential of a
redox process is not constant and depends on the temperature and activity of the
reduced and oxidized species, as described by Nernst equation:
𝐸𝑒𝑞 = 𝐸𝑜 −𝑅𝑇
𝑛𝐹∙ 𝑙𝑛
𝑎𝑟𝑒𝑑𝑢𝑐𝑒𝑑
𝑎𝑜𝑥𝑖𝑑𝑖𝑧𝑒𝑑
𝑎𝑖 = 𝛾𝑖 · 𝑐𝑖 𝑙𝑜𝑔∗ 𝛾𝑖 = −𝐴 · 𝑧2 √𝐼
1+√𝐼 𝐼 = 0.5 ∑ 𝑐𝑖𝑧𝑖
2
where:
- Eeq = real equilibrium potential (V)
- Eº = equilibrium potential at standard conditions (1atm, 25 ºC)
- R = universal gas constant (J·K-1·mol-1)
- T = temperature (K)
- n = number of electrons involved into the redox process
- F = Faraday constant (C·mol-1)
- a = activity of the reduced or oxidized species
- γ = activity coefficient
- c = concentration of the reduced or oxidized species (mol·L-1)
- z = valence number of the ion
- A = 0.5102 (at 25ºC)9
- I = ionic strength (mol·L-1)

Desing of novel electroactive nanofluids for flow cell
Chapter 3. Experimental Methods Page | 59
The equilibrium potential of the redox processes is tabulated against the
hydrogen electrode and is measured by calculating the potential difference between the
studied process and the process 2H+ + 2e- → H2 in standard conditions, assigning 0 V
to this electrode. By determining the equilibrium potential, it is possible to obtain a
referenced scale of all the redox processes which allows us to easily determine which of
the two species will be oxidized or reduced. Most importantly, the energy difference
between them in V, therefore allows us to predict the voltage of a battery or know the
voltage needed to be applied in order to induce a non-spontaneous redox process1,4,5,7.
The application of a voltage difference between the two electrodes of an
electrochemical cell could induce redox processes if the voltage applied is high enough.
Consequently, all the species present in the cell must be carefully chosen depending on
the voltage of cell: solvent, salt and current collector must be stable in the working
potential. If not, they will provide spurious electrochemical reactions that will distort the
results and degrade, damage and even break the electrochemical cell.
3.1.2 Cyclic Voltammetry
Cyclic Voltammetry (CV) is an effective technique for measuring current as a
function of potential and is commonly used in electrochemical research studies. With this
technique, the potential applied to the working electrode (WE) with respect to a reference
electrode (RE) is cyclically swept at a constant sweep rate and the resulting current
passing through the WE and an auxiliary counter electrode (CE) is measured and plotted
as a function of potential. Conventionally, CV can be performed in two different
configurations: using three or two electrodes, in which case it would be preferable to call
it cyclic polarization (CP).
While the conventional three-electrode CV is the best way to characterize an
electrode, the two-electrodes CP is the simplest configuration to characterize a device.
It has some limitations in terms of accuracy for the study of the thermodynamics and
kinetics of a redox process, but nevertheless is the most used configuration for the
practical, preliminary characterization of electrochemical devices. In a two electrode
configuration, the difference of potential between the two electrodes (while passing
current through them) is measured, although the position of the working electrode
potential in the tabulated potential list is unknown since the counter electrode is also
connected as “reference electrode”, see Figure 5.

Desing of novel electroactive nanofluids for flow cell
Chapter 3. Experimental Methods Page | 60
Fig.5 Example of the two electrode voltage issue.
Therefore, with a two electrode configuration it is not possible to apply the
potential needed in order to induce or study a specific redox process that takes place at
a specific potential. The reason for this is that there is no true reference that can indicate
the position of the potential applied between the two electrodes against a standard redox
process. Furthermore, as the potential of an electrode depends on the activity of the
redox species, the voltage applied between two electrodes can shift against the specific
redox process during the experiment.
A three electrode configuration solves this issue, because this configuration
includes a specific reference electrode. Voltage is applied between RE and WE and
current flows between WE and the current electrode (CE), see Figure 6, left. The RE is
a special electrode based on a specific redox process with a fixed potential due to the
fact that the reduced and oxidized species are solids (the activity of a solid is 1 if it is a
pure compound at 1 atm) and thus can be proven by the Nerst equation that in this case
the potential of the electrode will not change. In this type of configuration, it is important
to keep the RE as near as possible to the WE in order to minimize the uncompensated
solution resistance. Additionally, since the set up potential is just applied between the
WE and the RE including this partial potential drop, the actual potential applied to WE is
insufficient by the amount of potential drop10,11, see Figure 6 right. Even with a modern
potentiostat, such a potential drop cannot be controlled completely.

Desing of novel electroactive nanofluids for flow cell
Chapter 3. Experimental Methods Page | 61
Fig.6 Left 3 electrodes configuration scheme, right uncompensated solution resistance diagram.
Moreover, should be pointed out that in a symmetrical two electrode cell, the
potential differences applied to each electrode are equal to each other and are one-half
of the values shown on the potential axe of the CV12. In contrast, in a three electrode
configuration the potential applied to WE with the RE, corresponds with potential plotted
in the CV.
CV of a capacitive system will show a rectangular profile because the current is
not dependent on the voltage since there is no electrochemical reaction. CV applied to
a capacitive process can also show deviations from the ideal rectangular profile due to
a high resistance, see Figure 7. There are two main reasons for this. First, there is a
linear increase or decrease of the current with the voltage, a small slope in the current
signal that makes it not constant vs the voltage. This is usually due to variables such as
the internal resistance in the system, the electrical conductivity of the electrodes, the
distances between them or the effective area in contact. Second, there is the ionic
conductivity of the electrolyte: a smaller ionic conductivity results in a worse ionic
response to the polarization and consequently the response of the current against the
polarization of the electrodes is not fast enough to keep the rectangular profiles of the
ideal CV2,3.

Desing of novel electroactive nanofluids for flow cell
Chapter 3. Experimental Methods Page | 62
Fig.7 Simulation of a 1mF supercapacitor at 100mV/s at different resistances.
The capacitive current response follows a linear dependence on the scan rate:
ic = ν·C,
where ν is the scan rate (V·s-1) and C the capacitance (A·s·V-1)13.
For a redox process, the CV profile is completely different since the reaction and
its associated current only takes place once the potential of the redox process is
exceeded: the current suddenly increases until it reaches a maximum and then
decreases back to a small but non-zero value. The current decrease after the maximum
occurs due to a depletion of the active species needed for the redox process (the redox
active species in case of solutions or ions for an intercalation solid electrode) near the
electrode and therefore, the velocity of the process is limited by the diffusion process of
the active species to the electrode. The velocity of a redox process increases with the
overpotential applied as Butler–Volmer equation proves. This equation shows that for an
overpotential larger than 250mV a maximum velocity of electron transfer between the
electrode and the active species is reached. But maximum velocity of electron
transference is usually faster than the velocity at which the active species can reach the
electrode to react. As a result, once all the active species near the electrode (inside the
diffusive layer) is consumed, due to the redox process being faster than the process of
diffusion of the active species from the bulk solution species and thus current measured
decreases from the value that corresponds to the velocity of the redox process to a value
delimitated by diffusion of the active species1,4,5.
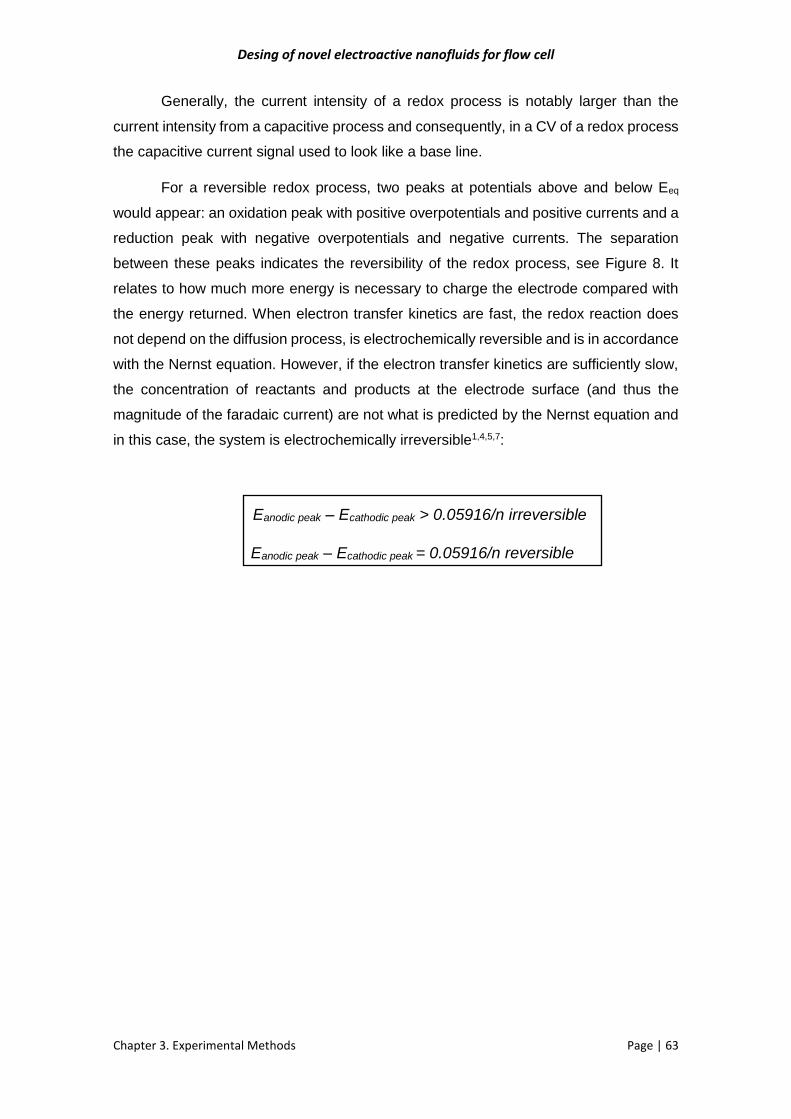
Desing of novel electroactive nanofluids for flow cell
Chapter 3. Experimental Methods Page | 63
Generally, the current intensity of a redox process is notably larger than the
current intensity from a capacitive process and consequently, in a CV of a redox process
the capacitive current signal used to look like a base line.
For a reversible redox process, two peaks at potentials above and below Eeq
would appear: an oxidation peak with positive overpotentials and positive currents and a
reduction peak with negative overpotentials and negative currents. The separation
between these peaks indicates the reversibility of the redox process, see Figure 8. It
relates to how much more energy is necessary to charge the electrode compared with
the energy returned. When electron transfer kinetics are fast, the redox reaction does
not depend on the diffusion process, is electrochemically reversible and is in accordance
with the Nernst equation. However, if the electron transfer kinetics are sufficiently slow,
the concentration of reactants and products at the electrode surface (and thus the
magnitude of the faradaic current) are not what is predicted by the Nernst equation and
in this case, the system is electrochemically irreversible1,4,5,7:
Eanodic peak – Ecathodic peak > 0.05916/n irreversible
Eanodic peak – Ecathodic peak = 0.05916/n reversible

Desing of novel electroactive nanofluids for flow cell
Chapter 3. Experimental Methods Page | 64
Fig.8 CV simulation of one e- reversible redox process at different standard heterogeneous rate constant
(Ks), only at 0.1cm/s the system is electrochemically reversible
The peak current in a CV, figure 9, is given by the Randles-Sevcik
equation1,14,15:
𝑖𝑝 = (2.69 × 10⁵)𝑛3 2⁄ 𝐴𝐷1 2⁄ 𝑣1 2⁄ 𝐶
where:
- ip = maximum current of the peak (A)
- n = number of electrons of the redox process
- A = area of the electrode (cm2)
- D = diffusion constant of the reduced or oxidized species (cm2·s-1)
- v = scan rate (V·s-1)
- C = concentration of the active species (mol·L-1)

Desing of novel electroactive nanofluids for flow cell
Chapter 3. Experimental Methods Page | 65
Fig.9 Intensity peaks of a reduction and oxidation process in a CV.
In a non-reversible process oxidation or reduction could be hindered or partially
hindered and therefore not all oxidized products would be reduced in a cycle and vice
versa. As a consequence, peaks could be unsymmetrical, or, in the limit, only one of the
two peaks could be observed in the CV8,14,15, see Figure 10.
Fig.10 CV simulation of one e- irreversible redox process, left partially reversible, right completely
irreversible.

Desing of novel electroactive nanofluids for flow cell
Chapter 3. Experimental Methods Page | 66
3.1.3 Chronoamperometry
Chronoamperometry is an electrochemical technique based on the application of
a constant potential to the WE which measures current as a function of time. When a
chosen potential is applied, the current slowly but continuously decreases as the active
redox species is consumed. The current depends on the depletion velocity of the of the
active species, which depends in turn, on the capacity of the active species to reach the
WE electrode.
There are three possible mechanisms by which an active species can reach the
WE: diffusion, convection and migration. Diffusion occurs when the concentration of the
active species at the surface of the electrode is different from the concentration in bulk
solution. The region of the solution in which diffusion occurs is the diffusion layer and in
the absence of other mechanisms of mass transport, the width of the diffusion layer (δ)
increases with time. Convection takes place when the solution is mechanically stirred,
moving reactants toward the electrode and removing products from the electrode.
Finally, migration occurs when a charged particle in solution is attracted to or repelled
from an electrode that carries a surface charge by the coulombic force: thus, unlike
diffusion and convection, migration only affects the movement of charged particles.
Real movement of species to and from the electrode’s surface is a complex
function of diffusion, convection and migration. In order to simplify the calculations, it is
possible to limit the movement of active species by only diffusion. Migration can be
eliminated by a large addition of a support electrolyte due to ions of similar charge are
equally attracted to or repelled from the surface of the electrode. Each ion has an equal
probability of undergoing migration and thus, a large excess of an inert electrolyte
ensures that few reactants or products experience migration, so their contribution is
negligible. Eliminating convection can be achieved simply by not stirring the solution.
Thus, with only diffusion as the mechanism by which the active species move to the
electrode, the current can be described by Fick’s law1,13:
𝑖 =𝑛𝐹𝐴𝐷(𝐶𝑏𝑢𝑙𝑘 − 𝐶𝑥=0)
δ

Desing of novel electroactive nanofluids for flow cell
Chapter 3. Experimental Methods Page | 67
where:
- i = current (A)
- n = number of electrons of the redox process
- F = Faraday constant (C·mol-1)
- A = area of the electrode (dm2)
- D = diffusion coefficient (dm2·s-1)
- δ = thickness of diffusion layer (dm)
- Cx=0 = concentration at the electrode’s surface (mol·L-1)
- Cbulk = concentration into the bulk solution (mol·L-1)
3.1.4 Galvanostatic Cycling with Potential Limitation
(GCPL)
This is a charge-discharge technique in which a constant current is applied and
potential is recorded as a function of time. Potential is limited to the charge and discharge
state of the studied device. Once the voltage at which the device is charged is reached,
an inverse current is applied until it reaches the voltage at which the device is discharged.
The process is repeated in order to produce several charge-discharge cycles to allow
the study of both performance and stability.
In a battery GCPL experiment, potential remains almost constant during charge
and discharge. Potential initially increases at charge or decreases at discharge until the
potential needed to carry out the redox process is reached. Thereafter, potential stays
constant until the redox process related to the charge or the discharge finish. In a
supercapacitor, voltage linearly increases or decreases during charge and discharge,
respectively7,13.
Fig.11 GCPL profiles for a, left a supercapacitor, right a battery.

Desing of novel electroactive nanofluids for flow cell
Chapter 3. Experimental Methods Page | 68
𝐼(𝑡) = |∆𝐼| cos(𝜔𝑡 + 𝜃)
3.1.5 Potentiostatic Electrochemical Impedance
Spectroscopy (PEIS)
PEIS is an AC electrochemical technique in which voltage is fixed and impedance
is measured as a function of applied frequency. For this technique, and in general for
any electrochemical impedance technique, it is very important to look for a steady state
between current and voltage. Thus, for PEIS, once potential is applied, measurements
should be taken only when the current has stabilized. This is important because models
and functions applied to the electrochemical impedance are built on this assumption and
also on the assumption of flat electrodes1.
AC can be described as two components, E and I phasor, been both components
related by a phase angle (Ф) and depending on the circuit element through which current
flows16,17:
Fig.12 Representation of phase delay between V and I induced by the circuit element.
𝑉(𝑡) = |∆𝑉| cos(𝜔𝑡)
Ф = 0° Ф = 90°

Desing of novel electroactive nanofluids for flow cell
Chapter 3. Experimental Methods Page | 69
Impedance techniques provide information about an electrical circuit and
therefore, electrochemical system needs to be considered as an electrical circuit to fit
the data obtained by the EIS. Three circuit elements can be used to develop the
equivalent circuit: resistors, capacitors and inductors. The Z of an electrical circuit can
be decomposed into real (Zr) and imaginary (Zj) components, the resistor is the only one
of these three circuit elements that doesn’t have an imaginary component1,16,17, see
Figure 13:
Fig.13 Impedance definition of an electrical circuit and impedance of the three basic circuit elements.
Impedance data is usually represented in a diagram called a Nyquist plot. In this
diagram Zj is the y axis Zr is the x axis and each point of the diagram represents a specific
frequency. Figure 14 shows an example with a simple circuit:
Fig.14. Nyquist plot of a simulation of 10 Ω resistance and 0.1mF capacitor in serial.

Desing of novel electroactive nanofluids for flow cell
Chapter 3. Experimental Methods Page | 70
For this simple circuit, it can be proved that:
where:
- R = resistance of the equivalent circuit
- C = capacitance of the equivalent circuit
- Rct = charge transference resistance of a redox process
- σ = Warburg coefficient (Ω·s-1/2)
- n = number of e- associated with the redox process
- F = Faraday constant
- io = faradic current (current from redox process)
- A = Area of the electrode
- Co = concentration of the oxidized species
- Cr = concentration of the reduced species
In this case, Z can be described as a sum of a real part and an imaginary part
that depends on the frequency. This simple circuit provides a very good description of
the behavior of redox process in an electrode; large currents in a redox process mean
low charge transfer resistances (Rct) and thus, current is limited by the diffusion process.
Therefore, in this case Rct is very small and then Z would depend on Zw. Consequently,
Zw is used to define resistance associated with ionic diffusion. On the other hand, in the
case of a redox process with a little current, the Rct is large, thus limits the current of the
redox process. In this case Rct is very large and thus Z depends on it1,16,17.
In a real electrode redox and capacitive processes take place simultaneously,
considering the redox process just defined, an electrical circuit with it in parallel with a
capacitor would describe properly both mechanisms simultaneously:
Fig.15 Equivalent circuit of a redox process and ELD

Desing of novel electroactive nanofluids for flow cell
Chapter 3. Experimental Methods Page | 71
But it may be useful to first study a simpler system in order to properly understand
the behavior of a real electrode in the Nyquist plot diagram, Figure 16 illustrates the
behavior of a resistance and a capacitor in parallel:
Fig.16 Nyquist plot of a simulation of a 10 Ω resistance and 0.1mF capacitor in parallel
A resistance and a capacitor in parallel generate a perfect semicircle in the
Nyquist plot from which the capacitance of the capacitor (Cdl) can be easily obtained from
the point with the larger Zj, see Figure 16. This behavior is due to a frequency where the
Zj and Zr have the same contribution and consequently, the capacitive current (ic) and
the faradaic current (ir) are also equal at this frequency1,16,17:
Fig.17 Distribution of the current though a resistance and a capacitor in serial as a function of the
frequency.
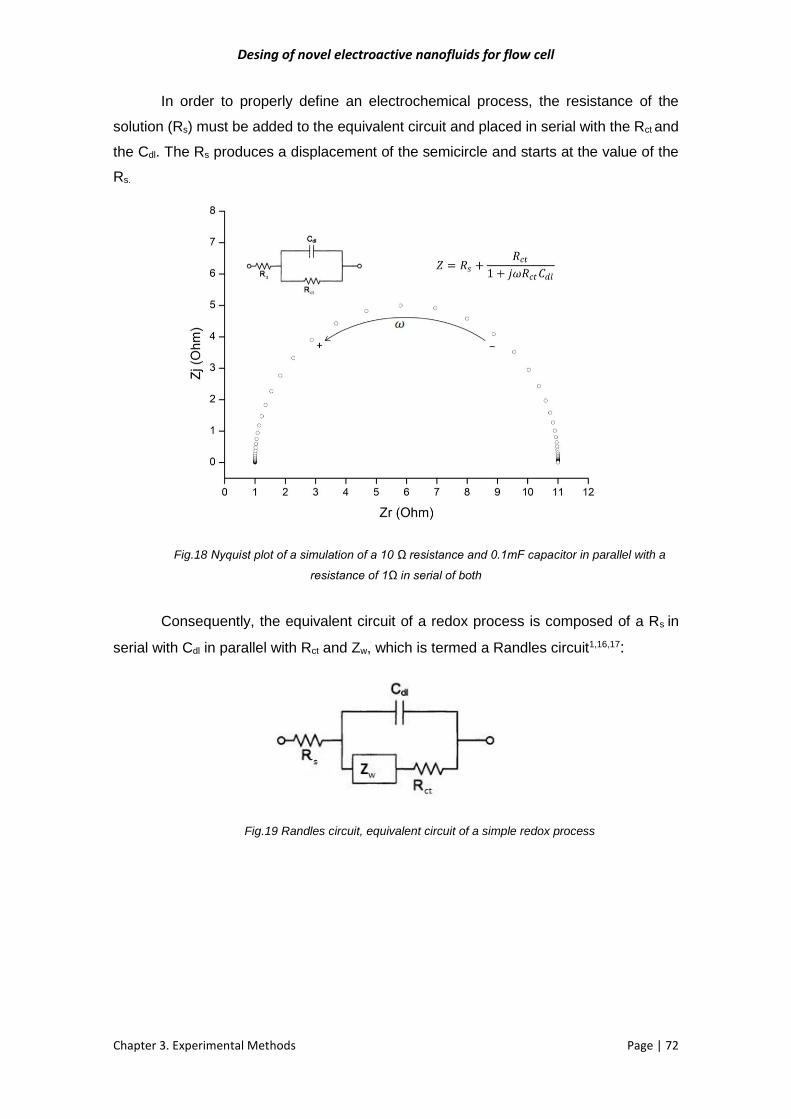
Desing of novel electroactive nanofluids for flow cell
Chapter 3. Experimental Methods Page | 72
In order to properly define an electrochemical process, the resistance of the
solution (Rs) must be added to the equivalent circuit and placed in serial with the Rct and
the Cdl. The Rs produces a displacement of the semicircle and starts at the value of the
Rs.
Fig.18 Nyquist plot of a simulation of a 10 Ω resistance and 0.1mF capacitor in parallel with a
resistance of 1Ω in serial of both
Consequently, the equivalent circuit of a redox process is composed of a Rs in
serial with Cdl in parallel with Rct and Zw, which is termed a Randles circuit1,16,17:
Fig.19 Randles circuit, equivalent circuit of a simple redox process

Desing of novel electroactive nanofluids for flow cell
Chapter 3. Experimental Methods Page | 73
The Nyquist plot of a Randles circuit shows linear behavior at low frequencies
and the explained semicircle behavior at high frequencies with Z being a complex
function1,16,17:
For simplicity, Z of the Randles circuit can be expressed depending on the range
of frequencies1,16,17:
· At high f (ω → ∞):
· At low frequencies (ω → 0):
𝑍𝑟 = 𝑅𝑠 +𝑅𝑐𝑡
1 + 𝜔2 + 𝐶𝑑𝑙2 + 𝑅𝑐𝑡
2
𝑍𝑗 =𝐶𝑑𝑙𝑅𝑐𝑡
2𝜔
1 + 𝜔2 + 𝐶𝑑𝑙2 + 𝑅𝑐𝑡
2
(𝑅𝑐𝑡
2)
2
= (𝑍𝑟 − 𝑅𝑠 −𝑅𝑐𝑡
2)
2
+ 𝑍𝑗
Circumference with center 𝑍𝑟 = 𝑅𝑠 +𝑅𝑐𝑡
2
And radio = 𝑅𝑐𝑡
2
Elimination of ω from this pair of equations yields:
𝑍𝑟 = 𝑅𝑠 + 𝑅𝑐𝑡 + 𝜎𝜔−12
𝑍𝑗 = 𝜎𝜔−12 + 2𝜎2𝐶𝑑𝑙
𝑍𝑗 = 𝑍𝑟 − 𝑅𝑠 − 𝑅𝑐𝑡 + 2𝜎2𝐶𝑑𝑙
Straight with slope 1, cut Zr in 𝑅𝑠 + 𝑅𝑐𝑡 − 2𝜎2𝐶𝑑𝑙
Elimination of ω from this pair of equations yields:
𝑍𝑟 = 𝑅𝑠 +𝑅𝑐𝑡 + 𝜎𝜔−1/2
(𝐶𝑑𝑙𝜎𝜔1/2 + 1)2 + 𝜔2𝐶𝑑𝑙2 (𝑅𝑐𝑡 + 𝜎𝜔−1/2)2
𝑍𝑗 =𝜔𝐶𝑑𝑙(𝑅𝑐𝑡 + 𝜎𝜔−1/2)
2+ 𝜎𝜔−1/2(𝜔1/2𝐶𝑑𝑙𝜎 + 1)
(𝐶𝑑𝑙𝜎𝜔1/2 + 1)2 + 𝜔2𝐶𝑑𝑙2 (𝑅𝑐𝑡 + 𝜎𝜔−1/2)2

Desing of novel electroactive nanofluids for flow cell
Chapter 3. Experimental Methods Page | 74
Fig.20 Simulation of a Randles circuit with 1Ω of Rs, 10Ω of Rct, 0.1mF of Cdl and 10Ω·s-1/2 of σ.
This different behavior at different frequencies is because in an impedance
technique, the processes observed depend on the frequency. High frequencies allow
observation of fast processes like the DLC generation or charge transference between
an active redox species and the electrode, whereas low frequencies allow observation
of slow processes like diffusion to the electrode1,16,17.
As a result, a Randles circuit provides a good description of a simple redox
electrochemical process, Figure 21. However, for more complex systems more complex
equivalent circuits are needed. For instance, inductors are used in the equivalent circuit
to describe the generation of coatings on the electrode surface. In this case, the profile
in the Nyquist plot is extended to negative values in the Zj as a partial semicircle16,17,
Figure 22.
Fig.21 Example of an equivalent circuit for an electrode in which a coating process takes place.

Desing of novel electroactive nanofluids for flow cell
Chapter 3. Experimental Methods Page | 75
Fig.22 Simulation of the equivalent circuit of the fig 21. Rs 1Ω, Cdl 0.1mF, Rct 10Ω, L 1 henry (H)
and RL 10Ω.
Equivalent circuit design is crucial for PEIS or any impedance technique, is basic
to design or find a circuit that fits the experimental data but that also have physical sense
with what is taking place in the electrode (there are a lot of equivalent circuits that can fit
the same data, but only a few have physical meaning). Therefore, in every case, the
equivalent circuit should be carefully chosen, especially in complex systems1,16,17.
3.2 Spectroscopic Techniques
3.2.1 Energy Dispersive X-ray Spectroscopy (EDX)
This technique records the energy and intensity of the x-rays generated by the
impact of an electron beam on the surface of a sample for a qualitative and quantitative
elemental analysis.

Desing of novel electroactive nanofluids for flow cell
Chapter 3. Experimental Methods Page | 76
An electron beam ejects core electrons from the atom of the sample leaving the
atom in an ionized state and an electron vacancy in the core, which is immediately filled
by an upper-shell electron and consequently an x-ray is emitted. The energy between
electronic levels is characteristic of each element and therefore, by measuring the energy
of the x-rays produced by the sample, it is possible to obtain the elemental composition
of the sample. Quantitative analysis can be performed by comparison of the relative peak
intensity of the peaks of different elements. Nevertheless, for an accurate quantification,
a standard compound with known stoichiometry is required18.
3.2.2 X-ray Photoelectron Spectroscopy (XPS)
In this technique, electrons are ejected from the sample surface by excitation
caused by x-ray radiation.
For elemental analysis, chemical state and a quantitative analysis of the sample can be
performed by measuring kinetic energy and counting the electrons emitted by the sample
because each element and chemical state has a unique electron energy19.
Fig.23 Scheme of XPS process
XPS analysis in the present study was carried out using a Perkin-Elmer
system, equipped with cylindrical analyzer and a highly monochromatic Al Kα
(1486.6 eV) X-ray source.

Desing of novel electroactive nanofluids for flow cell
Chapter 3. Experimental Methods Page | 77
3.2.3 Raman Spectroscopy
In this spectroscopic technique, the sample is excited with visible light and the
inelastic photons emitted by the sample are measured. When a sample is excited,
electrons can move to a virtual upper state, which they leave immediately by the
emission of a photon. If the electron returns to the same state, then an elastic interaction
takes place and the emitted photons have the same energy as the absorbed, which is
the most probable process and is called Rayleigh dispersion. But if the electron returns
to a different state, then inelastic interaction take place. This is very improbable in
comparison with Rayleigh scattering, which is 106 – 107 larger than inelastic interaction.
If an electron returns to a higher energy state than the initial state, the photons emitted
have lower energy than the absorbed photons, which is called Raman Stokes scattering.
If the electron returns to a lower energy state, compared with its initial state, the emitted
photons have a larger energy than the absorbed photons and this is referred to as anti-
Stokes Raman scattering. Anti-Stoke signals are less intense than Stoke signals
because they are less probable20.
Fig.24 Scheme of different electronic transitions
Raman scattering occurs as a result of a molecular vibration or a phonon that
generates a change in polarizability: in contrast, infrared scattering is produced by
vibration modes that cause a permanent dipole20.
Raman spectroscopy has been used to characterize graphene, it usually
presents 3 bands and their exact position depends on the laser used to excite the
sample21:
- D band ≈ 1350 cm-1
- G band ≈ 1580 cm-1
- 2D band ≈ 2700 cm-1

Desing of novel electroactive nanofluids for flow cell
Chapter 3. Experimental Methods Page | 78
Pure one-layer graphene will only show the G and 2D bands, being the 2D the
most intense. As the number of layers increases, the intensity of the 2D decreases:
at 5-10 layers, the intensity of the G and 2D are about equal. Above 10 layers, the G
band is the most intense peak. The D band is produced due to graphene defects, so
oxidized materials like rGO o GO use to present a strong D band, but in bulk
graphene its contribution is small and related to its edges.22
3.2.4 Ultaviolet-Visible Absorption Spectroscopy
This technique works on the principle of photon absorption that promotes bonding
and non-bonding electrons to excited states by a light source of 200-800nm. The
energy needed for this electronic transition is unique for each molecule and this
technique therefore allows identification of molecules and also the study of electronic
properties like the band gap. The main electronic transitions are:
- σ → σ* : promotion of an electron in a σ bonding orbital to an anti-bonding σ*
orbital, are very energetic transitions due to affects to the most stable valence
electrons, λ<150nm.
- n → σ* : promotion of non-bonding electrons (pair of free electrons) to an anti-
bonding σ* orbital, are also very energetic because the σ* is a very energetic
orbital, λ<150-200nm.
- n → π* and π→ π*: These are the most common and studied transitions, from
non-bonding and π orbitals to anti-bonding π* orbitals and take place at λ 200-
700 nm. These transitions correspond to the promotion of electrons from double,
triple bonds and ligands.
Spectra is recorded as absorbance (Aλ) vs wavelength (λ), absorbance is a measure
of the attenuation of light after passing through a material defined as:
where I0 is the intensity of the light before passing through the sample and I is the
intensity after passing through the sample. Bands tend to be wide in the Aλ vs λ diagram
because electrons from excited vibrational and rotational states are also promoted too23.
𝐴λ = −𝑙𝑜𝑔10 (𝐼
𝐼0)

Desing of novel electroactive nanofluids for flow cell
Chapter 3. Experimental Methods Page | 79
But it can also be recorded as transmittance (Tλ) vs λ, where Tλ is:
By the Beer–Lambert law, it is possible to determine the concentration of a solution
by using the equation:
where l is the is the length of the light path (cm), c is the analyte concentration (mol·L-1)
and Ɛ is the molar absorptivity coefficient (L·mol-1·cm-1)
3.3 Transmission Electron Microscopy (TEM)
To characterize the morphology of NPs or nanostructures, the size or number of
graphene layers and also do chemical and crystallographic analysis in situ TEM is
needed. In this technique, a thin specimen is crossed by an electron beam (electrons are
unable to cross trough a thick sample) and higher atomic elements will appear darker in
TEM images because of their higher electron density.
Electrons are used to generate the image because in order to see in the atomic
scale, a wavelength with the same scale is needed and electrons have a De Broglie
wavelength (size of particles that will interact with the radiation) of less than 1 Å. The
resolution of any optical system is defined by the Abbe’s equation24:
where:
- d = minimum resolvable distance
- λ = wavelength
- n = refractive index
- θ = aperture angle of the objective lens
X-ray radiation also fits the wavelength requirements, but electrons interact
stronger with atoms, so electrons are the best option to obtain images at atomic scale.
TEM works by monoenergetic electrons, magnetic lenses and a fluorescence
screen or a CCD sensor everything under ultravacuum conditions and can work in two
modes: image and diffraction depending on the aperture24,25, Figure 25.
𝐴λ = −𝑙𝑜𝑔10𝑇𝜆
𝐴λ = 𝑙𝑐Ɛ
𝑑 =𝜆
2𝑛 sin 𝜃

Desing of novel electroactive nanofluids for flow cell
Chapter 3. Experimental Methods Page | 80
Diffraction patterns are used to identify the crystallographic structures of a sample
thanks to constructive and destructive interferences produced by the crystal structure of
a material. Furthermore, TEM analysis capacity has been improved by the integration of
other techniques in the device and techniques like EDX and electron energy loss
spectroscopy (EELS) 24
Fig.25 Scheme of TEM in image and diffraction mode
3.3.1 Selected Area Electron Diffraction (SAED)
SAED is a crystallographic technique that can be implemented in the diffraction
mode of a TEM to identify and study crystalline phases. In this technique, the sample is
first examined by the image mode of the TEM to determine the concrete area to study.
The microscope is then switched to diffraction mode by inserting the proper aperture,
which blocks almost all the electrons from the beam except for the small fraction that are
scattered by the sample due to its crystalline structure24.
Interplanar distance can be directly determined by the separation of the diffraction
spots (figure 26), thanks to Bragg’s law and the camera length (L):
2𝑑 sin 𝜃 = 𝜆

Desing of novel electroactive nanofluids for flow cell
Chapter 3. Experimental Methods Page | 81
𝑅𝑑 = 𝜆𝐿 (4)
(3)
(2)
(1)
where λ is the wavelength of the electrons, d is interplanar space and 2θ is the
scattering angle of the electrons caused by the diffraction process.
Fig.26 Scheme of the geometry of the diffraction pattern
Because electron wavelength is very small, the diffraction angle is also very small
and thus, diffracted electrons are almost parallel to the electron beam. For instance, for
a low energy beam of 100 KeV, λ is 0.037Å and θ ≈ 1º. Consequently, for a small angle
of diffraction26
By the geometry of figure 26
and using Bragg’s law can be expressed as:
and
sin 𝜃 ≈ tan 𝜃 ≈ 1
2tan(2𝜃)
tan(2𝜃) =𝑅
𝐿
2𝑑1
2
𝑅
𝐿= 𝜆

Desing of novel electroactive nanofluids for flow cell
Chapter 3. Experimental Methods Page | 82
Equation 4 allows to determine the interplanar space from the separation of the
diffraction points (R), provided λL, the “camera constant” (Å·cm), is known.
3.4 Scanning Electron Microscopy (SEM)
This technique allows to characterize the surface morphology and microstructural
characteristics of a sample, but also can provide information about the elemental
composition. SEM works by the scanning of the sample with a focused beam of
electrons, the electrons can get scattered through an elastic (negligible energy loss) or
inelastic mechanism, then are collected to generate the picture, thus the sample must
be electrically conductive in order to be able to scatter the electrons.
Inelastic scattered electrons ejected from the valence band of the sample with
low energy (< 50eV) are called secondary electrons. They emerge from the immediate
sample surface (few nanometers below the surface), thus these electrons provide an
excellent topological information. On the other hand, elastic scattered electrons can also
be used to generate a picture of the sample. In that case topological details will be worse
than those obtained from secondary electrons because elastically scattered electrons
come from a deeper part of the sample. However, since elastic scattering depends on
the mass of the atoms, in this case important information related to composition of the
sample can be obtained27.
3.5 X-ray Diffraction (XRD)
XRD is a technique that allows the crystal structure or structures of a sample to
be determined and even, with a proper pattern, a quantitative analysis of the different
phases in a complex mixture can also be performed, thanks to the intensity and thickness
of peaks in the diffraction pattern.
X-rays are used because their wavelength fits with the interplanar distances of
the crystalline structures, and monochromatic x-ray radiation is used. Diffraction peaks
are generated when the scattered x-ray from a set of lattice planes in the crystal satisfies
Bragg’s law. Thus, scanning a powder sample through a range of 2θ angles, all possible
diffraction directions of the lattice can be attained due to the random orientation of the
powdered material. Because each crystalline phase has a unique interplanar distance, it
is possible to identify the various phases that form a material from the conversion of the

Desing of novel electroactive nanofluids for flow cell
Chapter 3. Experimental Methods Page | 83
peaks recorded in the diffractogram to the corresponding interplanar distance. This is
usually done by comparison of the peak position and intensity with those of standard
database patterns28.
Fig.27 Scheme of x-ray diffraction process
3.6 Specific Surface Area (SSA)
This technique measures N2 adsorption and desorption at different pressures on
the surface of a material to determine it SSA and pore size by the multipoint Brunauer-
Emmett-Teller (BET) method. The concept behind this method is an extension of the
Langmuir theory, which is a theory for monolayer to multilayer molecular adsorption with
the following hypotheses: (a) gas molecules physically adsorb on a solid in layers
infinitely; (b) there is no interaction between each adsorption layer; and (c) the Langmuir
theory can be applied to each layer29.
IUPAC pore size classification:
o Macroporous: pores larger than 50 nm.
o Mesoporous: pores between 2-50 nm.
o Microporous: pores smaller than 2nm.

Desing of novel electroactive nanofluids for flow cell
Chapter 3. Experimental Methods Page | 84
Gas adsorption is a complex process that depends on chemical composition,
physical interactions and the surface structure. Thus, inert gasses at low temperatures
are used to make physical interactions. A large part of the porous structures are complex,
with different pore sizes and channels of different sizes, which produce different kinds of
adsorption-desorption curves. One of the classifications more widely accepted is that
proposed by IUPAC29:
Fig.28 IUPAC adsorption-desorption curves classification
Type I: A typical curve of microporous materials: high adsorption energy of
micropores allows gas adsorption at low pressures.
Type II: This curve is obtained with a non-porous or microporous adsorbent and
represents unrestricted monolayer-multilayer adsorption. Point B, the beginning of the
almost linear middle section of the curve, is often taken to indicate the stage at which
monolayer coverage is complete and multilayer adsorption is about to begin.
Type III: This type of curve, which is not commonly found, indicates a week
interaction between the gas and material.
Type IV: A typical curve of mesoporous materials: at low pressures it acts as type
II but at high pressures, it shows a hysteresis cycle.
Type V: This is like a type III curve indicating a low interaction between gas and
material. This is also not a common kind of curve.
Type VI: This curve is associated with an adsorption layer by layer that is
homogeneous with respect to the gas. These are the least common adsorption curves.

Desing of novel electroactive nanofluids for flow cell
Chapter 3. Experimental Methods Page | 85
3.7 Rheology
Rheology is the discipline dealing with deformation and flow of matter. Viscosity
is one of the building blocks of rheology. Viscosity is a measure of the flow resistance of
a fluid. When a fluid starts to flow under the action of a force, a shearing stress arises
everywhere in the fluid that tends to oppose the motion. As one layer of the fluid moves
past an adjacent layer, the fluid's molecules interact to transmit momentum from the
faster layer to the slower layer, tending to resist motion30. In this thesis work, rheology
experiments were carried out using a RheoStress 600 from Hacker at the Institut de
Ciència de Materials de Barcelona (ICMAB).
3.8 Materials Preparation
3.8.1 Reduced Graphene Oxide (RGO)
Graphene oxide (GO) was synthesized from natural graphite using the modified
Hummers method. Briefly, 2.5 g of NaNO3 and 125 ml of H2SO4 were added to 2.5 g of
graphite and stirred for 30 min in an ice bath. 12.5 g of KMnO4 was added to the resulting
solution, and then the solution was stirred at 50 ºC for 2 h. 500 ml of deionized water and
15 ml of H2O2 (35%) were then slowly added to the solution, and the solution was washed
with dilute HCl. The GO product was washed again with 250 ml of concentrated HCl
(37%). The reduced graphene oxide (RGO) was prepared by high temperature treatment
of the GO sample at 800 ºC under nitrogen for 1 h.
3.8.2 RGO-Polyoxometalate (RGO-POM)
Hybrid materials were prepared based on rGO-phosphomolybdic acid (rGO–
PMO12) and RGO-phosphotungstic acid (RGO-PW12). Briefly, 0.25 g of rGO was
dispersed in 100 ml of deionized water with a probe sonicator (1000 watts) for 30 min.
10 mM of the chosen POM was then added to the pre-sonicated 100 ml RGO dispersion.
This suspension was further sonicated (bath sonicator 200 watts) for 2 h and kept at
room temperature for 24 h. Afterwards, the product was filtered off and dried in a vacuum
oven at 80 ºC overnight.
Desing of novel electroactive nanofluids for flow cell
Chapter 3. Experimental Methods Page | 86
3.8.3 LiFePO4
A LiFePO4 sample was prepared by a reflux method. Stoichiometric amounts
(0.03 mmol) of Li(CH3COO)·2H2O (3.0606 g), Fe(C2O4)·2H2O (5.3907 g) and 85 %v/v
H3PO4 (2.05 mL) were dissolved in 70mL of ethylene glycol. The liquid reaction mixture
was placed in a round-bottom flask connected to a condenser and refluxed vigorously
for 72 h at 200ºC. The final pH of this solution was 7. The resulting solid was filtered-off,
washed several times with deionized water and then ethanol. The sample was dried
under vacuum at 80ºC overnight, preheated at 350ºC for 5 h and then sintered at 700ºC
for 10 h under nitrogen atmosphere. 3.4214 g of green powder were collected, which
amounts to a 92% yield.
3.8.4 Electrochemically Exfoliated Few Layers Graphene
A cell with a novel horizontal geometry was designed and built in order to directly
exfoliate graphite powders (20 µm of average size). Graphite powder (Sigma Aldrich
282863-1KG) was placed at the bottom of the cell as the negative electrode and a Pt
sheet was placed on top of it as the positive electrode. The whole system was submerged
in the electrolyte, 0.1M (NH4)2SO4, to carry out the exfoliation process.
After the exfoliation process, the electrochemical cell was cleaned with water and
acetone over a filtration setup with a 0.2 µm pore size PTFE filter to deposited on it the
exfoliated product. Which was washed with water and acetone several times to remove
the electrolyte.
The product obtained was weighed and dispersed in DMF, 3g/L, and sonicated
for 5 minutes in an ultrasound bath. After 24 h the stable dispersion was extracted from
the precipitated non exfoliated product, which was filtrated and weighed in order to
calculate the yield of the exfoliation process.

Desing of novel electroactive nanofluids for flow cell
Chapter 3. Experimental Methods Page | 87
3.8.5 Graphene Film Preparation
Graphene film was prepared from the stable graphene dispersions produced by
the electrochemical exfoliation of carbon powder. LiClO4 was added up to 1M to the
stable graphene dispersions to induce a flocculation process to precipitate the graphene.
Next, the excess solvent was removed and deposited on a Kapton substrate placed on
a watch glass to avoid leaking at the edges. After a week, samples were dried, and the
graphene and LiClO4 were deposited on the Kapton substrate. Finally, samples were
carefully cleaned with acetone to only remove the LiClO4.
References
1. Bard, A. J. & R.Faulkner, L. Electrochemical methods, fundamentals and
applications. Journal of Chemical Education (2000).
2. Kurzweil, P. Electrochemical Double-layer Capacitors. Electrochemical
Energy Storage for Renewable Sources and Grid Balancing (Elsevier
B.V., 2015). doi:10.1016/B978-0-444-62616-5.00019-X
3. Kotz, R. & Carlen, M. Principles and applications of Caps. Electrochim.
Acta 45, 2483–2498 (2000).
4. Linden, D. & Reddy, T. B. Handbook of Batteries, third edition. McGraw-
Hill (2002). doi:10.1016/0378-7753(86)80059-3
5. Daniel, C. Electrochemical Technologies for Energy Storage and
Conversion Electrocatalysis of Direct Methanol Fuel Cells
Nanotechnology for the Energy Challenge Lithium Ion Rechargeable
Batteries Hydrogen and Fuel Cells Handbook of Fuel Cells High Energy
Density Lit. (2012).
6. Goodenough, J. B. & Park, K. S. The Li-ion rechargeable battery: A
perspective. J. Am. Chem. Soc. 135, 1167–1176 (2013).
7. Winter, M. & Brodd, R. J. What are batteries, fuel cells, and
supercapacitors? Chem. Rev. 104, 4245–69 (2004).
8. Zhou, H. & Dong, S. Determination of the standard heterogeneous rate

Desing of novel electroactive nanofluids for flow cell
Chapter 3. Experimental Methods Page | 88
constant in polyelectrolyte using steady state microdisk voltammograms.
J. Electroanal. Chem. 425, 55–59 (1997).
9. Bleam, W. Water Chemistry. in Soil and Environmental Chemistry 189–
251 (Elsevier, 2017). doi:10.1016/B978-0-12-804178-9.00005-7
10. Madjarov, J. et al. Revisiting methods to characterize bioelectrochemical
systems: The influence of uncompensated resistance (iRu-drop), double
layer capacitance, and junction potential. J. Power Sources 356, 408–418
(2017).
11. Van Der Vliet, D. et al. On the importance of correcting for the
uncompensated Ohmic resistance in model experiments of the Oxygen
Reduction Reaction. J. Electroanal. Chem. 647, 29–34 (2010).
12. Stoller, M. D. & Ruoff, R. S. Best practice methods for determining an
electrode material’s performance for ultracapacitors. Energy Environ. Sci.
3, 1294–1301 (2010).
13. Shao, Y. et al. Design and Mechanisms of Asymmetric Supercapacitors.
Chem. Rev. 118, 9233–9280 (2018).
14. Sandford, C. et al. A Synthetic Chemist’s Guide to Electroanalytical Tools
for Studying Reaction Mechanisms. Chem. Sci. (2019).
doi:10.1039/C9SC01545K
15. Elgrishi, N. et al. A Practical Beginner’s Guide to Cyclic Voltammetry. J.
Chem. Educ. 95, 197–206 (2018).
16. Orazem, M. E. & Tribollet, B. Electrochemical Impedance Spectroscopy.
(John Wiley & Sons, Inc., 2008). doi:10.1002/9780470381588
17. Snook, I. & Barnard, A. Impedance Spectroscopy. America (John Wiley &
Sons, Inc., 2005). doi:10.1002/0471716243
18. Tsuji, K. Grazing-exit electron probe X-ray microanalysis ( GE-EPMA ):
Fundamental and applications. 60, 1381–1391 (2005).
19. Bluhm, H. X-ray photoelectron spectroscopy (XPS) for in situ
characterization of thin film growth. in In Situ Characterization of Thin Film

Desing of novel electroactive nanofluids for flow cell
Chapter 3. Experimental Methods Page | 89
Growth 75–98 (Elsevier, 2011). doi:10.1533/9780857094957.2.75
20. Dietzek, B., Cialla, D., Schmitt, M. & Popp, J. Introduction to the
Fundamentals of Raman Spectroscopy. in Springer Series in Surface
Sciences 66, 21–42 (2010).
21. Ferrari, A. C. et al. Raman spectrum of graphene and graphene layers.
Phys. Rev. Lett. 97, 1–4 (2006).
22. Das, A., Chakraborty, B. & Sood, A. K. Raman spectroscopy of graphene
on different substrates and influence of defects. Bull. Mater. Sci. 31, 579–
584 (2008).
23. De Caro, C. A. & Haller, C. UV-VIS Spectrophotometry - Fundamentals
and Applications. (Mettler-Toledo, 2015).
24. Williams, D. B. & Carter, C. B. Transmission Electron Microscopy: A
Textbook for Materials Science. (Springer US, 1996). doi:10.1007/978-1-
4757-2519-3
25. Meyer, J. C. Transmission electron microscopy (TEM) of graphene. in
Graphene 101–123 (Elsevier, 2014). doi:10.1533/9780857099334.2.101
26. Fultz, B. & Howe, J. Transmission Electron Microscopy and Diffractometry
of Materials. (Springer Berlin Heidelberg, 2008). doi:10.1007/978-3-540-
73886-2
27. Zhou, W., Apkarian, R., Wang, Z. L. & Joy, D. Fundamentals of Scanning
Electron Microscopy (SEM). in Scanning Microscopy for Nanotechnology
1–40 (Springer New York, 2006). doi:10.1007/978-0-387-39620-0_1
28. Jenkins, R. & Snyder, R. L. Introduction to X-ray Powder Diffractometry.
Chemical Analysis - volume 138 (John Wiley & Sons, Inc., 1996).
doi:10.1002/9781118520994
29. K.S., W. S. Reporting physisorption data for gas/solid systems with
Special Reference to the Determination of Surface Area and Porosity.
Pure Appl. Chem. 57, 603–619 (1985).
30. Rheology of Complex Fluids. (Springer New York, 2010).

Desing of novel electroactive nanofluids for flow cell
Chapter 3. Experimental Methods Page | 90
doi:10.1007/978-1-4419-6494-6

Desing of novel electroactive nanofluids for flow cell
Chapter 4. Molecular Flowing Systems. Quinones in Organic Electrolytes Page | 91
CHAPTER 4
Molecular Flowing
Systems. Quinones in
Organic Electrolytes

Desing of novel electroactive nanofluids for flow cell
Chapter 4. Molecular Flowing Systems. Quinones in Organic Electrolytes Page | 92

Desing of novel electroactive nanofluids for flow cell
Chapter 4. Molecular Flowing Systems. Quinones in Organic Electrolytes Page | 93
4.1 Context
This first research chapter is centered on a well-known family of electroactive
molecular compounds, i.e. quinones. In principle, simple organic molecules able to
reversibly exchange two electrons per molecule in solution with good kinetics and a well-
known mechanism in aqueous media. As a consequence, the overwhelming majority of
work related to the use of quinones in flow cells dealt with aqueous electrolytes. As a
matter of fact, this made it necessary for these aromatic molecules to be tuned, e.g.
sulfonated, in order to reach acceptable concentrations in water to be used as an energy
storage system.
In principle, the use of organic solvents would lead to greater solubility of
quinones, to a wider working voltage range and therefore to a greater energy density. In
the other hand, quinone redox mechanisms would be needed to be studied due to their
high dependence of the media and in order to understand and avoid secondary spurious
reactions.
For this study we chose CH3CN as solvent because it low viscosity, 0.34 mPa·s,
and good dielectric constant, 38, make it and excellent option for a system that must flow
and thus, it final efficiency will deepens not only by the electrochemical performance but
also by the cost of pump the electroactive solutions into the electrochemical cell. We
chose a Li salt to work with quinones because we tried to change the two electrochemical
semireversible steps that used to present quinones in organic electrolytes, for an
electrochemical mechanism similar in water in which Li+ would act in a similar way than
H+. Furthermore, work with Li+ is inserting because allows to study the potential of
quinones as cathodes for Li-ion battery technology. Finally, we chose the methyl-p-
benzoquinone (MBQ) as the main quinone in this work because, due to its size and
sterical hindrance, allows to show more clear this effects on the electrochemical
performance in comparison with the other quinones also studied and reported in this
work.

Desing of novel electroactive nanofluids for flow cell
Chapter 4. Molecular Flowing Systems. Quinones in Organic Electrolytes Page | 94
4.2 Introduction
Quinones are the perfect example of reversible redox organic molecules. They
are key pieces in natural and synthetic chemistry, from biological processes such as the
mitochondrial ATP synthesis or the photosynthetic reaction center to their use as active
materials in energy storage applications.1 In both cases their effectiveness rests on their
well-known reversible aqueous electrochemistry with good kinetics and a high
electrochemical equivalent (two electrons per molecule of quinone).
In the field of energy storage quinones have been increasingly studied as active
molecular materials for redox flow batteries (RFBs) and they count with all the
characteristics necessary to conform the next generation of this type of cells. On the
other hand, quinones have most frequently been used in aqueous solutions for this type
of applications. Indeed, a recent series of works have described the successful use of
sulfonated quinone derivatives to demonstrate their potential in aqueous electrolytes2–4.
This may seem paradoxical since these organic molecules are most soluble in a variety
of organic solvents rather than in water. As a matter of fact, the effective use of
anthraquinone in aqueous solutions requires the sulfonation of the aromatic moiety.
Thus, a plausible alternative would be to explore the use of quinones in organic
electrolytes as active fluid materials for RFBs. In our group we have worked along that
direction but have found several hurdles which we report here, as well as two alternative
solutions to circumvent those hurdles
Two distinct mechanisms for the reduction of quinones have been proposed
depending on the medium. For protic media the redox reactions take place in a single
step involving the transference of two electrons. In this case the nature of intermediate
species depends on the pH5. In aprotic media the redox mechanism involves two one-
electron steps with a radical being generated in the first step1,5,6, and with a second
process that usually is not completely reversible.
In aprotic media, the addition of a proton source (Bronsted acid) results in an
intermediate situation5,7,8 with hydrogen-bond formation leading to a redox mechanism
similar to that in protic media9–11.
In any event, the behavior of quinones in aprotic media is quite varied and
complex because it depends on the polarity of the solvent, the support electrolyte, the
quinone structure and, as explained above, the presence of protons in the media.
Furthermore, the redox chemistry of quinones in aprotic media involves several possible
intermediate adducts formed through weak interactions between two quinone molecules.

Desing of novel electroactive nanofluids for flow cell
Chapter 4. Molecular Flowing Systems. Quinones in Organic Electrolytes Page | 95
These adducts could be anionic ([QQ]2-, [QQ]- ) or radical species ([QQ]•)7,12–14 that
modify the mechanism leading to an irregular reversibility of the second redox process.
The variable redox behavior of quinones with solvent polarity15,16 is due to the selective
stabilization of some of these adduct species in different solvents. Similarly, the support
electrolyte modulates the redox mechanism due to the interaction between the
electrolyte cation and the different quinone anions14–18.
Other important issue of the redox chemistry of quinones in aprotic media is a
distinct trend to undergo dimerization. Indeed, the radical generated in the first redox
process can react with a neutral quinone molecule, a quinone-anion or other radical
leading to dimer generation19–22. Finally, we should mention the formation of polymers as
another characteristic feature of quinone electrochemistry in aprotic media. The resulting
polymers can be grown as thin films on the electrode surface, 23–25 and can present
conductivity and reversible redox processes, thus making them potentially useful as
catalysts or electrodes. A common approach to foster these polymerization processes is
the use of quinones with amino or carboxylic acid groups. For example, poly-1,5-
diaminoanthraquinone is one of the most frequently studied quinone polymers as a thin
film supercapacitor electrode26–28, but it has also been studied as electrocatalyst for O2
reduction29,30.
A vast number of articles have been published on the electrochemistry of
quinones. Yet, a substantial majority of them dealt with aqueous media, where the redox
mechanism is better understood. As we have just discussed, the chemistry and
electrochemistry of quinones in organic media is more difficult to predict, but precisely
because of that it should deserve more attention.
In this work we report a detailed study of a specific combination of quinone
(methyl-p-benzoquinone (MBQ)), solvent (CH3CN) and electrolyte (LiClO4). Acetonitrile
was selected for this study due to its large dielectric constant, 38, and low viscosity, 0.34
mPa·s, together with a wide electrochemical stability window. Also we decided to work
with a Li electrolyte to its widespread use and good performance in redox process
applied to energy storage. Under our experimental conditions MBQ only shows a couple
of redox peaks and the reversibility of its redox process depends on the concentration of
LiClO4, with best results for larger concentrations of LiClO4. These facts made us
consider the hypothesis that Li+ could induce a behavior similar to that of protons in the
redox mechanism of MBQ.
The work reported here was carried on in order to confirm this hypothesis and
understand the corresponding redox mechanisms. On the other hand, during the

Desing of novel electroactive nanofluids for flow cell
Chapter 4. Molecular Flowing Systems. Quinones in Organic Electrolytes Page | 96
electrochemical reduction of MBQ a green layer was systematically generated onto the
working electrode (regardless of the working electrode used and the presence of O2 in
solution). We have proven and show here how this layer prevents the MBQ redox
processes from taking place, and how it can lead to a quinone polymerization process
which can be reversed by the application of a positive overpotential. Similar behavior
was observed for p-benzoquinone and 1,4-naphthoquinone but not for anthraquinone.
4.3 Experimental Section
Reagents from Sigma Aldrich: 1,4-naphthoquinone (97%), acetonitrile (≥99.9%),
anthraquinone (97%), lithium perchlorate (>95%), methyl-p-benzoquinone “MBQ” (98%),
p-benzoquinone (98%), tetraethyammonium tetrafluoroborate (99%).
A VMP3 potentiostat-galvanostat from BioLogic with the EC-Lab 10.44 version
was used for the electrochemical measures. Glassy carbon disk of 3 mm diameter from
CH Instruments Inc. (CHI 104) electrode and a Pt sheet were used as working (WE)
electrode, a Pt mesh as a counter electrode (CE). We used a non-aqueous reference
electrode (RE) Ag/Ag+ from BAS Inc. (013394), based on a solution of 0.1 M
tetrabutylammonium perchlorate (TBAP) and 0.01 M AgNO3 in CH3CN.
Cyclic Voltammetry and Potentiostatic Electrochemical Impedance Spectroscopy
(PEIS) experiments were performance with the same 3 electrodes configuration, working
frequencies were from 10 kHz to 100 mHz. Before each PEIS measure was made a
chronoamperometry experiment of 10 minutes to obtain a current with low variation front
time, was not possible apply a longer time in the chronoamperometry experiments by
large volatility of the solution to obtain a better constant current, a longer time would
promote a significant concentration difference between the experiments. Also before
each experiment the glassy carbon electrode was polished.
UV-Vis spectra were recorded as a function of the potential applied on the
working electrode. These in-situ studies were carried out with an Autolab PGSTAT30
potentiostat/galvanostat. Chromogenic analyses were performed concomitantly with the
electrochemical experiments using a USB4000 spectrophotometer (Ocean Optics Inc)
equipped with an LS1 tungsten halogen light source and fiber optic cables with a
diameter of 600 µm.

Desing of novel electroactive nanofluids for flow cell
Chapter 4. Molecular Flowing Systems. Quinones in Organic Electrolytes Page | 97
4.4 Results and Discussion
Cyclic voltammetry experiments of MBQ solutions in LiClO4 / CH3CN electrolytes
showed an apparently single (or two unresolved) redox couple process in contrast to the
typical behavior of quinones in aprotic solvents, which show two well-resolved
processes. Figure 1 compares CVs for the same MBQ in two different acetonitrile
electrolytes, showing the remarkable difference between LiClO4 and
tetraethylammonium tetrafluoroborate (TEATFB).
Fig.1 Cyclic voltammetry with glassy carbon WE at 100 mV s-1 of 0.01M MBQ solution in CH3CN,
a) 1.5M LiClO4 b) 1M TEATFB.
Another remarkable difference between the electrochemistry of MBQ in TEATFB
and in LiClO4 electrolytes is the generation of a bright green coating upon application of
negative potentials associated to the reduction of MBQ. This green coating, which will
be discussed in detail below (Figure 3d) is formed regardless of the working electrode,
scan rate and electrolyte concentration used. Indeed, we found it in every experiment we
run.
But before dealing with this conspicuous green layer, we need to discuss another
important element of this work, namely, the effect of Li+ concentration on the
electrochemistry of MBQ. Figure 2 shows CVs of MBQ with various concentrations of
LiClO4 in acetonitrile electrolytes recorded at 100 mV s-1. The separation between

Desing of novel electroactive nanofluids for flow cell
Chapter 4. Molecular Flowing Systems. Quinones in Organic Electrolytes Page | 98
oxidation and reduction peaks of MBQ (indicative of the reversibility of the redox
potentials) depends on the concentration of LiClO4. Low concentration of salt leads to a
wide and weaker oxidation peak which is shifted to higher potential, indicating a poorly
reversible oxidation process (figure 2a). As the concentration of LiClO4 is increased the
oxidation peak gets better resolved and shifts to lower potentials (figure 2b). Thus, the
larger concentration of LiClO4 used led to the minimum distance between oxidation and
reduction peaks by a displacement of the oxidation peak to more negative potentials
(figure 2c).
Fig.2 Cyclic voltammetry with glassy carbon WE at 100 mV s-1 of 0.01M MBQ solution in CH3CN,
a) 0.5M LiClO4 b) 1M LiClO4 c) 1.5M LiClO4.
Thus, an increase of the LiClO4 concentration increases the reversibility of the
redox process of MBQ. This indicates that Li+ ions stabilize the MBQ anions generated
by the reduction process. Accordingly, any possible irreversible reaction which MBQ
anions could undergo for low lithium concentrations are minimized with high lithium
concentrations, thus allowing the generation of a reduced product able to be reoxidized.
Furthermore, it should be noted that the oxidation process is composed of two individual
steps, as indicated by the shoulder in the oxidation peak in figure 2c. That indicates that
the redox of MBQ in our conditions takes place in two steps at very close potentials,
implying the presence of a radical species in the MBQ redox mechanism.

Desing of novel electroactive nanofluids for flow cell
Chapter 4. Molecular Flowing Systems. Quinones in Organic Electrolytes Page | 99
Cyclic voltammetry experiments at lower scan rates (10 mV s-1) show a decrease
of the intensity in each cycle (figures 3a-c) with a faster collapse for the oxidation peak.
That behavior is associated to the very conspicuous and fast generation of a green layer
coating the WE. That coating was generated at negative potentials corresponding to the
reduction of MBQ and was formed regardless of Li+ concentration, scan rate or materials
used as WE (figure 3d), in our case, Pt, Au Ni and Cu, as well as various carbon
electrodes, including glassy carbon. Remarkably, it was possible to remove this coating,
produced by the reduction of the MBQ, with the application of a positive overpotential,
but this reoxidation is a slower process than the reductive coating process as is proved
by the experiments at 10 mV s-1.
Fig.3 Cyclic voltammetry with glassy carbon WE at 10mV s-1 of 0.01M MBQ solution in CH3CN, a)
0.5M LiClO4 b) 1M LiClO4 c) 1.5M LiClO4, d) Glassy carbon and Pt sheet as WE covered by the MBQ
reduction.

Desing of novel electroactive nanofluids for flow cell
Chapter 4. Molecular Flowing Systems. Quinones in Organic Electrolytes Page | 100
The electrode passivation at low scan rate indicate that the reduction process is
faster than oxidation. The progressive collapse of CV waves upon cycling indicates that
the coating generated on the surface of the electrode by the reduction process increases
in each cycle, with the resistance of the electrode increasing at the same time. This is
consistent with a polymerization process taking place on the surface of the electrode.
This electropolymerization process is clearly associated to the reduction peak appearing
at the more negative potentials on the CVs (figure 2c). That peak is much better resolved
in the CV of figure 2c than in 2a,b. The reason is that the former CV was run up to a
large positive potential, thus allowing enough time for the green coating to dissolve after
each cycle (a dissolution which was ascertained by visual inspection). This resulted in
the polymerization process to start anew in each cycle leading to a well-defined
electropolymerization peak. This hypothesis is supported by results at low scan rate,
figures 3a-c, where the most negative peaks disappear faster than the other reduction
peaks upon cycling.
Impedance studies corroborate the mechanism proposed by the CV experiments.
The impedance experiments were performance at five different potentials in order to
study the different processes taking place on the electrode surface. Figure 4a shows
Nyquist plots recorded at each of those potentials, and figure 4b presents the
corresponding polarization curve. A glassy carbon disk electrode was used as WE in all
the PEIS experiments.

Desing of novel electroactive nanofluids for flow cell
Chapter 4. Molecular Flowing Systems. Quinones in Organic Electrolytes Page | 101
Fig.4 a) Nyquist plot of the different potentials applied, b) Polarization curve.
The first point was recorded at -0.43V, a potential less negative than the reduction
peak of MBQ. The corresponding series in the Nyquist plot shows the typical behavior
for a simple electrochemical redox process, a semicircle at high frequencies due to the
electron transfer and a 45º straight line at low frequencies due to mass transport. The
second point (-0.47V) corresponds to the first reduction peak, corresponding to the
reversible reduction of MBQ. It also shows the behavior of a simple electrochemical
redox process. In this case the resistance associated to electron transfer decreases and

Desing of novel electroactive nanofluids for flow cell
Chapter 4. Molecular Flowing Systems. Quinones in Organic Electrolytes Page | 102
the current increases due to the application of a larger overpotential allowing for a
maximum velocity for electron transfer between MBQ and the electrode. It should be
noted that no green coating was detected on the electrode surface after these two PEIS
experiments.
The third point (-0.5V) is located between the peak of reversible reduction of MBQ
and the second reduction peak that we assign to a polymerization process. At this
potential the resistance associated with the electron transfer is the largest of all the
potentials studied and, correspondingly, the current is the lowest. The shape in the
Nyquist plot changes radically with respect to the two previous cases. The semicircle can
be considered completed but it is irregular and is followed by a line with larger slope than
in the two previous cases at less negative potentials discussed above. The large
semicircle clearly indicates that the resistance for the redox process of MBQ increases
substantially. On the other hand, the large slope after the semicircle indicates a
capacitive behavior which is compatible with the adsorption of MBQ on the electrode and
not diffusing to the solution. Indeed, at the end of this experiment, the green coating was
apparent on the surface of the electrode, thus confirming the MBQ adsorption. All these
observations conform to a picture in which the application of a potential negative enough
(-0.5V), leads to a faster reduction of MBQ, which results in an increased concentration
of the reduced product on the electrode surface; a concentration high enough to lead to
the formation of the green coating, which in turn blocks the surface to the reduction of
the remaining MBQ in solution. This blocking barrier (not yet an insoluble polymer) is
responsible for the largest resistance observed and the very small current associated.
The fourth point (-0.64V) is integrated in the second reduction peak. As
mentioned before, this potential was associated to the growth of a blocking polymer
leading to the collapse of intensity of CVs at low scan rate (Fig. 3). At this potential the
shape of the Nyquist plot is similar to that of the third point (at -0.5V) but the resistance
associated to the electron transfer is much smaller (Fig 4 a). Furthermore, the series for
this fourth point shows negative values of the imaginary component of impedance for the
last three points. Finally, this point presents the largest intensity value despite having a
larger resistance than the first and second points. This large intensity confirms that an
electropolymerization process is effectively taking place. The larger resistance of the
electrode compared to the two first points indicates that it is covered, so the process
involved at this potential takes place on the coating not on the electrode surface and the
product resulting from that process is characterized by a lower resistance than the
(green) coating produced at the third voltage point. This means that a new product is
generated on the electrode surface. It should be noted that after this experiment the

Desing of novel electroactive nanofluids for flow cell
Chapter 4. Molecular Flowing Systems. Quinones in Organic Electrolytes Page | 103
electrode was coated with a darker material, which was more difficult to remove from the
electrode than the green coating formed at the third potential point. Thus, the green
coating grown at -0.5V could be easily removed by dissolution in acetonitrile whereas
the darker coating of this fourth point (-0.64V) could not be dissolved in a similar way
and needed scratching the electrode surface to be removed.
The fifth point (-0.7V) was fixed after the second reduction point. As it could be
expected for the continuing growth of the polymer coating, the intensity decreases and
the resistance increases with respect to the values found for the fourth point. The shape
on the Nyquist plot is still not well defined but shows a semicircle on the negative
imaginary impedance zone that indicates an inductance due to the larger thickness of
the coating on the working electrode. To a lesser extent this behavior can also be
appreciated on the fourth point (the last three points extending to the negative zone of
the imaginary impedance component).
All the experiments described so far were carried out in air. In order to establish
the possible involvement of oxygen in the formation of the described coatings, a series
of parallel experiments in deaerated electrolytes under argon were carried out. These
experiments were necessary since it is well known that reduced quinone species and
polymers can reduce oxygen31.
Figure 4 shows the CV of a solution of MBQ in deaerated acetonitrile and under
Ar flow (5a) and in air, as above (5b). Despite the obvious similarities we note that the
solution without oxygen, 4a, shows more intense and better resolved oxidation peaks.
This can be explained by a larger concentration of reduced species in each cycle thanks
to the absence of dissolved oxygen, which could otherwise oxidize part of the reduced
MBQ.
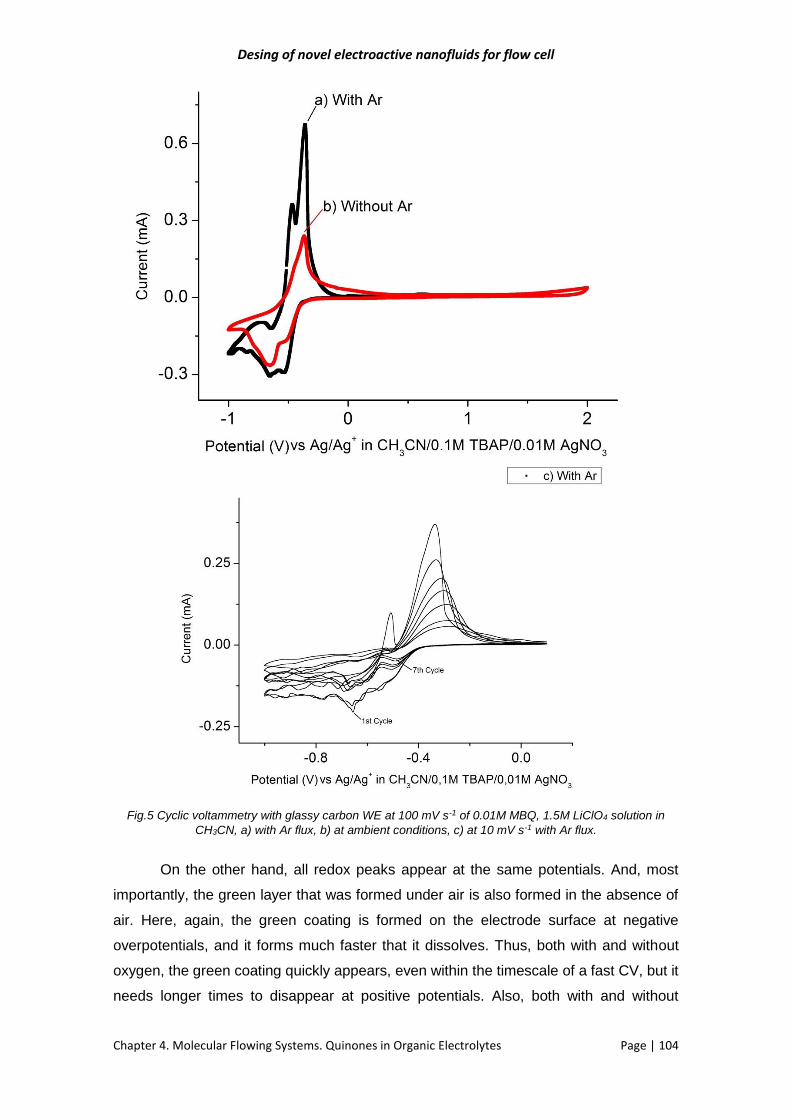
Desing of novel electroactive nanofluids for flow cell
Chapter 4. Molecular Flowing Systems. Quinones in Organic Electrolytes Page | 104
Fig.5 Cyclic voltammetry with glassy carbon WE at 100 mV s-1 of 0.01M MBQ, 1.5M LiClO4 solution in
CH3CN, a) with Ar flux, b) at ambient conditions, c) at 10 mV s-1 with Ar flux.
On the other hand, all redox peaks appear at the same potentials. And, most
importantly, the green layer that was formed under air is also formed in the absence of
air. Here, again, the green coating is formed on the electrode surface at negative
overpotentials, and it forms much faster that it dissolves. Thus, both with and without
oxygen, the green coating quickly appears, even within the timescale of a fast CV, but it
needs longer times to disappear at positive potentials. Also, both with and without

Desing of novel electroactive nanofluids for flow cell
Chapter 4. Molecular Flowing Systems. Quinones in Organic Electrolytes Page | 105
oxygen, the green coating passivates the electrode surface thus blocking the reversible
redox process of MBQ. This can be ascertained from figure 5c, where several cycles
were recorded at low scan rate. The peak at ca. -0.35 V, corresponding to the reversible
oxidation of MBQ, gets collapsed upon cycling due to the accumulation of the green
coating, similarly to what happened in air (figure 3c).
So, the generation of the green layer is a process independent of the presence
of oxygen in solution. However, this will not be so for the ensuing processes following
further reduction of the green layer, as we will show below. The first hint towards this
conclusion comes from the very complex pattern systematically recorded on the CVs at
negative overpotentials. Indeed, all Ar-deaerated CVs showed an apparently noisy signal
after the negative redox peak, below ca. -0.6V (figure 5c). Our first hypothesis of an
instrumental artefact was ruled out by the systematic reproducibility of these apparently
irreproducible traces, characterized by a chaotic component. Figure 6 shows one
experiment intended to probe the extent of this behavior in a wide potential range.
Indeed, the aleatory appearance of the trace goes down to -2.0 V in contrast with the
behavior in air.
Fig.6 Cyclic voltammetry with glassy carbon WE at 100 mV s-1 of 0.01M MBQ, 1.5M LiClO4
solution in CH3CN, a) with Ar flux, b) at ambient conditions.

Desing of novel electroactive nanofluids for flow cell
Chapter 4. Molecular Flowing Systems. Quinones in Organic Electrolytes Page | 106
Complex Impedance measurements were also performed for this oxygen-free
series at voltages similar to the series run in air. Thus, figure 7 collects the corresponding
Nyquist plots and polarization curve for this series, which show a different behavior under
Ar, even at the potential corresponding to the first redox peak (-0.5V), thus confirming
the dependence of this process on the presence of oxygen in solution.
For the first potential point (-0.495), placed right before the first reduction peak,
PEIS results under Ar show a simple electrochemical redox process as the experiment
in air. And, as in air, with no signal of the green coating. In the second potential point (-
0.536V), which corresponds to the first reduction peak, there is already inductive
behavior just after the formation of the green coating on the working electrode surface.
In the experiment with air there was no green layer generated at this point, which can be
explained by the presence of O2 lowering the concentration of reduced MBQ. That is also
the reason for the different trend observed for the first three points of the polarization
curve in Ar versus air: the coverage process starts before reaching the potential of the
peak for the reversible MBQ reduction.
The third potential point (-0.6V) is located between the two reduction peaks. In
this case the impedance shows a capacitive behavior (high slope line) and the working
electrode gets the green coating layer. This different behavior with respect to the
experiments in air confirms that the polymerization mechanism depends on the presence
of O2. The fourth potential point (-0.66V) corresponds to the second reduction peak, the
Nyquist plot shows a complete semicircle with a very low resistance followed by a straight
line with a large slope. That may indicate that a redox process takes place but not
involving diffusion of molecular species to the electrode and with the product generated
on the electrode still acting as a capacitor. Again that behavior is completely different
from that observed in the solution with air, where the resistance was reduced in the
second redox peak potential but never with a smaller value than for the first and second
points. The large current and low resistance at this point confirm that there is a very
favored process, but despite being at a very similar potential to the second reduction
peak in the experiments with O2 is not the same process.
Finally, the last point (-1.0V) shows large resistance in the Nyquist plot and low
current values, confirming the growth of a passivating product on the electrode.

Desing of novel electroactive nanofluids for flow cell
Chapter 4. Molecular Flowing Systems. Quinones in Organic Electrolytes Page | 107
Fig.7 Nyquist plot of the different potentials applied with Ar flux (second diagram is focus on the
small impedance values) and it polarization curve.
In an attempt to identify and characterize the products growing and passivating
the working electrodes, in situ spectroscopy analyses were carried out. Thus, UV-Vis
spectra were recorded in real time using a transparent Indium Tin Oxide (ITO) working
electrode as it was polarized to record a CV (Fig 8). Figure 8b shows the evolution of
absorbances measured at four different wavelengths as successive cyclic voltammetries
were carried out (five CV cycles are shown). Two well-resolved maxima are initially
detected in the time evolution line. They are clearly correlated to the two reduction waves
detected in the first CV (Fig 8a). This agrees with our hypothesis that the initial coating
leads to the generation of a second product by a polymerization process. As CV cycles
go on the first maximum (associated to the formation of the green coating) is eventually
buried by the growing second maximum (corresponding to polymer formation). As the
number of cycles grow the maximum absorbance of the second process grows and the

Desing of novel electroactive nanofluids for flow cell
Chapter 4. Molecular Flowing Systems. Quinones in Organic Electrolytes Page | 108
polymer formed on the surface of the electrode under reduction is not completely
dissolved upon oxidation, thus initiating the passivation of the electrode.
The results of this in-situ experiments clearly confirm the successive generation of two
different products, as proposed in our mechanism. It should be noted that although the
electrochemical signal of MBQ on an ITO electrode is worse than on glassy carbon, it
still shows the two reduction peaks and the decrease of redox peaks upon cycling.
Fig.8 Real time spectroscopy of an ITO working electrode at 10 mV s-1 of 0.01M MBQ and 1.5M
LiClO4 in CH3CN solution (in air). a) CVs of the first 5 cycles, b) Evolution of the absorbance at various
visible wavelengths of the ITO working electrode.
So far we have been able to prove the electrochemical growth of the green
coating (both in the presence and absence of oxygen) and the subsequent formation of
passivating layers whose nature depends on the presence of oxygen. In order to
determine whether these layers form exclusively through electrochemical processes we
carried out an experiment consisting on the chemical reduction of solutions of MBQ in
acetonitrile using metallic lithium as reducing agent.
Figure 9 includes a digital photograph showing the formation of the green layer
on the surface of metallic lithium, thus proving that this compound can also be formed
chemically as long as lithium is present. It should be noted that the green product grows
on the surface of lithium but can be easily dispersed to the solution by just a very gentle
shaking. Remarkably, the final color of the solution was not green but orange,
corresponding to the typical color of free reduced quinone anions, indicating the
metastable nature of the green species. This result can contribute to an understanding
of the structure of the green product, which must be formed by reduced quinone

Desing of novel electroactive nanofluids for flow cell
Chapter 4. Molecular Flowing Systems. Quinones in Organic Electrolytes Page | 109
molecules with the implication of Li (the green layer was not formed in TEA+ TFB-
electrolytes).
Fig.9 Metal lithium on a 0.01M MBQ solution on CH3CN. The green layer formed on the surface of
metallic lithium is apparent in this photograph.
With all the data at hand we propose the structure depicted in figure 10 (left
structure), in which Li atoms bridge different reduced quinone molecules in an
arrangement which is not purely ionic (only possible at reducing potentials) and only
possible on the vicinity of the reducing electrode with a relatively large ratio of reduced
quinone to lithium. The lack of covalent bonding between quinones would explain the
low stability of this product, which upon stirring gets dissolved into the (Li+ rich) bulk
electrolyte solution yielding the red-orange reduced Li2MBQ species.
A combined analysis of CV, PEIS and UV-Visible spectroscopy results allows us
to propose a mechanism for the transformation (in air) of the green layer into a secondary
product with an improved conductivity (shown by PEIS data) which eventually grows into
a passivating coating on the surface of the WE. Starting from the green product (left
structure), figure 10 shows the mechanism for further reduction. We relate the second
reduction peak of the CV with a polymerization process, made possible by the catalytic
reduction of O2 by the green product31,32 , a process obviously not possible in the absence
of air. That process generates a polymer with a conductive structure that explains the
reduction of the resistance on the PEIS experiments with respect to the initial green
coating.

Desing of novel electroactive nanofluids for flow cell
Chapter 4. Molecular Flowing Systems. Quinones in Organic Electrolytes Page | 110
For experiments under Ar the green coating accumulates faster on the electrode
thanks to the absence of O2 that could otherwise oxidize part of the reduced MBQ. Thus,
the polymerization process starts before, even at less negative potentials and there isn’t
a decrease of the current in the polarization curve between the MBQ redox and the
polymerization processes. The final outcome is also a passivating layer. However,
impedance data show that is not the same polymer obtained in air. Furthermore, the
chaotic oscillation of current in the reduction area of the CV indicates that the electrode
passivation doesn’t follow a well-defined polymerization process as with O2. In this case
different reactions could take place, including Diels-Alder reaction or Michael addition30.
A wide variety of structures could be generated in these processes, not only by reaction
among quinone molecules but also possibly by heterogeneous reactions of quinones
with the carbon electrode leading to covalent bonding. That fact could explain the
widening oxidation peak and its shoulder in the CVs of deaerated solutions (figure 5) as
well as the chaotic reduction currents. Unfortunately, the wide possibilities for these
processes do not allow for the proposal of a single plausible mechanism in the absence
of oxygen.
Fig.10 Proposed mechanism for the MBQ polymerization process at ambient conditions.
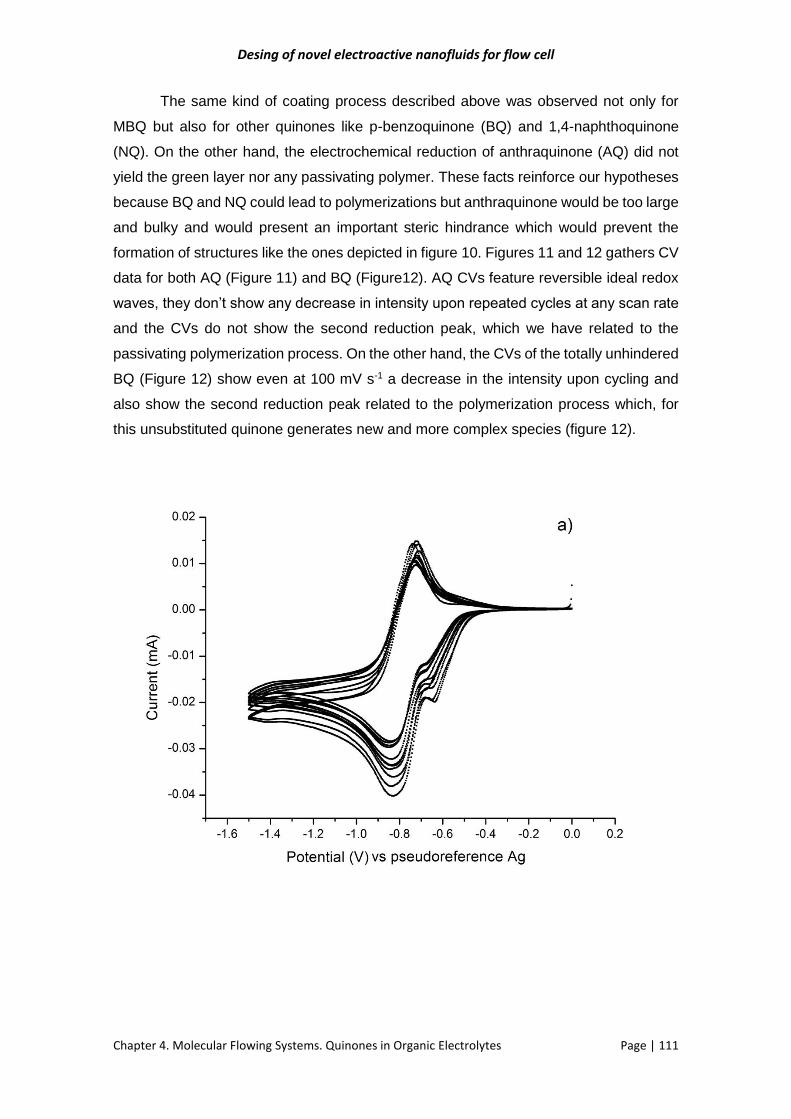
Desing of novel electroactive nanofluids for flow cell
Chapter 4. Molecular Flowing Systems. Quinones in Organic Electrolytes Page | 111
The same kind of coating process described above was observed not only for
MBQ but also for other quinones like p-benzoquinone (BQ) and 1,4-naphthoquinone
(NQ). On the other hand, the electrochemical reduction of anthraquinone (AQ) did not
yield the green layer nor any passivating polymer. These facts reinforce our hypotheses
because BQ and NQ could lead to polymerizations but anthraquinone would be too large
and bulky and would present an important steric hindrance which would prevent the
formation of structures like the ones depicted in figure 10. Figures 11 and 12 gathers CV
data for both AQ (Figure 11) and BQ (Figure12). AQ CVs feature reversible ideal redox
waves, they don’t show any decrease in intensity upon repeated cycles at any scan rate
and the CVs do not show the second reduction peak, which we have related to the
passivating polymerization process. On the other hand, the CVs of the totally unhindered
BQ (Figure 12) show even at 100 mV s-1 a decrease in the intensity upon cycling and
also show the second reduction peak related to the polymerization process which, for
this unsubstituted quinone generates new and more complex species (figure 12).

Desing of novel electroactive nanofluids for flow cell
Chapter 4. Molecular Flowing Systems. Quinones in Organic Electrolytes Page | 112
Fig.11 Cyclic voltammetry of anthraquinone (AQ) solutions 0.05 M, 1M LiClO4 in CH3CN solution, with
glassy carbon WE at a) 10 mV s-1 b) 100 mV s-1.

Desing of novel electroactive nanofluids for flow cell
Chapter 4. Molecular Flowing Systems. Quinones in Organic Electrolytes Page | 113
Fig.12 Cyclic voltammetry of benzoquinone (BQ) solutions 0.05 M, 1M LiClO4 in CH3CN solution, with
glassy carbon WE at a) 10 mV s-1 b) 100 mV s-1.
In addition to the green coating issue described, Li-organic electrolytes present
another problem in order to work with quinones: low solubility in organic solvents of the
reduced Li-quinone product, which tends to crystallize even outside of the
electrochemical cell Figure 13.
Fig.13 Digital pictures of quinone crystallization outside of different electrochemical cells.

Desing of novel electroactive nanofluids for flow cell
Chapter 4. Molecular Flowing Systems. Quinones in Organic Electrolytes Page | 114
4.5 Conclusions
The possible use of quinones in organic lithium electrolytes for application in
Redox Flow Batteries could benefit from wider stability windows and higher solubility in
organic media. However, a high concentration of quinones on the electrode-electrolyte
interphase is precisely one of the conditions leading to the type of passivating coatings
that we have reported here.
Our results show the large influence of Li+ on the MBQ redox mechanism,
showing mainly a couple of redox peaks and increasing the electrochemical reversibility
of the MBQ redox process.
On the other hand, we have proven the systematic and reversible generation of
a green coating that increases the resistance of the electrode and prevents the regular
redox process of MBQ to take place, regardless of the presence of O2 in solution and the
nature of the electrode material. We have proven the involvement of Li in the formation
of this green coating by showing its growth by chemical reduction with Li metal in CH3CN
and its absence when other electrolytes such as TEA+ TFB- were used. That green
product is not stable and easily disassembles into individual reduced Li-MBQ molecules.
We have also shown the generation of new and different products on this first coating
that increase notably the resistance of the electrode, and which nature depends on the
presence or absence of O2. All of these coatings have a detrimental effect for the use of
quinones in organic electrolytes. On the other hand, we have found that larger quinones
such as anthraquinone can be reversibly cycled without formation of the passivating
layers, whereas quinones with no steric impediments quickly yield these coatings on the
current collector.
Thus, our work allows us to conclude that in order to apply quinones for energy
storage in RFBs making use of organic media, two main guidelines should be
considered. Large, sterically hindered quinones should be used instead of simpler
quinones prone to polymerization in the presence of Li+. Otherwise, organic electrolytes
not containing Li+ would be preferable.
Despite the hurdles found in our research, the intrinsic but potential advantages of
organic quinone electrolytes (wider working voltage, greater quinone solubility) make it
worth it to further investigate their possible application in RFBs in the light of the present
results. We hope that the work reported here will help in preventing some of the
drawbacks of these systems, thus contributing to setting the path for organic quinone
electrolytes to be applied in redox flow batteries.

Desing of novel electroactive nanofluids for flow cell
Chapter 4. Molecular Flowing Systems. Quinones in Organic Electrolytes Page | 115
References
1. Guin, P. S., Das, S. & Mandal, P. C. Electrochemical Reduction of Quinones in Different Media: A Review. Int. J. Electrochem. 2011, 1–22 (2011).
2. Chen, Q., Eisenach, L. & Aziz, M. J. Cycling Analysis of a Quinone-Bromide Redox Flow Battery. J. Electrochem. Soc. 163, A5057–A5063 (2016).
3. Huskinson, B. et al. A metal-free organic-inorganic aqueous flow battery. Nature 505, 195–8 (2014).
4. Qing Chen, Michael R. Gerhardt, Lauren Hartle, M. J. A. A Quinone-bromide Flow Battery with 1 W/cm2 Power Density. J. Chem. Inf. Model. 53, 160 (1989).
5. Quan, M., Sanchez, D., Wasylkiw, M. F. & Smith, D. K. Voltammetry of Quinones in Unbuffered Aqueous Solution: Reassessing the Roles of Proton Transfer and Hydrogen Bonding in the Aqueous Electrochemistry of Quinones. J. Am. Chem. Soc. 129, 12847–12856 (2007).
6. Alizadeh, K. & Shamsipur, M. Calculation of the two-step reduction potentials of some quinones in acetonitrile. J. Mol. Struct. THEOCHEM 862, 39–43 (2008).
7. Gupta, N. & Linschitz, H. Hydrogen-bonding and protonation effects in electrochemistry of quinones in aprotic solvents. J. Am. Chem. Soc. 119, 6384–6391 (1997).
8. Tonholo, J. et al. Electrochemical properties of biologically active heterocyclic naphthoquinones. J. Braz. Chem. Soc. 9, 163–169 (1998).
9. Macıas-Ruvalcaba, N. a., González, I. & Aguilar-Martınez, M. Evolution from Hydrogen Bond to Proton Transfer Pathways in the Electroreduction of α-NH-Quinones in Acetonitrile. J. Electrochem. Soc. 151, E110 (2004).
10. Alligrant, T. M. & Alvarez, J. C. The Role of Intermolecular Hydrogen Bonding and Proton Transfer in Proton-Coupled Electron Transfer. J. Phys. Chem. C 115, 10797–10805 (2011).
11. Alligrant, T. M., Hackett, J. C. & Alvarez, J. C. Acid/base and hydrogen bonding effects on the proton-coupled electron transfer of quinones and hydroquinones in acetonitrile: Mechanistic investigation by voltammetry, 1H NMR and computation. Electrochim. Acta 55, 6507–6516 (2010).
12. Nikitina, V. a., Nazmutdinov, R. R. & Tsirlina, G. a. Quinones electrochemistry in room-temperature ionic liquids. J. Phys. Chem. B 115, 668–677 (2011).
13. Guin, P. S., Das, S. & Mandal, P. C. Electrochemical reduction of sodium 1,4-dihydroxy-9,10- anthraquinone-2-sulphonate in aqueous and aqueous dimethyl formamide mixed solvent: A cyclic voltammetric study. Int. J. Electrochem. Sci. 3, 1016–1028 (2008).

Desing of novel electroactive nanofluids for flow cell
Chapter 4. Molecular Flowing Systems. Quinones in Organic Electrolytes Page | 116
14. Electroanal, J., Russel, C. & Jaenicke, W. Heterogeneous electron exchange of quinones in aprotic solvents, part III. Electroanalysis 199, 139–151 (1986).
15. Bao, D. et al. Electrochemical reduction of quinones: Interfacing experiment and theory for defining effective radii of redox moieties. J. Phys. Chem. B 114, 14467–14479 (2010).
16. Seto, K., Nakayama, T. & Uno, B. Formal redox potentials of organic molecules in ionic liquids on the basis of quaternary nitrogen cations as adiabatic electron affinities. J. Phys. Chem. B 117, 10834–10845 (2013).
17. T.Fujinaga, K.Izutsu, T. N. Efect of metal ions on the polarographic reduction of organic compounds in dipolar aprotic solvents. Electroanal. Chem. INTERFACIAL Electrochem. Elsevier Sequoia S.A., Lausann 29, 203–209 (1971).
18. Choi, D. et al. Electrochemical recognition of ammonium and alkali metal cations with calix[4]arenediquinone. J. Electroanal. Chem. 387, 133–134 (1995).
19. Cheng, W. X. et al. Investigation on the π-dimer/σ-dimer of 1,8-dihydroxy-9,10- anthracenedione in the process of electrochemical reduction by using IR spectroelectrochemical cyclic voltabsorptometry and derivative cyclic voltabsorptometry. J. Phys. Chem. C 117, 3940–3948 (2013).
20. Li, D., Cheng, L. & Jin, B. Investigation on PCET-accompanied Dimerization of 5-hydroxy-1, 4-naphthoquinone in the Process of Electrochemical Reduction by in Situ FT-IR Spectroelectrochemistry and Density Functional Calculation. Electrochim. Acta 130, 387–396 (2014).
21. Macías-Ruvalcaba, N. A. & Evans, D. H. Association reactions of the anion radicals of some hydroxyquinones: Evidence for formation of π- And σ-dimers as well as a neutral-anion radical complex. J. Phys. Chem. C 114, 1285–1292 (2010).
22. Rieke, R. D., Saji, T. & Kujundzic, N. Vo ltammetric measurements Electrochemical synthesis of diduroquinone. 102, 397–405 (1979).
23. Algharaibeh, Z. & Pickup, P. G. Charge trapping in poly(1-amino-anthraquinone) films. Electrochim. Acta 93, 87–92 (2013).
24. Balasubramaniam, E. et al. Electrochemical Preparation of Anthraquinone and Zinc Porphyrin Coated Electrodes - Redox Activity and Film Stability. J. Mater. Chem. 5, 625–629 (1995).
25. Yamamoto, T. & Etori, H. Poly(anthraquinone)s Having a π-Conjugation System along the Main Chain. Synthesis by Organometallic Polycondensation, Redox Behavior, and Optical Properties. Macromolecules 28, 3371–3379 (1995).
26. Suematsu, S. & Naoi, K. Quinone-introduced oligomeric supramolecule for supercapacitor. J. Power Sources 97-98, 816–818 (2001).
27. Naoi, K., Suematsu, S., Hanada, M. & Hideaki, T. Enhanced Cyclability of π-π Stacked Supramolecular (1,5-Diaminoanthraquinone) Oligomer as an

Desing of novel electroactive nanofluids for flow cell
Chapter 4. Molecular Flowing Systems. Quinones in Organic Electrolytes Page | 117
Electrochemical Capacitor Material. J. Electrochem. Soc. 149, A472 (2002).
28. Naoi, K., Suematsu, S. & Manago, A. Electrochemistry of poly(1,5-diaminoanthraquinone) and its application in electrochemical capacitor materials. J. Electrochem. Soc. 147, 420–426 (2000).
29. Gao, M., Yang, F., Zhang, G., Liu, L. & Wang, X. Effects of poly-1,5-diaminoanthraquinone morphology on oxygen reduction in acidic solution. Electrochim. Acta 54, 2224–2228 (2009).
30. Dongmo, S., Witt, J. & Wittstock, G. Electropolymerization of quinone-polymers onto grafted quinone monolayers: A route towards non-passivating, catalytically active film. Electrochim. Acta 155, 474–482 (2015).
31. Newton, L. a. a., Cowham, E., Sharp, D., Leslie, R. & Davis, J. Plumbagin: a natural product for smart materials? New J. Chem. 34, 395 (2010).
32. Ardakani, M. M., Karami, P. E., Zare, H. R. & Hamzehloo, M. Electrocatalytic reduction of oxygen on the surface of glassy carbon electrodes modified with plumbagin. Microchim. Acta 159, 165–173 (2007).

Desing of novel electroactive nanofluids for flow cell
Chapter 4. Molecular Flowing Systems. Quinones in Organic Electrolytes Page | 118

Desing of novel electroactive nanofluids for flow cell
Chapter 5. Hybrid Nanofluids Made of rGO and Polyoxometalates Page | 119
CHAPTER 5
Hybrid Nanofluids Made
of Reduced Graphene
Oxide and
Polyoxometalates

Desing of novel electroactive nanofluids for flow cell
Chapter 5. Hybrid Nanofluids Made of rGO and Polyoxometalates Page | 120

Desing of novel electroactive nanofluids for flow cell
Chapter 5. Hybrid Nanofluids Made of rGO and Polyoxometalates Page | 121
5.1 Context
Previous work in our group proved the feasibility of using reduced graphene oxide
(rGO) dispersed in acidic electrolytes as electroactive nanofluids. Indeed, these rGO
dispersions act a supercapacitors, showing an ultrafast response (being able to show a
capacitive response in Cyclic Voltammograms recorded at very fast rates, up to 10 V·s-
1). These rGO nanofluids also showed specific capacitance per gram of active material
(169 F·g-1) comparable with the corresponding electrodes in solid devices even at very
small mass loads (0.025 wt%) which means and stunning electrical percolation capability
of the dispersed rGO, which indeed is acting as an electrode in whole volume of the
electroactive nanofluids.
In this work we explore the performance as nanofluids of hybrid materials formed
by polyoxometalates adsorbed onto rGO (rGO-POMs), and dispersed in the same acidic
electrolyte and conditions used with rGO dispersions. The redox activity of POMs turns
these materials into hybrids with the possibility of combined faradaic and capacitive
energy storage. These hybrid materials had been studied previously as solid electrodes
in our group but these were the first studies exploring the feasibility of their use in the
form of nanofluids.

Desing of novel electroactive nanofluids for flow cell
Chapter 5. Hybrid Nanofluids Made of rGO and Polyoxometalates Page | 122
5.2 Introduction
The field of hybrid materials is a field with many trees.1-3 In just a few decades it
has evolved into a lush and fertile landscape with a large variety of endemic species as
well as new blossoming ones. Describing this evolution with agricultural metaphors is
most fitting in a field that made words like hybrid or grafting part of its own identity. And
along this line it is most appropriate to highlight the seminal work seeded by prof. Ruiz-
Hitzky and his group.
Indeed, three decades ago Ruiz-Hitzky’s group was already publishing inspiring
communications in high-impact journals4-9[1-5] reporting how to graft organic branches
into inorganic phases4, 10 or the possibility to use the hybrid approach to develop
improved ionic conductors.9, 11 Our group was not working on solid electrolytes but on
electrode materials at the time. And the group’s approach was not to work with covalent
but with ionic bonding in hybrids. But those works were inspiring and inviting and
conveyed the full strength of the hybrid approach: wise design of complex materials
integrating organics and inorganics at the molecular level in order to get the best of both
worlds, leading even to synergy12, 13.
Nowadays the hybrid concept impregnates all areas subareas and little corners
of materials science14-20. Our own crop of hybrid materials, developed with energy
storage applications in mind, grew on different grounds from Ruiz-Hitzky’s and other
pioneers8, 14-20.Our group explored several varieties of hybrids for energy storage, mainly
those dispersing organic into inorganic components (i.e. Conducting Organic Polymers
into transition metal oxides)21, 22 and vice versa, those integrating smaller inorganic
components into organic matrices. Among the latter we have tried nanoparticles and
nanostructures,23 smaller polyoxometalates24-27 and molecular species28-30 into
conducting but also non-conducting organic polymers31 as well as onto carbons32-36.
These materials were used in symmetric32-35 and asymmetric36 supercapacitors with
enhanced energy density.
The present work presents a new way to deliver nanostructured hybrid materials
for energy storage, namely, in the form of nanofluids.
Nanofluids are homogeneous dispersions of nanoparticles in conventional base
fluids which constitute an emerging type of unique liquid materials within the field of
Nanoscience and Nanotechnology. Several applications of nanofluids have been
explored with very special prominence on magnetic (ferrofluids) or thermal properties for
heat-transfer applications37. However, they have never been proposed as possible
Desing of novel electroactive nanofluids for flow cell
Chapter 5. Hybrid Nanofluids Made of rGO and Polyoxometalates Page | 123
electroactive materials. A few recent investigations have suggested the use of thick
slurries as electrodes for energy storage in flow cells. For instance, Gogotsi et al.38
reported an electrochemical flow capacitor (EFC) using a flowable carbon slurry
improving upon the concept introduced by Kastening et al39. Very recently we have also
reported graphene nanofluids featuring ultrafast charge transfer40. Yet, all of these recent
reports were on flowing materials with a purely capacitive storage mechanism
We present here the first examples of the use of hybrid electroactive nanofluids
(HENFs) with the potential to be used as liquid electrode in flow electrochemical cells by
combining redox as well as capacitive double-layer mechanisms.
5.3 Experimental Section
We used H3PMo12O40 (≥99.9%) and H3PW12O40 (≥99.9%) electroactive clusters
from Sigma Aldrich.
Graphene oxide (GO) was synthesized from graphite using a modified Hummers
method. Briefly, 5 g NaNO3 and 225 ml H2SO4 were added to 5 g graphite and stirred
for 30 min in an ice bath. 25 g KMnO4 was added to the resulting solution, and then the
solution was stirred at 50 °C for 2 h. 500 ml deionized water and 30 ml H2O2 (35%) were
then slowly added to the solution, and the solution was washed with dilute HCl. Next, the
GO product was washed again with 500 ml concentrated HCl (37%). The reduced
graphene oxide (rGO) was prepared by high temperature treatment of the GO sample at
800 °C.
We first prepared solid nanocomposite hybrid materials based on redox-active
polyoxometalates (POMs) supported on reduced Graphene Oxide nanosheets (rGO),
the latter providing a double-layer capacitive storage mechanism. In particular, we used
phosphomolybdic acid (H3PMo12O40) and phosphotungstic acid (H3PW12O40)
electroactive clusters.
In order to prepare the corresponding HENFs, rGO-POMs hybrid materials were
dispersed in different proportions in aqueous electrolyte (1 M H2SO4) to be directly used
as liquid electrodes for charge storage in flow cells. Interestingly, this type of hybrid
nanofluids combines the faradaic storage capabilities of redox POMs clusters with the
high power provided by the electric double layer (EDL) mechanism of rGO. The HENFs
reported here were able to store electricity through both mechanisms, as the parent solid-

Desing of novel electroactive nanofluids for flow cell
Chapter 5. Hybrid Nanofluids Made of rGO and Polyoxometalates Page | 124
electrode supercapacitors, except that in the present case the electrode is a liquid, stored
externally and flowing through a flow electrochemical cell.
5.4 Results and Discussion
In order to confirm the effective anchoring of POMs on the surface of 3D open
porous rGO nanosheets, multiple morphological characterizations were carried out.
Figure 1 (a, b) presents SEM images of rGO-PMo12 and rGO-PW12 hybrid materials with
the corresponding elements mapping and EDAX spectra. It is interesting to note that,
rGO preserves its 3D open porous structure even after heavy deposition of PW12 and
PMo12 clusters, which is highly beneficial to enhance the electron transport while keeping
good ionic conductivity within each solid particle. EDS mapping and elemental analyses
of rGO-POM hybrid samples evidently confirm the homogeneous and efficient anchoring
of PW12 and PMo12 clusters onto the rGO nanosheets. Figure 2 (a-c) shows STEM
images of rGO, rGO-PW12 and rGO-PMo12 samples, respectively. It is clearly seen that
the surface of rGO nanosheets is blank and free from tiny spots (Figure 2 a) while in
great contrast the surface of rGO-POMs hybrids is abundantly decorated with
nanometer-sized PW12 and PMo12 dots (Figure 2 b-c) (see also EDS mapping with STEM
in Figure 4). It is also interesting to note that the POM clusters are evenly distributed at
a strictly molecular level without any agglomeration.
Fig.1 SEM images of (a) rGO-PW12 and (b) rGO-PMo12 hybrid materials with corresponding
mapping images and EDX elemental spectrum which suggests mooring ofPOM clusters to rGO
nanosheets showing characteristic molybdenum and tungsten peaks in the spectrum.

Desing of novel electroactive nanofluids for flow cell
Chapter 5. Hybrid Nanofluids Made of rGO and Polyoxometalates Page | 125
It is very important to note the utterly dispersed nature of the electroactive centers
in this hybrid material. These POM clusters have a stable structure and size (1nm
diameter), with all twelve W or Mo moieties on the surface of the cluster (there is no
“bulk”). Therefore, the present hybrid configuration is ideal for fast (diffusion-free)
faradaic processes added to the inherently fast capacitive polarization of graphene.
Furthermore, it should be noted that rGO-PW12 and rGO-PMo12 exhibit high surface
areas of 237 m2/g and 231 m2/g, respectively (Figure 3). The slight decrease in the active
surface for rGO-PW12 is attributed to the inclusion of the PW12 nanoparticles, which
contribute heavily to the total mass of the hybrid. Even with this slight decrease the
specific BET surface area of rGO-PW12 is considerably larger than many recently
reported carbon/metal oxide hybrid materials41-42.
Fig.2 (a–c) Scanning transmission electron micrographs (STEM) of rGO, rGO-PW12, rGO-PMo12
hybrid, respectively (d–f) core-level C1s, Mo3d and W4f spectra ofrGO-PMo12 and rGO-PW12 material.
Figure 2d-f shows core level XPS spectra of C1s, Mo3d and W4f, respectively.
The detection of Mo3d peaks at 232.3 eV (Mo3d3/2) and 235.4 eV (Mo3d5/2)
unambiguously confirms the presence of PMo12 in rGO-PMo12 hybrid with a
predominance of Mo(VI) oxidation state Figure 2e43, 44 while core-level W4f spectrum
shows two peaks at 37.54 eV (W4f5/2) and 35.4 eV (W4f7/2) with spin-orbit splitting of 2.14
eV (with a peak ratio 4:3). The position and shape of these peaks are representative of
W atoms with an oxidation state of W(VI) further confirming the presence of PW12 in rGO-
PW12 hybrid (Figure 2f)45, 46.

Desing of novel electroactive nanofluids for flow cell
Chapter 5. Hybrid Nanofluids Made of rGO and Polyoxometalates Page | 126
Fig.3 (a-c) Nitrogen adsorption-desorption curves and the corresponding pore size distribution plots for
rGO, rGO-PMo12 and rGO-PW12 samples, respectively. The shape of the hysteresis loop is characteristic
of mesoporous materials. BET analyses of these data showed that all the samples exhibit high surface
areas of 242.48 m2/g, 231.14 m2/g and 237.20 m2/g. The slight decrease in the active surface for rGO-
POMs sample is attributed to the inclusion of the POM nanoparticles, which contribute heavily to the total
mass of the hybrid.
Fig.4 (a, b) shows HRTEM images of rGO-PW12 and rGO-PMo12 hybrid, respectively. As seen in
Figure, few parts are highlighted with circles to realize the presence of PW12 and PMo12 clusters however
that is not only the part covered by POMs. (c, d) EDS spectra of rGO-PW12 and rGO-PMo12 hybrid
materials. EDX analysis explicitly confirmed the mooring of PW12 and PMo12 clusters to rGO nanosheets
showing characteristic tungsten and molybdenum peaks in the spectrum.

Desing of novel electroactive nanofluids for flow cell
Chapter 5. Hybrid Nanofluids Made of rGO and Polyoxometalates Page | 127
The electrochemical characterization of rGO-POMs HENFs was carried out
both under static and continuous flow conditions using a specially designed flow cell
(Figure 5a-b). Hybrid Electroactive Nanofluids (HENFs) of rGO-POMs were prepared by
direct mixing of different proportions of rGO-POMs (rGO-PMo12 or rGO-PW12) (0.025 %,
0.1 % and 0.4 %) in 1 M H2SO4 aqueous solution (where, H2SO4 acts as an electrolyte).
These dispersions of rGO-POMs HENFs were directly used as liquid electrodes in
electrochemical flow cells (see Figure 5c).
Fig.5 (a) Schematic diagram of the flow cell setup used in this work in which charged and discharged
nanofluids are stored in separate containers. Two peristaltic pumps with automatic control of flow direction
and flow rate were used, (b) Digital photograph of our home-made flow cell which consists of stainless-
steel current collectors (7 cm x 6cm x 1 cm) with a carved serpentine, polyvinylidene fluoride (PVDF)
membrane as a separator and oil paper as a gasket enclosed together using hard plastic plates and
screws, (c) Actual photographs of rGO, rGO-PMo12 and rGO-PW12 HENFs (0.025% in 1 M H2SO4 aqueous
solution) showing stable and uniform sols, (d) The viscosity of rGO, rGO-PMo12 and rGO-PW12 HENFs of
different concentrations with shear rate Electrochemical performance of rGO-POMs Hybrid Electroactive
Nanofluids (HENFs).
The rheological properties of rGO-POMs HENFs were measured under variable
shear rates ranging from 25/s to 150/s. In the present study, the base fluid composed of
water with surfactant (0.5 % triton X-100) and electrolyte (1 M H2SO4) showed Newtonian
behavior with a viscosity of approximately 1 mPa s, in the shear rate range of 25-150 /s
at room temperature (25C), essentially identical to the theoretical value of water (1 mPa
s)47. The viscosities of rGO-POMs HENFs of different concentrations with shear rate

Desing of novel electroactive nanofluids for flow cell
Chapter 5. Hybrid Nanofluids Made of rGO and Polyoxometalates Page | 128
were determined and are plotted in Figure 5d. There are two kinds of viscosity variations
for rGO-POMs HENFs are observed with increase in shear rate: Newtonian and shear-
thinning behaviors. As seen in Figure 5d, the viscosity of rGO-POMs HENFs decreases
slightly with shear rate, showing the shear-thinning behavior. It is further seen that with
an increase in the concentration of solid nanoparticles the viscosities of the rGO-POMs
HENFs increase but are in all cases between 1.2 to 1.8 mPa s, very close to that of water
(1 mPa s)48. These low values are far better than those for carbon-slurry based
electrodes (ca. 2000 mPa s)38, 49. These results undoubtedly ascertain the suitability of
rGO-POMs HENFs to be used as liquid electrodes in electrochemical flow cells without
any flowing or clogging problems.
Fig.6 CV curves of rGO and rGO-POMs HENFs at 60 mV/s scan rate with conventional three electrode
set-up comprising glassy carbon, platinum wire and Ag/AgCl as working, counter and reference
electrodes, respectively.
Before exploring their final application in flow cells, we tested the electrochemical
properties of rGO and rGO-POMs HENFs in conventional three-electrode cells
comprising glassy carbon, platinum wire and Ag/AgCl as working, counter and reference
electrodes, respectively. Figure 6 shows CV curves of rGO and rGO-POMs HENFs at
60 mV/s scan rate. The CV curve for rGO nanofluid exhibits a featureless rectangular
shape characteristic of double layer capacitive mechanism whereas CV curves for rGO-
POMs hybrid nanofluids show quasi-rectangular capacitive behavior but with well-
defined redox peaks on top, confirming both EDL and faradaic charge storing
mechanism. This test definitely confirmed our successful preparation of hybrid

Desing of novel electroactive nanofluids for flow cell
Chapter 5. Hybrid Nanofluids Made of rGO and Polyoxometalates Page | 129
electroactive nanofluids. CV curves for rGO and rGO-POMs HENFs at different scan
rates are shown in Figure 7.
Fig.7 (a-c) CV curves of rGO, rGO-PMo12 and rGO-PW12 hybrid electroactive nanofluids with conventional
three electrode set-up comprising glassy carbon, platinum wire and Ag/AgCl as working, counter and
reference electrodes, respectively at different scanning rates.
In order to demonstrate the practical application of these rGO-POMs HENFs,
their electrochemical performance was tested in flow cells under static and flowing
conditions using the cell described above. Figure 8a-b shows the Cyclic polarization
curves of symmetric rGO-PW12 and rGO-PMo12 HENFs cells at different scanning rates
under static conditions. It is worth noting that, the shape of CV curves for rGO-POMs
HENFs is different than that for rGO nanofluid with extensive improved current densities
(Figure 9). Furthermore, CV curves up to very high scan rate of 5 V/s (5000 mV/s) for
rGO-POMs HENFs were recorded (Figure 10). Most remarkably, the rectangular CV
shape was maintained even at a very high scan rate of 5000 mV/s, indicating rGO-POMs
HENFs exhibit excellent rate capabilities as needed for high-power supercapacitors. This
is an extremely fast scan rate, much greater than values reported to have been used in
CV measurements of any capacitive flow cell50. It should be noted that the shape of CV

Desing of novel electroactive nanofluids for flow cell
Chapter 5. Hybrid Nanofluids Made of rGO and Polyoxometalates Page | 130
curves becomes more and more rectangular with increase in scan rate. This indicates
an increasingly important relative contribution of capacitive (Double Layer) energy
storage vs. pseudocapacitive (faradaic) energy storage at high rates. Again, this could
be expected for any conventional solid carbon based hybrid electrode, given the slower
rates of redox reactions and electron transfer processes when compared with
electrophysical double layer polarization.
Fig.8 (a–b) CV curves of rGO-PW12 and rGO-PMo12 HENFs of 0.025% concentration at different
scanning rates, respectively (c) Variation of specific capacitance with scan rates for rGO-POMs HENFs,
(d) Plot of capacity retention with scan rate for rGO-POMs HENFs.
Fig.9 (a-b) Cyclic voltammetry and galvanostatic charge discharge curves of rGO nanofluids at different
scanning rates and different current densities, respectively.

Desing of novel electroactive nanofluids for flow cell
Chapter 5. Hybrid Nanofluids Made of rGO and Polyoxometalates Page | 131
The specific capacitances of the cell for rGO-POMs HENFs were calculated from
the CV curves for 0.025 % concentration at different scanning rates.
From cyclic voltammetry, the capacitance was calculated using the following
equation:
ΔEmν
idVCsp
2 (1)
where Δ E is the voltage window, i the discharge current, V the voltage, v scan rate, and
m the mass of rGO in one electrode. The factor of 2 accounts for the two electrode setup,
where the charge is evenly distributed between two capacitors in series. Note that the
specific capacitances were normalized by the mass of rGO in one electrode (not the total
weight of nanofluids).
The specific capacitance Csp was calculated from galvanostatic cycling using this
equation:
dt
dVm
iCsp
2 (2)
where dV/dt is the slope of the discharge curve.
Initially, the cell was discharged for 15 min (at 0 V) then the cell was charged to
certain cell potential for 5 min and then discharged to 0 V for 5 min. Integration of the
discharge curve directly yielded the charge of the two-electrode setup. The capacitance
was extracted from the discharge curves of chronoamperometry experiments using the
following equation:
Em
idtCsp
2
(3)
The coulombic efficiency was determined according to the following equation and
corrected for leakage current:
%100
arg
arg
dtI
dtI
ech
edisch
C (4)

Desing of novel electroactive nanofluids for flow cell
Chapter 5. Hybrid Nanofluids Made of rGO and Polyoxometalates Page | 132
Fig.10 (a-c) Cyclic voltammetry curves of rGO, rGO-PW12 and rGO-PMo12 hybrid electroactive
nanofluids at very high scan rates, respectively.
As expected, specific capacitances decrease gradually with increasing scan rate
(Figure 8c). Maximum specific capacitance values of 273 F/g(rGO-PW12) and 306
F/g(rGO-PMo12) were obtained for 0.025 % rGO-POM HENFs at a scan rate of 5 mV/s.
Here again, in order to store that amount of charge on rGO-POMs HENFs within the flow
cell, the rGO flakes must be electrically connected to the external load via a conductive
pathway. Unlike conventional supercapacitors in which solid film electrodes benefit from
well-defined fixed conduction paths, our cell utilizes a ‘liquid electrode’ in which charge
must percolate through a dynamic network of conductive particles. Figure 8d shows the
capacity retention with scan rate. It is observed that about 12-14 % of specific
capacitance is retained for rGO-POMs HENFs as scan rate increases from 5 mV/s to
200 mV/s, suggesting good rate capability of the material in flow cell. The values of
specific capacitances obtained in this work are very much comparable or even higher
than the values reported for thicker carbon slurries as well as solid carbon-POM based
electrodes. For instance, Presser et al.38 prepared a thick carbon slurry of carbide-
derived carbon powder obtained from titanium carbide (TiC: CDC) and 1 M Na2SO4 with
Desing of novel electroactive nanofluids for flow cell
Chapter 5. Hybrid Nanofluids Made of rGO and Polyoxometalates Page | 133
compositions of 3:1 and 4:1 (electrolyte: carbon by mass). The highest specific
capacitance reported for toothpaste-like TiC:CDC slurry (3:1, electrolyte: carbon) was
109 F/g at the scan rate of 2 mV/s. Furthermore, Zhang et al.50 reported a specific
capacitance of 154 F/g at 2 mV/s in 1 M H2SO4 for a thick slurry of porous carbon spheres
with concentration ranging from 16 wt% to 23 wt%. Moreover, our recent investigation
on activated carbon-PMo12 and activated carbon-PW12 solid electrodes showed a
specific capacitance of 183 F/g and 254 F/g respectively.32, 33. And our recent reports on
solid graphene-polyoxometalate electrodes34-36 also showed high specific capacitance
and long cyclability. Our present study provides promising preliminary data supporting
the use of this type of materials in a novel liquid electrode format, namely that of hybrid
electroactive nanofluids (HENFs) and supports the potential of HENFs in general and of
rGO-POMs HENFs in particular for energy storage applications.
The electrochemical performance of rGO-POMs HENFs was further studied by
galvanostatic charge/discharge test in static conditions as shown in Figure 11a-b. The
shapes of charge-discharge curves are not symmetrically triangular showing a great
contribution from the redox species of POMs molecular clusters. The maximum values
of specific capacitance obtained for the 0.025 % rGO-POMs HENFs were 207.7
F/g(rGO-PW12) and 222.8 F/g(rGO-PMo12) at current density of 4 A/g, respectively. This
capacitance corresponds to specific energy values of 28.85 Wh/kg(rGO-PW12) and 30.95
Wh/kg(rGO-PMo12) and specific power of 2-8 kW/kg(rGO-POMs) as shown in Figure
11c. The values obtained for rGO-POMs HENFs are remarkably higher than those
measured for rGO nanofluids (13.1 Wh/kg(rGO)) which can be due to the synergetic
combination of rGO and POMs redox clusters. Moreover, the values of specific energy
are significantly higher than those previously reported for slurries (for example, 5.6-8.2
Wh/kg for carbon beads slurry49). Furthermore, the galvanostatic charge/discharge
cycling performance was tested at different current densities for 2000 cycles. The rGO-
POMs HENFs were found to be remarkably stable, with cycle efficiencies greater than
about 94-95 % after 2000 charge/discharge cycles (Figure 11d). This confirms the stable
attachment of the POMs redox clusters to the graphene sheets.

Desing of novel electroactive nanofluids for flow cell
Chapter 5. Hybrid Nanofluids Made of rGO and Polyoxometalates Page | 134
Fig.11 (a–b) Galvanostatic charge-discharge curves for rGO-PW12 and rGO-PMo12 HENFs of 0.025% at
different current densities in static condition, (b) Plot of specific energy versus specific power in Ragone
plot for rGO, rGO-PW12 and rGO-PMo12 in flow cell (d) Galvanostatic charge/discharge cycling test for
rGO-POMs HENFs of 0.025% at different current densities for 2000 cycles.
Figure 12a-b shows a series of chronoamperometry experiments carried out for
rGO-PW12 and rGO-PMo12 HENFs under static conditions. Initially, the cell was
completely discharged for a period of 15 min and then charged to different potentials
such as 0.4, 0.6, 0.8 and 1.0 V. While charging was associated with additional leakage
current, the integration of the discharge current versus time plot directly yields the charge
for a given cell voltage (as plotted in Figure 12c). The flow cell capacitances were
calculated by simply dividing by the cell voltage and are displayed in Figure 12d. When
compensating for the leakage current, this translates into device capacitances of 0.70-
0.72 F for rGO-POMs HENFs. Moreover, the coulombic efficiency of the rGO-POMs
nanofluid cell was found to be 95.3 % (a large value since we did include the leakage
current).

Desing of novel electroactive nanofluids for flow cell
Chapter 5. Hybrid Nanofluids Made of rGO and Polyoxometalates Page | 135
Fig.12 (a–b) Chronoamperometry test for rGO-PW12 and rGO-PMo12 HENFs (0.025%) under static
condition at different applied voltages such as 0.4, 0.6, 0.8 and 1.0 V which shows high coulombic
efficiency of 95.3% when charged to a cell potential of 1.0 V and subsequently discharged to 0 V, (c) Plot
of charge extracted by integrating discharge curves with given potential, (d) Plot of device capacitance
versus given potential for rGO-PMOs HENFs in flow cell, (e–f) CV curves of rGO-PW12 and rGO-PMo12 for
different flow rates at scan rate of 200 mV/s, respectively.
Energy storage of rGO-POMs HENFs under flowing condition
As a final test for the use of our nanofluids in flow cells, we tested the
electrochemical properties of rGO-POMs HENFs under continuous flow conditions.
Indeed, it is interesting to note that the shape of the CV curves slightly changes for the
different flow rates used, which may be due to the migration of the redox electroactive
clusters (see Figure 12 e-f). However, the current under the curve slightly increases with
increase in flow rate from 0 to10 ml/min but then remains constant for flow rates > 10
ml/min. This initial increase in current density may be attributed to the flow of fresh rGO-
POMs nanoparticles taking part in charge storage. However, at high flow rates, and
under the experimental conditions used, the residence time for rGO-POMs nanoparticles
in the flow channels will eventually be insufficient for completing the expected redox
reactions of all the dispersed material, consequently leading to the saturation in current
density. In addition, CV curves of rGO-POMs at different flowing rates for different scan
rates are presented (see Figure 13).

Desing of novel electroactive nanofluids for flow cell
Chapter 5. Hybrid Nanofluids Made of rGO and Polyoxometalates Page | 136
Fig.13 CV curves for (a-c) rGO-PW12 and (d-f) rGO-PMo12 hybrid electroactive nanofluids (HENs) at
different scan rates for different flow rates (5 ml/min, 10 ml/min and 15 ml/min), respectively.
5.5 Conclusions
Our present investigation has established the first successful example of the
possible use of hybrid electroactive nanofluids for energy storage in electrochemical flow
cells. In particular, our work provides proof of this breakthrough concept by
demonstrating the use of hybrid rGO-POMs nanofluids for dual energy storage through
a hybrid (faradaic-capacitive) mechanism parallel to hybrid solid electrodes51 but in this
case, for the first time, in the form of a nanofluid.
The results certainly confirmed that these rGO-POMs HENFs electrodes exhibit
excellent electrochemical performances, including high capacitance and energy density
as well as high rate performance and long cycle life. Most strikingly, our study shows full
electrochemical utilization of both components of the hybrid (rGO and POMs) in the bulk
nanofluid, even at very fast rates, thus showing effective charge percolation in a material
that behaves as a true liquid electrode. The studies described here have been performed
with model low-concentration nanofluids and certainly more concentrated systems will
be necessary. But our work provides data on the intrinsic potential of these rGO-POMs
HENFs as truly flowing electrodes for Electrochemical Flow Cells. Further investigations
are already in progress concerning both improved engineering design and improved
active materials, a combination which should lead to efficient, low-cost and scalable flow
cells based on Electroactive Nanofluids (ENFs).

Desing of novel electroactive nanofluids for flow cell
Chapter 5. Hybrid Nanofluids Made of rGO and Polyoxometalates Page | 137
References
1. P. Gomez-Romero, C. Sanchez, Functional Hybrid Materials. Editor, Wiley-
VCH, 2004.
2. G. Kickelbick, Hybrid Materials: Synthesis, Characterization, and
Applications. Editor, Wiley-VCH, 2007.
3. S. A. Kumar, Eco-Friendly Nano-Hybrid Materials for Advanced Engineering
Applications. Editor, CRC Press, 2017.
4. E. Ruizhitzky, J. M. Rojo, Nature 1980, 287, 28-30 10.1038/287028a0.
5. E. Ruizhitzky, P. Aranda, Advanced Materials 1990, 2, 545-547
10.1002/adma.19900021108.
6. J. M. Amarilla, B. Casal, J. C. Galvan, E. Ruizhitzky, Chemistry of Materials
1992, 4, 62-67 10.1021/cm00019a015.
7. P. Aranda, E. Ruizhitzky, Chemistry of Materials 1992, 4, 1395-1403
10.1021/cm00024a048.
8. E. Ruizhitzky, Advanced Materials 1993, 5, 334-340
10.1002/adma.19930050503.
9. E. Ruizhitzky, R. Jimenez, B. Casal, V. Manriquez, A. S. Ana, G. Gonzalez,
Advanced Materials 1993, 5, 738-741 10.1002/adma.19930051011.
10. A. J. Aznar, J. Sanz, E. Ruizhitzky, Colloid and Polymer Science 1992, 270,
165-176 10.1007/bf00652183.
11. P. Aranda, J. C. Galvan, B. Casal, E. Ruizhitzky, Electrochimica Acta 1992,
37, 1573-1577 10.1016/0013-4686(92)80114-2.
12. P. Gomez-Romero, Advanced Materials 2001, 13, 163-174.
13. P. Gomez-Romero, C. Sanchez, New Journal of Chemistry 2005, 29, 57-58
10.1039/b416075b.
14. E. Ruiz-Hitzky, B. Casal, P. Aranda, J. C. Galvan, Reviews in Inorganic
Chemistry 2001, 21, 125-159.
15. E. Ruiz-Hitzky, M. Darder, P. Aranda, K. Ariga, Advanced Materials 2010,
22, 323-336 10.1002/adma.200901134.
16. L. Rozes, C. Sanchez, Chemical Society Reviews 2011, 40, 1006-1030
10.1039/c0cs00137f.
17. E. Ruiz-Hitzky, P. Aranda, M. Darder, M. Ogawa, Chemical Society Reviews
2011, 40, 801-828 10.1039/c0cs00052c.

Desing of novel electroactive nanofluids for flow cell
Chapter 5. Hybrid Nanofluids Made of rGO and Polyoxometalates Page | 138
18. M. C. Orilall, U. Wiesner, Chemical Society Reviews 2011, 40, 520-535
10.1039/c0cs00034e.
19. C. Sanchez, P. Belleville, M. Popall, L. Nicole, Chemical Society Reviews
2011, 40, 696-753 10.1039/c0cs00136h.
20. K. Naoi, W. Naoi, S. Aoyagi, J. Miyamoto, T. Kamino, Accounts of Chemical
Research 2013, 46, 1075-1083.
21. M. Lira-Cantu, P. Gomez-Romero, Journal of Solid State Chemistry 1999,
147, 601-608.
22. M. Lira-Cantu, P. Gomez-Romero, Journal of the Electrochemical Society
1999, 146, 2029-2033.
23. O. Ayyad, D. Munoz-Rojas, J. Oro-Sole, P. Gomez-Romero, Journal of
Nanoparticle Research 2010, 12, 337-345 10.1007/s11051-009-9620-3.
24. P. Gomez-Romero, M. Lira-Cantu, Advanced Materials 1997, 9, 144-147.
25. M. Lira-Cantu, P. Gomez-Romero, Chemistry of Materials 1998, 10, 698-
704.
26. P. Gomez-Romero, M. Chojak, K. Cuentas-Gallegos, J. A. Asensio, P. J.
Kulesza, N. Casan-Pastor, M. Lira-Cantu, Electrochemistry
Communications 2003, 5, 149-153 10.1016/s1388-2481(03)00010-9.
27. D. P. Dubal, B. Ballesteros, A. A. Mohite, P. Gomez-Romero,
Chemsuschem 2017, 10, 731-737 10.1002/cssc.201601610.
28. P. Gomez-Romero, G. Torres-Gomez, Advanced Materials 2000, 12, 1454-
1456.
29. G. Torres-Gomez, S. Skaarup, K. West, P. Gomez-Romero, Journal of the
Electrochemical Society 2000, 147, 2513-2516.
30. G. Torres-Gomez, E. M. Tejada-Rosales, P. Gomez-Romero, Chemistry of
Materials 2001, 13, 3693-3697.
31. P. Gomez-Romero, J. A. Asensio, S. Borros, Electrochimica Acta 2005, 50,
4715-4720 10.1016/j.electacta.2005.02.029.
32. V. Ruiz, J. Suarez-Guevara, P. Gomez-Romero, Electrochemistry
Communications 2012, 24, 35-38 10.1016/j.elecom.2012.08.003.
33. J. Suarez-Guevara, V. Ruiz, P. Gomez-Romero, Journal of Materials
Chemistry A 2014, 2, 1014-1021 10.1039/c3ta14455k.
34. J. Suarez-Guevara, V. Ruiz, P. Gomez-Romero, Physical Chemistry
Chemical Physics 2014, 16, 20411-20414 10.1039/c4cp03321c.

Desing of novel electroactive nanofluids for flow cell
Chapter 5. Hybrid Nanofluids Made of rGO and Polyoxometalates Page | 139
35. D. P. Dubal, J. Suarez-Guevara, D. Tonti, E. Enciso, P. Gomez-Romero,
Journal of Materials Chemistry A 2015, 3, 23483-23492
10.1039/c5ta05660h.
36. D. P. Dubal, N. R. Chodankar, A. Vinu, D. H. Kim, P. Gomez-Romero,
Chemsuschem 2017, 10, 2742-2750 10.1002/cssc.201700792.
37. Taylor, R. J. J. Appl. Phys. 113, 011301 (2013).
38. Presser, V. et al. Adv. Energy Mater. 2, 895-902 (2012).
39. Kastening, B. Boinowitz, T. Heins, M. J. Appl. Electrochem. 27, 147-152
(1997).
40. Dubal, D. P. and Gomez-Romero, P. 2D-Materials, 3, 031004 (2016).
41. Ji, Y. Huang, L. Hu, J. Streb, C. Song, Y. F. Energy Environ. Sci., 8, 776-
789 (2015)
42. Chen, H. Y. et al. Nanoscale, 7, 7934-7941 (2015).
43. Ma, A. et. al. J. Electrochem. Soc., 161, F1224-F1230 (2014).
44. Bajwa, G., Genovese, M. Lian, K. Multilayer ECS J. Sol. State Sci. Tech., 2,
M3046-M3050 (2013).
45. Barreca, D. et al. Surf. Sci. Spectra, 8, 258 (2001).
46. Weinhardt, L. et al. Electronic surface level positions of WO3 thin films for
photoelectrochemical hydrogen production. J. Phys. Chem. C, 112, 3078-
3082 (2008).
47. Pastoriza-Gallego, M.J. Casanova, C. Legido, J. L. Pineiro, M. M. CuO in
water nanofluid: Influence of particle size and polydispersity on volumetric
behaviour and viscosity. Fluid Phase Equilibr. 300, 188-196 (2011).
48. Hong, R.Y. Rheological properties of water-based Fe3O4 ferrofluids. Chem.
Eng. Sci. 62, 5912-5924 (2007).
49. Campos, J. W. et al. Investigation of carbon materials for use as a flowable
electrode in electrochemical flow capacitors. Electrochim. Acta 98, 123-130
(2013).
50. Zhang, C. et al. Carbon, 77, 155-164 (2014).
51. Dubal, D. P. Ayyad, O. Ruiz, V. Gomez-Romero, P. Chem. Soc. Rev. 44,
1777-1790 (2015).

Desing of novel electroactive nanofluids for flow cell
Chapter 5. Hybrid Nanofluids Made of rGO and Polyoxometalates Page | 140

Desing of novel electroactive nanofluids for flow cell
Chapter 6. From hybrid Nanofluid to hybrid cells. The rGO/DABA-LiFePO4 system Page | 141
CHAPTER 6
From hybrid Nanofluid
to hybrid cells. The
rGO/DABA-LiFePO4
system

Desing of novel electroactive nanofluids for flow cell
Chapter 6. From hybrid Nanofluid to hybrid cells. The rGO/DABA-LiFePO4 system Page | 142

Desing of novel electroactive nanofluids for flow cell
Chapter 6. From hybrid Nanofluid to hybrid cells. The rGO/DABA-LiFePO4 system Page | 143
6.1 Context
The rGO-POM nanofluids described in the previous chapter showed great
performance, however their stability left room for improvement. After 10h a clear change
in the opacity due to the precipitation of rGO was observed, and after 40h almost all the
rGO had been precipitated despite the use of surfactants. In order to improve the stability
of the rGO dispersions we developed a new kind of nanofluid.
Using the π-π interaction between rGO and a solvated aromatic molecule we
aimed at a definitive improvement of the stability of rGO in nanofluids without using
surfactants, thus without an increase of the viscosity and most important, without affects
to it electronic transference capability though the solution. For this propose we chose the
3,4 diaminobenzoic acid (DABA) as the aromatic solved molecule which will “hold” the
rGO through the π-π interaction.
But in addition to new strategies to stabilize nanofluids, the work reported in this
article was trying to answer the question of how to harness the electroactivity of a well-
known conventional solid phase widely used in batteries when “transplanted” to a
nanofluid. LiFePO4 was selected as the model battery material and dispersed as
nanosheets in a series of nanofluids with increasing complexity, but always based in the
interaction with the dispersed rGO which allows the charge transference between the

Desing of novel electroactive nanofluids for flow cell
Chapter 6. From hybrid Nanofluid to hybrid cells. The rGO/DABA-LiFePO4 system Page | 144
LiFePO4 nanosheets and the current collector due to the nanosheets have a poor
diffusion capability because it large size in comparison with a molecule or ion.
Thus, the fundamental question was how to enable charge transfer in these
nanomaterials and we could determine the role of rGO as enabler of this process.
Another interesting technological derivation of the work could be the combination of a
purely capacitive nanofluid electrode with a redox-active nanofluid in an unprecedented
hybrid flow cell.
6.2 Introduction
Electrochemical Energy Storage is the midst of a regenerative resurgence.
Batteries, Supercapacitors (SCs), Fuel Cells (FCs) or Redox Flow Batteries (RFBs) are
markedly complementary technologies and are all called to play a role within the
forthcoming sustainable energy model. From load-leveling devices to wearable
electronics, to the development of smart grids to electric vehicles or to renewable energy
storage. Exploring conceptual frontiers between batteries, supercapacitors, redox flow
batteries (RFBs) and fuel cells (FCs) could provide new opportunities to get the best of
each of those technologies.
Redox Flow Batteries (RFBs) for instance could indeed be considered as laying
halfway between conventional solid-electrode batteries and FCs. Unlike traditional
batteries, energy density and power density are effectively detached in RFBs. Energy is
proportional to the size of the external reservoirs and power to the number of cells and
area of the electrodes. This technology does not suffer memory effect and benefits from
a long cycle life. These are important advantages related to the fact that active materials
are ions solvated in the flowing electrolyte media. On the other hand, RFBs have
drawbacks like low energy density and low specific energy due to the solubility limit of
the active redox species.
Different types of mechanisms have been proposed for flow cells in water and in
organic media, as discussed in a very recent review1 All organic RFBs have been
typically developed using benzoquinone and anthraquinone. Some works combining
organic and inorganic solutions (for instance anthraquinone and ferricyanide as
electrolytes) have been published in order to develop organic-inorganic redox flow cells.
Also a combination of Li metal (deposited on the anode) and an organic molecule as

Desing of novel electroactive nanofluids for flow cell
Chapter 6. From hybrid Nanofluid to hybrid cells. The rGO/DABA-LiFePO4 system Page | 145
catholyte has been frequently used for organic – inorganic hybrid flow batteries in organic
media.
In the same review1 a full comparative discussion of the various types of flow cells is
included. Concerning energy densities, flow batteries with organic molecules in aqueous
media report values below 20 Wh·L-1. For hybrid organic-inorganic redox flow batteries
the energy densities increase but always to values below 40 to 50 Wh·L-1 for aqueous
and organic solvents respectively. The largest value of energy density reported so far
(200 Wh·L-1) corresponds to a flow cell combining metallic Li anode and a TEMPO
catholyte. This device however presents serious stability problems and has only been
subject to 20 cycles1
Among well-established systems, All-Vanadium cells constitute the most
developed type of RFBs and have an energy density of 40 Wh·L-1 and a specific energy
of 25 Wh·Kg-1 and operate between 1.6V and 1.3V2, 3. Those values are far away from
current Li-Ion Batteries (LIBs), 150-200 Wh·Kg-1 at 3.7V4. Aside from the higher voltage
attained in organic LIBs, the primary reason why RFBs do not achieve the energy density
values of LIBs is the low concentration of active material due to limited solubility5, 6.
Furthermore, the chemical stability of the active species is limited in some cases by the
enhancement of spurious reactions at high concentrations5, 7. Finally, there is one more
factor that affects both the energy and power densities of many RFBs, namely, relatively
low voltages due not only to thermodynamic but also to kinetic factors, such as the high
internal resistance associated to electrolyte diffusion through selective membrane
separators.
The recent proposal of Semisolid Flow Batteries (SFBs) tries to solve these
drawbacks by using heterogeneous mixtures of electroactive species with surfactant and
carbon particles. For example, Chiang and coworkers described a so-called semi-solid
lithium flow battery8. And Gogotsi and coworkers described a similar system for a
capacitive system9. A so-called flowable carbon-electrolyte mixture was used as the
active material for capacitive energy storage and was handled in a similar way to flow or
semi-solid batteries. In 2014, Nair and collaborators also reported a flow capacitor device
based on a graphene dispersion in organic electrolyte, with improved energy density
(14.3 W·h·L-1) with respect to graphite (0.422 W·h·L-1)10. 3D interconnected hybrid
materials (RGO@CS) were used to prepare an EFC. When tested as flowable
electrodes, the composition with a 1:2 ratio of GO to CS exhibited the highest
capacitance of 200 F·g-1 and an improved rate performance11. In general, this approach

Desing of novel electroactive nanofluids for flow cell
Chapter 6. From hybrid Nanofluid to hybrid cells. The rGO/DABA-LiFePO4 system Page | 146
has been quite popular and highly concentrated semisolid catholytes based on LiCoO2,
LiNi0.5Mn1.5O4 and Li4Ti5O12 suspensions, have been developed12.
More recently, Tarascon et al. focused on the performance of a LiFePO4/LiPF6
EC-DMC/Li redox flowable half-cell13. As a result, power densities of 328 mW·cm−2 at
104 mA·cm−2 were achieved with specific energy of 50 Wh·kg−1. It is important to
mention, however, the use of intermittent flow conditions with the values reported being
measured under static conditions13.
A procedure described as “intermittent flow” was used that allowed the slurry to
rest on the electrodes prior to and during measurements. Under those conditions the
process of cycling of the active material could be closer to that of a solid battery electrode
rather than to a flowing one.
Lu et al reported a silicon-carbon nanocomposite semi-solid anolyte, achieving a
high reversible capacity (>1200 mAh g−1 ) and stable cycle life (>100 cycles), although
the experiments were also made under interment flow conditions14.
SFBs usually need a significant amount of dispersed conducting particles such
as carbon particles, which can transform the electrolyte solution into a slurry electrode
that allows for electrical conduction by percolation in all the volume of the electrode9. On
the other hand, these conducting particles often need a surfactant to generate a stable
dispersion15. This large amount of carbon particles and the use of surfactant are
responsible for a detrimental increase in the viscosity of semisolid electrodes. Finally,
the nature of the carbon used is another crucial point since it determines the electrical
conductivity and thus the effectiveness of the percolation effect16, 17.
High viscosity is not compatible with flow cells, which need a pumping system to
flow the solutions from the reservoirs to the electrochemical cell and vice versa, with a
corresponding decrease in overall efficiency. Thus, a significant increase in viscosity of
the fluids is highly undesirable, because the extra energy needed to circulate the pastes
could cancel out the possible intrinsic advantages of the active materials, or at least
reduce dramatically the overall efficiency of the system.
On the other hand, a different approach to the harnessing of electroactive solid
particles in flow cells has been proposed by Grätzel and collaborators by introducing the
concept of shuttle redox molecular solutions with suitable redox potentials, solubility,
stability and kinetics to transfer the charge to solid particles stored in a separate
reservoir18.

Desing of novel electroactive nanofluids for flow cell
Chapter 6. From hybrid Nanofluid to hybrid cells. The rGO/DABA-LiFePO4 system Page | 147
Other approach using nanofluids was proposed by Timofeeva and col. in 2015.
They developed a scalable one-step surface modification procedure for functionalizing
TiO2 nanoparticles with a monolayer coverage of propyl sulfonate groups19. With this
new formulation the nanofluids had a high solid loading and low viscosity, while retaining
the surface activity of nanoparticles.
Our approach has been to use graphene instead of activated carbon as the key
material to provide an electrical percolation effect on the solution. This approach is
backed by preliminary results showing extraordinary charge percolation even in dilute
graphene nanofluids20. Thus, a stabilized dispersion of rGO in aqueous sulfuric acid
solution can provide energy storage capacities similar to those of solid electrode
supercapacitors (169 F·g−1(rGO)) but working up to much faster rates (from 1 mV·s−1 to
the highest scan rate of 10 V·s−1) in nanofluids20.
Our efforts to create graphene-based nanofluids led to the development of two
new hybrid materials (rGO-phosphomolybdate, rGO-PMo12 and rGO-phosphotungstate,
rGO-PW12), dispersed with the aid of a surfactant in 1 M H2SO4 aqueous electrolyte to
yield highly stable hybrid electroactive nanofluids (HENFs) of low viscosity which were
tested in a home-made flow cell under static and continuous flowing conditions.
Remarkably, even low concentration rGO-POMs HENFs (0.025 wt%) exhibited high
specific capacitances of 273 F/g(rGO-PW12) and 305 F/g(rGO-PMo12) with high specific
energy and specific power per mass of active material21.
Indeed, RGO must be properly dispersed in electrolytes in order to be used as a
nanofluid. This has been attempted both in aqueous and organic solvents. For example
Xu et al. reported a successful production of stable high-concentration graphene
dispersions in low-boiling-point, low-polarity conventional organic solvents by liquid-
phase noncovalent exfoliation of graphite assisted using polyethylene (HDPE) as the
stabilizer22. Other example of RGO dispersion, this time in water, is the report of an
imidazolium-modified hexa-peri-hexabenzocoronene derivative (HBC-C11-MIM[Cl−] 5)
designed and synthesized as a stabilizer to disperse RGO. The resulting RGO/HBC-C11-
MIM[Cl−] hybrid can reach stable concentrations of 5.0 mg·mL−1 (rGO) in water23. In these
two examples the stabilization of the rGO is achieved by a solvated aromatic molecule
that keeps rGO in suspension.
On the other hand, LiFePO4 has been intensely studied as cathode material for
LIBs since the seminal work of Goodenough in 199724. It has made it from the labs to the
market thanks to its low cost, abundant raw materials, safety, low toxicity, structural
stability and excellent electrochemical properties. The active material can be reversibly

Desing of novel electroactive nanofluids for flow cell
Chapter 6. From hybrid Nanofluid to hybrid cells. The rGO/DABA-LiFePO4 system Page | 148
charged and discharged with a stable voltage at 3.45 V vs. Li+/Li with a very small change
in unit cell parameters during the LiFePO4/FePO4 phase transition. It needs, however,
conducting additives or coatings in order to display its full potential. As part of the
extensive research on LiFePO4 Bonaccorso, reported a battery with a graphene and
LiFePO4 electrodes and an energy density of 190 Wh·Kg-1 25.
In this work we want to demonstrate the feasibility of reversibly transferring
charge to/from nanoparticles of an electroactive phase (in this case, model LiFePO4)
dispersed in an electrolyte by means of the presence of rGO in a stabilized nanofluid,
with rGO providing effective charge percolation.
In this work, we have used 3,4-diaminobenzoic acid (DABA) to generate a stable
rGO dispersion in water and lithium iron phosphate (LiFePO4) nanoparticles with a 2D
layered morphology to demonstrate the high rate of charge transfer throughout the
graphene dispersion in low concentration and in the absence of conventional surfactants.
Just small amounts of rGO dispersed in aqueous Li2SO4 electrolyte lead to nanofluids
with low viscosity while allowing effective charge/discharge of redox LiFePO4
nanoparticles.
6.3 Experimental Section
LiFePO4 sample was prepared by a reflux method. Stoichiometric amounts (0.03
mmol) of Li(CH3COO)·2H2O (3.0606 g), Fe(CO2CO2)·2H2O ( 5.3907 g) and 85 %v/v
H3PO4 ( 2.05 mL) were dissolved in 70 mL of ethylene glycol. The liquid reaction mixture
was placed in a round-bottom flask connected to a condenser and refluxed vigorously
for 72 h at 200 °C. The final pH of this solution was 7. The resulting solid was filtered-off,
washed several times with deionized water and then ethanol. The sample was dried
under vacuum at 80°C overnight, preheated at 350°C for 5 h and then sintered at 700°C
for 10 h under nitrogen atmosphere. We collected 3.4214 g of green powder which
amounts to 92% yield.
Graphite oxide (GO) was prepared from natural graphite using a modified
Hummers method as follows26: NaNO3 (5g) and H2SO4 (225mL) were added to graphite
(5g) and stirred for 30 min in an ice bath. KMnO4 (25g) was added to the resulting
solution, and then the solution was stirred at 50°C for 2 h. Deionized (DI) water (500 mL)
and H2O2 (30 mL, 35%) were then slowly added to the solution. Concentrated HCl (500
mL, 37%) was added and then a final washing with 750 mL of 10% HCl, followed by
dialysis until pH 6-7 and a final drying under vacuum at 70°C, afforded the GO product

Desing of novel electroactive nanofluids for flow cell
Chapter 6. From hybrid Nanofluid to hybrid cells. The rGO/DABA-LiFePO4 system Page | 149
as a powder. The amount of powder recovered was 4.1381g, which represents a 16%
yield. Reduced graphene oxide (rGO) was prepared by high temperature treatment of
this GO sample at 800°C under N2 atmosphere for 1 hour.
The electroactive nanofluids discussed in this article were prepared using 1M
solutions of Li2SO4·H2O as base fluid and different DABA concentrations. RGO was then
dispersed in this electrolyte solution, and sonicated for 5 minutes. The mass ratio of
DABA to rGO was optimized in order to get a stable dispersion with a maximum amount
of rGO. It is important to mention that pH 7 is needed for these electroactive nanofluids.
To adjust the pH, LiOH·H2O was added before adding LiFePO4. Finally, layered LiFePO4
was added and the mixture sonicated for 35 minutes. Different amounts of rGO and
LiFePO4 were tested and will be discussed through the article.
The viscosity for DABA/rGO (40:1)) nanofluid is 1.055 (10) mPa·s at 20.1°C. This
value is very similar to the viscosity of water at the same temperature (1.002 mPa·s).
The electroactive nanofluid based on sample e LiFePO4 1.4 g/L (DABA/RGO (40:1)) has
a viscosity of 1.72 mPa.s, at 20.1°C with a shear rate of 2880 s-1. This electroactive
nanofluid has a higher viscosity than water and the base nanofluid, the higher viscosity
is a result of the addition of the LiFePO4 particles. However, this value is still reasonably
low and perfectly compatible with low-energy pumping in a flow cell system.
Physical Characterization. The phase purity and crystal structure of the samples
were confirmed by X-ray diffraction (XRD) using PANalytical X′Pert PRO diffractometer
using a Cu Kα radiation source (λ = 1.5418 Å) in the angular range 10º ≤ 2θ ≤ 70º at a
scan rate of 0.017º per second. The morphology of the particles was studied by Scanning
Electron Microscopy (SEM) and Transmission Electron Microscopy (TEM, Tecnai G2
F20 HRTEM) operated at an acceleration voltage of 200 keV. For TEM studies, samples
were dispersed in absolute ethanol, and a drop was then put onto a holey carbon coated
Cu grid and allowed to evaporate slowly under ambient conditions before being
introduced for TEM characterization. Raman scattering (RS) spectra were recorded on
a HORIBA Scientific LabRAM HR Raman spectrometer system using Ar laser. Rheology
experiments were carried out at the Institut de Ciencia de Materials de Barcelona
(ICMAB) with a Haake RheoStress 600.
Cyclic voltammograms were carried out from -0.2 V to 1.2V vs Ag/AgCl 3.5M KCl.
Pt was used as counter and working electrode during the electrochemical tests of the
nanofluids. Potentiostatic electrochemical impedance spectroscopy (PEIS) experiments
were carried out over a frequency range of 5000 kHz and 100000 mHz, with an amplitude
of 10 mV. Before the PEIS experiments, the cell was keep at constant voltage for 10

Desing of novel electroactive nanofluids for flow cell
Chapter 6. From hybrid Nanofluid to hybrid cells. The rGO/DABA-LiFePO4 system Page | 150
minutes. The voltages of the experiments were 0.0 V vs. Ag/AgCl or 0.9 V vs. Ag/AgCl
the electrochemical tests were carried out with a Biologic VMP3 potentiostat/galvanostat.
A commercial Electrolysis Cell was used (BASi Bulk). A container with a porous
glass frit of 4-6 μm pore diameter was used for the charge and discharge test. In the
glass frit only 1.4 g·L-1 of LiFePO4 DABA/rGO (40:1) nanofluid was placed. A DABA-rGO
(40:1) dispersion was used as counter electrode in the 75 mL glass cell with an Ag/AgCl
KCl 3.5M reference electrode immersed in it. The cell was cycled between -0.2V to 1V
vs. Ag/AgCL KCl 3.5M at 1C. The dispersion was stirred during the experiment. It is
important to mention that we balanced the amounts of active materials in each nanofluid
electrode (1.4 g·L-1 of LiFePO4 DABA/rGO (40:1) sample and the DABA/rGO (40:1)
sample) to balance their charge. For instance, we used 75 mL of DABA/rGO (40:1)
nanofluid and 1.3 mL of the LiFePO4 DABA/rGO nanofluid. The calculation was based
on data from a symmetric cell with DABA/rGO (40:1) electrodes Figure 1.
Fig.1 Capacity vs. Potential profile of symmetric capacitor cell with DABA/rGO (40:1) electrodes.
Cycle at 500 mA for one hour. Both the anolyte and the catholyte were DABA/RGO (40:1).
Physical Characterization. The phase purity and crystal structure of the samples
were confirmed by X-ray diffraction (XRD) using PANalytical X′Pert PRO diffractometer
using a Cu Kα radiation source (λ = 1.5418 Å) in the angular range 10º ≤ 2θ ≤ 70º at a
scan rate of 0.017º per second. The morphology of the particles was studied by Scanning
Electron Microscopy (SEM) and Transmission Electron Microscopy (TEM, Tecnai G2
F20 HRTEM) operated at an acceleration voltage of 200 keV. For TEM studies, samples
were dispersed in absolute ethanol, and a drop was then put onto a holey carbon coated
Cu grid and allowed to evaporate slowly under ambient conditions before being

Desing of novel electroactive nanofluids for flow cell
Chapter 6. From hybrid Nanofluid to hybrid cells. The rGO/DABA-LiFePO4 system Page | 151
introduced for TEM characterization. Raman scattering (RS) spectra were recorded on
a HORIBA Scientific LabRAM HR Raman spectrometer system using Ar laser. Rheology
experiments were made in the Institute de Ciencia de Materials de Barcelona (ICMAB)
with a Haake RheoStress 600.
For the solid-electrode test the cathodes were prepared by pressing a mixture of
the active materials with Carbon Super-P (Timcal) and Polyvinylidene fluoride (PVDF)
binder in a weight ratio 85/10/5. They were mixed in a mortar for 5 minutes and then
dispersed in N-Methyl-2-pyrrolidone and coated onto Al foil.
6.4 Results and Discussion
Behera et al. have reported that reduced graphene oxide has a better
dispersibility in a pH range of 7 to 1127. Guyomard and collaborators reported that
LiFePO4 has an initial pH near 7 in a water dispersion; they conclude that the stability
and the electrochemical performance is better when the initial pH is not altered28.
Furthermore, DABA solubility has a strong dependence on the pH, with decreased
solubilities in acidic media (Table 1 and Table 2) probably due to the protonation of its
carboxylic acid moiety. Therefore, LiOH·H2O was used in order to adjust the pH at 7; this
compound was selected to avoid the presence of other ions in solution.
DABA concentration LiOH.H2O pH Solubility
12 g·L-1 N/A 4 no
12 g·L-1 1.6 g·L-1 6 partially
12 g·L-1 2.8 g·L-1 7 yes
12 g·L-1 3.6 g·L-1 10 yes
Table 1 DABA experimental solubility
As a preliminary step for the formulation of our final nanofluids, we optimized the
DBA/rGO concentration in aqueous media. Three different DABA/rGO mass ratios were
tested: 20:1, 30:1 and 40:1 (see Table 1 for concentration). As it is shown in Table 1, the
more stable dispersion of DABA and rGO was the one with the mass ratio DABA/rGO 40
to 1.

Desing of novel electroactive nanofluids for flow cell
Chapter 6. From hybrid Nanofluid to hybrid cells. The rGO/DABA-LiFePO4 system Page | 152
pH Concentration (g·L-1)
1 263
2 30
3 5.2
4 2.7
5 4
6 18
7 161
8 1000
9 1000
10 1000
Table 2 Theoretical solubility of DABA at 25 ° C (a)
(a) Calculated using Advanced Chemistry Development (ACD/Labs) Software V11.02 (© 1994-2017 ACD/Labs)
For comparison, pure rGO was dispersed in the Li2SO4 aqueous electrolyte at a
nominal concentration of 0.29 g·L-1. However, at this concentration RGO precipitates
immediately, although a grey-colored dispersion was maintained (Table 3). This means
that, although some graphene flakes remain in solution thanks to the polar oxygen
groups remaining in the structure of rGO, in the absence of DABA, the solubility limit for
rGO is much lower.

Desing of novel electroactive nanofluids for flow cell
Chapter 6. From hybrid Nanofluid to hybrid cells. The rGO/DABA-LiFePO4 system Page | 153
Sample Aspect Stability Complete precipitation of the
dispersion (hours)
RGO (0.29 ng/L) Translucent grey immediate ppt N/A
Diaminobenzoic acid / RGO
(20:1) (0.6 g·L-1 RGO) Translucent Precipitation starts after 4 hrs. 7
Diaminobenzoic acid / RGO
(30:1) (0.4 g·L-1 RGO) (orange) Decrease with time Precipitation starts after 27 hrs. 56
Diaminobenzoic acid / RGO
(40:1) (0.3 g·L-1 RGO)
(orange)
Decrease with time Precipitation starts after 97 hrs. 120
Diaminobenzoic acid / RGO
(40:1)/ 0.4 g·L-1 LiFePO4 Brown
Precipitation starts after ca. 24
hours 36
Diaminobenzoic acid / RGO
(40:1)/ 1 g·L-1 LiFePO4 Almost Black N/A Around 24
Diaminobenzoic acid / RGO
(40:1)/ 1.4 g·L-1 LiFePO4 Almost black N/A Around 24
Diaminobenzoic acid / RGO
(40:1)/ 2 g·L-1 LiFePO4 Black N/A More than 12 less than 24
Table 3 Stability of the nanofluids (12 mg/mL DABA, 2.8 mg/mL LiOH.H2O, 1M of Li2SO4.H2O, pH 7).
The stabilization of rGO by DABA could be explained through solvation by this
aromatic molecule that keeps rGO in suspension by π-π interactions, with the
introduction of functional groups providing a steric effect that maintains the rGO layers
apart. Indeed, DABA is an amphiphilic molecule with an aromatic core and polar groups.
This must be at the heart of its capacity to stabilize rGO in water. The fact that a large
excess of molecules is needed for this suggest that a simple single-layer coating of both
sides of rGO sheets by DABA is not enough to explain this stabilization. Instead, we
propose a multilayer structure of DABA molecules with orientations parallel to rGO
sheets in the first-layer sphere (with π-π interactions) turning into loosely perpendicular
orientations after a few DABA layers, with carboxylate and –NH2 groups hydrogen-
bonding water molecules. Of course, this appealing hypothesis would need to be
confirmed by further studies, possibly through molecular simulation.

Desing of novel electroactive nanofluids for flow cell
Chapter 6. From hybrid Nanofluid to hybrid cells. The rGO/DABA-LiFePO4 system Page | 154
After optimization of the DABA/rGO ratio (optimal mass ratio 40:1 DABA/rGO),
we proceeded to develop an electroactive nanofluid incorporating platelet LiFePO4 as
redox electroactive species to test the rGO/DABA dispersion. Different amounts of
LiFePO4 were tested to optimize the amount of redox active material load in the nanofluid
(Table 3). The sample with 0.4 g·L-1 of LiFePO4 was the most stable, however samples
containing 1 g·L-1 and 1.4 g·L-1 of LiFePO4 exhibited a stability that could be considered
good enough to develop a nanofluid. Unfortunately, the sample with 2 g·L-1 of LiFePO4
layer did not show good stability. Depending on the particle concentration and the
strength of particle−particle interactions, a dispersion/agglomeration equilibrium is
established in the particle suspension. Large concentrations of LiFePO4 platelets induce
agglomeration and precipitation. On the other hand, it should be noted that even gentle
stirring prevents precipitation of these more concentrated nanofluids.
The electrochemical characterization of optimized nanofluids included cyclic
voltammetry (CV) and impedance (PEIS) studies, as well as Galvanostatic Charge-
Discharge (GCD) tests. As shown in Fig.2a, the CV of DABA shows an important change
on its electrochemical signal when rGO is added. DABA alone did not show any special
electrochemical response. There is an apparent wave at both ends of the selected scan
range, the separation between the peaks is ca. 0.7 V vs. Ag/AgCl. The difference
between these Epa and Epc, is a useful diagnostic test of a Nernstian reaction. In this
case it is quite far from the value of 0.059 V at 25ºC 29 expected for a reversible reaction.
Fig.2 (a) Cyclic Voltammograms of DABA (12 g L-1) (red trace) and DABA/rGO (12 g L-1 and 0.3 g L-1
respectively) (blue) showing a characteristic irreversible oxidation wave of DABA enabled by rGO. Scan
rate 5 mV s-1 (b) Cyclic Voltammograms of LiFePO4 (DABA-rGO (40/1)) (concentrations of LiFePO4 0.4 g
L-1, 1 g L-1, 1.4 g L-1, 2 g L-1). Scan rate 5 mV s-1. (c) Cyclic Voltammetry at different scan rates of LiFePO4
(1.4 g L-1). Inset shows the CV of a 1g L-1 LiFePO4 in DABA/rGO (40/1) in which the characteristic wave
from DABA is still apparent.

Desing of novel electroactive nanofluids for flow cell
Chapter 6. From hybrid Nanofluid to hybrid cells. The rGO/DABA-LiFePO4 system Page | 155
But the addition of RGO leads to the appearance of an oxidation wave at 0.3 V
vs Ag/AgCl. Thus, rGO seems to promote an irreversible oxidation process. It is
important to mention that the rGO dispersion shows a capacitive behavior rather than a
faradaic redox process, Figure 3a.
Fig.2b shows cyclic voltammograms of nanofluids with various LiFePO4
concentrations with DABA/rGO as additive at constant concentration (40/1 mass ratio).
They show the expected LiFePO4 redox waves at 0.65 V vs Ag/AgCl and 0.19 V vs.
Ag/AgCl with intensities increasing as LiFePO4 concentration increases up to 1.4 g·L-1.
The acknowledged redox process for LiFePO4 is the following 24, 30:
𝐿𝑖𝐹𝑒𝑃𝑂4 𝐿𝑖+ + 𝑒− + 𝐹𝑒𝑃𝑂4 (1)
Fig.3 Cyclic voltammograms of (a) rGO (b) 1.4g/L of LiFePO4 in an aqueous electrolyte The electrolyte is
1M Li2SO4 with 1.4 gL-1 of LiFePO4. The scan rate was 5 mVs-1.
Finally, a redox wave associated to DABA was also detected at 0.3 V vs Ag/AgCl.
The sample with 1.4 g·L-1 of LiFePO4 led to the best electrochemical
performance, although its dispersion in the nanofluid is not as long-lasting as that of more
dilute sample (i.e. 0.4 g·L-1). Thus, the 1.4 g·L-1 was further used to explore in detail the
electrochemical characteristics of these nanofluids. The decrease in the current intensity
for the nanofluid with a LiFePO4 concentration of 2 g/L is a result of a co-precipitation of
rGO and LiFePO4 nanoparticles.
Fig.2c shows the electrochemical behavior of the selected sample (1.4 g/L
LiFePO4 nanofluid) at different scan rates. The intensity of the Fe(II)/Fe(III) peak from
LiFePO4 increases as the scan rate is increased. On the other hand, the peak
corresponding to DABA appears as a shoulder at low scan rates and nearly disappears
as the scan rate is increased up to 25 mV·s-1. It should be noted that the order for
recording these CVs was from fastest to slowest. Thus, the disappearance of the DABA

Desing of novel electroactive nanofluids for flow cell
Chapter 6. From hybrid Nanofluid to hybrid cells. The rGO/DABA-LiFePO4 system Page | 156
signal cannot be due to full consumption of the chemical. Instead, it can be attribute to a
slow kinetic of the DABA reaction. This observation allows us to conclude that at fast
scan rates this reaction does not contribute significantly to the electrochemistry of this
system. The concentration of LiFePO4 also has an effect. Thus, as we can see in Figure
4, the CV of the sample with 1 g·L-1 of LiFePO4 at 25 mV·s-1 shows a small peak
corresponding to DABA oxidation. These experiments show a decrease of the DABA
signal induced both by the addition of LiFePO4 and by an increase of the scan rate. That
behavior suggests that the electrochemical redox processes of LiFePO4 are much faster
than the oxidation of DABA.
Fig.4 Cyclic voltammograms of 1g/L of LiFePO4 in DABA/RGO (40:1).
On the other hand, it is well known that LiFePO4 electroactivity is hindered by its
poor electronic conductivity (10-9 S·cm-1) and slow lithium diffusion31. Increasing the
conductivity by coating the LiFePO4 surface with carbon30, 32 or conducting polymers33, 34
have been two of the most popular approaches to improve the capacity and rate
performance of LiFePO4 in LIBs. Similarly, our experiments show that in the absence of
rGO the Cyclic Voltammogram of LiFePO4 does not show a well-defined electrochemical
signal (Figure 3b). This behavior changes dramatically when the nanofluid contains
DABA-stabilized rGO in addition to LiFePO4, with well-defined and intense redox peaks
unambiguously assigned to LiFePO4 (Figure 4). This indicates that the water-dispersed
rGO allows for an effective charge-transfer percolation between the current collector and
the uncoated LiFePO4 nanosheets.
PEIS experiments were carried out for the 1.4 g·L-1 LiFePO4 nanofluid and the
corresponding Nyquist plots for the system in its reduced (0.0 V vs. Ag/AgCl) (Fig.5a)

Desing of novel electroactive nanofluids for flow cell
Chapter 6. From hybrid Nanofluid to hybrid cells. The rGO/DABA-LiFePO4 system Page | 157
and oxidized (0.9 V) (Fig.5b) states. The results fit the Randles equivalent circuit (inset
Fig.5b) typical for a simple electrochemical process. In this equivalent circuit, there is a
resistance associated to the electrolyte and the external circuit, which in the Nyquist plot
corresponds to the point in the real axes where the semicircle begins. This point is the
same for the oxidation and reduction processes of the sample. The value of this
resistance is negligible compared to the resistance associated with the charge transfer,
discussed below.
Fig.5 PEIS impedance spectra of LiFePO4 (1.4 g L-1) in DABA/RGO (40:1) (a) recorded at 0.0V (reduced)
and (b) at 0.9 V (oxidized).
The charge transfer resistance related to the redox process can be measured by
the width of the semicircle observed in the real axes of the Nyquist plot. The semicircle
is larger for the oxidation than for the reduction process in LiFePO4. This agrees with
other publications, where they found that LiFePO4 is more stable than FePO4 35. This
also means that the de-intercalation process is less favorable than the intercalation
process in this system.
The inclined line in the low frequency zone of the plot represents the Warburg
impedance (Zw), which is customarily associated to lithium-ion diffusion in the material36.
This process is associated with a mass transfer control.
Fig. 6a shows the performance of a full cell with the LiFePO4 (1.4 g·L-1) -
DABA/rGO (40:1) nanofluid as positive electrode and the DABA/rGO (40:1) nanofluid as
negative electrode cycled at 1C. The discharge capacity of the cell is ca. 140 mA·h·g-
1(LiFePO4) at 1 C.

Desing of novel electroactive nanofluids for flow cell
Chapter 6. From hybrid Nanofluid to hybrid cells. The rGO/DABA-LiFePO4 system Page | 158
The Coulombic efficiency of the cell increases continuously from 65% (1st cycle)
up to ca. 90% (5th cycle). This is not an intrinsic behavior of the electroactive phases in
the nanofluids. We believe the initial lower efficiency could be related to some irreversible
(but minor) reaction taking place during the first few cycles of charge. Finally, the results
show a high utilization of the LiFePO4.
Fig. 6b shows a plot of the potential of the working electrode vs. capacity for a
single representative cycle (5th cycle). The charge capacity is only slightly larger than the
discharge capacity, in agreement with the evolution of the coulombic efficiency shown in
Figure 6Fig. a. The profile of the cell shows a clear plateau around 0.35 V (discharge)
and 0.55 V (charge) vs Ag/AgCl.
Fig. 6 (a) Evolution of discharge capacity and coulombic efficiency of a two-nanofluid cell with LiFePO4
(1.4 g L-1)-DABA/RGO (40/1) as positive and DABA/RGO (40/1) as negative electrodes. Full cell cycled at
1C. (b) Charge and Discharge profiles (cell Voltage vs. charge) of the full Nanofluids cell.
Material characterization
The LiFePO4 material prepared presents the expected olivine phase as confirmed
by powder XRD (Figure 7a) with high purity. All diffraction peaks are indexed to
orthorhombic LiFePO4 (JCPDS card number 081-1173, space group Pnma), with no
impurities detected. The average primary crystallite size, as determined from the peak
width at 23.2ϴ by the Scherrer equation, was 38 nm, substantially smaller than the
average size of the plates which was found to be 138 nm.

Desing of novel electroactive nanofluids for flow cell
Chapter 6. From hybrid Nanofluid to hybrid cells. The rGO/DABA-LiFePO4 system Page | 159
Fig.7 (a) XRD pattern (indexes shown only up to 37º) (b) TEM image showing the flake microstructure and
(c) Selected Area Electron Diffraction (SAED) pattern; all corresponding to our solid LiFePO4 material.
On the other hand, the synthesis procedure reported here for LiFePO4 leads to a
striking, unusual morphology and agglomeration of thin plates Figure 7b. This sample is
well crystallized, single-crystals according to their Selected Area Electron Diffraction
(SAED) patterns, Figure 7c. This analysis of the SAED pattern, obtained from the
isolated nanoparticle shows in the inset of this figure, shows that this particle has a plane
axis of [100]. The inset shows a TEM image of the particle used to obtain the SAED. The
planes show by this nanoparticle can be index 101 and 020, corresponding to the bc
plane. These axes are listed in a JCPDS card number 081-1173 of LiFePO4.
In the absence of such a conducting coating, the maximum discharge capacity
obtained for this material in half cells vs. Li was around 100 mA·h·g-1 at 0.10C,
decreasing progressively at higher rates down to 30 mA·h·g-1 at 5C and ca. 10 mA·h·g-1
at 10C (Figure 8b).
Fig.8 (a) Cyclic Voltammetry of LiFePO4 scan rate 0.5 mV·s-1 (b) Rate Capability of the half-cell Li/LiFePO4
from Galvanostatic Charge-Discharge measurements at various current densities.

Desing of novel electroactive nanofluids for flow cell
Chapter 6. From hybrid Nanofluid to hybrid cells. The rGO/DABA-LiFePO4 system Page | 160
Figure 9a shows micrographs of representative rGO sheets at different scales.
These sheets are very thin and segregated, although their preparation for TEM results
in wrinkles and partial overlap with each other. The SAED pattern of the sheet shown in
the top inset (Figure 9a) shows a typical hexagonal symmetry but with strongly distorted
elongated spots, which is representative of single-crystalline graphene layers with a high
degree of distortions.
Raman scattering is one of the most widely used techniques to characterize the
structural and electronic properties of carbon materials. Figure 9b shows the Raman
spectrum of our rGO with a D band at 1355.2cm−1 and a G band at 1595.3 cm−1. The D
band is related to the degree of disorder and its intensity shows the degree of edge
chirality. Thus, the intensity ratio of G and D band (ID/IG) of rGO indicates the degree of
the disorder. As shown in Figure 9b, the ID/IG ratio of rGO is 0.99. This spectrum shows
that this sample has 2 other bands at 2716.3 and 2953.9 cm-1. The bands correspond to
2D (2953.9 cm-1), a combination scattering peak37, 38; a second order overtone of a
different in plane vibration D + G (2716.3 cm-1)37.
D and G Raman bands can be deconvoluted using four Gaussians or Gaussian-
Lorentzian lines in order to estimate the ratio of sp2 to sp3 type carbon.[38] We have fitted
the Raman intensity profiles using four Gaussian lines, see Figure 9b, and have
estimated intensity ratio Isp2/Isp3 = (I1270+ I1610) / (I1100+I1510). For RGO sample, we
found a value for Isp2/Isp3 =3.2.
Fig.9 (a) RGO HRTEM image, inset SAED and TEM image (b) Raman spectra of GO (bottom) and RGO
(top) (inset shows RGO D and G band deconvolution)

Desing of novel electroactive nanofluids for flow cell
Chapter 6. From hybrid Nanofluid to hybrid cells. The rGO/DABA-LiFePO4 system Page | 161
6.5 Conclusions
We successfully developed a stable dispersion of rGO in water thanks to the
addition of DiAminoBenzoic Acid (DABA). This aromatic but polar molecule interacts with
rGO through π-π forces equivalent to a solvating effect. As a consequence of this
interaction rGO was maintained in water as stable dispersions. Furthermore, the steric
effect of the functional groups of the DABA preclude the restacking of rGO layers, which
remain separated in the dispersion.
Our results show the strong effect of adding rGO-DABA to a nanofluid containing
LiFePO4 allowing for an effective charge-transfer percolation between the current
collector and the uncoated LiFePO4 nanosheets. The latter were used as a model
electroactive nanoparticulate phase and showed an improvement of its redox
performance in the nanofluid with respect to their use in a solid electrode. It should also
be noted that our base nanofluid (rGO-DABA) does not disturb the electrochemical signal
of this LiFePO4, despite the enhancement by rGO of a redox process of DABA (not
observed with pristine DABA). In this respect, we must conclude that the relatively much
faster and reversible LiFePO4 electrochemistry precludes the process of irreversible
oxidation of DABA, especially at fast rates. Finally, our work shows how to harness the
electroactivity of LiFePO4 integrated in a freely flowing nanofluid. It should be noted that
LiFePO4 nanosheets in the nanofluid where not coated with any conducting material.
Yet, they performed better than similarly uncoated nanoparticles integrated in a
conventional electrode. This improved performance must be assigned to the efficient
charge-transfer from current collectors mediated by rGO in the nanofluid.
We feel our present work represents one end of a research line connecting i) well-
dispersed nanofluids (sols) with low viscosity but low energy density (this work) and ii)
the many paste formulations with higher energy density but poor flowing characteristics
reported in the literature. It is our opinion that a whole new world of opportunities lies in
between: the world of nanopastes, with heavy loads of solid nanoparticles dispersed in
liquids, yet with the particles stabilized to avoid agglomeration, thus keeping the interface
between solid and liquid domains effectively active at the nanodimension.

Desing of novel electroactive nanofluids for flow cell
Chapter 6. From hybrid Nanofluid to hybrid cells. The rGO/DABA-LiFePO4 system Page | 162
References
1. P. Leung, A.A. Shah, L. Sanz, C. Flox, J.R. Morante, Q. Xu, M.R. Mohamed, C. Ponce de León, F.C. Walsh, Recent developments in organic redox flow batteries: A critical review, J. Power Sources, 360 (2017) 243-283.
2. Q. Huang, Q. Wang, Next-Generation, High-Energy-Density Redox Flow Batteries, ChemPlusChem, 80 (2015) 312-322.
3. G.L. Soloveichik, Flow Batteries: Current Status and Trends, Chem. Rev., 115 (2015) 11533-11558.
4. Z. Yang, J. Zhang, M.C.W. Kintner-Meyer, X. Lu, D. Choi, J.P. Lemmon, J. Liu, Electrochemical Energy Storage for Green Grid, Chem. Rev., 111 (2011) 3577-3613.
5. L. Hoober-Burkhardt, S. Krishnamoorthy, B. Yang, A. Murali, A. Nirmalchandar, G.K.S. Prakash, S.R. Narayanan, A New Michael-Reaction-Resistant Benzoquinone for Aqueous Organic Redox Flow Batteries, J. Electrochem. Soc., 164 (2017) A600-A607.
6. M.O. Bamgbopa, Y. Shao-Horn, S. Almheiri, The potential of non-aqueous redox flow batteries as fast-charging capable energy storage solutions: demonstration with an iron-chromium acetylacetonate chemistry, Journal of Materials Chemistry A, 5 (2017) 13457-13468.
7. D. Rueda-García, D.P. Dubal, F. Huguenin, P. Gómez-Romero, Hurdles to organic quinone flow cells. Electrode passivation by quinone reduction in acetonitrile Li electrolytes, J. Power Sources, 350 (2017) 9-17.
8. M. Duduta, B. Ho, V.C. Wood, P. Limthongkul, V.E. Brunini, W.C. Carter, Y.-M. Chiang, Semi-Solid Lithium Rechargeable Flow Battery, Advanced Energy Materials, 1 (2011) 511-516.
9. V. Presser, C.R. Dennison, J. Campos, K.W. Knehr, E.C. Kumbur, Y. Gogotsi, The Electrochemical Flow Capacitor: A New Concept for Rapid Energy Storage and Recovery, Advanced Energy Materials, 2 (2012) 895-902.
10. S. Sasi, A. Murali, S.V. Nair, A.S. Nair, K.R.V. Subramanian, The effect of graphene on the performance of an electrochemical flow capacitor, Journal of Materials Chemistry A, 3 (2015) 2717-2725.
11. M. Boota, K.B. Hatzell, M. Alhabeb, E.C. Kumbur, Y. Gogotsi, Graphene-containing flowable electrodes for capacitive energy storage, Carbon, 92 (2015) 142-149.
12. M. Duduta, B. Ho, V.C. Wood, P. Limthongkul, V.E. Brunini, W.C. Carter, Y.M.
Chiang, Semi‐Solid Lithium Rechargeable Flow Battery, Advanced Energy
Materials, 1 (2011) 511-516.
13. S. Hamelet, T. Tzedakis, J.-B. Leriche, S. Sailler, D. Larcher, P.-L. Taberna, P. Simon, J.-M. Tarascon, Non-Aqueous Li-Based Redox Flow Batteries, J. Electrochem. Soc., 159 (2012) A1360-A1367.

Desing of novel electroactive nanofluids for flow cell
Chapter 6. From hybrid Nanofluid to hybrid cells. The rGO/DABA-LiFePO4 system Page | 163
14. H. Chen, N.-C. Lai, Y.-C. Lu, Silicon–Carbon Nanocomposite Semi-Solid Negolyte and Its Application in Redox Flow Batteries, Chem. Mater., 29 (2017) 7533-7542.
15. L. Madec, M. Youssry, M. Cerbelaud, P. Soudan, D. Guyomard, B. Lestriez, Surfactant for Enhanced Rheological, Electrical, and Electrochemical Performance of Suspensions for Semisolid Redox Flow Batteries and Supercapacitors, ChemPlusChem, 80 (2015) 396-401.
16. M. Boota, K.B. Hatzell, M. Beidaghi, C.R. Dennison, E.C. Kumbur, Y. Gogotsi, Activated Carbon Spheres as a Flowable Electrode in Electrochemical Flow Capacitors, J. Electrochem. Soc., 161 (2014) A1078-A1083.
17. J.W. Campos, M. Beidaghi, K.B. Hatzell, C.R. Dennison, B. Musci, V. Presser, E.C. Kumbur, Y. Gogotsi, Investigation of carbon materials for use as a flowable electrode in electrochemical flow capacitors, Electrochim. Acta, 98 (2013) 123-130.
18. Q. Huang, H. Li, M. Gratzel, Q. Wang, Reversible chemical delithiation/lithiation of LiFePO4: towards a redox flow lithium-ion battery, PCCP, 15 (2013) 1793-1797.
19. S. Sen, V. Govindarajan, C.J. Pelliccione, J. Wang, D.J. Miller, E.V. Timofeeva, Surface Modification Approach to TiO2 Nanofluids with High Particle Concentration, Low Viscosity, and Electrochemical Activity, ACS Applied Materials & Interfaces, 7 (2015) 20538-20547.
20. D.P. Dubal, P. Gomez-Romero, Electroactive graphene nanofluids for fast energy storage, 2D Materials, 3 (2016) 031004.
21. D.P. Dubal, D. Rueda‐Garcia, C. Marchante, R. Benages, P. Gomez‐Romero,
Hybrid Graphene‐Polyoxometalates Nanofluids as Liquid Electrodes for Dual
Energy Storage in Novel Flow Cells, The Chemical Record, 0.
22. L. Xu, J.-W. McGraw, F. Gao, M. Grundy, Z. Ye, Z. Gu, J.L. Shepherd, Production of High-Concentration Graphene Dispersions in Low-Boiling-Point Organic Solvents by Liquid-Phase Noncovalent Exfoliation of Graphite with a Hyperbranched Polyethylene and Formation of Graphene/Ethylene Copolymer Composites, The Journal of Physical Chemistry C, 117 (2013) 10730-10742.
23. H. Wei, Y.-Y. Li, J. Chen, Y. Zeng, G. Yang, Y. Li, Dispersion of Reduced Graphene Oxide in Multiple Solvents with an Imidazolium-Modified Hexa-peri-hexabenzocoronene, Chemistry – An Asian Journal, 7 (2012) 2683-2689.
24. A.K. Padhi, K.S. Nanjundaswamy, J.B. Goodenough, Phospho‐olivines as
Positive‐Electrode Materials for Rechargeable Lithium Batteries, J.
Electrochem. Soc., 144 (1997) 1188-1194.
25. J. Hassoun, F. Bonaccorso, M. Agostini, M. Angelucci, M.G. Betti, R. Cingolani, M. Gemmi, C. Mariani, S. Panero, V. Pellegrini, B. Scrosati, An Advanced Lithium-Ion Battery Based on a Graphene Anode and a Lithium Iron Phosphate Cathode, Nano Lett., 14 (2014) 4901-4906.
26. N.J. Dudney, Thin Film Micro-Batteries, Electrochem. Soc. Interface, 17 (2008).

Desing of novel electroactive nanofluids for flow cell
Chapter 6. From hybrid Nanofluid to hybrid cells. The rGO/DABA-LiFePO4 system Page | 164
27. S. Kashyap, S. Mishra, S.K. Behera, Aqueous Colloidal Stability of Graphene Oxide and Chemically Converted Graphene, Journal of Nanoparticles, 2014 (2014) 6.
28. W. Porcher, P. Moreau, B. Lestriez, S. Jouanneau, D. Guyomard, Is LiFePO4 Stable in Water?: Toward Greener Li–Ion Batteries, Electrochem. Solid-State Lett., 11 (2008) A4-A8.
29. A.J. Bard, L.R. Faulkner, Electrochemical Methods: Fundamentals and Applications, Wiley, New York, 2001.
30. Z. Cabán-Huertas, O. Ayyad, D.P. Dubal, P. Gómez-Romero, Aqueous synthesis of LiFePO4 with Fractal Granularity, Scientific Reports, 6 (2016) 27024.
31. Y.-N. Xu, S.-Y. Chung, J.T. Bloking, Y.-M. Chiang, W.Y. Ching, Electronic Structure and Electrical Conductivity of Undoped LiFePO4, Electrochem. Solid-State Lett., 7 (2004) A131-A134.
32. N. Ravet, Y. Chouinard, J.F. Magnan, S. Besner, M. Gauthier, M. Armand, Electroactivity of natural and synthetic triphylite, J. Power Sources, 97–98 (2001) 503-507.
33. A. Fedorková, A. Nacher-Alejos, P. Gómez-Romero, R. Oriňáková, D. Kaniansky, Structural and electrochemical studies of PPy/PEG-LiFePO4 cathode material for Li-ion batteries, Electrochim. Acta, 55 (2010) 943-947.
34. A.V. Murugan, T. Muraliganth, A. Manthiram, Microwave-Irradiated Solvothermal Synthesis of LiFePO4 Nanorods and their Nanocomposites for Lithium Ion Batteries, ECS Transactions, 16 (2009) 49-56.
35. P. Tang, N.A.W. Holzwarth, Y.A. Du, Comparison of the electronic structures of four crystalline phases of FePO4, Physical Review B, 76 (2007) 174118.
36. A. Fedorkova, R. Orinakova, A. Orinak, M. Kupkova, H.D. Wiemhofer, J.N. Audinot, J. Guillot, Electrochemical and XPS study of LiFePO4 cathode nanocomposite with PPy/PEG conductive network, Solid State Sciences, 14 (2012) 1238-1243.
37. R. Saito, A. Jorio, A.G. Souza Filho, G. Dresselhaus, M.S. Dresselhaus, M.A. Pimenta, Probing Phonon Dispersion Relations of Graphite by Double Resonance Raman Scattering, Phys. Rev. Lett., 88 (2001) 027401.
38. R. Saito, M. Hofmann, G. Dresselhaus, A. Jorio, M.S. Dresselhaus, Raman spectroscopy of graphene and carbon nanotubes, Adv. Phys., 60 (2011) 413-550.

Desing of novel electroactive nanofluids for flow cell
Chapter 7. New and Improved Cell and Method for the production of Graphene by Electrochemical Exfoliation of Graphites Page | 165
CHAPTER 7
New and Improved Cell
and Method for the
production of Graphene
by Electrochemical
Exfoliation of Graphites

Desing of novel electroactive nanofluids for flow cell
Chapter 7. New and Improved Cell and Method for the production of Graphene by Electrochemical Exfoliation of Graphites Page | 166

Desing of novel electroactive nanofluids for flow cell
Chapter 7. New and Improved Cell and Method for the production of Graphene by Electrochemical Exfoliation of Graphites Page | 167
7.1 Context
All graphene nanofluids previously described are actually based on reduced
graphene oxide (rGO) dispersed in aqueous acidic electrolytes. As it was described in
the chapter of quinones nanofluids, organic electrolytes can provide larger working
voltages and therefore greater energy densities. However, we could no stabilize rGO in
organic solvents. As a consequence, we decided to use graphene instead rGO. But in
order to have a fine control of the nature of the graphene obtained (in terms of number
of layers, absence or concentration and type of defects and oxygen), we decided to
produce it by electrochemical exfoliation of graphite. This task turned out to be more
challenging and at the same time more fruitful than anticipated and led us to a simple
but original design and procedure which merited the filing of a European patent,
described in this chapter.
7.2 State of the art
Great advances are being made in several fields like energy generation and
storage, electronics, photonics, composites, sensors and bio applications thanks to the
extraordinary properties of graphene1,2, but these advances need the implementation of
procedures for large scale synthesis of graphene with truly controlled purity and
structural and physical properties3.
Electrochemical exfoliation emerged as a prominent method able to produce
large quantities of high quality few layers graphene4 (FLG) and other materials like
graphite oxide5,6, graphene quantum dots7,8 or functionalized graphene9,10. Although
much research has been carried out related to the electrochemical exfoliation of
graphene11, reported studies have focused mainly on the electrolyte and potential
applied, whereas the influence of the C precursor has been generally ignored4,10–15.
The strategy followed when using aqueous electrolytes is generally based on an
anodic exfoliation with a Pt current collector. O2 gas generation in the anode promotes
the exfoliation process by the oxidation of (at least) the edges of the graphene layers
that induce an expansion of the interlayer space so that ions can get into graphite more
easily10,16,17.
Neutral sulfate electrolytes have been widely used because they show the best
exfoliation yield although they also lead to a high concentration of oxygen and defects

Desing of novel electroactive nanofluids for flow cell
Chapter 7. New and Improved Cell and Method for the production of Graphene by Electrochemical Exfoliation of Graphites Page | 168
on the product10,16,18,19. Actually, several different electrolytes have been studied in order
to prevent the oxidation of graphene, using additives that inhibit graphene oxidation20,21,
surfactans22 or using alternative electrolytes10,11,14,23.
On the other hand, electrochemical exfoliation of graphite in organic electrolytes
generally produces better quality graphene with less defects and oxygen than for
aqueous electrolytes. With organic electrolytes, in addition to anodic exfoliation24
cathodic exfoliation is also used25, furthermore simultaneous anodic and cathodic
exfoliation have been also studied26,27 proving that the product generated in the cathode
presents less defects and less oxygen than the product generated in the anode28.
Organic electrolytes have typically included salts of large ions24,25,28–31, but also
with ionic liquids27,32 and even molten salts33,34.
On the other hand, the effect of the precursor carbon materials used has received
little attention in comparison with the exfoliation mechanism and conditions. Indeed,
there are very few works focusing on the carbon precursor35 or studying in a systematic
way the influence of different carbon precursors under the same experimental
conditions15,23,36,37. There are even some reports in which it is not properly specified
which was the carbon material used5,21,38,39, which shows the little importance that in
general it receives as a variable to consider for the exfoliation process.
As it will be shown in this work, the influence of the type of graphite material used
as precursor for the exfoliation is huge, and affects the conditions needed for the
exfoliation, the yield of the exfoliated material and the quality of the product.
Consequently, a soft and thin graphite will be prone to exfoliation under a wider range of
experimental conditions, whereas a compact, rigid and thick electrode would need
extremely harsh conditions to be exfoliated, thus resulting in final graphene products with
more oxygen and defects.
J.M.D. Tascon and col.36 tackled this issue by studying the effect of four different
carbon materials under anodic exfoliation, the materials were: Highly Oriented Pyrolytic
Graphite (HOPG), rigid C flake, flexible C foil and C pellets made by compression of
graphite powder with a hydraulic press in 0.1M K2SO4 aqueous electrolyte at 10V. By
SEM analysis before and after the exfoliation of the materials they observed that HOPG
and rigid C flake present a clearly more compact structure and consequently low
expansion and delamination of the materials were observed. On the other hand, flexible
C foil and C pellets showed larger expansion and delamination as a result of their lower
compaction. In addition, flexible C foil showed greater exfoliation than the C pellet. This
was explained considering that the small particles conforming the pellet lost the electrical

Desing of novel electroactive nanofluids for flow cell
Chapter 7. New and Improved Cell and Method for the production of Graphene by Electrochemical Exfoliation of Graphites Page | 169
contact due to its expansion at a very early step of the exfoliation process. Consequently,
exfoliation processes were faster and thus more effective for C pellets (3 min) and flexible
C foil (15 min) than rigid C flake and HOPG (60min each). Moreover, C pellets showed
the lowest oxygen content (determined by XPS) and the lower amount of defects
(determined by Raman) followed by flexible C foil, rigid C flake and finally HOPG. It
should be noted the large amount of defects that shows the rigid C flake and particularly
HOPG which D band is the most intense band in its Raman spectra. Another important
result showed by J.M.D Tascon and col. is the increase of the oxygen content in the
products as exfoliation time increases.
In a more recent paper by the same group,23 Munuera et al. reported the
exfoliation of graphene with halide aqueous electrolytes looking for a non-oxidative
electrolyte. In this work they used HOPG, rigid graphite flake, and flexible C foil. They
found that under those conditions the exfoliation process only works with flexible C foil.
A SEM analysis of the materials before and after the exfoliation showed that due to the
more compacted structure of HOPG and rigid graphite flake they were not able to be
expanded and thus exfoliated by the electrolytes tested.

Desing of novel electroactive nanofluids for flow cell
Chapter 7. New and Improved Cell and Method for the production of Graphene by Electrochemical Exfoliation of Graphites Page | 170
7.3 Patent
Awarded in the Open Innovation Nanotech of Tokyo with the Technology
Transfer award as part of CSIC portfolio awarded

Desing of novel electroactive nanofluids for flow cell
Chapter 7. New and Improved Cell and Method for the production of Graphene by Electrochemical Exfoliation of Graphites Page | 171
Brief description of the invention
The present invention solves the problems described above, since it refers an
electrolytic cell with a horizontal arrangement of the electrodes and a procedure for the
fabrication of graphene from any type of graphite, including soft cheap graphitic materials
such as powdered graphite.
This allows for an exfoliation process needing much less energy and time than
those required for more compact materials which in turn implies a process less
aggressive leading to a product with very small amounts of defects and oxygen and at a
reduced cost.
Thus, in a first embodiment, the present invention refers to an electrolytic cell for
the fabrication of graphene by means of electrochemical exfoliation of graphite (hereafter
the electrolytic cell of the present invention), comprising a first electrode and a second
electrode linked through a circuit, and separated by a given distance between each other,
and being both first and second electrodes immersed in a liquid electrolyte contained in
a vessel, characterized in that the first electrode and the second electrode are arranged
in horizontal parallel planes as a functional condition for the fabrication of graphene, in
which the first electrode is placed in a plane above the second electrode, with the second
electrode presenting a confinement zone where the graphite to be exfoliated will be
contained, with the mentioned confinement zone being bounded by a confining non-
conducting material (such as a polymeric circular ring).
In a particular embodiment of the present invention, the confinement zone
comprises a compacting element arranged in a plane parallel to the second electrode
and in contact with the graphite to be exfoliated. More in particular, the compacting
element is constituted by a porous non-conducting material, more in particular being a
porous polymeric film. In a more particular embodiment the compacting element is made
of filter paper.
In a particular embodiment of the present invention the first and second
electrodes of the electrolytic cell of the present invention are arranged in parallel planes.
More in particular the first and second electrodes of the electrolytic cell of the present
invention are arranged at a distance between them of at least 1mm.
The electrodes of the present invention can be made of any conducting material
as long as they are not oxidized at high voltages. In a particular embodiment, the first
and second electrodes of the electrolytic cell of the present invention are made of the
same material. More in particular, the first and second electrodes of the electrolytic cell

Desing of novel electroactive nanofluids for flow cell
Chapter 7. New and Improved Cell and Method for the production of Graphene by Electrochemical Exfoliation of Graphites Page | 172
of the present invention are made of platinum. In another particular embodiment of the
present invention, the first and second electrodes of the electrolytic cell of the present
invention are made of glassy carbon.
In another particular embodiment of the present invention, the graphite to be
exfoliated in the electrolytic cell of the present invention is graphite powder.
In another particular embodiment of the present invention, the graphite powder
is mixed with solid particles of a non-oxidizable conducting material. More in particular,
the solid particles of non- oxidizable material are selected from glassy carbon and
platinum. More in particular, the mixture of graphite powder with solid particles of non-
oxidizable material contains between 5-95% (in volume) of graphite powder. In another
particular embodiment of the present invention, the graphite powder is contained in a
conducting porous material resistant to oxidation at high voltages. In another particular
embodiment of the present invention the electrolyte is an electrolyte not leading to a
stable dispersion of graphene.
When we refer to an electrolyte in the present invention we mean organic and/or
aqueous electrolytes.
In a second embodiment, the present invention refers to a procedure for the
fabrication of graphene by means of the electrochemical exfoliation of graphite in an
electrolytic cell as described in the present invention (hereafter procedure of the present
invention), characterized by the following steps:
a) Place the material to be exfoliated in the confinement zone on the second
electrode.
b) Apply a voltage to initiate the electrolytic process, in a more particular
embodiment a voltage comprised between 3-15V is applied for a time comprised
between 0.5-120 minutes during which the reactor is purged with a flow of inert
gas in order to eliminate the possible gases generated during the reaction.
c) Wash the product obtained after the electrolysis of step b in order to eliminate the
electrolyte. In a more particular aspect the washing is made by filtering.
In a particular embodiment, voltage is applied in the form of pulses. More in
particular, voltage is applied in the form of long pulses (10s to 1 min) of small voltages
(1-5V) alternating with short pulses (1-10s) of high voltages (10-15V).

Desing of novel electroactive nanofluids for flow cell
Chapter 7. New and Improved Cell and Method for the production of Graphene by Electrochemical Exfoliation of Graphites Page | 173
Description of the figures
Figure 1 is a schematic view showing the elements forming one of the
embodiments of the electrolytic cell of the present invention.
Figure 1
Figure 2 is a schematic view showing the elements forming one of the
embodiments of the electrolytic cell of the present invention including the compacting
element (9).

Desing of novel electroactive nanofluids for flow cell
Chapter 7. New and Improved Cell and Method for the production of Graphene by Electrochemical Exfoliation of Graphites Page | 174
Figure 2
Figure 3 is a schematic view showing the elements forming one of the
embodiments of the electrolytic cell of the present invention including the compacting
element (9) and the graphite powder mixed with non-oxidizable solid particles.

Desing of novel electroactive nanofluids for flow cell
Chapter 7. New and Improved Cell and Method for the production of Graphene by Electrochemical Exfoliation of Graphites Page | 175
Figure 3
Description of a preferred embodiment of the invention
According to one form of realization, the electrolytic cell (1) for the fabrication of
graphene by electrochemical exfoliation of graphite (6) comprises essentially a first
electrode (2) a second electrode (3) linked and separated from each other, being both
first and second electrodes (2), (3) immersed in a liquid electrolyte (7) contained in a
vessel (8) made of a suitable material.
The first electrode (2) and the second electrode (3) are arranged horizontally as
a functional condition to obtain graphene in which the first electrode (2) is placed in a
plane above the second electrode (3).
In a more detailed description of the second electrode (3), the second electrode
(3) presents a confinement zone (4) where the graphite to be exfoliated (6) is placed,
with that confinement zone (4) bounded by a confining non-conducting material (5).

Desing of novel electroactive nanofluids for flow cell
Chapter 7. New and Improved Cell and Method for the production of Graphene by Electrochemical Exfoliation of Graphites Page | 176
Preferably, the graphitic material to be exfoliated (6) is graphite powder, although any
other suitable material could be used for the same end.
As shown in figure 1, the first electrode (2) and the second electrode (3) are linked
(though the external circuit) and separated by at least a 1 mm gap, with the first electrode
(2) placed in a plane above the second electrode (3) an arranged in parallel planes. Both
electrodes (2, 3) must be made of a conducting material resistant to oxidation at high
voltages, with both electrodes (2, 3) made of platinum in this particular embodiment.
The system described in the present invention assures the obtention of few-
layers graphene from graphite powder, using substantially lower voltages than those
published in the literature and in a period of time much shorter, all of which represents a
great reduction in the overall energy needed to carry out the process. Furthermore,
thanks to the low voltages and short processing times needed, the concentrations of
oxygen and defects in the final graphene are minimal. This is made possible thanks to
the horizontal arrangement of the electrode on which the graphite powder is deposited,
since in this configuration graphite particles are always in contact with the current
collector.
The specific design of the electrolytic cell of the present invention allows for the
use of graphite powder in such a way that during the electrochemical exfoliation process
a flow of material from the electrode is generated, with larger, heavier particles being
deposited by gravity in the confinement zone, in contact with the second electrode,
whereas the lighter exfoliated material is displaced to the surface.
Thus, in addition to reducing the use of energy, time and production costs, the
cell and procedure of the present invention allows for an automatic reutilization of poorly
exfoliated material without any pre-treatment through a feedback system which could
lead to yields close to 100%.

Desing of novel electroactive nanofluids for flow cell
Chapter 7. New and Improved Cell and Method for the production of Graphene by Electrochemical Exfoliation of Graphites Page | 177
Abstract
The present invention relates to an electrolytic cell (1) for obtaining graphene by
electrolytic exfoliation of graphite (6), comprising a first electrode (2) and a second
electrode (3) linked and spaced apart, and both electrodes submerged in a liquid
electrolyte (7) contained in a vessel (8), where both electrodes (2, 3) are arranged
parallel and in a horizontal plane in a functional condition where graphene is obtained,
in which the first electrode (2) is located right above the second electrode (3), the second
electrode (2) presenting a confinement zone (4) (materialized by a confining non-
conductive material(5)) in which the graphite (6) to be exfoliated is contained,. The
invention also relates to the process for obtaining few-layers graphene in said electrolytic
cell
Claims
1. Electrolytic cell (1) for the fabrication of graphene by electrochemical
exfoliation of graphite (6), comprising a first electrode (2) and a second electrode (3)
linked and separated and being both first and second electrode (1), (2) immersed in a
liquid electrolyte (7) contained in a vessel (8), characterized in that the first electrode (2)
and the second electrode (3) are arranged in a horizontal plane as a functional condition
for the obtention of graphene, in which the first electrode (2) is placed in a plane above
de second electrode (3), with the second electrode (3) featuring a confinement zone (4)
in which the graphite (6) to be exfoliated can be placed, with that confinement zone (4)
being delimited by a confining non-conducting material (5).
2. Electrolytic cell (1) according to claim 1, in which the confinement zone
includes a compacting element (9) arranged in a plane parallel to the second electrode
(3) and in contact with the graphite (6) to be exfoliated.
3. Electrolytic cell (1) according to any of the claims 1-2, in which the first and
second electrodes (2), (3) are arranged in planes parallel between them.
4. Electrolytic cell (1) according to any of the claims above, in which the
electrodes are separated by a distance of at least 1mm.
5. Electrolytic cell (1) according to any of the claims above, in which the first
electrode (2) and/or the second electrode (3) are made of platinum.
6. Electrolytic cell (1) according to any of the claims above, in which the graphite
to be exfoliated is in the form of graphite powder.

Desing of novel electroactive nanofluids for flow cell
Chapter 7. New and Improved Cell and Method for the production of Graphene by Electrochemical Exfoliation of Graphites Page | 178
7. Electrolytic cell (1) according to claim 6, in which the graphite powder is mixed
with solid particles of a conducting non-oxidizable material.
8. Electrolytic cell (1) according to any of the claims above, in which the
electrolyte leads to a non-stable dispersion of graphene.
9. Procedure for the fabrication of graphene by electrolytic exfoliation of a
graphitic material in an electrolytic cell (1) according to any of the claims 1-8,
characterized by comprising the following steps:
a) place the material to be exfoliated (6) in the confinement zone (4) on
the second electrode (3),
b) apply a voltage leading to the electrolytic process,
c) wash or purify the product obtained after the electrolysis carried out in
step b).
10. Procedure for the fabrication of graphene according to claim 9, in which the
material to be exfoliated (6) is graphite powder.
11. Procedure for the fabrication of graphene according to any of the claims 9-
10, in which in step b) a voltage comprised between 3-15 V, is applied for a period of
time comprised between 0.5-120 minutes,
13. Procedure for the fabrication of graphene according to any of the claims 9-
11, in which the voltage is applied in the form of pulses.

Desing of novel electroactive nanofluids for flow cell
Chapter 7. New and Improved Cell and Method for the production of Graphene by Electrochemical Exfoliation of Graphites Page | 179
7.4 Results
Exfoliation of graphite powder in the electrolytic cell with a compacting element
and conducting particles mixed with the graphite powder to be exfoliated.
In an example of realization, an electrolytic cell (1) was set up, formed by
a first electrode (2) and a second electrode (3) (in the present case the positive
electrode) both made of platinum and arranged in a planar configuration
separated by 10 mm, both immersed in a container filled with an electrolyte made
of a 0.1M (NH4)2SO4 aqueous solution. A compacting element (9) was included
in the confinement zone as shown in figure (3). The confined zone contained
0.05g of graphite powder mixed with 0.2g of small glassy carbon.
Next, a 3 V voltage was applied, and 3 electrolysis times were tested: 3, 5
and 10 minutes. The products were then filtered off using a PTFE filter (0.2µm
pore size) and washed with water and acetone to remove remaining electrolyte
salt, then weighed.
As an additional procedure, the better exfoliated fraction was separated
from the rest by extraction with DMF, DMAc or NMP as it is described in the
literature. In the present case the product was dispersed in DMF and left to stand
for 24h in such a way that only few-layer graphene did not precipitate.
Finally, the precipitated fraction was collected, dried and weighed in order
to determine the amount of few-layer graphene produced by weight difference.
The by-product not fully exfoliated could be used again as starting material
for a new exfoliation process without the need of any special treatment.
Product characterization
Few drops of the stable graphene dispersion where dropped on a Ni (with
also a bit of Cu) holey carbon grid, after one night all the DMF was evaporated
and then samples where exanimated in the TEM:

Desing of novel electroactive nanofluids for flow cell
Chapter 7. New and Improved Cell and Method for the production of Graphene by Electrochemical Exfoliation of Graphites Page | 180
3V 3min:
Fig.4 Up TEM images, left-bottom SAED image, right-bottom in situ EDX of the few layers graphene
produced at 3V in 3min.

Desing of novel electroactive nanofluids for flow cell
Chapter 7. New and Improved Cell and Method for the production of Graphene by Electrochemical Exfoliation of Graphites Page | 181
3V 5min:
Fig.5 Up TEM images, left-bottom SAED image, right-bottom in situ EDX of the few layers
graphene produced at 3V in 5min.

Desing of novel electroactive nanofluids for flow cell
Chapter 7. New and Improved Cell and Method for the production of Graphene by Electrochemical Exfoliation of Graphites Page | 182
3V 10 min:
Fig.6. Up TEM images, left-bottom SAED image, right-bottom in situ EDX of the few layers graphene
produced at 3V in 10min.
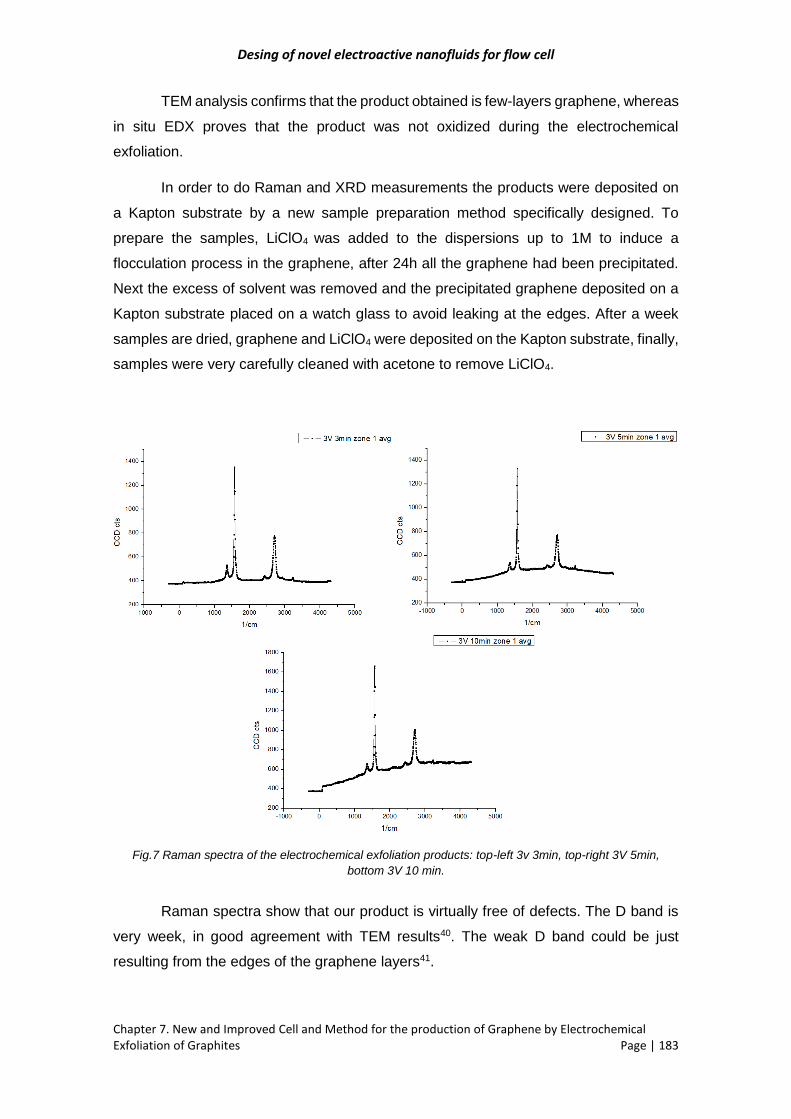
Desing of novel electroactive nanofluids for flow cell
Chapter 7. New and Improved Cell and Method for the production of Graphene by Electrochemical Exfoliation of Graphites Page | 183
TEM analysis confirms that the product obtained is few-layers graphene, whereas
in situ EDX proves that the product was not oxidized during the electrochemical
exfoliation.
In order to do Raman and XRD measurements the products were deposited on
a Kapton substrate by a new sample preparation method specifically designed. To
prepare the samples, LiClO4 was added to the dispersions up to 1M to induce a
flocculation process in the graphene, after 24h all the graphene had been precipitated.
Next the excess of solvent was removed and the precipitated graphene deposited on a
Kapton substrate placed on a watch glass to avoid leaking at the edges. After a week
samples are dried, graphene and LiClO4 were deposited on the Kapton substrate, finally,
samples were very carefully cleaned with acetone to remove LiClO4.
Fig.7 Raman spectra of the electrochemical exfoliation products: top-left 3v 3min, top-right 3V 5min,
bottom 3V 10 min.
Raman spectra show that our product is virtually free of defects. The D band is
very week, in good agreement with TEM results40. The weak D band could be just
resulting from the edges of the graphene layers41.

Desing of novel electroactive nanofluids for flow cell
Chapter 7. New and Improved Cell and Method for the production of Graphene by Electrochemical Exfoliation of Graphites Page | 184
Fig.8 XRD of graphene samples and graphite base product, bottom picture is an inset of the graphene
diffractograms.

Desing of novel electroactive nanofluids for flow cell
Chapter 7. New and Improved Cell and Method for the production of Graphene by Electrochemical Exfoliation of Graphites Page | 185
XRD results show a small, but clear, displacement of the 002 peak in graphite to
slightly smaller angles in graphene (from 26.65º in the graphite sample to 26.57º in the
graphene samples). In addition, a shoulder can be appreciated in the graphene peaks at
the same position of the graphite peak. These results prove that the inter-planar spacing
in the graphene samples is a bit larger than in graphite42 this suggest a different
microcrystalline structure in graphene43. In addition the shoulder of the graphene peaks
at the same position than the peak of the graphite suggest that the graphene produced
have also part of the same structure than graphite, thus it present a non-uniform
multilayer distribution44,45.
These results fit with the data of the Raman spectra and the TEM/EDX that shows
no defects and oxidation in our graphene. If our graphene would be oxidized and/or
present a high concentration of defects on its structure the displacement of the 002 peak
in the XRD would be clearly larger, more than 10º for GO, and peak width would be
clearly larger46,47.
Moreover, it should also be pointed out that for the recording of the XRD of
graphene produced, a similar mass to that of graphite was used and it was also
measured on a Kapton film. Therefore, the big difference in intensity recoded between
graphite and graphene samples is not due to a large difference in mass, which could
corroborate that our product has few layers.
Our current prototype should be improved because it doesn’t allow to keep under
a minimum pressure the graphite powder, which is not completely sealed into the cell
(figure 9). As a consequence, poor electrical conductivity between carbon particles still
limits the efficiency of the exfoliation process

Desing of novel electroactive nanofluids for flow cell
Chapter 7. New and Improved Cell and Method for the production of Graphene by Electrochemical Exfoliation of Graphites Page | 186
Fig.9 Prototype of the electrochemical cell patented, could be observed that is a very simple cell with
important issue in order to be assembled and to keep seal and under pressure the graphite to be exfoliate.
Due to the limitations of the current prototype no significant differences in yield
were observed between the 3 times tested, yield was measured by two methods:
- Weight difference between the product collected from the exfoliation process
and the product initially precipitated after dispersion in DMF (after 24h).
- Transmittance measurements of the stable dispersions obtained
However, there is one order of magnitude of difference between these two
methods, probably because the small amounts of sample obtained induces big errors in
the weigh process.
By weigh difference the concentration of the graphene dispersions obtained
where:
- 3 minutes: 0.48 g·L-1
- 5 minutes: 0.79 g·L-1
- 10 minutes: 0.88 g·L-1
And the concentration calculated by the Beer–Lambert law (Ɛ = 1390 L·g-1·m-1)48:
- 3 minutes: 0.05 g·L-1
- 5 minutes: 0.08 g·L-1
- 10 minutes: 0.04 g·L-1

Desing of novel electroactive nanofluids for flow cell
Chapter 7. New and Improved Cell and Method for the production of Graphene by Electrochemical Exfoliation of Graphites Page | 187
We are confident that with the optimization of the design mentioned above and the
scaling up of the set-up and procedure these values will improve substantially in the
future.
References
1. Bonaccorso, F. et al. Graphene, related two-dimensional crystals, and hybrid systems for energy conversion and storage. Science (80-. ). 347, (2015).
2. Novoselov, K. S. et al. A roadmap for graphene. Nature 490, 192–200 (2012).
3. Zhong, Y. L., Tian, Z., Simon, G. P. & Li, D. Scalable production of graphene via wet chemistry: Progress and challenges. Mater. Today 18, 73–78 (2015).
4. Low, C. T. J., Walsh, F. C., Chakrabarti, M. H., Hashim, M. A. & Hussain, M. A. Electrochemical approaches to the production of graphene flakes and their potential applications. Carbon N. Y. 54, 1–11 (2013).
5. Ambrosi, A. & Pumera, M. Electrochemically Exfoliated Graphene and Graphene Oxide for Energy Storage and Electrochemistry Applications. Chem. - A Eur. J. 22, 153–159 (2016).
6. Sorokina, N. E., Maksimova, N. V. & Avdeev, V. V. Anodic oxidation of graphite in 10 to 98% HNO3. Inorg. Mater. 37, 360–365 (2001).
7. Huang, H. et al. Electrochemical Cutting in Weak Aqueous Electrolytes: The Strategy for Efficient and Controllable Preparation of Graphene Quantum Dots. Langmuir 34, 250–258 (2018).
8. Wang, X., Sun, G., Li, N. & Chen, P. Quantum dots derived from two-dimensional materials and their applications for catalysis and energy. Chem. Soc. Rev. 45, 2239–2262 (2016).
9. Chuang, C. H. et al. A green, simple and cost-effective approach to synthesize high quality graphene by electrochemical exfoliation via process optimization. RSC Adv. 5, 54762–54768 (2015).
10. Paredes, J. I. & Munuera, J. M. Recent advances and energy-related applications of high quality/chemically doped graphenes obtained by electrochemical exfoliation methods. J. Mater. Chem. A 5, 7228–7242 (2017).
11. Wu, W., Zhang, C. & Hou, S. Electrochemical exfoliation of graphene and graphene-analogous 2D nanosheets. J. Mater. Sci. 52, 10649–10660 (2017).
12. Yu, P., Lowe, S. E., Simon, G. P. & Zhong, Y. L. Electrochemical exfoliation of graphite and production of functional graphene. Curr. Opin. Colloid Interface Sci. 20, 329–338 (2015).
13. Abdelkader, A. M., Cooper, A. J., Dryfe, R. A. W. & Kinloch, I. A. How to

Desing of novel electroactive nanofluids for flow cell
Chapter 7. New and Improved Cell and Method for the production of Graphene by Electrochemical Exfoliation of Graphites Page | 188
get between the sheets: A review of recent works on the electrochemical exfoliation of graphene materials from bulk graphite. Nanoscale 7, 6944–6956 (2015).
14. Yang, S., Lohe, M. R., Müllen, K. & Feng, X. New-Generation Graphene from Electrochemical Approaches: Production and Applications. Adv. Mater. 6213–6221 (2016). doi:10.1002/adma.201505326
15. Coroş, M. et al. Simple and cost-effective synthesis of graphene by electrochemical exfoliation of graphite rods. RSC Adv. 6, 2651–2661 (2016).
16. Parvez, K., Wu, Z., Li, R., Liu, X. & Graf, R. Exfoliation of Graphite into Graphene in Aqueous Solutions of inorganic salts. J. Am. Chem. Soc. (2014). doi:10.1021/ja5017156
17. Hofmann, M., Chiang, W. Y., D Nguyn, T. & Hsieh, Y. P. Controlling the properties of graphene produced by electrochemical exfoliation. Nanotechnology 26, (2015).
18. Wu, L. et al. Powder, paper and foam of few-layer graphene prepared in high yield by electrochemical intercalation exfoliation of expanded graphite. Small 10, 1421–1429 (2014).
19. Su, C. Y. et al. High-quality thin graphene films from fast electrochemical exfoliation. ACS Nano 5, 2332–2339 (2011).
20. Chen, C. H., Yang, S. W., Chuang, M. C., Woon, W. Y. & Su, C. Y. Towards the continuous production of high crystallinity graphene via electrochemical exfoliation with molecular in situ encapsulation. Nanoscale 7, 15362–15373 (2015).
21. Yang, S. et al. Organic Radical-Assisted Electrochemical Exfoliation for the Scalable Production of High-Quality Graphene. J. Am. Chem. Soc. 137, 13927–13932 (2015).
22. Alanyalioǧlu, M., Segura, J. J., Oró-Sol, J. & Casañ-Pastor, N. The synthesis of graphene sheets with controlled thickness and order using surfactant-assisted electrochemical processes. Carbon N. Y. 50, 142–152 (2012).
23. Munuera, J. M. et al. Electrochemical Exfoliation of Graphite in Aqueous Sodium Halide Electrolytes toward Low Oxygen Content Graphene for Energy and Environmental Applications. ACS Appl. Mater. Interfaces 9, 24085–24099 (2017).
24. Najafabadi, A. T. & Gyenge, E. High-yield graphene production by electrochemical exfoliation of graphite: Novel ionic liquid (IL)-acetonitrile electrolyte with low IL content. Carbon N. Y. 71, 58–69 (2014).
25. Yang, Y. et al. Electrochemically triggered graphene sheets through cathodic exfoliation for lithium ion batteries anodes. RSC Adv. 3, 16130–16135 (2013).
26. Chakrabarti, M. H. et al. One-pot electrochemical gram-scale synthesis of graphene using deep eutectic solvents and acetonitrile. Chem. Eng. J.

Desing of novel electroactive nanofluids for flow cell
Chapter 7. New and Improved Cell and Method for the production of Graphene by Electrochemical Exfoliation of Graphites Page | 189
274, 213–223 (2015).
27. Lu, J. et al. One-Pot Synthesis of Fluorescent Carbon Graphene by the Exfoliation of Graphite in Ionic Liquids. ACS Nano 3, 2367–2375 (2009).
28. Najafabadi, A. T. & Gyenge, E. Synergistic production of graphene microsheets by simultaneous anodic and cathodic electro-exfoliation of graphitic electrodes in aprotic ionic liquids. Carbon N. Y. 84, 449–459 (2015).
29. Cooper, A. J., Wilson, N. R., Kinloch, I. A. & Dryfe, R. A. W. Single stage electrochemical exfoliation method for the production of few-layer graphene via intercalation of tetraalkylammonium cations. Carbon N. Y. 66, 340–350 (2014).
30. Abdelkader, A. M., Kinloch, I. A. & Dryfe, R. A. W. Continuous electrochemical exfoliation of micrometer-sized graphene using synergistic ion intercalations and organic solvents. ACS Appl. Mater. Interfaces 6, 1632–1639 (2014).
31. Xia, Z. Y. et al. Synergic exfoliation of graphene with organic molecules and inorganic ions for the electrochemical production of flexible electrodes. Chempluschem 79, 439–446 (2014).
32. Abdelkader, A. M., Patten, H. V., Li, Z., Chen, Y. & Kinloch, I. A. Electrochemical exfoliation of graphite in quaternary ammonium-based deep eutectic solvents: a route for the mass production of graphane. Nanoscale 7, 11386–11392 (2015).
33. Kim, H. K., Kamali, A. R., Roh, K. C., Kim, K. B. & Fray, D. J. Dual coexisting interconnected graphene nanostructures for high performance supercapacitor applications. Energy Environ. Sci. 9, 2249–2256 (2016).
34. Kamali, A. R. & Fray, D. J. Large-scale preparation of graphene by high temperature insertion of hydrogen into graphite. Nanoscale 7, 11310–11320 (2015).
35. Sharief, S. A., Susantyoko, R. A., Alhashem, M. & Almheiri, S. Synthesis of few-layer graphene-like sheets from carbon-based powders via electrochemical exfoliation, using carbon black as an example. J. Mater. Sci. 52, 11004–11013 (2017).
36. Munuera, J. M. et al. High quality, low oxygen content and biocompatible graphene nanosheets obtained by anodic exfoliation of different graphite types. Carbon N. Y. 94, 729–739 (2015).
37. Marković, Z. M. et al. Semi-transparent, conductive thin films of electrochemical exfoliated graphene. RSC Adv. 6, 39275–39283 (2016).
38. Liu, Z. et al. Ultraflexible In-Plane Micro-Supercapacitors by Direct Printing of Solution-Processable Electrochemically Exfoliated Graphene. Adv. Mater. 28, 2217–2222 (2016).
39. Bakhshandeh, R. & Shafiekhani, A. Ultrasonic waves and temperature effects on graphene structure fabricated by electrochemical exfoliation method. Mater. Chem. Phys. 212, 95–102 (2018).

Desing of novel electroactive nanofluids for flow cell
Chapter 7. New and Improved Cell and Method for the production of Graphene by Electrochemical Exfoliation of Graphites Page | 190
40. Seehra, M. S., Narang, V., Geddam, U. K. & Stefaniak, A. B. Correlation between X-ray diffraction and Raman spectra of 16 commercial graphene–based materials and their resulting classification. Carbon N. Y. 111, 380–385 (2017).
41. Ni, Z., Wang, Y., Yu, T. & Shen, Z. Raman spectroscopy and imaging of graphene. Nano Res. 1, 273–291 (2008).
42. Barnakov, C. N., Khokhlova, G. P., Popova, A. N., Sozinov, S. A. & Ismagilov, Z. R. XRD characterization of the structure of graphites and carbon materials obtained by the low-temperature graphitization of coal tar pitch. Eurasian Chem. J. 17, 87–93 (2015).
43. Li, Z. Q., Lu, C. J., Xia, Z. P., Zhou, Y. & Luo, Z. X-ray diffraction patterns of graphite and turbostratic carbon. Carbon N. Y. 45, 1686–1695 (2007).
44. Andonovic, B., Ademi, A., Grozdanov, A., Paunović, P. & Dimitrov, A. T. Enhanced model for determining the number of graphene layers and their distribution from X-ray diffraction data. Beilstein J. Nanotechnol. 6, 2113–2122 (2015).
45. Andonovic, B. et al. Laue functions model vs scherrer equation in determination of graphene layers number on the ground of XRD data. J. Chem. Technol. Metall. 49, 545–550 (2014).
46. June, P., Eq, A. & Eq, A. An Introduction to Graphene Plasmonics Erratum. 1–2 (2016).
47. Seehra, M. S., Geddam, U. K., Schwegler-Berry, D. & Stefaniak, A. B. Detection and quantification of 2H and 3R phases in commercial graphene-based materials. Carbon N. Y. 95, 818–823 (2015).
48. Hernandez, Y. et al. Liquid Phase Production of Graphene by Exfoliation of Graphite in Surfactant/Water Solutions. J. Am. Chem. Soc. 131, 3611–3620 (2009).

Desing of novel electroactive nanofluids for flow cell
Chapter 8. Conclusions Page | 191
CHAPTER 8
CONCLUSIONS

Desing of novel electroactive nanofluids for flow cell
Chapter 8. Conclusions Page | 192

Desing of novel electroactive nanofluids for flow cell
Chapter 8. Conclusions Page | 193
General conclusions
In this thesis, a wide variety of materials have been studied with the common goal
of improving the capability of flow cells fluids to store energy. Given this variety that
spans from molecular species (both organic and inorganic) to extended phases
(inorganic and carbons) it might seem difficult to extract a general conclusion.
Nevertheless, when we consider the knowledge gained as a result of our work, we could
make some general statements about the different approaches that could be taken in
order to improve a parameter in principle so simple as the solubility of the active species.
Indeed, both for quinones and for POMs and for LiFePO4 we were aiming at increasing
the concentration of our fluids and found many unexpected problems, like spurious
reactions of bare quinones or limited stability of LiFePO4 dispersions. It should be
stressed though, that in all cases our work led to the proposal of alternative ways to guide
the path to this final objective (steric protection in quinones, stabilization with DABA of
rGO-LiFePO4 in the latter case). Furthermore, a very important general conclusion of this
Thesis is that we have been able to demonstrate how to utilize electroactive solid phases,
properly dispersed in electrolyte solutions (in itself a difficult task), for energy storage in
a novel type of flow cells. A proof of concept with important implications.
Specific conclusions. In addition to the conclusions published in each of the
articles, we present here an extended list of more detailed conclusions for each of the
works described. Since the last article presented (Energies, 2019) is itself an extended
overview and discussion of our research work in graphene nanofluids, no specific
conclusions have been written corresponding to this article.

Desing of novel electroactive nanofluids for flow cell
Chapter 8. Conclusions Page | 194
Organic quinone solutions
Lithium ion has a strong impact in the electrochemical mechanism of quinones in
aprotic solvents. Contrary to the behavior previously reported for other cations,
the two electrons involved in the reduction of the quinone molecule are
transferred at almost the same potential. This represents a mechanism very
similar to that found in protic solvents, and leads to an improved electrochemical
reversibility.
When small non-hindered quinones are reduced in organic Li electrolytes, a
reversible green coating is formed on the electrode at negative overpotentials. It
is due to the formation of an ionic pair between reduced quinones and Li+, which
can be dissolved in the solution with mild stirring.
The same green coating was obtained by the chemical oxidation of Li metal with
a solution of small unhindered quinones.
The rate of formation of the green coating is proportional to the quinone
hindrance. Smaller quinones with no steric hindrance present the highest
generation speed, whereas large and bulky quinones will not generate the green
coating.
The green coating acts as a passivating layer and prevents the completion of
quinone reduction on the electrode. Larger negative overpotentials induce a
polymerization process of the quinones on the green layer, leading to an insoluble
product with a resistance lower than the initial green layer, but larger than the
electrode.
The formation of the green coating does not depend on the presence of oxygen.
On the other hand, the mechanism of the subsequent redox polymerization is
different in the presence or absence of oxygen.
Despite an improved electrochemical reversibility of quinones in aprotic Li+
electrolytes (reduced separation of redox waves as Li+ concentration increases),
effective reoxidation does not take place due to the precipitation of a large fraction
of the reduced quinone-Li2 generated.
Larger and bulky quinones can be used in electroactive solutions to avoid the
unwanted processes described and to ensure good stability over time. However,
large and bulky quinones have poorer solubility in polar solvents. The
combination of these two factors is at the heart of the difficulties to use quinones
as active species for energy storage in organic electroactive fluids.

Desing of novel electroactive nanofluids for flow cell
Chapter 8. Conclusions Page | 195
Hybrid rGO-POM nanofluids
Hybrid rGO-POM materials have a homogenous distribution of POMs on the rGO
layers, POMs are not crystallized on the rGO.
rGO and rGO-POMs aqueous dispersions have a small viscosity, in the range
1.2-1.8 mPa·s, close to the value of water (1.0 mPa·s).
The nanofluids with 0.025 wt% of rGO-POM (both for PMo12 and PW12) showed
greater long-term stability as compared with 0.1 and 0.4 wt%.
These nanofluids showed high values of specific capacitance both when studied
by CV (Maximum specific capacitance values of 306 F/g(rGO-PMo12) and 273
F/g(rGO-PW12) for 0.025% rGO-POM at a scan rate of
5 mV/s) as well as through charge discharge cycles (223 F/g(rGO-PMo12) and
208 F/g(rGO-PW12) at current density of 4 A/g). These values are comparable or
even better than those found for related solid electrodes.
Flowing improves the specific capacitance per gram of active material with
respect to static conditions. 10ml/min was found to be the optimal flow rate,
although this parameter would heavily depend on the cell design.
rGO aqueous dispersions in acidic electrolytes showed very fast charge transfer
(could cycle up to 10V/s and charge and discharge at 16 A/g) utilizing all of the
active material dispersed, thus, performing as conventional supercapacitors but
with flowing design.
POM addition to rGO allows to increase the working potential window, thus
increasing the power density of the nanofluid (specific power between 2-8
kW/kgrGO-POM) (with specific power for rGO between 0.45-1.0 kW/ kgrGO ).
POM addition to rGO increases the capacity and as a result the energy density
of the nanofluid increases. (between 8-29 Wh/kgrGO-POM as compared to between
5-15 Wh/kgrGO for the parent rGO)
Good cyclability was observed, cycle efficiency was 77-79% after 2000 charge
discharge cycles at different current densities.
Relative low stability of the dispersion was observed despite low content of active
material and use of surfactant, precipitation begins after 10h.
Despite the good intrinsic performance, the low effective concentration of solid
active nanoparticles results in nanofluids with low volumetric and mass energy
density.

Desing of novel electroactive nanofluids for flow cell
Chapter 8. Conclusions Page | 196
DABA-rGO and DABA-rGO-LiFePO4 nanofluids
rGO was successfully dispersed in water by addition of DABA. The optimal
dispersion, with a ratio DABA:rGO of 40:1, showed a great stability and low
viscosity (1.055 mPa·s), starting to precipitate after 97h.
DABA and rGO interact through π-π interactions, thus solved DABA molecules
hold graphene dispersed and preclude rGO restacking.
rGO enhances an irreversible oxidation process of DABA, not observed for pure
DABA. This constitutes a proof of the strong interaction between DABA and rGO.
DABA-rGO nanofluids showed an excellent charge transfer capability, allowing
for an effective and complete charge-discharge of pure LiFePO4 NPs added to
the nanofluid. Those particles showed no electrochemical response with no
DABA-rGO in the nanofluid.
The addition of LiFePO4 NPs to the nanofluid reduced and even made disappear
(depending on the scan rate velocity, DABA peak is reduced as the scan rate
increases) the redox peak of DABA enhanced by rGO. We believe that is
because the fast and reversible redox process of LiFePO4 precludes the
irreversible redox process of DABA, which in turn is only possible thanks to rGO.
We have demonstrated the feasibility to fully charge and discharge insulating
nanoparticles such as LiFePO4 (not coated by carbon or any other conductive
agent) dispersed into the nanofluid. This confirms that a percolation effect exists
between rGO layers which allows to transfer charge through all the volume.
Addition of LiFePO4 reduces the stability of the nanofluid to 24 h approximately,
even when low concentrations of NPs were used. As a result, our nanofluid has
a low volumetric and mass energy density, since greater concentrations of
LiFePO4 would result in unstable dispersions.
An asymmetric balanced cell was setup with DABA-rGO as negative and DABA-
rGO-LiFePO4 as positive electrodes (electrolyte…) demonstrating the feasibility
to combine purely capacitive nanofluids with hybrid capacitive-faradaic ones.

Desing of novel electroactive nanofluids for flow cell
Chapter 8. Conclusions Page | 197
Graphene from the electrochemical exfoliation of graphite
The type of graphite used as graphene precursor is the most important variable
to consider in an electrochemical exfoliation to fabricate graphene. Even under
the same exfoliation conditions (i.e. voltage, electrolyte and time), different
precursors can lead to very different products (i.e. number of layers and amount
of oxygen/defects) and very different exfoliation yields.
Harder exfoliation conditions will promote more oxygen and defects in the
exfoliated products. However, these hard conditions would not ensure high
exfoliation yields because it would depend on the precursor.
Hard and thick carbon precursors would be very difficult to exfoliate; only harsh
conditions would exfoliate this kind of materials. As a consequence of this harsh
conditions, large amounts of oxygen and defects would be present on the
exfoliated product. Consequently, the resulting products could be considered
closer to a reduced graphene oxide in the best cases and graphene oxide in the
worst.
On the other hand, soft and thin carbon precursors would be very easy to
exfoliate at any conditions. Due to the low energy needed to exfoliate this kind of
precursors, very few defects and oxygen will be present into the exfoliated
product. Moreover, for these precursors exfoliation processes would be faster
than for hard and thick precursors.
Conventional electrochemical exfoliation setups (based on the electrode
positioned vertically and immersed in the electrolyte) present the serious
drawback of the loss of non-exfoliated material resulting from the breaking and
detachment of part of the electrodes during the exfoliation process.
Graphite powder can be directly exfoliated into graphene. As a matter of fact, it
can be the precursor more easily exfoliated, needing lower voltages and times
and thus, consuming less energy and time, and leading altogether to a product
with a minimum amount of oxygen and defects.
Nevertheless, a powder cannot be exfoliated in available electrochemical cells
because it would just get dispersed in the electrolyte. A new and specific
electrochemical cell has been designed in order to allow for the exfoliation of
powders.
A horizontal cell configuration has been demonstrated as an effective
configuration to exfoliate powders. Specifically, a suitable current collector was
placed on the bottom of a cavity in which the powder to be exfoliated was placed.

Desing of novel electroactive nanofluids for flow cell
Chapter 8. Conclusions Page | 198
Carbon powders have a deficient contact between the particles during the
exfoliation. As a consequence, two solutions were implemented in the horizontal
cell design in order to improve the electrical conductivity between carbon
particles. First, a cover/holder was added to the cavity that at the same time
allowed for an applied pressure to the powder, compacting it in the cavity.
Second, the carbon powder to be exfoliated was mixed with glassy carbon macro-
microscopic particles in order to get conductive particles that would not be
exfoliated and could provide electrons from the current collector during all the
exfoliation process.

Desing of novel electroactive nanofluids for flow cell
Appendix. Resumen en Castellano Page | 199
APPENDIX
RESUMEN EN
CASTELLANO

Desing of novel electroactive nanofluids for flow cell
Appendix. Resumen en Castellano Page | 200

Desing of novel electroactive nanofluids for flow cell
Appendix. Resumen en Castellano Page | 201
Desarrollo de nuevos nanofluidos electroactivos para celdas
de flujo
Las celdas de flujo van camino de convertirse en una pieza clave para el
almacenamiento de energía eléctrica (EES) gracias a su idoneidad como dispositivos
de nivelación de carga, contribuyendo así al desarrollo de una red inteligente que pueda
compensar la intermitencia de las fuentes de energía renovables. Hasta hace poco, las
celdas de flujo se habían limitado a las baterías de flujo redox (RFB), donde el
almacenamiento de energía está dado por las reacciones redox de los iones disueltos.
Muy recientemente, se han propuesto nuevos tipos de electrodos líquidos basados en
un mecanismo de almacenamiento capacitivo (condensadores de flujo electroquímicos
o EFC). Nuestro grupo ha sido uno de los laboratorios pioneros en este tipo de nuevas
celdas de flujo basadas en nanofluidos electroactivos. La presente Tesis ha tenido como
objetivo aprovechar la actividad de especies electroactivas bien conocidas (quinonas,
grafeno, polioxometalatos, LiFePO4) en nuevos nanofluidos electroactivos. Una parte
importante de nuestra estrategia ha sido el diseño de formulaciones y sistemas híbridos
que pudieran combinar mecanismos de almacenamiento faradaico (redox) y capacitivo
(doble capa) para mejorar el rendimiento de las celdas de flujo resultantes.
En la introducción de esta tesis se ha realizado una revisión y perspectiva
ampliadas de las tecnologías de celdas de flujo electroquímicas y sus posibles líneas de
evolución. Con esto se presentan el estado del arte, los problemas a resolver y las
diferentes soluciones propuestas para estas tecnologías. Además, también mostramos
nuestro punto de vista y perspectivas para estas tecnologías y el almacenamiento de
energía eléctrica en general. Por ello esta parte constituye la parte principal de la
introducción y una parte fundamental de esta tesis para entender los objetivos,
motivaciones y el trabajo realizado.
En el capítulo 4 se estudiaron los fundamentos electroquímicos de las quinonas
en electrolitos orgánicos con sal de litio. Los mecanismos electroquímicos de las
quinonas se han descrito ampliamente en la bibliografía pero en medios acuosos. En
este trabajo, los estudiamos en un electrolito orgánico en un intento de aprovechar la
mayor solubilidad y las ventanas de potencial más amplias disponibles en este medio.
Encontramos y describimos en detalle varios problemas que impiden el funcionamiento
reversible de las quinonas en los electrolitos orgánicos con Li+ que, a su vez, impiden
su uso en celdas de flujo en esas condiciones.
En el capítulo 5 se describe la síntesis, caracterización y rendimiento
electroquímico de materiales híbridos basados en óxido de grafeno reducido (rGO) y

Desing of novel electroactive nanofluids for flow cell
Appendix. Resumen en Castellano Page | 202
polioxometalatos dispersos en un electrolito acuoso (H2SO4) para producir un
nanofluido. Estos nanofluidos presentan baja viscosidad y muestran una respuesta
electroquímica ultrarrápida e hibrida, con contribución tanto capacitiva del rGO como
faradaica de los polioxometalatos. Demostrando así su funcionamiento como fluidos de
almacenamiento de energía con plena carga y descarga de todo el material sólido
disperso.
El sexto capítulo presenta un nuevo tipo de nanofluido basado en rGO. En lugar
de usar tensioactivos convencionales como en el capítulo descrito anteriormente,
disolvimos una molécula aromática capaz de estabilizar el rGO en un electrolito acuoso
mediante interacciones de tipo π-π. Con este enfoque logramos un gran aumento en la
estabilidad del nanofluido. Además, este nuevo nanofluido también mostró una gran
capacidad de transferencia de carga, como lo demuestra el hecho de que permite que
se produzca actividad redox de nanopartículas de LiFePO4 (sin recubrimento conductor)
simplemente dispersas en el nanofluido. Por lo tanto, gracias a la presencia de rGO en
el nanofluido, los electrones podrían alcanzar las nanopartículas dispersas y, por lo
tanto, cargarse y descargarse de manera efectiva y completa, algo que no es posible en
nanofluidos que contienen solo nanopartículas de LiFePO4.
La síntesis de grafeno también se ha estudiado en profundidad en esta tesis tal
y como se puede ver en el capítulo 7, dado que el objetivo final es producir materiales
que se puedan usar en aplicaciones reales, asegurarse de que los materiales con los
que se trabaja se pueden producir en cantidades grandes, mediante métodos escalables
y elementos abundantes es también importante. Como resultado, se ha desarrollado y
patentado un nuevo método para la producción de grafeno por exfoliación
electroquímica de grafito. En esta tesis se presenta la patente, un resumen de los
resultados obtenidos y el estado del arte del método de exfoliación electroquímica de
grafeno.
En esta tesis hemos demostrado el potencial de los nanofluidos en el
almacenamiento de energía electroquímica. A partir de los resultados mostrados aquí,
podemos inducir conclusiones generales importantes sobre los efectos extendidos de
pequeñas cantidades de sólidos en todo el volumen del nanofluido. Hemos demostrado
que las dispersiones estables de rGO en agua pueden transferir la carga a través de
todo el volumen de nanofluidos, lo que hace que todo el nanofluido actúe como un
electrodo supercondensador que almacena la carga a través de un mecanismo
capacitivo. De hecho, el nanofluido acuoso rGO mostró una transferencia de carga
extremadamente rápida, pudiendo realizar ciclos a 10V·s-1. Gracias a esta rápida

Desing of novel electroactive nanofluids for flow cell
Appendix. Resumen en Castellano Page | 203
transferencia de carga, pudimos cargar y descargar por completo nanopartículas activas
redox dispersas de LiFePO4 y detectar claramente picos redox incluso a 25 mV·s-1.
Además, al dopar el rGO con especies redox activas moleculares como los
polioxometalatos, desarrollamos sistemas híbridos con potencia y capacidad mejoradas
con respecto al nanofluido rGO puro. Finalmente, demostramos que los nanofluidos de
rGO acuosos pueden mejorar su estabilidad al disolver una molécula aromática (DABA)
capaz de estabilizar rGO mediante interacciones π-π manteniendo su buena
conductividad eléctrica. Todo esto ha sido posible manteniendo la viscosidad de los
nanofluidos desarrollados muy cerca de los disolventes originales, lo que facilitará su
aplicación final en dispositivos de flujo real. Por otro lado, la baja concentración de
nanopartículas de grafeno podría ser una desventaja para la aplicación de estos
materiales en dispositivos de alta densidad de energía. Por lo tanto, aumentar la carga
de nanopartículas electroactivas es un objetivo importante.
En resumen, hemos diseñado y preparado nanofluidos basados en grafeno pero
también en híbridos de grafeno. Hemos mostrado en esta descripción general cómo
estos novedosos materiales de nanofluidos pueden presentar rendimientos
sobresalientes incluso en el caso de sistemas muy diluidos. Hemos demostrado efectos
no lineales, que conducen a propiedades notables con pequeñas cantidades de grafeno
dispersas en los nanofluidos. Por lo tanto, nuestro trabajo subraya el sólido potencial de
estos sistemas para el almacenamiento de energía.