development of instructional material to · pdf filei development of instructional material to...
TRANSCRIPT

i
DEVELOPMENT OF INSTRUCTIONAL MATERIAL TO IMPROVE MIDDLE SCHOOL RULER READING
BY
Karen A Schrage
A Research Paper
Submitted in Partial Fulfillment of the Requirements for the
Master of Science Degree With a Major in
Technology Education
Approved: 2 Semester Credits
___________________________________ Investigation Advisor
The graduate School University of Wisconsin-Stout
December, 2000The Graduate School

ii
ii
University of Wisconsin-Stout Menomonie, WI 54751
ABSTRACT
________Schrage_____________________Karen___________________A.__________ (Writer) (Last Name) (First) (Initial _____Development of instructional material to improve middle school ruler reading____ (Title) Technology education Dr. Kenneth Welty December, 2000 150_______ (Graduate Major) (Research Advisor) (Month/Year) (No. of Pages) _______________American Psychological Association Style Manual________________
Over the years, teachers have complained about the students’ inability to use a ruler.
Nationwide mathematics tests have confirmed that half of eighth grade students can not
read a ruler more accurately than one quarter of an inch. This research study tested the
capability of a self-developed teaching aid to improve ruler- reading skills in middle
school students.
This quantitative study began with a pilot test using a self-developed ruler reading
assessment. This assessment was used with two classes of eight grade students at South
Middle School, Eau Claire, Wisconsin. The results of the pilot study gave direction to
the type of teaching aids needed to improve ruler-reading skills in middle school. The
teaching aids were developed. A pretest and posttest were administered to two six-grade
graphic communication classes at Chippewa Falls Middle School. The teaching aids
were used as a self-paced homework program. The difference between the pretest and
the posttest indicated the amount of skills learned with ruler reading.

iii
iii
TABLE OF CONTENTS
INTRODUCTION Background of the Problem ……………….……………………… 1 Statement of the Problem …………………………………………… 3 Purpose of the Study …………………………...…………………… 3 Questions ……………………………………...……………………. 3 Justification for the Study ...………………………………………… 4 Definition of Terms ……………………….…...…………………… 5
REVIEW OF LITERATURE
Development of a Child’s Concepts of Length and Measurement … 8 Length ………………………………………..……………..………. 8 Measurement ……………………………………………………….. 9 Deficiencies Middle School Students have with Ruler Reading …… 14 Strategies used in Middle School Ruler Reading ……..………..…… 17 Instructional Materials ……..……………………………………….. 19 Summary ……………………………………………………………. 21
METHOD
Research Design ……………………………………………………. 23 Sample Selection ………………………………………………… 25 Instrumentation …………………………………………………… 25 Perspective of Ruler Reading Test (pretest/posttest) ……………… 26 Procedures ………………………………………………………… 27 Statistical Analysis …………………………….…………………… 27 Limitations of the Study …………………………………………… 32
RESULTS
Demographic Information ……………….………………………… 34 Pretest/Posttest …………….………………..……………………… 38
Section one: recognizing parts to whole ……….…………… 38 Section two: drawing parts to whole ……..………………… 39 Section three: dividing a line ……………………………… 41 Section four: meaning of lines ……………………………… 42 Section five: reading lines ……….………………………… 43 Section six: measuring efficiently ………….……………… 44 Section seven: measuring lines ……….….………………… 45 Section eight: estimating and measuring objects …………… 47
Summary of Study ………….……………………………………… 50 Discussion ………………………..………………………………… 55
SUMMARY, CONCLUSIONS AND RECOMMENDATIONS
Summary ………………………..…………………………………. 57 Purpose of Study …………………………………………………… 58 Research Questions ………………….……………………………… 58

iv
iv
Research Method …………………………………………………… 59 Findings ……………………………….……………………………. 60 Subsection finding ……………………..…………………………… 60 Total test ……………………………….…………………………… 62 Variables ……………………………….…………………………… 63 Recommendations ……………………..…………………………… 63
REFERENCES …………………………………………………………… 66 APPENDIXES
A. Pilot test ………………………………………………………… 71 B. Pretest …………………………………………………………… 79 C. Cover sheet …………………………………..………………… 86 D. Posttest …………………………………………….…………… 88 E. Analysis of individual items on test ………………..…………… 95 F. Correct responses for pretest and posttest by student ……..…… 99 G. Mean, median, standard deviation for pretest/posttest ……… 101 H. Ruler reading section one: recognizing parts to whole ………… 103 I. Ruler reading section two: drawing parts to whole ……………… 108 J. Ruler reading section three: dividing a line ……………………… 112 K. Ruler reading section four: meaning of lines …………………… 117 L. Ruler reading section five: reading lines ……………………… 123 M. Ruler reading section six: measuring efficiently ……………… 128 N. Ruler reading section seven: measuring lines ………………… 133 O. Ruler reading section eight: estimating and measuring objects … 138

v
v
LIST OF FIGURES AND TABLES
FIGURES 1. Section one: recognizing parts to whole ………………….. 39 2. Section two: drawing parts to whole …………………… 40 3. Section three: dividing a line …………………………….. 41 4. Section four: meaning of lines ………………………….. 43 5. Section five: reading lines ………………………………. 44 6. Section six: measuring efficiently ………………….….. 45 7. Section seven: measuring lines …………………………… 47 8. a. Section eight: estimating objects ………………………. 48
b. Section eight: measuring objects ……………………….. 50 9. Comparison of missing answers …………………………. 52
TABLES
1. Sample demographics …………………………………… 36 2. Percent of correct answers with 8th and 16ths ……….… 53 3. Percent comparison of performance in reading
measurements with and without a ruler ………………… 53 4. Homework completed compared to pre/posttest
scores change, posttest score, and percent of change from pretest to posttest ………………………………..… 54
1
1
CHAPTER ONE
Introduction
Background of the Problem
Measurement, which contains both a number and a unit of measure, is a concept
that is used daily. It is important for measurement to be done accurately. The Mars
Climate Orbiter, which cost $125 million, did not function correctly in space because
educated scientists mixed up the English and metric measurements (Fordahl, 1999). This
is an example of a costly mistake involving a simple measurement concept.
Measurement is used extensively in government, industry, and business as well as
in our homes and in our leisure activities. The above example demonstrates the
importance of measurement in the space program. In industry, measurement is used in
design, production, quality control, packaging, and shipping. In local business, the clerk
needs to be able to measure chain and plastic sheeting at the hardware store, vacuum
tubing and roll pins at the auto store, lumber and nails at the lumberyard, or fabric and
trim at the quilt shop. In our homes we use measurement to determine where to hang a
picture, if a new car will fit in the garage, and how wide to buy a window shade. Hobbies
that involve making an object, such as woodworking, making models, sewing, and
quilting, often require extensive measuring skills.
In our middle schools linear measurement is used in art, science, math, and
technology education. Many teachers admit that their students are unable to read a ruler
properly. In talking to the teachers, most have avoided the problem because of frustration
in trying to teach ruler-reading skills. One art teacher explained that he found measuring
so frustrating in his classroom, that he avoided measurement in his lesson plans. A math

2
2
teacher admitted that some of his students could not read a ruler, but felt that he needed to
move on in the math curriculum in order to complete the assigned materials. Another
math teacher admitted that she spent more time on understanding the concept of
measuring units using customary units and metric units and the conversion between the
two systems than she spent on teaching the use of the ruler. The technology teacher
assisted students with learning ruler reading, but she did not have a lesson plan in place
that broke the task down into small steps. When she presented the subject of measuring
to the students, they acted as if they were bored.
Many different methods have been used to teach students to read a ruler, yet
efficiency and accuracy in reading a ruler escapes them. This maybe because the
students did not truly understand the concepts when they were taught to them or that they
just forgot the skill when it came time to use it again. Reading a ruler involves eye-hand
coordination, spatial relationships, formalization, and estimating. Ruler reading has
several different sub-concepts that must be master in order to be successful at measuring.
Because students learn in different ways, it may take several different teaching strategies
in order to teach all of the students in the classroom how to read a ruler. When eighth
grade students are presented with the topic of ruler reading, they act bored and complain
that they know this stuff, yet the problem remains that many middle school students
cannot read or use a ruler.
“Forty-seven percent of the 13-year-olds could not measure the length of a pencil to
the nearest quarter of an inch” (Carpenter et. al., 1980, p. 45). In a more complex
situation about half of the seventh graders could not measure a line when the beginning
of the line to be measured was not aligned with the zero point on the ruler (Lindquist,

3
3
1989). The NAEP included a question on a recent eighth grade assessment that asked the
measurement in inches of the length, width, and height of a model doghouse. The results
found that 45% could not answer the three measurements correctly. The answers were 1,
1½”, and 2”(NAEP, 2000).
Statement of the Problem
Almost half of eighth grade students enrolled in Technology Education classes have
not learned to read a ruler at the level needed for success in high school Technology
Education classes because the teaching method was not appropriate for the student’s
learning style. The inability for half the students to read a ruler is documented in national
math performance tests. Discussion with local teachers in the areas of math, science, art,
and technology education reaffirm the problem.
Purpose of the Study
The purpose of the study was to develop and evaluate an instructional unit that
would address the ruler reading deficiencies of middle school students. The results of this
study will add to the current knowledge of how students learn ruler reading. The results
of the study will assist teachers in adapting more effective teaching methods for this
essential topic.
Questions
The questions this study will answer are as follows:
1. To what extent did the materials that were developed effectively help students
recognize parts and whole?
2. To what extent did the materials that were developed effectively help students
draw parts to whole?

4
4
3. To what extent did the materials that were developed effectively help students
divide a line and illustrate a fraction?
4. To what extent did the materials that were developed effectively help students
name the lines on the ruler?
5. To what extent did the materials that were developed effectively help student
read the lines on a ruler?
6. To what extent did the materials that were developed effectively help students
measure efficiently?
7. To what extent did the materials that were developed effectively help students
measure lines?
8. To what extent did the materials that were developed effectively help students
estimate and measure objects?
Justification for the Study
Teachers and students alike continue to have problems and frustration with the
subject of reading a ruler. Teachers may present a fine lesson in ruler reading only to
find out that some students are not ready to learn the skill or that it does not met the needs
of some students learning style. Other teachers may not teach ruler reading because they
do not have the materials, the time, or the ability to break the topic down into small steps.
Students may have not been taught the material in a style that meets their needs, or they
have forgotten the material, or they need a review. Regardless of the reasons, reading a
ruler is a skill that is necessary in work, home, and leisure.
Teaching strategies and instructional materials developed as a result of this study
would be valuable to math, art, and technology teachers. If the evaluation of the learning

5
5
activity were positive, it would be beneficial to determine if other educators could obtain
similar results.
Definition of Terms
Concrete operational: see logico-mathematical abstraction
Conservation of length: “Involves recognizing that the length of an object is not
altered by a change in its spatial position (Hiebert, 1984, p. 19).
Estimating: to make a general calculation without the aid of measuring tools
Formal: see formalization
Formalization: synonym-formal refers to the computation of measurement using
conventional units and their symbolic representation (Heraud, 1989a).
Intuitive: "Refers to a global perception of the notion at hand; it results from a type
of thinking based essentially on visual perception; it provides rough non-numerical
approximations" (Heraud, 1989a, p. 84).
Length: "unmeasured one-dimensional physical magnitude" (Heraud, 1989a, p. 85).
Linear measurement: measurement in a straight line between two points
Logico-mathematical abstraction: (synonym-concrete operational) Is the use of a
measuring standard or units to understand logico-physical abstractions (Heraud, 1989a).
Logico-physical abstraction: Refers to the ability to recognize the length of an
object or line even if figural transformations have been made that tend to give erroneous
information via visual perception (Heraud, 1989a).
Measurement: “Contains both a number and a unit of measure” (Bright, 1976, p.
88).

6
6
Measuring: “The process of comparing an attribute of a physical object to some
unit selected to quantify that attribute” (Bright, 1976, p. 88).
Procedural: “Refers to the acquisition of logico-physical procedures which the
learners can relate to their intuitive knowledge and use appropriately” (Heraud, 1989a, p.
84). Or “Refers to the acquisition of explicit logico-mathematical procedures which the
learner can relate to the underlying preliminary physical concepts and use appropriately”
(Heraud, 1989a, p. 85) also see preoperational.
Preoperational: synonym-procedural (measurement) The first concept in
measurement, which involves unit iteration. (Heraud, 1989a).
Transitivity: “Refers to the ability to deduce a third relationship from two other
relationships” (Kamii, 1995, p. 113).
Unit iteration: Refers to the repeated use of a measuring unit to determine the length
of lines or objects (Kamii, 1995).

7
7
CHAPTER TWO
Chapter Review of Literature
Almost half of eighth grade students enrolled in technology education classes have
not learned to read a ruler at the level needed for success in high school Technology
Education classes because the teaching method was not appropriate for the student’s
learning style. The inability for half the students to read a ruler was documented in
national math performance tests. Discussions with local teachers in the areas of math,
science, art, and technology education reaffirm the problem.
The purpose of the study was to develop and evaluate an instructional unit that
would address the ruler reading deficiencies of middle school students. The results of this
study would add to the current knowledge of how students learn ruler reading. The study
would also assist teachers in adapting more effective teaching methods for this essential
topic.
Two of the standards from the Wisconsin Department of Public Instruction apply to
ruler reading. After the eighth grade, students should be proficient at using tools in
technological designs and they should be able to use skills from other disciplines in the
technological activities (Wisconsin Department of Public Instruction, 1998). Project
2061 sets a benchmark for sixth through eighth grade as being able to calculate the
circumferences and areas of different geometric shapes (American Association for the
Advancement of Science, 1993). With the standards in mind this chapter will look at the
development of a child’s concepts of length and measurement, the problems middle
school students have with ruler reading, strategies used in middle school to teach ruler
reading and the instructional materials used to teach ruler reading.

8
8
Development of a child’s concepts of length and measurement
This section covered the aspects of length, measurement, and ruler reading as they
develop in elementary school students. The terms used to describe the concepts of length
and measurement varies from author to author. Synonyms were noted for some terms
under definitions. The ideas presented here use a consistent set of terminology. The
concept of length was divided into intuitive, procedural, and logico-physical abstraction.
The understanding of measurement was divided into procedural, logico mathematic
abstraction, and formalization.
Intuitive length Length is a description of the physical concepts. It starts at about
age four or five with the children making the comparisons based purely on perception.
Children begin to describe length using terms such as “a little” and “a lot”. Heraud
(1989b) did a study of third grade children on this very issue. He gave the children a
group of straws with lengths varying by 3mm in order by size and asked them to arrange
them by length. The results showed that 92 percent of the children had no difficulty with
this task.
Procedural length. The next step in understanding length is using procedural length.
This occurs in children between the ages of five and seven. Here the children are
learning to manually bring the objects together for a more accurate comparison. The
comparison is still visual (Steffe & Hirstein, 1976). Children in this stage, for example,
will slide two towers together to compare the height. Heraud (1989a) cites more
advanced examples. In one example the students were given a set of rods that are
arranged in order over length, but with one missing rod. The students are asked to choose
the missing rod by a comparison with those that laid on the table. In another example, the
students were asked to arrange rods in order from long to short. They are given rods that

9
9
are so close together in length that the students must put the rods next to one another in
order to compare their length.
Logico-physical abstraction Logico-physical abstraction is the ability to recognize
the length of a line when added lines change the figure and give erroneous visual
perceptual information (Heraud, 1989a). The classical example in this area is the a pair
of lines, one with arrows on the end of the line pointing in and on the other with arrow at
the end of the line pointing out. Visually the line with the arrows pointing in makes that
line appear to be shorter than the line with the arrows pointing out. Similarly, when two
lines are the same length, but are drawn perpendicular to one another, the vertical line
appears to be longer than the horizontal line. Another example of logico-physical
abstraction is to realize that two rods are the same length even though one is cut up and
the pieces spaced apart. Logico-physical abstraction occurs in a student when he is able
to recognize the situations in which visual perception gives erroneous information as to
length and to then adjust for it.
Measurement
The mathematical concept of measurement consists of three components, which are
procedural, logico-mathematical abstraction, and formalization (Heraud, 1989a).
Learning these concepts is more strongly related to the child’s ability to process
information than to a strong developmental sequence (Boulton-Lewis, 1987). Boulton-
Lewis was measuring the knowledge of children aged 3-7 with respect to measuring.
Sequences were predicted from theory, from review of literature, and from demands of
the tasks. The test results showed that a child’s understanding measurement was best
predicted by the demands of the tasks. The only exceptions were responses with a ruler

10
10
and transitive reasoning, which occurred later than predicted by theory and a review of
literature.
Procedural measurement Procedural measurement involves understanding the unit.
Understanding the unit starts with questions from the student. Eventually the student
begins placing units one after another. As the students get more sophisticated, fewer units
are needed. Finally one unit is used as a measuring standard (Heraud, 1989a). Kamii
(1991) repeated Piaget’s experiment with the lines that are the same length and
perpendicular to one another. She gave the students a block to use as a measuring device.
She noted that around age eight, they began to use the block to measure the length of a
line. Such use of the block was unit iteration. She went on to conduct a unit iteration test
on 383 students in grades one through five. The students were given a block and asked if
they could use it to prove that one line was longer than another. This concept of unit
iteration was understood by: ten percent of first grade, 33 percent of second grade
students, 55 percent of third grade students, 76 percent of fourth grade students and, 78
percent of fifth grade students. Kamii (1995) repeated the above study with two fourth
grade classes. Each class was given a pre/posttest and three days of instruction. The
study found 86 percent of the students were able to demonstrate the logic of unit iteration
at the end of the test. The success rate in this test was ten percent higher than in the study
done by the same author four years earlier. In her conclusion Kamii states that she
thought teaching ruler reading in fourth grade would be appropriate and easy because 86
percent of the students understood unit iteration. Kamii stated, “However, this logic
turned out to be far from sufficient for the learning I expected” (1995, p. 7). She

11
11
continued by saying that more research needs to be done to understand the children’s
thinking about measurement.
Logico-mathematical abstraction Logico-mathematical abstraction is related to
logico-physical abstraction, but it is verified with units. Logico-physical abstraction is
the ability to recognize the length of a line and to adjust for visual perceptual changes
with the use of a rod or a ruler. Logico-mathematical abstraction includes the concepts of
transitivity and conservation of length.
The term transitivity refers to the ability to deduce a third relationship from two
other relationships (Kamii, 1991). Linear measurement depends on the transitive
reasoning (Steffe & Hirstein, 1976). This begins with what is known as body transfer.
Students that are five to seven years old use their body to measure the height of a tower
and compare it to the height of a second tower. The research shows that presence of the
transitivity concept in children four to seven years old is inconsistent in studies (Carey &
Steffe, 1968; Steffe & Carey, 1972; Owens, 1972).
The method used to assess the presence of this abstraction has been based on
figures that tend to give questionable information when judged by a visual means only.
Piaget, Inhelder, and Szeminska (1960) were the leaders in studying students’
understanding of the concept of length. Piaget’s classic examples are: 1) two straws, one
of which is cut into two pieces and placed under and parallel to the first straw, 2)
identical straws perpendicular to each other, and 3) two straws the same length with one
fragmented and placed in a non rectilinear path. The results of his studies showed that
transitive reasoning is evident in some students between five and six, but that fifty
percent of eight years did not display transitive reasoning. Steffe and Hirstein (1976)

12
12
studies seven years old students. They were given a measuring rod and asked to measure
building towers. They were able to do so with encouragement if the measuring rod was
longer than the towers. They were not able to use a measuring rod that was shorter than
the building towers. Kamii (1991) did a similar study with seven year olds. She gave
them a ruler to use. The students found the ruler useless. Piaget’s experiment was
repeated by Heraud (1989a). The results showed that twenty percent of the nine year old
students had difficulties with the concept of logico-physical abstraction. Kamii (1991)
did a study with 383 students in grades 1-5. The students’ understanding of transitivity
increased gradually with grade level. Twenty-nine percent of first grade, 72 percent
second grade, 85 percent third grade, 86 percent fourth grade, and 92 percent of fifth
graders understood the concept of transitivity. It appears that one can successfully teach
students the concept of transitivity in one situation and then find out that the students
have difficulty applying the concept to a closely related problem (Owens, 1972). The
student needs to understand that the actual length of an object being measured does
change as a result of the unit chosen for measurement (Heraud, 1989a). This concept is
referred to as conservation of length (Hiebert, 1984). Heraud (1989b) studied logio-
mathematical abstraction by having eleven third grade students perform two different
tests. The first test compared rods with respect to displacement and the second compared
rods with respect to displacement and unit. The first task involved two rods 12 cm. and 9
cm. The bottom rod was offset about 3 cm. The students were asked to show with a
piece of paper what had to be done with the short rod to make it as long as the longer rod.
The second task involved the same concept with equally marked units on the rods. Five
of the eleven students succeeded on the two tasks. For the other six, they were able to do

13
13
the first task, but became confused with the added units. Three students attempted to
solve the problem by visually looking at the rods. Three students added the unit, but
without taking into account the length of the unit. The concept that the unit can be
different, but once chosen the unit needs to be consistent in the measuring process is not
always comprehended (Heraud, 1989b).
Crucial to understanding measurement is the concept of the relationship between
the unit and the number of units in the measurement. Lindquist (1989) studied this
concept. Almost two-thirds of the third graders knew that it took more of the small units
than large units to equal the length of a given line. However, when she gave this
problem, “Sam reported the length of an object to be 8 of his units, and Sue reported that
its length was 6 of her units” (Lindquist, 1989), over half of the third and seventh graders
named the person who measured the most units as the one using the largest unit. Similar
results were obtained by Bright and Hoeffner (1993).
Formalization Formalization is the last concept in the understanding of
measurement. This concept covers the computation of measurement using conventional
units and their symbolic representation (Heraud, 1989a). After this concept is
understood, ruler reading can begin. According to Heraud, ruler reading involves two
skills: understanding the use of the lines on the ruler and eye hand coordination. Heraud
(1989b) did several studies with ruler reading. His findings included students having
difficulty placing the zero mark of the ruler on the end of the line to be measured and not
understanding the meaning of the numbers on the ruler. Kamii (1991) reported that only
eleven students out of seventy-six fifth grade students were able to use the zero on the
ruler correctly. Difficulty comes from two areas. The first is that students measure from

14
14
the “one” on the ruler instead of from the zero on the ruler. The students state that they
do so because they count 1, 2, 3 not 0, 1, 2, 3. This problem was reported by others
(Heraud, 1989a; Hart et al., 1981; Kamii, 1995). Students also had difficulty knowing if
the zero point was on the end of the ruler or if the zero point was in a small distance in
from the end of the ruler (Hiebert, 1984; Kamii, 1995). The zero point on a ruler is
generally either where the ruler begins, in which case the zero is not marked, or the zero
point is 1/16” to 1/8” in from the end of the ruler, in which case the zero is marked.
Occasionally, a triangular shaped architecture or engineering ruler is used. On these
rulers the zero mark maybe anywhere from 1/16” to three inches in from the end of the
rule.
Measurement can be taught more successfully if estimating is included in the
curriculum. Bright and Hoeffner (1993) stated that practice at estimating helps students
develop flexible and useful concepts. He felt that more experience with estimating was
needed when teaching students ruler reading.
Deficiencies middle school students have with ruler reading
Measurement is a topic in mathematics that is regarded as useful math (Hart et al.,
1981). Measurement is a subdivision of math in which there is a dramatic discrepancy
between opportunity to learn and actual performance (Bright & Hoeffner, 1993). General
reasoning ability is more important than the age of the students in predicting a students’
performance in ruler reading (Bright & Hoeffner, 1993). Many middle school students
have difficulty with the fundamental concepts of measurement. Some students have not
acquired the skills, while others have forgotten them and need the skill to be taught again
(Bright & Hoeffner, 1993; Hart et al., 1981). When reading a ruler, Hiebert (1984) said

15
15
that students often read off the answer without really understanding what the answer
represents. The line being measured represents the distance between the beginning and
end point is not understood. The use of fractions or a ruler made the task of ruler reading
more difficult (Hart et al., 1981). Thirty percent of secondary school students were not
convinced that the length of an object does not change when it is moved and 40 percent
of secondary school students forgot the importance of the type of unit used (Hart et al.,
1981). Another problem was that students counted the number marks on the ruler
including the zero mark, rather than the spaces in between the marks (Bright & Hoeffner
1993; Hart et al., 1981). Hart reported this problem in 10 to 18 percent of 12 year olds he
tested. When teaching secondary students who have not learned the ruler reading skills,
students should be given the opportunity to use such skills to solve real problems (Hart et
al., 1981; Bright & Hoeffner, 1993).
Interesting facts emerged when one examines the national performance assessments
of students. Example one: a ruler was illustrated on a page of the assessment with a line
above the ruler that ran from the number three to the number eight. Fifty percent of the
seventh graders were unable to determine the correct length of the line (Lindquist, 1989).
Example two: even when 9 and 13 year old students knew a concept, they had difficulty
applying it to an actual problem. Eighty-seven percent of 13 year olds knew twelve
inches equals one foot. However, 53 percent of the students could not solve the problem:
“Mr. Hernandez needs a ribbon 6’5” long. How many inches of ribbon does he need”
(Carpenter et al., 1980)? Nine percent of the 13-year-old students could not measure the
length of a line to whole inches. Forty-seven percent of those students could not measure
the line to the nearest ¼” (Carpenter et al., 1980). The newest NAEP math results asked
16
16
the students to measure an object on three different planes. The answers required
precision to ½”. This question had results as follows: 47% correct, 23% partial, 22%
incorrect, 8% omitted item, and 1% off task (NAEP, 2000).
In eighth grade 17 percent of the teachers reported putting a heavy emphasis on
measurement and fifty percent of them reported putting a moderate emphasis on
measurement. It is interesting to note that the students in classes where the teacher
reported putting a moderate degree of emphasis of ruler reading were more proficient in
ruler reading than the students in classes where the teacher reported putting either a heavy
emphasis or little emphasis on ruler reading (Mullis, Dossey, Owen, & Phillips, 1991).
Teachers reported using rulers with 28 percent of eighth grade students on a weekly basis
(Mullis et al., 1991). Carpenter et al. (1980) reported 81 percent of 9 year olds and 91
percent of 13 year olds could measure a line to the nearest whole number on a ruler, even
if the line was longer than the ruler. Lindquist (1989) found that 75 percent of seventh
graders could read a ruler to the nearest quarter of an inch. Carpenter et al. (1980) found
53 percent of 13 year olds could measure the length of a pencil to the nearest quarter of
an inch. Carpenter et al. (1989) went on to comment that a slight change in the context of
the problem revealed that the students had a superficial understanding of the basic
concept of measurement. In a national math test of eighth grade students, 31 percent of
eighth grade students were unable to measure the side of a rectangle (Mullis et al., 1991).

17
17
Strategies used in middle school ruler reading
Measurement is used in many different areas. One area is as important as another.
Steffe and Hirstein (1976) said the areas to be address when teaching measurement are:
cognitive and affective aspects of the individual, social aspects, mathematical content to
be taught, and the method of presenting mathematical content. Many students do not
understand that a ruler is an indirect method of laying down units of length end to end
(Thompson & Van de Walle, 1985). Thompson and Van de Walle (1985) presented ideas
on how to teach ruler reading in the classroom. They started with the units and then
added numbers to the units to help students understand what the numbers meant. Next
they introduced the standard ruler. They explained to the students why the numbers were
written below and not between the longest line and what the other shorter lines represent.
They finally stressed that linear measurement was done by repeatedly laying the unit
length end-to end. Kamii (1995) stressed that it is necessary to make measuring relevant
to students. They need a purposeful reason for learning ruler reading.
Peterson, Ridenour, and Somers (1990) did a study that looked at the relationship
between declarative, conceptual, and procedural knowledge in ruler reading skills. Four
sections of sixth grade industrial arts students at two schools were involved in the study
with two teachers. Two groups were formed. One group was taught by a method that
emphasized an understanding of how the lines on a ruler divide the basic unit into smaller
fractions. The second group was taught by the unit identification method that taught the
students the meaning of the various lengths of the lines. The results showed that the
students who were taught ruler reading by line identification were superior in initial
acquisition and retention of ruler reading skills. The study showed that these students

18
18
used procedural knowledge to infer the conceptual knowledge. The issue not addressed
in the study was that the system taught was specific for a standard U.S. ruler and would
not work with a metric ruler. The authors of this study felt that the line identification
method of teaching ruler reading was also useful in improving the students’
understanding of fractions.
Bright (1976) and Bright and Hoeffner (1993) are authors who did studies about
estimating and measurement. The following ideas are from their papers. Estimation is
the use of units to measure in a mental way. Estimating is an educated guess, not just a
guess. Measuring and estimating are processes; measurements and estimations are
products. Tools are needed for measurements, but not for estimating. There are eight
types of estimating. The two major groups are named objects and unnamed objects.
Under each of the major groups are divisions with the object present or absent and finally
whether or not the unit is present or absent (Bright, 1976). Practice in estimating helps
students to develop flexible and useful concepts (Bright & Hoeffner, 1993). Estimating
starts by asking students to estimate the length of a line or object and then having the
student measure it. By having students compare their estimations to the measurement,
the students are able to improve their skills of estimation. Estimation should be taught
with familiar objects. Students need some understanding of measurement before they can
begin estimating. They need to be encouraged to make reasonable estimates. They need
to use all eight types of estimating, to practice, and continue to practice in order to
maintain their estimating skill (Bright, 1976). Measurement can be taught more
successfully if estimating is part of the instructional activity (Bright, 1976).

19
19
Two studies commented on the fact that measuring should involve actual physical
measurements and that the measurements should be relevant to the children (Kamii,
1995; Bright & Hoeffner, 1993). Hart et al. (1981) stated that there was no information
on the relationship between a student’s practical measuring experiences and the student’s
success in measurement objects. Although Kamii discussed some applications of
practical measuring experiences, she did not formally study its relationship to success.
No research on this topic has been found.
Instructional materials
Two guides for classroom teachers and one textbook were reviewed. The first
guide was for a 50-minute lesson that is a part of a 110-hour high school course on
metals. One of the lesson’s objectives was to teach students to correctly measure with a
tape rule or ruler. Instructional aids included a transparency of a ruler with additional
transparencies to overlay the ruler with divisions of eighths, sixteenths, and thirty-
seconds. The guide also included an outline of a lecture about the divisions of an inch
and an explanation of the lines accompanied the transparencies (Higa, 1986).
The second guide was a program written for instructors serving the occupational
needs of the special need students. The instructional materials were self-paced and self-
contained. The objectives were for the students to identify tools and materials used in
reading and measuring with a ruler, reading the ruler in whole numbers, reading fractions
of an inch on a given ruler, measuring objects with a ruler, and drawing lines and objects
to length using a ruler. This guide started with illustrations of the ruler, tape, and folding
rule. It then explained the uses for each and asked the student to get a ruler. The guide
has illustrations of the ruler with 1”, ½”, ¼”, 1/8”, and 1/16” increments. The caption for

20
20
the illustration said to use the divisions of the ruler and practice reading whole, half,
quarter, eighth, or sixteenth units. The guides then illustrated a folding ruler. The
student was asked to identify the measurement of the fractions indicated in the drawing.
The guide has one page on learning the terms length, width, and height and one page on
drawing lines. Next was a page asking for the identification of the three measuring tools.
The final page was a checklist for the student and instructor to use as the lessons are
completed (Herd, 1981).
Three technology education textbooks were reviewed for their discussion of rulers
and measurement. Living with Technology (Hacker & Barden, 1992) and Technology
Today and Tomorrow (Fales, Kuetemeyer, and Brusic, 1997) do not address the subject
of rulers or measurement. Understanding Technology (Wright & Smith, 1993) does not
discuss ruler measurement. It had one page devoted to measurement, which stated that
measurement created numbers that were useful in solving problems.
Two math textbooks were reviewed. The math textbooks reviewed were a seventh
grade book and an eighth grade book in the same series. The math textbooks were Math
Advantage (Burton & Maletsky, 1998a; 1998b) published by Harcourt Brace and
Company.
The seventh grade textbook index had fourteen citations for “rulers”. Three of
these citations explained using the ruler to draw straight lines with no measuring and four
of these citations were concerned with metric measurements. The remaining citations
explained the use of finding midpoints, ratios, scale, and volume. One page discussed the
terms length and width, and two pages discussed height. The index had citations to seven
pages that discussed length. Of the seven pages, three were devoted toward estimation,

21
21
two and a half pages devoted to the greatest possible error, one half page on estimating
millimeters, and one page contained a problem about the number of 1/2” units in
13’10½”, and one page on metric measurement. The book also contained a conversion
table for metric and customary units (Burton & Maletsky, 1998a).
The eighth grade textbook index also had fourteen citations for “rulers”. Two of the
fourteen pages were metric exercises, three pages discussed using the ruler as a straight
edge, and three pages used the ruler measuring to whole numbers only. In the remaining
five pages, one page discussed measuring to an accuracy level of ¼”, one page discussed
an accuracy level of 1/8”, and three pages discussed an accuracy level of 1/16”. The
index had citation for fifteen pages that discussed length. The textbook’s discussion of
length was divided into three areas. The first area was patterns in measurement systems
and explained conversions between metric units and customary units. The second
explained measuring length and discussed the significant digits. The third discussed the
measurement of the perimeter of geometric shapes. The topics discussed in this area
were algebraic equations for calculating the length of the perimeter, significant digits,
maximum and minimum perimeter, and area with whole numbers, and doubling and
halving in two dimensions.
Summary
The results of the literature search show that most children’s development of the
concept of length can be related to age, but that the development of the concept of
measurement is more related to a child’s ability to process information. Studies show
over and over again that a posttest items presented in a different manner resulted in poor
understanding of measurement concepts. The NAEP’s report of the measurement

22
22
abilities of eighth grade students was not defined by how precise the students can
measure. Forty-seven percent of the 13 year-olds could not measure the length of a
pencil to the nearest quarter of an inch (Carpenter et al., 1980, p.45). Forty five percent
could not measure the longer side of a rectangular floor, the shorter side of a rectangular
floor, and the height from the floor to the highest point of the roof in a model of a
doghouse. The answers to these questions required precision to ½” (NAEP, 2000).
Different people, primarily in the field of mathematics and psychology have developed
programs through research to help students learn to read a ruler. The textbooks in
technology education do not address ruler reading. A seventh and eight grade math series
showed that seventh grade devoted one page to a problem about the number of ½” units
in 13’10 ½”. The eighth grade math book, one page discussed precision of ¼”, one page
1/8”, and three pages 1/16”.
It appears that approximately 50 percent of the students in middle school will
understand the concept of measuring with a ruler and be proficient for their needs in high
school. The other 50 percent will struggle with the concept. Many of these students will
not understand the concept even as adults. Some of these adults will be in positions to
use measurement daily and will be forced to use compensating techniques because they
were never taught the basic skill of reading a ruler.

23
23
CHAPTER THREE
Methods and Procedures
The purpose of this study was to determine the effectiveness of self-paced packets
by statistically comparing the pretest and posttest results. This chapter outlines the
methods and procedures used in this study of middle school students’ ruler reading skills.
The methods and procedures used in this study of ruler reading are explained in this
chapter under the headings of (1) research design, (2) sample selection, (3)
instrumentation, (4) perspectives of testing instrument, (5) procedures, (6) statistical
analysis, and (7) limitations of the study.
Research Design
A review of the literature had identified several findings that were significant to the
design of the research instrument. Pertinent concepts that contributed to the rationale of
the ruler reading were:
• Children’s development of the concept of length was related to age.
• Children’s development of the concept of measurement was related to a child’s
ability to process information.
• Middle school students had difficulty reading a ruler more accurately than ¼”.
• Middle school technology education and math books have very limited to no
coverage on ruler reading.
• Fifty percent of the students in middle school will not be proficient in ruler
reading skill to meet their needs in high school.

24
24
All of these concepts contributed to understanding of the unique nature of learning
to read a ruler by middle school students. Students many not have been ready to
understand the concepts when they were taught to them in elementary school or they
forgot the skill. Ruler reading involves eye-hand coordination, spatial relationships,
formalization, and estimating. It also involves the understanding of the sub-concepts in
order to read a ruler successfully. An attempt was made to identify an existing
measurement instrument for this research, but none was found. The author developed the
measurement instrument used in this research.
The questions this study addressed are as follows:
1. To what extent did the materials that were developed effectively help
students recognize parts and whole?
2. To what extent did the materials that were developed effectively help
students draw parts to whole?
3. To what extent did the materials that were developed effectively help
students divide a line and illustrate a fraction?
4. To what extent did the materials that were developed effectively help
students name the lines on the ruler?
5. To what extent did the materials that were developed effectively help
students read the lines on a ruler?
6. To what extent did the materials that were developed effectively help
students measure efficiently?
7. To what extent did the materials that were developed effectively help
students measure lines?

25
25
8. To what extent did the materials that were developed effectively help
students’ estimate and measure objects?
Sample Selection
A formal sample was not obtained for this study. The populations used in this study
were volunteers obtained through technology education classes. This study had research
done with two different groups of middle school students. The first group of students
was used for the pilot study. This group of students was selected by finding a technology
education teacher who was interested in ruler reading. The pilot study was administered
to two eight-grade technology education classes of Mr. Mike Galloy at South Middle
School in Eau Claire, Wisconsin. This test was administered at the end of the school
year.
The second set of students was selected by the placement of the researcher in a
student teaching assignment. The students were from two sixth grade classes in
technology education at Chippewa Falls Middle School. The first class had fifteen
students and the second twelve students. Of the twenty-seven students, two parents
refused to have their children participate in the study and one student did not complete
the study because he was transferred to another class. In addition to the test, a cover
sheet addressed dependent variables in the areas of gender, age, previous education,
where homework is done, noise, and who helps with homework. Completion of
homework was also a dependent variable.
Instrumentation
The Ruler Reading Test (Appendix A) was developed by the author of this research
and was used as the single instrument of measurement for the pilot study. The results of

26
26
the pilot study were used to determine the instructional material that was developed and
to revise the testing instrument for the pretest and the posttest. The format of the pretest
and the posttest are the same, but the questions vary in some areas. The Ruler Reading
Test in Appendix B was the single instrument of measurement used in the pretest.
Attached to the pretest was a cover sheet (Appendix C), which asked about the dependent
variables. The Ruler Reading Test in Appendix D was the single instrument of
measurement used in the posttest.
The pilot test instrument covered the following areas of ruler reading: recognizing
parts/whole, drawing parts/whole, recognizing length, width, and depth, estimating,
meaning of lines, dividing ruler, reading lines, measuring lines, measuring missing lines,
and measuring objects. The pretest/posttest instrument covered the following areas of
ruler reading: recognizing parts to whole, drawing parts to whole, dividing a line,
meaning of lines, reading lines, measuring efficiently, measuring lines, and estimating
and measuring objects. The test required accuracy to one-sixteenth of an inch. The test
was a pencil and paper test. The students were supplied with the test and a packet
containing a ruler, three objects with which to estimate dimensions, and three objects
with which to measure dimensions. Three samples were done with each subdivision of
ruler reading. The students were allowed approximately thirty-five minutes to complete
the test.
Perspectives of Ruler Reading Test (pretest/posttest)
The Ruler Reading Test was designed to measure students’ ability to answer
questions about the sub-concepts of ruler reading. The content of the test was derived

27
27
primarily from Dr. Kenneth Welty’s expertise and from problem areas noted in the
literature search.
The test was divided into eight sections and consisted of fifty-seven questions.
Some of the sections were further divided into subsections. The questions for most
subsections had a completed example. All the parts used were illustrated with two, four,
eight, or sixteen divisions. Section one: recognizing parts to whole had three subsections
and a total of nine questions, section two: drawing parts to whole had three subsections
and a total of nine questions, section three: dividing a line had three subsections and a
total of nine questions, section four: meaning of lines had three questions, section five:
reading lines had three questions, section six: measuring efficiently had three questions,
section seven: measuring lines had three subsections and a total of nine question, and
section eight had two subsections and a total of twelve questions.
The test packet that was use with the test included a ruler, one wooden clothespin,
one large playing card, one small playing card, and one package of gum, an eraser, and a
plastic screw anchor. The ruler included with the test packet was a clear, twelve-inch
ruler that was divided into sixteenths of an inch. The other side of the ruler was a metric
scale. Masking tape was placed over this edge to prevent students from using the wrong
scale. The items included in the test packet were used in section eight for estimation and
measuring.
Section one The first section was written to address the first research question, “To
what extend did the materials that were developed effectively help students recognize
parts and whole”. This was accomplished by subdividing the section into three smaller
areas. These areas asked the student: 1) into how many parts is each rectangle divided, 2)

28
28
how many parts are shaded in each rectangle, and 3) what is the number of parts shaded
compared to the total number of parts? The test questions use rectangles that were
divided into parts. In the first subsection, the student was asked to identify the number of
smaller parts or boxes in the larger or whole rectangle. In the second subsection, the
students was asked to identify the number of shaded parts in each rectangle and in the
final subsection, the students was asked to write a fraction that compares the number of
shaded parts to the total number of parts.
Section two The second section was written to address the second research
question, “To what extent did the materials that were developed effectively help student
draw parts to whole”. This was accomplished by subdividing the section into three
smaller areas. These areas asked the student to: 1) divide the rectangle into equal pieces,
2) divide the rectangle into equal pieces and shade the requested number of parts as
written out, and 3) divide the rectangle into equal pieces and shade the requested number
of parts as given in a fraction. The test questions gave a rectangle to draw the answer.
Section three The third section was written to address the third research question,
“To what extent did the materials that were developed effectively help students divide a
line and illustrate a fraction”. This was accomplished by subdividing the section into
three smaller areas. These areas asked the student: 1) into how many parts is each line
divided, 2) express as a fraction the number of shaded parts to the total number of parts,
and 3) using the given line, illustrate the requested fraction. In the first subsection the
student was asked to count the number of parts in each line, the second subsection asked
the student to write a fraction that was drawn with the given line, and the third subsection
asked the student to draw the fraction on the given line.

29
29
Section four The fourth section was written to address the fourth research question,
“To what extent did the materials that were developed effectively help students name the
lines on a ruler”. This section had arrows pointing to lines on a ruler. The students were
asked a multiple-choice question. The question asked the student to name what the line
on the ruler represented.
Section five The fifth section was written to address the fifth research question,
“To what extent did the materials that were developed effectively help students name the
lines on the ruler”. This section the students are asked to figure out the length of an
arrow that is above a one-inch section on a ruler.
Section six The sixth section was written to address the sixth research question,
“To what extent did the materials that were developed effectively help students measure
efficiently”. In this section the students are asked to figure out the length of a line that is
above a one-inch section of a ruler, but some of the lines on the ruler are missing. The
missing lines do not allow a student to simply count the sixteenth and reduce the fraction.
This requires the student to understand the meaning of the lines and to use short cuts to
get the answer thus leading to more efficient ruler reading skills.
Section seven This seventh section was written to address the seventh research
question, “To what extent did the materials that were developed effectively help students
measure lines”. This section had three subsections. This was the first section to use the
supplied ruler. The three subsections required the students to use the ruler to measure a
drawn line, to use the ruler as a straight edge, and to use the ruler to draw a line a
requested length.

30
30
Section eight The eighth section was written to address: “To what extent did the
materials that were developed effectively help students estimate and measure objects”.
This section had two subsections, which were estimation and measuring objects. The
objects used for the estimation and measuring were found in the test packet that was
distributed with the test. The objects included a plastic anchor, a clothespin, a small
playing card, a large playing card, an eraser, and a package of gum. These objects were
chosen because some of their dimensions were 16ths. The estimation and measuring
subsections were presented in a similar fashion. The objects were given in the directions.
One object was estimated/measured in length, one object in length and width, and one
object in length, width, and depth. The terms length, width, and depth were written on all
the objects except the plastic anchor. In order to receive credit for the estimation section,
the student had to be within 1/16th of an inch with measurement that were less than one
inch and within 1/8th of an inch with measurements that were more than one inch.
Procedures
The pilot school technology education teacher was given the evaluation instrument
and the equipment needed for administrating the test. In addition the teacher was asked
to record any difficulties with the direction of the test and instruction on returning the
pilot test. The results of the pilot test were used to revise the ruler-reading test for the
study.
The researcher responsible for the pretest administered the pretest, scored it, and
established which areas the students performed less than 100% competency. The pretest
determined what sections of the instructional materials the student should perform. The
students were given one to three packets per week to complete and return to class. A

31
31
Figure was established to determine who was to receive the homework packets, when
they returned the packets, and pertinent comments. A different colored folder with the
student’s name was used to contain the eight different self-paced lessons. If the students
were absent, the folders were given to them on their first day back. Four days passed
between the issuance of the last packet and the posttest. As the fourth and eighth packets
were distributed, verbal reminders were made to students that were deficient in returning
the homework packets.
The researcher responsible for the pretest administered the posttest. No retention
test was given.
Statistical Analysis
The hypotheses of this study are as follows:
1. There is no relationship between the materials that were developed and
students recognizing parts and whole.
2. There is no relationship between the materials that were developed and
drawing parts to whole.
3. There is no relationship between the materials that were developed and
dividing a line to illustrate a fraction.
4. There is no relationship between the materials that were developed and
naming the lines on a ruler.
5. There is no relationship between the materials that were developed and
reading the lines on a ruler.
6. There is no relationship between the materials that were developed and
measuring efficiently.

32
32
7. There is no relationship between the materials that were developed and
measuring lines.
8. There is no relationship between the materials that were developed and
estimating and measuring lines.
The independent variable is prior enrollment in a sixth grade graphic
communications class. The control variables associated with the students’ ability to read
a ruler were: a) gender, b) age, c) elementary school attended, c) where homework is
done, d) degree of noise, e) who helps with homework, and, f) completion of homework.
Limitations of the Study
The limitations of the study are as follows:
1. The pilot study was limited to two classrooms of eighth grade middle school
students at South Middle School, Eau Claire, Wisconsin.
2. The pre/post test was limited to two classrooms of sixth grade middle school
students at Chippewa Falls Middle School, Chippewa Falls, Wisconsin.
3. The pretest and the posttest contained similar items, but the test was not
exactly the same.

33
33
CHAPTER FOUR
Results
The purpose of this study was to develop and evaluate a series of self-paced packets
that taught ruler-reading skills to middle school students. The researcher developed both
the evaluation tool and the packets. A pretest, posttest, and packets were used in the
study.
The population for this study was two classes of sixth grade students that the
researcher was assigned for student teaching. The class was graphic communications in
the technology education department at Chippewa Falls Middle School in Chippewa Falls
Wisconsin. The students for the study were a population and not a sample. The two
classes had total of twenty-seven students. Of the twenty-seven students, two lacked
parental permission to participate and one student did not complete the class. The total
number of students participating in the study was twenty-four.
The students were given the pretest (Appendix B). The researcher scored it. The
students did not see the scored pretest. The pretest and the posttest were subdivided into
eight sections. Any student that did not receive a hundred percent correct on the pretest
in a subsection was given the homework packets (Appendix H-O). There were eight
separate homework packet. Each packet consisted of three to five pages of directions,
activities, and problems. Each packet was presented in different colored folder. Two to
three packets were distributed per week. Four days after the last packet was distributed,
the posttest (Appendix D) was administered.
Both the pretest and the posttest were similar in structure. Sections one, two, three,
and seven had three subsection. On both tests, the questions under a subsection were

34
34
numbered one, two, and three. In the research data, the test questions under sections one,
two, three, and seven were numbered one through nine. Section eight was divided in two
subsections. The subsections were referred to as section 8A and 8B. Section 8A
addressed estimating and section 8B addressed measuring objects. The questions were
labeled one through three for section 8A and four through six for section 8B. The letters
L, W, and D appear after the questions. These letters stood for length, width, and depth.
Demographic Information
The demographic information was collected from the students by asking them to
complete a cover sheet (Appendix C) to the pretest. The cover sheet asked about gender,
age, elementary school attended, where they study, how quiet their study area is, who
helps them with homework, whether or not they have received instruction or learned how
to read a ruler. Table 1 describes the demographic information. T tests were the type of
statistical analysis that was used to compare the variables to the pretest and posttest
results.
The population in the study was comprised of twelve males and twelve females.
The results of the male and female students were studied and were found to be not
significant. The total number of correct answers in the posttest and the gain in the total
number of correct answers found no significant difference between the males and the
females.
The twenty-four students were from six different elementary schools. One school
had six students and one school had seven students respectfully. The remaining four
schools had less than three students each. The number of students from each school was

35
35
too small to be used to make any valid comparisons between the schools. This variable
was not addressed in the study.
The third variable addressed the age of the students. The students were divided into
two groups. One group was students 11.33 years or less and the second group was 11.42
years or more. The younger group had eleven students and the older group had twelve
students. The number of correct answers on the pretest found the t test close to being
significant. This indicates that the younger students did better on the pretest. However,
the total gain on the number of correct answers found the older students close to being
significant with the t-test in this statistic.
t df Sig. (2-tailed)
Pretest total number of correct answers 1.967 21 .063 Gain on total number Of correct answers -1.768 21 .092
The fourth variable addressed the location where the homework was done. Two
students had multiple responses. One multiple response was for bedroom and kitchen
table and the second multiple response was for kitchen table and living room. Since
almost half of the students study in their bedroom, the comparison was made between
those who study in their bedroom and to those who study in other locations. Of the two
students with multiple answers, one was assigned to each side. The student who stated

36
36
Table 1
Sample Demographics
Demographic Frequency Percent Gender
Male 12 50.0 Female 12 50.0
Name of grade school where respondent was a student
Halmstad 6 25.0 Hillcrest 3 12.5 Liberty 1 4.2 Parkview 7 29.2 Southview 4 16.7 Stillson 3 12.5
Place respondent usually does homework
Kitchen table 4 16.7 Bedroom 11 45.8 Living room 6 25.0 Computer desk 1 4.2 Multiple response 2 8.3
How quiet is the place where homework is done?
Quiet 15 62.5 Occasionally noisy 7 29.2 Noisy 1 4.2 Multiple response 1 4.2
Who helps with homework?
Parent 15 62.5 Sister/brother 2 8.3 Other 1 4.2 Multiple response 6 25.0
Learn to use a ruler in elementary school
Yes 23 95.8 No 1 4.2
I remember how to read a ruler
Yes 22 91.7 No 2 8.3

37
37
bedroom/kitchen table was added to the group that studies in the bedroom location. The
student who stated kitchen table/living room was added to the group that studies in other
locations. The total number of correct answers on the posttest found the t test close to
being significant. The significance is .096. The significance would have been stronger if
the significance were a .05 or lower.
t df Sig. (2-tailed)
Posttest total number of correct answers -1.742 22 .096 The significance was that studying in other areas yields more correct answers on the
posttest.
The fifth variable concerned how quiet was the place where homework was done.
The students who gave multiple responses all chose “quiet” and “occasionally noisy”.
Therefore the comparison was made between those students who study in a quiet place,
including the multiple responders and the remaining students. This variable compared
fifteen students that preferred quiet to nine students that preferred some noise. The
results were not significant.
The next variable addressed who helps the student with homework had six multiple
respondents. These multiple responses were: 1) parent/grandparent, 2) parent/friend, 3)
parent/brother, 4) parent/sister/brother, 5) parent / homework hotline, and 6)
parent/friend/homework hot line. By following the pattern set above, all these students
were added to the parent category. The number of students in the “parent” versus the
“non-parent” categories was twenty-one to three. Since the non-parent sample of three
was too small for meaningful analysis, the study of this variable was dropped from the
study.

38
38
Similarly, the answers to the last two questions yielded groups that were too small
for meaningful analysis. Whether or not the students learned to use a ruler in elementary
school and whether or not the student remembered how to read a ruler were not compared
to the pretest and posttest results.
Pretest/Posttest
The evaluation instrument used in the pretest and the posttest followed the same
format. Each test was divided into eight sections, which test the students ability to
recognizing parts to whole, drawing parts to whole, dividing a line, meaning of lines,
reading lines, measuring efficiently, measuring lines, and estimating and measuring
objects. Sections one, two, three, seven, and eight are subdivided. Each subdivision has
at least three questions. The questions in sections 1-7 were similar in the pretest and
posttest. The questions in section eight were the same for both tests. The results of the
pretest/posttest will be discussed together.
Section one: recognizing parts to whole Section one was subdivided into three
subsections. Subsections one asked the student into how many parts was a rectangle
divided, subsection two asked the student how many parts were shaded in each rectangle,
and subsection three asked the student what was the number of parts shaded compared to
the total number of parts. Each subdivision had three questions. Figure 1 depicts the
results for section one.

39
39
Figure 1
Section one: recognizing parts to whole
0
5
10
15
20
25
6 of 9 7 of 9 8 of 9 9 of 9
T est results
Nu
mb
er o
f st
uden
ts
Pre test
Posttest
The pretest found five students gave a total of eight wrong answers. The five
students were given homework packets. All homework packets were completed and
returned. The posttest found only one student giving a total of one wrong answer.
Section two: drawing parts to whole Section two was subdivided into three
subsections and was done without using a ruler. Subsection one asked the student to
divide the box into equal pieces, subsection two asked the student to divide the box into
equal pieces and lightly shading the number of parts requested, and subsection three
asked the student to divide the rectangle into equal sized boxes and lightly shading the
number of boxes required by the fraction. Each subsection had three questions. Figure 2
depicts the results for section two.
40
40
Figure 2
Section two: drawing parts to whole
0
2
4
6
8
10
12
14
16
18
0 o f 9 1 o f 9 5 o f 9 6 o f 9 7 o f 9 8 of 9 9 of 9
T est results
Nu
mb
er o
f st
uden
ts
Pre test
Posttest
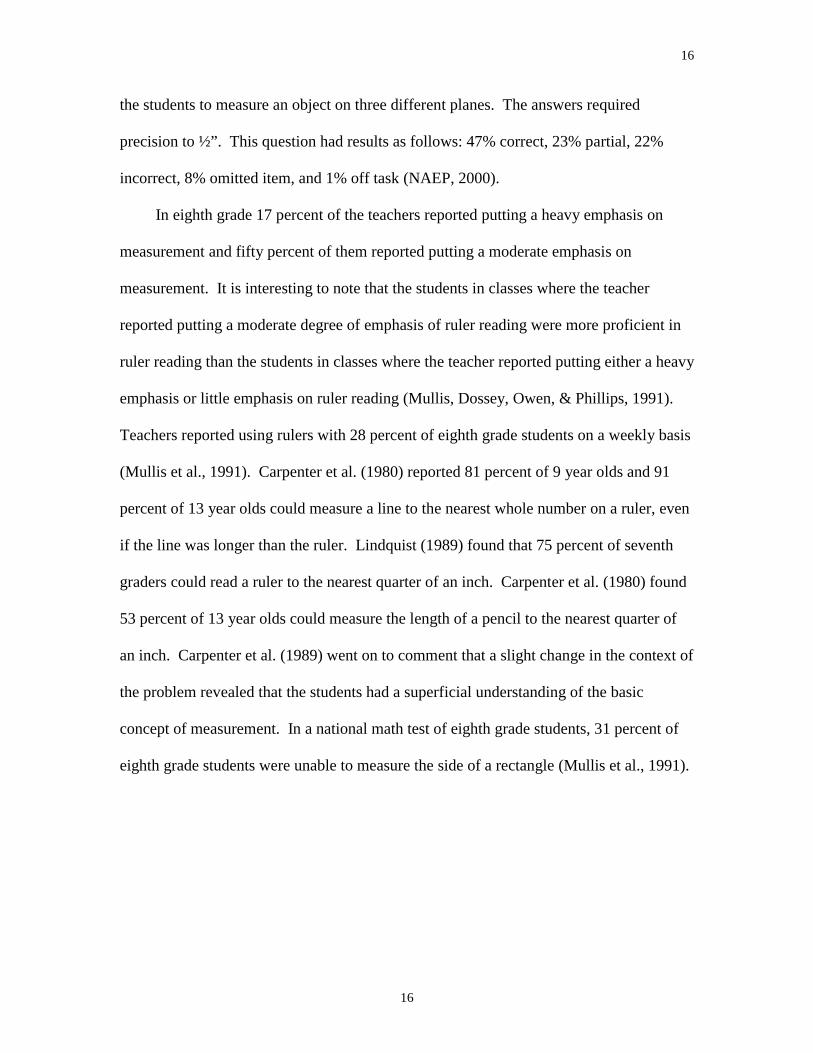
The pretest found twelve students gave a total of thirty-one wrong answers. Twelve
students received homework packets. Ten students completed and returned the packets.
The posttest found six students gave a total of twelve wrong answers. One student
skipped the entire section. Those answers were marked missing. One student
commented that the homework helped him to understand section two.
All of the students who made errors, made them in dividing the rectangle into the
correct number of pieces. The literature review did not address this problem. This
problem occurred in the pilot study and was addressed in the packets, but continued in the
tests.
Item 5 in this section was the only item on the entire test that had a negative result
when comparing the pretest/posttest. The pretest asked that the student illustrate one

41
41
shaded part of four parts and the posttest asked the student to illustrate three shaded parts
of four parts. All the students got the item correct in the pretest. One student got the
item incorrect on the posttest and one student skipped the question. This resulted in a –2
change between the pretest and the posttest for this question.
Section three: dividing a line Section three was subdivided into three subsections.
Subsection one asked the student into how many parts were each line divided, subsection
two asked the student to express as a fraction the number of shaded parts to the total
number of parts on this line, and subsection three asked the student to divide the line into
equal sized pieces and lightly shade that number of pieces indicated by the fraction. Each
subdivision had three questions. Figure 3 depicts the results for section three.
Figure 3
Section three: dividing a line
0
2
4
6
8
10
12
14
16
18
20
3 o f 9 4 o f 9 5 o f 9 6 o f 9 7 o f 9 8 of 9 9 of 9
T est results
Nu
mb
er o
f st
uden
ts
Pre test
Posttest

42
42
The pretest found thirteen students gave a total of thirty-six wrong answers.
Thirteen students were given homework packets. Twelve students completed and
returned the packets. The posttest found six students gave a total of nine wrong answers.
One student commented that it was difficult to understand the answers.
An error occurred in the posttest subsection three questions 7 and 9. The question
was the same. Upon realizing this, the researcher changed question 9 to 7/8 from 5/8.
Each student was individually notified of the change. However, several students were
beyond that point in the test. As a result, some students changed the answer and other did
not. In scoring, both answers were accepted.
The errors that occurred in posttest were a repeat of section two. The students did
not divide the line into the correct number of parts. In addition, students did not divide
the whole line. They did not divide the line into reasonable equal sections nor did they
mark the beginning and end of the line. The following example was marked wrong.
5/8
Other students shaded the wrong number of parts. Of the six students that had errors on
this posttest section, four also had errors on section two
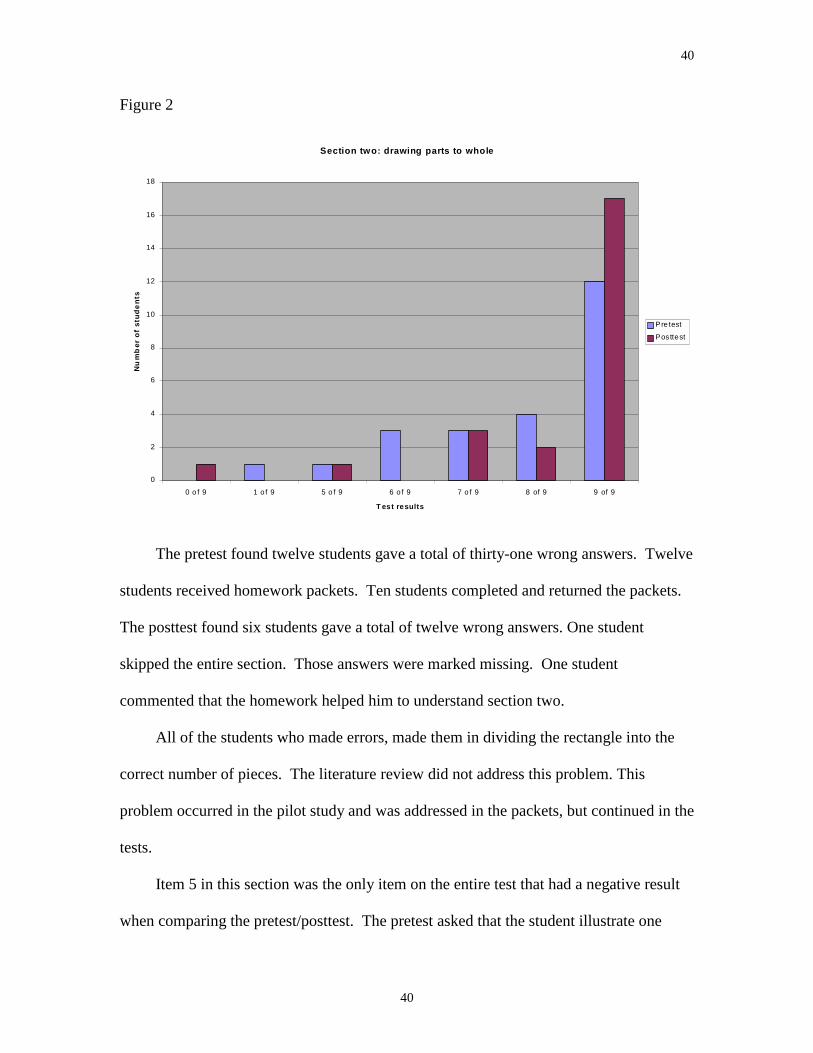
Section four: meaning of lines Section four had three questions, which asked the
student to match a line of the ruler with a unit. Section four was done without using a
ruler. Figure 4 depicts the results for section four.
The pretest found twelve students gave a total of twenty-five wrong answers.
Twelve students received homework packets. Six students completed and returned the
packets. The posttest found six students gave a total of thirteen wrong answers.
43
43
Comments on this section were that the information was confusing and that it was hard
until you got the hang of it.
Figure 4
Section four: meaning of lines
0
2
4
6
8
10
12
14
16
18
20
0 of 3 1 of 3 2 of 3 3 of 3
T est results
Nu
mb
er o
f st
uden
ts
Pre test
Posttest
Section five: reading lines Section five had three questions, which asked the
student to read the length of a line that was located above a provided ruler. Section five
was done without using a ruler. Figure 5 depicts the results for section five.
The pretest found fifteen students gave a total of thirty-two wrong answers. In the
pretest of section five, one student did not complete the test due to time. When this
happened, the answers were marked as missing (Appendix E) not errors. The number of
students not completing the test steady rose to eleven with the pretest. All students were
able to complete this section on the posttest. Fifteen students received homework
packets. Eleven students completed and returned the packets. The posttest found eleven

44
44
students gave a total of twenty-three wrong answers. One student commented that did not
get it at first.
Figure 5
Section five: reading lines
0
2
4
6
8
10
12
14
o of 3 1 of 3 2 of 3 3 of 3
T est results
Nu
mb
er o
f st
uden
ts
Pre test
Posttest
Section six: measuring efficiently This section had three questions, which asked the
student to measure the length of the line using pictures of rulers where some of the lines
were missing. Figure 6 depicts the results for section six.
The pretest found eighteen students gave a total of thirty-eight wrong answers.
Two students had missing answers. Eighteen students received homework packets.
Thirteen students completed and returned the packets. The posttest found thirteen
students gave a total of thirty-one wrong answers. In this section almost half of the
students missed 2/3 questions on the posttest.

45
45
Figure 6
Section six: measuring efficiently
0
2
4
6
8
10
12
14
0 of 3 1 of 3 2 of 3 3 of 3
T est results
Nu
mb
er o
f st
uden
ts
Pre test
Posttest
In looking over the tests, the following observations were made:
1. Six students on the pretest and ten students on the posttest completed all three
items correctly; five students completed the items correctly on the both tests
2. Eight students on the pretest and one student on the posttest omitted answers to
at least one of the questions
3. Two students on the pretest and eight students on the posttest did not reduce
fractions
4. Eight students on the pretest and four students on the posttest tried to fill in the
missing lines on the ruler
Section seven: measuring lines Section seven was subdivided into three
subsections. Subsection one asked the student to measure each line, subsection two

46
46
asked the student to draw a line above the ruler the requested length, and subsection three
asked the student to draw a line the requested length starting at the dot. The student used
the supplied ruler in this section. Figure 7 depicts the results for section seven.
The pretest found twenty-one students gave a total of eight-nine wrong answers.
Three students had missing answers in items 1-6 and the four students had missing
answers in items 7-9. Twenty-one students received homework packets. Twelve
completed and returned the packets. The posttest found twenty students gave a total of
eighty-four wrong answers. One student had missing answers in items 7-9.
Errors in this section fell into four areas. The first area was fractions that were not
reduced. Fractions that were not reduced were scored as incorrect because it
demonstrated that the student was not using the ruler correctly as a tool. This occurred
six times on the pretest and eight times on the posttest. The second area included
answers with the wrong denominator, decimals, or metric. This occurred fourteen times
in the pretest and thirteen times in the posttest. The fourth area included answers that
demonstrated that the student did not have any understanding of the questions being
asked. Examples were 7/16” for 3/16”, 5/8” for 3/16”, 15/16” for 7/16”, 3/8” for 7/8”
11/16” for 3/8”, 3” for 3/8”, and 15/16” for 3/8”. This area decreased from twenty-six
times in the pretest to sixteen times in the posttest. The fourth area included
understandable mistake or errors that were close. Examples were 5/16” for 5/8”, 3/8” for
5/8” or answers that were within 1/8”. This area had sixteen examples in the pretest and
twenty-two examples in the posttest.

47
47
Figure 7
Section seven: m easuring lines
0
1
2
3
4
5
6
7
8
0 of 9 1 o f 9 2 of 9 3 of 9 4 o f 9 5 of 9 6 o f 9 7 of 9 8 of 9 9 o f 9
T e st results
Nu
mb
er o
f st
uden
ts
Pre test
Posttest
Section eight: estimating and measuring objects This section was subdivided into
two subsections. Subsection one asked the student to estimate and subsection two asked
the student to measure objects. The items used for estimation included a clothespin, a
small playing card, and a package of gum. The items used for measuring objects
included a plastic anchor, a large playing card, and an eraser. The clothespin and the
plastic anchor were the two items that were used to estimate/measure length. The playing
cards were the two items that were used to estimate/measure length and width. The
package of gum and the eraser were the two items that were used to estimate/measure
length, width, and depth.
Estimation The results of this section were meaningless. The students had used the
ruler in section seven and used it again in section 8B. When it was observed that the

48
48
students were using the rule for estimating, they stated that they wanted to get the
questions correct. Once the students had measured the object, it was not possible for
them to estimate the object. This was more of a problem with the posttest than the pretest
because more students completed this section on the posttest and the posttest was being
used as a test grade in the class. Figure 8A depicts the results for section eight A.
Figure 8A
Section eight: estimating objects
0
2
4
6
8
10
12
14
0 o f 6 1 o f 6 2 o f 6 3 o f 6 4 o f 6 5 of 6 6 of 6
T est results
Nu
mb
er o
f st
uden
ts
Pre test
Posttest
The estimating was scored with the answer falling in a range. The range was within
1/16” with measurements under one inch and within 1/8” with measurements over one
inch.
The pretest questions one and two found fifteen students gave a total of fifty-three
wrong answers. The pretest question three found thirteen students gave a total of
eighteen wrong answers. Eight students had missing answers for question one and two.
Ten students had missing answers for question three. Twenty-four students received

49
49
homework packets. Nine students completed and returned the packets. The posttest
question one found eleven students gave a total of eleven wrong answers. The posttest
question two found fourteen students gave a total of twenty-one wrong answers. The
posttest question three found seventeen students gave a total of twenty-eight wrong
answers. Two students had missing answers for question one, four students had missing
answers for question two, and three students had missing answers for question three.
Measuring objects Section 8B had three questions. The students were asked to
measure to the nearest 1/16th” a plastic anchor, a large playing card, and an eraser. The
students were asked to measure the length of the anchor, the length and width of the
playing card, and the length, width, and depth of the eraser. There were a total of six
answers for section 8B. Four of the six answers were greater than one inch. Figure 8B
depicts the results for section 8B.
The pretest found eleven students gave a total of forty-seven wrong answers. Eleven
students had missing answers. Twenty-three students received homework packets. Nine
students completed and returned the packets. The posttest found twenty students gave a
total of eighty-two wrong answers. Three students had missing answers.
In the pretest fourteen answers were not reduced and in the posttest thirty answers
were not reduced. If these answers were reduced three would have been correct in the
pretest and two in the posttest. Two students on the posttest had answers with the correct
fraction, but missed the whole number in front of the fraction.

50
50
Figure 8B
Section eight: measruing objects
0
2
4
6
8
10
12
14
0 o f 6 1 o f 6 2 o f 6 3 o f 6 4 o f 6 5 of 6 6 of 6
T est results
Nu
mb
er o
f st
uden
ts
Pre test
Posttest
It looked like the number of wrong answers on section 8B sharply increased.
However, if the number of missing answers on the pretest was added to the errors on the
pretest, the total was 115. If the number of missing answers on the posttest was added to
the errors on the posttest, the total was 101. This indicated a slight gain.
Summary of study
The purpose of the study was to develop and evaluate an instructional unit that
would address the ruler reading deficiencies of middle school students. The ruler reading
tests and packets were set up to start from materials that the students understood to
material they did not understand. Each section was meant to build upon the previous
section. When a student did not understand a section, most likely, the student would have
difficulty with later section.
51
51
The data collected in the study can be presented in many different ways. One can
look at the data by an analysis of the questions on the test (Appendix E). This Figure lists
the question in each section and presents the results on the pretest and the posttest by
showing the number of correct, incorrect, and missing answers for each question. The
final column shows the change between the number of correct answers on the pretest and
the posttest.
One could look at the data from the standpoint of each individual student (Appendix
F). On this Figure, the twenty-four students that participated in the study were shown for
each of the section scores and total scores on the pretest and the posttest. One can see by
looking at this table that all but two students improved their scores. Eight students
improved by ten to fifteen points on a test with a total of fifty-seven points. The two
students, who did not improve, decreased their scores by one point and by four points.
The mean, median and standard deviation for the test results are shown on
Appendix G. Of particular interest was the fact that the mean score increased about six
points, the median increased nine points, and that the standard deviation decreased about
two points between the pretest and the posttest.
Pearson correlations (r) were calculated with a population of 24 (n= 24). The
correlation between the total pretest and the posttest were r = .833 with sig. (2-tailed)
.000, the correlation between the gain of the total test and the pretest total was r = -.603
with sig. (2-tailed) .002, the correlation between the gain of the total test and the posttest
total was r = -.060 with sig. (2-tailed) .780. These statistics moved in the direction one
would expect. The scores on the pretest compared to the posttest went up as indicated by
the positive r value. The total gain correlated to the total pretest had a negative r-value,

52
52
which indicated that the largest gains were from the lowest students or an inverse
relationship.
Figure nine illustrated the speed at which the students were able to process the
information. One can see by looking at Figure nine, the radical reduction in the number
of students with missing answers between the pretest and the posttest. This result
indicated that the students processed the information faster when taking the post-test.
Figure 9
Com parison of missing answers
0
2
4
6
8
10
12
Se ctio n 1 Section 2 Section 3 Section 4 Se ction 5 Sectio n 6 Section 7 Section 8
T es t sectio ns
Nu
mb
er o
f st
uden
ts
Pre test
Posttest
Test results were also analyzed by a comparison of correct answers when measuring
with 8th’s and 16th’s, a comparison of reading measurement with and without a ruler, the
lower 25% to the upper 25%, and a comparison of the effect the homework had on the
test results. Since the number of answers involving 8th’s and 16th’s was not equal in the
test, this data is given in percentages in Table 2.

53
53
Table 2
Percent of correct answers with 8th’s and 16th’s Pretest Posttest 8th’s 16th’s 8th’s 16th’s Mean 74.1071 64.583 79.398 81.862 Median 75.0 65.0 86.11 91.176 Std. Deviation 16.825 24.535 17.219 18.756 This table shows that there was improvement in reading 8th’s and 16th’s between the
pretest and the posttest. It also showed that there was a bigger gain in correct answers
with the 16th’s than the 8th’s.
The analysis of reading measurements with and without a ruler compared the results
between using and reading the supplied ruler as opposed to using and reading the ruler
that was printed on the test (Table 3). Issues that were addressed here were eye hand
coordination and visual perception.
Table 3
A percent comparison of performance in reading measurements with and without a ruler
Pretest Posttest Without With Without With Mean 48.611 31.597 65.740 42.013 Median 33.333 29.166 88.888 41.666 Std. Deviation 36.896 31.563 33.077 27.526 One can see by this table that the students improved between the pretest and the posttest
in both categories, but that they had more success with rulers printed on the page than
with the use of a separate ruler.
The t test was applied to the lower 25% and the upper 25% of students, as
determined by the pretest, and the gain from the total number of correct answers on the

54
54
posttest. This t test was significant for the lower 25% making more gains than the upper
25%.
t df Sig. (2-tailed)
Gain of total number of correct answers 4.551 10 .001
Finally, what was the relationship between the homework packets completed and
the learning that occurred with ruler reading? After the pretest was scored and the
students identified who would receive the study packets, two to three study packets per
week were distributed to these students. A school holiday, no homework on Wednesdays
(school policy), and no homework on the weekends determined the packet distribution
schedule. Students were reminded about the delinquent homework assignments as packet
four and eight were distributed. Table 4 compares the percent of homework completed
with the pretest/posttest score changes, the posttest score, and the percent of change
between the pretest score and the posttest score.
Table 4 Homework completed compared to pre/posttest score change, posttest score, and percent of change from pretest to posttest Percent of home- Frequency Pre/posttest Posttest % Change work completed change score from pretest
0 1 5 30 20 25 1 9 43 26.3
28.57 1 -1 32 -3 33.33 1 11 43 34
40 3 4 47 9.3 2 35 6 15 43 53.5
50 2 2 52 4 2 33 3
60 1 13 54 31 62.5 1 14 39 52
66.67 2 0 50 0 7 31 29
80 1 10 47 27

55
55
83.33 1 5 39 14 85.71 1 4 36 9.3
100 8 7 47 17.5 14 27 107 -4 52 -7 9 36 33 4 49 8.8 0 43 0 11 50 28.2 12 42 40
Discussion
Almost half of the eighth grade students enrolled in technology education classes
have not learned to read a ruler at the level needed for success in high school technology
education classes. The National Assessment of Educational Progress as well as other
researchers (Bright & Hoeffner, 1993; Carpenter et al., 1980; Lindquist, 1989) and
teachers agrees that middle school students are deficient in ruler reading skills. Research
shows that the logico-physical abstraction, procedural measurement, and logico-
mathematical abstraction should be established in most students by fifth grade.
Formalization appears to develop in students slightly later (Kamii, 1991; Heraud, 1989a).
Often times there is a discrepancy between the opportunities to learn ruler reading and the
actual performance (Bright & Hoeffner). By the time students are in middle school, some
students have not acquired ruler-reading skills, while other have forgotten such skills and
need the skills to be taught to them again (Bright& Hoeffner, 1993; Hart et al., 1981).
Problems that middle school students have with ruler reading include being afraid of
fractions, failing to realize that the length of an object does not change when it is moved,
failing to understand where the zero is on a ruler, counting the lines rather than the spaces
on a ruler, and inability to estimate (Kamii, 1991; Bright & Hoeffner, 1993; Hart et al.,
1981; Bright, 1976).

56
56
This study found a wide range of ruler reading skills among the students tested. Of
the problems mentioned above, realizing that the length of an object does not change
when it is moved and not understanding where the zero is on a ruler were not a problem
in this study. However, being afraid of fractions, counting the lines rather than the
spaces, and inability to estimate were problems with this population of students. The
students had a hard time understanding that the ruler was a tool and that if the lines on the
ruler were correctly read the answer could then easily be stated in the form of the
resulting fraction.

57
57
CHAPTER FIVE
Summary, Conclusions, and Recommendations
Summary
Few will argue that measurement is a skill used in many professions. Measurement
is an intricate part of manufacturing, construction, communication, agriculture, power,
transportation, retail business, art and theater, and food processing to name a few. In our
schools measurement is a part of the curriculum in art, science, mathematics, and
technology education. National math tests find about half of the eighth grade students
unable to measure with a ruler more accurately than one quarter of an inch. Yet, no
discipline has taken responsibility for teaching this skill and no discipline has devised a
method of teaching the skill successfully to all students.
One hears stories about people who cannot read a ruler. A librarian told a story of a
carpenter who came to her looking for information on how to read a ruler because he
needed the skill for a test he was going to take. A college graduate and kindergarten
teacher was delighted to find self-reading rulers on the market because she could not read
a ruler. And pipe fitter at the former Uniroyal plant in Eau Claire, Wisconsin always
carried a ball of string on his hip to measure the pipes he needed to cut. He too, could not
read a ruler.
Studies done on length and measurement with children over the years have shown
that they generally possess the skill necessary to read a ruler by fifth grade. Studies
showed that after the students have been taught a method of learning to read a ruler, they
performed poorly if the test questions were presented in a different format. This
indicated that the students did not understand the concepts in the skill of reading a ruler.

58
58
Purpose of the Study
The purpose of the study was to develop and evaluate an instructional unit that
would address the ruler reading deficiencies of middle school students. The results of this
study would add to the current knowledge of how students learn ruler reading. The
results of the study would assist teachers in adapting more effective teaching methods for
this essential topic.
Questions
The questions this study answered are as follows:
1. To what extent did the materials that were developed effectively help students
recognize parts and whole?
2. To what extent did the materials that were developed effectively help students
draw parts to whole?
3. To what extent did the materials that were developed effectively help students
divide a line and illustrate a fraction?
4. To what extent did the materials that were developed effectively help students
name the lines on the ruler?
5. To what extent did the materials that were developed effectively help student
read the lines on a ruler?
6. To what extent did the materials that were developed effectively help students
measure efficiently?
7. To what extent did the materials that were developed effectively help students
measure lines?

59
59
8. To what extent did the materials that were developed effectively help students’
estimate and measure objects?
Research Method
Data for this research was gathered from two six grade technology education
classes. Twenty-four students participated in the study. The author developed the ruler
reading test and homework packets. The test had eight subdivisions which were: 1)
recognizing parts to whole 2) drawing parts to whole 3) dividing a line 4) meaning of
lines 5) reading lines 6) measuring efficiently 7) measuring lines and 8) estimating and
measuring objects. The pretest contained a cover sheet to collect the demographics for
the variables. After the pretest was administered and scored, self-paced packets were
given to students that were deficient in the subdivisions. Four days after the last packets
were distributed, the posttest was administered.
The independent variables in this study were gender, age, elementary school
attended, where they study, how quiet it is, who helps them with homework, whether or
not they learned to read a ruler, whether or not they remembered how to read a ruler, and
homework completion. Of these variables elementary school attended, who helps them
with homework, whether or not they learned to read a ruler, and whether or not they
remembered how to read a ruler were dropped as the samples were too small. The
dependent variable was the students assigned to the researcher for student teaching.
Raw data, percentage, and t test analysis were used on the colleted data in the
pretest, posttest, cover page, and homework completion Figure.

60
60
Findings
The findings of this study reflected that the students have for the most part studied
how to read a ruler and think that they know how to read a ruler, but in fact, most of the
students were not proficient with this skill. This study was researched and the pilot test
administered with eighth grade students in mind. Although the topic was appropriate for
sixth grade students, the developmental skills needed for this task were not as mature in
the sixth grade students as in the eighth grade students. When one reviews the findings
of this study, one can look at each subsection, the total test, and the variables.
Subsection findings
Section one, recognizing parts to whole, found the students made eight wrong
answers on the pretest and one wrong answer on the posttest. The students were at 96.3%
on the pretest and at 99.6% on the posttest. One can say that these students understood
recognizing parts to whole.
Section two, drawing parts to whole, found the students made thirty-one wrong
answers on the pretest and twelve wrong answers and nine missing answers on the
posttest. The students were at 85.65% on the pretest and at 94.2% on the posttest with
the missing answers not counted with the wrong answers nor in the total possible
answers. One can say that these students understood drawing parts to whole.
Section three, dividing a line, found the students made thirty-six wrong answers on
the pretest and nine wrong answers on the posttest. The students were at 83.4% on the
pretest and at 95.9% on the posttest. One can say that these students understood dividing
a line.

61
61
Section four, meaning of lines, found the students made twenty-five wrong answers
on the pretest and thirteen wrong answers on the posttest. The students were at 65.3% on
the pretest and at 85% on the posttest. This shows a significant improvement between the
pretest and the posttest, but 16% of the students did not understand this section. Since
understanding the meaning of the lines is essential in reading a ruler, teachers should be
aware of this stumbling block for students.
Section five, reading lines, found the students made thirty-two wrong answers on
the pretest and twenty-three wrong answers on the posttest. The students were at 55.6%
on the pretest and at 60.1% on the posttest. In this section, the degree of improvement
sharply declined and forty percent of the students had difficulties with this section after
completing the homework packet. In this study, this was the point at which the class as a
whole needed additional help.
Section six, measuring efficiently, found the students made thirty-eight wrong
answers on the pretest and thirty-one on the posttest with six missing answers on the
pretest. The students were at 42.5% on the pretest and at 57% on the posttest. Since
measuring efficiently was based on an understanding of reading lines, one would expect
problems in this section since 40% of the students were unable to read a line. Teachers
need to help their students understand the reading lines first. The students need to
understand the basics before they can take the short cuts.
Section seven, measuring lines found the students made eighty-nine wrong answers
on the pretest and eight-four wrong answers on the posttest with missing answers from
both tests. The students were at 52.5% on the pretest and at 60.8% on the posttest. The
problems that the students had in section five also influence section seven. In addition

62
62
this was the section that introduced the use of the ruler. One now needs to look at how
eye-hand coordination and spatial relationships affect this process.
Section eight A, estimating, found the students made fifty-three wrong answers on
the pretest and sixty wrong answers on the posttest with missing answers from both tests.
The students were at 44.8% on the pretest and at 52.8% on the posttest. This study found
that estimation was not easily evaluated with a measurement test. Once the students had
access to a ruler, they preferred to use the ruler instead of estimating. Since the students
progressed at different rates through the tests, it was not possible to prevent the students
from using the ruler for estimating.
Section eight B, measuring objects, found the students made forty-seven wrong
answers on the pretest and eight-two wrong answers on the posttest with missing answers
from both tests. The students were at 39.8% on the pretest and at 35% on the posttest.
In this section, in addition to the problems that mounted from the other sections, the
students now had to manipulate the object and the ruler while measuring. This section
also had the poorest rate of homework complete at 39%.
Total test
The overview of pretest and the posttest found that most students benefited from the
ruler reading packets. Of the twenty-four students in the study, twenty-two improved
their score in the posttest from the pretest. The two students that had lower scores were
down one and four points. The mean score increased about six points, the median
increased up nine points, and that the standard deviation decreased about two points
between the pretest and the posttest. Students also improved in their ability to process the
63
63
information faster. This study was also able to identify the point at which the students
began to have problems with understanding how to read a ruler.
Variables
The variables included gender, elementary school, age, location of homework,
noise, who helped with homework, whether or not the students had learned to read a
ruler, whether or not the students remembered how to read a ruler, and the number of
packets completed and returned. Of these variables, the sample size was too small with
the elementary schools, who help the student with the homework, whether or not the
students learned to use a ruler in elementary school, and whether or not the students
remembered how to use a ruler. No significant data appeared when one looked at the
differences between males and females and the amount of noise in ones study area. Two
other variables were close to being significant. These two looked at age and location of
study area. This found that the younger students did better with the pretest and the older
students made more overall gains. It also showed that students who study outside of the
bedroom area do better on the posttest. With regards to the number of homework packets
completed and the test results, only raw data was obtained.
Recommendations
Based on the findings of this study, the following recommendations are made.
1. The study needs to be repeated with a larger population at the eighth grade
level. This study was designed primarily for the eighth grade student instead of
the sixth grade students that it was given too. The eighth grade students has had
a little more exposure to reading a ruler, are at an age where they realize that
they do not know this information, and have improved eye-hand coordination.
64
64
2. The estimation section should be done separate from the remaining ruler reading
test. The literature review and research has shown that students have difficulty
estimating length. By improving ones ability to estimate well, one is able to
recognize when measurements are likely wrong. However, the experience of
this study found that it would be easier to administer an estimating test one day
and a measurement test another day.
3. The material used in this study can be valuable to sixth grade students by
putting the emphasis on halves, quarters, and eighths and not sixteenth. The
sixth grade teacher should use the packets and tests for sections one through
three as is. Section four, the meaning of lines, needs to be supplemented with
additional materials. Section five needs to be presented with more emphasis on
quarters and eighths. Drawing lines and measuring lines and objects with
quarters and eights should be added. One would suggest that the ruler selected
for use with these students have the length of the lines (half, quarter, eighth,
sixteenth) clearly distinguishable
4. The students need more practice with measuring objects.
Recommendations for Further Research
Based on the findings of this study, the following items are recommended for
further research.
1. Use the same pretest and posttest so one knows that one is measuring the same
thing.
2. Correct the answer in homework packet section three n and the question on the
posttest section three question nine.

65
65
3. Use a larger population or a sample of eighth grade students or rewrite the tests
and homework packets for a sixth grade level.
4. Review the homework packets in sections four, five, six, seven, and eight B.
5. Develop a separate estimating test.
6. Workout a way to statistically measure the influence of homework packets
completed with posttest and gain results.

66
66
REFERENCES
American Association for the Advancement of Science. (1993). Benchmarks for
science literacy: Project 2061 New York: Oxford University Press.
Bright, G. (1976). Estimation as part of learning to measure. In D. Nelson (Ed.),
Measurement in school mathematics (pp. 87-104). Reston, VA: National Council of
Teachers of Mathematics.
Bright, G., & Hoeffner, K. (1993). Measurement, probability, statistics, and
graphing. In D. T. Owens (Ed.), Middle grades mathematics (pp. 8-85). New York:
Macmillan Publishing Company.
Boulton-Lewis, G. (1987). Recent cognitive theories applied to sequential length
measuring knowledge in young children. British Journal of Psychology, 57, 330-342.
Burton, G., & Maletsky, E. (1998a). Math advantage II. Orlando, FL: Harcourt
Brace & Co.
Burton, G., & Maletsky, E. (1998b). Math advantage III. Orlando, FL: Harcourt
Brace & Co.
Carey, R., & Steffe, L. (December, 1968). An investigation in the learning of
equivalence and order relations by four and five year old children. Athens, GA: Research
and Development Center in Education Stimulation. (ERIC Document Reproduction
Service No. ED 045 178)
Carpenter, T., Kepner, H., Corbitt, M., Lindquist, M., & Reys, R. (1980). Results
and implications of the second NAEP mathematics assessments: Elementary school.
Arithmetic Teacher, 27 (8), 10-12, 44-47.

67
67
Fales, J., Kuetemeyer, V., & Brusic, S. (1997). Technology today and tomorrow.
New York: Glencoe.
Fordahl, M. (1999, October, 1). Mixup may have doomed Mars orbiter (Associated
Press News Service). Original Source. Retrieved February 20, 2000 from NewsBank on-
line database (Record Number:008020DFD331945173400) on the World Wide Web:
http://infoweb.newsbank.com
Full prisons make unemployment data look rosier. (2000, February 1). The Wall
Street Journal, A1.
Hacker, M., & Barden, R. (1992). Living with technology. Albany, NY: Delmar
Publishers.
Hart, K. (1984). Which comes first—length, area, or volume? Arithmetic Teacher,
31 (9), 16-18, 26.
Hart, K., Kerslake, D., Brown, M., Ruddock, G., Kuchemann D., & McCartney, M.
(1981). Children’s understanding of mathematics: 11-16. Oxford, Great Britain: Alden
Press.
Heckman, J. (1999). Doing it right: Job training and education. The Public Interest,
135, 86-107.
Heraud, B. (1989a). A conceptual analysis of the notion of length and its measure.
Paris, France: International Group for the Psychology of Mathematics Education. (ERIC
Document Reproduction Service No. ED 411 141)
Heraud, B. (1989b). Case studies of children’s understanding of the concept of
length and its measure. Brunswick, NJ: Annual Meeting of the North American Chapter

68
68
of the International Group for the Psychology of Mathematics Education. (ERIC
Document Reproduction Service No. ED 411 132)
Herd, A. (1981). Carpentry. Vocational preparation curriculum. University of
Missouri-Columbia: Instructional Materials Laboratory. (ERIC Document Reproduction
Service No. ED 209 490)
Hiebert, J. (1984). Why do some children have trouble learning measurement
concepts? Arithmetic Teacher, 31, (7), 19-24.
Higa, F. (1986). How to use a tape rule. General metals 1, Lesson plan. Manoa,
HA: Hawaii University, Western Curriculum Coordination Center. (ERIC Document
Reproduction Service No. ED 283 549)
Kamii, C. (1991). Children’s readiness for measurement of length. Blacksburg, VA:
North American Chapter of the International Group for the Psychology of Mathematics
Education. (ERIC Document Reproduction Service No. ED 352 274)
Kamii, C. (1995). Why is the use of a ruler so hard? Columbus, OH: North
American Chapter of the International Group for the Psychology of Mathematics
Education. (ERIC Document Reproduction Service No. ED 389 558)
Lindquist, M. (Ed.). (1989). Results from the fourth mathematics assessment of the
national assessment of educational progress. Reston, VA: National Council of Teachers
of Mathematics.
Mullis, I., Dossey, J., Owen, E., & Phillips, G. (1991). The state of mathematics
achievement: Executive summary. Princeton, NJ: National Assessment of Educational
Progress. (ERIC Document Reproduction Service No. ED 330 546)

69
69
National Assessment of Educational Progress (NAEP), (2000). The nation’s report
card, mathematics. (On-line). Available:
http://nces.ed.gov/nationsreportcard/math/math_about_strands.asp
Owens, D. (1972). The effects of selected experiences on the ability of
disadvantaged kindergarten and first grade children to use properties of equivalence and
order relations. Unpublished doctoral dissertation, University of Georgia, Athens, GA.
Peterson, S., Ridenour, M., & Somers, S. (1990). Declarative, conceptual and
procedural knowledge in the understanding of fractions and acquisition of ruler
measurement skills. Journal of Experimental Education, 53(3), 185-93.
Piaget, J., Inhelder, B., & Szeminska, A. (1960) .The child’s conception of
geometry. London: Routledge & Kegan Paul.
Steffe, L., & Carey, R. (April, 1972). An investigation in the learning of relational
properties by kindergarten children. Chicago, IL: American Educational Research
Association.
Steffe, L., & Hirstein, J. (1976). Children’s thinking in measurement situations. In
D. Nelson (Ed.), Measurement in school mathematics (pp. 35-59). Reston, VA: National
Council of Teachers of Mathematics.
Thompson, C., & Van de Walle, J. (1985). Let’s do it: Learning about rulers and
measuring. Arithmetic Teacher, 32 (8), 8-12.
Wisconsin Department of Public Instruction. (1998). Wisconsin’s model academic
standards for technology education (Bulletin No. 9006). Milwaukee, WI: Wisconsin
Department of Public Instruction.

70
70
Wright, R., & Smith, H. (1993). Understanding technology. New York: Glencoe-
McGraw-Hill.
71
71
Appendix A
Pilot Test

72
72
Ruler Reading
Section one Into how many parts is each rectangle divided?
Example: answer_2___ 1. answer_____
2. answer _____
3. answer _____ How many parts are shaded in each rectangle?
Example: answer_2___
1. answer _____
2. answer _____
3. answer _____
What is the number of parts shaded compared to the total number of parts?
Example: answer_5/8___
1. answer _____
2. answer _____
3. answer _____
Section two Without using the ruler, divide the boxes into equal pieces.

73
73
Example: 2 pieces
1. 16 pieces
2. 4 pieces
3. 8 pieces
Without using the ruler, divide the box into equal pieces and lightly shade in the numbers of parts requested. Lightly shade the boxes so the scorer can count the number of boxes shaded.
Example: 1 shaded part of 16 parts
1. 7 shaded parts of 8 parts
2. 1 shaded part of 4 parts
3. 3 shaded parts of 16 parts
Without using the ruler, divide the rectangle into equal sized boxes and lightly shade the number of boxes required by the fraction.
Example: 1/4
1. 1/8
2. 15/16
3. 3/4
Section three
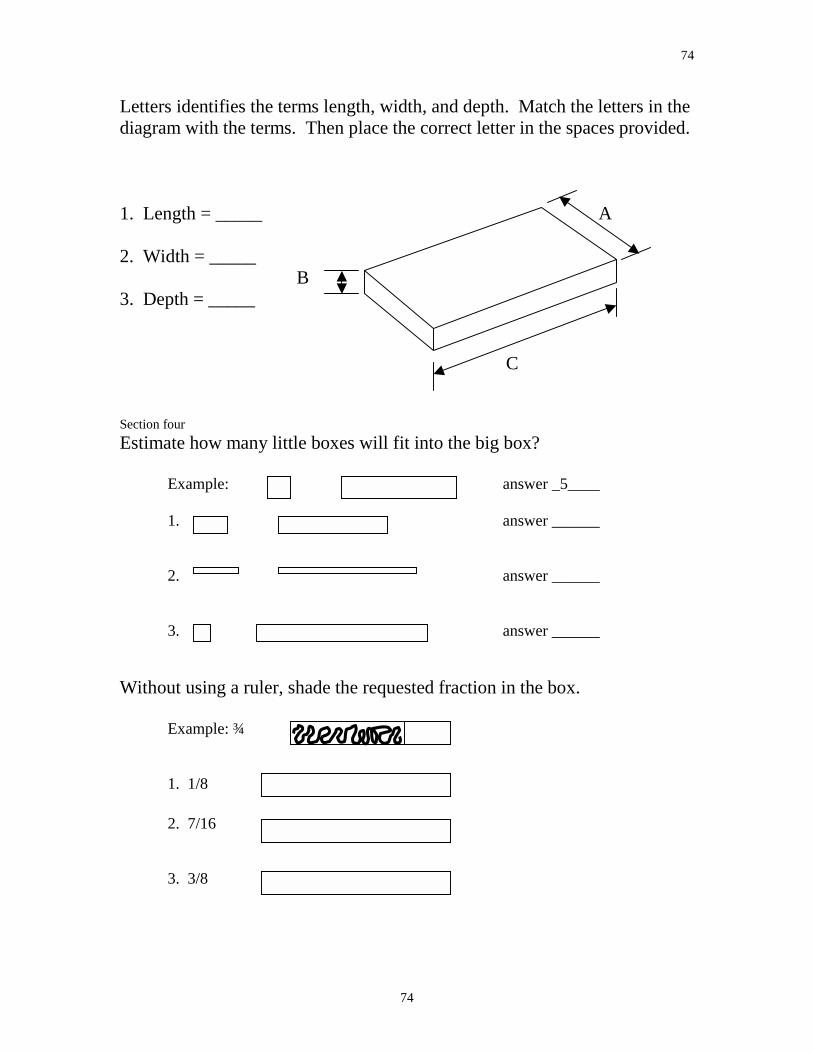
74
74
Letters identifies the terms length, width, and depth. Match the letters in the diagram with the terms. Then place the correct letter in the spaces provided. 1. Length = _____ A 2. Width = _____ B 3. Depth = _____ C Section four Estimate how many little boxes will fit into the big box? Example: answer _5____ 1. answer ______ 2. answer ______ 3. answer ______ Without using a ruler, shade the requested fraction in the box. Example: ¾ 1. 1/8 2. 7/16 3. 3/8

75
75
1. Take the clothespin out of the bag. Estimate its length. Record the length in the space below and return the clothespin to the bag.
Clothes pin length:_____inches 2. Take the small playing card out of the bag. Estimate its length and width. Record the length and width below. Return the card to the bag. Small playing card length:_____inches width:_____inches 3. Take the package of gum out of the bag. Estimate its length, width, and depth. Record the estimates below. Return the gum to the bag.
Package of gum length:_____inches width:_____ inches depth:_____inches Section five The arrow is pointing to a mark on the ruler. Underline what division of an inch the mark represents. 0 1 0 1 0 1 0 1 Example: 1. sixteenth 1 sixteenth 1. sixteenth 1. sixteenth 2. eighth 2. eighth 2. eighth 2. eighth 3. quarter 3. quarter 3. quarter 3. quarter 4. half 4. half 4. half 4. half 5. whole 5. whole 5. whole 5. whole Section six Into how many parts is each ruler divided?
Example: answer_2___ 1. answer_____ 2. answer_____ 3. answer_____

76
76
Express as a fraction the number of shaded parts to the total number of parts on this ruler.
Example: answer 4/8 or ½ 1. answer _____ 2. answer _____ 3. answer _____
Without using the ruler, divide the line into equal sized pieces and lightly shade that number of pieces indicated by the fraction. Example: ¾
1. 5/8
2. 1/16
3. 3/8
Section seven How long is the arrow below the ruler? Measure to the tip on the arrow. Example: answer __5/8__ answer _____ answer _____ answer _____ Section eight

77
77
Using the supplied ruler, measure each arrow to its tip very carefully.
1. answer:_____
2. answer:_____
3. answer:_____
Using the supplied ruler as a straight edge, draw a line below the ruler of the requested length. Example: 1/2” 1. 7/16” 2. 1/8” 3. 3/16” Using the supplied ruler, draw a line the requested length starting at the dot. Draw carefully and accurately!
1. 15/16” . 2. 5/8” .
3. 3/16” .

78
78
Section nine Can you figure out the length of the line using the pictures of the rulers where some of the lines are missing? Example: 0 1 answer _7/8__ 0 1 0 1 0 1 1. answer:_____ 2. answer:_____ 3. answer:_____ Section ten 1. Take the blue plastic anchor out of the bag. Using the ruler supplied, measure the anchor’s length to the nearest 1/16th of an inch. Record the length below and replace the anchor in the bag.
Plastic anchor length:_____inches
2. Take the large playing card out of the bag. Using the ruler supplied, measure the playing card’s length and width to the nearest 1/16th of an inch. Record the length and width below and replace the playing card in the bag
Large playing card length:_____inches width:_____inches
3. Take the eraser out of the bag. Using the ruler supplied, measure the eraser’s length, width, and depth to the nearest 1/16th of an inch. Record the length below and replace the eraser in the bag.
Eraser length:_____inches width:_____inches depth:_____inches

79
79
Appendix B
Pretest

80
80
Ruler Reading Section one: recognizing parts to whole Into how many parts is each rectangle divided?
Example: answer_2___ 1. answer_____
2. answer _____
3. answer _____ How many parts are shaded in each rectangle?
Example: answer_2___
1. answer _____
2. answer _____
3. answer _____
What is the number of parts shaded compared to the total number of parts?
Example: answer_5/8___
1. answer _____
2. answer _____
3. answer _____
Section two: drawing parts to whole Without using the ruler, divide the boxes into equal pieces.
Teacher to complete Number: ________

81
81
Example: 2 pieces
1. 16 pieces
2. 4 pieces
3. 8 pieces
Without using the ruler, divide the box into equal pieces and lightly shade in the numbers of parts requested. Lightly shade the boxes so the scorer can count the number of boxes shaded.
Example: 1 shaded part of 16 parts
1. 7 shaded parts of 8 parts
2. 1 shaded part of 4 parts
3. 3 shaded parts of 16 parts
Without using the ruler, divide the rectangle into equal sized boxes and lightly shade the number of boxes required by the fraction.
Example: 1/4
1. 1/8
2. 15/16 3. 3/4
Section three: dividing a line

82
82
Into how many parts is each line divided?
Example: answer_2___ 1. answer_____ 2. answer_____ 3. answer_____ Express as a fraction the number of shaded parts to the total number of parts on this line.
Example: answer 3/8___ 1. answer _____ 2. answer _____ 3. answer _____
Without using the ruler, divide the line into equal sized pieces and lightly shade that number of pieces indicated by the fraction. Example: ¾
1. 5/8
2. 1/16
3. 3/8
Section four: meaning of lines

83
83
The arrow is pointing to a mark on the ruler. Underline what division of an inch the mark represents. 0 1 0 1 0 1 0 1 Example: 1. sixteenth 1 sixteenth 1. sixteenth 1. sixteenth 2. eighth 2. eighth 2. eighth 2. eighth 3. quarter 3. quarter 3. quarter 3. quarter 4. half 4. half 4. half 4. half 5. whole 5. whole 5. whole 5. whole Section five: reading lines How long is the arrow above the ruler? Measure to the tip on the arrow. Example: answer __3/8__ answer _____ answer _____ answer _____ Section six: measuring efficiently Can you figure out the length of the line using the pictures of the rulers where some of the lines are missing? Example: answer _7/8__ 0 1

84
84
0 1 0 1 0 1 1. answer:_____ 2. answer:_____ 3. answer:_____ Section seven: measuring lines Using the supplied ruler, measure each arrow to its tip very carefully.
1. answer:_____
2. answer:_____
3. answer:_____
Using the supplied ruler as a straight edge, draw a line above the ruler of the requested length. Example: ½” 1. 7/16” 2. 1/8” 3. 3/16” Using the supplied ruler, draw a line the requested length starting at the dot. Draw carefully and accurately!
1. 15/16” . 2. 5/8” .
3. 3/16” .
Section eight: estimating and measuring objects

85
85
Using the objects in the supplied bag, estimate the following items to the nearest 1/16”. 1. Take the clothespin out of the bag. Estimate its length. Record the length in the space below and return the clothespin to the bag.
Clothes pin length:_____inches 2. Take the small playing card out of the bag. Estimate its length and width. Record the length and width below. Return the card to the bag. Small playing card length:_____inches width:_____inches 3. Take the package of gum out of the bag. Estimate its length, width, and depth. Record the estimates below. Return the gum to the bag.
Package of gum length:_____inches width:_____ inches depth:_____inches Using the objects in the supplied bag, measure the following items to the nearest 1/16th” 1. Take the blue plastic anchor out of the bag. Using the ruler supplied, measure the anchor’s length to the nearest 1/16th of an inch. Record the length below and replace the anchor in the bag.
Plastic anchor length:_____inches
2. Take the large playing card out of the bag. Using the ruler supplied, measure the playing card’s length and width to the nearest 1/16th of an inch. Record the length and width below and replace the playing card in the bag
Large playing card length:_____inches width:_____inches
3. Take the eraser out of the bag. Using the ruler supplied, measure the eraser’s length, width, and depth to the nearest 1/16th of an inch. Record the length below and replace the eraser in the bag.
Eraser length:_____inches width:_____inches depth:_____inches

86
86
Appendix C
Cover Sheet

87
87
Ruler Reading Study
Name: _____________________________ Information about the participates: 1. Male _____ Female _____ 2. Age: _____ years _____months 3. What elementary school did you attend? School name: _________________________ City: ________________________________ 4. Where do you generally do your homework? Kitchen table _____ Bedroom _____ Living room _____ Computer desk _____ Other (name) _____ 5. How quiet is it in the area that you do your homework? Quiet ______ Occasionally noisy _____ Noisy _____ 6. Who helps you with your homework? Parent _____ Sister/Brother ______ Friend _____ Homework hotline _____ Other (name) _____________________ 7. I have learned to read a ruler in elementary school? Yes _____ No _____ 8. I remember how to read a ruler? Yes _____ No _____
Teacher to complete: Number: ________ Permission given Yes _____ No _____
88
88
Appendix D
Posttest

89
89
Ruler Reading Posttest Section one: recognizing parts to whole Into how many parts is each rectangle divided?
Example: answer_2___ 1. answer_____
2. answer _____
3. answer _____ How many parts are shaded in each rectangle?
Example: answer_2___
1. answer _____
2. answer _____
3. answer _____
What is the number of parts shaded compared to the total number of parts?
Example: answer_5/8___
1. answer _____
2. answer _____
3. answer _____ Section two: drawing parts to whole

90
90
Without using the ruler, divide the boxes into equal pieces.
Example: 2 pieces
1. 8 pieces
2. 16 pieces
3. 4 pieces
Without using the ruler, divide the box into equal pieces and lightly shade in the numbers of parts requested. Lightly shade the boxes so the scorer can count the number of boxes shaded.
Example: 1 shaded part of 16 parts
1. 5 shaded parts of 8 parts
2. 3 shaded part of 4 parts
3. 7 shaded parts of 16 parts
Without using the ruler, divide the rectangle into equal sized boxes and lightly shade the number of boxes required by the fraction.
Example: 1/4
1. 7/8
2. 3/16 3. 1/2
Section three: dividing a line Into how many parts is each line divided?

91
91
Example: answer_2___
1. answer_____ 2. answer_____ 3. answer_____ Express as a fraction the number of shaded parts to the total number of parts on this line.
Example: answer 3/8__ 1. answer _____ 2. answer _____ 3. answer _____
Without using the ruler, divide the line into equal sized pieces and lightly shade that number of pieces indicated by the fraction. Example: ¾
1. 5/8
2. 9/16
3. 5/8
Section four: meaning of lines The arrow is pointing to a mark on the ruler. Underline what division of an inch the mark represents.

92
92
0 1 0 1 0 1 0 1 Example: 1. sixteenth 1 sixteenth 1. sixteenth 1. sixteenth 2. eighth 2. eighth 2. eighth 2. eighth 3. quarter 3. quarter 3. quarter 3. quarter 4. half 4. half 4. half 4. half 5. whole 5. whole 5. whole 5. whole
Section five: reading lines How long is the arrow above the ruler? Measure to the tip on the arrow. Example: answer __3/8__ answer _____ answer _____ answer _____ Section six: measuring efficiently Can you figure out the length of the line using the pictures of the rulers where some of the lines are missing? Example: answer _7/8__ 0 1 0 1 0 1 0 1 1. answer:_____ 2. answer:_____ 3. answer:_____ Section seven: measuring lines Using the supplied ruler, measure each arrow to its tip very carefully.
1. answer:_____

93
93
2. answer:_____
3. answer:_____
Using the supplied ruler as a straight edge, draw a line above the ruler of the requested length. Example: ½” 1. 7/8” 2. 3/8” 3. 11/16” Using the supplied ruler, draw a line the requested length starting at the dot. Draw carefully and accurately!
1. 3/8” . 2. 5/8” .
3. 7/16” .
Section eight: estimating and measuring objects

94
94
Using the objects in the supplied bag, estimate the following items to the nearest 1/16th”. 1. Take the clothespin out of the bag. Estimate its length. Record the length in the space below and return the clothespin to the bag.
Clothes pin length:_____inches 2. Take the small playing card out of the bag. Estimate its length and width. Record the length and width below. Return the card to the bag. Small playing card length:_____inches width:_____inches 3. Take the package of gum out of the bag. Estimate its length, width, and depth. Record the estimates below. You may have the package of gum.
Package of gum length:_____inches width:_____ inches depth:_____inches Using the objects in the supplied bag, measure the following items to the nearest 1/16th” 1. Take the blue plastic anchor out of the bag. Using the ruler supplied, measure the anchor’s length to the nearest 1/16th of an inch. Record the length below and replace the anchor in the bag.
Plastic anchor length:_____inches
2. Take the large playing card out of the bag. Using the ruler supplied, measure the playing card’s length and width to the nearest 1/16th of an inch. Record the length and width below and replace the playing card in the bag
Large playing card length:_____inches width:_____inches
3. Take the eraser out of the bag. Using the ruler supplied, measure the eraser’s length, width, and depth to the nearest 1/16th of an inch. Record the length below and replace the eraser in the bag.
Eraser length: _____inches Width: _____inches depth: _____inches

95
95
Appendix E
Analysis of Individual Items on the Test

96
96
Analysis of individual items on test
Pretest Pretest Pretest Posttest Posttest Posttest Pretest/Posttest correct incorrect missing correct Incorrect missing change
Section 1: item 1 24 0 0 24 0 0 0 Section 1: item 2 23 1 0 24 0 0 1 Section 1: item 3 24 0 0 24 0 0 0 Section 1: item 4 23 1 0 24 0 0 1 Section 1: item 5 23 1 0 23 1 0 0 Section 1: item 6 23 1 0 24 0 0 1 Section 1: item 7 24 0 0 24 0 0 0 Section 1: item 8 21 3 0 24 0 0 3 Section 1: item 9 23 1 0 24 0 0 1 Section 2: item 1 21 3 0 22 1 1 1 Section 2: item 2 22 2 0 22 1 1 0 Section 2: item 3 20 4 0 23 1 0 3 Section 2: item 4 18 6 0 21 2 1 3 Section 2: item 5 24 0 0 22 1 1 -2 Section 2: item 6 17 7 0 19 4 1 2 Section 2: item 7 21 3 0 22 1 1 1 Section 2: item 8 19 5 0 21 2 1 2 Section 2: item 9 23 1 0 23 0 1 0 Section 3: item 1 21 3 0 24 0 0 3 Section 3: item 2 22 2 0 24 0 0 2 Section 3: item 3 23 1 0 24 0 0 1 Section 3: item 4 21 3 0 24 0 0 3 Section 3: item 5 20 4 0 24 0 0 4 Section 3: item 6 23 1 0 24 0 0 1 Section 3: item 7 18 6 0 19 5 0 1 Section 3: item 8 16 8 0 23 1 0 7 Section 3: item 9 16 8 0 21 3 0 5 Section 4: item 1 17 7 0 20 4 0 3 Section 4: item 2 14 10 0 20 4 0 6 Section 4: item 3 16 8 0 19 5 0 3 Section 5: item 1 15 9 0 16 8 0 1 Section 5: item 2 10 14 0 16 8 0 6 Section 5: item 3 14 9 1 17 7 0 3 Section 6: item 1 7 15 2 12 12 0 5 Section 6: item 2 11 11 2 15 9 0 4 Section 6: item 3 10 12 2 14 10 0 4 Section 7: item 1 10 11 3 10 14 0 0 Section 7: item 2 10 11 3 10 14 0 0 Section 7: item 3 3 18 3 14 10 0 11 Section 7: item 4 12 9 3 18 6 0 6 Section 7: item 5 14 7 3 17 7 0 3 Section 7: item 6 12 9 3 17 7 0 5 Section 7: item 7 13 7 4 16 7 1 3 Section 7: item 8 11 9 4 13 10 1 2 Section 7: item 9 12 8 4 14 9 1 2 Section 8: item 1 7 9 8 11 11 2 4 Section 8: item 2L 3 13 8 12 8 4 9

97
97
Section 8: item 2W 3 13 8 7 13 4 4 Section 8: item 3L 11 3 10 15 6 3 4 Section 8: item 3W 8 6 10 11 10 3 3 Section 8: item 3D 5 9 10 9 12 3 4 Section 8: item 4 4 9 11 5 16 3 1 Section 8: item 5L 4 9 11 6 15 3 1 Section 8: item 5W 4 9 11 5 16 3 1 Section 8: item 6L 7 6 11 13 8 3 6 Section 8: item 6W 7 6 11 8 13 3 1 Section 8: item 6D 6 7 11 7 14 3 1

98

99
99
Appendix F
Correct Responses for Pretest and Posttest by Students

100
100
Correct responses for pretest and posttest by student Posttest results are in parenthesis. Subject Pre/Post Pre/Post Pre/Post Pre/Post Pre/Post Pre/Post Pre/Post Pre/Post Pre/Post Total Number Section 1 Section 2 Section 3 Section 4 Section 5 Section 6 Section 7 Section 8A Section 8B 101 9 (9) 9 (9) 8 (9) 3 (2) 1 (3) 0 (2) 7 (8) 2 (3) 1 (2) 40(47) 102 9 (9) 9 (9) 9 (9) 3 (3) 3 (3) 3 (3) 8 (8) 4 (2) 2 (6) 50(52) 104 9 (9) 9 (9) 6 (9) 1 (3) 1 (3) 3 (3) 7 (8) 3 (2) 4 (1) 43(47) 105 8 (9) 1 (8) 3 (7) 0 (3) 1 (0) 0 (0) 0 (0) 0 (0) 0 (0) 13(27) 106 9 (9) 8 (9) 6 (9) 3 (3) 3 (3) 3 (3) 9 (8) 3 (3) 6 (3) 50(50) 108 9 (9) 6 (8) 4 (7) 2 (1) 3 (2) 0 (0) 0 (0) 0 (3) 0 (1) 24(31) 109 9 (9) 5 (7) 9 (8) 3 (3) 0 (1) 0 (2) 7 (1) 0 (4) 0 (0) 33(35) 110 9 (9) 9 (9) 9 (9) 1 (3) 0 (3) 0 (0) 0 (4) 0 (4) 0 (2) 28(43) 111 8 (9) 6 (9) 6 (9) 1 (3) 1 (0) 1 (1) 1 (7) 1 (1) 0 (0) 25(39) 112 9 (9) 9 (9) 9 (9) 3 (3) 1 (2) 0 (0) 1 (1) 0 (0) 0 (0) 32(33) 113 9 (9) 9 (9) 9 (9) 3 (3) 3 (3) 3 (3) 8 (9) 6 (4) 6 (3) 56(52) 115 9 (9) 8 (9) 9 (8) 3 (3) 3 (3) 2 (3) 0 (8) 0 (0) 0 (0) 34(43) 116 9 (9) 9 (9) 9 (9) 0 (0) 0 (3) 0 (2) 0 (4) 0 (0) 0 (0) 27(36) 117 9 (9) 8 (9) 8 (9) 3 (3) 3 (3) 3 (2) 9 (9) 0 (3) 2 (2) 45(49) 118 6 (9) 7 (5) 5 (9) 3 (3) 3 (2) 2 (3) 9 (7) 0 (5) 2 (4) 37(47) 119 9 (9) 7 (0) 8 (9) 1 (3) 1 (0) 1 (3) 2 (4) 4 (4) 2 (4) 35(36) 120 9 (9) 9 (7) 8 (9) 2 (3) 1 (0) 0 (0) 2 (4) 3 (4) 0 (3) 34(39) 121 9 (9) 9 (9) 9 (9) 2 (3) 2 (3) 2 (3) 8 (8) 0 (6) 0 (4) 41(54) 122 8 (9) 9 (9) 7 (7) 1 (1) 3 (2) 0 (3) 0 (5) 3 (5) 1 (2) 32(43) 123 9 (9) 9 (9) 6 (9) 3 (3) 3 (3) 3 (3) 6 (5) 4 (5) 4 (1) 47(47) 124 9 (9) 7 (9) 6 (9) 1 (1) 1 (1) 0 (0) 4 (3) 3 (0) 2 (0) 33(32) 125 9 (9) 6 (7) 9 (8) 0 (0) 0 (0) 0 (0) 0 (2) 1 (3) 0 (1) 25(30) 126 7 (8) 8 (9) 9 (9) 3 (3) 2 (3) 2 (2) 8 (7) 0 (4) 0 (5) 39(50) 127 9 (9) 9 (9) 9 (9) 2 (3) 0 (3) 0 (0) 1 (9) 0 (0) 0 (0) 30(42)

129
Appendix G
Mean, Median, Standard Deviation for Pretest/Posttest

102
Mean Median Standard deviation
Pretest section 1 8.67 9 0.76 Posttest section 1 8.96 9 0.2 Pretest section 2 7.71 8.5 1.9
Posttest section2 8.13 9 2.01 Pretest section 3 7.5 8 1.82 Posttest section 3 8.63 9 0.71 Pretest section 4 1.96 2 1.12 Posttest section 4 2.46 3 1.12 Pretest section 5 1.63 1 1.21 Posttest section 5 2.04 3 1.23 Pretest section 6 1.17 .5 1.31 Posttest section 6 1.71 2 1.33 Pretest section 7 4.04 3 3.71 Posttest section 7 5.38 6 3.02 Pretest section 8A 1.54 .5 1.84 Posttest section 8A 1.83 1.5 1.81 Pretest section 8B 1.33 0 1.9 Posttest section 8B 1.83 1.5 1.81 Total pretest 35.54 34 9.88 Total posttest 41.83 43 7.89

103
Appendix H
Ruler Reading Section One:
Recognizing Parts to Whole

104
Ruler Reading Section one: recognizing parts to whole Name: ____________________ OBJECTIVES: Upon completion of this packet you will be able to:
• Count the number of parts in each rectangle • Count the number of parts in each rectangle that are shaded • Write a fraction that is illustrated by a picture • Draw a picture of a fraction using a box when given the fraction
Most errors made in this section are silly mistakes. Examples of errors would include counting the white boxes instead of the shaded boxes or counting the boxes incorrectly. Read carefully!! Think!! Complete the worksheet. Correct each section as you complete it. The answers are at the end of the packet. Part A. Into how many parts is each rectangle divided? Example: answer: 2 One is asked to count the boxes. The above example with the answer 2 is arrived at as follows: 1 box + 1 box = 2 boxes Try these examples on your own. Put your answer next to the box. The correct answers are at the end of the packet under Part A. a. answers answers b. _____ ______ c. d. ____ ______ e. f. _____ ______

105
g. h. _____ ______ i. j. _____ ______ Part B. How many parts are shaded in each rectangle? Here one is asked how many parts are shaded, not how many parts in the large rectangle or how many white boxes. Answer: 3 One is asked to count the number of shaded boxes. The above example with the answer 3 is arrived at as follows: 1 shaded box + 1 shaded box + 1 shaded box = 3 shaded boxes Try these examples on your own. The answers are at the end of the packet under Part B. k. answer _____ l. answer _____ m. answer _____ n. answer _____ o. answer _____ p. answer _____ q. answer _____ r. answer _____

106
s. answer _____ t. answer _____ Part C. What is the number of parts shaded compared to the total number of parts? NOTE: The question asks for shaded boxes to total boxes therefore, the shaded boxes will be the TOP number in the fraction and the total number of boxes will be the BOTTOM number in the fraction. Answer: 5 (5 shaded boxes) 8 (8 total boxes) The answers to this section of questions will always be a fraction. In the above example the number of shaded boxes is 5 and the total number of boxes is 8. The most common error in this section will be putting the incorrect total number of boxes in the fraction. Try these examples on your own. The answers are at the end of the packet under Part C. u. answer _____ v. answer _____ w. answer _____ x. answer _____ y. answer _____ z. answer _____ aa. answer _____ bb. answer _____ cc. answer _____ dd. answer _____

107

108
Appendix I
Ruler Reading Section Two:
Drawing Parts to Whole

109
Ruler Reading Section two: drawing parts to whole OBJECTIVES: Upon completion of this packet you will be able to divide the boxes into the correct number of parts. Divide this box into 16 parts. Count the number of boxes. How many do you have? ______ Most of the errors on this section happen because the rectangle was not divided into the correct number of boxes. When one draws a line in a rectangle, that line forms the end of the box. But the end line of the large rectangle forms the last end of a box. LOOK at this box, which is divided into 8 equal pieces. This line represents the This line represents the end end of box one of a box, box 9 This line represents the eighth line drawn inside the large rectangle. It is the end of box eight. HINT: How to ALWAYS get this RIGHT With a customary ruler (standard ruler divided into 16ths) every dimension or finer level is ½ the size of the level before it. Train yourself to divide the box following these directions. To practice you will need one piece of paper approximately 1 5/8” x 11” which is in the packet, a pencil, and the sample box below. DIRECTIONS: Dividing a box into two pieces: 1. Divide the rectangular piece of paper in half by putting the short ends together and folding in the middle. 2. Draw a pencil line on the fold. 3. Count the number of boxes. 4. Place a pencil line in the practice box in the same place that the pencil line is on the rectangular piece of paper. Number the boxes.

110
Practice box Example: Dividing a box into four pieces: 1. Divide the rectangular piece of paper in half as done above and then in half again. 2. Draw pencil lines on the new lines. 3. Count the number of boxes. Is it twice as many as before? ______ 4. Place the pencil lines in the practice box in the same order that they were placed on the rectangular piece of paper. Draw the centerline first because you folded the centerline first. Then draw the lines that are on each side of the centerline because they were folded second. Number the boxes. Practice box Dividing a box into eight pieces: 1. Divide the rectangular piece of paper in half and then half again as was done above and then in half again. 2. Draw pencil lines on the new lines. 3. Count the number of boxes. Is it twice as many as before? _____ 4. Place the pencil lines in the practice box in the same order that they were placed on the rectangular piece of paper. Draw the center line first, then the lines that make four boxes and finally the lines that make the eight boxes. Number the boxes. Practice box Dividing a box into sixteen pieces: 1. Divide the rectangular piece of paper in half, half again, half again, and finally half again. 2. Draw pencil lines on the new lines 3. Count the number of boxes. Is it twice as many as before? _____ 4. Place the pencil lines in the practice box in the same order that they were placed on the rectangular piece of paper. Draw the centerline first, the lines that make four boxes, then eight boxes, and finally the lines that make the sixteen boxes. Number the boxes.
1 2

111
Practice box Dividing the practice box into 16 pieces again. Notice that every time new lines are added, the existing boxes are divided in half. Practice

112
Appendix J
Ruler Reading Section Three:
Dividing a Line

113
Ruler Reading Section three: dividing a line Name: _____________________ OBJECTIVES: Upon completion of this packet you will be able to:
• Count the number of parts into which each line is divided • Write a fraction that is illustrated by a picture • Draw a picture of a fraction using a line when given the fraction
The main problems students have with this section are silly mistakes. The mistakes include being in a hurry and not answering the questions or writing a fraction like 5/5 when the answer is 5/8. The other problem, which is more serious, is not being able to divide the lines into the correct number of units. Below are some exercises. Think! The answers are at the end of the packet. Part A. Into how many parts is each line divided?
Example: answer: 2
Try these examples on your own. Put your answer next to the box. The correct answers are at the end of the packet under Part A.
a. answer: _____ b. answer: _____ c. answer: _____ d. answer: _____ Part B. Express as a fraction the number of shaded parts to the total number of parts on this ruler. Example: answer: 7/16

114
Seven divisions are colored which represents the top number of the fraction and the total number of divisions represents the bottom number of the fraction. Try these examples on your own. Put your answer next to the box. The correct answers are at the end of the packet under Part B. e. answer: _____ f. answer: _____ g. answer: _____ h. answer: _____ i. answer _____ j. answer _____ Part C: Without using the ruler, divide the unit into equal sized pieces and lightly shade that number of pieces indicated by the fraction. Example: 3/4
This exercise is just the opposite of the one above. Here you need to be concerned with the bottom number of the fraction first and then the top number. First divide the line into equal pieces indicated by the bottom number of the fraction (4). Then shade the number of pieces indicated by the top number (3). Try these examples on your own. k. 11/16 l. ¼ m. 7/8

115
n. 3/16 o. 1/2 This section needs to be corrected by you. Carefully count the spaces you have made. Item “k” should have 16 spaces between the lines. Do you have 16 spaces? Are 11 of the spaces shaded? Does your answer look like this? Continue correcting with item “l”. Do you have four spaces? Is one of the spaces shaded? Does your answer look like this? Continue correcting with item “m”. Do you have eight spaces? Are seven of the spaces shaded? Does your answer look like this? Continue correcting with item “n”. Do you have sixteen spaces? Are seven of the spaces shaded? Does your answer look like this? Continue correcting with item “o”. Do you have two spaces? Is one of the spaces shaded? Does your answer look like this?

116
If you have marked one of the problems wrong, you need to bring this paper to your teacher and explain how you figured out your answer. If you completed these problems without error, you are done with this section. Comments on this homework:

117
Appendix K
Ruler Reading Section Four:
Meaning of Lines

118
Ruler Reading Section four: meaning of lines Name: ____________________ OBJECTIVES: Upon completion of this packet you will be able to name the value represented by the length of lines on the ruler. The ruler will help you measure if you know how to use the tool. Understanding and using the lines on a ruler correctly is essential. What do those lines mean? One can figure this out by making a paper inch. To make your inch you will use the 5 pieces of paper (approximately 1 ¾” x 11”) that are in your packet. Follow the directions below to make the inch. You will use it as a reference later in this lesson. Make an inch Step 1. The first strip of paper will represent the full inch. Lay it at the bottom of your desk. Step 2. Using a second strip of paper, fold the paper in half. Draw a line on the fold and mark that line ½. Place this second strip of paper above the first strip of paper.

119
Step 3. Using a third strip of paper, fold the paper in half and then half again. The strip should have four sections. Draw a line on each fold. Since the paper is divided into four sections, the denominator (bottom number) is 4 and the numerator (top number) is the number of boxes it represents. Mark the folds ¼, 2/4, and ¾. Place this third strip of paper above the second strip of paper.
Step 4. Using a fourth strip of paper, fold the paper in halves until you have 8 sections. Draw a line on each fold. Mark the folds 1/8, 2/8, 3/8, 4/8, 5/8, 6/8, and 7/8. Place this fourth strip of paper above the third strip of paper.
Step 5. Using a fifth strip of paper, fold the paper in halves until you have 16 sections. Draw a line on each fold. Mark the folds 1/16, 2/16, 3/16, 4/16, 5/16, 6/16, 7/16, 8/16, 9/16, 10/16, 11/16, 12/16, 13/16, 14/16, and 15/16. Place this strip above the last strip.
At this point, you may want to tape the sections together so you can look at them later.

120
NOTE: The fractions 2/2, 4/4, 8/8, and 16/16 have not been marked on the ruler, as they are a whole inch. Now look at the ruler. Pretend that all the strips are attached to one another. You will note that some lines continue from one strip of paper to another. Consider these lines unbroken. What observations can you make about the ruler you made? Write down any observations about the length of the lines and the divisions of the inch. 1. ___________________________________________________________________ 2. ___________________________________________________________________ 3. ___________________________________________________________________ 4. ___________________________________________________________________ 5. ___________________________________________________________________ These are some observations that can be made. See how they compare to your observations. Do you understand these observations? Talk to a parent, friend, or teacher about the observations you do not understand. OBSERVATIONS: 1. There are four different lengths of lines. 2. The same length of line is always on the same level. 3. The shorter line, the more lines on the ruler. 4. Each strip of paper can represent one level. 5. Each level has twice as many boxes as the level above. 6. The number of boxes represented on each level is 2, 4, 8, and 16. 7. The lines on the ruler represent the end of the box. 8. The fraction on the top of the line is always the reduced fraction. 9. The edges of the paper inch represent full inches. VERY, VERY IMPORTANT POINT!! When reading a ruler that is divided into sixteenths, the only numbers that can be in the denominator (bottom number of the fraction) are 2, 4, 8, or 16. Below are illustrated the changes that occur in the change between the inch you made and a ruler. 1. This is ruler you made without the fractions. . the lines from the folds in the paper strips the paper strips

121
2. This is the ruler you made without 3. This is a twelve-inch ruler, which the lines that represent the strips. is 12 inches put together. .
1 2 The lines tell the ruler reader into how many parts that level is divided. With that in mind, now identify what the length of the line on a ruler means. C D H M K A P G E O B L J N F I Q Underline the correct answer. Example: What does line A represent? whole half quarter eighth sixteenth What does line B represent? whole half quarter eighth sixteenth What does line C represent? whole half quarter eighth sixteenth What does line D represent? whole half quarter eighth sixteenth What does line E represent? whole half quarter eighth sixteenth What does line F represent? whole half quarter eighth sixteenth What does line G represent? whole half quarter eighth sixteenth What does line H represent? whole half quarter eighth sixteenth What does line I represent? whole half quarter eighth sixteenth What does line J represent? whole half quarter eighth sixteenth What does line K represent? whole half quarter eighth sixteenth

122
What does line L represent? whole half quarter eighth sixteenth What does line M represent? whole half quarter eighth sixteenth What does line N represent? whole half quarter eighth sixteenth What does line O represent? whole half quarter eighth sixteenth What does line P represent? whole half quarter eighth sixteenth What does line Q represent? whole half quarter eighth sixteenth The answers are on the back of this sheet. If you had any problems with this section, please ask your parent or teacher to help clarify this for you. Comments on this homework:

123
Appendix L
Ruler Reading Section Five:
Reading Lines

124
Ruler Reading Section five: reading lines Name: _____________________ OBJECTIVES: Upon completion of this packet you will be able to use the lines on a ruler to determine the length of an arrow. These ruler reading exercises use a ruler. When using a ruler, let the ruler do the work for you. If one uses a few simple rules, the answer will always come out correct and the fraction will not need to be reduced. Rules: 1. Decide what line on the ruler represents the length of the arrow being measured. 2. The height of the line on the ruler will tell the number of parts into which the inch is divided. The number of parts becomes the bottom number in the fraction. This is called the denominator. At this point you are no longer concerned with shorter lines on the ruler. Reminder: a ruler that measures to 1/16” can only be divided into 2, 4, 8, or 16 parts. The denominator represents the number of parts across the whole inch. What will the denominator be? 3. Now count the number of parts to the tip of the arrow being measured. Reminder: do not count the shorter lines on the ruler. This number is the numerator or the top number in the fraction. It should always be an odd number. What will the numerator be? Here is an example. What is the length of the arrow? 0 1 Rule 1: Decide where the arrow ends. 0 1

125
Rule 2: What will the denominator be? _________ The denominator will be 8 because that length of line (second from the shortest) divided the inch into 8 parts. Do not count the lines on the ruler that are shorter, just the lines on the ruler that are the length of the line being measured or longer. Rule 3: What will the numerator be? ___________ The numerator will be 5 because the arrow being measured covered 5 of the 8 parts in the inch. The fraction is than 5/8. Since there are no whole inches, the line measures 5/8”. Try reading these lines on your own. The answers are at the end of the packet. a. b. answer: _____ answer: ______ c. d. answer: _____ answer: ______

126
e. f. answer: _____ answer: ______ g h. answer: _____ answer: ______ i. j. answer: _____ answer: ______ k. l. answer: _____ answer: ______ m. n. answer: _____ answer: ______

127
o. Comments on this homework:

128
Appendix M
Ruler Reading Section Six:
Measuring Efficiently
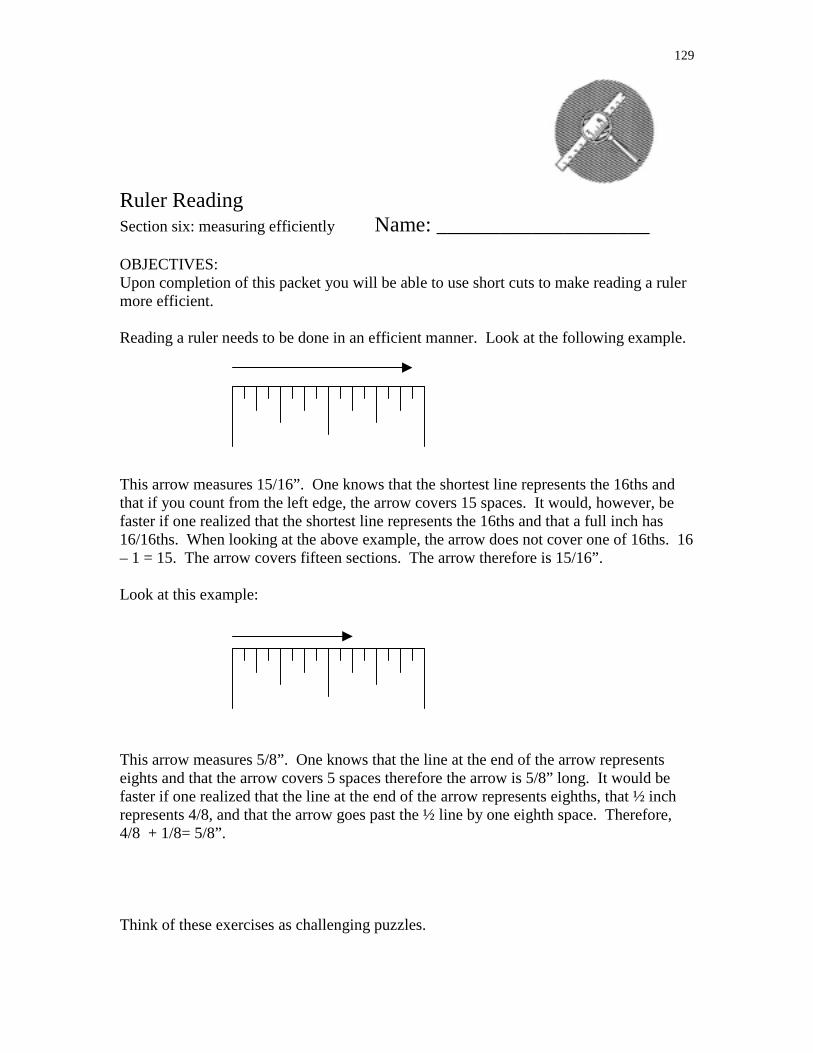
129
Ruler Reading Section six: measuring efficiently Name: ____________________ OBJECTIVES: Upon completion of this packet you will be able to use short cuts to make reading a ruler more efficient. Reading a ruler needs to be done in an efficient manner. Look at the following example. This arrow measures 15/16”. One knows that the shortest line represents the 16ths and that if you count from the left edge, the arrow covers 15 spaces. It would, however, be faster if one realized that the shortest line represents the 16ths and that a full inch has 16/16ths. When looking at the above example, the arrow does not cover one of 16ths. 16 – 1 = 15. The arrow covers fifteen sections. The arrow therefore is 15/16”. Look at this example: This arrow measures 5/8”. One knows that the line at the end of the arrow represents eights and that the arrow covers 5 spaces therefore the arrow is 5/8” long. It would be faster if one realized that the line at the end of the arrow represents eighths, that ½ inch represents 4/8, and that the arrow goes past the ½ line by one eighth space. Therefore, 4/8 + 1/8= 5/8”. Think of these exercises as challenging puzzles.

130
Some of the lines are erased from the ruler to force you to read the ruler using other cues. This exercise will help you learn to read the ruler more efficiently. Try these exercises. With some practice, it will be come automatic. Clues are included after the first four eight and twelve exercises. You are on your own for the last four. The answers are at the end of the packet. a. b. 0 1 0 1 answer _____ answer _____ c. d. 0 1 0 1 answer _____ answer _____ CLUES: Numerator: the top number in a fraction Denominator: the bottom number in a fraction a. Figure the denominator and count back from 1” to figure out the numerator. b. Start with the number of sixteenths in a half-inch and count forward. c. Identify the length of the line and count the numerator. d. Start with the number of sixteenths in a half-inch and count backwards. e. f. 0 1 0 1 answer _____ answer _____ g. h. 0 1 0 1 answer _____ answer _____

131
CLUES: Numerator: the top number in a fraction Denominator: the bottom number in a fraction e. Count backwards from the one-inch mark. f. Start with the number of eighths in a half-inch and count forward. g. Start with the number of sixteenths in a half-inch and count forward. h. Start with the number of sixteenths in a half-inch and count backwards. i. j. 0 1 0 1 answer _____ answer _____ k. l. 0 1 0 1 answer _____ answer _____ CLUES: Numerator: the top number in a fraction Denominator: the bottom number in a fraction i. Start at the half-inch mark and count backwards. j. Start at the inch mark and count backwards. k. Start at the inch mark and count backwards. l. Identify the length of the line and count the numerator. m. n. 0 1 0 1 answer _____ answer _____

132
o. p. 0 1 0 1 answer _____ answer _____ Comments on this homework:

133
Appendix N
Ruler Reading Section Seven:
Measuring Lines

134
Ruler Reading Section seven: measuring lines OBJECTIVES: Upon completion of the packet you will be able to:
• Estimate the length of straight lines • Measure lines over one inch • Draw lines over one inch
Part A Caution!! In order to measure accurately, one has to know where “0” is on the ruler. When measuring one starts at “0” which may or may not be at the end of the ruler. Let’s look at two examples.
The end of the first complete inch is marked with a “1”. The “0” will be the same height line as the one-inch line. On this ruler, the “0” is not indicated with a “0”, but is understood to be the first line in from the left hand edge of the ruler.
The end of the first complete inch is marked with a “1” as in the ruler above. In this ruler there is no line on the left hand side of the ruler the same length as the one-inch line. The first line on the ruler is a very short line indicating 1/16”. On this ruler the left edge of the ruler is considered to be “0”.

135
To help clarify where the “0” line is on the above rulers, the zero line has been printed in bold. Part B Estimating is educated guesses without tools. Try these exercises to see the many different ways to estimate. ESTIMATE: 1. How wide can you stretch your fingers from your thumb to your pinkie in inches? _______ 2. What is the distance between the floor and your thumb when you are standing up? ______ 3. How wide is your locker in inches? ______ 4. How long is your house? ______ 5. Get a ruler. Which of the following has a measurement closest to 3 feet? width of a doorway, height of a kitchen counter, length of your bathtub 6. Which of the following would normally have a length closest to 7 ½”? width of a piece of typing paper, length of your shoe, a new pencil 7. Hold a ruler in your hands. Without getting up, find an object in the room that that measures 16”. 8. Find an object in the room that is one yard (36”). Part C The emphasis has been so far has been on using a ruler to measure lines and objects less than one inch. For lines and objects that are more than one inch, the process is almost the same. Start by recording the full inches and then determine the fraction in the usual manner. Remember to write down the whole inches. Do not count any fractions in the whole inches. This will lead to unreduced fractions and more work. An answer such as 36/8” is not a usable answer. If the fraction was read correctly, it would be 41/2”. Here is an example:
1 2 In order to measure this line, start by recording the full inches, in this case 2. Then proceed in the usual manner to determine the fraction. How long is this line? _______ Try some more. This time estimate the length of the line and then measure the line. The answers are at the end of the packet under Part C.

136
a. answer: estimation _______ measured _______ b. answer: estimation ______ measured ______ c. answer: estimation ______ measured _______ d. answer: estimation ______ measured _______ e. answer: estimation ______ measured _______ f. answer: estimation ______ measured _______ g. answer: estimation ______ measured _______ h. answer: estimation _____ measured ______ Part D Now use your ruler to draw a line the requested length starting at the dot. Compare your line to the length of the wooden block indicated in parenthesis. The wooden blocks are in the packet and each one as a different number on it. It should match exactly! i. 3” (#1) . j. 1 ½” (#3) . k. 3 ¼” (#5) . l. 1 7/8” (#7) . m. 1 3/8” (#9) .

137
n. 2 11/16” (#11) . o. 3 1/16” (#13) . p. 2 7/16” (#15) . Comments on this homework:

138
Appendix O
Ruler Reading Section Eight:
Estimating and Measuring Objects

139
Ruler Reading Section eight: measuring objects OBJECTIVES: Upon completion of this packet you will be able to measure objects successfully to 1/16th of an inch. Rules for measuring: 1. Decide what line on the ruler represents the length of the object being measured. 2. Measure and write the whole inches first. 3. Determine the denominator (bottom number) of the fraction. The height of the line will tell the denominator of the fraction. Remember: a ruler that measures to 1/16” can only have denominators of 2, 4, 8, or 16. That denominator represents the number of parts across the whole inch. 4. Determine the numerator (top number) of the fraction. Now count the number of parts up to the line on the ruler being measured. Reminder: do not count the shorter lines on the ruler. This number is the numerator. It should always be an odd number. To do this exercise, you will need the bag of wooden blocks in the packet and the answer sheet for ruler reading blocks. Each wooden block has a number on one surface. Use the length (longest distance) and width (shortest distance) on that surface to measure. Then starting with any block:
1. Estimate the length and width of the block. 2. Record on the answer sheet. 3. Measure the length and the width of the block using your ruler and the above stated rules. 4. Record on the answer sheet. 5. Check the answer with the answer sheet after completing each block.
You have done an excellent job of estimating if your answers are within the fractions on the answer sheet. The ACTUAL measurements should be exactly the same. Continue to practice measuring the blocks until you are confident that you can do it correctly. Two answer sheets are included in the packet. Refer to prior lessons for help or see your teacher if you still have problems.

140
Comments on this homework:
Estimation
Actual
Block Number
WIDTH
LENGTH
WIDTH
LENGTH
1
2
3
4
5
6
7
8
9
10
11
12
13
14
15