development of innovative microfluidic polymeric technologies for
TRANSCRIPT

Development of Innovative
Microfluidic Polymeric Technologies
for Point-of-care & Integrated
Diagnostics Devices
by
Jose Luis Garcia Cordero (B.Sc., M.Sc.)
A thesis submitted in partial fulfillment of the
requirements for the degree of
Doctor of Philosophy
Dublin City University
2010
Research Supervisor: Prof. Antonio J Ricco
Co-Supervisor: Prof. Jens Ducree
Biomedical Diagnostics Institute / School of Physical Sciences
Dublin City University
April 2010

ii
I hereby certify that this material, which I now submit for assessment on the programme
of study leading to the award of Doctor of Philosophy is entirely my own work, that I have
exercised reasonable care to ensure that the work is original, and does not to the best of my
knowledge breach any law of copyright, and has not been taken from the work of others save
and to the extent that such work has been cited and acknowledge within the text of my work.
Signed:
ID No.:
Date:

v
Contents
1. Introduction .................................................................................................1
1.1 Diagnostics ............................................................................................2
1.2 Human and veterinary diagnostics........................................................4
1.3 Point-of-care diagnostics.......................................................................4
1.4 Microfluidics and lab-on-a-chip technologies......................................5
1.5 Centrifugal microfluidics ......................................................................5
1.6 Scope of the thesis.................................................................................6
1.7 References ...........................................................................................13
2. The Philosophy of Lab-on-a-Chip ...........................................................15
2.1 Introduction .........................................................................................16
2.2 Historical perspective..........................................................................17
2.3 Miniaturization ....................................................................................19
2.4 Microfluidics: fluid movement and handling .....................................20
2.5 Fabrication...........................................................................................21
2.6 The lab-on-a-chip concept ..................................................................22
2.7 Conclusions .........................................................................................24
2.8 References ...........................................................................................26
3. A Point-of-care Microfluidic Sedimentation Cytometer (POC-SeCy)
for Milk Quality and Bovine Mastitis Monitoring ................................27
3.1 Introduction .........................................................................................28
3.2 Design..................................................................................................33
3.2.1 General concept of separation and analysis...............................33
3.2.2 Number of cells ..........................................................................33
3.2.3 Properties of milk, cells, and fat globules..................................33
3.2.4 Device.........................................................................................34
3.2.6 Sample volume and channel geometry dimensions ..................36
3.3 Materials and methods ........................................................................37
3.3.1 Disc fabrication ..........................................................................37
3.3.2 Milk collection ...........................................................................39
3.3.3 Spinning station and optical setup .............................................39
3.4 Results and Discussions ......................................................................40
3.4.1 Characterization .........................................................................40
3.4.2 Operational angular speeds ........................................................41

vi
3.4.3 Theory sedimentation time ........................................................42
3.4.4 Fat globules sedimentation time ................................................43
3.4.5 Somatic cells sedimentation time ..............................................44
3.4.6 Cell counts and fat percentage ...................................................46
3.5 Reader..................................................................................................48
3.6 Conclusions .........................................................................................50
3.7 References ...........................................................................................50
4. Liquid Recirculation in Microfluidic Channels by the Interplay of
Capillary and Centrifugal Forces............................................................55
4.1 Introduction .........................................................................................56
4.2 Recirculation Concept.........................................................................59
4.3 Experimental Details...........................................................................61
4.3.1 Design of devices .......................................................................61
4.3.2 Fabrication of devices ................................................................61
4.3.3 Test solution ...............................................................................62
4.3.4 Spinning station and optical setup .............................................62
4.4 Results and Discussions ......................................................................63
4.4.1 Capillary filling ..........................................................................63
4.4.2 Centrifugal-capillary interaction................................................65
4.4.3 Acceleration test.........................................................................67
4.4.4 Sampling time ............................................................................68
4.5 Design Rules .......................................................................................70
4.6 Applications.........................................................................................70
4.7 Conclusions .........................................................................................72
4.8 References ...........................................................................................72
5. Towards a Monolithic Centrifugal Microfluidic Platform
for Bacteria Capture and Concentration, Lysis, Nucleic-Acid
Amplification, and Real-Time Detection ...............................................77
5.1 Introduction .........................................................................................78
5.2 Nucleic acid sequence-based amplification (NASBA) ......................79
5.3 Device. Generation 1 ..........................................................................81
5.3.1 Design and fabrication ...............................................................81
5.3.2 Results and discussions..............................................................83
5.3.3 Conclusions ................................................................................85
5.4 Device. Generation 2 ..........................................................................86
5.4.1 Design and fabrication ...............................................................86

vii
5.4.2 E. coli culture .............................................................................88
5.4.3 Real-time amplification..............................................................88
5.4.4 Device operation ........................................................................89
5.4.5 Results and discussions..............................................................91
5.4.6 Conclusions ................................................................................92
5.5 References ...........................................................................................93
6. Optically Addressable Single-use Microfluidic Valves by
Laser Printer Lithography......................................................................97
6.1 Introduction .........................................................................................98
6.2 Concept..............................................................................................101
6.3 Microfluidic Operation......................................................................102
6.4 Materials and methods ......................................................................104
6.4.1 Fabrication................................................................................104
6.4.2 Characterization .......................................................................104
6.4.3 Experimental set-up .................................................................104
6.5 Results and discussions.....................................................................106
6.5.1 Optical Spectra .........................................................................106
6.5.2 Printer toner composition and adhesion ..................................106
6.5.3 Orifice size and response times................................................107
6.5.4 Laser beam - plastic interactions..............................................111
6.6 Microfluidic devices examples .........................................................112
6.6.1 Liquid microfluidic display......................................................112
6.6.2 Centrifugal microfluidic device ...............................................114
6.6.3 Long-term reagent storage .......................................................114
6.7 Conclusions .......................................................................................116
6.8 References .........................................................................................117
7. Summary, Conclusions and Future Prospects.....................................121
7.1 References .........................................................................................127
Appendix ......................................................................................................131
List of Publications, Conference Proceedings, and Patents ....................136
Acknowledgments ........................................................................................139

1
1
Introduction

Chapter 1
2
1.1 Diagnostics
Traditionally, healthcare systems have relied on a patient-doctor relationship in which the
patient regards the doctor as the ultimate expert and trusts his/her good judgment. The patient
visits a doctor in his/her office or at the hospital and explains his or her symptoms during the
consultation. Depending on the condition, the diagnostic cycle begins with the doctor ordering
laboratory tests. What follows can be an excruciating process that can take from 2 hours to 4
days to get a result back from the laboratory.1
The diagnostic cycle involves four major steps: sample collection, sample pre-treatment,
analyte detection and measurement, and interpretation. The rest of the steps deal more with
administration and logistics tasks ranging from the personnel involved in the process to the
labeling, transportation, and quality control of the sample. It is estimated that there could be as
many as 56 steps between a doctor requesting a test and receiving the result.1 Figure 1.1
illustrates some of the activities involved in the diagnostic cycle. Based on the test results, the
doctor can order more specific tests or make a decision on a drug treatment, hospitalization, or
surgery. A similar cycle is applicable to other settings such as the emergency room (ER), the
operation room (OR), or intensive care units (ICUs).
Figure 1.1 Steps involved in the diagnostic cycle. Adapted from 1.
The diagnostic cycle begins by collecting the specimen (blood, urine, feces, or tissue
samples) either in the same doctor’s office or in a test facility where the patient may have to
make an appointment beforehand. The specimen is then labeled and transported to the clinical
laboratory. Specimen preparation may be required to “clean up” the sample in order to isolate
the analyte of interest in a form compatible with the laboratory analyzer (used to detect and

Introduction
3
measure the analyte). The specimen may also require an incubation time, such as in blood
culturing for pathogens. Sample preparation can include a variety of tasks either performed
individually or in tandem, such as centrifugation, filtration, distillation, dilution, target
amplification, and target extraction.2 These tasks can be manually performed by trained
personnel; however, some modern facilities have instruments that automate most of these tasks.
Next, the processed sample is analyzed by various techniques and instruments such as enzyme-
linked immunosorbent assay (ELISA), flow cytometry, or polymerase chain reaction (PCR), to
name a few.
Next in the diagnostic process, after the analyte has been detected, quantified, and
validated, is the interpretation step. The results are compared to a reference point associated
with normality or with previous results when monitoring the progression of a disease. A report
is then sent to the doctor indicating the significance of the results. The doctor should be able to
take a decision or may continue the cycle by soliciting more specific tests.
There are historical and economic reasons why the diagnostic cycle happens this way.
Ideally, a doctor should be able to accurately diagnose in a single consultation any health
problems regarding the patient condition, which will eliminate or diminish the number of
follow-up visits. For the patient this will translate into time and cost savings. Also, faster test
turnaround times mean earlier therapeutic interventions, which increase the chances of a
successful outcome. However, many of the instruments or techniques used in diagnostics are
difficult to bring into a doctor’s office because (i) maintenance, operation, and running costs of
the instruments are very expensive, (ii) some instruments/techniques require conditioned rooms
for their operation, and (iii) trained personal are needed to operate the equipment and interpret
results. Therefore, it is more economical and practical to channel the tests to centralized clinical
laboratories, which combine a set of instruments, personnel, and unique facilities to perform
most of the clinical tests.
Processing all the tests in a clinical laboratory, however, suffers from many
disadvantages: long turnaround times (in the ER or OR, turnaround times become critical to
make decisions that can save a life), inconvenience for patients, and high costs for both the
patient and healthcare systems. As noted above, there are up to 56 steps involved in the
diagnostic cycle, giving rise to frequent errors and largely responsible for delays in the delivery
of a result.3 Specimens not processed in timely manner, sample mislabeling or misplacement,
inappropriate identification of patients, and errors during transportation are some of the pitfalls
of the process.4,5 Despite these problems, clinical laboratories remain the workhorses of
diagnostics in most of the developed world.

Chapter 1
4
1.2 Human and veterinary diagnostics
Most of the time the term diagnosis refers to human diagnostics. However, the diagnosis
of livestock diseases is potentially more challenging than human diseases. Depending on the
disease, human beings have the ability to describe their symptoms, often before the disease
becomes serious, but for animals it is only when symptoms become visible that veterinarians
can begin diagnosis of the disease, and oftentimes visible symptoms are an indication that the
disease has escalated to such a point that the chances of successful treatment are minimal.
Diseases are progressive and some can take a number of weeks to develop, but even in
the early stages there are indicators that can be used for early diagnosis. Therefore, monitoring
these indicators on a continual basis is necessary to prevent escalation of a particular disease.
Veterinarians also need to be able to process an easily accessible body fluid such as saliva,
urine, feces, or milk, and as a last resort, blood, which is more costly and requires more
resources.
The logistics for diagnosing infections and diseases in livestock share a number of
similarities with human diagnostics. Consider the case of bovine mastitis. Mastitis is a
common disease that afflicts dairy cattle worldwide; it is caused by a range of pathogens. As
with the diagnostic cycle, milk samples are collected from the farm, labeled, and transported to
a central laboratory where multiple tests are performed on the milk. Finally a technician reports
the result back to the farmer or veterinarian, who may then take a decision on administering
antibiotics or isolating the animal. Problems with transportation, sample mislabeling, and
identification are also typical in this process.
1.3 Point-of-care diagnostics
Point-of-care (POC) testing is seen as one possible solution to the problems encountered
in clinical or veterinary laboratories.3 POC medical diagnosis means that clinical tests (i) are
performed near the location of patient care (ii) use easy-to-operate devices that analyze the
patient specimens in a short time and (iii) are carried out by personnel who may or may not
have some training in related laboratory practice.3 This has been made possible by (1) recent
technological developments that have permitted some clinical tests to be miniaturized and
simplified and (2) scientific advances in molecular biology that have accelerated the discovery
of new biomarkers and the precise identification of pathogens at the molecular level.6.
Although shortening the diagnostic cycle to provide faster turnaround times is perceived
to be the main benefit of POC testing,1 other advantages have been identified, such as a
reduction in analytical errors, shortened length of stay in the ER, immediate identification of
life-threatening conditions, and increased patient compliance and satisfaction, among others.3,4,7
POC diagnostic devices are likely to revolutionize and improve global public health by

Introduction
5
diagnosing diseases in a more timely manner, preventing epidemics, controlling chronic health
conditions, tailoring treatments, and decreasing national healthcare system costs.6,8,9 Criticisms
of POC testing typically focus on their accuracy, instrument/test calibration, quality control,
training requirements, and the limited number of tests that is currently available.3,4 Although
many of these issues also pertain to centralized laboratory testing, they are better controlled
there because of rigorous standards.7 There is still much debate on the benefits and pitfalls of
POC testing and it will likely remain the subject of controversy until it proves its economic
benefits over the centralized laboratory for a wide range of tests, and until it is widely adopted
by doctors and nurses.7
The developing world presents an ideal environment in which to adopt the philosophy of
POC testing because, contrary to developed nations, healthcare infrastructure is typically found
mostly in large cities.9 On the other hand, healthcare workers are the main source of healthcare
in rural areas, where most of the population is usually concentrated, but where healthcare
infrastructure is lacking or intermittent; there may even be a lack of basic services such as
running water and electricity.9 POC systems for deprived-resource settings, therefore, require
portability, easy disposability, low cost, simplicity of use, ruggedness, and a degree of
temperature independence.6,8,9 They also need to deliver assay results with similar sensitivity,
reproducibility, and selectivity to centralized laboratory tests.6,8,9 Finally, POC devices should
operate with minimal, non-expert operator attention.
1.4 Microfluidics and lab-on-a-chip technologies
Of the different technologies that currently exist to address the technological aspects of
POC test development, microfluidic and lab-on-a-chip technologies have the potential and the
toolset to make many POC diagnostic systems a reality.8,10 The lab-on-a-chip vision is to
miniaturize clinical laboratory processes, integrating them onto disposable units the size of a
credit card using minute amounts of complex samples and precious reagents. These
autonomous and integrated chips would consist of different modules or components to handle a
complex sample such as blood, preparing it and mixing it with the necessary reagents to
produce a signal that can be detected by a miniaturized detection system.
1.5 Centrifugal microfluidics
Most of the work presented in this thesis is based on the controlling of liquid flow in
microfluidic channels using centrifugal forces. A plastic circular substrate, usually the size of a
Compact Disc (CD), is commonly used as the platform upon which to form microfluidic
networks or to mount devices. The size of the CD can accommodate many assays on a single
disc. The CD is mounted on the spindle of a rotary motor and, upon spinning the disc, fluids
flow through the channels, driven by radially directed forces. Researchers often use the term
Chapter 1
6
Lab-on-a-CD to refer to centrifugal microfluidics.11
Centrifugal microfluidics offers several advantages compared to other, more commonly
used methods to transport and handling fluids in microchannels, namely pressure-driven flow
using syringe pumps, diaphragm pumping, or electrokinetic phenomena.12,13 By controlling the
angular speed, the length of the channel, and its radial distance from the center of rotation, flow
rates from 1nL/sec to 100 µL/sec can be achieved.12 Microfluidic mixing is easily implemented
by periodically alternating the direction of rotation. The centrifugal platform has successfully
pumped biological fluids and solutions with a range of physicochemical properties. Valving
can be accomplished by exploiting capillary forces, hydrophobic methods, and more recently
using paraffin-based valves.14 Fluid metering and flow switching are also relatively easy to
implement in this platform. Applications of the centrifugal platform include whole-blood
processing, sample lysis and homogenization, nucleic acid amplification (PCR and digital-
PCR), immunoassays, DNA hybridization onto microarrays, and cell-based assays.11
These characteristics have made the CD a versatile platform to carry out a variety of bio-
assays; they are the reasons we decided to employ this platform for the various devices
presented in this thesis.
The theory behind microfluidic centrifugal pumping is explained in Chapter 4. The same
chapter also presents a detailed study of the coupling of centrifugal and capillary forces in a
microchannel. The sedimentation theory of particles, with application to the movement of cells
under centrifugally generated forces, is presented in Chapter 3. Valves for centrifugal
microfluidics are discussed in detail in Chapter 6.
1.6 Scope of the thesis
The goal of the work described by this thesis was the development of POC diagnostic
tests based on microfluidic and lab-on-a-chip technologies. Chapter 2 describes the advantages
of using these technologies for POC testing, as well as the hurdles that impede the field as its
workers attempt to realize the vision of miniaturizing lab-on-a-chip systems to the size of a
credit card, this despite the significant progress that has been achieved over nearly two decades
of research and development on this topic. In the same chapter, we explore the key components
in a lab-on-a-chip technology and show how this vision shaped the work described in this thesis.
Because diagnostics encompasses a diverse selection of topics, the work described in this
thesis is focused on the case of veterinary diagnostics, more specifically bovine mastitis (BM).
BM offers a good model of the diagnostic cycle, as there are similar steps involved during the
diagnostic process. However, sample handling and safety requirements are less stringent than
when using blood or human cells from the point of view of regulatory bodies (although
obtaining milk samples with desired properties proved not to be as easy as expected).

Introduction
7
The BM project was also one of three integration projects in the first five-year funding
cycle of the Biomedical Diagnostics Institute (BDI); the objective of the BM project was to
develop integrated diagnostic tests for the detection of BM, see Figure 1.2. There were two
partners working along with the BDI to reach this objective. One team, from the National
University of Ireland (NUI) Galway, supported the project in the area of molecular biology,
optimizing assays, and developing molecular probes. Enfer, our industrial partner, is an Irish
veterinary diagnostics company that provides advanced diagnostics to improve animal disease
management. The BDI team led the integration and miniaturization of the assays onto
microfluidic platforms.
Figure 1.2 Early conceptual design of the BM diagnostic chip. At the beginning of the project, there
were four parameters that were chosen as a basis to diagnose mastitis: electrical conductivity, somatic cell
count, bacterial cell count, and bacteria identification. We ingenuously believed all of them could be
integrated into a single microfluidic platform.
Our objective was to develop two different POC-based microfluidic devices to diagnose
BM. Both devices would take a sample of raw milk and present an answer to the user after
analysis of the sample. The first goal was to develop an easy-to-use and cost-effective POC
diagnostic device that would measure the number of somatic cells in milk. This device would
give an indication of a potential infection in the animal, but would not identify the causative
pathogen. If the result of this test were positive, a more expensive, sophisticated, and ambitious
lab-on-a-chip device would determine the type of bacteria causing the infection. Based on this,
a farmer (or veterinarian) could decide if the animal would need a particular antibiotic or should
be separated from the rest of the herd to prevent more infections.
In the development of this second device, our team consisted of scientists with different
backgrounds and expertise ranging from chemistry, molecular biology, and microbiology, to
optics, physics, and engineering. Our target was the detection of 10 bacteria in 1 mL of milk.
There are different bacteria that cause BM such as Staphylococcus aureus, Streptococcus
dysgalactiae, and Escherichia coli, among others.15 We chose E. coli for several reasons.
Firstly, it is one of the most common bacteria that cause BM. Secondly, working with the
particular non-pathogenic E. coli strain we chose did not pose any safety challenges in the
laboratory. Finally, there were molecular probes already being developed by one of our partners

Chapter 1
8
to detect messenger RNA (mRNA) from E. coli.
In initial conversations with the team and my supervisor, we agreed that we could adopt
one of two approaches for the detection of bacteria using microfluidics as shown in Figure 1.3.
The first approach we agreed upon was to capture bacteria using an immunological approach.
Using antibodies against some of the most common bacteria that cause mastitis was a sound
strategy as our group had the expertise to generate antibodies against these bacteria, as well as a
chemist who had broad experience immobilizing antibodies on different substrate materials.
The second approach was to use a molecular biological technique to detect and analyze the
tmRNA from bacteria. Because there are more copies of tmRNA in a single bacterium than
DNA (about 1000 copies of mRNA vs. ~3 of DNA), albeit less stable than DNA but more stable
than ordinary m-RNA, we hoped that our test would be more sensitive than current assays.
The strategy we followed was that the BDI group was going to develop the microfluidic
platforms for both approaches while the group in NUI Galway and the Enfer groups would
optimize and minimize the number of steps used in both assays. They would also downscale
volumes as much as possible so that they could be transferred into a microfluidic platform. This
thesis describes the process and results of trying to integrate these assays into different
microfluidic platforms.

Introduction
9
Figure 1.3 After some research and internal discussions within the group it was decided that developing
independent devices to measure each of the four parameters was a more realistic and sound approach.
The conductivity test was dropped because it is a very unreliable assay. In the end, the group agreed that
three devices would be developed: one device would measure somatic cell counts, whereas the other two
would detect bacteria either by employing an RNA detection approach or by using an immunoassay
technique.
Chapter 3 describes the first of these screening tests. It offers an introduction to BM and
describes a POC microfluidic sedimentation cytometer developed for the enumeration of
somatic cells and fat percentage in milk.
The remaining of the chapters presents a series of polymeric microfluidic technologies for
the detection of bacteria in milk. In chapter 4, a platform for recirculation of liquids in a
microfluidic channel by the interplay of capillary and centrifugal forces is described. The idea

Chapter 1
10
emerged as a result of needing a method to sample high volumes of milk through a microfluidic
channel that contains much less than the full sample volume. One of the surfaces in the
microfluidic channel would be patterned with antibodies specific against the target bacteria and
it was expected that by recirculating the sample through the channel several times the number of
binding events between the bacteria and the antibodies would increase, thus enhancing the
probability of capturing the bacteria. Chapter 4 describes the construction and physical
characterization of the device.
Chapter 5 presents a device to capture and concentrate bacteria, similar in concept to the
POC sedimentation cytometer. The device also integrates other functionalities such as bacteria
lysis and RNA amplification using nucleic acid sequence-based amplification (NASBA) for the
speciation and precise quantification of the number of bacteria initially present in milk.
One of the problems we encountered with the device presented in Chapter 5 was the
fabrication of the microvalve. Fluid control in microfluidic devices is typically regulated by a
microvalve, but current microvalves are difficult to integrate into manufacturing processes. In
addition, microfluidic valves are one of the most important components of monolithic
microfluidic systems. A novel microfluidic single-use valve that we hope will solve this
problem is introduced in Chapter 6. We present the approach to its fabrication, the results of its
characterization, and an application to store liquid reagents on-chip.
Conclusions and future work close this thesis in Chapter 7.
Finally, I would like to emphasize one word in the title of this thesis: polymeric. All the
microfluidic devices presented in this thesis have been constructed using different types of
polymers, mostly thermoplastics. Let us not forget that DNA is also a type of polymer;
however, polymeric is a more proper technical term than plastic, so I have decided to use the
word polymer when referring to plastics.
For most microfluidic applications, the material polydimethylsiloxane (PDMS) has
become indispensable for prototyping microfluidic devices in research laboratories because of
its optical and physical properties,16 as argued in Chapter 2. Despite the fact that new
microfabrication techniques are developed every year17-21 with the objective of simplifying the
fabrication of microfluidic devices, it is arguably difficult to see the real advantages of these
techniques over the use of photolithography to fabricate PDMS-based microfluidic devices (or
“soft-lithography”), even when they could consume less time or offer lower cost. Recipes for
fabrication of microstructures have been well established for almost thirty years thanks to
developments in the semiconductor and the microelectromechanical systems (MEMS) fields, so
it is straightforward to adapt these recipes to the fabrication of structures with high aspect ratios
(mm to µm or nm) and tight tolerances (nm) or structures that combine different heights.22 After
the microstructures are fabricated, they can be easily cast in PDMS. These advantages make

Introduction
11
PDMS an ideal material for microfluidic devices because it facilitates the control of fluids and
the manipulation of cells or bacteria.23 In addition, most universities in the developed world
have access to a cleanroom and/or basic equipment for photolithography (a spin-coater and a
mask aligner), as is the case at Dublin City University. In my opinion and considering all of
these facts, it is impractical for someone doing research on microfluidics not to utilize PDMS.
However, a series of unfortunate circumstances delayed me from not working with
PDMS during the first few months on my PhD, mainly because of maintenance work in our
cleanroom. During this time, I familiarized myself with other microfabrication equipment and
techniques such as micro-milling, a CO2 laser cutting system, an injection molding machine,
and a lamination system (for bonding plastics with thin pressure-sensitive adhesives). This
equipment does not offer the same resolution and precision as photolithographic processes, but
they work well with thermoplastics (however, they are incompatible with PDMS). Two
conclusions I drew early on in my PhD from the different seminars I attended was that
manufacturing costs are a major obstacle in the commercialization of microfluidic
technologies24 and, secondly, that there is hardly any microfluidic or diagnostic device or
biotechnology research tools company using PDMS as a substrate for building devices,
conceivably because casting of PDMS does not lend itself to mass-manufacturing,24 because it is
incompatible with organic solvents, and because it is laborious to bond PDMS to itself or to
other materials.23 Most companies use thermoplastics and glass to build microfluidic devices, as
thermoplastics are a much less expensive material than glass and polymeric replication
technologies (such as injection molding) are available for large-volume manufacturing,
necessary for POC diagnostics.24
Therefore, at the device-design stage it is important to consider the advantages and
limitations of the materials and the techniques available for large-scale manufacturing; at least, I
believe this to be true for the scientist who would like to see the outcome of his or her research
transition by commercial enterprise to the market.
These conditions, added to my interest in translational research (as well as those of the
BDI), made me realize that a more interesting challenge would be to design my devices with
what I call a “top-down” philosophy rather than the more traditional “bottom-up” approach for
the design of microfluidic systems for POC diagnostic devices. I believe that the primary goal
of most academic researchers working in microfluidics is that of understanding, learning, and
advancing their field, and of course publishing their results, but rarely is translational research
considered one of the principal objectives (although this perception is beginning to change in
the scientific community, and it is a topic that probably should include some history of the
technology and consideration of personal motivations). However, I do not believe that both
objectives are necessarily in conflict with each other, and actually have huge implications on the
way research is performed or the way some approaches to solving problems are undertaken. For

Chapter 1
12
example, consider the sedimentation cytometer presented in Chapter 3. The cytometer could
have been designed in a different way by using microfluidic components already developed by
several research groups. We initially thought that somatic cells could be separated from fat
globules using acoustic forces created in a silicon microfluidic channel,25 and the separated
cells could then have been counted one at a time by impedance cytometry,26 as shown in Figure
1.4. (Actually the chip shown in Figure 1.4 was initially thought to be a good solution to count
somatic cells in milk.) This is what I call a “bottom-up approach”, an approach that aims to
integrate or combine what other researches have proven to work for particular problems, but
that does not consider the feasibility of fabricating the device in large volumes. Neither does
this approach consider if the device is actually easy to set up and operate, but rather, relies upon
the belief that these problems should be addressed by someone else.
Figure 1.4 First design of a microfluidic cytometer for counting somatic cells in milk (A). The device
consisted of two sections, one to separate fat globules from milk using ultrasound standing waves
generated by a piezoelectric transducer (B), and the other to count cells by hydrodynamically focusing
(C) the cells over a pair of electrodes where a change in the impedance would indicate the passage of a
cell (D).
However, let us return to the idea of translational research. Although the device laid out
in Figure 1.4 seems like a plausible solution to the problem of counting somatic cells in milk
and could have possibly given me valuable experience with different techniques, possibly
generated a stream of publications and intellectual property, the questions always remained: was
this the simplest solution (once development was complete), the easiest to use, and the least
costly to manufacture? As my supervisor Prof. Ricco simply put it, I needed to imagine a
farmer trying to use the device: would he have been able to use such a complex device? Would
the device have been robust enough to operate on a farm? How much volume sample would the
device need? Could the device be manufactured on polymers, with a small number of
manufacturing steps? These four questions started me thinking about the problem in a different
way. Addressing those questions from the start, combined with an understanding of materials
limitations and of mass-manufacturing technologies, are key to designing a device that could

Introduction
13
ultimately be useful as a point-of-care system and not only be regarded as a piece of research.
So this is what I consider the “top-down” philosophy for point-of-care microfluidic devices,
which starts by considering addressing the limitations. This philosophy permeated the rest of
the work presented in this thesis, whether the outcome was successful or not.
1.6 References
1. C. P. Price, A. St. John and J. Hicks. Point-of-Care Testing: What, Why, When, and
Where? In: Point-of-care testing. Ed. C. P. Price, et al. American Association for Clinical
Chemistry Press, USA (2004), 3-10
2. A. J. de Mello and N. Beard. Dealing with 'real' samples: sample pre-treatment in
microfluidic systems. Lab on a Chip (2003) 3, 11n-19n
3. G. J. Fermann and J. Suyama. Point of care testing in the Emergency Department. Journal
of Emergency Medicine (2002) 22, 393-404
4. U. R. Jahn and H. Van Aken. Near-patient testing - point-of-care or point of costs and
convenience? British Journal of Anaesthesia (2003) 90, 425-427
5. N. E. Drenck. Point of care testing in Critical Care Medicine: the clinician's view. Clinica
Chimica Acta (2001) 307, 3-7
6. P. Yager, G. J. Domingo and J. Gerdes. Point-of-care diagnostics for global health. Annual
Review of Biomedical Engineering (2008) 10, 107-144
7. G. J. Kost, S. S. Ehrmeyer, B. Chernow, J. W. Winkelman, G. P. Zaloga, R. R. Dellinger
and T. Shirey. The laboratory-clinical interface - Point-of-care testing. Chest (1999) 115,
1140-1154
8. C. D. Chin, V. Linder and S. K. Sia. Lab-on-a-chip devices for global health: Past studies
and future opportunities. Lab on a Chip (2007) 7, 41-57
9. P. Yager, T. Edwards, E. Fu, K. Helton, K. Nelson, M. R. Tam and B. H. Weigl.
Microfluidic diagnostic technologies for global public health. Nature (2006) 442, 412-418
10. G. M. Whitesides. The origins and the future of microfluidics. Nature (2006) 442, 368-373
11. R. Gorkin, J. Park, J. Siegrist, M. Amasia, B. S. Lee, J. M. Park, J. Kim, H. Kim, M.
Madou and Y. K. Cho. Centrifugal microfluidics for biomedical applications. Lab on a
Chip (2010) 10, 1758-1773
12. M. Madou, J. Zoval, G. Y. Jia, H. Kido, J. Kim and N. Kim. Lab on a CD. Annual Review
of Biomedical Engineering (2006) 8, 601-628
13. N. S. Lynn and D. S. Dandy. Passive microfluidic pumping using coupled
capillary/evaporation effects. Lab on a Chip (2009) 9, 3422-3429
14. J. M. Park, Y. K. Cho, B. S. Lee, J. G. Lee and C. Ko. Multifunctional microvalves control
by optical illumination on nanoheaters and its application in centrifugal microfluidic
devices. Lab on a Chip (2007) 7, 557-564

Chapter 1
14
15. S. Waage, T. Mork, A. Roros, D. Aasland, A. Hunshamar and S. A. Odegaard. Bacteria
associated with clinical mastitis in dairy heifers. Journal of Dairy Science (1999) 82, 712-
719
16. Y. N. Xia and G. M. Whitesides. Soft lithography. Annual Review of Materials Science
(1998) 28, 153-184
17. P. Mali, A. Sarkar and R. Lal. Facile fabrication of microfluidic systems using electron
beam lithography. Lab on a Chip (2006) 6, 310-315
18. A. L. Liu, F. Y. He, K. Wang, T. Zhou, Y. Lu and X. H. Xia. Rapid method for design and
fabrication of passive micromixers in microfluidic devices using a direct-printing process.
Lab on a Chip (2005) 5, 974-978
19. W. Wang, S. W. Zhao and T. R. Pan. Lab-on-a-print: from a single polymer film to three-
dimensional integrated microfluidics. Lab on a Chip (2009) 9, 1133-1137
20. A. W. Browne, M. J. Rust, W. Jung, S. H. Lee and C. H. Ahn. A rapid prototyping method
for polymer microfluidics with fixed aspect ratio and 3D tapered channels. Lab on a Chip
(2009) 9, 2941-2946
21. P. Hazarika, D. Chowdhury and A. Chattopadhyay. Fabrication of submicron scale
patterned plastic thin film fluidic devices with controllable thickness. Lab on a Chip (2003)
3, 128-131
22. K. S. Yun and E. Yoon. Fabrication of complex multilevel microchannels in PDMS by
using three-dimensional photoresist masters. Lab on a Chip (2008) 8, 245-250
23. G. M. Whitesides, E. Ostuni, S. Takayama, X. Y. Jiang and D. E. Ingber. Soft lithography
in biology and biochemistry. Annual Review of Biomedical Engineering (2001) 3, 335-373
24. H. Becker. It's the economy ... Lab on a Chip (2009) 9, 2759-2762
25. F. Petersson, A. Nilsson, C. Holm, H. Jonsson and T. Laurell. Separation of lipids from
blood utilizing ultrasonic standing waves in microfluidic channels. Analyst (2004) 129,
938-943
26. D. Holmes, D. Pettigrew, C. H. Reccius, J. D. Gwyer, C. van Berkel, J. Holloway, D. E.
Davies and H. Morgan. Leukocyte analysis and differentiation using high speed
microfluidic single cell impedance cytometry. Lab on a Chip (2009) 9, 2881-2889

15
2
The Philosophy of Lab-on-a-Chip*
In this chapter we discuss the philosophy of the field of lab-on-a-chip. We begin by presenting a historical perspective of the field and the advantages
of miniaturization. Fabrication techniques as well as fluid movement and handling are discussed. Finally, the main components of a lab-on-a-chip
systems are presented.
*Parts of this chapter are published in: JL Garcia-Cordero, AJ Ricco, Lab-on-a-Chip (General Philosophy). Encyclopedia of Microfluidics and
Nanofluidics, Springer-Verlag (2008), pp. 962-969

Chapter 2
16
2.1 Introduction
Imagine standing in a chemistry, biology, or clinical laboratory and observing the
activity: a chemist deciphering the composition of a new substance, a biochemist developing a
new drug to cure a disease; in a clinical laboratory, technicians analyze patients’ blood samples
for pathogens or diagnostic markers. Now, imagine the possibility of devices, some as small as
electronic microchips, none much larger than a human hand, that perform these and many other
laboratory tasks without human intervention, providing a more efficient, rapid, and reliable way
to detect the composition of the substance, to develop not just a new but a more effective drug,
or to provide more comprehensive information about a patient’s state of health. This possibility
is gradually becoming reality; this chapter examines how such devices are developed, what
impedes widespread implementation of the lab-on-a-chip vision, and how implementing this
philosophy generates advances in basic science and applied technology.
In general, laboratory processes, including biochemical or chemical syntheses, analytical
assays, and in-vitro experiments with microorganisms, involve manipulation of samples and
reagents, and, in many cases, the subsequent detection or quantification of analytes using
detectors and instruments. Diverse labware, balances, dispensers, mixers, filters, and
incubators, together with instruments such as spectrometers and chromatographs, enable such
processes. Volumes from tens of nanoliters to many milliliters of solutions are typical. Time-
consuming manipulations are carried out by a variety of personnel; qualified technicians operate
costly equipment and instruments. It is remarkable, with feats of modern engineering
surrounding us – particularly the many examples of miniaturization and automation – that some
procedures have changed very little in more than a century, still relying on skilled human labor.
How is it possible that such procedures, particularly the most common, have not been integrated
into automated systems?
Decades ago, the manufacturing industry began adopting automation systems in the form
of robots, increasing productivity, reducing costs, minimizing human error, and avoiding
hazardous situations. Clearly, automatic systems could mechanize many of the human
manipulations in assays; except for minimizing human labor and error, however, merely
automating established, lengthy procedures in their human-executable form provides minimal
benefit in terms of time, efficiency, operating cost, or other measures of performance. Still,
criticizing modern engineering for failing to address the needs of complex laboratory
manipulations and measurements would be unjust: flow-injection analysis (FIA) systems
automate liquid handling and analysis for tiny samples; the fluorescence-activated cell sorter
(FACS) analyzes and sorts single cells at rates near 100,000/second; laboratory automation is a
thriving commercial endeavor, with robotic dispensers, multiwell plate conveyors, plate reading
spectrometers, and incubators linked together for high-throughput automated assays. Mass

The Philosophy of Lab-on-a-Chip
17
spectrometers and DNA sequencers, along with their sample-introduction “front ends” and
software, are impressive examples of engineering integration applied to difficult analytical
challenges. Impressive indeed, but the sizes of these instruments dwarfs the scale of the
samples they analyze: microliters or picograms of biological cells, biopolymers, or small
molecules. Furthermore, while the human genome sequencing project owes its ahead-of-
schedule finish to the automated DNA sequencer,1 as much as 75% of the cost of sequencing the
genome was associated with sample preparation involving manual manipulations, with highly
automated electrophoretic sequencing accounting for just 25%. Protein analysis (proteomics)
and drug-candidate screening also need new tools to process large numbers of samples in a
specified time period, i.e. they have throughput requirements to attain economic viability.2
Simply automating human-executed steps or applying conventional automation and
instrumentation engineering to laboratory procedures are not in accord with the lab-on-a-chip
philosophy. Rather, to realize the vision of major scale-down, comprehensive integration, and
massive parallelization of laboratory tasks, new paradigms and architectures must be developed
to shrink and adapt sequences of laboratory processes to the components and methods of
microfluidics. The newly integrated lab-on-a-chip tools often must provide better limits of
detection or enhanced resolution at lower cost than the laboratory systems they replace in order
to be adopted by practitioners of traditional laboratory methods.
Can modern science and technology lead to the attainment of such ambitious goals? Are
miniaturization and integration invariably beneficial? Can complex manipulations in fact be
replaced by on-chip operations? How is all this to be accomplished? The following sections
address these questions.
2.2 Historical perspective
The use of modern microfabrication technologies to construct and integrate the
components of miniaturized analytical instrumentation was inaugurated some 30 years ago
when Terry and coworkers at Stanford described a microfabricated gas chromatograph (GC)
constructed on a single silicon wafer.3 Just a few years earlier, advances in glass capillary-
based chromatography had shown that high-performance separations were possible using
column cross sections measured in micrometers, provided column lengths were measured in
centimeters to meters. Advances in conventional chromatography were made in both gas and
liquid phase, with the improved performance of liquid chromatography (LC) giving rise to the
term “high-performance liquid chromatography” (HPLC).
Comparable utilization of the tools of microfabrication for liquid-phase analyses came a
decade later, when electrokinetic phenomena were proposed to separate dissolved species on
chips: the application of a high electric field between the ends of a small-diameter column or
channel can both transport and separate dissolved species in conductive solution without

Chapter 2
18
moving mechanical parts. The concept of “chip-CE” (capillary electrophoresis) was first
described in the patent literature in 1990,4-6 wherein CE separations are performed in
microfabricated columns or microchannels on planar substrates. At the same time, publications
appeared detailing the concept of integrating separations and other processing steps on a chip,
extolling its potential to revolutionize chemical analysis.7
Research and development of chemical and biological sensors preceded the first chip-
integrated analytical separations systems by a decade or more, but the considerable enthusiasm
for the elegant “immerse-and-read” sensor-based analytical method was damped by the
realization that requirements for low limits of detection (LODs), high chemical specificity, and
rapid reversibility can be contradictory. This made the “ideal” sensor an elusive, often
unattainable goal: rapid reversibility requires small interaction energies, while high specificity
and low LODs imply strong binding. This potential Achilles’ Heel applies to some of the most
important samples: medical analytes, as well as many environmental, health-and-safety, and
industrial process-control samples, are often (bio)chemically complex mixtures, typically
requiring one of three strategies to avoid errors due to interference with the target analyte: high
selectivity, usually with accompanying irreversibility – making the sensor a dosimeter for all
practical purposes; use of an array of sensors, wherein the pattern of responses from multiple
partially selective sensors provides chemical discrimination without loss of reversibility; or
coupling of the sensor – which in effect becomes a detector – with a chromatographic “front
end” that separates complex mixtures into their components.
Many samples, both biological and chemical, require not only separation of interferences
to provide meaningful sensor response; they may also require significant processing to cleanse
the sample of debris, to add reagents, to change the concentration of background ions or change
the solvent, to attach readily detectable “labels” to the target species, to carry out thermally-
stimulated reactions, or to enhance LODs by pre-concentration or replication (termed
“amplification” for nucleic acids) of the target species. Because of the success in miniaturizing
LC, instead of employing traditional methods that use tubing to connect components and
glassware for sample processing, scientists and engineers have embraced the lab-on-a-chip
philosophy to miniaturize and integrate the purification, isolation, reaction, concentration, and
separation steps, and, where applicable, the detectors or sensors, into one integrated chemical
analytical system.7-9 Because many such systems have analysis as the end goal, they are
frequently referred to as micro-total analytical systems, or TAS; the central role played by
fluidics on the micrometer scale (detailed in the following sections) has resulted in these
systems often being called simply “microfluidic devices.” Regardless of nomenclature, the lab-
on-a-chip philosophy, even as it enables analyses not possible with discrete sensors alone,
signals a paradigm shift in the way laboratory work is performed.
The Philosophy of Lab-on-a-Chip
19
2.3 Miniaturization
The advantages of reducing the size of an integrated (bio)chemical processing / analysis
system can be significant, with overall enhancement of performance, measured in various ways,
emerging as a common theme. Specific benefits can be deduced by assessing how some
parameters, such as volume, reaction time, and device density, change as the system is scaled
down in size.2,10 Imagine a reaction of sample and reagent carried out in two different-sized
cube-shaped flasks with edge length d. The first flask (d = 1 cm) is a macrosystem: it has a
volume of 1 mL. The second flask (d = 100 m) is a microsystem: it has a volume of 1 nL.
The 100-fold reduction in linear dimension results in a one-million-fold decrease in volume.
Other factors being unchanged, the microscale system requires a million times less sample and
reagent volume to perform an assay, so many times more analyses can be performed with the
same amount of solution. Less chemical waste is produced; expensive reagents are consumed in
smaller quantities. Also, chemical reactions including highly toxic or reactive species that are
prone to cause accidents in laboratories are more easily controlled and safer using miniature
systems because lower volumes mean less hazardous material and lower risk of thermal
runaway.
Another relevant parameter is device density, which is well represented here by the
number of reaction vessels per unit area. In the context of the two systems compared above,
100 vessels in the macrosystem would occupy 100 cm2; in the microsystem, they occupy 1
mm2, a 10,000-fold reduction in surface area. Further reducing the edge-length of the vessels to
1 m (assuming no space is required between adjacent reactions) would fit 1010 simultaneous
reactions in the same area.
Now, for the same systems, consider a concentration of a certain “target” molecule of one
nanomolar (nM).1 There will be almost 109 target molecules in the macrosystem and 1000
molecules in the microsystem. Further reduction of the edge-length to 1 m, easily attainable
with current microfabrication techniques, provides just 1 molecule per m3. One must then
consider the interplay between dimensions, numbers of molecules, and detection: single-
molecule detection is possible, but very challenging to implement on-chip, very limiting as to
choice of detection technologies, and, at the single-molecule level, probability considerations
mean that detection will only be successful some of the time.
Agitating and stirring (forcing convection) of a multicomponent solution or mixture of
multiple solutions reduces the time for the solution to become homogeneous (completely
mixed). Length, volume, and concentration reductions in the microsystem require scale-specific
assessment of the behavior of fluids and molecules in a restricted space. A localized group of
1 1 molar is 6.023 x 10²³ molecules in one litre and nanomolar is 6.023 x 10¹⁴ molecules in one litre.

Chapter 2
20
molecules having a diffusion coefficient2 of 10-5 cm2/s requires about one day to evenly diffuse,
or spread, throughout the macrosystem in the absence of convection; in the microsystem, this
process takes 10 seconds, and diffusion across 10 m takes just 100 ms (diffusion time scales
with the square of length). Such short diffusion times can allow reaction rates to be limited only
by how fast the reaction takes place (reaction kinetics), rather than by forced movement of the
substances involved.
In addition to performance enhancements related to volume, time, and density of
reactions, miniaturization also improves performance by other measures, for example,
separations efficacy.7,10 Some components, however, are proving challenging or unsuitable for
miniaturization or monolithic integration because of inherent complexities in their design,10 for
example ultra-high-sensitivity detectors. Attempts to miniaturize macrosystem components are
often motivated primarily by gains in performance and time rather than a desire to minimize
space,7 although some biomedical applications for which wearable or hand-held sensing systems
are necessary, as well as remote military and aerospace applications, often place a high premium
on size, mass, and power.
2.4 Microfluidics: fluid movement and handling
Fluid manipulation and transport of samples and reagents are often implemented in a
network of microfluidic channels that interconnect the various components on a common
substrate. These microchannels have dimensions ranging from hundreds of nanometers to
hundreds of micrometers – comparable to, or in many cases much smaller than, a human hair.
Flow in microchannels behaves very differently than in “macrochannels” such as laboratory
tubing, water pipes, or a river.
In microchannels, the viscosity and, in many situations, the surface tension of the fluid
dominate inertial (mass-related) forces. Thus, fluid movement shows a smooth, predictable
behavior known as laminar flow.11 Turbulence in microchannels is always negligible, although
in-channel convection (without turbulence) can be created in a number of often-complex ways:
rapid, effective mixing has proved to be one of the most interesting and well-studied
fundamental challenges in microfluidics. In many cases, diffusion is relied upon for mixing
because of its rapidity on micrometer length scales, but the system must be carefully evaluated
when taking this approach: two streams of liquid flowing parallel to one another in a 200 m-
wide channel at a velocity of 1 mm/s over a distance of 3 mm would be have to be slowed by a
factor of three to mix completely before exiting that short channel.
Because of the properties of microchannels, such as the material and coating of the
surface, the high surface area-to-volume ratios can affect the behavior of the flow. Surface
2 The diffusion coefficient is a measure of the rate of diffusion of a species in absence of convection or migration
contributions to mass transport; diffusion is often the controlling factor in the time it takes a solution species to spread throughout a given volume to reach equilibrium, i.e. to be evenly distributed.

The Philosophy of Lab-on-a-Chip
21
effects, many depending on interfacial tension (surface energy) can give rise to interesting
applications such as the formation of droplet emulsions, the use of capillary forces to pump
fluid, and the modification of the surfaces to create hydrophobic stop-valves.11 Also, high
surface area-to-volume ratios facilitate rapid and controlled heating and cooling. Surface effects
and topography (the route of the channel) define flow motion in the microchannel. The control
and consequences of various microchannel characteristics makes them useful as components in
their own right. For example, by changing their geometry they can be used as mixers, filters,
injectors, separators, and the like.7,11 Other fluidics-relevant physical phenomena, including
electrokinetic, acoustic, and thermal effects are described in a recent review.11
2.5 Fabrication
The development of microfluidic devices has been both limited and spurred ahead by
limitations of and advances in the materials they are built from and how they are made.
Without a doubt, the microelectronics industry gave a critical first impulse to the field by
lending its microfabrication tools. Even today, the fabrication techniques used to make
microfluidic devices are influenced by advances in the microelectronics industry.
Glass is ubiquitous in laboratory manipulations, while plastic dominates many modern
molecular biology, biochemistry, and drug development labs. Glass does not react with most
substances and is optically transparent; certain plastics are biocompatible, readily moldable into
complex structures, and inexpensive enough to be discarded after a single use. The first
microfluidic devices used glass or silicon as the substrate material, both substrates relying on
microelectronics-industry-type patterning methods. However, the time, cost, and special
(etching) facilities needed to fabricate devices with these methods and materials initially
deterred some researchers from entering the field. New fabrication techniques for microfluidics
based on “soft polymers” as well as traditional thermoplastics, began to be developed in 1991,3
but not until the end of the 1990’s were these approaches more widely described12 and adopted
for rapid prototyping of devices at minimum cost.8 The “soft lithography” technique was
quickly adopted as de facto for fabrication of biologically-focused microfluidic devices in
academic laboratories. Unfortunately, soft polymers are incompatible with many organic
chemicals, including small molecules of interest in drug development; this approach has yet to
be proven for mass fabrication of a commercial microfluidic device. Plastics are much “in
vogue” nowadays, mainly because they are readily prototyped and suitable for manufacturing
with long-standing techniques, such as hot embossing and injection molding, but also because
they are inexpensive as a material and very familiar to the life sciences. To date, no single
standard material has been adopted for the fabrication of microfluidic devices.

Chapter 2
22
2.6 The lab-on-a-chip concept
Scientists and engineers from diverse disciplines – physics, chemistry, biology, and
computer science, together with mechanical, chemical, electrical, and materials engineering –
have broadened the approaches and concepts of TAS and microfluidics. Contributions from
and interactions among these fields have created more complex, sophisticated, and novel
devices, which, together with the merging of the TAS and microfluidics concepts, have led to
the field of research and technology called lab-on-a-chip (LOC).3
The workhorse and core of a LOC is the microfluidic system. Built around it is some
combination of detectors and sensors, actuators, electronic controls (microprocessors, field-
programmable gate arrays, A-to-D converters, etc.), software, and reagents.9 The microfluidic
device consists of microchannels and components that effect operations such as filtration, pre-
concentration, washing, mixing, purification, isolation, and separation. The configuration of the
components of a microfluidic device should be dictated by whether the goal is to synthesize a
compound, to grow an organism, to detect the presence of a target, or to determine the
concentration of an analyte.
Analysis requires appropriately sensitive and, if separations are not part of the fluidic
system, selective, detectors; these have varying degrees of sensitivity, accuracy, performance,
ease of integration, and cost. Common detector technologies include optical, electrochemical,
magnetic, impedimetric (conductance and/or capacitance), mechanical, and thermal. The
specific type and configuration of detector depends on the details of the application. Non-
optical detectors tend to be less sensitive and, in some cases less selective (optical detectors can
include wavelength-based selectivity), but are generally smaller than optical detectors and easier
to integrate with the microfluidic device.
Optical detection, particularly laser-induced fluorescence, is widely used with
microfluidic devices due to high sensitivity, but infrequently integrated on chip. For most
optical detection approaches, “labels,” i.e. molecules that fluoresce or strongly absorb light of a
selected wavelength, must be bio/chemically attached to “tag” the analyte, adding an additional,
sometimes challenging, process step. The more sensitive and readily-implemented optical
detectors also require an external optics system,4 which usually occupies significant physical
space, often consumes more power than all the rest of the system, and can be the most
expensive part of a lab-on-chip system.
Unlike optical detection, integrated electrical detectors (impedimetric, electrochemical,
most mechanical and thermal, certain magnetic) require electrode interconnections and on-chip
3 The reader should note that these three terms, lab-on-a-chip, microfluidic devices and micro-total chemical analysis system are often, and erroneously, used interchangeably. 4 The optics system incorporates different elements, such as mirrors, polarisers, condensers, among others, that are used to manipulate the light, which excites the label, collects and filters the fluorescence, and thereby enables the detection of the analyte.

The Philosophy of Lab-on-a-Chip
23
electrical “traces” (conductive pathways) to connect to external electronics. Although this is an
added complication, it is typically easier to implement than full monolithic integration of an
optical excitation-and-detection system.
Actuators, such as valves or pumps, can be either integrated or external to the
microfluidic device, and are needed to regulate the movement of fluids in the microchannels.
Strict fluid regulation and control is important because the different steps of the components for
the analysis need to be completed in a systematic and timely fashion in order to be successful.
Because vast amounts of information can potentially be generated in lab-on-a-chip
systems, and because sophisticated analysis may be required to generate meaningful
information from raw data, e.g. for protein analysis or drug discovery, data analysis requires
appropriate computational power and speed. Thus, when data volume and analysis complexity
are minor, appropriate microprocessors and affiliated components can be integrated in a hybrid
fashion with the microfluidics or, more commonly, included on an external electronics board,
eliminating the need for an external computer.
Reagents often must be mixed with the sample at one or more process steps to facilitate
purification, separation, amplification, or labeling (for detection). It is possible, and for many
commercial applications desirable, to integrate the reagents in liquid or powder (often
lyophilized) form, on the chip. Optimally, the sample will be the only assay component
dispensed onto the microfluidic device for analysis or reaction, making the LOC system easier
to use, more efficient in reagent and power consumption, and more robust to errors in
measurement or sequence.
Easily integrable, user-friendly, and, ideally, standardized, fluidic connections that
facilitate microfluidic input/output (IO) are vital. Because of the varying size of microfluidic
devices – sub-mm2 to the size of a multiwell plate (> 100 cm2) – a related key challenge is an
easy-to-handle, standard user interface.
The term ‘lab-on-a-chip’ has been used in a wide variety of contexts. Some of the best-
studied applications are in chemical analysis, biological research, and medical diagnosis, with
many other exciting uses under development, such as chemical synthesis, space studies,
industrial automation and process control, fuel cells and power generation, printing devices, and
environmental and food-safety monitoring. LOC may refer to a chemical or biological micro-
reactor, a micro-cytometer, a screening tool for drug discovery, a diagnostic device for clinical
use, or a sampling-and-analysis system for environmental monitoring. The ultimate goal of
LOC is to integrate the microfluidic components with detectors, actuators, electronics, fluidic
connections, and reagents in a single (often single-use) device that enables a complete process,
whether synthetic, analytical, or “life support,” in an autonomous and automated fashion.

Chapter 2
24
Figure 2.1 Illustration of a fully integrated lab-on-a-chip (LOC) system, with components numbered
according to their (approximate) historic integration with other LOC components, prevalence of research
activities and publications that include that level of integration, and criticality of integration in order to
accomplish an effective analysis. Historically, the analysis component (1) was first to be miniaturized
and is indispensable to detect the analyte; it often includes a separation process. Sample preparation (2) is
often required to make real-world samples amenable to analysis; the core microfluidic chip (3) thus
consists of these two components connected by microchannels. For systems to be manufactured
inexpensively in large volumes, the microfluidic chip might be fabricated on a plastic card (4) or other
supporting substrate. Reagents (5) may be needed for sample preparation or analysis, for example to
label the analyte with fluorescent molecules. Actuators (6) to motivate and regulate fluid movement
through the various modules of the microfluidic chip can be integrated (or supported) on the same plastic
card with the microfluidic device or remain external. The detector (7) is more often integrated in the case
of electrical (electrochemical, impedance) detection approaches than for optical transduction. Sample is
introduced to the chip through fluidic connections (8). An electronics board (9) controls the system and
collects data; batteries (10) power the system. Following analysis with the aid of software, the “answer”
is displayed (11).
2.7 Conclusions
LOC is now an area of intense research and technological development, having grown
exponentially in the past two decades. Initially, LOC began by proving its feasibility and
justifying its existence: postulating and demonstrating that miniaturization and integration of the
components of bio/chemical systems were not only possible, but would bring substantial
improvement relative to traditional macroscale systems. A vast number of proof-of-concept

The Philosophy of Lab-on-a-Chip
25
components have been developed during the past few years and, when successfully integrated
together, will form the basis of a range of functional LOC systems.
‘Simple’ LOCs, lacking sophisticated integration and focusing on the detection of a small
concentration of a certain molecule or measuring one parameter like pH, are already a reality
and have found their way to market.1,8 The creation of a LOC that is capable of processing and
analyzing high-volume, complex samples with low analyte concentrations, such as the sets of
biological “markers” for cancer or other diseases, remains elusive, though there are a few
commercial success stories [http://www.biosite.com, http://www.abbottpointofcare/isat/].
Although many of the necessary components are already available or demonstrated, progress in
monolithically integrating disparate technologies has been slower than expected.
There are two explanations for why realization of the LOC vision is proving difficult.
First, challenges are many, development is gradual, and many refinements are needed before the
technology is accepted, reliable, and robust. Frequently, components are built in vastly different
ways, with different geometries or structures different performance, and fundamental
incompatibilities. Often, the more effective or successful components require cumbersome
fabrication procedures and/or exotic materials. Additional components that would ideally be
integrated may require a completely different set of fabrication steps that render integration
incompatible with low-cost, automated manufacturing. Clearly, adopting standard components
that are robust, give reproducible results, perform well, and are amenable to integration is
essential for successful implementation of the LOC philosophy.
Second, this field, like few others, requires synergistic expertise and multidisciplinary
cooperation in engineering, physics, chemistry, biology, and computer science. If LOCs are to
be applied successfully to relevant and needy problems, engineers and physicists must more
often liaise and communicate with biologists or chemists to understand their needs and
questions. For success, those working in each of these fields must become knowledgeable in
the basics and language of the disciplines with which they interact to make collaborations
fruitful. The additional education and training for all the involved parties is essential, so more
universities should establish undergraduate and graduate programs encouraging an
interdisciplinary, “applications-aware” education.1 This will expand the ranks of scientists and
engineers with the skills necessary to make fundamental and unconventional advances in LOC
science and technology.1
LOC systems have the potential to enhance, perhaps transform, our understanding of cell
biology and biochemistry. It’s likely they will play a major role in the development of new
drugs, and almost certainly in the earlier, more accurate diagnosis of disease. Nonetheless,
much is still to be discovered and conceived: the promise of nanofluidics, ways to include optics
directly on fluidic chips, the integration of multiple detector types, more efficient means to
detect small numbers of molecules, etc. LOC technology is already finding special applications

Chapter 2
26
niches in environmental monitoring and space exploration, with promise for everything from
power generation to therapeutics to information technology. Most importantly, LOCs are
poised to impact the world economy and society as a whole, in much the same way
microelectronics technology now shapes our world.
2.8 References
1. S. Fields. The interplay of biology and technology. Proceedings of the National Academy
of Sciences of the United States of America (2001) 98, 10051-10054
2. P. S. Dittrich and A. Manz. Lab-on-a-chip: microfluidics in drug discovery. Nature
Reviews Drug Discovery (2006) 5, 210-218
3. D. R. Reyes, D. Iossifidis, P. A. Auroux and A. Manz. Micro total analysis systems. 1.
Introduction, theory, and technology. Analytical Chemistry (2002) 74, 2623-2636
4. B. Ekstöm, G. Jacobson, O. Öhman and H. Sjödin. Microfluidic structure and process for
its manufacture. World Patent, WO/1991/016966 (1991)
5. G. A. Kovacs and K. C. Holland. Electrophoretic system. European Patent, EP0376611
(1990)
6. S. J. Pace. Silicon semiconductor wafer for analyzing micronic biological samples. USA
Patent, 4908112 (1990)
7. A. Manz, N. Graber and H. M. Widmer. Miniaturized Total Chemical-Analysis Systems - a
Novel Concept for Chemical Sensing. Sensors and Actuators B-Chemical (1990) 1, 244-
248
8. G. M. Whitesides. The origins and the future of microfluidics. Nature (2006) 442, 368-373
9. A. W. Chow. Lab-on-a-chip: Opportunities for chemical engineering. Aiche Journal (2002)
48, 1590-1595
10. D. Janasek, J. Franzke and A. Manz. Scaling and the design of miniaturized chemical-
analysis systems. Nature (2006) 442, 374-380
11. T. M. Squires and S. R. Quake. Microfluidics: Fluid physics at the nanoliter scale. Reviews
of Modern Physics (2005) 77, 977-1026
12. T. Boone, Z. H. Fan, H. Hooper, A. Ricco, H. D. Tan and S. Williams. Plastic advances
microfluidic devices. Analytical Chemistry (2002) 74, 78a-86a

27
3
A Point-of-Care Microfluidic
Sedimentation Cytometer
(POC-SeCy) for
Milk Quality and Bovine Mastitis
Monitoring*
In this chapter, we present a rapid, low-cost, portable microfluidic system
for assessing the number of somatic cells and fat content of milk in 15 min. Our concept offers a “sample-in, answer-out” capability.
*Parts of this chapter have been submitted for publication to Biomedical
Microdevices.

Chapter 3
28
3.1 Introduction
Bovine mastitis (BM) is a disease that affects dairy cattle worldwide and causes
annual loses of US$ 2 billion to the dairy industry in the US alone.1 BM affects the
composition of milk, reduces milk yield, and decreases milk quality and its price.2 The costs
of drug treatments, veterinarian services, and labor, as well as milk buyers’ penalties, are
part of the economical losses due to mastitis.3 Prompt diagnosis of infection at early stages
can help improve milk production, prevent permanent harm to the cow, decrease the
effective costs of BM, and reduce the widespread propagation of the infection to the rest of
the herd and consequent culling, resulting in economic benefit to farmers and the general
public.1-3
BM is caused by different pathogenic organisms, more commonly bacteria, and
results in the inflammation of the (milk-producing) mammary gland.1,2 The gold standard in
diagnosing BM is microbiological testing, which accurately identifies the afflicting
pathogen in most cases; such tests are lengthy and costly, however, and therefore not
feasible to implement as a routine screening test for mastitis. Other, simpler screening tests
exist to determine the presence of an infection, such as measuring the electrical conductivity
of milk,1,4 the viscosity change on addition of detergent (e.g. CMT), or pH changes, but
these tests suffer from limited reliability.4
Without identifying the causative pathogen, determining the number of somatic cells
present in milk has become the gold-standard test to assess the potential presence of an
infection.4 Somatic cell counts are used to assess the quality and therefore the monetary
value of the milk. In addition, somatic cell tests are an important component of udder
health management for dairy producers.5 For these health-management programs to be
successful, somatic cell tests should be implemented on a frequent basis and on-site.6
Fat (cream) content is used mainly as a measure of milk's monetary value,7 and is an
indicator of nutritional status as well,8 providing farmers with a potential decision point for
nutritional supplementation. Milk with low fat content could indicate the existence of
health problems with the animal.7 It has also recently been observed that high fat:protein
ratios are associated with increased risk of mastitis.9
Current reliable methods to measure somatic cell counts (SCCs) include direct
microscopy, flow cytometry, and electronic particle detection (using a Coulter counter).10
Flow cytometers are one of the most widely employed SCC tests because of their high
throughput and accuracy, see Figure 3.1. Their use has been standardized and
recommended by international dairy organizations.11 However, flow cytometers are
expensive (> US$50,000) and the labor and maintenance costs associated with the operation
of the equipment have precluded small farmers from adopting them for routine monitoring

A Point-of-care Microfluidic Sedimentation Cytometer for Milk Quality and Bovine Mastitis Monitoring
29
of herd health status. Typically, small farmers in developed countries send milk samples to
government or centralized private laboratories to test the milk for somatic cell counts, along
with other tests. This is less than ideal, as transportation of milk across long distances in
non-refrigerated trucks, or delays in analyzing the samples, can affect the composition of
milk, leading to inaccurate test results. Misplaced or mislabeled samples is also a recurrent
problem.12 In developing countries, the main problem is the nonexistence of such
laboratories. In both developed and developing countries, farmers would benefit greatly
from an affordable, robust, easy-to-use “cow-side” test enabling regular monitoring of the
herd’s milk quality and incidence of mastitis.
Figure 3.1 The MilkoScan FT 6000 is manufactured by FOSS (Denmark) and costs about US $150,000.
It consists of a flow cytometer, a liquid handling system, and custom electronics and optics. A carrier
band transports the 20-mL milk containers from left to right and a blunt needle located at the middle of
the carrier band aspirates a small amount of sample from each milk container. A computer reports the
results back to the user. Similar systems are used in dairy research centers. The system can measure
somatic cell counts, fat percentage, and protein content. Fat percentage and protein content are measured
with infrared spectroscopy.
Several microfluidic systems have focused on miniaturization of the functionality of
flow cytometers or electronic cell counters in hopes of reducing costs, automating manual
tasks, and conferring portability, while also seeking to enable new discoveries and the
processing of smaller sample volumes.13,14 Although there have been successful
demonstrations of miniaturized cytometers, providing similar sensitivity and quality of
information to their benchtop counterparts, issues such as sample manipulation and
automation are only beginning to be addressed.13-15 Current “micro-cytometers” suffer

Chapter 3
30
from: (i) elaborate microfabrication process sequences, some of which are not amenable to
low-cost manufacturing;13-15 (ii) requirement for very precise flow control to create a stable
sheath flow;13 (iii) clogging or fouling of microchannels;13 (iv) malfunctioning caused by air
bubbles;14 (v) need for multiple buffers and reagents for flow control and staining of
cells;13-15 and (vi) complexity of operation necessitating significant operator training.10
High-performance optics are commonplace in some commercial microfluidic flow
cytometers, adding to cost;10,13 see Figure 3.2.
Figure 3.2 Examples of miniaturized flow cytometers. (a) Schematic of the operation of a flow
cytometer. A sheath flow surrounds the sample and confines the fluorescent-labeled cells to a narrow
single-file stream. High-end optics measure the scattering signal from the cell that pass through the laser
beam.15 (b) Schematic of a microfluidic flow cytometer that uses hydrodynamic focusing to confine cells
in a narrow stream. Two optical fibers are used to interrogate cells passing through the incident laser
beam.16 (c) Example of a micromachined impedance spectroscopy flow cytometer for cell analysis and
particle sizing. Electrodes in the channel detect change of impedance when a cell passes between them.17

A Point-of-care Microfluidic Sedimentation Cytometer for Milk Quality and Bovine Mastitis Monitoring
31
Recently, Toner and colleagues18-20 reported innovative approaches for cell
enumeration that addressed some of the shortcomings listed above: no reagent required,
easy-to-use, low-cost fabrication, portability, and minimum instrumentation. They
demonstrated the detection and count of CD4+ lymphocytes from whole blood using a
combination of immunoaffinity and controlled-shear stress to selectively capture CD4+
cells18,20 while preventing the capture of other types of leukocytes. They also demonstrated
that captured CD4+ cells can be quantified using impedance spectroscopy by lysing the
cells, which alters the bulk conductance of the solution.19 In another approach, Austin and
colleagues demonstrated that cells can be efficiently sorted into different compartments—
where presumably they could be counted—based on their sizes, using an array of
microposts;21,22 see Figure 3.3.
Figure 3.3 Alternative approaches for the enumeration and separation of cells in microfluidic systems
that exploit phenomena at the microscale. (a) In the first approach, cells are captured with antibodies at a
specific flow rate.18 (b) In the second approach, cells in blood can be separated by size using an array of
posts.22
These innovative approaches demonstrate that miniaturization of bench-top
instrumentation is not invariably the best strategy to address specific assays requiring cell
counting and detection; rather, new approaches can exploit a range of bio/chemical/physical
phenomena on the micro scale and at liquid/solid interfaces, leading to simpler, more
economical, more practical solutions.
We demonstrate here a portable point-of-care (POC) microfluidic sedimentation
cytometer (SeCy) to assess the numbers of somatic cells and the percentage of fat in milk;
see Figure 3.4. Rather than counting cells one by one, our approach is to centrifuge the

Chapter 3
32
somatic cells into a closed-end microfluidic channel, forming a packed pellet of cells whose
volume is proportional to cell count. The device exploits the difference in cell and fat
density from the rest of the milk components to separate them by centrifugation, forming
the pellet and a fat band in opposite radial directions for convenient measurement.
The fluidic device has the same dimensions as a compact disc (CD) and allows for up
to twelve tests to be performed at once; it is easy to use and handle, requiring no training
other than learning to dispense 150 L of raw milk into each of the twelve SeCy’s using a
single-volume pipette. Unlike other cell-counting techniques, this assay does not require
any additional reagents or sample preparation. Completing the assay requires fifteen
minutes, at the end of which a reading of the cell count as well as the percentage of fat are
made. Made of transparent polymer, the device is amenable to mass production, e.g. via
injection molding. We also present a prototype portable reader unit to automate
measurements, suitable for cow-side use; it includes two motors and two miniature
microscopes
Figure 3.4 General steps to operate point-of-care sedimentation cytometer. The process starts with a
farmer milking a cow (i) and bringing the portable reader unit into the farm (ii). The farmer then draws
150 μL of raw milk into an exact volume pipette (iii). Next, up to 12 different milk samples can be
dispensed into the microfluidic sedimentation cytometer unit (iv). The disc is then loaded into the
portable reader unit (v) which spins the disc for 15 min and analyses cell pellet size and cream band
length (vi).

A Point-of-care Microfluidic Sedimentation Cytometer for Milk Quality and Bovine Mastitis Monitoring
33
3.2 Design
3.2.1 General concept of separation and analysis
Cells and fat globules can be separated from the rest of a sample of milk by
centrifugal acceleration in a rotating CD platform because their densities and volumes differ
substantially from the rest of the milk. The volumes of the cell pellet and the cream band
formed after centrifugation can then be correlated with the number of cells and fat
percentage of the milk, respectively. The cell pellet volume is more easily quantified by
localization in a comparatively long and narrow closed-end channel, but there is sufficient
fat to simply measure the width of the band of cream that forms.
A number of constraints were placed on the design of the SeCY disc, the most
relevant fundamental parameters being the properties of milk, cells, and fat globules;
however, we also considered the smallest volume of milk reasonably handled by a farmer
with a pipette, the maximum number of individual SeCY’s that could fit on the footprint of
a CD, and a desire to operate the disc using a conventional CD player motor.
3.2.2 Number of cells
Assuming normally functioning immune response, somatic cell numbers increase
dramatically after a pathogen invades one of the mammary glands of the animal.4 SCC
thresholds are often used to predict infection and to determine if milk is suitable for human
consumption: the legal maximum for somatic cells in milk Grade A is 400,000 cells/mL in
the European Union, New Zealand, and Australia, whereas in Canada and the US it is
500,000 and 750,000 cells/mL, respectively.23,24 A threshold of 200,000 cells/mL has been
suggested as indicative of a healthy “quarter”, i.e. as measured in milk collected from one
of the four teats of the cow.4 Flow cytometers can detect up to ten million cells per mL. In
designing this device, a target range of 0 to 3x10⁶ cells/mL was selected.
3.2.3 Properties of milk, cells, and fat globules
Milk is a complex matrix composed in its majority of water (87.1%), fat(in the form
of spherical droplets, 2.2 to 5.5%25), lactose (4.6%), and proteins (3.3%).25 Present in less
quantities are vitamins and minerals. Somatic cells in milk include mostly white blood cells
(WBCs), and at lower percentages epithelial cells (0 - 7% of the SCC total).26 Table 3.1
shows the physical properties of cells, fat globules, and milk plasma (milk minus fat
globules). The viscosity of milk plasma is 1.68 mPa•s.25 Cells being denser than milk
plasma and fat globules being less dense, a centrifugal force field moves the two particle
types in opposite directions, cells away from the axis of rotations and fat towards it.

Chapter 3
34
Table 3.1 Physical properties of somatic cells, fat globules, and milk plasma
Component Diameter (μm)
Mass density (kg/m3)
Leukocytes (WBC) 6-10 1055-1085 27 Fat globules 1-8 28 916 (20°C) 25 Milk plasma - 1034 (20°C) 25
3.2.4 Device
Each SeCy has one inlet and one outlet separated by a ridge as shown in Figure 3.5.
The milk sample is introduced through the inlet and the gas is expelled through the outlet
for reliable filling of the device. Attempts to use a SeCy containing a single inlet and no
outlet were inconsistent because air was often trapped, preventing proper filling.29
An indexing system based on Braille code, embossed in the surface of the disc at a
consistent radial distance, is used to identify each SeCy unit on a given CD. Numbers in
Braille consist of a cell of six dots arranged in a matrix of 2 columns by 3 rows. The Braille
code (numbers from 1 to 12) will enable a future reader to identify the funnel being scanned
using pattern-recognition software.
Indexing holes facilitate correct and reproducible positioning of the disc in the reader
system: protruding pins in the surface of the reader lock the disc in place and prevent
movement to ensure that each image is collected in the same region of each SeCy unit.

A Point-of-care Microfluidic Sedimentation Cytometer for Milk Quality and Bovine Mastitis Monitoring
35
Figure 3.5 Design and principle of the sedimentation cytometer disc. (a) Top view of the disc, which
comprises 12 SeCy units, each being identified with a Braille code. Indexing holes in the disc are used by
the reader to facilitate correct and reproducible positioning of the disc relative to the microscopes. (b) A
3D view of a SeCy unit shows the tapered walls, which reduce gradually the height of the structure from
0.9 mm to 0.2 mm. (c) Magnification of the end of the closed-end channel. (d) Schematic of the SeCy
unit with milk (left) shows that after spinning the disc for 15 min, the fat globules and cells separate into
two distinct regions (right): the cream band forms near the upper part of the funnel while a cell pellet
forms in the closed-end channel, its length proportional to cell count. (e) Images of a SeCy device spun
for 15 min, captured with a conventional pocket digital camera. Insets show the cream band and cell
pellet as viewed with the microscope.
Chapter 3
36
3.2.5 Sample volume and channel geometry and dimensions
The sample must be easily collected and handled by a farmer, preferably with a
dropper or inexpensive pipette. Disposable pipettes are available with precise, pre-defined
volumes ranging from 20 – 400 μL (Poly-Pipets, NJ, USA); the 150- L version is well
matched to the current SeCy unit design.
The funnel should have a small footprint to fit as many as possible on each CD. The
dimensions of the closed-end microchannel are defined by milk sample volume, desired cell
count resolution, and maximum number of cells to be measured. In this regard, the
microchannel must be long enough to accommodate the maximum number of cells, narrow
enough that the cell distribution is uniform across the channel width (easing readout of the
pellet size), and shallow enough to give a pellet length conducive to a quantitative result.
The resultant microchannel dimensions should be consistent with low-cost manufacture,
preferably without requiring tight tolerances on tooling for reproducible assay results
(injection molding yields highly reproducible part dimensions for a given polymer and set
of process conditions, but sizing the mold tooling in advance to make an exact part size is
somewhat more challenging).
Cells constitute less than 0.01% of milk volume, hence the device must contain
sufficient milk to provide a readily countable number of cells. The selected milk sample
volume is 150 μL, hence the closed-end microchannel must accommodate up to 450,000
cells (3x10⁶ cells/mL), occupying approximately 235 nL (average cell radius of 5 μm;
packing fraction is not considered for these calculations, as the cells are reasonably
deformable.)30 The designed 200 x 200 μm closed-end microchannel cross section means
that increments of 7,500 cells (50,000 cells/mL) correspond roughly to an increase in cell
pellet length of 100 μm. The pellet length at the “healthy” detection level is therefore
400 m.
Cell counting is greatly facilitated by well-chosen geometry, with a localization
region where cells collect during centrifugation. Each SeCy comprises a funnel with a
narrow closed-end channel as its tip, as shown in Figure 3.5. The design process was a
trade-off between guiding the cells into the closed-end channel with minimal chance of
trapping along the walls at readily attainable rotational speeds, containing sufficient milk,
creating a compact cell pellet that can be readily measured without high-resolution
microscopy, and choosing an overall form factor consistent with a number of the structures
fitting onto a single CD. The upper wall of the V-shaped part of the funnel decreases from
a height of 900 m to 200 μm (where the closed-end channel begins) at an angle of 5.5º.
The deeper region allows more milk sample to be contained in a given device area, while
the shallower region creates a larger total area of compacted cells for quantitative
measurement. Because the centrifugal acceleration can be separated into normal and

A Point-of-care Microfluidic Sedimentation Cytometer for Milk Quality and Bovine Mastitis Monitoring
37
tangential components at the sloping “floor”,31 the low 5.5° angle keeps the tangential
component comparatively small, decreasing the likelihood that cells will become trapped
along the sloping floor as they move into the closed-end channel. The V-shaped region of
the funnel has a maximum angle of 37º relative to the disc radius, possibly larger than ideal
for minimizing cell trapping along this region of the side walls, but the sample volume,
height of the disc, and radius of the disc constrained this dimensional choice, which proved
to be acceptable.
3.3 Materials and methods
3.3.1 Disc fabrication
Initial CD-based assay prototypes were fabricated using a CAT3D micromilling
machine (Datron, UK). Cyclo olefin polymer (COP, Zeonor 1060R, Zeonor Chemicals,
Japan) plastic CDs were obtained from Åmic (Sweden). The discs had a 1.2 mm thickness,
an inner hole and outer diameter of 15 mm and 120 mm, respectively. The design was laid
out in a CAD program (Excalibur 5.0, Progressive Software Corporation, USA) and then
converted into micromilling machine code using the same software. All the features were
milled with a 1-mm solid carbide endmill tool (99010, Premier Machine Tools, Ireland) at
10,000 rpm except for the tip of the channel which was milled with a 0.5mm endmill tool
(905005-MEGA-T, Premier Machine Tools) at 11,000 rpm. The V-shape of the funnel was
machined in steps of 100 μm to create a tapered surface as shown in Figure 3.6.
Surface profiles of the fabricated devices were obtained using an optical profiling
system (Wyco NT1100, VEECO, USA). Sheets of 250 μm thick poly(methyl
methacrylate), PMMA, (Goodfellow, UK) were laminated into a sheet of 80 μm thick
double-sided pressure sensitive adhesive, PSA, (Adhesives Research Ltd, Limerick,
Ireland). The sheets were then cut to the size of a CD using a laser ablation system (Optec
Micromaster, Belgium). The liner of the PSA was removed and the adhesive laminated into
the milled plastic CD.

Chapter 3
38
Figure 3.6 Initial SeCy prototypes created with the micromilling machine. (a) 3D emulated design. (b)
Fabricated device with a magnified view of the bottom part of the funnel, highlighting the cell pellet in
red color.
The low throughput of this fabrication technique (three hours to fabricate a single
disc; two more to characterize the dimensions), the challenges of alignment and
reproducibility for small features on opposite extremes of the discs, and a need to
understand a path towards commercialization, compelled the development of a high-volume
manufacturing approach. Once a design was proven to work, the design was adapted to
injection mold tooling and discs were mass-fabricated in 1.4 mm thick COC (5013-S04,
Topas Advanced Polymers GmbH, Germany) by Microfluidic ChipShop (Jena, Germany)
using injection molding. All channel features are included in the single molded layer. A
flat 150- m-thick COC (8007, Topas Advanced Polymers GmbH, Germany) cover layer
was bonded to the 1.4-mm-thick disc with proprietary technology (Microfluidic ChipShop).
Unbonded discs and closed-end microchannels in bonded devices were characterized
with a Scanning Electron Microscope, SEM (Evo LS 15, Zeiss, Germany). Four SeCy units
from a single disc located at 90º to one another were analyzed. Closed-end channels on
bonded discs were manually cut with a knife for SEM characterization.

A Point-of-care Microfluidic Sedimentation Cytometer for Milk Quality and Bovine Mastitis Monitoring
39
3.3.2 Milk collection
Milk samples were obtained from the Irish Dairy Research Center, Teagasc (Fermoy,
Co. Cork, Ireland). The samples came from local Teagasc dairy research herds and were
analyzed using a milk analyzer, MilkoScan FT 6000 (FOSS, Denmark), which includes a
flow cytometer to count somatic cells. Milk samples then were stored at 4° C and
transported to our facilities for testing.
CD-based assay devices were loaded using exact volume pipettes of 150 μL (Poly-
Pipets Inc, NJ, USA).
3.3.3 Spinning station and optical setup
Raw milk volumes of 150 μL from individual samples were dispensed through the
inlet of each SeCy unit using a pipette. Milk flowed into the left side of the SeCy unit as
shown in Figure 3.1. No cross-contamination was observed between units when loading
each device. Up to 12 samples can be processed by the SeCy disc.
Discs were mounted on the spindle of a brushless DC motor with an integrated optical
encoder (Series 4490, Faulhaber, Switzerland). The motor was controlled by a host
computer using WinMotion (v2.02, Faulhaber).
Images of the channel tips were recorded with a low-cost microscope (MIC-D,
Olympus, USA). Images in bright-light provided enough contrast to distinguish the cell
pellet and fat layer from the rest of the milk as shown in Figure 3.7. Microscope
magnification was set to 22X to image the cream band whereas for the cell pellet it was set
at 57X. Cell pellet images were converted to a black and white image manually adjusting
the threshold using GIMP (v2.6.6, Free Software Foundation). Next, the pellet area was
processed and measured with custom software (MATLAB, Mathworks, USA). The area
returned by Matlab was in pixels so it had to be multiplied by a constant to obtain the area
in mm2. The volume of the cell pellet was obtained by multiplying the area times the height
of the channel. GIMP tools were also used to measure the fat band size and converted to
millimeters. Image processing results were compared to cell counts from the FOSS
MilkoScan system.

Chapter 3
40
Figure 3.7 Image analysis steps. The cream band and the cell pellet of each SeCy are imaged with a
microscope. The length of the cream band is measured with GIMP (top). Images from the cell pellet
(bottom) are manually converted to black and white (BW) using a raster graphic editor. BW images are
analyzed with customized software which returns a numeric value indicating the size of the area in pixels.
3.4 Results and discussions
3.4.1 Characterization
The tip of the closed-end channels had a height of 191 ± 9 μm and a width of 215 ±
10 μm, a 2.6% increase relative to the designed area for a 200-μm square. This deviation is
small relative to the standard deviations determined by experimental measurement (see Cell
Counts Results section) and therefore are not of concern.
.

A Point-of-care Microfluidic Sedimentation Cytometer for Milk Quality and Bovine Mastitis Monitoring
41
Figure 3.8 SEM images of the SeCy device showing images of the bottom part of the funnel (a); dotted
line shows the approximate locations where the cross sectional images were obtained in (b) and (c). Cross
sectional view of disc, highlighting disc borders with dotted lines (b), and cross sectional view of closed-
end channel. Arrows in (c) point to defects during release of molded disc from mold insert and
subsequent bonding. Scale bars are 500 μm, 200 μm, and 100 μm, in images (a), (b), and (c),
respectively.
3.4.2 Operational angular speeds
Air pockets became trapped in the closed-end microchannels during operation of the
device with milk and thus prevented any cells to reach the bottom of the channel. This
defect set the minimum angular speed of operation. Removal of all air pockets and filling
of closed-end channels with cells was possible at speeds of 4000 rpm and above, which is
equivalent to a pressure of 183 kPa at the tip of the channel. This pressure can be
calculated from the following equation:32
(3.1)
where is the angular velocity, the density of milk, and and r the average radial
distance from the CD center and length of the milk sample in the SeCy unit, respectively.

Chapter 3
42
The milk sample in the SeCy unit had an inner radius of 3.5 cm and the tip of the SeCy unit
is 5.7 cm away from the centers of the CD. This inner radius distance, determined by the
milk sample volume dispensed into the SeCy unit, is constant.
Previous SeCy designs demonstrated that filling of wider closed-end channels was
possible at angular speeds of 3000 rpm.29 The dimensions of the channel affects the filling
and can be optimized according to the application. Strategies do exist for bubble-free
priming of blind channels by a two-level hydrophilic structure33; however, surface treatment
(e.g. hydrophilizing) represents an extra step and cost in the manufacturing of the SeCy
system, which was desirable to avoid.
The maximum angular speed was set by pressures at which delamination of the sealed
CD occurs. Fluid leakage started to occur above 6000 rpm, equivalent to a pressure of 413
kPa. Thus, the proper functioning for cell counting of the SeCy ranges between 4000 and
6000 rpm.
3.4.3 Theory sedimentation time
We performed a theoretical analysis to estimate the minimum amount of time to form
the cell pellet and cream layer, the general case of the time for a single cell and a single fat
globule to travel the full length of the liquid in the rotating SeCy unit is considered. Cells
and fat globules are assumed to be rigid spheres, not subject to deformation for this
analysis, and the same local concentration of particles is assumed throughout the trajectory.
We also assumed milk plasma (whey) as the liquid medium where particles are suspended
and the liquid has Newtonian properties.
Four forces act on a spherical particle of radius R that is rotating in the SeCy unit at
an angular speed : centrifugal, FC = 2rVp p; buoyant, Fb = -
2rVp m; viscous drag, Fd = -
u ; and Brownian, Ff ,34 where r is the radial distance from the center of rotation to the
particle, Vp=4/3 R3 and p are the volume and density of the particle, respectively, m is the
density of the medium, u is the velocity of the particle, and uC is the (terminal) settling
velocity of the particle corrected by a factor that considers the volume fraction of particles
present in the solution.
The viscous friction coefficient, , is related to the size of the particle as =6 R,
where is the viscosity of the medium. Because the mean diameter of somatic cells is
about 10 μm, Brownian force is not included in these calculations. A cell reaches its
terminal velocity in a uniform centrifugal field in a matter of microseconds,35 so it is safe to
assume that the total force acting on it is
(3.2)
or

A Point-of-care Microfluidic Sedimentation Cytometer for Milk Quality and Bovine Mastitis Monitoring
43
(3.3)
thus the settling velocity can be found from the following equation (known as the Stokes
equation34):
(3.4)
This formula applies only to low-Reynolds-number conditions, Re < 1, for a single
particle.36 During sedimentation, hydrodynamic interactions with other cells or fat globules
can decrease the settling velocity.34,35,37,38 To correct for the particle concentration in
solution, Equation 3.4 must be adjusted by a correction factor,
(3.5)
also known as Richard-Zaki correlation, where C is the solid volume fraction and p is
an empirical constant equal to 5.5 for hard spheres and low Re.39 The correction factor does
not consider wall effects. Equations 3.4 and 3.5 have been studied for cubic and cylindrical
containers,40,41 hence the geometry of our device may require an alternate formulation. To
simplify the analysis we do not include wall effects, particularly rolling of cells to the upper
taper walls as they sediment, which could significantly affect settling velocity.31 Thus, we
assume that the majority of the cells remain in the bulk of the solution for most of the
sedimentation process.
The total solids volume fraction in milk is 0.21, 0.05 from the fat content plus 0.16
from other components (casein micelles, lactose, and whey protein).42 Although
sedimentation processes are dynamic and give rise to the propagation of kinematic waves
that change the volume fraction as a function of distance, Equation 3.5 remains a good
approximation of the settling velocity.43 A more thorough study of sedimentation processes
in a centrifugal field can be found elsewhere.44,45
To calculate the time it takes for a particle to travel from a radial distance r1 to r2,
Equation 3.4 and 3.5 are integrated to give
(3.6)
3.4.4 Fat globules sedimentation time
To determine the time it takes to form the band of cream (fat), experiments at
different angular speeds were performed using raw milk with 4.5% w/w of fat. Figure 3.9
shows the time evolution of the width of the cream band size at 2500, 4000, and 5500 rpm.
The time for a fat globule with a mean diameter42 of 3.5 μm to travel from the tip of the

Chapter 3
44
SeCy unit, r1 = 57 mm, to the top of the liquid, r2 = 35mm, was estimated using Equation
3.6. Calculated times were 9.6, 3.8, and 2 min for angular speeds of 2500, 4000, and 5500
rpm, respectively, and are represented as stripes in the same figure. At 2500 rpm, it takes
almost 15 min to before the cream band attains a constant area (unchanged by additional
spinning). A perceptible band is formed in ~3 min at 4000 rpm and remains constant for the
next 12.5 min. After 15 min, the 2500-rpm band converged to the same width as the 4000-
rpm band.
At 5500 rpm, the cream band is rapidly formed in two minutes, increases slightly in
width to a maximum in the next minute, then shrinks in size over the next 7 min, remaining
almost constant for a subsequent 5 min. From the calculated theoretical values, the width of
the cream layer was expected to remain constant after 2 min as was the case for the 4000-
rpm band. The reduction in cream band width was unexpected, but careful observations on
the disc revealed a significant protruding “bump” on the bottom part of the SeCy unit, i.e.
protrusion of the 150- m bonded polymer cover layer. The high pressures generated during
the rotation of the disc forced the thin layer to bulge up. This bulge caused the height of the
SeCy unit to increase, and thus reduced the width of the cream band while accommodating
the same volume of cream.
Calculated times from Equation 3.6 agree well with experimental findings and should
serve as a rough guide for estimating the minimum amount time to form the cream band.
Figure 3.9 Evolution of the cream band length over time at three different angular speeds (2500, 4000,
and 5500 rpm). Vertical stripes indicate the theoretical time required for a fat globule to travel from r1 to
r2, calculated using Equation 3.6. The error bars represent the standard deviations from three independent
measurements.
3.4.5 Somatic cells sedimentation time
Experiments at different speeds and times determined the appropriate conditions to

A Point-of-care Microfluidic Sedimentation Cytometer for Milk Quality and Bovine Mastitis Monitoring
45
sediment the cells. Figure 3.10 shows experiments carried out with raw milk with a cell
count of 4.74 x 10⁵ cells (as determined with the MilkoScan system) and a high fat content
of 4.94%. A reproducible cell pellet is formed between 10 and 15 min at 5000 and 5500
rpm. The data show that the cell pellet is more compacted at 5500 rpm than at 5000 rpm.
Error bars are smaller at faster speeds ( 5000 rpm) than when slower speeds are used.
Figure 3.10 Evolution of the cell pellet volume over time at four different angular speeds (4000, 4500,
5000, and 5500 rpm). Vertical stripes indicate the theoretical time it takes for a cell to travel from the
upper layer of the liquid to the tip of the SeCy unit, calculated using Equation 3.6. Image processing
software recognizes and measures the area occupied by the cells in the channel and computes the volume.
The error bars represent the standard deviations from three independent measurements.
In analogy to the fat globules, the time was calculated for a cell with a mean diameter
of 6 μm to travel from r1 to r2. Calculated times of 6.2, 4.9, 4, and 3.3 min for angular
speeds of 4000, 4500, 5000, and 5500 rpm, respectively, are represented as vertical stripes
in Figure 3.10. These times are not consistent with our experimental findings: there is a
difference of 7 min between expected and calculated values at 5500 rpm, and at 4000 rpm
this difference is 9 min and did not seem to form a constant pellet. Thus, Equation 3.6 does
not predict cell sedimentation times nearly as well as the times for fat band formation.
Figure 3.10 shows a sharp rate of increase in the cell pellet volume vs. spin time for
the first few minutes, followed by an almost two-fold decrease in subsequent minutes.
Although it was anticipated that the cell pellet would compress over time in the closed-end
channel, a two- or more-fold packing density increase was unexpected, even for a packing
fraction reaching 100%.30 In some cases, small debris or clusters of fat globules were
observed slowly migrating center-wards from the region of the closed-end channel; the
debris or clusters likely are initially trapped in the channel and slowly move center-wards as
they detach from the cells already trapped in the closed-end channel. The cell pellet volume

Chapter 3
46
ultimately remains stable at times exceeding 10 to 15 min for high angular speeds (> 5000
rpm).
The disagreement between calculated and experimental values for sedimentation time
of somatic cell can be attributed to multiple factors, fat globules or debris (from the raw
milk samples themselves) trapped in the channel being one. The fat globules tend to
aggregate in clusters and could interact with cells, perturbing their flow path and reducing
their velocity. The large difference in concentration between fat globules and somatic cells,
~4% versus 0.01%, makes this factor worthy of serious consideration. As shown in Figure
3.1, after 1 min at 5500 rpm, a dense cream band has formed that could block cell
sedimentation. It is also likely that some of the cells roll along the wall(s) as they move
toward the closed-end channel, decreasing the average settling velocity. Leatzow et al.
found that small differences in the angles of tapered walls can cause as much as a 6-fold
difference in the separation time.31
During experiments, we noted bulging of the 150-μm layer bonded to the device at all
speeds greater than 4000 rpm, more noticeable still at 5500 rpm. Upon stopping the disc,
the bulge slowly returns to an almost normal position. This bulging may have a detrimental
effect on the capture efficiency of the SeCys and will be further studied in the future.
Despite this fairly complicated behavior and the potential non-ideal effects, the
correlation between cell pellet volume and somatic cell count is still close to 90% (see
below).
3.4.6 Cell counts and fat percentages
After developing and characterizing the protocol to sediment the cells and fat
globules, a number of samples with different cell counts and fat percentages were tested.
All experiments were carried out for 15 min at an angular speed of 5500 rpm using an
angular acceleration of 150 rpm/sec to reach that speed.
Figure 3.11 shows results from various samples, comparing the width of the cream
band with readings from the MilkoScan system. The SeCy compares favorably to this
bench-top instrument, measuring samples with fat percentages ranging from 2 to 6.6%.

A Point-of-care Microfluidic Sedimentation Cytometer for Milk Quality and Bovine Mastitis Monitoring
47
Figure 3.11 Width of cream band compared to measurement of the same sample using the MilkoScan
system. The error bars represent the standard deviations from three independent measurements.
Figure 3.12 compares the results of the SeCy to the flow cytometer readings. The
SeCy detects cells in the range from 5x10⁴ to 5x10⁶ cells/mL with good correlation to the
commercial system (R2 = 0.88); the estimated lower limit of detection is 5 x 10⁴ cells/mL.
The data gap between 2x10⁶ and 5x10⁶ cells/mL is due to a lack of samples in that range.
High-cell-count samples are uncommon in well-maintained herds exhibiting low incidence
of mastitis; during the timeframe of these experiments, we could obtain only 3 samples
above 1 x 10⁶ cells/mL.
Figure 3.12 Cell pellet volumes obtained with the SeCY system compared to readings from the same
sample using the MilkoScan system. The “expected value” line represents the theoretical limit of 100%
cell-capture efficiency in the closed-end channel. Inset graph shows the comparison of up to 5x10⁶
somatic cells. The error bars represent the standard deviations from three independent measurements.

Chapter 3
48
The cell pellet volumes obtained with the SeCy devices are very close to the expected
values. Below 500,000 cells/mL, the SeCy system provides a better correlation (R2=0.92)
than at much higher cell counts (>500,000 cells/mL), where it is possible that some somatic
cells become trapped in the dense cream band that forms very rapidly at 5500 rpm. In
addition, at the onset of an infection and for cell counts higher than 200,000 cells, most of
the somatic cells are neutrophils, which engulf not only bacteria, but micelles and fat
globules as well,46,47 thus changing the physical properties (density) of some of those cells
and precluding them from reaching sedimenting in the closed-end channel.
A few parameters can be optimized to improve cell capture efficiency at high cell
counts: for example, reducing the speed of rotation in the first minutes slows initial
formation of the cream layer and may increase the chances of all cells sedimenting into the
closed-end channel. The effect of reducing or increasing the milk sample volume might
also be investigated. Future work could also include simulations to understand the effect of
the geometry (wall angles, aspect ratios) on the efficiency of sedimenting the cells, and
characterization of other phenomena such as the Coriolis effect.48
3.5 Reader
We developed a portable ‘point-of-cow’ (POC) reader system in parallel to the
manufacturing and testing of the SeCy chip; it is housed in a “farm-appropriate,” rugged
box. The reader, built by AOS Technoology Ltd. (Leicerstershire UK), incorporates
electronics, two microscopes, and a motor to spin the disc. The reader weighs 4 kg and
measures 30 cm wide x 22 cm deep x 20 cm tall and includes spin and scan stations. The
spin station rotates the disc at a fixed angular speed for a controllable time. The spin station
also features a lid with interlock mechanisms that only allows the disc to rotate when the lid
is closed as shown in Figure 3.13.
The scan station contains two USB digital microscopes with an integrated camera
(Dino-Lite AM413t, Absolute Data Services Limited, UK), one to measure the cell pellet
area and another to measure the cream band width. The former microscope is fixed at a
magnification of 183X, the latter at a 36.8X. Due to spatial constrains, the microscopes are
located at a 90° angle to one another, viewing different SeCy units. Selecting between the
two microscopes is accomplished with a toggle switch. The reader is connected to a
portable computer to acquire images. Electrical power is supplied from a rechargeable
lithium ion battery. USB and electrical connectors are located in the back panel of the box.
To operate the POC-reader, the user inserts the disc into the spin station, closes the
lid, and presses the spin button. The disc rotates for a fixed time. After the disc stops, the
disc is manually transferred to the reading station where the two microscopes capture an
image (Dino-Capture software) of the cell pellet and fat layer. Images can then be analyzed

A Point-of-care Microfluidic Sedimentation Cytometer for Milk Quality and Bovine Mastitis Monitoring
49
with a portable computer. A future version of the POC reader will integrate a
microcomputer and display in the same box.
Figure 3.13 (a) Point-of-Cow sedimentation cytometer reader system. (b) The reader consists of a spin
and a scan stations to facilitate and automate the cell pellet and band cream measurements.

Chapter 3
50
3.6 Conclusions
We demonstrated the design, fabrication, and characterization of a low-cost, portable
microfluidic system for assessing the number of somatic cells and fat content of whole,
unprocessed milk in 15 min. This system is one of the few demonstrations of a microfluidic
concept providing a “sample-in, answer-out” capability. Unlike other cell-counting
techniques, this assay requires no additional reagents. It is easy to operate and handle: the
user only needs to dispense 150 μL into each SeCy unit and insert the disc into a portable
reader.
Our CD-based device design was demonstrated to be manufacturable in large
quantities using injection molding of COC thermoplastic resin and a thin polymer cover
layer, in analogy to conventional CD manufacture. The CD includes twelve independent
sedimentation cytometer units, each resembling a flattened funnel with sloped walls to
facilitate the cell collection and featuring a narrow closed-end channel where cells sediment
and form a column whose length is proportional to cell count.
We investigated the formation of the cream layer over a range of angular speeds and
compared the results with theoretical values, and performed similar experiments for cell
pellets. Results from our device correlate well with those from a bench-top flow cytometer
designed specifically for milk analysis for both somatic cell counts and fat percentage
measurements. Our SeCy units measure fat content in the range 2.0 - 6.5% and cell counts
from 5 x10⁴ to 5 x10⁶ cells. The SeCy has captures efficiencies above 80% for cell counts
below 5 x10⁴ cells/mL and above 50% for higher cell counts.
We also reported the development of a ‘point-of-cow’ reader system to automate the
measurements of the cell pellets and the band of cream. The POC reader is suitable for
deployment on farms.
3.7 References
1. C. Viguier, S. Arora, N. Gilmartin, K. Welbeck and R. O'Kennedy. Mastitis detection:
current trends and future perspectives. Trends in Biotechnology (2009) 27, 486-493
2. J. E. Hillerton and E. A. Berry. Treating mastitis in the cow - a tradition or an archaism.
Journal of Applied Microbiology (2005) 98, 1250-1255
3. K. Huijps, T. J. G. M. Lam and H. Hogeveen. Costs of mastitis: facts and perception.
Journal of Dairy Research (2008) 75, 113-120
4. S. Pyorala. Indicators of inflammation in the diagnosis of mastitis. Veterinary Research
(2003) 34, 565-578
5. Y. H. Schukken, D. J. Wilson, F. Welcome, L. Garrison-Tikofsky and R. N. Gonzalez.
Monitoring udder health and milk quality using somatic cell counts. Veterinary Research
(2003) 34, 579-596

A Point-of-care Microfluidic Sedimentation Cytometer for Milk Quality and Bovine Mastitis Monitoring
51
6. K. E. Leslie, J. T. Jansen and G. H. Lim. Opportunities and implications for improved on-
farm cowside diagnostics. In: Proc DeLaval Hygiene Symposium, UK (2002), 147-160
7. D. O. Forcato, M. P. Carmine, G. E. Echeverria, R. P. Pecora and S. C. Kivatinitz. Milk fat
content measurement by a simple UV spectrophotometric method: An alternative screening
method. Journal of Dairy Science (2005) 88, 478-481
8. J. R. Ashes, S. K. Gulati and T. W. Scott. Potential to alter the content and composition of
milk fat through nutrition. Journal of Dairy Science (1997) 80, 2204-2212
9. J. J. Windig, M. P. Calus and R. F. Veerkamp. High milk yields and the risk of mastitis in
different herd environment. In: Mastitis in dairy production: current knowledge and future
solutions. Ed. H. Hogeveen. Wageningen Academic Publishers, The Netherlands (2005),
254-259
10. J. S. Moon, H. C. Koo, Y. S. Joo, S. H. Jeon, D. S. Hur, C. I. Chung, H. S. Jo and Y. H.
Park. Application of a new portable microscopic somatic cell counter with disposable
plastic chip for milk analysis. Journal of Dairy Science (2007) 90, 2253-2259
11. C. Gonzalo, J. C. Boixo, J. A. Carriedo and F. San Primitivo. Evaluation of rapid somatic
cell counters under different analytical conditions in ovine milk. Journal of Dairy Science
(2004) 87, 3623-3628
12. E. Berry, N. Middleton, M. Gravenor and J. E. Hillerton. Science (or art) of cell counting.
In: Proceedings of the British Mastisis Conference, UK (2003), 73-83
13. D. A. Ateya, J. S. Erickson, P. B. Howell, L. R. Hilliard, J. P. Golden and F. S. Ligler. The
good, the bad, and the tiny: a review of microflow cytometry. Analytical and Bioanalytical
Chemistry (2008) 391, 1485-1498
14. T. D. Chung and H. C. Kim. Recent advances in miniaturized microfluidic flow cytometry
for clinical use. Electrophoresis (2007) 28, 4511-4520
15. D. Huh, W. Gu, Y. Kamotani, J. B. Grotberg and S. Takayama. Microfluidics for flow
cytometric analysis of cells and particles. Physiological Measurement (2005) 26, R73-R98
16. N. Pamme, R. Koyama and A. Manz. Counting and sizing of particles and particle
agglomerates in a microfluidic device using laser light scattering: application to a particle-
enhanced immunoassay. Lab on a Chip (2003) 3, 187-192
17. S. Gawad, L. Schild and P. Renaud. Micromachined impedance spectroscopy flow
cytometer for cell analysis and particle sizing. Lab on a Chip (2001) 1, 76-82
18. X. H. Cheng, A. Gupta, C. C. Chen, R. G. Tompkins, W. Rodriguez and M. Toner.
Enhancing the performance of a point-of-care CD4+T-cell counting microchip through
monocyte depletion for HIV/AIDS diagnostics. Lab on a Chip (2009) 9, 1357-1364
19. X. Cheng, Y. S. Liu, D. Irimia, U. Demirci, L. J. Yang, L. Zamir, W. R. Rodriguez, M.
Toner and R. Bashir. Cell detection and counting through cell lysate impedance
spectroscopy in microfluidic devices. Lab on a Chip (2007) 7, 746-755
Chapter 3
52
20. X. H. Cheng, D. Irimia, M. Dixon, K. Sekine, U. Demirci, L. Zamir, R. G. Tompkins, W.
Rodriguez and M. Toner. A microfluidic device for practical label-free CD4+T cell
counting of HIV-infected subjects. Lab on a Chip (2007) 7, 170-178
21. D. W. Inglis, K. J. Morton, J. A. Davis, T. J. Zieziulewicz, D. A. Lawrence, R. H. Austin
and J. C. Sturm. Microfluidic device for label-free measurement of platelet activation. Lab
on a Chip (2008) 8, 925-931
22. J. A. Davis, D. W. Inglis, K. J. Morton, D. A. Lawrence, L. R. Huang, S. Y. Chou, J. C.
Sturm and R. H. Austin. Deterministic hydrodynamics: taking blood apart. Proceedings of
the National Academy of Sciences of the United States of America (2006) 103, 14779-
14784
23. J. E. Hillerton and E. A. Berry. Quality of the milk supply: Europeand regulations versus
practice. In: National Mastitis Council Annual Meeting Proceedings, USA (2004), 207-214
24. C. Nightingale, K. Dhuyvetter, R. Mitchell and Y. Schukken. Influence of variable milk
quality premiums on observed milk quality. Journal of Dairy Science (2008) 91, 1236-
1244
25. P. Walstra, T. J. Geurts, A. Noomen, A. Jellema and M. A. J.S. van Boekel. Dairy
technology: principles of milk properties and processes. ed. Marcel Dekker, NY, USA
(1999), 118-125
26. C. S. Lee, F. B. P. Wooding and P. Kemp. Identification, Properties, and Differential
Counts of Cell-Populations Using Electron-Microscopy of Dry Cows Secretions,
Colostrum and Milk from Normal Cows. Journal of Dairy Research (1980) 47, 39-50
27. P. Sethu, A. Sin and M. Toner. Microfluidic diffusive filter for apheresis (leukapheresis).
Lab on a Chip (2006) 6, 83-89
28. P. Walstra. Physical chemistry of milk fat globules. In: Advanced Dairy Chemistry. Ed. P.
F. Fox. Chapman & Hall, London (1995), 131-151
29. J. Garcia-Cordero, L. Kent, I. Dimov, C. Viguier, L. Lee and A. Ricco. Microfluidic CD-
Based Somatic Cell Counter for the Early Detection of Bovine Mastitis. In: 12th
International Conference on Miniaturized Systems for Chemistry and Life Sciences,
microTAS, San Diego (2008), 1762-1764
30. A. Donev, I. Cisse, D. Sachs, E. Variano, F. H. Stillinger, R. Connelly, S. Torquato and P.
M. Chaikin. Improving the density of jammed disordered packings using ellipsoids.
Science (2004) 303, 990-993
31. D. M. Leatzow, B. J. Van Wie, B. N. Weyrauch and T. O. Tiffany. Design optimization
and characterization of a small-scale centrifugal cell separator. Analytica Chimica Acta
(2001) 435, 299-307
32. M. Madou, J. Zoval, G. Y. Jia, H. Kido, J. Kim and N. Kim. Lab on a CD. Annual Review
of Biomedical Engineering (2006) 8, 601-628

A Point-of-care Microfluidic Sedimentation Cytometer for Milk Quality and Bovine Mastitis Monitoring
53
33. L. Riegger, M. Grumann, J. Steigert, S. Lutz, C. P. Steinert, C. Mueller, J. Viertel, O.
Prucker, J. Ruhe, R. Zengerle and J. Ducree. Single-step centrifugal hematocrit
determination on a 10-$ processing device. Biomedical Microdevices (2007) 9, 795-799
34. V. Sharma, K. Park and M. Srinivasarao. Shape separation of gold nanorods using
centrifugation. Proceedings of the National Academy of Sciences of the United States of
America (2009) 106, 4981-4985
35. W. D. Corry and H. J. Meiselman. Deformation of Human Erythrocytes in a Centrifugal
Field. Biophysical Journal (1978) 21, 19-34
36. W. B. Russel, D. A. Saville and W. R. Schowalter. Colloidal Dispersions. ed. Cambridge
University Press, Cambdrige, UK (1992),
37. G. J. Kynch. A Theory of Sedimentation. Transactions of the Faraday Society (1952) 48,
166-176
38. A. D. Maude and R. L. Whitmore. A Generalized Theory of Sedimentation. British Journal
of Applied Physics (1958) 9, 477-482
39. J. Martin, N. Rakotomalala and D. Salin. Accurate Determination of the Sedimentation
Flux of Concentrated Suspensions. Physics of Fluids (1995) 7, 2510-2512
40. E. Kuusela, J. M. Lahtinen and T. Ala-Nissila. Sedimentation dynamics of spherical
particles in confined geometries. Physical Review E (2004) 69, -
41. R. Burger and W. L. Wendland. Sedimentation and suspension flows: Historical
perspective and some recent developments. Journal of Engineering Mathematics (2001)
41, 101-116
42. P. F. Fox and P. L. H. McSweeney. Advanced Dairy Chemistry: Lipids, vol. 2. ed.
Springer, USA (2003), 201-203
43. D. Lerche. Dispersion stability and particle characterization by sedimentation kinetics in a
centrifugal field. Journal of Dispersion Science and Technology (2002) 23, 699-709
44. R. Bürger, J. J. R. Damasceno and K. H. Karlsen. A mathematical model for batch and
continuous thickening of flocculated suspensions in vessels with varying cross-section.
International Journal of Mineral Processing (2004) 73, 183-208
45. R. Burger and F. Concha. Settling velocities of particulate systems: 120. Batch
centrifugation of flocculated suspensions. International Journal of Mineral Processing
(2001) 63, 115-145
46. R. J. Harmon. Symposium - Mastitis and Genetic Evaluation for Somatic-Cell Count -
Physiology of Mastitis and Factors Affecting Somatic-Cell Counts. Journal of Dairy
Science (1994) 77, 2103-2112
47. M. E. Kehrli and D. E. Shuster. Factors Affecting Milk Somatic-Cells and Their Role in
Health of the Bovine Mammary-Gland. Journal of Dairy Science (1994) 77, 619-627
48. D. Fromer and D. Lerche. An experimental approach to the study of the sedimentation of
dispersed particles in a centrifugal field. Archive of Applied Mechanics (2002) 72, 85-95

Chapter 3
54

55
4
Liquid Recirculation in Microfluidic Channels
by the Interplay of Capillary and Centrifugal Forces*
In this chapter a technique to recirculate liquids in a microfluidic channel is presented. By the interplay of capillary and centrifugal forces it is possible
to sample successive sub-aliquots of a liquid by bringing them into successive contact with the same sensing surface.
*Parts of this chapter have been published in the Journal of Microfluidics
and Nanofluidics

Chapter 4
56
4.1 Introduction
Immunological assays such as ELISA (enzyme-linked immnosorbent assay) are among
the most reliable and widely used techniques in medical diagnostics.1-4 Immunoassays are used
to detect a variety of targets from raw samples: cells, bacteria, proteins, viruses, antigens,
pollutants, hormones, peptides, nucleic acids, and even pesticides.5 The combination of
microfluidics with immunoassays, specifically with surface-bound probes, has demonstrated the
potential to deliver low-cost, high-sensitivity, easy-to-operate, portable point-of-care (POC)
devices.1
In assays carried out using microfluidic architectures, target analytes can be delivered
effectively to surface-immobilized receptors using less reagent volume and/or less time than
bench-top counterparts.6 However, microfluidics has yet to become a workhorse for the
analysis of precious raw samples containing very rare molecules or particles in large volumes,
one important example being the detection of a handful of cancer cells in a few mL of whole
blood,7 and another being the detection of certain proteins at femtomolar levels and below (one
target molecule in a 100-μm cube).8 Recent advances show that some microfluidic systems can
successfully tackle this problem, the price being laborious fabrication methods, expensive
materials, and costly instrumentation.2,7,8
To improve limits of detection (LODs) in microfluidic devices in such instances, three
approaches have been proposed: (1) using sensors (detectors) with exceptional limits of
detection and specificity; (2) employing a reliable microfluidic strategy that delivers most of the
analyte to the sensor very efficiently; or (3) combining both approaches.2 Any approach must
include consideration of time-to-result, as well as manufacturability issues, if it is to be
considered for commercial point-of-care use.
Successful fluidic approaches to improve LODs require a major fraction of the target
species in a liquid sample to have sufficient time to diffuse to the detection surface as the
sample flows by. If this is not the case, larger sample volumes are needed to provide a given
limit of detection with reasonable assay times. To avoid localized target depletion around the
sensor area, quick replenishment with fresh sample is necessary, and this is often provided by
high flow rates that further increase sample consumption.9
Several strategies have been proposed to efficiently deliver analyte to the sensing surface.
The most obvious has been simple reduction of channel or chamber size, which may not
necessarily accelerate target capture adequately to shorten assay times to a few minutes10 and
can render some fluidic miniaturization strategies impractical. Reduction of channel height to
dimensions where diffusion times are on the order of few seconds has been explored to increase
sensor sensitivity.6,10 However, reducing the channel dimensions implies either a reduction in
volumetric flow rate and a corresponding increase in assay time, or an increase in pressure to

Liquid Recirculation in Microfluidic Channels by the Interplay of Capillary and Centrifugal Forces
57
often-impractical levels to maintain the same flow rates and assay times. In addition, channels
with heights less than 20 μm are prone to clogging and remain challenging for large-scale
manufacturing and bonding to other substrates.
Another strategy exploited in microfluidic devices is to flow the sample at very low flow
rates (often nL/sec) to provide enough time for analytes to diffuse to surface receptors.9
However, for large sample volumes this approach may be impractical due to its adverse impact
on assay time.
Another microfluidic strategy is to confine the sample using sheath flow to reduce the
flow layer thickness of the original sample. Although this method reduced assay times from 55
min to 13 min, it required 25 times more confining buffer than the original sample and relatively
elaborate microfabrication techniques with exquisite flow control.6 Some groups have explored
the use of continuously and discontinuously rotating chambers,11 microfluidic planetary
centrifugal mixing,12 and electrothermal stirring.13
On-chip passive mixing can also increase the rate of mass transfer to the sensor surface;
this can be implemented by adding grooves, chevrons, or other structures to microfluidic
channel surfaces.14-19 Active mixing using external forces20-27 can also enhance the rate of mass
transfer. However, these mixing strategies require precise flow control, can involve elaborate
microfabrication techniques, or require coupling of external actuators to the microfluidic
channel.
Relative to diffusion-limited mass transport, recirculation and other means of liquid
movement can enhance capture efficiency for surface-binding or solution-phase reaction
kinetics for a given interaction time by providing more (frequent) collisions of solution-phase
species with one another or with binding sites.24,28-32 For a given assay time, (re)circulation can
thus enable (i) use of smaller sample volumes without loss of assay sensitivity or (ii) more
exhaustive sampling of larger sample volumes, improving limits of detection. Microfluidic
recirculation has been shown variously to shorten nucleic acid hybridization times by 3x – 10x
compared to conventional methods,28-30 to enhance reaction kinetics by almost two orders of
magnitude,31 to reduce sample volume requirements by 1 to 3 orders of magnitude,32 and to
accelerate mixing.33,34 Examples of devices used to recirculate solutions in microfluidic devices
are shown in Figure 4.1.

Chapter 4
58
Figure 4.1 Examples of strategies used to recirculate solutions in microfluidic devices. (a) A peristaltic
pump is used to pump and recirculate a solution in a hybridization chamber.30 (b) Two hybridization
chambers are connected by channels with herringbone indentations. The solution is then recirculated
between the two chambers to reduce DNA hybridization times.28
We report herein a technique to (re)circulate liquids through microfluidic channels in a
compact disc (CD)-format fluidic device using the interplay of capillary and centrifugal forces,
demonstrating that a liquid sample can be recirculated through a microchannel at least 1000
times without observable change apart from slight evaporation. Li et al.35 have shown an
important application of this approach to accelerating the rate of hybridization of DNA.36 We
present here the physical equations and demonstrate the principles that govern this method,
summarizing their implications for such key assay and device parameters as sample volume,

Liquid Recirculation in Microfluidic Channels by the Interplay of Capillary and Centrifugal Forces
59
channel volume, diffusion coefficient, channel height, and number of "spin cycles" required to
achieve a given surface binding percentage of a low-concentration analyte.
Solely by manipulating disc spin rates and durations, a sample with many times the
volume of the channel can be brought into surface contact in its entirety by introducing
successive aliquots of the sample, removing each aliquot after a defined interaction time, re-
mixing the entire sample, then introducing a fresh aliquot. Liquid volumes of μL to mL can be
handled in many sizes of microfluidic channels, provided the channel wall with greatest surface
area is hydrophilic.
Our approach is easily implemented compared to techniques requiring special
microfabrication methods or syringe pumps.28-32 The polymer-based devices are inexpensive to
produce in quantity and easy to prototype: one hour from concept to completed device. Another
advantage is that the equipment needed to drive this process is minimal, requiring only a low-
cost motor to spin a compact disc (80 g weight) up to 1500 rpm (CD player motors rotate at up
to 3000 rpm and are inexpensive: less than $US5 in electronics shops). Recirculation is
achieved by spinning and stopping the disc.
4.2 Recirculation concept
The device and its conceptual operation, Figure 4.2, show an inlet reservoir, a
microfluidic channel, and a blind outlet reservoir that is vented by a small perforation to enable
air ingress and egress. The top or bottom channel surface is hydrophilic to enable capillary
filling. The inlet and outlet reservoirs, the volumes of which can exceed that of the solution to
be circulated in a single cycle by many times, must be large enough to contain the entire sample
volume. The connection to the outlet chamber is sufficiently narrow that liquid (re)fills the
microchannel by capillary flow.
After the sample is introduced into the inlet reservoir, capillary action draws liquid into
the channel. The fluid front stops at the junction between channel and outlet reservoir, leaving
much or most of the liquid in the inlet reservoir. Spinning the device moves the fluid from the
inlet, through the channel at a flow rate controlled by a combination of angular acceleration and
final angular speed, into the outlet reservoir. This imparts momentum to the liquid moving from
the channel into the outlet chamber, which exerts a force on the sample in the outlet reservoir.
The centrifugal force also has a noticeable effect on the liquid contained in the outlet reservoir.
At low angular speeds, the volume is spread uniformly over the entire “floor” of the reservoir,
but as speed increases and more sample volume is added to the outlet reservoir, the liquid is
forced against the outer wall of the reservoir, the height of the liquid column then being limited
by gravity and/or the top cover of the reservoir. The Coriolis pseudo-force can also help to mix
at high angular speeds and for wide outlet reservoirs. The Coriolis effect forces the moving
liquid to one side of the chamber during rotation;37 that, combined with the fluid momentum, is

Chapter 4
60
another factor that changes the shape of the fluid within the reservoir in response to angular
speed. Thus, two factors (driven by multiple phenomena), namely the momentum of the fluid
entering the outlet reservoir and the changing shape and volume of the liquid in that reservoir,
effectively mix the liquid by advection.
Once rotation stops, the now well-mixed liquid refills the channel by capillary action.
This operation can be repeated many times, the mixing in the outlet chamber providing a
random sample aliquot to the channel for each cycle.
Figure 4.2 Process to (re)circulate liquids and capture scarce analytes. (a) A number of devices can fit on
one CD. (b) Device schematic. Solution is loaded into the inlet reservoir (c), capillary forces draw liquid
into the channel (d) until it reaches the outlet chamber, where it stops (e). Rotating the device forces the
liquid to flow into the outlet reservoir (f,g). Immediately after stopping the device, liquid flows in the
opposite direction (h), refilling the channel (i). This process is automatically repeated to sample the entire
fluid volume (i e). (j) Fabricated device.

Liquid Recirculation in Microfluidic Channels by the Interplay of Capillary and Centrifugal Forces
61
4.3 Experimental details
4.3.1 Design of devices
Dimensions of microfluidic channels were 4 mm wide and 80 μm deep. The microfluidic
channel length was 6 cm and 3.1 cm for the capillary filling and the centrifugal experiments,
respectively. Devices were designed in a CAD program (AUTOCAD 2007, Autodesk, USA).
4.3.2 Fabrication of devices
Different materials were used for top and bottom channel surfaces: hydrophilic layers
(MH90368, Adhesives Research, Ireland), poly(methylmethacrylate) (PMMA) sheets
(GoodFellow, UK), and cyclo-olefin polymer (COP) transparent compact discs (Zeonor 1060R,
Zeon Chemicals, USA).
Devices were fabricated using multi-layer lamination as shown in Figure 4.3.35 A CO2
laser system (Laser Micromachining LightDeck, Optec, Belgium) was used to cut the different
plastic layers. Microfluidic channels were laser-cut from an 80-μm thick layer of double-sided
pressure sensitive adhesive, d-PSA, film (AR9808, Adhesives Research, Ireland). Reservoir
and inlet structures consisted of a 1 mm thick layer of PMMA bonded to a d-PSA. The lid on
the reservoir was made of a 0.2 mm thick layer of PMMA bonded to a layer of d-PSA. A
thermal roller laminator (Titan-110, GBC Films, USA) was employed to laminate the different
polymer layers with the d-PSA films. For the assembly of all devices, the temperature in the
laminator was set at 60°C with a height difference of 1.5mm between the rollers.
The maximum length of a device is restricted to the axial length of the CD which is 52.5
mm (inner radius 7.5 mm, outer radius 60 mm).

Chapter 4
62
Figure 4.3 Assembly of the recirculation microfluidic device. (a) The d-PSA is laminated to the bottom
substrate. (b) The liner from the d-PSA is peeled off and the top substrate bonded onto it. The inlet and
reservoir structures are created by (c) laminating a thick layer of acrylic with d-PSA onto the assembly.
Finally, (d) a lid is attached to the reservoir structure using a thin layer of acrylic with d-PSA.
4.3.3 Test solution
To facilitate visualization of liquid displacement in the microchannels, a mixture of 40
mL of de-ionized water and 0.3 mL of red food coloring (Cochineal Artificial Food Colouring:
Water, Colour (Carmoisine E122), Acid (Acetic); Goodall’s, Ireland) was used. Surface tension
was assumed to be 71 x10-5 N, a density of 1000 kg/m3 and viscosity of 1 cP were also assumed,
similar to the properties of water.
Contact angles of the different substrates were measured using a sessile drop analysis
instrument (FTÅ200, First Ten Ångstroms, USA). Solution contact angles of these materials
were measured as 12°, 76°, and 90° for the hydrophilic layer, PMMA, and COP, respectively.
4.3.4 Spinning station and optical setup
Fabricated devices were attached to a transparent compact disc (Åmic, Sweden). Discs
were subsequently mounted on the spindle of a brushless DC motor with an integrated optical
encoder (Series 4490, Faulhaber, Switzerland). Flow of liquids was monitored using a 12X
motorized zoom lens (Navitar, UK) attached to a high-sensitivity camera (Sensicam QE, PCO
AG, Germany). Motor and camera were controlled by a host computer. The motor triggered
the camera every revolution to acquire images of the spinning disc. Camware (PCO AG,
Germany) was used to acquire and analyze captured images.

Liquid Recirculation in Microfluidic Channels by the Interplay of Capillary and Centrifugal Forces
63
4.4 Results and discussions
To control the movement of liquids in microchannels using this device, two principal
forces acting on the fluid must be taken into account: capillary and centrifugal. The capillary
force initially draws the liquid into the channel until it completely fills the channel. The filling
speed is dictated by the hydrophilic properties (contact angle) of the channel’s surfaces, its cross
sectional area, and the fluid properties (viscosity, density, surface tension). When the disc is set
in motion, the centrifugal force begins to displace the liquid in an outward direction from the
center of rotation; however, as any given section of the channel becomes empty, the capillary
force continues to act in a manner that would refill the channel, essentially in opposition to the
centrifugal force. Thus, the centrifugal force must exceed the capillary force (which is
constant), a process enabled by sufficient rotational speed, as discussed in Section 4.4.2.
In this work, we studied and characterized the effect of both forces in microfluidic
channels. Due to the small vertical dimension of the system, the effect of gravitational force is
negligible, so it is not considered in these calculations.
4.4.1 Capillary filling
The interfacial pressure PC of a liquid front advancing into a rectangular channel is given
by5,9:
(4.1)
where is the surface tension of the liquid, h and w are the height and width of the
channel, respectively, and cos B,T,L,R are the contact angles of the liquid with the surface of the
bottom, top, left, and right walls, respectively.
To obtain the filling speed of a channel up to distance L(t) by capillary action, the
volumetric flow rate, Q, is given by
(4.2)
subject to
(4.3)
where V(t) is the time-dependent volume filled, P is the difference in pressure, and R is
the hydrodynamic resistance of the channel and is given by:38

Chapter 4
64
(4.4)
which for a rectangular microchannel for high-aspect ratio channels such that w >> h, ,
(our channels have an aspect ratio of 50:1) is given by:38
(4.5)
where μ is the fluid viscosity. Substituting Equation 4.5 in Equation 4.2 and equating
Equation 4.3 and 4.2, we arrive to the following:
(4.6)
Integrating Equation 4.6 results in:
(4.7)
which is also known as the Washburn equation39 and describes the progression of the
advancing meniscus in the microchannel at time t. Conversely, by expressing t as a function of
L, equation 4.7 yields the (minimum) time required for the liquid to wick (back) into the
channel.
In Figure 4.4, experimental results are compared to theoretical values from Equation 4.6.
When at least one substrate is very hydrophilic ( B or T < 15°), filling times are independent of
the contact angle of the opposing substrate and are significantly faster than when both substrates
have identical, moderate contact angles ( B = T = 76°).

Liquid Recirculation in Microfluidic Channels by the Interplay of Capillary and Centrifugal Forces
65
Figure 4.4 Characterization of liquid filling an empty microchannel by capillary force as a function of
the square root of time. Comparison of experimental (points are averages of 3 measurements) and
theoretical values obtained from Equation 4.2 (lines) for different top and bottom surface contact angles.
Upper left schematic shows the capillary force, Pc, acting on the plug of liquid displaced by a distance L.
The error bars represent the standard deviation from three independent measurements.
Discrepancies between calculated and measured values may be attributable to the
roughness of the channel side walls, which can “pin” the fluid along the walls during filling,
slowing the flow. Also, the Washburn equation neglects inertial effects, gravity, and deviations
from a fully-developed flow profile and a dynamic contact angle.40-42 Nonetheless, it can be
concluded that when one substrate is highly hydrophilic, the difference between expected and
measured fill time is typically less than 200 ms.
4.4.2 Centrifugal-capillary interaction
The centrifugally-induced hydrostatic pressure at the outer end of the liquid plug is given
by:43,44
(4.8)
where is the density of the liquid and is the angular velocity of the disc. And
(4.9)
(4.10)

Chapter 4
66
where is the average distance of the liquid plug in the channel from the center of
rotation and is the radial length of the liquid plug as shown in Figure 4.5. ro and ri are the
inner and outer radii of the liquid plug, respectively.
ro remains constant at all times because the liquid cannot go further than this point. Also,
the capillary pressure is constant at the front end of the liquid plug. The maximum speed of
rotation needed to displace the liquid from the inlet to the outer edge of the microfluidic
channel, as well as the minimum speed needed for the liquid to return into the channel, can be
calculated, as can the displacement distance of the liquid front, or ri, at different angular speeds.
The (stationary) equilibrium position, ri, of the inner meniscus,
(4.11)
occurs when Pm is equal to PC at all times, with
(4.12)
The liquid starts moving at an initial angular speed, i, where the centrifugal pressure
overcomes the capillary force, Pm - PC > 0, thus
(4.13)
the final speed at which the liquid is fully displaced to the outlet chamber is
(4.14)
where rf is the radius of the end of the microfluidic channel.
To verify these relationships, we fabricated three identical devices with lengths of 3.5 cm
(ri = 2 cm, rf = 5 cm, ro = 5.5 cm), widths of 4 mm and depths of 80 μm , using hydrophilic
layers for top and bottom substrates ( B = T = 12°). The total sample volume was 25 μL; the
enclosed microchannel volume was ~ 11 μL. With these values, Equation 4.1 yields a capillary
pressure of 1214 Pa, from which equation 4.11 gives ri as a function of , shown in Figure 4.5;
i and f were calculated from Equation 4. 13 and 4.14 as 214 and 600 rpm, respectively.
Figure 4.5 shows that the liquid plug begins to move radially outward at 210 rpm, at
which point centrifugal pressure overcomes capillary pressure. As increases, the liquid plug
advances, reaching the channel end at 600 rpm. These values agree well with calculated results,
214 and 600 rpm.

Liquid Recirculation in Microfluidic Channels by the Interplay of Capillary and Centrifugal Forces
67
Figure 4.5 Comparison of experimental and theoretical values for fluid radial displacement, ri, versus the
angular velocity of the disc. Sequence of images shows liquid displacement from the top
(corresponding to the reservoir near the disc’s center) at different angular speeds. The outlet chamber is
marked by a red bar at the bottom of each image. If the angular speed is reduced below 200 rpm, liquid
wicks back into the channel by capillary action. Left schematic shows the two forces acting on the plug of
liquid and the dynamic radii. The error bars represent the standard deviation from five measurements.
4.4.3 Acceleration test
The flow velocity at which a solution passes over a capture region or sensor in a
microchannel may affect the sensitivity and/or limit of detection of an assay or sensor. In some
circumstances, it may be necessary to incubate the sample with the sensing surface region for a
predetermined time, then replenished it with fresh sample solution. For example, a target
protein in solution with a diffusion coefficient of 10-6 cm2/s requires about 12 sec to diffuse
across a 50- m channel; a red blood cell requires about 38 sec to gravitationally sediment
through that same distance. By selecting the angular acceleration, final angular velocity, and
incubation time between successive “spin cycles”, this platform can adjust to the characteristic
binding, diffusion, and sedimentation times for any analyte and capture surface combination.
Using the device described above, a series of experiments revealed the time to flush the
liquid from the microchannel into the outlet reservoir as a function of angular acceleration. For
the range of accelerations and final frequencies studied, most of the liquid is displaced during
the acceleration phase and is transferred to the outlet chamber by the time the final angular
speed is attained, so the measurements were performed over a range of constant accelerations to
the same final angular speed. The results, Figure 4.6, show that evacuation time can be
controlled from 5 s to 400 ms (a shorter channel, of course, would have shorter evacuation
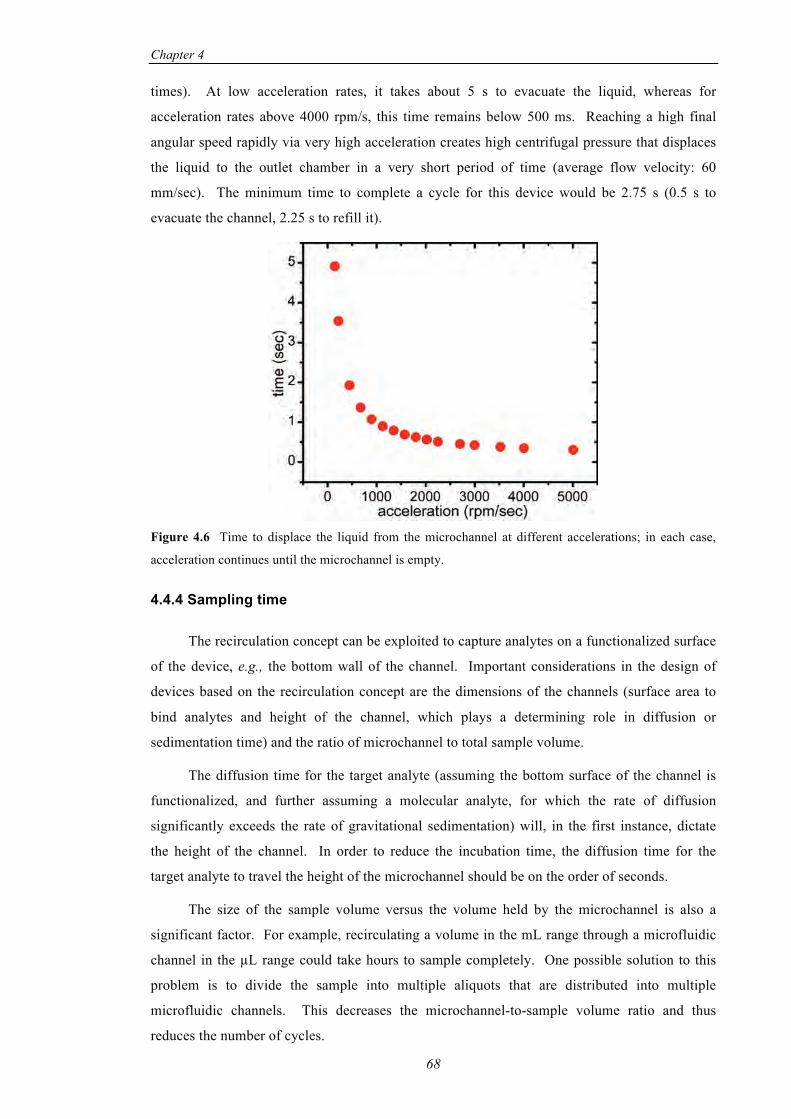
Chapter 4
68
times). At low acceleration rates, it takes about 5 s to evacuate the liquid, whereas for
acceleration rates above 4000 rpm/s, this time remains below 500 ms. Reaching a high final
angular speed rapidly via very high acceleration creates high centrifugal pressure that displaces
the liquid to the outlet chamber in a very short period of time (average flow velocity: 60
mm/sec). The minimum time to complete a cycle for this device would be 2.75 s (0.5 s to
evacuate the channel, 2.25 s to refill it).
Figure 4.6 Time to displace the liquid from the microchannel at different accelerations; in each case,
acceleration continues until the microchannel is empty.
4.4.4 Sampling time
The recirculation concept can be exploited to capture analytes on a functionalized surface
of the device, e.g., the bottom wall of the channel. Important considerations in the design of
devices based on the recirculation concept are the dimensions of the channels (surface area to
bind analytes and height of the channel, which plays a determining role in diffusion or
sedimentation time) and the ratio of microchannel to total sample volume.
The diffusion time for the target analyte (assuming the bottom surface of the channel is
functionalized, and further assuming a molecular analyte, for which the rate of diffusion
significantly exceeds the rate of gravitational sedimentation) will, in the first instance, dictate
the height of the channel. In order to reduce the incubation time, the diffusion time for the
target analyte to travel the height of the microchannel should be on the order of seconds.
The size of the sample volume versus the volume held by the microchannel is also a
significant factor. For example, recirculating a volume in the mL range through a microfluidic
channel in the L range could take hours to sample completely. One possible solution to this
problem is to divide the sample into multiple aliquots that are distributed into multiple
microfluidic channels. This decreases the microchannel-to-sample volume ratio and thus
reduces the number of cycles.

Liquid Recirculation in Microfluidic Channels by the Interplay of Capillary and Centrifugal Forces
69
The particular details of the application will determine which factors can help to reduce
the number of cycles and thus the time to result. Here, we introduce statistical calculations that
help in choosing the appropriate device geometry in order to compute (and minimize) the
number of cycles needed to capture a significant amount of the analyte.
For example, for respective sample and channel volumes of 100 L and 25 L, ideal
mixing results in 25% “sampling overlap” between two successive spin cycles; thus,
statistically, a total of 16 cycles samples more than 99% of the fluid volume at least once.
Similarly, a volume of 5 mL can be sampled in 15 L aliquots with 95% efficiency by 1000
successive cycles. The fraction, F, of the sample brought within one diffusion length of the
surface (diffusion length being defined here as channel height) in n spin cycles is given by:
(4.15)
where p is the ratio of the microfluidic channel volume, VM, to the total sample volume, VT .
The probability of different fractions of sample volume-to-microchannel-volume ratios is
plotted in Figure 4.7. For a fraction 1/3, it takes 6 cycles to sample 90% of the volume whereas
it takes 45 cycles for a fraction of 1/50.
Figure 4.7 Percentage of randomly distributed analyte molecules in a fluid sample brought within one
diffusion length of the device surface as a function of the number of “spin cycles” of a fluidic CD device.
Calculated values from Equation 4.15 are plotted for different ratios of microfluidic channel volume to
total sample volume. For larger ratios ( 1/3), the sample volume is 90% sampled in less than 10 cycles,
whereas for low ratios ( 1/50), over 100 cycles are needed to sample 90% of the sample volume.
For the CD devices we fabricated, a surface area of 1 cm2 is available for binding of
analytes, so a 15- L aliquot implies a channel height of 150 m which, if defined to be the
diffusion length, , yields a diffusion time of 113 s for an analyte with a typical diffusion

Chapter 4
70
coefficient of 10-6 cm2/s. With a total sample volume of 5 mL and 0.5 s allowed for each
spinning step, this diffusion time implies a total assay time of 31 hr for 1000 spin cycles, an
ineffective strategy for timely completion of an assay. Note, however, that if the assay
detection limit goal can be attained by 50% sampling, only 231 cycles are required; further, if
the assay surface area is increased to 6 cm2 and the channel height decreased to 25 m (readily
accessible with the CD format and using off-the-shelf PSA films), assay time per spin cycle is
3.1 s and overall assay time for 50% sampling is just 14 min. Thus, an informed design of
device geometry and assay process can produce a useful assay result some 130 times more
quickly than the uninformed approach.
4.5 Design rules
To design new devices based on this technique, we suggest following these rules:
1. Define total sample volume and microfluidic channel volume. Design and fabricate outlet
and inlet chambers as well as microfluidic channel accordingly.
2. Obtain the surface tension and contact angle of solutions with surface.
3. Get the dimensions of microfluidic channel and the radius of the end of the microfluidic
channel.
4. Obtain the capillary pressure using Equation 4.1.
5. Calculate the minimum filling time of channel if needed using Equation 4.7.
6. Minimum and maximum angular speeds can be calculated from Equation 4.13 & 4.14.
7. If need be, approximate flow velocity can be calculated based on the angular acceleration.
8. Use Equation 4.15 to estimate the minimum number of cycles that device has to be spun to
statistically sample the full volume
4.6 Applications
We fabricated two distinct devices to demonstrate the functionality and versatility of this
novel concept. In one experiment, the device was spun 1000 times at 700 rpm for 5 sec each
time, with a 5-sec pause between successive spin cycles to allow the channel to refill by
capillary action. Figure 4.8 shows this device after 1000 recirculation cycles over 2.5 hr, at the
end of which the channel continues to spontaneously refill.

Liquid Recirculation in Microfluidic Channels by the Interplay of Capillary and Centrifugal Forces
71
Figure 4.8. Fabricated microfluidic channel, which contains 25 μL; the outlet chamber contains up to
100 L. Part a shows in detail the inlet, blind outlet, and vent. After loading the solution into the inlet
chamber, several bubbles form (blue arrows). Part b shows the same device after 1000 recirculation
cycles over 2.5 hr. Notice that the liquid initially visible in the inlet hole has been fully transferred to the
blind outlet chamber; also note that there are no more bubbles in the channels. Scale bar: 5 mm.
Figure 4.9 shows that two liquids are mixed effectively using the same principle: 3 cycles
over a total of 30 sec resulted in complete mixing, as shown in the photograph.
Figure 4.9. Complete mixing of two liquids. Part a shows two microfluidic channels, the left one filled
with 3 μL of red dye and the right one with water. After recirculating by rotation and pausing for refill
three times (30 sec total elapsed time), the solution is completely mixed, as shown in b. Scale bar: 5 mm.

Chapter 4
72
4.7 Conclusions
In summary, we have presented results from, as well as the fundamental physical
principals underlying, a new technique to recirculate large-volume samples in microfluidic
channels using a rotational platform. The interplay of capillary and centripetal forces makes it
possible to move liquid repetitively through the channel, bringing a freshly mixed sample
aliquot into the channel with each cycle. We provide a theoretical framework with which to
calculate the speeds of rotation needed to circulate the liquid, facilitating the design of new
devices that use this technique. We also presented results for, and compared with calculations,
the time to fill a microfluidic channel for varying surface properties.
4.8 References
1. S. K. Sia, V. Linder, B. A. Parviz, A. Siegel and G. M. Whitesides. An integrated approach
to a portable and low-cost immunoassay for resource-poor settings. Angewandte Chemie,
International Edition (2004) 43, 498-502
2. T. M. Squires, R. J. Messinger and S. R. Manalis. Making it stick: convection, reaction and
diffusion in surface-based biosensors. Nature Biotechnology (2008) 26, 417-426
3. S. Lai, S. N. Wang, J. Luo, L. J. Lee, S. T. Yang and M. J. Madou. Design of a compact
disk-like microfluidic platform for enzyme-linked immunosorbent assay. Analytical
Chemistry (2004) 76, 1832-1837
4. C. C. Liu, X. B. Qiu, S. Ongagna, D. F. Chen, Z. Y. Chen, W. R. Abrams, D. Malamud, P.
L. A. M. Corstjens and H. H. Bau. A timer-actuated immunoassay cassette for detecting
molecular markers in oral fluids. Lab on a Chip (2009) 9, 768-776
5. E. Delamarche, D. Juncker and H. Schmid. Microfluidics for processing surfaces and
miniaturizing biological assays. Advanced Materials (2005) 17, 2911-2933
6. O. Hofmann, G. Voirin, P. Niedermann and A. Manz. Three-dimensional microfluidic
confinement for efficient sample delivery to biosensor surfaces. Application to
immunoassays on planar optical waveguides. Analytical Chemistry (2002) 74, 5243-5250
7. S. Nagrath, L. V. Sequist, S. Maheswaran, D. W. Bell, D. Irimia, L. Ulkus, M. R. Smith, E.
L. Kwak, S. Digumarthy, A. Muzikansky, P. Ryan, U. J. Balis, R. G. Tompkins, D. A.
Haber and M. Toner. Isolation of rare circulating tumour cells in cancer patients by
microchip technology. Nature (2007) 450, 1235-U1210
8. G. F. Zheng, F. Patolsky, Y. Cui, W. U. Wang and C. M. Lieber. Multiplexed electrical
detection of cancer markers with nanowire sensor arrays. Nature Biotechnology (2005) 23,
1294-1301
9. H. Parsa, C. D. Chin, P. Mongkolwisetwara, B. W. Lee, J. J. Wang and S. K. Sia. Effect of
volume- and time-based constraints on capture of analytes in microfluidic heterogeneous
immunoassays. Lab on a Chip (2008) 8, 2062-2070
Liquid Recirculation in Microfluidic Channels by the Interplay of Capillary and Centrifugal Forces
73
10. C. Phillips, M. Jakusch, H. Steiner, B. Mizaikoff and A. G. Fedorov. Model-based optimal
design of polymer-coated chemical sensors. Analytical Chemistry (2003) 75, 1106-1115
11. J. Vanderhoeven, K. Pappaert, B. Dutta, P. Van Hummelen and G. Desmet. DNA
microarray enhancement using a continuously and discontinuously rotating microchamber.
Analytical Chemistry (2005) 77, 4474-4480
12. M. A. Bynum and G. B. Gordon. Hybridization enhancement using microfluidic planetary
centrifugal mixing. Analytical Chemistry (2004) 76, 7039-7044
13. M. Sigurdson, D. Z. Wang and C. D. Meinhart. Electrothermal stirring for heterogeneous
immunoassays. Lab on a Chip (2005) 5, 1366-1373
14. R. A. Vijayendran, K. M. Motsegood, D. J. Beebe and D. E. Leckband. Evaluation of a
three-dimensional micromixer in a surface-based biosensor. Langmuir (2003) 19, 1824-
1828
15. T. J. Johnson, D. Ross and L. E. Locascio. Rapid microfluidic mixing. Analytical
Chemistry (2002) 74, 45-51
16. A. D. Stroock, S. K. W. Dertinger, A. Ajdari, I. Mezic, H. A. Stone and G. M. Whitesides.
Chaotic mixer for microchannels. Science (2002) 295, 647-651
17. J. P. Golden, T. M. Floyd-Smith, D. R. Mott and F. S. Ligler. Target delivery in a
microfluidic immunosensor. Biosensors & Bioelectronics (2007) 22, 2763-2767
18. K. P. Nichols, J. R. Ferullo and A. J. Baeumner. Recirculating, passive micromixer with a
novel sawtooth structure. Lab on a Chip (2006) 6, 242-246
19. M. G. Lee, S. Choi and J. K. Park. Rapid laminating mixer using a contraction-expansion
array microchannel. Applied Physics Letters (2009) 95, 051902-051901
20. J. Cao, P. Cheng and F. J. Hong. A numerical study of an electrothermal vortex enhanced
micromixer. Microfluidics and Nanofluidics (2008) 5, 13-21
21. S. S. Wang, Z. J. Jiao, X. Y. Huang, C. Yang and N. T. Nguyen. Acoustically induced
bubbles in a microfluidic channel for mixing enhancement. Microfluidics and Nanofluidics
(2009) 6, 847-852
22. A. O. El Moctar, N. Aubry and J. Batton. Electro-hydrodynamic micro-fluidic mixer. Lab
on a Chip (2003) 3, 273-280
23. J. den Toonder, F. Bos, D. Broer, L. Filippini, M. Gillies, J. de Goede, T. Mol, M. Reijme,
W. Talen, H. Wilderbeek, V. Khatavkar and P. Anderson. Artificial cilia for active micro-
fluidic mixing. Lab on a Chip (2008) 8, 533-541
24. M. Grumann, A. Geipel, L. Riegger, R. Zengerle and J. Ducree. Batch-mode mixing on
centrifugal microfluidic platforms. Lab on a Chip (2005) 5, 560-565
25. N. S. Lynn, C. S. Henry and D. S. Dandy. Microfluidic mixing via transverse electrokinetic
effects in a planar microchannel. Microfluidics and Nanofluidics (2008) 5, 493-505

Chapter 4
74
26. Y. K. Cho, J. G. Lee, J. M. Park, B. S. Lee, Y. Lee and C. Ko. One-step pathogen specific
DNA extraction from whole blood on a centrifugal microfluidic device. Lab on a Chip
(2007) 7, 565-573
27. J. Ducree, T. Brenner, S. Haeberle, T. Glatzel and R. Zengerle. Multilamination of flows in
planar networks of rotating microchannels. Microfluidics and Nanofluidics (2006) 2, 78-84
28. J. Liu, B. A. Williams, R. M. Gwirtz, B. J. Wold and S. Quake. Enhanced signals and fast
nucleic acid hybridization by microfluidic chaotic mixing. Angewandte Chemie,
International Edition (2006) 45, 3618-3623
29. P. K. Yuen, G. S. Li, Y. J. Bao and U. R. Muller. Microfluidic devices for fluidic
circulation and mixing improve hybridization signal intensity on DNA arrays. Lab on a
Chip (2003) 3, 46-50
30. H. H. Lee, J. Smoot, Z. McMurray, D. A. Stahl and P. Yager. Recirculating flow
accelerates DNA microarray hybridization in a microfluidic device. Lab on a Chip (2006)
6, 1163-1170
31. H.-P. Chou, M. A. Unger and S. R. Quake. A Microfabricated Rotary Pump. Biomedical
Microdevices (2001) 3, 323-330
32. M. Abrantes, M. T. Magone, L. F. Boyd and P. Schuck. Adaptation of a surface plasmon
resonance biosensor with miorofluidics for use with small sample volumes and long
contact times. Analytical Chemistry (2001) 73, 2828-2835
33. K. Hosokawa, T. Fujii and I. Endo. Handling of picoliter liquid samples in a
poly(dimethylsiloxane)-based microfluidic device. Analytical Chemistry (1999) 71, 4781-
4785
34. K. Handique and M. A. Burns. Mathematical modeling of drop mixing in a slit-type
microchannel. Journal of Micromechanics and Microengineering (2001) 11, 548-554
35. J. L. Garcia-Cordero, L. Basabe-Desmonts, J. Ducree, L. P. Lee and A. J. Ricco. Liquid
recirculation in microfluidic channels by the interplay of capillary and centrifugal forces.
In: The 15th International Conference on Solid-State Sensors, Actuators, and
Microsystems, USA (2009), 1265-1268
36. C. Y. Li, X. L. Dong, J. H. Qin and B. C. Lin. Rapid nanoliter DNA hybridization based on
reciprocating flow on a compact disk microfluidic device. Analytica Chimica Acta (2009)
640, 93-99
37. T. Brenner, T. Glatzel, R. Zengerle and J. Ducree. Frequency-dependent transversal flow
control in centrifugal microfluidics. Lab on a Chip (2005) 5, 146-150
38. H. Bruus. Theoretical Microfluidics. 1st ed. Oxford University Press, (2008),
39. E. W. Washburn. The Dynamics of Capillary Flow. Physical Review (1921) 17, 273
40. H. Kusumaatmaja, C. M. Pooley, S. Girardo, D. Pisignano and J. M. Yeomans. Capillary
filling in patterned channels. Physical Review E (2008) 77, 067301

Liquid Recirculation in Microfluidic Channels by the Interplay of Capillary and Centrifugal Forces
75
41. B. V. Zhmud, F. Tiberg and K. Hallstensson. Dynamics of capillary rise. Journal of
Colloid and Interface Science (2000) 228, 263-269
42. M. Dreyer, A. Delgado and H. J. Rath. Capillary Rise of Liquid between Parallel Plates
under Microgravity. Journal of Colloid and Interface Science (1994) 163, 158-168
43. D. C. Duffy, H. L. Gillis, J. Lin, N. F. Sheppard and G. J. Kellogg. Microfabricated
centrifugal microfluidic systems: Characterization and multiple enzymatic assays.
Analytical Chemistry (1999) 71, 4669-4678
44. J. Ducree, S. Haeberle, S. Lutz, S. Pausch, F. von Stetten and R. Zengerle. The centrifugal
microfluidic bio-disk platform. Journal of Micromechanics and Microengineering (2007)
17, S103-S115

Chapter 4
76

77
5
Towards a Monolithic Centrifugal Microfluidic Platform for Bacteria
Capture and Concentration, Lysis, Nucleic-Acid Amplification, and
Real-Time Detection*
We developed a centrifugal microfluidic device to capture and concentrate bacteria (E. coli), similar in concept to the POC-SeCy device presented in
Chapter 3. We then added other important functions specific identification of small numbers of bacteria, including lysis and nucleic-acid amplification,
on the same microfluidic unit. This chapter presents the results of the integration of these functions into a monolithic platform.
*Parts of this chapter are published in: JL Garcia-Cordero, IK Dimov, J O’Grady, J Ducree, T Barry, AJ Ricco, Proceedings of the IEEE MEMS
2009, pp. 356-359

Chapter 5
78
5.1 Introduction
Rapid detection and precise identification of bacterial pathogens is critical in food and
water monitoring and in clinical diagnostics.1,2 Detection becomes more challenging because of
the low concentration of pathogens (10 – 100) in large-volume samples (mL).2 Traditional
techniques such as visual microscopy, plating, or culture enrichment can require times on the
order of days, require access to unique facilities (bio-hazard containment), and need skilled
technicians who may have to perform many repetitive steps. Even with such labor-intensive
methods, some microorganisms cannot be readily detected.3
Detection assays based on nucleic acid amplification methods have made possible the
precise identification of low numbers of pathogens in relatively short periods time (tens of
minutes to hours).3,4 However, compared to traditional methods, there are more process steps
involved to achieve sensitive detection of pathogens, such as lysis of the organism and, in some
cases, nucleic acid purification. Also, reagents (lysis buffer, primers, and enzymes) are needed
to conduct these reactions. Sample concentration may be required for the assay to be most
effective and to reduce reagent consumption. In addition, processing involves manual handling,
expensive instrumentation, and liquid transfer to multiple containers, which can worsen the
limits of detection or lead to false positives. Thus, there is a clear need for an automated
platform that integrates the many steps involved in nucleic-acid amplification-based assays.
Microfluidics and lab-on-a-chip (LOC) technologies are enabling the integration and
automation of sophisticated diagnostic tests, traditionally carried out in clinical laboratories, into
nearly-autonomous monolithic systems the size of a microscope slide or a credit card.2,5-14
These devices offer reductions in reagent and sample volumes, as well as shorter assay times.
Several microfluidic devices have been reported for the detection of bacteria5,7-11,14 and
viruses.6,12,13,15 Magnetic microbeads coated with specific antibodies against the target organism
are one popular technique to capture, isolate, and concentrate pathogens.5-14 However, this
technique adds cost to the assay because specific antibodies are needed for each target
organism. Dielectrophoresis is another technique used to capture and concentrate bacteria;
however, it has low throughput because low flow rates are needed to efficiently capture
bacteria,8,10 and operation of these devices requires the combination of electrophoretic and
thermopneumatic pumps,11 while other microdevices require syringe pumps and pneumatic lines
to move liquids through the device.5,6,8-10,12
Centrifugal microfluidics offers inherent advantages over these and other microfluidic
pumping and actuation mechanisms: it can pump liquids over a wide range of flow rates, mixing
can be easily accomplished by alternating the direction of rotation, and short-term valving can
be implemented by carefully controlling the rotation speed.15

Towards a Monolithic Centrifugal Microfluidic Platform for Bacteria Detection
79
Centrifugation is widely utilized in many laboratories to capture and isolate bacteria from
complex sample matrices.3 Because most bacteria have a higher density than the media in
which they are suspended, they can be sedimented and thus concentrated and captured. Our
device uses similar principles, combining the advantages of centrifugal microfluidics to control
fluid transport and meter liquids. Our monolithic system executes two basic operations:
bacteria capture and bacteria identification. First, bacteria are sedimented in a container and
concentrated. Second, bacteria identification is accomplished by (1) lysing them to release the
nucleic acids, (2) “amplifying” (replicating) target-specific nucleic acid sequences using nucleic
acid sequence-based amplification, NASBA, and (3) monitoring the amplification process, and
hence the amount of target nucleic acid present, in real time using fluorescence detection, as
detailed below. Most of these reaction steps would require manual pipetting, which is
eliminated by their integration onto the disc using a microfluidic channels to allow removal of
unneeded materials.
5.2 Nucleic acid sequence-based amplification (NASBA)
Nucleic acid diagnostics can identify bacteria by amplifying and detecting specific target
sequences of either ribonucleic acid (RNA) or deoxyribonucleic acid (DNA). In diagnostics,
nucleic acid amplification serves several purposes. It permits the precise and highly selective
identification of pathogens (even when they are of the same strain or species) via the design of
nucleic-acid probes against target sequences of DNA or RNA that are specific to the pathogen.
This permits quantitative determination of the number of organisms initially present in the
sample: nucleic acid amplification generates thousands to hundreds of millions of copies
(amplicons) of a given target nucleic acid sequence, which can then be detected by
electrophoresis or various blotting techniques.16
It is also possible to detect the amplification products as they are produced. So-called
“real-time” amplification methods incorporate a “reporter” in the amplification process that
produces a signal, often optical, in proportion the number of times a target NA sequence has
been replicated. For example, amplicons can be labeled with a fluorescent reporter molecule
(such as a “molecular beacon”) that contains a complementary sequence to the target nucleic
acid. The molecular beacons fluoresce upon hybridization of the amplicon and the reporter
molecule.3,16,17 Fluorescence can then be plotted against time to give a real-time amplification
curve. Over some part of the amplification process, usually shortly after the number of
amplicons are sufficient to be detectable, the slope of the curve typically reflects the initial copy
number of the particular NA target present in the sample.
DNA and RNA are found in different quantities and different locations within a
microorganism. A bacterium—a prokaryote—may contain just three copies of chromosomal
DNA, thus raising concerns about the limit of detection sensitivity, in particular when there are

Chapter 5
80
only a handful of bacteria in a sample. Also, some molecular probes for genomic DNA may
only be species specific,18 lacking the subspecies information that can be important in treating
infections. Ribosomal RNA, on the other hand, is the most conserved piece of genetic material
in bacteria and can be present in as many as 10,000 copies per bacterium thus making it a more
desirable and suitable target for amplification than DNA.18 Another advantage of using RNA
rather than DNA is that it allows differentiation between live and dead cells,17 a consequence of
the lower stability (shorter “life span”) of RNA. However, the very property that enables this
live/dead differentiation often makes RNA more difficult to amplify, and can result in poor
detection limits or false negatives. An exception to this rule is transfer-messenger RNA
(tmRNA), which is a more stable type of RNA molecule, almost as robust as DNA.19 tmRNA,
encoded by the ssrA gene (10Sa), is ubiquitous in all bacteria and has properties of both a
transfer RNA (tRNA) and messenger RNA (mRNA).20,21 There are between 500-1000 copies of
tm-RNA in one E. coli cell22 and as many as 2000 copies in some other bacteria.17 Thus,
tmRNA is an ideal candidate for amplification: it is present in high numbers, it is a robust
nucleic acid molecule, and probes for it can be designed to identify a pathogen by strain or
species.
Nucleic acids can be amplified using a variety of techniques including ligase chain
reaction (LCR), strand displacement amplification (SDA), Q-beta replicase (QBR), cycling
probe reaction (CPR), branched DNA (bDNA) amplification, nucleic acid sequence-based
amplification (NASBA), and the most popular, polymerase chain reaction (PCR), to name a
few.23,24 However, only NASBA can selectively amplify an RNA analyte in the presence of
similar DNA sequences.23 NASBA is specifically designed to amplify an RNA sequence,
including mRNA, rRNA, and tmRNA.19,23 It is also possible to use NASBA to amplify single-
stranded DNA targets and viral nucleic acids.23 Real-time NASBA employs three enzymes
(avian myeloblastosis virus reverse transcriptase, RNAse H, and T7 RNA polymerase) working
simultaneously with the forward and reverse primers and the molecular beacons to generate
amplicons and fluorescent signal simultaneously and in direct proportion.
Another significant advantage of NASBA is that it runs under isothermal conditions
(41 °C) as compared to the three temperatures steps (~95°C, 50-65°C, ~72-77°C) necessary for
a PCR cycle.25 This fact translates into several benefits for the design and fabrication of a
microfluidic device: more materials and bonding methods can be used as 41°C is below the
glass transition temperature for almost all thermoplastics; power consumption is reduced; the
electronic system that provides thermal control can be simplified. Thus, NASBA was employed
in this study for the specific detection of E. coli.

Towards a Monolithic Centrifugal Microfluidic Platform for Bacteria Detection
81
5.3 Device. Generation 1
5.3.1 Design and fabrication
The first centrifugal microfluidic device developed is shown in Figure 5.1. Its sole
purpose is to capture and retain cells, whether prokaryotic or eukaryotic. The device
consists of a funnel, three microchannels, a waste chamber, and outlet/inlet ports. The
microchannels are connected to the waste chamber through the waste channels. Valves are
formed by depositing wax in the microchannels through the access holes. Given the
dimensions of the vessel (3 mm x 5 mm x 1 mm) and the low diffusion rates for cells,
trapped cells will not exit the vessel in any reasonable time period once localized at the
bottom of the vessel.
The solution is loaded through the inlet and centrifuged for enough time to sediment
the cells to the bottom of the funnel. Next, the upper and middle wax valves are opened one
after the other, with the device spinning between the openings, and the supernatant solution
drained through both valves into the waste chamber.
Figure 5.1 (a) Schematic of the first centrifugal microfluidic device to capture bacteria. (b) Fabricated
device. Scale bar is 5 mm.
Compact discs were laser-cut from a 1.5 mm thick sheet of poly(methyl
methacrylate), PMMA, (Radionics, Ireland) using a CO2 laser ablation system (Optec
Micromaster, Belgium). The discs had inner and outer diameters of 15 mm and 120 mm,
respectively. Initial prototypes were fabricated using a CAT3D micromilling machine
(Datron, UK). The design was laid out in a CAD program (Excalibur 5.0, Progressive
Software Corporation, USA) and then converted into micromilling machine code using the
same software. All the features were milled in the PMMA discs with a 1mm solid carbide
end-mill tool (99010, Premier Machine Tools, Ireland) at 10,000 rpm.
Sheets of 250 μm thick PMMA, (Goodfellow, UK) were laminated onto a sheet of 80

Chapter 5
82
μm thick double-sided pressure sensitive adhesive, PSA, (Adhesives Research Ltd,
Limerick, Ireland). The sheets were then cut into the size of a CD using the laser ablation
system. The liner of the PSA was removed and laminated into the milled plastic CD. The
fabricated device is shown in Figure 5.2.
A DC motor was used to spin the disc. A tachometer suspended from a post was used
to measure the angular speed as shown in Figure 5.2.c.
Figure 5.2 (a) Schematic of a disc containing four centrifugal microfluidic devices to capture bacteria.
(b) Image of a milled disc consisting of three devices; the tool broke while milling the last device.
(c) The device was tested in a centrifugal platform consisting of a DC motor and a tachometer.
The valves were formed by manually loading a small amount of paraffin wax, with a
melting point of 53-57º C (327204, Sigma-Aldrich, Ireland) through the wax-access holes,
as shown in Figure 5.3. The device was then warmed on a hot plate at 70 ºC to melt the
wax, which then filled the entrance of the channels by capillary action.

Towards a Monolithic Centrifugal Microfluidic Platform for Bacteria Detection
83
Figure 5.3 Assembly of wax valves. (i) An access hole is created where a valve is needed. (ii) A piece
of solid wax is deposited through the access hole into the microfluidic channel. (iii) The bottom
substrates is heated using a thermo-foil. (iv) The wax melts and capillary forces draw the molten wax
into both sides of the channel. After a few seconds the wax re-solidifies and blocks the microchannel.
5.3.2 Results and discussion
Figure 5.4 shows the general steps for the operation of the centrifugal microfluidic
device. The device was tested with raw milk. Initially, a 250-μL milk sample was pipetted
into the device and the disc was loaded into the centrifugal platform (a). The disc was spun
for 5 min at 3000 rpm to sediment the cells (b). The device was stopped (c) and a
thermofoil flexible heater (Minco, USA) was attached to the bottom part of the disc (d). The
heater was connected to a power supply set at 12V. A single heater was sufficient to melt
the wax in both valves. The heater extended over the regions of the two upper valves but it
was positioned in such a way that the middle section of the heater coincided with the upper

Chapter 5
84
valve. The heater is hottest in the center whereas the edges are cooler, at least 20ºC below
the temperature in the middle (Application Aid #25, Minco, USA). We observed that 15
sec was enough to melt the wax in the upper channel. The disc was quickly spun again at
3000 rpm for 30 sec. The centrifugal pressure generated by the liquid displaced the melted
wax into the waste channel. Almost half of the supernatant is removed in this step (e).
The disc was stopped again and the leads of the heater reconnected to the power
supply. The heater was left to warm for 30 sec, after which the disc was spun at 3000 rpm
for 30 sec (f) to open the valve and drain the rest of the supernatant. Figure 5.4.g shows the
cells trapped in the bottom of the funnel. The final concentration volume in the trapping
vessel (tip of the funnel) was 15 μL, which is 6% of the initial total volume of 250 μL.
Figure 5.4 Operation of the centrifugal microfluidic device to capture cells.
Scale bar on Figure g is 1 mm.
Draining the supernatant solution in two steps, as performed in this device using the
two side valves, is believed not to disturb the pellet formed at the bottom of the vessel. If
the middle valve alone were used to drain the supernatant solution, we believe that, given
the very low resistance of the valve channel (1 mm wide x 1 mm long x 0.4 mm deep), the
flow generated by the centrifugal pressure might create eddies that could ultimately disturb
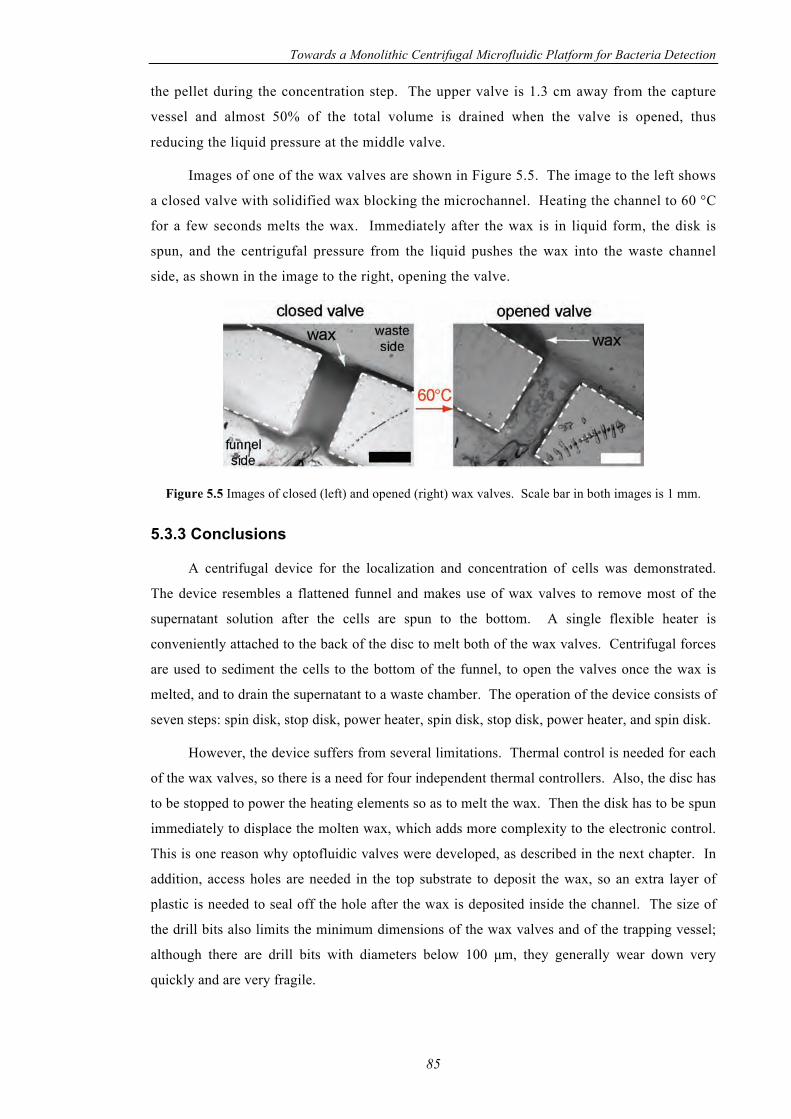
Towards a Monolithic Centrifugal Microfluidic Platform for Bacteria Detection
85
the pellet during the concentration step. The upper valve is 1.3 cm away from the capture
vessel and almost 50% of the total volume is drained when the valve is opened, thus
reducing the liquid pressure at the middle valve.
Images of one of the wax valves are shown in Figure 5.5. The image to the left shows
a closed valve with solidified wax blocking the microchannel. Heating the channel to 60 °C
for a few seconds melts the wax. Immediately after the wax is in liquid form, the disk is
spun, and the centrigufal pressure from the liquid pushes the wax into the waste channel
side, as shown in the image to the right, opening the valve.
Figure 5.5 Images of closed (left) and opened (right) wax valves. Scale bar in both images is 1 mm.
5.3.3 Conclusions
A centrifugal device for the localization and concentration of cells was demonstrated.
The device resembles a flattened funnel and makes use of wax valves to remove most of the
supernatant solution after the cells are spun to the bottom. A single flexible heater is
conveniently attached to the back of the disc to melt both of the wax valves. Centrifugal forces
are used to sediment the cells to the bottom of the funnel, to open the valves once the wax is
melted, and to drain the supernatant to a waste chamber. The operation of the device consists of
seven steps: spin disk, stop disk, power heater, spin disk, stop disk, power heater, and spin disk.
However, the device suffers from several limitations. Thermal control is needed for each
of the wax valves, so there is a need for four independent thermal controllers. Also, the disc has
to be stopped to power the heating elements so as to melt the wax. Then the disk has to be spun
immediately to displace the molten wax, which adds more complexity to the electronic control.
This is one reason why optofluidic valves were developed, as described in the next chapter. In
addition, access holes are needed in the top substrate to deposit the wax, so an extra layer of
plastic is needed to seal off the hole after the wax is deposited inside the channel. The size of
the drill bits also limits the minimum dimensions of the wax valves and of the trapping vessel;
although there are drill bits with diameters below 100 μm, they generally wear down very
quickly and are very fragile.

Chapter 5
86
Another concern with the device was the bottom valve. This valve was designed to
eventually communicate with another chamber where further analysis would be performed on
the captured cells. However, because of the close contact of the valve with the cells, by melting
the wax valve the cells would become trapped in the wax, which could have interfered with the
downstream analysis. For these reasons, a similar platform that relies on the same capture
mechanism but that is designed to integrate the different analysis steps in the capture vessel is
described in the next section.
In spite of these limitations, the device proved to be a good strategy to capture and
concentrate cells. The approximate volumetric concentration ratio is 17:1 starting from the
250 L volume in which the cells are initially contained and ending with the 15 L volume in
the funnel tip. The quantification of the cell capture efficiency was performed in the second
generation of this device.
5.4 Device. Generation 2
5.4.1 Design and fabrication
The design of the centrifugal microfluidic cartridge is shown in Figure 5.6. The device
consists of a main chamber in the form of a funnel that holds a sample of 200 μL (scalable to
hold larger volumes). The bottom of the funnel features a rectangular-shaped vessel where the
various reactions are carried out. The volume of this vessel is 5 μL, and as with the funnel, it
can also be scaled with corresponding scaling of reagent consumption.
A 5-cm-long microfluidic channel connects the waste chamber to the main funnel-shaped
chamber; its purpose is to remove reactants not needed and to define the vessel volume. The
entrance to the microfluidic channel is initially sealed with wax. The waste chamber holds 100
L more volume than the main chamber, which is needed for the subsequent steps where other
reagents are loaded into the cartridge. The waste chamber features a hole that functions as a
vent, equalizing it with atmospheric pressure. Alignment holes are included on each layer to
facilitate alignment.

Towards a Monolithic Centrifugal Microfluidic Platform for Bacteria Detection
87
Figure 5.6 Centrifugal cartridge for the detection and analysis of bacteria. The cartridge consists of a
flattened funnel that is initially loaded with sample through the inlet port. A wax valve separates the
microfluidic channel from the funnel. All reactions are carried out in the vessel. Once a reactant is no
longer needed, it is drained to the waste chamber via the microfluidic channel. Scale bar is 1 cm.
Devices were fabricated using multi-layer lamination as shown in Figure 5.7. A CO2
laser system (Laser Micromachining LightDeck, Optec, Belgium) was used to cut the polymer
layers. To laminate the layers, a thermal roller (Titan-110, GBC Films, USA) was used. The
funnel structure and waste chamber were cut from a 1.2-mm thick poly(methylmethacrylate)
sheet (GoodFellow, UK) previously laminated with an 80-μm thick layer of pressure-sensitive
adhesive, PSA (AR9808, Adhesives Research, Ireland). The microfluidic channel, cut from the
same PSA, had a width of approximately 400 μm, as measured with a microscope (MIC-D,
Olympus, USA).
All layers except the cover were carefully aligned and passed through the laminator. The
valve was formed by manually loading a small amount of solid wax at the intersection of the
microfluidic channel with the main chamber. The device was then warmed on a hot plate at 70
ºC to melt the wax, which then filled the entrance of the channel by capillary action. Finally,
the cover layer was laminated onto the device. The final assembled device was mounted on a
transparent compact disc (Åmic, Sweden) using the same PSA (AR9808).

Chapter 5
88
Figure 5.7 Five different plastic layers are used to build the centrifugal cartridge.
5.4.2 E. coli culture
E. coli strain XL-1 blue, genetically modified to express green fluorescent protein (GFP),
was used to facilitate the detection and quantification of bacteria captured in the device. E. coli
was cultured overnight at 37 °C in Luria broth containing NaCl, 10g/L (Sigma-Aldrich,
Ireland), Tryptone, 10g/L, and yeast extract, 5g/L (both from Lab M Ltd, UK). Optical density
of the solution was measured the next day using an optical spectrometer (UV-160A, Shimadzu,
UK) at a wavelength of 600 nm. Cell concentration per mL was calculated from a standard
curve based on plate counts. The solution was diluted by factors of 10 to achieve the desired
concentrations.
5.4.3 Real-time amplification
NASBA reagents were supplied in a kit (NucliSens Basic Kit, bioMerieux, UK) also
containing a reagent sphere and enzymes. Primers and molecular beacons were obtained from a
different supplier (Eurofins MWG Operon, Germany). The primers and molecular beacons
were designed for the specific detection of E. coli based on the RiboSEQ platform.19 The
reverse primer sequence was 5’-CTACATCCTCGGTACTACA-3’, the forward primer
sequence was 5’-AATTCTAATACGACTCACTATAGGGAGATAGTCGAAACGACGAA-3’,
and the molecular beacon probe sequence was 5’-FAM-CCAGCTAGCCTGAT-
TAAGTTTTAAGCTGG-BHQ1-3’.
The NASBA mix was prepared following the manufacturer’s instructions. Briefly, the
reagent sphere was mixed with 16 μL of molecular grade water, 80 μL of diluent, and 14 μL of

Towards a Monolithic Centrifugal Microfluidic Platform for Bacteria Detection
89
stock KCl (70 mM concentration). Next, 5 μL of the required primers (5 μM concentration)
and 5 μL molecular beacon probes (5 μM concentration, FAM fluorophore, BHQ1 quencher,
emission at 530 nm) were added. Off-chip NASBA experiments were carried out in a
LightCycler 480 Real-Time PCR Sytem (Roche Applied Science, USA). The NASBA reagent
sphere was mixed with the primers and molecular beacons and heated on a block heater at 65 °C
for 5 min to destabilize secondary structures in RNA26 and then maintained at 41 °C for 5 min to
allow primer and probe annealing. Next, 5 μL of NASBA enzyme solution were added to the
mixture to initiate amplification. Negative controls were prepared with RNase-free water mixed
with the NASBA reaction mixture and with no target nucleic acid.
On-chip real-time amplification of tmRNA targets from NASBA was monitored with an
inverted fluorescence microscope (Olympus IX81, UK). An incubation chamber (Solen
Scientific, UK) encasing the microscope provided a constant temperature of 41 °C. The device
was illuminated with 492-nm excitation (filter BP492/18 with a xenon light source, Olympus)
for 230 ms. The emission of fluorescent light at 530 nm was measured through a filter cube (U-
MF2, Olympus) adapted to a CCD camera (Hamamatsu C4742-80-12AG). Images were
automatically records each minute. A 4x objective was used throughout all the experiments.
5.4.4 Device operation
Figure 5.8 presents the sequence of steps performed on the microfluidic cartridge. A
brushless DC motor with an integrated optical encoder (Series 4490, Faulhaber, Switzerland)
was used to rotate the disc through the various steps. Sample is loaded in the main chamber and
spun for 10 min at 6000 rpm to sediment the bacteria to the bottom of the funnel, Figure 5.8.A.
Although higher speeds could decrease the sedimentation time, the adhesive layer does not
withstand pressures above this speed, and the funnel would eventually rupture from the bottom.
Sealing of the different layers with thermal lamination could prevent this problem.
The disc is stopped and the wax valve opened by heating it to 70˚ C using a thermofoil
flexible heater (Minco, USA), Figure 5.8.B. The disc is spun again at 700 rpm for 1 min to
discharge the supernatant solution through the microfluidic channel into the waste chamber.
The remaining 5 L of liquid in the vessel includes a “pellet” that contains most of the bacteria,
Figure 5.8.C. Platform capture efficiency was characterized by applying different
concentrations of E. coli and assaying the captured bacteria by fluorescence.
Next, 10 μL of mineral oil for molecular biology (M5904, Sigma-Aldrich, Ireland) is
introduced through the inlet port as shown in Figure 5.8.D. The disc is spun and the oil covers
the contents of the reaction vessel and also seals the microfluidic channel, preventing any
evaporation during the various reactions steps.
Next, 20 μL of chemical lysis solution (microLysis Plus, Microzone, UK) are introduced
through the inlet and, by spinning, the lysis reagent sinks and mixes with the bacteria pellet,

Chapter 5
90
Figure 5.8.E. This mixture is thermally cycled as per the manufacturer’s instructions (65 ˚C: 15
min, 96 ˚C: 2 min, 65 ˚C: 4 min, 96 ˚C: 1 min, 65 ˚C: 1 min, 96 ˚C: 30 sec) to lyse the bacteria,
releasing nucleic acids including the RNA target. Thermal cycling also continuously mixes
both solutions, Figure 5.8.F.
Figure 5.8 Steps involved in the detection of bacteria in the centrifugal microfluidic platform. See text
for details.
The disc is spun again, and some of the lysate goes into the waste compartment, but 5 L
of the lysate remain in the vessel. The lysate is covered by a fresh layer of oil, and 5 μL of

Towards a Monolithic Centrifugal Microfluidic Platform for Bacteria Detection
91
NASBA enzymes are introduced into the compartment by spinning and allowed to react with
the lysate for 5 min at 61 ˚C. Finally, 15 μL of NASBA mixture, including primers and
molecular beacons for the target bacterial tmRNA fragment, are loaded into the platform and the
solution incubated at 41 ˚C. Detection of amplified tmRNA target is in real-time via molecular
beacons whose fluorescence is unquenched when hybridized to complementary RNA
amplicons.19,27 Figure 5.10 shows the NASBA-based detection of E. coli on this platform.
5.4.5 Results and discussion
Concentrations of GFP E. coli ranging from 101 – 108 cfu/mL (cfu = colony-forming
units) were prepared. Then, 100 L of each concentration were loaded into a microwell plate.
The plate was read with a fluorescent plate reader (Infinite 200, Tecan, USA), revealing a linear
correlation of fluorescent intensity to bacteria concentration from 104 – 108 bacteria/mL. These
data enabled characterization of the bacteria capture efficiency of the funnel.
The density of E. coli is 1.088 g/cm3, while that of the sample buffer was ~1.022 g/cm3.
This difference allows the sedimentation and concentration of bacteria. Microfluidic units were
loaded with different concentrations, valves opened, and supernatant discarded into the waste
chamber. 100 L of supernatant were extracted from the waste chamber with a pipette, loaded
into the microwell plate, and read with the fluorescent scanner.
To calculate the capture percentage efficiency of the devices, the supernatant
concentration was subtracted from the initial concentration and divided by 100. Typically, more
than 80% of the cells were captured in the compartment, as shown in Table 5.1. Experiments
were repeated in triplicate. Figure 5.9 shows bacteria captured on one of the funnel from a
solution containing 108 GFP E.coli/mL.
Table 5.1 Bacterial capture efficiency of the centrifugal microfluidic platform.

Chapter 5
92
Figure 5.9 GFP E. coli captured at the bottom of the funnel.
The unit was characterized using water spiked with a concentration of 105 E. coli/mL,
(i.e., 2 x 10⁴ bacteria contained in the funnel) performing all the steps described in the Device
operation section. Figure 5.10 shows the NASBA-based detection of E. coli on this platform.
Figure 5.10 NASBA real-time detection of a sample containing 105 bacteria per mL.
5.4.6 Conclusions
A novel centrifugal microfluidic cartridge was demonstrated that integrates bacteria
capture and concentration, lysis, and nucleic acid amplification operations. The microfluidic
device is manufactured with polymers, cut with a laser system, and assembled in a four-layer
stack using a lamination system. The cartridge resembles a flattened funnel and holds 200 μL
of sample, but can be easily scalable to hold larger volumes. A single wax valve incorporated in
the device is used to remove the supernatant solution after bacteria are captured and
concentrated. Because the wax is located on the side of the funnel, it is not affected by the large
pressures generated during high-speed centrifugation. The wax is melted at 70 °C using a
thermofoil heater and most of the supernatant drained into a waste chamber through a
microfluidic channel; the concentration ratio is approximately 40:1 starting from the 200 L
sample volume. Our device was shown to retain more than 80% of E. coli from concentrations
of 106 – 108/mL.

Towards a Monolithic Centrifugal Microfluidic Platform for Bacteria Detection
93
Lysis of bacteria is accomplished using chemical reagents and is performed inside the
same container used to trap the bacteria. After the bacteria are lysed, NASBA reagents,
primers, and molecular probes are mixed with the lysate. This mixture is then mixed with
enzymes and heated to start the real-time nucleic acid amplification. A fluorescent microscope
monitors the increase of fluorescent signal over time.
In summary, we integrated sample preparation and concentration, lysis of pathogens, and
nucleic acid sequence-based amplification into a monolithic polymer platform that is
inexpensive to manufacture.
5.5 References
1. S. Bhattacharya, J. S. Jang, L. J. Yang, D. Akin and R. Bashir. Biomems and
nanotechnology-based approaches for rapid detection of biological entities. Journal of
Rapid Methods and Automation in Microbiology (2007) 15, 1-32
2. A. K. Balasubramanian, K. A. Soni, A. Beskok and S. D. Pillai. A microfluidic device for
continuous capture and concentration of microorganisms from potable water. Lab on a
Chip (2007) 7, 1315-1321
3. L. A. Jaykus. Challenges to developing real-time methods to detect pathogens in foods.
Asm News (2003) 69, 341-347
4. Y. Zhao, S. Park, B. N. Kreiswirth, C. C. Ginocchio, R. Veyret, A. Laayoun, A. Troesch
and D. S. Perlin. Rapid Real-Time Nucleic Acid Sequence-Based Amplification-Molecular
Beacon Platform To Detect Fungal and Bacterial Bloodstream Infections. Journal of
Clinical Microbiology (2009) 47, 2067-2078
5. Z. Y. Chen, M. G. Mauk, J. Wang, W. R. Abrams, P. L. A. M. Corstjens, R. S. Niedbala,
D. Malamud and H. H. Bau. A microfluidic system for saliva-based detection of infectious
diseases. Oral-Based Diagnostics (2007) 1098, 429-436
6. C. J. Easley, J. M. Karlinsey, J. M. Bienvenue, L. A. Legendre, M. G. Roper, S. H.
Feldman, M. A. Hughes, E. L. Hewlett, T. J. Merkel, J. P. Ferrance and J. P. Landers. A
fully integrated microfluidic genetic analysis system with sample-in-answer-out capability.
Proceedings of the National Academy of Sciences of the United States of America (2006)
103, 19272-19277
7. C. G. Koh, W. Tan, M. Q. Zhao, A. J. Ricco and Z. H. Fan. Integrating polymerase chain
reaction, valving, and electrophoresis in a plastic device for bacterial detection. Analytical
Chemistry (2003) 75, 4591-4598
8. E. T. Lagally, S. H. Lee and H. T. Soh. Integrated microsystem for dielectrophoretic cell
concentration and genetic detection. Lab on a Chip (2005) 5, 1053-1058
9. E. T. Lagally, J. R. Scherer, R. G. Blazej, N. M. Toriello, B. A. Diep, M. Ramchandani, G.
F. Sensabaugh, L. W. Riley and R. A. Mathies. Integrated portable genetic analysis

Chapter 5
94
microsystem for pathogen/infectious disease detection. Analytical Chemistry (2004) 76,
3162-3170
10. B. H. Lapizco-Encinas, B. A. Simmons, E. B. Cummings and Y. Fintschenko. Insulator-
based dielectrophoresis for the selective concentration and separation of live bacteria in
water. Electrophoresis (2004) 25, 1695-1704
11. R. H. Liu, J. N. Yang, R. Lenigk, J. Bonanno and P. Grodzinski. Self-contained, fully
integrated biochip for sample preparation, polymerase chain reaction amplification, and
DNA microarray detection. Analytical Chemistry (2004) 76, 1824-1831
12. R. Pal, M. Yang, R. Lin, B. N. Johnson, N. Srivastava, S. Z. Razzacki, K. J. Chomistek, D.
C. Heldsinger, R. M. Haque, V. M. Ugaz, P. K. Thwar, Z. Chen, K. Alfano, M. B. Yim, M.
Krishnan, A. O. Fuller, R. G. Larson, D. T. Burke and M. A. Burns. An integrated
microfluidic device for influenza and other genetic analyses. Lab on a Chip (2005) 5, 1024-
1032
13. J. Pipper, M. Inoue, L. F. P. Ng, P. Neuzil, Y. Zhang and L. Novak. Catching bird flu in a
droplet. Nature Medicine (2007) 13, 1259-1263
14. L. C. Waters, S. C. Jacobson, N. Kroutchinina, J. Khandurina, R. S. Foote and J. M.
Ramsey. Microchip device for cell lysis, multiplex PCR amplification, and electrophoretic
sizing. Analytical Chemistry (1998) 70, 158-162
15. J. Ducree, S. Haeberle, S. Lutz, S. Pausch, F. von Stetten and R. Zengerle. The centrifugal
microfluidic bio-disk platform. Journal of Micromechanics and Microengineering (2007)
17, S103-S115
16. G. Leone, H. van Schijndel, B. van Gemen, F. R. Kramer and C. D. Schoen. Molecular
beacon probes combined with amplification by NASBA enable homogeneous, real-time
detection of RNA. Nucleic Acids Research (1998) 26, 2150-2155
17. B. Glynn, S. Lahiff, M. Wernecke, T. Barry, T. J. Smith and M. Maher. Current and
emerging molecular diagnostic technologies applicable to bacterial food safety.
International Journal of Dairy Technology (2006) 59, 126-139
18. F. C. Tenover. Constructing DNA Probes for Infectious Diseases. In: DNA probes for
infectious diseases. Ed. F. C. Tenover. CRC Press, USA (1989), 286
19. I. K. Dimov, J. L. Garcia-Cordero, J. O'Grady, C. R. Poulsen, C. Viguier, L. Kent, P. Daly,
B. Lincoln, M. Maher, R. O'Kennedy, T. J. Smith, A. J. Ricco and L. P. Lee. Integrated
microfluidic tmRNA purification and real-time NASBA device for molecular diagnostics.
Lab on a Chip (2008) 8, 2071-2078
20. S. J. Hong, F. H. Lessner, E. M. Mahen and K. C. Keiler. Proteomic identification of
tmRNA substrates. Proceedings of the National Academy of Sciences of the United States
of America (2007) 104, 17128-17133
21. K. C. Keiler, L. Shapiro and K. P. Williams. tmRNAs that encode proteolysis-inducing tags
are found in all known bacterial genomes: A two-piece tmRNA functions in Caulobacter.

Towards a Monolithic Centrifugal Microfluidic Platform for Bacteria Detection
95
Proceedings of the National Academy of Sciences of the United States of America (2000)
97, 7778-7783
22. B. Glynn, K. Lacey, J. Reilly, T. Barry, T. J. Smith and M. Maher. Quantification of
Bacterial tmRNA using in vitro Transcribed RNA Standards and Two-Step qRT-PCR.
Research Journal of Biological Sciences (2007) 2, 564-570
23. R. Sooknanan and L. T. Malek. Nasba - a Detection and Amplification System Uniquely
Suited for Rna. Bio-Technology (1995) 13, 563-564
24. E. A. Mothershed and A. M. Whitney. Nucleic acid-based methods for the detection of
bacterial pathogens: Present and future considerations for the clinical laboratory. Clinica
Chimica Acta (2006) 363, 206-220
25. M. U. Kopp, A. J. de Mello and A. Manz. Chemical amplification: Continuous-flow PCR
on a chip. Science (1998) 280, 1046-1048
26. S. Hibbitts, A. Rahman, R. John, D. Westmoreland and J. D. Fox. Development and
evaluation of NucliSen (R) Basic Kit NASBA for diagnosis of parainfluenza virus infection
with 'end-point' and 'real-time' detection. Journal of Virological Methods (2003) 108, 145-
155
27. J. O' Grady, S. Sedano-Balbas, M. Maher, T. Smith and T. Barry. Rapid real-time PCR
detection of Listeria monocytogenes in enriched food samples based on the ssr A gene, a
novel diagnostic target. Food Microbiology (2008) 25, 75-84

Chapter 5
96

97
6
Optically Addressable Single-use Microfluidic
Valves by Laser Printer Lithography*
The laser-printer-based fabrication of pressure-resistant microfluidic single-use valves and their implementation on pressure-driven and centrifugal microfluidic platforms is discussed in this Chapter. A laser printer is used to selectively deposit toner on a plastic substrate in the form of circular dots. After assembly into a microfluidic device, the valve is opened (melted) with a pulse of laser light. This is an easy approach to connect multiple fluidic levels. This simple technology is compatible with a range of polymer microfabrication technologies and should facilitate the development of fully integrated, (re)configurable, and automated lab-on-a-chip systems, particularly when reagents must be stored on chip for extended periods, e.g. for medical diagnostic devices, lab-on-a-chip synthetic systems, or hazardous bio/chemical analysis platforms. *Parts of this chapter have been submitted to the Lab on a Chip Journal

Chapter 6
98
6.1 Introduction
The microfluidic valve is a ubiquitous, core component of microfluidic systems1-10
and its
design, materials, and fabrication approach can greatly impact the cost-effective implementation
of microfluidic systems manufacture. The microvalve controls fluid communication between
fluidic elements such as microchannels, pumps, and reservoirs. Microvalves not only provide
critical functionality, but can, together with pumping mechanisms and detection approaches,
dictate fabrication methods and operational protocols. With the optofluidic valve reported here,
we seek to address limitations of two of the most popular microfluidic valves, the elastomer
diaphragm valve3,11,12 and the phase-change valve,2,13,14 which we briefly summarize.
In the elastomer diaphragm valve, a membrane, typically polydimethsiloxane (PDMS), is
sandwiched between a fluidic channel and a control channel, pressurization of which either
closes or opens the fluidic channel. These devices comprise at least three layers (e.g.,
PDMS/PDMS/glass); pressure to actuate the valves is typically controlled using mechanical
screws or solenoids,15,16 pins from a Braille display,17
hydraulic means,18
or, most popularly, air-
pressure sources, again often controlled by electrical solenoid valves.3,9,11,12 Two key limitations
of the PDMS diaphragm valve are (1) the need for often-bulky external components to actuate
the valves, and (2) the high permeability of PDMS to water vapor as well as most organic
solvents and compounds, making long-term (days to months) isolation of fluids, even aqueous
buffer solutions, impractical. Figure 6.1 shows two examples of elastomer diaphragm valves.
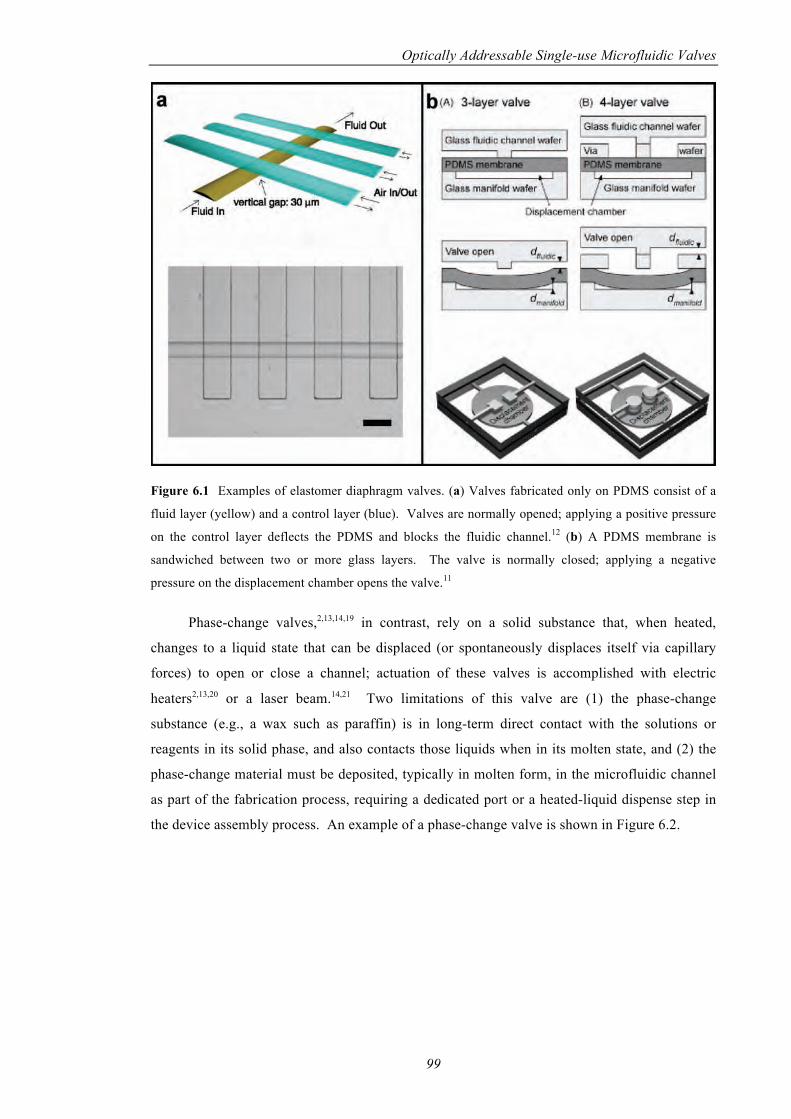
Optically Addressable Single-use Microfluidic Valves
99
Figure 6.1 Examples of elastomer diaphragm valves. (a) Valves fabricated only on PDMS consist of a
fluid layer (yellow) and a control layer (blue). Valves are normally opened; applying a positive pressure
on the control layer deflects the PDMS and blocks the fluidic channel.12
(b) A PDMS membrane is
sandwiched between two or more glass layers. The valve is normally closed; applying a negative
pressure on the displacement chamber opens the valve.11
Phase-change valves,2,13,14,19 in contrast, rely on a solid substance that, when heated,
changes to a liquid state that can be displaced (or spontaneously displaces itself via capillary
forces) to open or close a channel; actuation of these valves is accomplished with electric
heaters2,13,20 or a laser beam.14,21 Two limitations of this valve are (1) the phase-change
substance (e.g., a wax such as paraffin) is in long-term direct contact with the solutions or
reagents in its solid phase, and also contacts those liquids when in its molten state, and (2) the
phase-change material must be deposited, typically in molten form, in the microfluidic channel
as part of the fabrication process, requiring a dedicated port or a heated-liquid dispense step in
the device assembly process. An example of a phase-change valve is shown in Figure 6.2.

Chapter 6
100
Figure 6.2 Examples of a phase-change valve.13
The valve consists of three inlets; one is dedicated to
loading the wax and the other two are for the operation of the fluidic channel. Three electric heaters are
needed to actuate the valves. The schematic and pictures show the operation of the valve.
Both types of valve have been employed in several examples of microfluidic
systems,1-9,17,19,22,23 and a combination of these two valve concepts has also been recently
proposed.1,20 Other microvalves have been demonstrated including hydrogel valves,24,25 thermo-
pneumatically actuated valves,26
and electrophoretically permeable photopatterned gel valves.27
While droplet-based microfluidic architectures hold promise to drive complex assays without
valves,28
issues such as robustness to shock and vibration, evaporation, and compatibility with a
wide range of liquid conductivities are still being addressed. Additional valve types have been
proposed,29,30 but, as of yet, not implemented in microfluidic systems, perhaps owing to
complexities of fabrication and assembly.
In this chapter, we introduce a new approach to the single-use (“one-shot”) fluidic
microvalve, based on “laser printer lithography”: an office laser printer precisely patterns dots
of toner, on 100- m thick thermoplastic substrates, which ultimately serve as the control

Optically Addressable Single-use Microfluidic Valves
101
elements of one-shot valves. The valves are ‘opened’ with a single laser shot or pulse that is
efficiently absorbed by the toner and quickly melts the underlying plastic film; the approach is
compatible in terms of power, wavelength, and spot size with low-cost semiconductor diodes
found in commercial DVD read/write drives. This technology is compatible with polymers and
fabrication techniques such as hot embossing and multilayer plastic lamination. Compared to a
similar approach that melts holes in plastic films without the aid of absorption by laser toner,31
our approach requires lower laser powers (100-500 mW) and uses completely transparent foils,
enabling addressing of valves on multiple fluidic levels. Laser positioning is less demanding
since a general raster of the laser beam in the vicinity of the valve opens it without damaging
the surrounding, unpatterned plastic film.
6.2 Concept
The optofluidic valve concept relies on the interaction of a laser beam with a toner-
patterned polymer substrate as shown in Figure 6.3. Most transparent foils transmit light in the
visible and near-infrared regions of the spectrum: a laser beam passes almost unaffected through
the substrate except for front-surface reflection and minor scattering. However, patterning a
patch of an absorbing material on one side of the substrate alters the interaction of the beam
with the substrate: if formed of an appropriate material, e.g. a black material with high optical
density, the patch absorbs and converts the optical energy into thermal energy, which above
some energy threshold melts and perforates the substrate. The patterning patch is realized by
printing a dot with an office laser printer. Having a dot rather than the entire surface made from
an absorbing material reduces the required accuracy of aiming the laser, provided it is scanned
over an area that encompasses the valve dot.

Chapter 6
102
Figure 6.3 Working principle of the one-shot optofluidic valve. (i) A dot patterned on a plastic substrate
by a laser printer and a laser beam incident on that dot. (ii) The optical energy of the beam is converted
into thermal energy with multiple consequences: surface vaporization, surface melting, and heat
conduction through the plastic substrate. (iii) After 0.5 sec, the plastic recedes, leaving an orifice. The
distance d from the focal point was varied, as was the optical power level, to characterize the one-shot
valves.
6.3 Microfluidic Operation
This optofluidic valve principle was applied to the design and fabrication of microfluidic
devices that require single-use valves of the type shown in Figure 6.4. The device consists of a
single microfluidic “working layer” that includes and connects various fluidic components and
modules. Fluidic continuity is interrupted in the working layer in places where valves are
necessary; the working layer can include reservoirs with fluids stored for extended durations.
The bottom layer is the microfluidic “connector layer,” containing a connecting microchannel in
each location where segments of the working layer are to be (eventually) linked to one another.
A plastic foil with laser-printed dots is sandwiched between these two layers. The foil
underlying the dots can be perforated with a laser beam of appropriate power, connecting the
separated regions of the working layer and allowing fluid to flow freely through. The valve
must be designed in such a manner that bulk fluid is not in direct contact with the plastic in the
region of the toner spot, as it would conduct away heat, preventing melting of the polymer foil.
This is readily accomplished by the orientation of the fluidic device at time of valve opening
and/or by placing the valve in a recessed feature where a small air bubble is trapped.

Optically Addressable Single-use Microfluidic Valves
103
In another configuration of the optofluidic valve, the bottom microfluidic channel does
not act as a connector per se, functioning instead as an independent microchannel that leads to
other microfluidic elements or modules. In this case, only a single laser toner dot is required
and just one orifice is created. Both configurations can be implemented in one device.
Figure 6.4 Schematic of the microfluidic device operated with single-use valves. (i) A connecting
microchannel in the bottom layer has two foil-blocked links to two channels in the upper microfluidic
layer. Light from a laser beam melts orifices into the two valves (ii) opening them (iii). Liquid can flow
from either upper channel, down through the connecting channel, and then into the other upper channel.

Chapter 6
104
6.4 Materials and methods
6.4.1 Fabrication
Valves (toner dots) were designed in Illustrator (v10, Adobe, USA) and printed on
various plastic foils using an office laser printer (LaserJet 3030, HP, USA). Settings for the
laser printer were chosen as ‘Transparency’ and ‘Prosser 1200’ for paper and print quality
options, respectively. Several thermoplastic polymer foils were used as valve substrates: 125-
μm-thick poly(methyl methacrylate), PMMA (GoodFellow, UK), 100-μm-thick polycarbonate,
PC (Microfluidic ChipShop, Germany), 100-μm-thick cyclo olefin polymer, COP (Zeon
Chemicals LP, Japan), and 100-μm-thick polyethylene terephthalate, PET (transparency films,
CG3700, 3M, USA). These materials are some of the most-used thermoplastics in the
fabrication of microfluidic devices.
For the demonstration of optofluidic valve prototypes, polymer foil substrates were
manually cut to the size of the microfluidic module and attached to a sheet of paper using
double-sided tape. The paper with the foil was then passed through the laser printer. The
printer was allowed to cool for two minutes between printings.
Devices were fabricated using multilayer lamination. A CO2 laser system (Laser
Micromachining LightDeck, Optec, Belgium) was used to cut the various polymer layers.
Connecting and microfluidic channels were cut from an 80-μm-thick layer of pressure-sensitive
adhesive (PSA, AR9808, Adhesives Research, Ireland) and laminated onto a 250-μm PMMA
support layer (GoodFellow, UK) using a thermal roller laminator (Titan-110, GBC Films,
USA).
6.4.2 Characterization
Light transmittance of plastics was measured with a UV-visible spectrophotometer
(Cary 50, Varian, USA). Laser toner layer thickness was characterized with a scanning electron
microscope, SEM (Evo LS 15, Zeiss, Germany). Orifice size was measured with a non-inverted
microscope (Olympus).
6.4.3 Experimental set-up
A 671-nm, 500-mW DPSS laser system (LSR-671-00400-03, OEM Laser Systems Inc,
USA) was used to open the valves. DVD-RW players have similar power characteristics, see
e.g. datasheet for GH16P40A8C, = 660 nm, 400 mW pulsed operation, Sharp, Japan. The
laser system includes a diode driver with thermal control. An analog output module (NI 9264,
National Instruments, USA) connected to a NI-Compact-DAQ chassis (NI CDAQ-9172)
controlled the power output of the laser system. The laser system was warmed up for fifteen
minutes before performing the experiments in order to obtain a stable output power.

Optically Addressable Single-use Microfluidic Valves
105
The laser beam was focused onto microfluidic chips using an achromatic lens (F32-724,
Edmund Optics, UK) with an effective focal length of 60 mm. Optical power of the laser was
measured directly with a power meter (LaserCheck, Coherent, UK). A planar photodiode
(SLSD-71N7, Silonex, UK) was wired to a transimpedance amplifier circuit and the output
connected to an oscilloscope (TDS-2024B, Tektronix, USA) to quantify the time to open the
valves, as shown if Figure 6.5. The Wavestar program (Tektronix, USA) was used to transfer
the data from the oscilloscope to a PC. Gathered data were analyzed using Origin 8.1 (Origin
Lab, USA).
Figure 6.5. Schematic (a) and picture (b) of the experimental setup. Light from a 671-nm laser system is
focused into a plastic foil with a lens. The distance d was varied to investigate the effect on the size of the
orifice. Scattered light is measured using a planar photodiode connected to an oscilloscope through a
transimpedance operational amplifier.

Chapter 6
106
6.5 Results and discussions
6.5.1 Optical Spectra
Figure 6.6 shows spectral transmission, from 200 to 800 nm, of the various plastics used
in this study. Many plastics exhibit high transparency above 400 nm and throughout the visible
spectrum, including all of those we considered suitable for the laser valves, hence typical
CD/DVD-power-level visible laser diodes could not be used to operate these valves in the
absence of a light-absorbing spot. The effect of the number of black toner printed layers on the
plastic was also investigated. For only one toner layer, 7% of light still passes through the film;
for more than two printed toner layers, all the light is absorbed by the toner to the limit of
detection of the spectrophotometer. Thus, in all subsequent experiments, plastic foils printed
with two layers of black laser toner, which absorbs approximately 99% of the incident light,
were used.
Figure 6.6 Optical spectra of the different polymers employed to laser print dots. Single layer (gray) and
double layer (green) laser-printing patterning on PET substrates.
6.5.2 Printer toner composition and adhesion
The printed toner layer had a thickness of 16 μm for two layers. Typically, laser printer
toner is mainly composed of a copolymer (45-55 wt%) and iron oxide (45-55 wt%),32
as is the
case for the print cartridge used in our experiments (Q2612A-L, HP, USA). The polymeric base
of the toner is polystyrene (82%) and PMMA (18%) copolymer; it also includes amorphous
silica (1-3 wt%). Some printer toners contain carbon black rather than iron oxide.33
The
resolution of the printer and the size of the toner particles will affect the thickness of the layer as
well as its absorbance.32,34 Fused laser toner has been shown to be resistant to a variety of
chemicals32
and was utilized in the fabrication of polymeric microfluidic devices for
electrophoresis, amperometric detection, and electrospray ionization.32,35

Optically Addressable Single-use Microfluidic Valves
107
The laser printer drum reaches temperatures up to 185 °C during printing.36
Many
plastics at this temperature will melt or deform. Among the plastics we tested, only PET and
COP substrates withstood these temperatures without deformation and with good adherence of
the toner to the substrate. Although PC has a high glass transition point (150 °C), toner particles
did not adhere well to the substrate. PMMA substrates deformed when passed through the
printer.
6.5.3 Orifice size and response times
Response times and orifice sizes were characterized at three different powers: 100, 300,
and 500 mW; each power level was maintained continuously until the plastic melted sufficiently
to form a hole. The effect of varying the distance of the plastic foil from the focal point in 5
mm increments was also investigated. Figure 6.7 is a typical time-dependent response, showing
three successive events, from a photodiode measuring scattered light during the characterization
of one-shot laser valves on COP and PET substrates. Initially the laser is off and the signal
from the photodiode is 0V. Next, the laser is turned on and the beam strikes the plastic foil,
producing maximum light scattering and driving the signal almost to the voltage saturation, -
15V. Once the plastic is perforated, the signal returns to almost 0V because light scattering
decreases to a very low value: most of the laser beam passes through the orifice unaffected.
Figure 6.7 Light-scattering-measured response time of the addressable optofluidic one-shot valves.
Graph shows typical data from a photodiode (captured by an oscilloscope) for 100-μm-thick COP and
PET substrates. Initially, the signal is constant at 0 V; when the laser is activated, the photodiode
responds to scattered light and the signal increases almost to the saturation point. Once the valve has
opened, typically in 500 ms or less, the signal returns close to 0 V, corresponding to minimal light
scattering.
To obtain the response time of the valves, the time difference between laser beam turn-on
and the return of the signal to a constant, near-baseline value was measured. Response time for

Chapter 6
108
the laser valves is constant at 0.5 sec starting at a distance from the focal point of 5 mm for 300
and 500 mW laser powers for both plastic substrates, increasing to no more than 2.5 sec at 100
mW, as shown in Figure 6.8. Of the distances tested, the response time of the valves is longest
at the focal point (up to 10 sec for PET substrates). Thus, optimum operation of the valves
should start from a distance from the focal point of 5 mm and with powers greater than 300
mW.
Figure 6.8. Valve response times. Results for 100-μm thick (a) PET and (b) COP substrates. Distance
from the focal point, d, was varied from 0 to 15 mm. The opening time varied from 0.5 to 5.5 sec for
PET, whereas for COP the time ranged from 0.25 to 3.5 sec.

Optically Addressable Single-use Microfluidic Valves
109
For PET and COP, the orifice size increases as a function of the distance of the focal
point from the plastic foil and of the laser power, as shown in Figure 6.9. Orifice size for both
substrates ranged from 32 μm to 278 μm, although bigger orifices should be achievable by
further increasing the distance from the focal point. For both substrates, the orifice diameter is
smaller than the theoretical laser beam waist except at the focal point, where the orifice size is
almost the same as the focused beam, indicating that only part of the energy of the beam is used
in the thermal ablation process. Similar results using low-power CO2 lasers have been reported
for PMMA.37
The focused spot radius of the laser beam using a lens can be approximated using the
following equation:38
(6.1)
where f is the focal length of the lens, is the wavelength of the laser, r1 is the radius of the laser
beam before entering the lens, and r0 is the radius of the beam at the focal point, as shown in
Figure 6.9. The equation assumes a small far-field divergence angle (our laser system had a
divergence of 1 mrad). The beam radius, r(z), at any axial position can thus be found using the
following expression:
(6.2)
Figure 6.9 Effect of the lens on the propagation of a Gaussian beam.
The axial position was varied in steps of 5 mm from the focal point to a distance of 15
mm away from this point. Table 6.1 shows the results of substituting the values of the laser
beam used here into Equations 6.1 and 6.2 using r1 = 1 mm, = 651 nm, f = 60 mm. To obtain
a more accurate idea of the laser beam width, a ray-tracing program (TracePro, Lambda
Research, USA) was also employed to estimate the beam waist diameter at same set of distances
from the focal point (beam divergence: 1 mrad). The beam diameter was defined as where the
intensity has fallen to 1/e2 of the maximum value (thereby including 86% of the total beam
energy). The laser beam radii obtained using this software were employed in subsequent
calculations.

Chapter 6
110
Table 6.1 Laser beam radii at different distances from the focal point. Table
shows the comparison between values obtained using Equation 6.1 (for a
distance of 0 mm), 6.2 (for subsequent distances) and the ray-tracing program.
distance from focal
point (mm)
theoretical
value (μm)
Ray-tracing value
(μm)
0 12 32
5 84 76
10 167 162
15 250 243
Figure 6.9 Hole size characterization on PET and COP substrates. The distance from the focal point, d,
was varied from 0 to 15 mm. The laser valve orifice diameter varied from 30 μm to 225 μm for PET,
whereas for COP the diameter ranged from 35 μm to 280 μm. The ray-tracing program TracePro
(Lambda Research, USA) was employed to estimate the beam waist diameter at different distances from
the focal point (acromatic lens, f = 60 mm, original laser beam diameter: 2 mm, beam divergence: 1
mrad). The beam diameter was defined where the intensity falls to 1/e2 of the maximum value (including
86% of the total beam energy).

Optically Addressable Single-use Microfluidic Valves
111
6.5.4 Laser beam - plastic interactions
In contrast to UV laser micromachining, where the ablation of plastics occurs through a
photochemical process, we believe the removal of plastic to open our optofluidic valves occurs
through a photothermal ablation mechanism similar to CO2 laser micromachining and to laser-
welding of plastics.39
The laser beam is absorbed at the surface of the laser-printed spot and the
resultant thermal energy is conducted through the thickness of the material. The laser quickly
heats the material to its boiling point and material is vaporized and ejected. A solid-liquid
interface is initially created, which moves away from the surface during the heating phase. The
continuous laser irradiation causes a liquid-vapor interface to move through the material
accompanied by removal of material through evaporation above the liquid-vapor interface.39
Many thermoplastics have a decomposition temperature between 200 - 400 ºC.40 An
approximation of the surface temperatures generated with a Gaussian beam profile, Tlaser, as in
our laser system, can be calculated using the following expression:41
, (6.3)
where P is the laser power, r is the radius of the laser beam, K is the thermal conductivity, and
Tamb is the ambient temperature. This equation implies that the laser energy is instantaneously
converted to heat and entirely neglects any loss of heat, so it is only an upper bound, not an
accurate estimate. The laser beam radius in our experiments varied from 32 μm to 243 μm.
Table 6.2 shows the theoretical values obtained from Equation 6.3 for the different laser powers
used in our experiments. Thus, for PET, with K = 0.24 W/(m·K), the surface temperatures are
calculated from 367 ºC for the largest spot (243 μm) at 0.1 W to 13,213 ºC for the smallest spot
(32 μm) at 0.5 W. The latter temperature is highly unrealistic, as multiple thermal loss
mechanisms, including conduction, boiling, and/or vaporization of the polymer would limit
heating before the temperature exceeded a few hundred degrees. But even the lower
temperature is enough to melt PET (260 °C) and to initiate the decomposition (> 300 °C) of any
PET that doesn’t flow out of the beam. More realistic and detailed models38
describe the
different phase changes (melting, vaporization) that the foils undergo upon rapid heating and
include heat loss, but Equation 6.3 is useful to set the upper bound based on power input to the
material.

Chapter 6
112
Table 6.2 Calculated temperatures at the surface of the laser-printed obtained from Equation 6.3.
Calculated temperature* at different laser
powers (ºC) distance from focal point
(mm)
radius of
laser beam
(μm) 100mW 300mW 500mW
0 32 2659 7936 13213
5 76 1131 3353 5575
10 162 541 1584 2626
15 243 367 1062 1757
*thermal loss is not included in this calculation, hence temperatures are unrealistically high at the higher
laser powers.
The gas pressure of the evaporating polymer can eject melted material. Figure 6.10
shows an SEM image of a printed toner dot before and after laser opening of an orifice in the
plastic. In Figure 6.10(b), bulges are observed at the rim of the orifice; similar phenomena were
reported by others when cutting with CO2 lasers.37,42 These bulges are attributed to the ejection
of molten polymer—from high-pressure gas (due to vaporization) or surface-tension-driven
flow—that solidifies and accumulates on the rim when the material meets air.37,42,43
Figure 6.10 (a) SEM image of a laser-printed spot on a PET substrate. (b) After a laser pulse melts the
underlying plastic foil, creating an orifice that allows fluidic communication between two channels.
Bulge formation at the rim of the orifice can be observed. Scale bars: 100 μm.
6.6 Microfluidic device examples
6.6.1 Liquid microfluidic display
To demonstrate the optofluidic valve concept with powers similar to those used in DVD
drives, we fabricated two different microfluidic devices. The first is a liquid microfluidic
display, a matrix of 106 valves printed on a PET substrate that connects the microfluidic
channel layer with the microfluidic connecting layer. The design of the device is shown in
Figure 6.11; it is fabricated as described in Section 6.4.1.

Optically Addressable Single-use Microfluidic Valves
113
Figure 6.11 CAD design of microfluidic device shown in Figure 6.12. The device consisted of 5
different layers cut with a laser-cutting machine and assembled by multi-layer lamination. The bottom
substrate (i) consisted of a 500-μm thick layer of PMMA whereas the top substrate (v) consisted of a 1.2-
mm thick PMMA layer. A laser printer was used to pattern dots on a PET substrate (iii). Inlets and
outlets were manually cut in these layers. The microfluidic layer (ii) and the connecting microfluidic
layer (iv) were composed of stacks of three layers: 50-μm double-sided PSA, 125-μm thick PC, and 50-
μm double-sided PSA. Finally, the device was assembled by laminating these five layers together.
After the device was assembled, 56 of the valves were opened and a solution containing
multiple colors of dye flowed through the channels, forming the letters ‘bdi’ as shown in Figure
6.12. This type of device shows the potential for reconfigurable microfluidic devices, where
individual paths could be formed depending on the desired assay steps or on the outcome of the
previous valve configuration/reaction.
Figure 6.12 Liquid microfluidic display. The display consists of three devices, each with two inlets and
two outlets. After the device was assembled, 56 of the 106 optofluidic valves were opened to form the
letters ‘bdi’.

Chapter 6
114
6.6.2 Centrifugal microfluidic device
The second example device is a centrifugal microfluidic “lab-on-a-disc” cartridge with
two chambers connected by a microfluidic channel, see Figure 6.13. The solution is initially
loaded into the upper chamber. The disc was rotated at different speeds and no leakage was
observed through the valve even while spinning at 5000 rpm. The disc was then stopped and
light from the laser diode aimed at the laser-printed area, creating a communication port. The
disc was spun again and the solution was fully transferred to the bottom chamber.
Figure 6.13 A centrifugal microfluidic system consisting of two chambers connected by a channel. The
valve is in the location of the laser-printed black dot (A). After the valve is melted, the disc is spun for a
few seconds and all the liquid is transferred to the bottom chamber (B).
6.6.3 Long-term reagent storage
On-chip long-term reagent storage will be necessary for market success of many
microfluidic point-of-care devices. Although both wet and dry reagent storage in microfluidic
compartments has been reported,44-46 a key issue remains: delivering the reagents after an
extended storage time, in a well-controlled fashion. Linder and colleagues demonstrated storage
of reagents inside plastic tubing in liquid plugs separated by air gaps,46 but this and other
methods that do not provide a sealed physical barrier are ill-suited to storage beyond a few
hours due to migration of water in the vapor phase. Furthermore, this approach will not
necessarily work in more complex, integrated microfluidic systems; alternatives are needed.
A design for long-term reagent storage reservoirs for microfluidic devices, based on the
functionality of the laser valves, is demonstrated in Figure 6.14 A-C. A reservoir is defined in
the upper layer and can be designed to hold any fluid volume. The valve for this storage
reservoir is laser-printed at its peripheral end and at the intersection with a microfluidic channel
that connects it to the rest of the microfluidic system. The barrier properties of the foil to store
liquid reagents are exploited.
The operation of the device is shown in Figure 6.14 D-E. After assembly of the device,
reagents are loaded into the reservoir and encapsulated using PSA film. This film seals tightly

Optically Addressable Single-use Microfluidic Valves
115
the storage reservoir and prevents evaporation. Liquid from the container can be cleanly
released into the channel by centrifugal or capillary actuation.
Figure 6.14 (A) Illustration of on-board reagent storage using laser-printed valves. The polymer foil is
placed between the microfluidic connecting channel and the reservoir. Cross sectional (B) and frontal (C)
views are shown. Reagent is loaded in the reservoir (D) and covered by a pressure-sensitive adhesive
film (E).
Figure 6.15 illustrates the implementation of the long-term reagent storage principle in a
centrifugal microfluidic “lab-on-a-disc” cartridge. The cartridge consists of two reservoirs
connected to a mixing chamber through two independent microfluidic channels. In this system,
the two reservoirs are located near the center of the disc. Two solutions are loaded into the
reservoirs and sealed with PSA-coated film. The disc was rotated at a range of speeds and no
leakage was observed through the valve even at 5000 rpm (the distance of the valve from the
center of rotation is 3.2 cm, with an equivalent pressure of 100 kPa). The disc was then
stopped, the laser diode beam was aimed in turn at each of the two toner dots, thereby creating a
communicating port, and the disc was spun to move the two colored liquids into a mixing
chamber. Fluids can remain in isolated on-disc reservoirs for periods of (at least) 30 days
without noticeable fluid loss. That demonstration used a COP device and film, selected in part
for their low permeability to water vapor.

Chapter 6
116
Figure 6.15 A centrifugal microfluidic system consisting of two chambers connected by two channels to
a mixing chamber. (a) Two colored solutions are initially loaded in two compartments and sealed to
prevent evaporation. (b) After the laser valves are opened, the two solutions are forced into the mixing
chamber by spinning the disc.
6.7 Conclusions
In this chapter, the design, fabrication, and characterization of laser-printed, laser-
actuated, one-shot optofluidic valves were presented. Using an office laser printer, toner dots
that opto-thermally actuate the valves were deposited without damage to 100- m-thick PET and
COP foils. Response time of the valves on both substrates is on the order of half a second at
100 and 300 mW laser power; orifice sizes range from 50 to 300 μm at these powers. The
valves open at power densities easily attainable with semiconductor diodes found in DVD R/W
drives. Nevertheless, other visible semiconductor diodes such as those found in Bluray or CD
players could also be used to open the valves.
This new laser-printed valve technology will facilitate the design and fabrication of fully
integrated and automated lab-on-chip cartridges that require single-use valves, and in particular
can, when combined with low-permeability materials of construction like COPs, enable long-
term on-chip storage of aqueous buffers and reagents. The absence of mechanical components
in the valve and its actuation process facilitate both its manufacture and use.
This technology can be adapted to multilevel microfluidics, where multiple layers of
microfluidic channels are separated by multiple valving layers. As long as the laser-printed
spots do not overlap, the appropriate valve can be selected on demand in any given layer,
connecting channels on different layers at will.

Optically Addressable Single-use Microfluidic Valves
117
6.8 References
1. G. V. Kaigala, V. N. Hoang and C. J. Backhouse. Electrically controlled microvalves to
integrate microchip polymerase chain reaction and capillary electrophoresis. Lab on a Chip
(2008) 8, 1071-1078
2. R. Pal, M. Yang, R. Lin, B. N. Johnson, N. Srivastava, S. Z. Razzacki, K. J. Chomistek, D.
C. Heldsinger, R. M. Haque, V. M. Ugaz, P. K. Thwar, Z. Chen, K. Alfano, M. B. Yim, M.
Krishnan, A. O. Fuller, R. G. Larson, D. T. Burke and M. A. Burns. An integrated
microfluidic device for influenza and other genetic analyses. Lab on a Chip (2005) 5, 1024-
1032
3. T. Thorsen, S. J. Maerkl and S. R. Quake. Microfluidic large-scale integration. Science
(2002) 298, 580-584
4. J. Wang, Z. Y. Chen, P. L. A. M. Corstjens, M. G. Mauk and H. H. Bau. A disposable
microfluidic cassette for DNA amplification and detection. Lab on a Chip (2006) 6, 46-53
5. E. T. Lagally, J. R. Scherer, R. G. Blazej, N. M. Toriello, B. A. Diep, M. Ramchandani, G.
F. Sensabaugh, L. W. Riley and R. A. Mathies. Integrated portable genetic analysis
microsystem for pathogen/infectious disease detection. Analytical Chemistry (2004) 76,
3162-3170
6. P. Liu, T. S. Seo, N. Beyor, K. J. Shin, J. R. Scherer and R. A. Mathies. Integrated portable
polymerase chain reaction-capillary electrophoresis microsystem for rapid forensic short
tandem repeat typing. Analytical Chemistry (2007) 79, 1881-1889
7. R. H. Liu, J. N. Yang, R. Lenigk, J. Bonanno and P. Grodzinski. Self-contained, fully
integrated biochip for sample preparation, polymerase chain reaction amplification, and
DNA microarray detection. Analytical Chemistry (2004) 76, 1824-1831
8. C. J. Easley, J. M. Karlinsey, J. M. Bienvenue, L. A. Legendre, M. G. Roper, S. H.
Feldman, M. A. Hughes, E. L. Hewlett, T. J. Merkel, J. P. Ferrance and J. P. Landers. A
fully integrated microfluidic genetic analysis system with sample-in-answer-out capability.
Proceedings of the National Academy of Sciences of the United States of America (2006)
103, 19272-19277
9. N. M. Toriello, E. S. Douglas, N. Thaitrong, S. C. Hsiao, M. B. Francis, C. R. Bertozzi and
R. A. Mathies. Integrated microfluidic bioprocessor for single-cell gene expression
analysis. Proceedings of the National Academy of Sciences (2008) 105, 20173-20178
10. F. Benito-Lopez, R. Byrne, A. M. Raduta, N. E. Vrana, G. McGuinness and D. Diamond.
Ionogel-based light-actuated valves for controlling liquid flow in micro-fluidic manifolds.
Lab on a Chip (2010) 10, 195-201
11. W. H. Grover, A. M. Skelley, C. N. Liu, E. T. Lagally and R. A. Mathies. Monolithic
membrane valves and diaphragm pumps for practical large-scale integration into glass
microfluidic devices. Sensors and Actuators B-Chemical (2003) 89, 315-323

Chapter 6
118
12. M. A. Unger, H. P. Chou, T. Thorsen, A. Scherer and S. R. Quake. Monolithic
microfabricated valves and pumps by multilayer soft lithography. Science (2000) 288, 113-
116
13. R. Pal, M. Yang, B. N. Johnson, D. T. Burke and M. A. Burns. Phase change microvalve
for integrated devices. Analytical Chemistry (2004) 76, 3740-3748
14. J. M. Park, Y. K. Cho, B. S. Lee, J. G. Lee and C. Ko. Multifunctional microvalves control
by optical illumination on nanoheaters and its application in centrifugal microfluidic
devices. Lab on a Chip (2007) 7, 557-564
15. D. B. Weibel, A. C. Siegel, A. Lee, A. H. George and G. M. Whitesides. Pumping fluids in
microfluidic systems using the elastic deformation of poly(dimethylsiloxane). Lab on a
Chip (2007) 7, 1832-1836
16. S. E. Hulme, S. S. Shevkoplyas and G. M. Whitesides. Incorporation of prefabricated
screw, pneumatic, and solenoid valves into microfluidic devices. Lab on a Chip (2009) 9,
79-86
17. W. Gu, X. Y. Zhu, N. Futai, B. S. Cho and S. Takayama. Computerized microfluidic cell
culture using elastomeric channels and Braille displays. Proceedings of the National
Academy of Sciences of the United States of America (2004) 101, 15861-15866
18. J. Kim, D. Chen and H. H. Bau. An automated, pre-programmed, multiplexed, hydraulic
microvalve. Lab on a Chip (2009) 9, 3594-3598
19. Z. Y. Chen, M. G. Mauk, J. Wang, W. R. Abrams, P. L. A. M. Corstjens, R. S. Niedbala,
D. Malamud and H. H. Bau. A microfluidic system for saliva-based detection of infectious
diseases. Oral-Based Diagnostics (2007) 1098, 429-436
20. K. Pitchaimani, B. C. Sapp, A. Winter, A. Gispanski, T. Nishida and Z. H. Fan.
Manufacturable plastic microfluidic valves using thermal actuation. Lab on a Chip (2009)
9, 3082-3087
21. Z. Hua, R. Pal, O. Srivannavit, M. A. Burns and E. Gulari. A light writable microfluidic
"flash memory": Optically addressed actuator array with latched operation for microfluidic
applications. Lab on a Chip (2008) 8, 488-491
22. Y. K. Cho, J. G. Lee, J. M. Park, B. S. Lee, Y. Lee and C. Ko. One-step pathogen specific
DNA extraction from whole blood on a centrifugal microfluidic device. Lab on a Chip
(2007) 7, 565-573
23. Y. Marcy, C. Ouverney, E. M. Bik, T. Losekann, N. Ivanova, H. G. Martin, E. Szeto, D.
Platt, P. Hugenholtz, D. A. Relman and S. R. Quake. Dissecting biological "dark matter"
with single-cell genetic analysis of rare and uncultivated TM7 microbes from the human
mouth. Proceedings of the National Academy of Sciences of the United States of America
(2007) 104, 11889-11894
24. D. T. Eddington and D. J. Beebe. Flow control with hydrogels. Advanced Drug Delivery
Reviews (2004) 56, 199-210

Optically Addressable Single-use Microfluidic Valves
119
25. S. R. Sershen, G. A. Mensing, M. Ng, N. J. Halas, D. J. Beebe and J. L. West. Independent
optical control of microfluidic valves formed from optomechanically responsive
nanocomposite hydrogels. Advanced Materials (2005) 17, 1366
26. H. Takao, K. Miyamura, H. Ebi, M. Ashiki, K. Sawada and M. Ishida. A MEMS
microvalve with PDMS diaphragm and two-chamber configuration of thermo-pneumatic
actuator for integrated blood test system on silicon. Sensors and Actuators a-Physical
(2005) 119, 468-475
27. C. G. Koh, W. Tan, M. Q. Zhao, A. J. Ricco and Z. H. Fan. Integrating polymerase chain
reaction, valving, and electrophoresis in a plastic device for bacterial detection. Analytical
Chemistry (2003) 75, 4591-4598
28. J. Pipper, M. Inoue, L. F. P. Ng, P. Neuzil, Y. Zhang and L. Novak. Catching bird flu in a
droplet. Nature Medicine (2007) 13, 1259-1263
29. Z. Y. Chen, J. Wang, S. Z. Qian and H. H. Bau. Thermally-actuated, phase change flow
control for microfluidic systems. Lab on a Chip (2005) 5, 1277-1285
30. K. W. Oh and C. H. Ahn. A review of microvalves. Journal of Micromechanics and
Microengineering (2006) 16, R13-R39
31. B. Zucchelli and B. Van de Vyver. Devices and methods for programmable microscale
manipulation of fluid. US Patent, 7152616 (2006)
32. C. L. do Lago, H. D. T. da Silva, C. A. Neves, J. G. A. Brito-Neto and J. A. F. da Silva. A
dry process for production of microfluidic devices based on the lamination of laser-printed
polyester films. Analytical Chemistry (2003) 75, 3853-3858
33. Carbon Black User's Guide. http://carbon-black.org/index.html (accessed March 2010)
34. N. Bao, Q. Zhang, J. J. Xu and H. Y. Chen. Fabrication of poly(dimethylsiloxane)
microfluidic system based on masters directly printed with an office laser printer. Journal
of Chromatography A (2005) 1089, 270-275
35. W. K. T. Coltro, J. A. F. da Silva, H. D. T. da Silva, E. M. Richter, R. Furlan, L. Angnes,
C. L. do Lago, L. H. Mazo and E. Carrilho. Electrophoresis microchip fabricated by a
direct-printing process with end-channel amperometric detection. Electrophoresis (2004)
25, 3832-3839
36. M. Hobbs. Multifunction peripherals for PCs: technology, troubleshooting, and repair. 1st
ed. Newnes Press, USA (2000)
37. N. C. Nayak, Y. C. Lam, C. Y. Yue and A. T. Sinha. CO2-laser micromachining of
PMMA: the effect of polymer molecular weight. Journal of Micromechanics and
Microengineering (2008) 18, 095020
38. F. P. Gagliano and V. J. Zaleckas. Laser Processing Fundamentals. In: Lasers in Industry.
Ed. S. S. Charschan. Van Nostrand Reinhold Company, NY, USA (1972), 641
39. N. B. Dahotre and S. P. Harimkar. Laser fabrication and machining of materials. 1st ed.
Springer Science, NY, USA (2008)

Chapter 6
120
40. F. G. Bachmann and U. A. Russek. Laser welding of polymers using high power diode
lasers. Photon Processing in Microelectronics and Photonics (2002) 4637, 505-518
41. R. C. Crafer and P. J. Oakley. Laser processing in manufacturing. 1st ed. Chapman & Hall,
London, UK (1992)
42. C. K. Chung, Y. C. Lin and G. R. Huang. Bulge formation and improvement of the
polymer in CO2 laser micromachining. Journal of Micromechanics and Microengineering
(2005) 15, 1878-1884
43. H. Klank, J. P. Kutter and O. Geschke. CO2-laser micromachining and back-end
processing for rapid production of PMMA-based microfluidic systems. Lab on a Chip
(2002) 2, 242-246
44. E. Garcia, J. R. Kirkham, A. V. Hatch, K. R. Hawkins and P. Yager. Controlled
microfluidic reconstitution of functional protein from an anhydrous storage depot. Lab on a
Chip (2004) 4, 78-82
45. R. Seetharam, Y. Wada, S. Ramachandran, H. Hess and P. Satir. Long-term storage of
bionanodevices by freezing and lyophilization. Lab on a Chip (2006) 6, 1239-1242
46. V. Linder, S. K. Sia and G. M. Whitesides. Reagent-loaded cartridges for valveless and
automated fluid delivery in microfluidic devices. Analytical Chemistry (2005) 77, 64-71

121
7
Summary, Conclusions
and
Future Prospects

Summary, Conclusions, and Future Prospects
122
With many microfluidic technologies now maturing to the point where they could spur
interesting commercial applications, an open question is whether these technologies are
manufacturable in commercial volumes at economically viable costs; some authors claim that
manufacturing costs are a principle obstacle in the commercialization of microfluidic devices.1
In general, the more fabrication steps involved, the more expensive the manufacturing process.
External support equipment and reagents needed to operate fluidic devices also drive system
costs and, often more importantly, they can severely limit functionality and portability.2 In
nearly all demonstrations of microfluidic systems to date,2-9
microvalves—when they are
included—have dictated to lesser or greater extent the microfabrication and assembly steps and
have often impacted functionality, flexibility, complexity, and cost as well.
Thermoplastic-based fluidic devices can be manufactured in large volumes at low cost
through a diversity of well-established techniques, embossing and injection molding being the
two most important.10-13
There have been a number of demonstrations of microfluidic systems in
thermoplastics,10,11,14,15 but these examples are a rarity compared to microfluidic devices based
on PDMS and glass.2,4,6,9,16-18 Arguably, integrated microfluidic devices based on PDMS and
glass2-4,6,7,9 could be reconfigured as thermoplastic devices, but to date the examples of this are
few, and researchers continue to actively seek ways to substitute PDMS for thermoplastics.19-22
My belief is that integrated microfluidic systems should be designed from the outset with
consideration of volume manufacture and commercializability, and that this naturally leads to a
preference for thermoplastic components and structures.
An important recent trend is to operate microfluidic devices with the most inexpensive
supporting instrumentation feasible,2,23 and this in turn has led to the “borrowing” of
sophisticated but inexpensive consumer electronics technologies for lab-on-a-chip systems. For
example, cell phones have been employed successfully to read the results of an assay run in a
paper-based microfluidic device,24
and “smartphones” can power some types of lab-on-chip
systems, potentially analyzing and communicating the results as well.25
In the area of detection,
miniature fluorescence detection systems,26
lens-free holographic imaging systems,27
and
adaptation of optical pickup and disc-spinning technologies from compact-disc and digital-
video-disc hardware28,29 are examples of cleverly using affordable off-the-shelf consumer
electronics components. Such approaches to capable but inexpensive systems could expedite
the deployment of much-needed microfluidic-based diagnostic devices in developing nations.24
A number of different polymeric microfluidic technologies have been demonstrated in
this thesis, some or all of which could form the basis for point-of-care diagnostic devices.
In Chapter 2, I discussed the lab-on-a-chip philosophy, history, and the impact that this
technology is having in diverse fields. I also discussed the key components of a fully integrated
microfluidic system.

Summary, Conclusions, and Future Prospects
123
In Chapter 3, the “top-down” philosophy discussed in Chapter 1 was applied in the
development of a POC sedimentation cytometer (POC-SeCy) for milk quality monitoring with
good results. It was shown that our SeCy can measure cell counts in a range from 5x10⁴ - 5x10
6
cells and cream content from 3 - 7%. We investigated the best conditions, time and speed, to
effect cell separation and cream band formation. A POC reader system was built so that the
measurement of the cell counts and fat percentages were automated. The SeCy was initially
prototyped in thermoplastic using a micromilling machine and bonding through lamination. To
understand a path towards commercialization, the polymeric device was manufactured through a
third party using injection molding, showing the feasibility of our concept for mass-production.
The device was designed to be used by a farmer and does not need sample preparation or
any reagents. Raw milk is dispensed into one of the inlets of the SeCy. The disc then spins for
15 min in the reader system, after which two microscopes capture images of the pellet size and
the cream band. Software image analysis is employed to correlate the size of the areas to the
total cell count and fat percentage. Our POC-SeCy is one of the few demonstrations of a
microfluidic system that can be readily deployed as a point-of-care system, does not utilize any
reagents, and is easy to manufacture in large volumes at low cost.
I extended the same philosophy to the design of a microfluidic system for detecting
bacteria in large volumes of milk (1 mL). Although detection of bacteria is a more challenging
problem than that of counting cells because (a) they are present in much smaller quantities (~10-
100 cells per mL), (b) are much smaller (~1 μm), and (c) should ideally be identified to the
species and strain level, not just counted, we developed two key technologies that should help
solve this problem.
The microfluidic system demonstrated in Chapter 4 was designed to meet the challenge of
capturing bacteria in a surface patterned with antibodies. The device recirculates a sample by
the interplay of capillary and centrifugal forces. A motor is the only external piece of
equipment needed to put this technique into practice. Recirculation can enhance the rate of
surface-binding or solution-phase reaction kinetics and enables the capture of a larger fraction
of target analytes from a large-volume sample by allowing the sample to flow in multiple
aliquots over the same sensing surface several times. For a given assay time, (re)circulation can
thus enable (i) use of smaller sample volumes without loss of assay sensitivity or (ii) more
exhaustive sampling of larger sample volumes, improving limits of detection.
We developed a theoretical model of the forces operating in the liquid inside the
microchannel and demonstrated it experimentally. We also demonstrated that samples can be
recirculated at least 1000 times with no change other than slight evaporation. The recirculation
microfluidic device is manufactured at low cost using a stack of different layers consisting
mainly of thermoplastics and thin pressure-sensitive adhesives (PSAs). Plastics and PSA layers
are cut with a CO2 cutting laser system and then are assembled with a lamination system. We

Summary, Conclusions, and Future Prospects
124
believe that this technique has many other potential applications, for example, increasing the
sensitivity of surface-binding-based biosensors and in the detection of scarce analytes (e.g.
circulating tumour cells). By selecting the angular acceleration, final angular velocity, and
incubation time between successive “spin cycles”, this platform can adjust to the characteristic
binding, diffusion, and sedimentation times for any analyte and capture-surface combination. I
believe this new tool will increase analyte capture efficiency and consequently diminish assay
times and limits of detection of biosensors.
Pathogen detection using nucleic acid (NA) diagnostics requires the integration of
different microfluidic units to perform different reactions necessary for the extraction of the
nucleic acids from the cells. Any microfluidic device for the detection of pathogens in milk
(and actually for most applications in food, water safety, and environmental monitoring) would
be required to handle at least 1 mL of sample to find, capture, and concentrate ~10 - 100
bacteria. After the bacteria are captured, they must be lysed to release the nucleic acids. The
lysate then needs to be cleaned of any contaminants that could interfere with the subsequent step
of nucleic acid amplification. Reagents in various volumes have to be dispensed at
predetermined times to drive the lysis, RNA purification, and nucleic acid amplification steps.
Accurate thermal control is also necessary to drive all of these reactions and a reliable micro-
valving and pumping system is needed to actuate all of these operations. In addition, all steps
should be performed automatically with minimal supervision.
Our first attempt to solve this problem is the centrifugal microfluidic device proposed in
Chapter 5, where bacteria are captured and concentrated from an initial 200 μL volume into a 5
μL space. A wax valve is then opened to remove most of the supernatant but retain the bacteria
captured at the bottom of the container. We demonstrated that the device is able to capture up
to 80% of the bacteria. The bacteria trapped in the container are then chemically lysed and
overlaid with a layer of mineral oil to prevent evaporation. The RNA released after bursting
open the bacteria are amplified with nucleic acid sequence-based amplification (NASBA).
Several significant challenges remain for a truly integrated microfluidic system that could
automatically process one mL of sample and provide an answer of the type and quantity of
bacteria present in a sample. Although not ideal, our solution addresses the part of sample pre-
concentration that should facilitate the integration of other components as discussed below.
With this device, it was also demonstrated that mineral oil is an effective solution to the
problem of evaporation in reactions that occur at high temperatures or for long times. It was
also shown that mineral oil does not mix with any of the reagents used for lysing and NA
amplification.
Finally, Chapter 6 describes the development of a microfluidic single-use (“one-shot”)
laser valve. Only a typical office laser printer is needed to deposit black dots on a thin
polymeric foil. Light from a laser diode is focused onto the black dot which melts the foil and
Summary, Conclusions, and Future Prospects
125
creates a hole to allow fluidic communication between two microfluidic channels, reservoirs, or
other structures. The valve was characterized using different polymers and we investigated the
time to melt the polymer foils. It was also shown that this valve can be used for isolating and
later releasing stored liquid reagents, and can have other potential applications such as to route
liquids to different chambers or to meter liquids.
Throughout this thesis, I have shown the fabrication, characterization, and operation of
novel polymeric microfluidic technologies that could be the foundation for point-of-care and
integrated diagnostic devices.
I believe the centrifugal microfluidic device presented in Chapter 5 and the single-use
valves demonstrated in Chapter 6 can be the foundation of a microfluidic integrated pathogen
identification system (IPIDS), which will incorporate different microfluidic units into a
compact-disc (CD) platform as shown in Figure 7.1. Centrifugal forces will pump the liquids
between and through the different components and also separate and concentrate bacteria by
sedimentation. The IPIDS will consist of two regions, one to capture and concentrate bacteria
and the other for the identification of the pathogens. The first region consists of an array of
seven units similar in design to the one described in Chapter 5 that in total can contain up to 1
mL of liquid. The CD will then spin for a few minutes to separate and concentrate bacteria.
Opto-thermally activated valves, as shown in Chapter 6, located beside the capture zone will
then be opened to discard the supernatant solution. Next, the rest of the valves in the capture
region will be opened to move the captured bacteria to the detection region.
The IPIDS detection region contains a lysis chamber where bacteria are transported after
being captured. Lysis reagents are then released from the reagents storage reservoirs, mixed
with the bacteria, and the lysis reaction is initiated. A silica bead bed capture region lies
between the lysis and the amplification chamber. Its purpose is to retain the nucleic acids
released during the lysis step; the lysate is flushed through the silica bead bed and sent to a
waste chamber. The nucleic acids trapped on the surfaces of the beads are then washed with
other reagents to remove any contaminants that can interfere in subsequent steps. The nucleic
acids are then released with water into the amplification chamber. RNA is amplified using
NASBA.

Summary, Conclusions, and Future Prospects
126
Figure 7.1 Schematic of a fully integrated pathogen identification system (IPIDS). (a) One CD contains
two IPIDS. Each system is divided in two regions, one for the separation and capture of bacteria (b) and
the other for the detection of pathogens through nucleic acid amplification (c).

Summary, Conclusions, and Future Prospects
127
7.1 References
1. H. Becker. It's the economy. Lab on a Chip (2009) 9, 2759-2762
2. G. V. Kaigala, V. N. Hoang and C. J. Backhouse. Electrically controlled microvalves to
integrate microchip polymerase chain reaction and capillary electrophoresis. Lab on a Chip
(2008) 8, 1071-1078
3. R. Pal, M. Yang, R. Lin, B. N. Johnson, N. Srivastava, S. Z. Razzacki, K. J. Chomistek, D.
C. Heldsinger, R. M. Haque, V. M. Ugaz, P. K. Thwar, Z. Chen, K. Alfano, M. B. Yim, M.
Krishnan, A. O. Fuller, R. G. Larson, D. T. Burke and M. A. Burns. An integrated
microfluidic device for influenza and other genetic analyses. Lab on a Chip (2005) 5, 1024-
1032
4. T. Thorsen, S. J. Maerkl and S. R. Quake. Microfluidic large-scale integration. Science
(2002) 298, 580-584
5. J. Wang, Z. Y. Chen, P. L. A. M. Corstjens, M. G. Mauk and H. H. Bau. A disposable
microfluidic cassette for DNA amplification and detection. Lab on a Chip (2006) 6, 46-53
6. E. T. Lagally, J. R. Scherer, R. G. Blazej, N. M. Toriello, B. A. Diep, M. Ramchandani, G.
F. Sensabaugh, L. W. Riley and R. A. Mathies. Integrated portable genetic analysis
microsystem for pathogen/infectious disease detection. Analytical Chemistry (2004) 76,
3162-3170
7. P. Liu, T. S. Seo, N. Beyor, K. J. Shin, J. R. Scherer and R. A. Mathies. Integrated portable
polymerase chain reaction-capillary electrophoresis microsystem for rapid forensic short
tandem repeat typing. Analytical Chemistry (2007) 79, 1881-1889
8. R. H. Liu, J. N. Yang, R. Lenigk, J. Bonanno and P. Grodzinski. Self-contained, fully
integrated biochip for sample preparation, polymerase chain reaction amplification, and
DNA microarray detection. Analytical Chemistry (2004) 76, 1824-1831
9. C. J. Easley, J. M. Karlinsey, J. M. Bienvenue, L. A. Legendre, M. G. Roper, S. H.
Feldman, M. A. Hughes, E. L. Hewlett, T. J. Merkel, J. P. Ferrance and J. P. Landers. A
fully integrated microfluidic genetic analysis system with sample-in-answer-out capability.
Proceedings of the National Academy of Sciences of the United States of America (2006)
103, 19272-19277
10. T. Boone, Z. H. Fan, H. Hooper, A. Ricco, H. D. Tan and S. Williams. Plastic advances
microfluidic devices. Analytical Chemistry (2002) 74, 78A-86A
11. G. Binyamin, T. D. Boone, H. S. Lackritz, A. J. Ricco, A. P. Sassi and S. J. Williams.
Plastic Microfluidic Devices: Electrokinetic Manipulations, Life Science Applications, and
Production Technologies. In: Lab-on-a-Chip: Miniaturized Systems for (Bio)Chemical

Summary, Conclusions, and Future Prospects
128
Analysis and Synthesis. Ed. R. E. Oosterbroek and A. v. d. Berg. Elsevier, Amsterdam
(2003), 83-112
12. A. de Mello. Plastic fantastic? Lab on a Chip (2002) 2, 31N-36N
13. H. Becker and C. Gartner. Polymer microfabrication methods for microfluidic analytical
applications. Electrophoresis (2000) 21, 12-26
14. C. G. Koh, W. Tan, M. Q. Zhao, A. J. Ricco and Z. H. Fan. Integrating polymerase chain
reaction, valving, and electrophoresis in a plastic device for bacterial detection. Analytical
Chemistry (2003) 75, 4591-4598
15. R. C. Anderson, X. Su, G. J. Bogdan and J. Fenton. A miniature integrated device for
automated multistep genetic assays. Nucleic Acids Research (2000) 28, e60
16. N. M. Toriello, E. S. Douglas, N. Thaitrong, S. C. Hsiao, M. B. Francis, C. R. Bertozzi and
R. A. Mathies. Integrated microfluidic bioprocessor for single-cell gene expression
analysis. Proceedings of the National Academy of Sciences (2008) 105, 20173-20178
17. Y. Marcy, C. Ouverney, E. M. Bik, T. Losekann, N. Ivanova, H. G. Martin, E. Szeto, D.
Platt, P. Hugenholtz, D. A. Relman and S. R. Quake. Dissecting biological "dark matter"
with single-cell genetic analysis of rare and uncultivated TM7 microbes from the human
mouth. Proceedings of the National Academy of Sciences of the United States of America
(2007) 104, 11889-11894
18. W. Gu, X. Y. Zhu, N. Futai, B. S. Cho and S. Takayama. Computerized microfluidic cell
culture using elastomeric channels and Braille displays. Proceedings of the National
Academy of Sciences of the United States of America (2004) 101, 15861-15866
19. W. H. Grover, M. G. von Muhlen and S. R. Manalis. Teflon films for chemically-inert
microfluidic valves and pumps. Lab on a Chip (2008) 8, 913-918
20. K. Pitchaimani, B. C. Sapp, A. Winter, A. Gispanski, T. Nishida and Z. H. Fan.
Manufacturable plastic microfluidic valves using thermal actuation. Lab on a Chip (2009)
9, 3082-3087
21. P. A. Willis, B. D. Hunt, V. E. White, M. C. Lee, M. Ikeda, S. Bae, M. J. Pelletier and F. J.
Grunthaner. Monolithic Teflon (R) membrane valves and pumps for harsh chemical and
low-temperature use. Lab on a Chip (2007) 7, 1469-1474
22. P. A. Willis, F. Greer, M. C. Lee, J. A. Smith, V. E. White, F. J. Grunthaner, J. J. Sprague
and J. P. Rolland. Monolithic photolithographically patterned Fluorocur (TM) PFPE
membrane valves and pumps for in situ planetary exploration. Lab on a Chip (2008) 8,
1024-1026

Summary, Conclusions, and Future Prospects
129
23. B. Weigl, G. Domingo, P. LaBarre and J. Gerlach. Towards non- and minimally
instrumented, microfluidics-based diagnostic devices. Lab on a Chip (2008) 8, 1999-2014
24. A. W. Martinez, S. T. Phillips, E. Carrilho, S. W. Thomas, H. Sindi and G. M. Whitesides.
Simple telemedicine for developing regions: Camera phones and paper-based microfluidic
devices for real-time, off-site diagnosis. Analytical Chemistry (2008) 80, 3699-3707
25. J. M. Ruano-Lopez, M. Agirregabiria, G. Olabarria, D. Verdoy, D. D. Bang, M. Q. Bu, A.
Wolff, A. Voigt, J. A. Dziuban, R. Walczak and J. Berganzo. The SmartBioPhone (TM), a
point of care vision under development through two European projects: OPTOLABCARD
and LABONFOIL. Lab on a Chip (2009) 9, 1495-1499
26. L. Novak, P. Neuzil, J. Pipper, Y. Zhang and S. H. Lee. An integrated fluorescence
detection system for lab-on-a-chip applications. Lab on a Chip (2007) 7, 27-29
27. S. Seo, T. W. Su, D. K. Tseng, A. Erlinger and A. Ozcan. Lensfree holographic imaging for
on-chip cytometry and diagnostics. Lab on a Chip (2009) 9, 777-787
28. S. A. Lange, G. Roth, S. Wittemann, T. Lacoste, A. Vetter, J. Grassle, S. Kopta, M.
Kolleck, B. Breitinger, M. Wick, J. K. H. Horber, S. Dubel and A. Bernard. Measuring
biomolecular binding events with a compact disc player device. Angewandte Chemie-
International Edition (2006) 45, 270-273
29. A. G. J. Tibbe, B. G. de Grooth, J. Greve, C. Rao, G. J. Dolan and L. W. M. M. Terstappen.
Cell analysis system based on compact disk technology. Cytometry (2002) 47, 173-182

Summary, Conclusions, and Future Prospects
130

131
Appendix A

Appendix A
132
Most of the experiments presented in this thesis were performed in a centrifugal test
station. I assembled different centrifugal test stations throughout my research, starting from the
most basic, consisting of a DC motor, to a more sophisticated version, that includes a high-
sensitivity camera.
The first-generation centrifugal test station consists of a 12 VDC motor suspended on a
mechanical platform as shown in Figure A.1. The motor speed is controlled with a power
supply and can reach speeds of 6000 rpm. A tachometer is suspended from a post and it is used
to calibrate the speed of the disk against the input voltage of the motor. Assuming that the ideal
speed has been found for an application, this platform is inexpensive to set up ( 3 for the motor)
and light (100 g is the weight of the motor). The main problem with this setup, however, is to
set the angular speed. Small differences in the disk weight change the speed for the same
voltage and thus re-calibration of the voltage-speed curve is necessary for every disk.
Figure A.1 First centrifugal platform assembled. It consisted of a DC motor and a tachometer.
In the second generation, I removed the motor from a DVD player and replaced it with a
small brushless DC motor (1525BRC, Faulhaber, Switzerland). The shaft of the brushless
motor was 2 mm so it was possible to just snap the motor into the player without any
mechanical modifications to the motor or the DVD housing. The brushless motor comes with
integrated drive electronics which provides a frequency output signal to indicate the speed.
Speed control is also possible by adjusting an input voltage line. However, an electronic control
box (a digital-to-analog converter combined with a tachometer for accurate control) was still
required to accurately control the angular speed so the platform was abandoned in search of a

Appendix A
133
simpler solution. In addition, this platform only worked for disks with a maximum thickness of
1.5 mm. This platform is more expensive than the first platform, 95 for the motor plus the cost
of the electronic control box and the DVD player casing. However, the DVD casing provides
protection to the user in case the disk it is unbalanced or approaches speeds at which it could
disengage from the motor spindle. The loading port of the player can also be used to
automatically load and unload the disc.
Figure A.2 Second generation of the centrifugal platform. A DVD player was fitted with a brushless
motor.
Finally, I decided to purchase a 200 W brushless DC motor equipped with an optical
encoder (4490H-048B, Faulhaber, Switzerland). The motor speed, acceleration, and other
parameters can be adjusted from a computer through a motion controller card (MCBL5004,
Faulhaber) connected to the motor. The control software (WinMotion 2.02, Faulhaber) permits
the creation of motion routines where different speeds and acceleration settings can be
combined with cycles and timers.
The motor has high torque (~200 mN·m) and can reach speeds of up to 16,000 rpm. The
motion card requires a 48 V power supply with a minimum current of 6 A. Three 200 μH
inductors, connected between the motor and the motion card, are necessary to prevent current
spikes.
A high-performance cooled-detector digital camera (Sensicam qe, PCO AG, Germany) is
used to image the devices while they are rotating. The camera is triggered every revolution by
the motor. The camera is connected to a motorized 12X zoom lens (1-51314, Navitar, UK) to
image small features. The camera with the lens is mounted on a motorized linear stage
(8MT195-340, Standa, UK) to image different parts of the discs on its radial direction. The
linear stage has a travel range of 34 cm. The camera, motorized lens, and the linear stage are all
controlled from the computer.

Appendix A
134
Figure A.3 (a) Picture of the third-generation centrifugal test stand. The motorized stage moves the
camera in both directions. A plastic housing with sliding doors protects the user from any problems that
may occur while the disc is spinning. A 48 V power supply is connected to the motor. Lamps are used
to provide lighting around and on the disc. (b) A brushless DC motor is connected to the motion
controller card, which is controlled from a PC. 200 μH inductors are connected between the motion
controller and the motor to prevent current spikes. (c) The high-sensitivity camera is connected to a
motorized 12X zoom lens.

Appendix A
135
Although a more expensive test stand than its two predecessors (~ 25,000), it offers
several advantages: motion routines can be programmed and stored in the motion card memory,
which reduces the time to test new structures or designs; fluid motion can be imaged with the
CCD camera; different parts of the disc can be imaged while it is rotating; and the lens can be
adjusted from the computer to different magnification power so that small or large structures
can be observed.
The different centrifugal test stands have different uses. The most expensive test stand is
ideal for the research environment as different motion routines can be programmed into it and
the flow of liquids can be recorded while the disc spins. Due to its excessive cost, it is very
difficult to imagine that such a test stand would ever be used at any point-of-care setting.
Nevertheless, this test stand can be used to test proper functioning of a device before the motion
routine is transferred to a more economical platform. The other two test stands are more
economical and some version of these might be used at point-of-care settings.

136
List of Publications, Conference Proceedings, and Patents
Journals
[1] I.K. Dimov, J.L. Garcia-Cordero, J. O'Grady, C. Poulsen, C. Viguier, L. Kent, P. Daly,
B. Lincoln, M. Maher, R. O'Kennedy, T.J. Smith, A.J. Ricco, and L.P. Lee, Integrated
microfluidic tmRNA purification and real-time NASBA device for molecular diagnostics,
Lab Chip, 2008, 8, 2071 – 2078
[2] J.L. Garcia-Cordero, L. Basabe-Desmonts, J. Ducree, and A.J. Ricco, Liquid
recirculation in microfluidic channels by the interplay of capillary and centrifugal forces
(accepted for publication in Microfluidics and Nanofluidics)
[3] J.L. Garcia-Cordero, L.M. Barret, R. O'Kennedy, and A.J. Ricco, Microfluidic
sedimentation cytometer for milk quality and Bovine Mastitis monitoring (accepted for
publication in Biomedical Microdevices)
[4] J.L. Garcia-Cordero, D. Kurzbuch, F. Benito-Lopez, D. Diamond, L.P. Lee, and A.J.
Ricco, Optically addressable single-use microfluidic valves by laser-printer lithography
(accepted for publication in Lab on a Chip)
[5] I.K. Dimov, L. Basabe-Desmonts, J.L. Garcia-Cordero, A.J. Ricco, and L.P. Lee, Self-
powered integrated microfluidic blood analysis system (SIMBAS) (submitted to Lab on a
Chip)
Books
[6] J.L. Garcia-Cordero and A.J. Ricco, Lab-on-a-Chip (General Philosophy),
Encyclopedia of Microfluidics and Nanofluidics, Spriger-Verlag, 2008, pp. 962-969
Conference Proceedings
[7] J.L. Garcia-Cordero, L.M. Barrett, R. O’Kennedy, and A.J. Ricco, Point-of-care
microfluidic sedimentation cytometer for determination of somatic cell count and fat
percentage, The 5th IDF International Mastitis Conference 2010, (accepted as oral
presentation)
[8] C. Viguier, J.L. Garcia-Cordero, C. Barry, K. Welbeck, A.J. Ricco, and R. O’Kennedy,
Point-of-care centrifugal microfluidic device for the determination of proteins in bovine
milk, The 5th IDF International Mastitis Conference 2010, (accepted as oral presentation)

List of Publications, Conference Proceedings, and Patents
137
[9] E. Clancy, I.K. Dimov, J.L. Garcia-Cordero, J. O’Grady, T. Barry, M. Maher, and T.
Smith, Towards the development of integrated microfluidic “sample-in-answer-out”
devices for the detection of pathogens associated with mastitis, The 5th IDF International
Mastitis Conference 2010, (accepted as oral presentation)
[10] I.K. Dimov, L. Basabe-Desmonts, J.L. Garcia-Cordero, J. Ducree, A.J. Ricco, and L.P.
Lee. Self-powered Integrated Microfluidic Blood Analysis System (SIMBAS), The 13th
International Conference on Miniaturized Systems for Chemistry and Life Sciences
( TAS2009), pp. 384-386, Korea 2009
[11] M. Vazquez, F. Benito-Lopez, J.L. Garcia-Cordero, A.J. Ricco, and D. Diamond,
Analysis of Biopharma Raw Materials by Electrophoresis Microchips with Contactless
Conductivity Detection, The 13th International Conference on Miniaturized Systems for
Chemistry and Life Sciences ( TAS2009), pp. 537-539, Korea 2009
[12] J.L. Garcia-Cordero, L. Basabe-Desmonts, J. Ducree, and A.J. Ricco. Liquid
recirculation in microfluidic channels by the interplay of capillary and centrifugal forces.
Proceedings of the 15th International Conference on Solid-State Sensors, Actuators &
Microsystems, Transducers 2009, Denver, CO, USA, 2009, pp, 1265-1268
[13] J.L. Garcia-Cordero, I.K. Dimov, J. O'Grady, J. Ducree, T. Barry, and A.J. Ricco.
Monolithic Centrifugal Microfluidic Platform for Bacteria Capture and Concentration,
Lysis, Nucleic-Acid Amplification and Real Time Detection. Proceedings of the IEEE
MEMS 2009, pp.356-359, Sorrento, Italy, 2009
[14] J.L. Garcia-Cordero, F. Benito-Lopez, D. Diamond, J. Ducree, and A.J. Ricco. Low-cost
Microfluidic Single-Use Valves and On-Board Reagent Storage Using Laser-Printer
Technology. Proceedings of the IEEE MEMS 2009, pp. 439-442, Sorrento, Italy, 2009
[15] J.L. Garcia-Cordero, L. Kent, I.K. Dimov, C. Viguier, L.P. Lee, and A.J. Ricco.
Microfluidic CD-based Somatic Cell Counter for the Early Detection of Bovine Mastitis.
12th International Conference on Miniaturized Systems for Chemistry and Life Sciences
( TAS2008), pp. 1762-1764, San Diego, USA, 2008
[16] B. Lincoln, J.L. Garcia-Cordero, C.R. Poulsen, and L.P. Lee. A Microfluidic Platform
Optimizing Bead-based ELISA for the Detection of Cell Secretion. 12th International
Conference on Miniaturized Systems for Chemistry and Life Sciences ( TAS2008), pp.
1810-1812, San Diego, USA, 2008
[17] C.R. Roulsen, B. Lincoln, I.K. Dimov, JL Garcia-Cordero, S. O'Toole, M. Radomiski, J.
O'Leary, and L.P. Lee. Apoptotic Response of Ovarian Cancer Cells in Hypoxic
Conditions. 12th International Conference on Miniaturized Systems for Chemistry and
Life Sciences ( TAS2008), pp.1864-1866, San Diego, USA, 2008

List of Publications, Conference Proceedings, and Patents
138
Patents
[18] J.L. Garcia-Cordero, A.J. Ricco, F. Benito-Lopez, L.P. Lee, and J. Ducree. Microfluidic
single use valve and microfluidic systems incorporating said valve. British Patent
Application GB0901115.6
[19] J.L. Garcia-Cordero and A.J. Ricco, A milk analysis microfluidic apparatus for
detecting mastitis in a milk sample by isolating somatic cells suspended therein in the
form of pellets of cells using centrifugal sedimentation. British Patent Application No.
GB0801991.1
[20] I.K. Dimov, L. Basabe-Desmonts, J.L. Garcia-Cordero. Microfluidic device providing
degassing driven fluid flow, British Patent Application No. GB0919053.9

139
Acknowledgments
The work described in this thesis is the result of the teachings and help of several people I
had the pleasure to meet during my time at the Biomedical Diagnostics Institute. I will be
indebted all my life to Prof. Antonio J Ricco for his continuous support and patience throughout
my PhD. Tony has shown to be a great supervisor, always offering a word of advice,
inspiration, and encouragement even in the most uncreative and, at times, what seemed the most
unproductive times of my programme. I am thankful he gave me a lot of freedom to perform my
research but always keeping me on track on the meaningful aspects for my PhD and for the
projects. Tony has taught me a lot of things from planning and writing my papers to looking at
problems in different ways that never occurred to me. Brainstorming and discussing ideas with
him have been one of the most rewarding experiences. Tony told me the first time I talked to
him that this was going to be an interesting PhD with a mix of real-world applications, good
science, and interaction with the industry. Indeed, it turned out to be one of the most exciting,
challenging, and enjoyable projects I have ever worked in.
By pure luck I had the pleasure of working in the team of Prof. Luke Lee. Luke is one of
the most creative scientists I have run into. He transpires science and his dedication to it is
inspiring. I want to express my gratitude for the time he took with me to discuss my research
and papers and teaching me a little bit of his philosophy on life.
Prof. Brian MacCraith is one of the best leaders, managers, and scientists I have met, who
made possible the BDI, and therefore my stay and funding in the Institute. Brian always found
a solution for the different administrative problems I faced in DCU and I will be always grateful
for his time and effort he put on solving these problems. The BDI will not be the same without
his leadership.
The first year at the BDI were very challenging but the RP5 microfluidics platform group
including: Asif Riaz, Bryan Lincoln, Ivan Dimov, Claus Poulsen, and Lourdes Basabe-
Desmonts worked diligently to make the best of the situation. I would like to thank each of
them because their wealth of experiences and way of looking at things made my time a very
rewarding experience. I learned a lot from each you from even the simplest things to perform
an experiment to discuss about science, organization, papers, and internal politics. Each of
them became really good friends. I will really miss our dinners together, and the many
discussions with Ivan, Lourdes, and Fernando.
I will like to thank the technicians in the NCSR for showing me how to operate the
machinery and equipment I used for my projects. They were always very attentive when I
needed something and did not hesitate to leave whatever they were doing to give me a hand. I
want to thank Nigel Kent, Barry O’Connell, Lorcan Kent, Stephen Fuller, Brian O’Reilly, and
Henry Barry for their help. A lot of this thesis would not have been possible without the help

Acknowledgements
140
and advice of Pat Wogan (electronics) and Des Lavelle (workshop), the two technicians at the
School of Physics.
There are several people who took some of their time to answer some of my questions,
lend equipment or material to me, helped me prepared solutions, reviewed proposals, taught me
new things, or discussed projects with me: Prof. Hugh Fan, Niamh Gilmartin, Prof. David
Williams, Tony Killard, Robert Burger, Jens Ducree, Gregor Kijanka, Patrick Abgrall, Dirk
Kurzbuch, Robert Copperwhite, Vanessa Castro-Lopez, Leanne Harris, Vladimir Gubala, Paul
Daly, Prof. Richard O’Kennedy, Justin O’Grady, Katrina Lacey, Eoin Clancy, Leanna Levin,
Caroline Viguier, Louise Barrett, Colm McAtamney, Emma O’Neill, Fergus Fleming, Conor
Burke, Dave Smart, Mercedes Vazquez, John Moore, Stephen O’Driscoll, Aideen O’Neill. To
all of them my warmest appreciation.
I had the opportunity to take a couple of students in my last year of the programme; I
would like to thank Caroline Barry, Daniel O’Riordan, and Oshoke Ikpekha because I learned
more from them than I could have possibly taught them. Special thanks to Kevin Newman for
helping with the camera and motor control.
The BDI team (Tracy Dixon, Celine Heffernan, Paula Kirwan, Wendy Gurley, Angela
Lally, Keith O’Neill, Robbie Sinnott) made my life easy with all the administration and
purchasing. To all of them many thanks. And also to the BDI Education and Outreach team
(Aoife MacCormac, Emma O’Brien, Clare Scalzo) for letting me participate in some of their
events.
I am grateful to Jim Flynn and Brendan Kavanagh in Teagasc, MoorePark for providing
and analyzing milk samples in the MilkoScan system. I also thank Dr. Holger Becker of
Microfluidic ChipShop for helpful discussions in adapting the CD design to the injection
molding process.
I would also like to thank the guys who believed in the UNCSR and helped me initiate it:
Fernando Benito-Lopez, Robert Byrne, Robert Copperwhite, Emma Weir, James Chapman,
Yuliya Shakalisava, and Aoife White.
Many thanks to my examiners, Prof. Andrew de Mello and Prof. Tony Cafolla, for taking
the time to read this thesis.
Finally, I would like to thank my families back in Mexico and Canada for their love and
support even when we are so far apart. This thesis is dedicated to my parents for all their
teachings that have accompanied me all my life. Last but not least, I also dedicate this thesis to
Susanne for her love, dedication, and patience with me. Moving to different countries has not
been easy but she has made the best of it. Susanne has been the most wonderful wife, partner,
and friend.