development of exfoliated layered stanosilicate for
TRANSCRIPT
DEVELOPMENT OF EXFOLIATED LAYERED STANOSILICATE FOR HYDROGEN ADSORPTION
C. Rubio1, B. Murillo1, C. Casado2, A. Mayoral3, C. Téllez1, J. Coronas1, A. Berenguer-Murcia4, D. Cazorla-Amorós4
1Department of Chemical and Environmental Engineering and Nanoscience
Institute of Aragón (INA), Universidad de Zaragoza, 50018 Zaragoza. Spain
2Department of Chemical Engineering and Inorganic Chemistry, Universidad de
Cantabria, 39005 Santander, Spain
3Laboratorio de Microscopias Avanzadas (LMA), Nanoscience Institute of
Aragón (INA), Universidad de Zaragoza, 50018 Zaragoza. Spain
4 Alicante Materials Institute and Inorganic Chemistry Department, University
of Alicante, 03080 Alicante, Spain
brought to you by COREView metadata, citation and similar papers at core.ac.uk
provided by Repositorio Institucional de la Universidad de Alicante
Abstract
The use of hydrogen as an energy vector involves among other steps storage. This has
caused the development of new materials with high hydrogen adsorption capacity. In
this field, new layered stannosilicate, called UZAR-S3, has been synthesized and
delaminated becoming UZAR-S4. The new materials have been characterized by
several techniques: XRD, XRF, SEM, TEM, TGA, adsorption of N2, H2 and CO2, Hg
porosimetry, 29Si NMR MAS and 119Sn NMR MAS. UZAR-S3, with empirical formula
Na4SnSi5O14·5H2O and lamellar morphology, is a layered stannosilicate built from
SnO6 and SiO4 polyhedra. The delamination process used here comprises three stages:
protonation with acetic acid, swelling with nonylamine and the delamination itself with
an HCl/H2O/ethanol solution. UZAR-S4 is composed of sheets of a few nanometers of
thickness with a high aspect ratio and BET surface area of 236 m2/g twenty times higher
than for UZAR-S3. At -196 ºC, H2 adsorption is measured reaching remarkable values
of 3.7 and 4.2 wt% for 10 and 40 bar, respectively, the last value giving a high
volumetric H2 storage capacity of 26.2 g of H2 / L.
Keywords. Hydrogen storage, Layered stannosilicates, Delaminated materials
1. Introduction
In recent years, efforts have been devoted to synthesize new crystalline
microporous structures, different from classical zeolites, for their application in gas
storage, separation and purification fields. A large number of studies have been
concerned with microporous mixed Octahedral-Pentahedral-Tetrahedral (OPT)
framework silicates [1]. They have a crystal structure consisting of TO4 tetrahedral
units (T = Si, Ge) and polyhedra MOn (n = 5, 6), (M = Sn, Ti, Zr, V, Nb). Within
microporous OPT titanosilicates stand out ETS-10 [2], ETS-4 [3] and umbite-type
compounds [4], about which a large number of research papers have been developed.
Several OPT stannosilicates have been also reported: Sn-A, Sn-B, Sn-L [5], AV-6 [6],
AV-7 [7], AV-10 [8], Sn-AV-11 [9], Sn-AV-13 [10], Sn-AV-14 [11], Cs2SnSi3O9 [12]
and EMS-2 [13].
Porous layered silicates are now a developing research area because of the
advantages of layered materials as active catalysis [14], enhancing the permselectivity
of polymer–zeolite nanocomposite membranes [15] and producing polymer-layered
silicate nanocomposites with improved tensile properties [16]. A characteristic process
of some layered materials is their swelling and delamination which involves the
intercalation of guest molecules to increase the interlayer space and subsequent
exfoliation. These reactions are interesting in the case of few known layered zeolites:
EU-19 [17], PREFER [18], MCM-22P [19], Nu-6 (1) [20] obtaining delaminated
zeolites EU-20 [21], ITQ-2 [22], ITQ-6 [23], ITQ-18 [24] and Nu-6 (2) [25]. Also,
layered titanosilicates have been delaminated, such as JDF-L1 [26] and AM-4 [27]
obtaining the delaminated titanosilicates called UZAR-S1 [28] and UZAR-S2 [29].
Regarding layered OPT stannosilicate Corcoran et al. in 1989 [5] report a job involving

the synthesis of the first layered material, named Sn-L. There are other porous layered
stannosilicate, Sn-Ilerite [30], although its sheets are only formed by tetrahedral units.
Another area of research in constant development is materials with high capacity
to adsorb gases. Among the studied gases, hydrogen is particularly relevant because it is
becoming increasingly important as an energy vector. One of the main reasons is
because the main renewable energy sources in nature, such as solar, wind and
geothermal, generally need to be transformed into electricity to be transported
efficiently. Alternatively, hydrogen must only be produced. This production can be
made from renewable energy sources and subsequently convert it to electricity through
the use of fuel cells [31]. Conventional storage of large quantities of hydrogen in its
molecular form is complex and expensive due to the need to use high pressures and low
temperatures in order to have a high energy density that approaches commercial
parameters. This causes an enormous effort in the development of materials and
techniques efficient enough to allow use in both stationary and mobile applications. In
this development of new materials with high hydrogen adsorption capacity stand out
from other activated carbons [31-33] and MOFs [34, 35].
We present in this paper the synthesis of a novel stannosilicate named UZAR-
S3, its swelling and subsequent exfoliation resulting in a new delaminated material
named UZAR-S4. These materials have been characterized by multiple characterization
techniques and they have been applied to hydrogen adsorption.
2. Experimental section
2.1. Preparation of materials
To prepare 19.1 g of gel, sodium silicate solution (27 wt% SiO2, 8wt% Na2O,
Merck) (10.0 g) was mixed with deionized water (6,5 g) and NaOH (98 wt%, Sigma-
Aldrich) (1.4 g); then tin(II) chloride dihydrate (reagent grade 98 wt%, Sigma-Aldrich)
(1.2 g) was added. After stirring for half an hour at room temperature, the resulting gel
was degassed for a few minutes in ultrasonic bath and transferred into a 40 mL Teflon-
lined autoclave. The crystallization was carried out under hydrothermal conditions at
230 °C for 96 h. After filtering and washed repeatedly with deionized water and dried at
100 °C overnight, ca. 4.4 g of powder was obtained.
This material, called UZAR-S3, is swollen by intercalation of nonylamine
molecules. Previous to this step there was a proton exchange procedure of the material
(0.66 g) with a solution of water and acetic acid (0,38 g of glacial acetic acid in 82,5 mL
of deionized water, pH=2.7) for 10 min, after this time the pH reached a value of 3.9
(sample H- UZAR-S3). After this time the solution of nonylamine (5.42 g in 165 mL of
deionized water) was added and the reaction was carried under reflux at 60 ºC for 14 h
with a constant pH of 9.6. Finally the solution was centrifuged in order to recover the
solid with acetone and it was dried at 70 ºC for 3 h obtaining the swollen material.
The delaminated material (UZAR-S4) was obtained by extracting the amine with
an HCl/H2O/ethanol (5:17:870, molar ratio) solution. This extraction is carried under
reflux for 8 h and 55 ºC. After this time, the solid was recovered, washed 5 times with
deionized water and dried to 100 ºC for 12 h.
2.2. Characterization
X-ray diffraction (Rigaku/Max System diffractometer, CuKα radiation with
λ=1.5418 Å and graphite monochromator) and X-ray fluorescence analyses (THERMO
ELECTRON ARL ADVANT’XP equipped with a rhodium tube and software
UNIQUANT) were conducted for most of the samples. Thermogravimetric analyses
(TGA) were performed in a TGA/DSC 1 STARe SYSTEM (Mettler Toledo) under air at
a heating rate of 10 °C/min.
Scanning electron microscopy (JEOL JSM 6400) images were obtained over
gold-coated specimens by operating at 20 kV, while images of the smallest crystals
were collected using transmission electron microscopy (JEOL-2000 FXII). TEM
specimens were prepared after repeated dispersion in acetone before pouring onto the
carbon grid.
The measurements of 29Si NMR MAS were carried out with a pulse of 90º, a
recycle delay of 5 s and a spinning rate of 10 kHz. Chemical shifts referred to 3-
(trimethylsilyl)-1-propanesulfonic acid. In the case of 119Sn NMR MAS, they were
measured with a pulse of 40º, a recycle delay of 100 s and a spinning rate of 12 kHz.
Chemical shifts referred to tin dioxide. Fourier transformed infrared (FTIR)
transmission spectra were measured on a Shimadzu IRAffinity-1 in the range of 400-
4000 cm-1 using a KBr wafer, resolution 4 cm-1 and 30 scans.
To analyze the porosity a Micrometrics Tristar 3000 instrument was used with
two adsorbates: N2 at -196 ºC and CO2 at 25 ºC. The samples were measured after
degassing them at 200 ºC for 8 h. Mercury porosimetry experiments were performed
using a Micromeritics Autopore IV 9520 capable of obtaining pressures of 414 MPa.
Samples were degassed for 24 hours at 100 ºC and all penetrometers were calibrated
and the baseline errors of each penetrometer, caused by the compressibility and thermal
effects of the mercury and penetrometer parts, were obtained from analysis without
sample.

Hydrogen isotherms at -196ºC and up to 4 MPa were obtained using a Sartorius 4406
DMT high-pressure microbalance. The sample was degassed at 150ºC overnight under
vacuum. The experimental results were corrected for buoyancy effects related to the
displacement of gas by the sample, the sample holder, and the pan.[Agarwal, R.;
Schwarz, J. Analysis of high-pressure adsorption of gases on activated carbon by
potential-theory. Carbon 1988, 26, 873−87] Hydrogen isotherms at 25ºC were
determined in an automatic volumetric apparatus designed and assembled at the
Departamento de Química Inorgánica, Universidad de Alicante laboratory to determine
hydrogen isotherms up to 20 MPa. The manifold of the apparatus was kept at 36ºC.
Also, the sample cell was refrigerated at 25ºC by means of a liquid bath. The manifold
volume was calibrated with a standard volume by determining helium isotherms. To
ensure that the apparatus was leakfree, a hydrogen leak test was executed at 9 and 15
MPa over 28 h, with a leak rate of less than 10−6 s−1 resulting. The bulk gas amounts
were calculated by the equation of state of the modified Benedic−Webb−Rubin [Zhang,
C.; Lu, X. S.; Gu, A. Z. How to accurately determine the uptake of hydrogen in
carbonaceous materials. Int. J. Hydrogen Energ. 2004, 29, 1271−1276] formalism, and
the cell volume has been calculated by taking into account the correction described in
the literature.[Kiyobayashi, T.; Takeshita, H. T.; Tanaka, H.; Takeichi, N.; Zuttel, A.;
Schlapbach, L.; Kuriyama, N. Hydrogen adsorption in carbonaceous materials. J.
Alloys Compd. 2002, 330, 666−669] Previous to the determination of the adsorption
isotherm, the sample was degassed at 150ºC for 4 h under vacuum. After that, the
sample was placed in the sample holder and then evacuated at 130ºC for 4 h in vacuum.
The sample weight was about 500 mg. Hydrogen and helium gases used in the
experiments were 99.9995% pure. In both experimental systems used for hydrogen
adsorption measurements, the excess hydrogen adsorption is obtained and these are the
values reported in this work. Solid-state NMR MAS spectra were recorded with a
Bruker AV400 WB spectrometer operating at a resonance frequency of 79.49 MHz and
with a 4 mm probe.
3. Results
Layered stannosilicate UZAR-S3
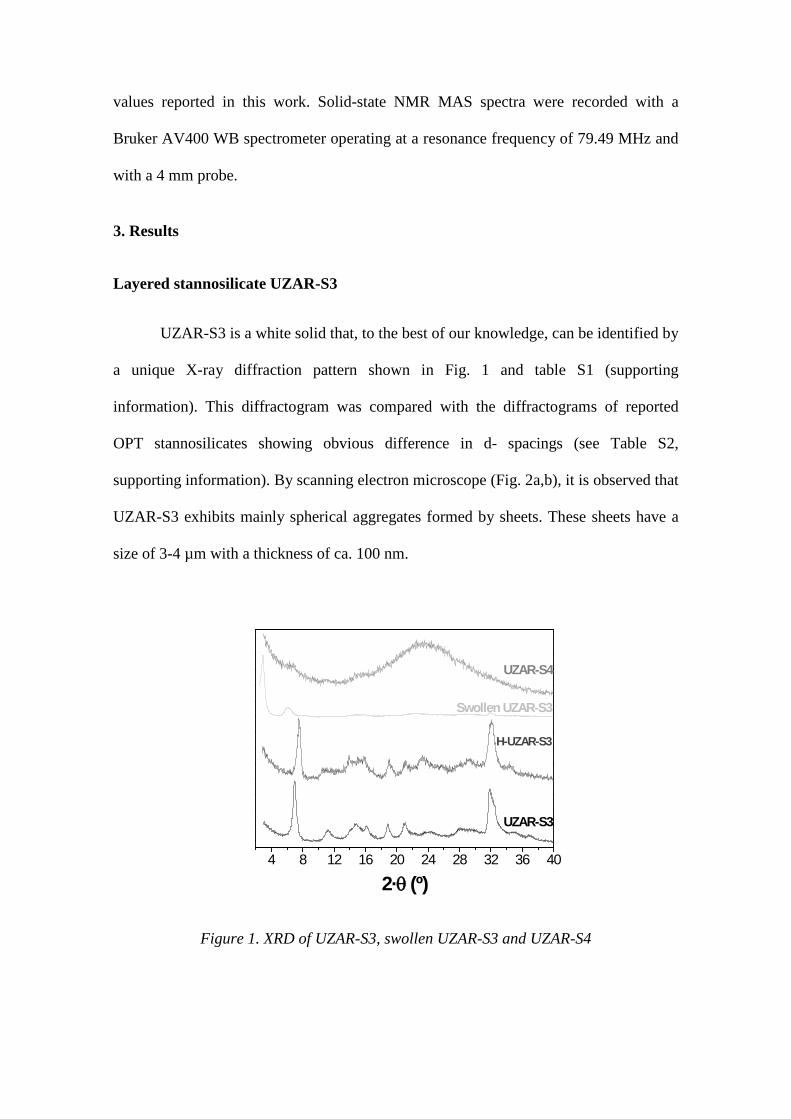
UZAR-S3 is a white solid that, to the best of our knowledge, can be identified by
a unique X-ray diffraction pattern shown in Fig. 1 and table S1 (supporting
information). This diffractogram was compared with the diffractograms of reported
OPT stannosilicates showing obvious difference in d- spacings (see Table S2,
supporting information). By scanning electron microscope (Fig. 2a,b), it is observed that
UZAR-S3 exhibits mainly spherical aggregates formed by sheets. These sheets have a
size of 3-4 µm with a thickness of ca. 100 nm.
4 8 12 16 20 24 28 32 36 40
H-UZAR-S3
UZAR-S3
Swollen UZAR-S3
2·θ (º)
UZAR-S4
Figure 1. XRD of UZAR-S3, swollen UZAR-S3 and UZAR-S4

Figure 2. SEM Images of UZAR-S3 (a, b), swollen UZAR-S3 (c) and UZAR-S4 (d)
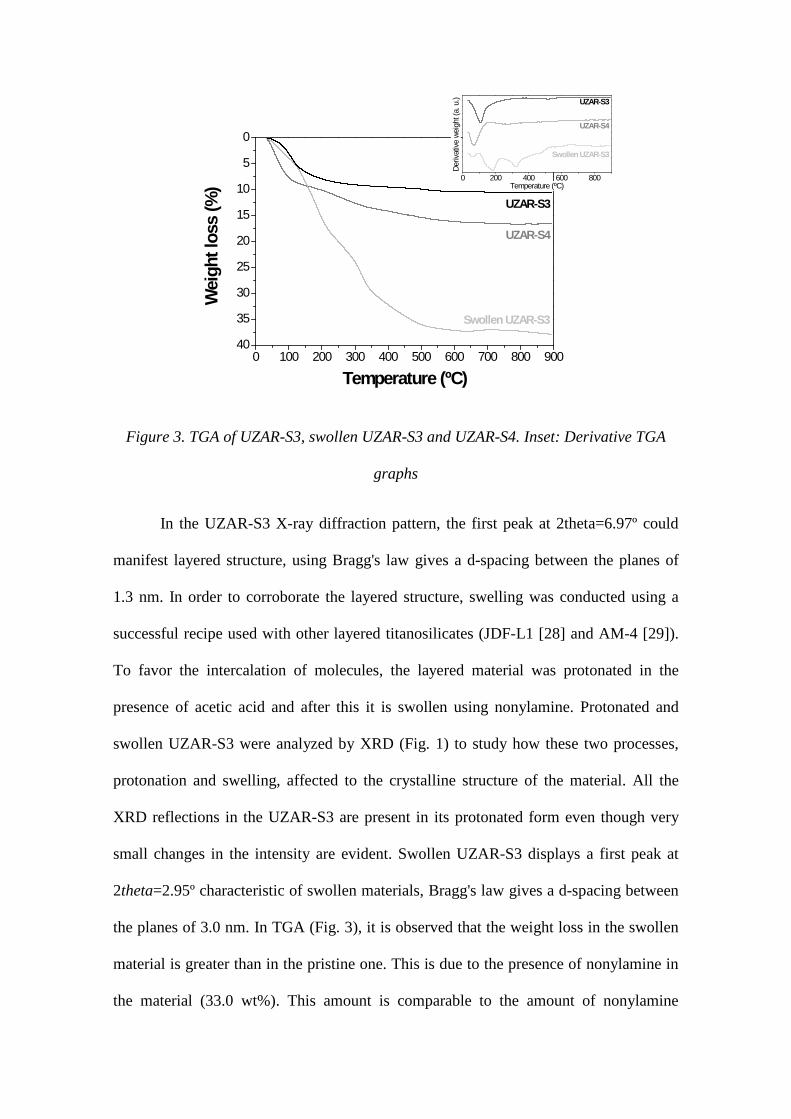
In order to establish the molecular formula of UZAR-S3, three samples were
analyzed by X-ray fluorescence and thermogravimetric analyses to determine metal and
water composition, respectively. X-ray fluorescence gives Na/Sn and Si/Sn atomic
ratios ca. 3.7 ± 0.3 and 4.7 ± 0.2, respectively. For UZAR-S3, water weight loss took
place below 300 ºC with a maximum weight loss at 100 ºC representing 9.6 ± 0.5 wt%,
as shown in Fig. 3. Balancing oxygen with Na+, Si4+ and Sn4+, the molecular formula of
UZAR-S3 can be estimated as: Na4 Sn Si5 O14 · 3.5 H2O. This molecular formula is
different from the molecular formula that present other stannosilicates (see table S2,
supporting information) although very similar to the formula of Sn-L reported by
Corcoran et al. [5] but these material present a different crystal structure as confirmed
by XRD and further corroborated with other characterization techniques.
100 µm 10 µm
7 µm
6 µm 20 µm
0 100 200 300 400 500 600 700 800 90040
35
30
25
20
15
10
5
0
UZAR-S4
Swollen UZAR-S3
Wei
ght l
oss
(%)
Temperature (ºC)
UZAR-S3
0 200 400 600 800
Deriv
ative
wei
ght (
a. u
.)
Temperature (ºC)
UZAR-S4
Swollen UZAR-S3
UZAR-S3
Figure 3. TGA of UZAR-S3, swollen UZAR-S3 and UZAR-S4. Inset: Derivative TGA
graphs
In the UZAR-S3 X-ray diffraction pattern, the first peak at 2theta=6.97º could
manifest layered structure, using Bragg's law gives a d-spacing between the planes of
1.3 nm. In order to corroborate the layered structure, swelling was conducted using a
successful recipe used with other layered titanosilicates (JDF-L1 [28] and AM-4 [29]).
To favor the intercalation of molecules, the layered material was protonated in the
presence of acetic acid and after this it is swollen using nonylamine. Protonated and
swollen UZAR-S3 were analyzed by XRD (Fig. 1) to study how these two processes,
protonation and swelling, affected to the crystalline structure of the material. All the
XRD reflections in the UZAR-S3 are present in its protonated form even though very
small changes in the intensity are evident. Swollen UZAR-S3 displays a first peak at
2theta=2.95º characteristic of swollen materials, Bragg's law gives a d-spacing between
the planes of 3.0 nm. In TGA (Fig. 3), it is observed that the weight loss in the swollen
material is greater than in the pristine one. This is due to the presence of nonylamine in
the material (33.0 wt%). This amount is comparable to the amount of nonylamine
intercalated in the titanosilicate JDF-L1 (with similar atomic spacing 3.0 nm), indicating
a bilayer surfactant configuration [28]. This total amount of amine can be divided into
two parts: the first from 150 to 275 °C due to the protonated amine and the second from
275 °C attributed to nonprotonated amine. This distinction, is similar to that occurring
in the case of zeolite MCM-22P laminar [19]. The d-spacing between the layers in
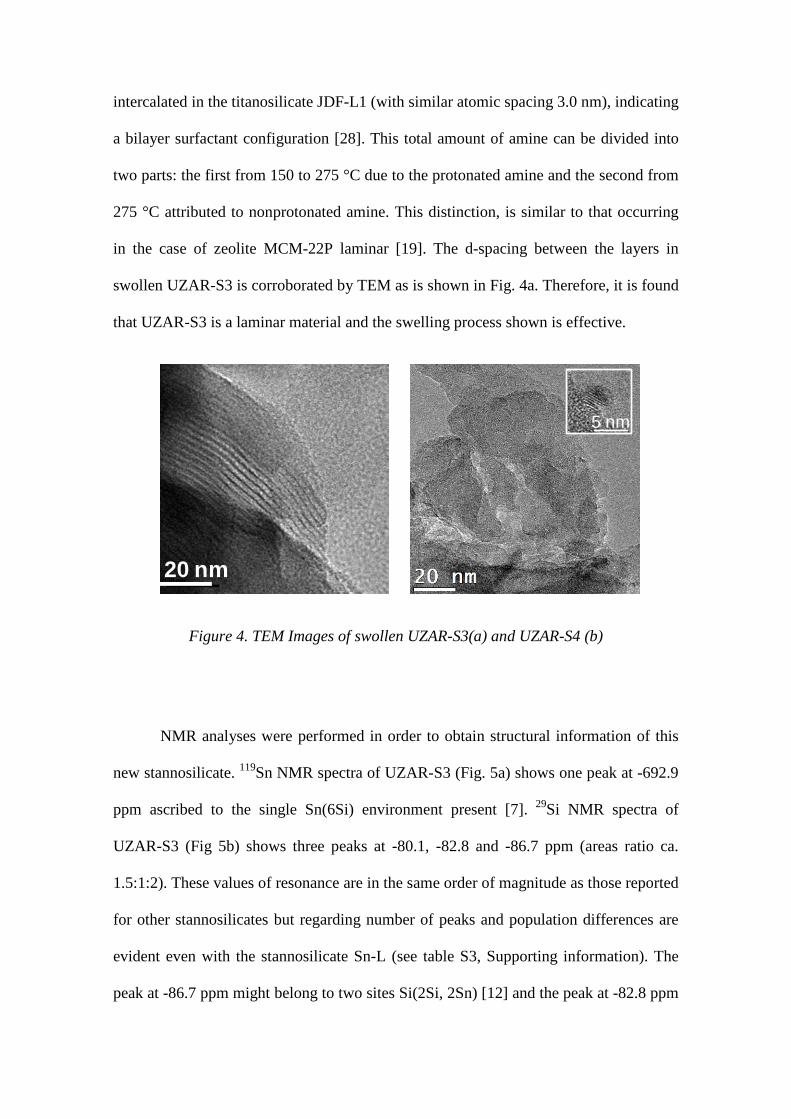
swollen UZAR-S3 is corroborated by TEM as is shown in Fig. 4a. Therefore, it is found
that UZAR-S3 is a laminar material and the swelling process shown is effective.
Figure 4. TEM Images of swollen UZAR-S3(a) and UZAR-S4 (b)
NMR analyses were performed in order to obtain structural information of this
new stannosilicate. 119Sn NMR spectra of UZAR-S3 (Fig. 5a) shows one peak at -692.9
ppm ascribed to the single Sn(6Si) environment present [7]. 29Si NMR spectra of
UZAR-S3 (Fig 5b) shows three peaks at -80.1, -82.8 and -86.7 ppm (areas ratio ca.
1.5:1:2). These values of resonance are in the same order of magnitude as those reported
for other stannosilicates but regarding number of peaks and population differences are
evident even with the stannosilicate Sn-L (see table S3, Supporting information). The
peak at -86.7 ppm might belong to two sites Si(2Si, 2Sn) [12] and the peak at -82.8 ppm
20 nm
5 nm

to a single site Si(2Si, 2Sn) [5]. The resonance at -80.1 ppm can be assigned as Si(2Si,
1Sn). So, UZAR-S3 shows four sites of Si: one site Q3 (2Si, 1Sn) and 3 sites Q4 Si(2Si,
2Sn) with an area ratio of 1.5:1:1:1 respectively. The site Si(2Si, 1Sn) is new in this
type of materials, showing a Q3 position typical of laminar materials [28], it is due to
the presence of small and thin particles in which the rupture of bonds Si−O−Si has taken
place. This Si would show two bonds −O−Si, one −O−Sn and other −O−H. The small
amount of Sn in this site makes that only one peak is observed in the 119Sn NMR
spectra. It is like the material EMS-2 [13] that has Si(2Si, 2Sn), Si(3Si, 1Sn) and a
single site Sn(6Si). The NMR analysis indicates that the framework of UZAR-S3
consists of SnO6 octahedra and SiO4 tetrahedra and can be classified in the OPT family.
-70 -80 -90 -100 -110 -120-600 -640 -680 -720 -760
b)
UZAR-S3
-111.0-101.8
-92.5
-86.7-82.8
-80.1
UZAR-S4
Chemical shift (ppm)
UZAR-S3
a)
Chemical shift (ppm)
-692.9
Figure 5: a) 119Sn MAS NMR of UZAR-S3. b) 29Si MAS NMR of UZAR-S3 and UZAR-S-
4;
In order to check the porosity, as made, protonated and swollen UZAR-S3
samples, scarcely adsorbs N2, and this is reflected by a BET specific surface area of
10.5 ± 5.6 m2/g (3 samples), 7.1 ± 0.1 m2/g and 19.7 ± 0.1 m2/g, respectively. It should

be noted that these results do not indicate that the material is non-porous. What these
results can tell is that the pores are smaller than the kinetic diameter of the nitrogen
molecule (0.364 nm) as occurs with other microporous OPT titanosilicates (umbite and
JDF-L1).
Exfoliated stannosilicate UZAR-S4
Swollen UZAR-S3 was exfoliated by HCl extraction to get the exfoliated
stannosilicate UZAR-S4. After this chemical extraction, UZAR-S4 shows a XRD-
amorphous or exhibits broad reflections (Fig. 1), similar to other delaminated porous
materials [24].
The delaminated stannosilicate has also been characterized by
thermogravimetric analysis (Fig. 3). At temperatures below 150 °C the weight loss is
greater than UZAR-S3 because the delaminated material adsorbs more moisture by the
most exposed area. The weight loss after 175 ºC could suggest that removal of the
amine material has not been completed but maximum weight loss does not agree with
the swollen UZAS-S3. To clarify FTIR analyses have been done (Fig. S1, supporting
information), the bands at 2958, 2926, 2855 and 1558 cm-1 assigned to the presence of
amine, due to C-H bond stretching of ─CH2─ and ─CH3 groups and ─NH2 functional
do not appear in sample UZAR-S4 indicating that the extraction process is adequate to
remove the main portion of nonylamine.
Nitrogen adsorption isotherms of materials are compared in Fig. 6. The
adsorption isotherms for UZAR-S3 and swollen UZAR-S3 show a very small N2
adsorption but the nitrogen isotherm of UZAR-S4 indicated a wide pore-size
distribution ranging from micro to mesopores. The BET specific surface area was 236 ±
28 m2/g (mean value and standard deviation of 4 samples prepared in the same
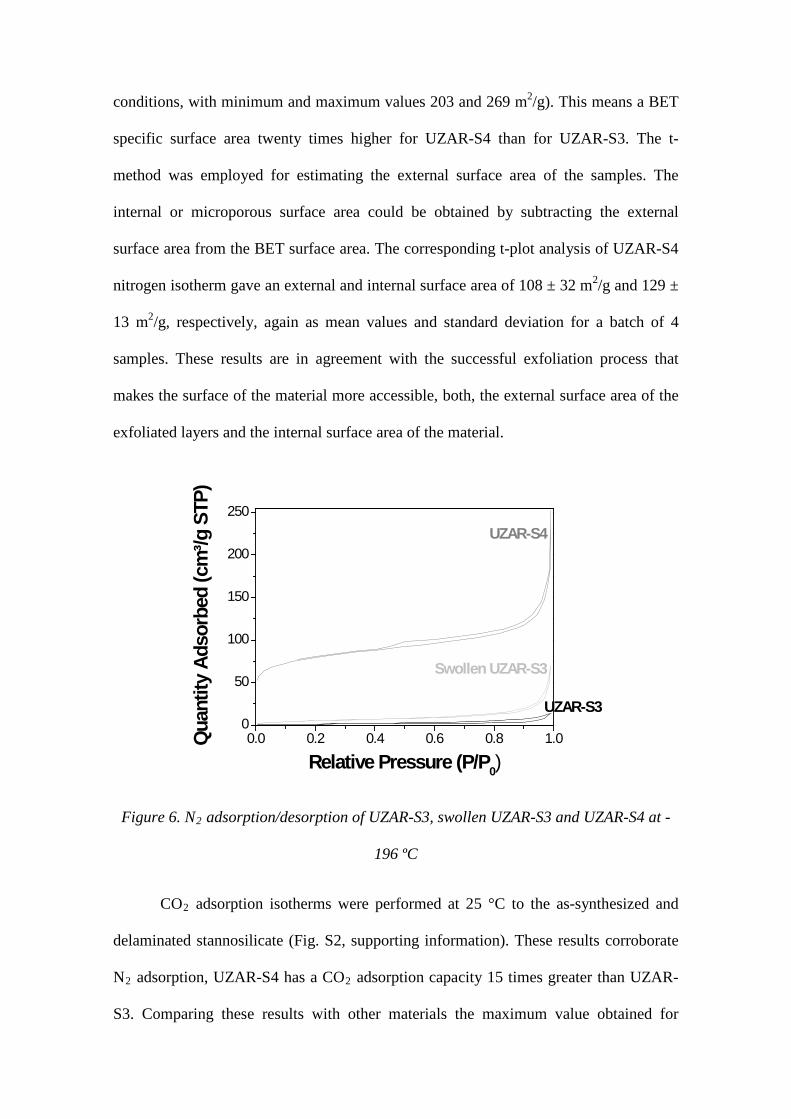
conditions, with minimum and maximum values 203 and 269 m2/g). This means a BET
specific surface area twenty times higher for UZAR-S4 than for UZAR-S3. The t-
method was employed for estimating the external surface area of the samples. The
internal or microporous surface area could be obtained by subtracting the external
surface area from the BET surface area. The corresponding t-plot analysis of UZAR-S4
nitrogen isotherm gave an external and internal surface area of 108 ± 32 m2/g and 129 ±
13 m2/g, respectively, again as mean values and standard deviation for a batch of 4
samples. These results are in agreement with the successful exfoliation process that
makes the surface of the material more accessible, both, the external surface area of the
exfoliated layers and the internal surface area of the material.
0.0 0.2 0.4 0.6 0.8 1.00
50
100
150
200
250
Quan
tity
Adso
rbed
(cm
³/g S
TP)
Relative Pressure (P/P0)
UZAR-S3
Swollen UZAR-S3
UZAR-S4
Figure 6. N2 adsorption/desorption of UZAR-S3, swollen UZAR-S3 and UZAR-S4 at -
196 ºC
CO2 adsorption isotherms were performed at 25 °C to the as-synthesized and
delaminated stannosilicate (Fig. S2, supporting information). These results corroborate
N2 adsorption, UZAR-S4 has a CO2 adsorption capacity 15 times greater than UZAR-
S3. Comparing these results with other materials the maximum value obtained for
UZAR-S4 (0.7 mmol CO2/g) is less than ETS-10 (2 mmol CO2/g) [36], similar to Sn -
Umbite (0.9 mmol CO2/g) [37] and greater than Ti-Umbite (0.2 mmol CO2/g) [37] and
UZAR-S2 (0.2 mmol CO2/g) [29].
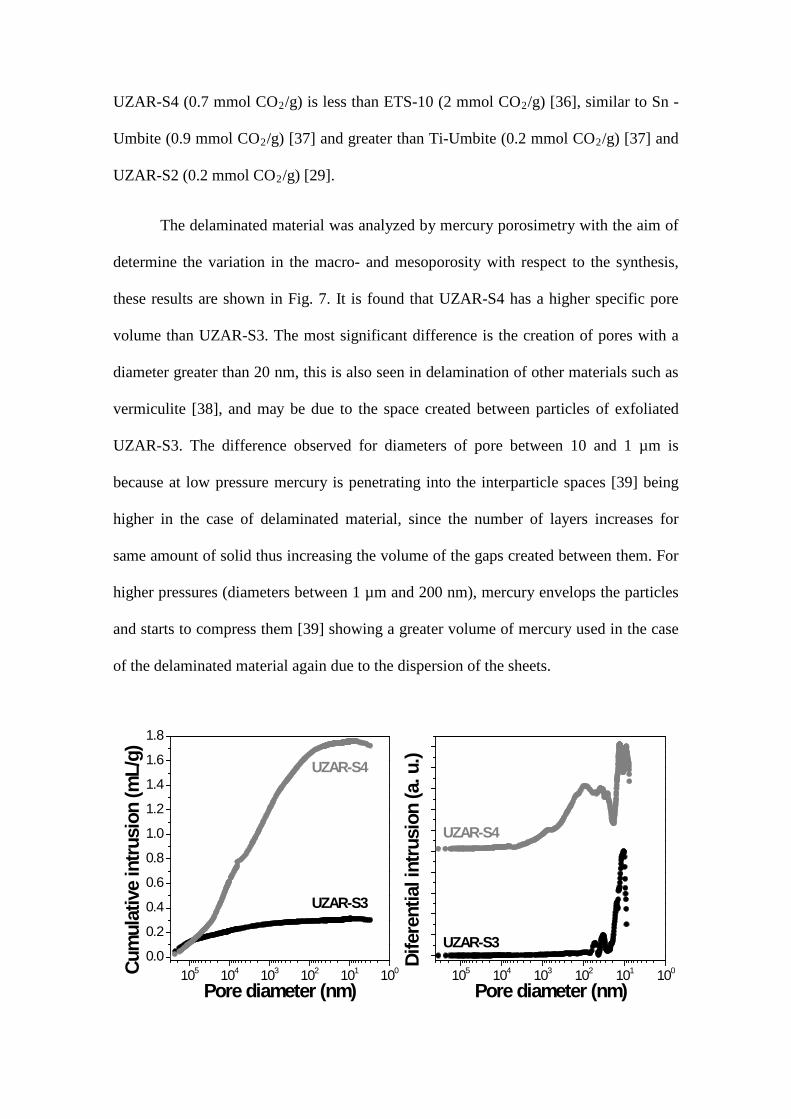
The delaminated material was analyzed by mercury porosimetry with the aim of
determine the variation in the macro- and mesoporosity with respect to the synthesis,
these results are shown in Fig. 7. It is found that UZAR-S4 has a higher specific pore
volume than UZAR-S3. The most significant difference is the creation of pores with a
diameter greater than 20 nm, this is also seen in delamination of other materials such as
vermiculite [38], and may be due to the space created between particles of exfoliated
UZAR-S3. The difference observed for diameters of pore between 10 and 1 µm is
because at low pressure mercury is penetrating into the interparticle spaces [39] being
higher in the case of delaminated material, since the number of layers increases for
same amount of solid thus increasing the volume of the gaps created between them. For
higher pressures (diameters between 1 µm and 200 nm), mercury envelops the particles
and starts to compress them [39] showing a greater volume of mercury used in the case
of the delaminated material again due to the dispersion of the sheets.
105 104 103 102 101 1000.0
0.2
0.4
0.6
0.8
1.0
1.2
1.4
1.6
1.8
105 104 103 102 101 100
UZAR-S3
Cum
ulat
ive
intru
sion
(mL/
g)
Pore diameter (nm)
UZAR-S4
UZAR-S3
Dife
rent
ial i
ntru
sion
(a. u
.)
Pore diameter (nm)
UZAR-S4
Figure 7. Hg porosimetry of UZAR-S3 and UZAR-S4
To gain more insight in the exfoliation process, a study of electron microscopies
has been realized. SEM images of UZAR-S4 (Fig 3d) did not show the aggregates of
UZAR-S3 presenting broken micrometric sheets with nanometric thickness. These are
also appreciable in the images of TEM in Fig. 4b. In the inset of this figure, the basal
spacing observed is 3.3 Å.
29Si MAS NMR spectra were performed in order to obtain structural information
on the connectivity of TO4 tetrahedral where T would in this case Si or Sn and oxygen
could be connected to other metal atoms or protons. In Fig. 5b the differences between
UZAR-S3 and UZAR-S4 can be observed. UZAR-S4 maintains the three positions of
UZAR-S3 but moved toward lower values of chemical shift. For UZAR-S4 there are
three chemical shifts at -92.5, -101.8 and -111.0 ppm, values very close to those seen in
the titanosilicate UZAR-S1[28]. As in the case of UZAR-S1, sites Si(2Si, 1Me) and
Si(1Si, 1Me) are generated by the rupture of the Si-O-Si consistent with the fine
particles observed by TEM. Sites Si(3Si, 0Me) and Si(4Si, 0Me) could be the result of
chemical attack taking place on the tin throughout the process and for this reason, no
signal was observed in the 119Sn MAS NMR analysis (not shown). The leaching of Sn
after the chemical extraction of UZAR-S4 was confirmed by X-ray fluorescence. Na/Sn
and Si/Sn atomic ratios are estimated 0.7 and 38, respectively.
Hydrogen storage
In the development of new materials for H2 adsorption, UZAR-S3 and S4 may
play an important role. UZAR-S3, once has been swollen and delaminated to obtain
UZAR-S4, shows a hydrogen adsorption behavior comparable to activated carbons with
a high porosity development and not found for any of the previously reported
stannosilicates. Two samples of UZAR-S4 were measured checking the reproducibility
of the material in the adsorption of hydrogen at -196 °C as shown in Fig. 8. For
comparison, hydrogen adsorption isotherms of UZAR-S1, UZAR-S3 and protonated
UZAR-S3 are also shown.
UZAR-S3 and protonated UZAR-S3 have a small hydrogen adsorption, and
similar in both cases, because they have not been delaminated. Regarding UZAR-S1, as
it has already been delaminated from JDF-L1, it has a hydrogen adsorption capacity
greater (2.1 wt% at 40 bar).
UZAR-S4 shows the maximum value of gravimetric H2 adsorption of the four materials
tested being 4.2 ± 0.1wt% (average and standard deviation of two samples) at 40 bar, obtaining
for 10 bar of pressure a gravimetric adsorption value of 3.7 ± 0.1 wt%. It is very important to
note the solid density used to calculate the volumetric hydrogen storage capacities. UZAR-S4
has a high density, tap density of 0.43 g / mL determined by filling and vibrating a container
with a known weight of sample obtaining the occupied volume and crystal density of 1.67 g /
mL, so its total volumetric H2 storage capacity, which was calculated as the sum of the excess
H2 adsorbed on the porous material and the compressed H2 as detailed in a previous work [40],
is 26.2 g of H2 / L (calculated from tap density) which is a remarkable value in terms of total
storage capacity, especially taking into account that the tap density was used in the calculations.
These results indicate that UZAR-S4 is an optimal material for the adsorption of H2 compared
to the materials that are currently researching, as are [40]: MOF-5, 16 g of H2 / L, and activated
carbons MAX3, 20 g of H2 / L and AC-1, 23 g of H2 / L (values for maximum volumetric
hydrogen storage capacity from tap density). MOF-5, MAX3 and AC-1 shows a greater
gravimetric hydrogen adsorption than UZAR-S4 (5.2, 5.3 and 5.4 wt% respectively) but these
materials have a lower tap density than UZAR-S3 (0.30, 0.36 and 0.38 g / L respectively)
resulting smaller values of volumetric hydrogen adsorption.

Moreover, is worth noting that UZAR-S4 with a BET surface area of 236 m2/g
shows the same excess H2 adsorption that activated carbons prepared from a Spanish
anthracite by chemical activation with KOH (KUA1) and prepared from Subituminous
coal by chemical activation with KOH (H1) [33] which show a BET surface area of
around 2000 m2/g. Hydrogen adsorption measurements at 25 ºC were also performed
being 0.63 wt% the excess hydrogen adsorption at 200 bar. From these results, it is
important to highlight that UZAR-S4 obtained a similar value than A20, commercial
activated carbon fibers from Osaka Gas Co with a BET surface area close to 2000 m2/g
[33].
It should be noted that, as it can be clearly seen in the UZAR-S4 material, even
when the H2 pressure was reduced to 1 bar in the desorption experiment, the sample still
had a very high amount of H2 adsorbed, indicating the existence of very narrow pores
which could only be filled by very small adsorbates, or for those adsorbates showing an
intense interaction with the adsorbent material.
0 5 10 15 20 25 30 35 400
1
2
3
4
UZAR-S3
H-UZAR-S3
UZAR-S1
H 2 ads
orbe
d (w
t.%)
Pressure (bar)
UZAR-S4
Figure 8. H2 adsorption of UZAR-S1, UZAR-S3, H-UZAR-S3 and UZAR-S4
4. Conclusions
A new layered stannosilicate, named UZAR-S3, has been obtained by
hydrothermal synthesis carried out at 230 ºC and 96 h. It presents a lamellar
morphology and a framework composed of SiO4 tetrahedra and SnO6 octahedra. Its
empirical formula is Na4SnSi5O14 · 3.5H2O. Several techniques like XRF, SEM, 29Si
NMR MAS, 119Sn NMR MAS and specially XRD showed that UZAR-S3 has never
been reported before.
UZAR-S3 has been protonated through an exchange procedure, where no
modifications in the framework have been observed. Then it was swollen through
intercalation of nonylamine molecules increasing the layers spacing from 1.3 to 3.0 nm.
A chemical extraction with 0.1 M HCl/ethanol was carried out to delaminated
the swollen UZAR-S3. The new nanometric material obtained, called UZAR-S4, has an
external specific surface area of 236 m2/g. NMR MAS, TGA, XRD, TEM, Hg
porosimetry and adsorption of N2, CO2 and H2 analysis provide evidences for existence
of nanometer like-high aspect ratio particles. It has been observed Sn leaching during
delamination process developed with HCl/ethanol mixtures.
At -196 °C, UZAR-S4 presents a high H2 adsorption capacity of 3.7 and 4.2
wt% for 10 and 40 bar, respectively. These results and its high packing density (0.43
g/mL) mean a higher hydrogen storage capacity (26.2 g of H2 /L at 40 bar) than that for
other materials currently being investigated.
Acknowledgements

The authors would like to thank the Spanish MINECO and FEDER (Project CTQ2012-
31762). Á. Berenguer-Murcia thanks the Spanish MINECO for a Ramón y Cajal
fellowship (RyC 2009-03913).
1. Rocha, J. and Z. Lin, Micro- mixed octahedral-pentahedral-tetrahedral
framework silicates. Microporous and Mesoporous Mineral Phases, 2005. 57: p. 173-
201.
2. Anderson, M.W., et al., Structure of the microporous titanosilicate ETS-10.
Nature, 1994. 367(6461): p. 347-351.
3. Philippou, A. and M.W. Anderson, Structural investigation of ETS-4. Zeolites,
1996. 16(2-3): p. 98-107.
4. Ilyushin, G.D., New data on crystal-structure of umbite K2ZrSi3O9.H2O.
Inorganic Materials, 1993. 29(7): p. 1128-1133.
5. Corcoran, E.W. and D.E.W. Vaughan, Hydrothermal synthesis of mixed
octahedral-tetrahedral oxides - Synthesis and characterization of sodium
stannosilicates. Solid State Ionics, 1989. 32-3: p. 423-429.
6. Lin, Z., J. Rocha, and A. Valente, Synthesis and characterisation of a framework
microporous stannosilicate. Chemical Communications, 1999(24): p. 2489-2490.
7. Lin, Z., et al., Synthesis and structure of a novel microporous framework
stannosilicate. Journal of Materials Chemistry, 2000. 10(6): p. 1353-1356.
8. Ferreira, A., et al., Ab initio structure determination of a small-pore framework
sodium stannosilicate. Inorganic Chemistry, 2001. 40(14): p. 3330-3335.
9. Lin, Z., A. Ferreira, and J. Rocha, Synthesis and structural characterization of
novel tin and titanium potassium silicates K4M2Si6O18. Journal of Solid State
Chemistry, 2003. 175(2): p. 258-263.
10. Ferreira, A., et al., Ab initio structure determination of novel small-pore metal-
silicates: knots-and-crosses structures. Inorganica Chimica Acta, 2003. 356: p. 19-26.
11. Lin, Z. and J. Rocha, Synthesis and characterisation of a stannosilicate with the
structure of penkvilksite-1M. Microporous and Mesoporous Materials, 2006. 94(1-3): p.
173-178.
12. Lo, F.R. and K.H. Lii, High-temperature, high-pressure hydrothermal synthesis
and characterization of a new framework stannosilicate: Cs2SnSi3O9. Journal of Solid
State Chemistry, 2005. 178(4): p. 1017-1022.
13. Millini, R., et al., Synthesis, characterization and crystal structure of EMS-2 - a
novel microporous stannosilicate. Microporous and Mesoporous Materials, 2007.
101(1-2): p. 43-49.
14. Corma, A., et al., Delaminated zeolite precursors as selective acidic catalysts.
Nature, 1998. 396(6709): p. 353-356.
15. Choi, S., et al., Layered silicates by swelling of AMH-3 and nanocomposite
membranes. Angewandte Chemie-International Edition, 2008. 47(3): p. 552-555.
16. Wang, Z. and T.J. Pinnavaia, Hybrid organic-inorganic nanocomposites:
Exfoliation of magadiite nanolayers in an elastomeric epoxy polymer. Chemistry of
Materials, 1998. 10(7): p. 1820-1826.
17. Andrews, S.J., et al., Piperazine silicate (EU-19) - The structure of a very small
crystal determined with synchrotron radiation. Acta Crystallographica Section B-
Structural Science, 1988. 44: p. 73-77.
18. Schreyeck, L., et al., PREFER: a new layered (alumino) silicate precursor of
FER-type zeolite. Microporous Materials, 1996. 6(5–6): p. 259-271.
19. Pergher, S.B.C., A. Corma, and V. Fornes, Preparation and characterization of
MCM-22 zeolite and its layered precursor. Quimica Nova, 2003. 26(6): p. 795-802.
20. Zanardi, S., et al., Crystal structure determination of zeolite Nu-6(2) and its
layered precursor Nu-6(1). Angewandte Chemie-International Edition, 2004. 43(37): p.
4933-4937.
21. Blake, A.J., K.R. Franklin, and B.M. Lowe, Preparation and properties of
piperazine silicate (EU-19) and a silica polymorph (EU-20). Journal of the Chemical
Society-Dalton Transactions, 1988(10): p. 2513-2517.
22. Corma, A., et al., Preparation, characterisation and catalytic activity of ITQ-2,
a delaminated zeolite. Microporous and Mesoporous Materials, 2000. 38(2-3): p. 301-
309.
23. Corma, A., et al., New aluminosilicate and titanosilicate delaminated materials
active for acid catalysis, and oxidation reactions using H2O2. Journal of the American
Chemical Society, 2000. 122(12): p. 2804-2809.
24. Corma, A., V. Fornes, and U. Diaz, ITQ-18 a new delaminated stable zeolite.
Chemical Communications, 2001(24): p. 2642-2643.
25. Gorgojo, P., et al., Direct exfoliation of layered zeolite Nu-6(1). Microporous
and Mesoporous Materials, 2011. 142(1): p. 122-129.
26. Rubio, C., et al., Seeded synthesis of layered titanosilicate JDF-L1. Materials
Letters, 2009. 63(1): p. 113-115.
27. Lin, Z., et al., Synthesis and structural characterization of microporous umbite,
penkvilksite, and other titanosilicates. Journal of Physical Chemistry B, 1997. 101(36):
p. 7114-7120.
28. Rubio, C., et al., Exfoliated Titanosilicate Material UZAR-S1 Obtained from
JDF-L1. European Journal of Inorganic Chemistry, 2010. 2010(1): p. 159-163.

29. Casado, C., et al., Synthesis, swelling, and exfoliation of microporous lamellar
titanosilicate AM-4. European Journal of Inorganic Chemistry, 2011. 2011(14): p. 2247-
2253.
30. Supronowicz, W. and F. Roessner, Influence of Sn and Al heteroatoms on the
synthesis of Ilerite. Clays and Clay Minerals, 2011. 59(1): p. 95-105.
31. Jimenez, V., et al., Hydrogen storage in different carbon materials: Influence of
the porosity development by chemical activation. Applied Surface Science, 2012.
258(7): p. 2498-2509.
32. Jorda-Beneyto, M., et al., Advanced activated carbon monoliths and activated
carbons for hydrogen storage. Microporous and Mesoporous Materials, 2008. 112(1-3):
p. 235-242.
33. Jorda-Beneyto, M., et al., Hydrogen storage on chemically activated carbons
and carbon nanomaterials at high pressures. Carbon, 2007. 45(2): p. 293-303.
34. Rowsell, J.L.C., et al., Hydrogen sorption in functionalized metal-organic
frameworks. Journal of the American Chemical Society, 2004. 126(18): p. 5666-5667.
35. Wong-Foy, A.G., A.J. Matzger, and O.M. Yaghi, Exceptional H2 saturation
uptake in microporous metal-organic frameworks. Journal of the American Chemical
Society, 2006. 128(11): p. 3494-3495.
36. Anson, A., et al., Adsorption of carbon dioxide, ethane, and methane on
titanosilicate type molecular sieves. Chemical Engineering Science, 2009. 64(16): p.
3683-3687.
37. Sebastian, V., et al., Deeping into the microporosity of porous silicates Ti- and
Sn-umbite. Microporous and Mesoporous Materials, 2011. 142(2-3): p. 649-654.
38. El Mouzdahir, Y., et al., Synthesis of nano-layered vermiculite of low density by
thermal treatment. Powder Technology, 2009. 189(1): p. 2-5.
39. Julve, D., et al., Analysis of mercury porosimetry curves of precipitated silica, as
an example of compressible porous solids. Journal of Non-Crystalline Solids, 2011.
357(4): p. 1319-1327.
40. Marco-Lozar, J.P., et al., MOF-5 and activated carbons as adsorbents for gas
storage. International Journal of Hydrogen Energy, 2012. 37(3): p. 2370-2381.