development of esi-lc-ms method for drug analysis
TRANSCRIPT
Cleveland State University Cleveland State University
EngagedScholarship@CSU EngagedScholarship@CSU
ETD Archive
2018
Development of ESI-LC-MS Method for Drug Analysis Development of ESI-LC-MS Method for Drug Analysis
Kimberly Yacoub Cleveland State University
Follow this and additional works at: https://engagedscholarship.csuohio.edu/etdarchive
Part of the Other Medicine and Health Sciences Commons
How does access to this work benefit you? Let us know! How does access to this work benefit you? Let us know!
Recommended Citation Recommended Citation Yacoub, Kimberly, "Development of ESI-LC-MS Method for Drug Analysis" (2018). ETD Archive. 1064. https://engagedscholarship.csuohio.edu/etdarchive/1064
This Thesis is brought to you for free and open access by EngagedScholarship@CSU. It has been accepted for inclusion in ETD Archive by an authorized administrator of EngagedScholarship@CSU. For more information, please contact [email protected].
DEVELOPMENT OF ESI-LC-MS METHOD FOR DRUG ANALYSIS
KIMBERLY YACOUB
Bachelor of Science in Chemistry
Case Western Reserve University
May 2015
submitted in partial fulfillment of requirements for the degree
MASTER OF SCIENCE IN CHEMISTRY
at the
CLEVELAND STATE UNIVERSITY
MAY 2018

We hereby approve this thesis for
Kimberly Yacoub
Candidate for the Master of Science in Chemistry degree for the
Department of Chemistry
and the CLEVELAND STATE UNIVERSITY
College of Graduate Studies
Thesis Chairperson, Dr. Baochuan Guo
Department & Date
Thesis Committee Member, Dr. John Turner
Department & Date
Thesis Committee Member, Dr. Aimin Zhou
Department & Date
Student's Date of Defense: April 11th, 2018

ACKNOWLEDGEMENTS
I would like to express my deepest gratitude to my thesis advisor, Dr. Baochuan
Guo, of the Department of Chemistry at Cleveland State University. His guidance,
assistance, and encouragement all helped me through my learning process of this master
thesis. He offered his expert knowledge to steer the research in the right direction.
I would like to thank Raghavi Kakarla, PhD Candidate, for her support,
knowledge, and expertise to undergo the development of this master thesis. Her support,
assistance, and guidance aided me in achieving profound results. Thank you for all of
your help and patience.
I would also like to graciously thank Dr. Turner and Dr. Zhou who took the time
to participate in my final defense committee. The time you two took is valued and
appreciated.
Lastly, I would like my family for supporting me during my time as a student.
Your love and dedication towards helping me reach my dreams are appreciated and have
not gone unnoticed.

DEVELOPMENT OF ESI-LC-MS METHOD FOR DRUG ANALYSIS
KIMBERLY YACOUB
ABSTRACT
Brain cancer, particularly astrocytomas, is one of the ten most common related
deaths related to cancer. Temozolomide (TMZ), an oral alkylating chemotherapy drug, is
used to treat anaplastic astrocytoma and glioblastoma multiforme. A few advantages of
TMZ are its ability to cross the blood-brain barrier, its small size, and it is rapidly
absorbed in the small intestine. Since this drug is advantageous to brain cancer patients, it
is important to study the extraction of this drug. In addition, it is important to study
administering this drug via microdialysis as the efficiency of the drug could increase.
In mice brain tumor tissue and lamb brain tissue, LC-MS was used to quantitate
TMZ. TMZ has been recovered from brain tissue using a strong cell lysis protease
(proteinase K) and protein precipitation using alcohol dehydration in order to increase
percent recovery of TMZ and decrease matrix effects.
Most research articles have studied the plasma or urine of mice to quantitate
TMZ. However, only a handful of studies focused on brain tumor tissue. Comparing with
another research article that studied the recovery of TMZ from mice brain tissue, this
method achieved higher percent recoveries of the chemotherapy drug, and lowered the
matrix effects.
iv
TABLE OF CONTENTS
ABSTRACT.................................................................................................................... iv
LIST OF TABLES ........................................................................................................ vii
LIST OF FIGURES ...................................................................................................... viii
CHAPTER
I. INTRODUCTION ....................................................................................1
1.1 Astrocytomas ................................................................................ 1
1.2 Glioblastoma Multiforme.............................................................. 2
1.3 Anaplastic Astrocytoma................................................................ 4
1.4 Temozolomide Background.......................................................... 5
1.5 Mechanism of Temozolomide ...................................................... 7
1.6 O6-methylguanine-DNA methyltransferase (MGMT) ................. 9
1.7 TMZ Pharmacokinetics and Stability ......................................... 10
1.8 Dacarbazine and TMZ ................................................................ 11
1.9 Rationale of the Work................................................................. 11
1.10 Solid Phase Extraction ................................................................ 13
1.11 Protein Precipitation.................................................................... 15
1.12 Comparing Solid Phase Extraction and Protein Precipitation .... 16
v
1.13 High-Performance Liquid Chromatography (HPLC) ................. 16
1.14 Mass Spectrometry (MS) ........................................................... 17
II. MATERIALS AND METHODS............................................................19
2.1 Chemicals and Solutions............................................................. 19
2.2 Sample Preparation ..................................................................... 19
2.3 Calibration Curve Standard Preparation ..................................... 20
2.4 HPLC-MS/MS Instrumentation .................................................. 21
2.5 HPLC-MS/MS Optimization Parameters ................................... 21
2.6 Optimizing ZipTip Conditions.................................................... 22
2.7 Optimizing Protein Precipitation ................................................ 23
III. RESULTS AND DISCUSSIONS............................................................ 26
3.1 Mass Spectrometry Infusion ....................................................... 26
3.2 Method Applicaton ..................................................................... 30
3.3 Recovery of TMZ and Theophylline ..........................................35
3.4 Matrix Effects .............................................................................36
IV. CONCLUSIONS...................................................................................... 37
4.1 Conclusions and Future Work ....................................................37
REFERENCES ...............................................................................................................38
vi

LIST OF TABLES
Table Page
I. Calibration Curve Standard Preparations for Lamb Brain...................................20
II. Optimized Parameters of TMZ and Theophylline (IS)........................................22
III. Varying Elution Mixtures for Optimization of ZipTips ......................................23
IV. Comparison of Goldwirt et al. Experimental Design for TMZ Extraction and This
Experimental Design for TMZ Extraction ..........................................................25
V. Percent Recoveries of TMZ .................................................................................35
VI. Matrix Effects ......................................................................................................36
vii

LIST OF FIGURES
Figure Page
1. Magnetic Resonance Image of Glioblastoma in the Cerebral Hemisphere ...........2
2. Chemical Structure of TMZ...................................................................................6
3. Mechanism of Action of TMZ and Methylation of Guanine.................................7
4. DNA Methylation ..................................................................................................8
5. MGMT Repairing O6-methylguanine Lesion ......................................................10
6. MRM Transition of TMZ.....................................................................................22
7. MRM Transition of IS .........................................................................................22
8. Expermiental Design of Cell Lysis and Protein Precipitation .............................24
9. Mass Spectrum of TMZ .......................................................................................27
10. CID of TMZ .........................................................................................................27
11. MRM Spectrum of TMZ......................................................................................28
12. Mass Spectrum of Theophylline ..........................................................................28
13. CID of Theophylline ............................................................................................29
14. MRM Spectrum of Theophylline.........................................................................29
15. Chromatogram of 30 mg Mice Brain Spiked with 10 ng/mL of TMZ and 50
ng/mL of IS .........................................................................................................30
viii
16. Chromatogram of 30 mg Mice Brain Spiked with 50 ng/mL of TMZ and
50 ng/mL of IS ....................................................................................................31
17. Chromatogram of 30 mg Mice Brain Spiked with 100 ng/mL of TMZ and
50 ng/mL of IS ...................................................................................................31
18. Chromatogram of 30 mg Mice Brain Spiked with 200 ng/mL of TMZ and
50 ng/mL of IS ...................................................................................................32
19. Chromatogram of 30 mg Mice Brain Spiked with 500 ng/mL of TMZ and
50 ng/mL of IS ...................................................................................................32
20. Chromatogram of 30 mg Mice Brain Spiked with 1000 ng/mL of TMZ and
50 ng/mL of IS ...................................................................................................33
21. Calibration Curve of 30 mg Mice Brain Spiked with Varying Amounts of TMZ
and 50 ng/mL IS (n=2 replicates). ......................................................................34
22. Calibration Curve of 30 mg Lamb Brain Spiked with Varying Amounts of TMZ
and 50 ng/mL IS (n=3 replicates). ......................................................................34
ix
CHAPTER I
INTRODUCTION
1.1 Astrocytomas
Astrocytomas are primary brain tumors and one of the ten most common cancer-
related deaths. Most primary brain tumors, including gliomas, originate from
neuroepithelial cells. If a tumor arises from supportive tissue of the brain, referred to as
glial, it is considered a glioma. Even though gliomas are rare, approximately 30-40% of
all brain tumors are gliomas and approximately 50% of gliomas are glioblastomas.1
Between 1-5% of gliomas are considered hereditary and a majority of gliomas
have unknown causes. Although these causes are unknown, a large risk factor can be
attributed to ionizing radiation. Middle-aged adults are most typically affected by
gliomas. The way that gliomas grow is by infiltrating into the brain, more specifically,
the white matter of the brain; therefore, they are not directly visible on the surface of the
brain. Most commonly in adults, gliomas can be found in the cerebral hemispheres
(Figure 1).1
1
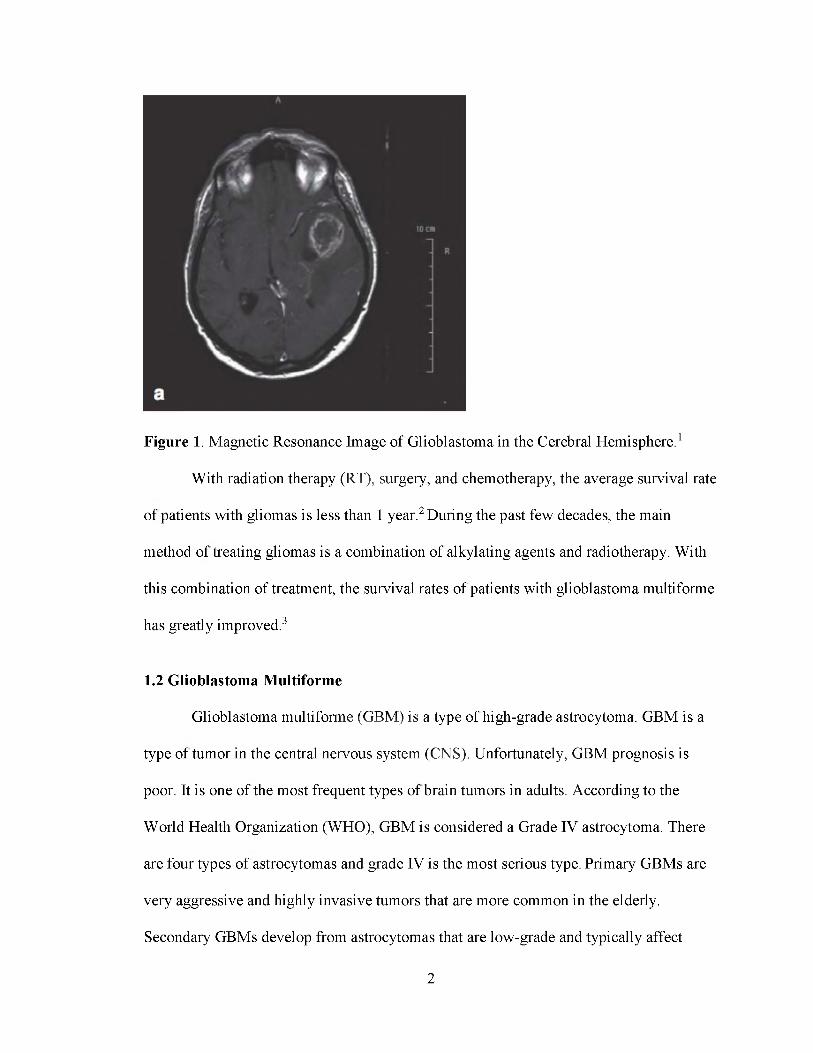
Figure 1. Magnetic Resonance Image of Glioblastoma in the Cerebral Hemisphere.1
With radiation therapy (RT), surgery, and chemotherapy, the average survival rate
of patients with gliomas is less than 1 year.2 During the past few decades, the main
method of treating gliomas is a combination of alkylating agents and radiotherapy. With
this combination of treatment, the survival rates of patients with glioblastoma multiforme
has greatly improved.3
1.2 Glioblastoma Multiforme
Glioblastoma multiforme (GBM) is a type of high-grade astrocytoma. GBM is a
type of tumor in the central nervous system (CNS). Unfortunately, GBM prognosis is
poor. It is one of the most frequent types of brain tumors in adults. According to the
World Health Organization (WHO), GBM is considered a Grade IV astrocytoma. There
are four types of astrocytomas and grade IV is the most serious type. Primary GBMs are
very aggressive and highly invasive tumors that are more common in the elderly.
Secondary GBMs develop from astrocytomas that are low-grade and typically affect
2

people who are less than 45 years of age. Primary GBMs are more common than
secondary GBMs and secondary GBMs have a much better prognosis than primary
GBMs. Histologically, these two tumors cannot be distinguished, but they evolve from
different genetic alterations.4 Since GBM cells grow invasively into normal brain tissue,
surgery is not possible for the resection of tumor cells.5 Not only is GBMs invasiveness a
factor in the inability to resect the tumor, but GBM tumors are also highly vascularized
making surgery impractical. The high vascularization of GBM tumors is due to the
overactive formation of new blood vessels also known as angiogenesis. The over
activation of these blood vessels is critical for supplying oxygen for tumor growth.4
The pathogenesis of GBM can be mainly attributed to an altered pathway that
involves receptor tyrosine kinases (RTKs), which are receptors located on the surface of
cells. Growth factors (GFs) are bound by RTKs through cross-linking. When cross
linking occurs, two adjacent receptors are dimerized, which then induces a
conformational change. Once a conformational change is induced, the kinase of RTK is
activated, which allows for cross-phosphorylation of tyrosine residues to prepare for
signaling cascades. One of these signaling cascades is epidermal growth factor receptor
(EGFR). EGFR is a transmembrane protein that plays a role in GBM pathogenesis.
EGFRs normally function by dividing and proliferating normal CNS cells. When there
are genetic mutations, EGFR is overexpressed. Thus, this leads to increased activity of
phosphorylation and proliferation of oncogenic cells.4
Not only are RTK pathways altered, but the Ras pathway is too. Ras is a
guanosine-binding protein (G protein). When bound to GDP, Ras is in an inactive state.
When bound to GTP, Ras is in an active state (Ras-GTP). Ras-GTP leads to advancement
3
through the cell cycle, a cascade of downstream effectors, and survival. Like EGFR,
when there is an interaction with RTK and GF, there is a signaling cascade. PI3K,
phosphoinositide 3-kinase, moves to the cell membrane. Once this occurs, a secondary
messenger PIP3, phosphatidylinositol trisphosphate, is created. PI3K-Akt pathway
activation leads to proliferation, survival, and angiogenesis of cells.4
The symptoms of GBM vary based on the location of the tumor. Some of these
symptoms are persistent headaches, double/blurred vision, nausea, vomiting, loss of
appetite, changes in mood/personality, changes in ability to think and learn, loss of
memory, new onset of seizures, muscle weakness, and speech difficulty. GBM, which
may appear on any lobe of the brain, most commonly appears on the frontal and temporal
lobes.6
1.3 Anaplastic Astrocytoma
Like GBM, anaplastic astrocytoma (AA) is a type of high-grade astrocytoma in
the CNS, but it is rare.7 AAs comprise about 30% of all astrocytomas and 7% of all
primary brain tumors in adults.8, 9 AA is considered a grade III astrocytoma according to
the WHO. Over time, AA can develop into a higher grade astrocytoma, or GBM.7 The
typical treatment plan for patients with AA is to maximally and safely resect the tumor,
and then further treat the tumor with RT. The combination of surgery and RT has been
associated with longer survival periods.9 AAs are most frequently found in the frontal
lobe of the brain. Some prognostic factors that influence survival are Karnofsky
performance score (KPS), amount of tumor resected, as well as the age of the patient at
diagnosis.10 The KPS method was first introduced in 1949. It is a widely used method in
order to determine the functional status of a patient on an 11-point scale with percentages
4

ranging from 100% (no symptoms) to 0% (death of patient).11 There is no link between
AAs and familial inheritance, and in most cases the cause is unknown. AAs, like other
cancers, are believed to occur due to factors such as genes and environment. In addition,
there is a higher chance of developing AA if a patient has inherited disorders such as
neurofibromatosis type I, Li-Fraumeni syndrome, tuberous sclerosis and Turcot
syndrome.12
Like GBM, the symptoms of AA are dependent upon the location of the tumor in
the brain. Some common symptoms include headaches, lethargy or drowsiness, vomiting,
changes in personality and mental status, seizures, vision problems, and weakness of the
arms and legs resulting in coordination difficulties.7
1.4 Temozolomide Background
The aim of this thesis is to develop a quantification method for the
pharmacokinetic analysis of injecting temozolomide (TMZ) in the brain directly to target
the drug to the tumor cells. Previous research has studied the concentration of TMZ in
mice plasma; however, only a handful of studies have studied the concentration of TMZ
in brain tissue. None have studied the effect of TMZ injected directly into the brain.
Thus, the significance of this research is imperative to study the effects of TMZ in
patients with GBM and AA to target the drug specifically to the tumor in the brain. One
study attempted to create a pharmacokinetic model to determine the amount of TMZ that
reaches brain tumors. Zhou et al. determined that the concentration of TMZ varied with
changes in blood-brain barrier permeability as well as tumor blood volume.13 Therefore,
studying the recovery of TMZ injected in mice brain and developing a method is
imperative in attempting to increase the pharmacokinetics of TMZ in patients.
5

In the early 1980s, Robert Stone chemically synthesized TMZ at Ashton
University. TMZ is a unique compound since it contains three adjacent nitrogen atoms, as
shown in Figure 2. Prior to synthesizing TMZ, other compounds were synthesized that
only contained two adjacent nitrogen atoms; however, TMZ had far greater cytotoxicity
when compared to the other drugs. Not only was TMZ more cytotoxic, but it was more
effective than compounds with two adjacent nitrogen atoms.2
TMZ is an alkylating imidazotetrazine chemotherapy pro-drug approved by the
Food and Drug Administration (FDA) as a first-line treatment for GBM and a second-line
treatment for AA.2 The International Union of Pure and Applied Chemistry (IUPAC)
name for TMZ is 3-methyl-4-oxoimidazo [5,1-d][1,2,3,5] tetrazine-8-carboxamide.14 It is
typically administered orally and is rapidly absorbed in the small intestine. Before the
synthesis of TMZ as an oral pill, it was administered intravenously. TMZ has a molecular
weight of 194.154 g/mol and a molecular formula of C6H6N6O2. TMZ is stable at a pH
less than 5 and it is labile at physiological pH. As TMZ is a pro-drug, its mechanism of
action is through conversion to an active form at physiological pH.14, 15
6
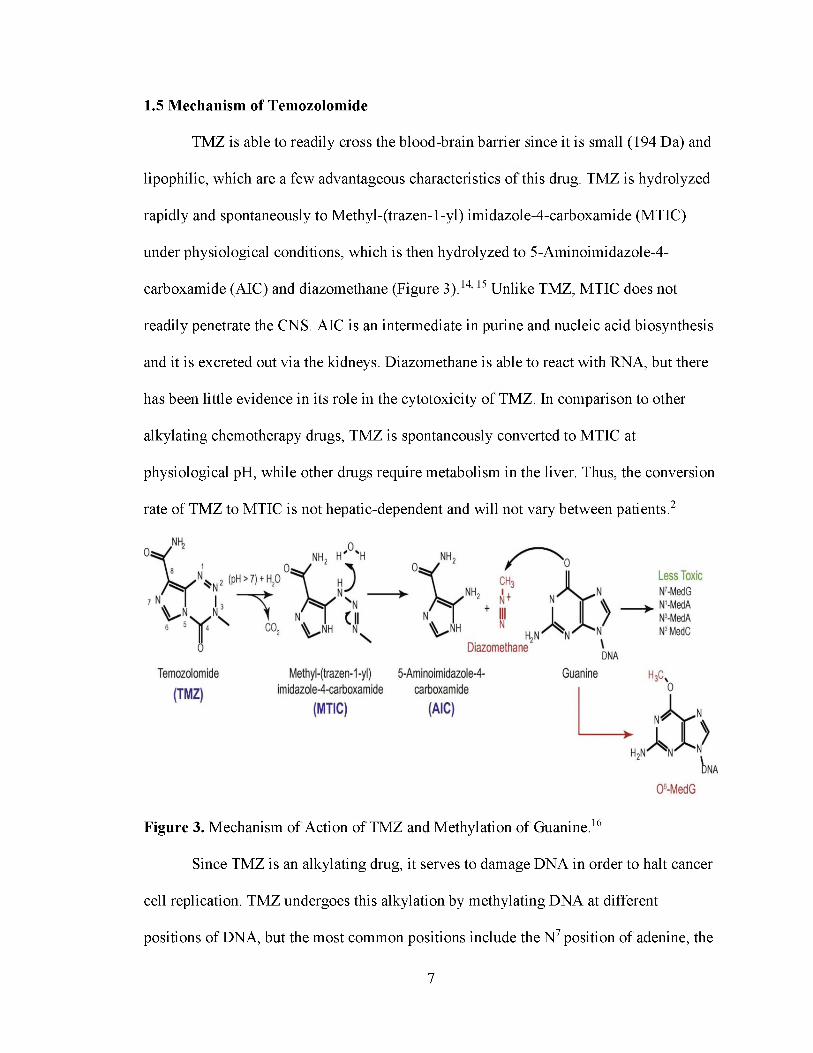
1.5 Mechanism of Temozolomide
TMZ is able to readily cross the blood-brain barrier since it is small (194 Da) and
lipophilic, which are a few advantageous characteristics of this drug. TMZ is hydrolyzed
rapidly and spontaneously to Methyl-(trazen-1-yl) imidazole-4-carboxamide (MTIC)
under physiological conditions, which is then hydrolyzed to 5-Aminoimidazole-4-
carboxamide (AIC) and diazomethane (Figure 3).14, 15 Unlike TMZ, MTIC does not
readily penetrate the CNS. AIC is an intermediate in purine and nucleic acid biosynthesis
and it is excreted out via the kidneys. Diazomethane is able to react with RNA, but there
has been little evidence in its role in the cytotoxicity of TMZ. In comparison to other
alkylating chemotherapy drugs, TMZ is spontaneously converted to MTIC at
physiological pH, while other drugs require metabolism in the liver. Thus, the conversion
rate of TMZ to MTIC is not hepatic-dependent and will not vary between patients.2
Figure 3. Mechanism of Action of TMZ and Methylation of Guanine.16
Since TMZ is an alkylating drug, it serves to damage DNA in order to halt cancer
cell replication. TMZ undergoes this alkylation by methylating DNA at different
positions of DNA, but the most common positions include the N7 position of adenine, the
7
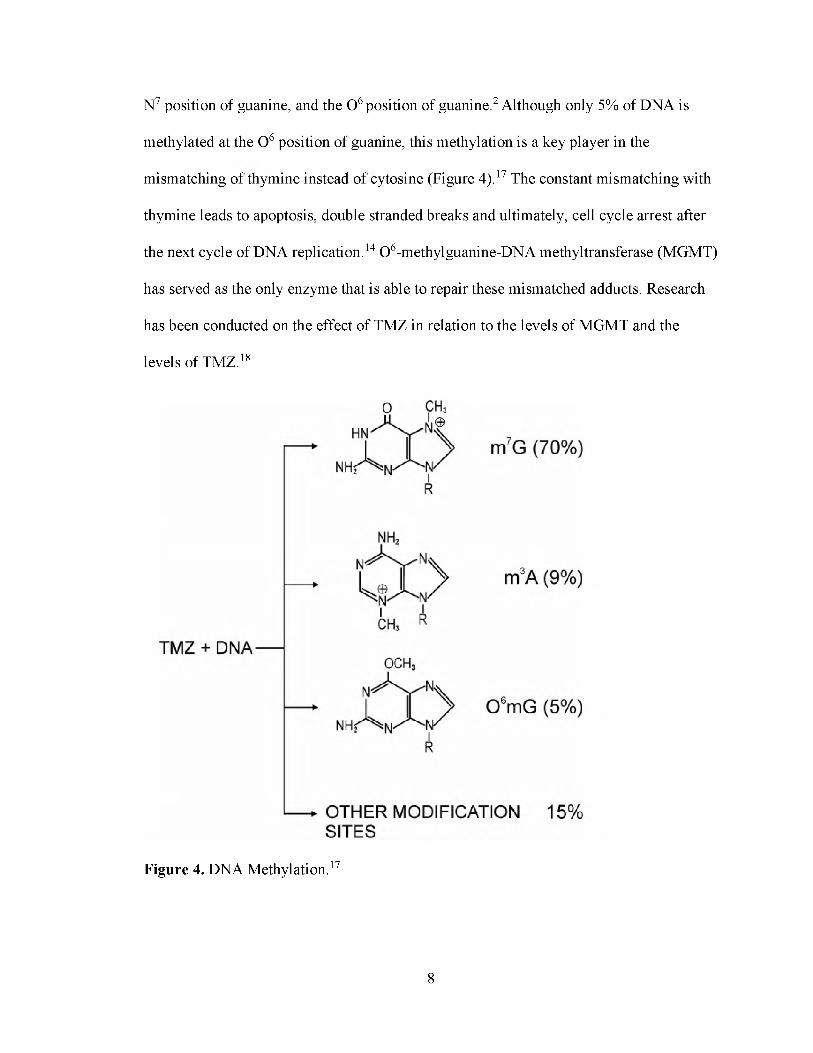
N7 position of guanine, and the O6 position of guanine.2 Although only 5% of DNA is
methylated at the O6 position of guanine, this methylation is a key player in the
mismatching of thymine instead of cytosine (Figure 4).17 The constant mismatching with
thymine leads to apoptosis, double stranded breaks and ultimately, cell cycle arrest after
the next cycle of DNA replication.14 O6-methylguanine-DNA methyltransferase (MGMT)
has served as the only enzyme that is able to repair these mismatched adducts. Research
has been conducted on the effect of TMZ in relation to the levels of MGMT and the
levels of TMZ.18
Figure 4. DNA Methylation.17
8

1.6 O6-methylguanine-DNA methyltransferase (MGMT)
MGMT is a human protein that is critical for the stability of DNA. The DNA
repair protein is 354 amino acids long with a molecular mass of 39 kDa.19 It is encoded
by chromosome 10q26.14 MGMT is considered a "suicide enzyme" since it is able to
irreversibly inactivate itself.19 Low MGMT levels, since it is a repair enzyme, correlate
with higher efficiency of TMZ.18 A number of studies have correlated the inverse
relationship between levels of TMZ and MGMT.20
Since TMZ serves to halt the proliferation of cancer cells by mismatching DNA
adducts, repairing O6-methylguanine is not ideal for oncogenic cells. The purpose of
MGMT is to serve as a DNA repair enzyme, which hinders the effects of TMZ. MGMT
is able to repair the O6-methylguanine lesions by transferring an alkyl group from
guanine to cysteine via acid catalysis allowing the protein to bind the methyl and cleave
the ether bond (Figure 5).9 Methylation of MGMT has led to improved survival in
patients who were treated in combination with RT and TMZ. Although it is important to
recognize that tumor cells should have depleted levels of MGMT to increase the
efficiency of TMZ, MGMT is also depleted in normal cells, which unfortunately leads to
hematologic toxicity.3
9

Figure 5. MGMT Repairing O6-methylguanine Lesion.19
1.7 TMZ Pharmacokinetics and Stability
As stated previously, TMZ is rapidly absorbed in the small intestine.
Consumption of food does delay the absorption of TMZ; however, the delay has been
found to be clinically insignificant. The concentration of TMZ in plasma reaches its peak
1 hour after administration, and then decreases slowly. According to a clinical study, it
was determined that the average maximum concentration of TMZ in the brain interstitium
was 2 hours after administration. This clinical study concluded that levels of TMZ in the
brain interstitium gradually rise over time and stayed at higher levels longer than plasma
levels of TMZ.21 In another study, it was determined that the maximum concentration of
TMZ in the brain is reached at 0.75 hours.22 Although this is different from the first
study, both of these studies concluded that the maximum concentration of TMZ in brain
occurs later than the maximum concentration of TMZ in plasma and the levels of TMZ in
brain stayed higher for longer periods of time. The maximum concentration time
differences may be attributed to the routes of administration, as well as the subjects. The
10
first study administered TMZ orally in humans, while the second study administered
TMZ intraperitoneally in mice.
The stability of TMZ in human plasma has been studied extensively. The half-life
of TMZ in vitro is 2.4 hours. At three different concentrations (0.2, 1.5, and 15 μg∕mL),
TMZ was stable at a pH < 4 using phosphoric acid for approximately 24 hours at room
temperature (25°C). In addition, TMZ was found to be stable at a pH < 4 at -20°C for at
least 30 days at the same three concentrations.23
1.8 Dacarbazine and TMZ
Dacarbazine (DTIC), like TMZ, is a chemotherapy drug administered
intravenously to treat Hodgkin lymphoma, melanoma and soft tissue sarcoma. DTIC was
approved by the FDA in the mid-1970s. Like TMZ, DTIC is also a pro-drug that is
converted to MTIC. The primary difference between TMZ and DTIC is that DTIC is
converted in the liver, while TMZ is spontaneously converted at physiological pH. TMZ
was introduced as an alternative to DTIC because of its potential as an antitumor agent
and the fact that preclinical assessments found it to be a safer drug. Not only is TMZ
safer; however, it is more convenient as it can be administered orally, while DTIC is
administered intravenously.23 TMZ also has extensive tissue distribution when compared
to DTIC.23, 24
1.9 Rationale of the Work
A number of research papers have focused on determining the amount of TMZ
found in the plasma matrix. However, very few have focused solely on brain tumor
tissue; therefore, we have studied TMZ extraction procedures in mice brain tumor tissue.
The problems with the extraction of TMZ from plasma have been low extraction yields
11
and time-consuming repetitive solvent extractions.20 The problems with the extraction of
TMZ from brain tumor tissue have also been low extraction yield, as well as high matrix
effects due to the high amounts of biological matrices found in brain.25 It is worthy to
note that mice brain contain between 45.0-20.1 mg/g of phospholipids, 105.8-107.4 mg/g
of proteins and 14.1-20.1 mg/g of cholesterol between ages 3 months to 26 months to
assist in the reduction of matrix effects.26 Therefore, studying the method development
for the injection of the drug directly targeted to the brain tumor is of utmost importance.
The two main goals of this research were to develop a method that increased the
extraction efficiency of TMZ in brain and to decrease matrix effect signaling. It is known
that TMZ can readily cross the blood-brain barrier if administered orally or
intravenously, but studying the administration of TMZ targeted directly to the brain
tumor is critical to improve the efficiency of TMZ in treating brain cancers. When
determining the most useful preparation techniques for this research, two other papers
were taken into consideration.
Goldwirt et al. were one of the few researchers to recover TMZ from brain tissue.
A number of studies researched TMZ in plasma; however, recovering the drug from brain
tissue has rarely been studied. Goldwirt et al. used small slices of mice brain (400 mg).
The brain cells were lysed with 200 μL of ammonium acetate 10 mM pH 3.5 buffer and
the proteins were precipitated using 200 μL of 100 mM zinc sulfate and 400 μL of
methanol in order to extract the TMZ from mice brain that was administered
intraperitoneally. Their results were found to be precise, accurate, and specific with low
limits of detection on UPLC-MS both intra- and inter-day. For brain, the extraction
recovery of TMZ was 67.7% for 125 ng/g, 61.0% for 1250 ng/g, and 61.4% for 12,500
12

ng/g. The matrix effect was 245% for 125 ng/g, 204% for 1250 ng/g, and 212% for
12,500 ng/g. The matrix effects were very high as expected for brain tissue due to
phospholipids and a number of unwanted biological matrices.22 Therefore, to improve
this method, a stronger lysis buffer was used along with better protein precipitation
solvents.
Shen et al. quantified TMZ in human plasma and urine using HPLC-UV. The
difference in techniques between the two papers is that Shen et al. used solid-phase
extraction (SPE) to eliminate interfering material from the biological matrices. Their
results were found to be accurate and precise for both urine and plasma intra- and inter
day. The extraction recovery of TMZ ranged between 86.0-90.0% for plasma and 102.5
104.8% for urine. When using SPE, multiple solvent extractions could be avoided and
higher extraction recovery of TMZ is possible when compared to liquid-liquid
extraction.20 Therefore, to extract TMZ from mice brain, ZipTips were attempted in order
to recover the drug and remove unwanted biological matrices.
1.10 Solid Phase Extraction
There are a number of different techniques to prepare samples before injection
into an LC-MS such as liquid-liquid extraction and protein precipitation. The reason that
cleaning biological samples before injection into HPLC is important is because high
protein concentration leads to a decrease in the longevity of the column, inability to
separate, and a build-up of column backpressure. High protein samples injected directly
in the HPLC will contaminate the system leading to electrospray instability as well as a
reduction in sensitivity. The single most used technique is solid-phase extraction (SPE)
13

since it is able to cleanup samples, it has high throughput, extraction reproducibility, and
short sampling times.27
The purpose of SPE is to desalt, fractionate, and purify sample before analysis for
the best quality. In SPE, much like liquid chromatography, different materials will have
different affinities with the stationary phase. Thus, either the impurities that are unwanted
from the sample, or the analytes in the sample are bound to the stationary phase leading
to the separation of wanted and unwanted sample compounds. If the wanted sample
compounds are in the mobile phase that passes through the stationary phase, then this is
injected into the LC-MS. If the wanted sample compounds bind to the stationary phase,
then the mobile phase is discarded and the analytes are eluted from the stationary phase.
The eluent is then injected into the LC-MS.28 There are different means to perform SPE,
such as normal-phase, reverse-phase, ion exchange, and cartridges. The type of SPE that
was attempted to separate biological matrices from brain tissue and TMZ in this research
was ZipTip.
ZipTip is a small-scale reverse-phase separation technique that is packed with
resin at the end of a 10 μL pipet tip. The resin beads serve to desalt small amounts of
peptides. There are different ZipTips, such as C4 and C18. C18 is more hydrophobic and C4
is less hydrophobic. The carbon chains are on the surface of silica beads. SPE consists of
five simple steps: wetting, conditioning, sample loading, washing, and eluting. The initial
wetting step requires using a water-miscible organic solvent, such as methanol. Then, the
conditioning step requires using a water of aqueous buffer that is able to displace the
organic solvent in the pores. The sample is then loaded and the compounds that are
attracted to the stationary phase of the ZipTip will bind. Then, the compounds that did
14
not bind to the stationary phase are washed away with an aqueous solvent. The sample is
then eluted from the stationary phase for injection into HPLC.28 SPE may give low
recovery of the analyte. If there is low recovery in SPE, the reasoning could be due to the
use of incorrect conditioning, strong loading and wash solvent, large volume of sample
loading, or too weak or too small elution mobile phase volume.27
1.11 Protein Precipitation
Protein precipitation is a very common technique that was discovered by Franz
Hofmeister over 120 years ago. Protein precipitation occurs via hydrophobic aggregation.
The proteins can precipitate in two ways. First, the folded structure of proteins can be
slightly disrupted thereby exposing more of the hydrophobic interior of proteins.
Therefore, the proteins begin to aggregate towards one another and the amount of water
per protein decreases. Second, the water molecules that begin to form over hydrophobic
areas on proteins that are folded correctly can be dehydrated.29
Salts maintain large and stable solvent shells so salts have high protein
precipitation abilities. The surface tension of the solution is then increased thereby
increasing the hydrophobic effect. Thus, proteins that have a larger amount of
hydrophobic surface character are able to precipitate at lower salt concentrations. Organic
solvents, such as ethanol and trifluoroacetic acid, can partially denature proteins and in
effect, expose more hydrophobic surfaces of the solvents. Since this research focused on
removing proteins, the possible denaturation of proteins did not deter from the use
organic solvents.29
15
1.12 Comparing Solid Phase Extraction and Protein Precipitation
Using the research methods Shen et al. used for extracting TMZ from plasma and
urine, solid phase extraction using C18 ZipTips were conducted to remove phospholipids
and unwanted biological matrices from the brain. Focusing on mice brain tissue, Goldwirt
et al. used ammonium acetate 10 mM pH 3.5 buffer to lyse the cells and zinc sulfate and
methanol to precipitate proteins to extract TMZ. Protein precipitation is a common
hydrophobic aggregation method. Protein precipitation is achieved by lowering the
solubility of the solute by reducing the hydration layer in order to decrease the likelihood
of protein aggregation.29 To compare, this research compared trifluoroacetic acid and
ethanol to precipitate proteins to recover TMZ. To further this, proteinase K was used to
digest the unwanted proteins in biological samples and lyse the cells to recover TMZ with
a higher recovery. Therefore, this research compared SPE to protein precipitation
solvents in order to successively extract TMZ from brain tissue.
1.13 High-Performance Liquid Chromatography (HPLC)
HPLC is a widely used separation technique of mixtures on the basis of molecular
structure and composition. Specifically, reverse-phase liquid chromatography is most
used as it can separate a large variety of different molecules. HPLC consists of a mobile
phase and a stationary phase. The specific column used was a C18, which is a reversed
phase column. In reversed phase chromatography, there is strong attraction between the
polar solvent and polar molecules in the mixture being passed through the column, which
is the mobile phase. The stationary phase is the hydrocarbon chains of the column (C18).
Therefore, polar molecules of the sample will be attracted to the solvent. On the other
hand, non-polar molecules in the sample will be attracted to the stationary phase, which
16

are the hydrocarbons of the column. Due to these interactions, the polar compounds will
elute quicker leading to chromatographic separation. HPLC is different from column
liquid chromatography because the high pressures allow for a much quicker separation.
Some of the fixed chromatographic conditions include flow rate, temperature, and the
column. Quantitative analysis of HPLC can be determined by taking the area under the
peak, which is proportional to the concentration of the sample. Qualitative analysis can
be determined by comparing retention times of standards and samples. The advantages of
HPLC are sensitivity, accurate quantitative analysis, ease of automation, stability of
separating non-volatile species or thermally fragile ones, and applicability to substances
important to industry. 30, 31
1.14 Mass Spectrometry (MS)
Mass spectrometry is a multi-purpose analytical technique in chemistry. MS can
aid in the identification of compounds that are unknown in a sample, determine the
concentration of known materials, and determine the structure and chemical properties of
different molecules. First, gas phase ions of the compound are produced through electron
ionization. The molecular ion then fragments. From the molecular ion, every primary
product ion fragments and this continues. In the mass spectrometer, the ions are separated
based on the mass-to-charge ratio (m/z) and are detected relative to their abundance. If
present in a pure compound, the molecular ion appears at the highest value of m/z, which
provides the molecular mass of the compound.32
The MS is composed of three key components- ion source, analyzer, and detector
system. The purpose of the ion source is to produce gaseous ions of the sample. The
purpose of the analyzer is to sort ions into their specific mass components according to
17

their m/z ratio. Finally, the purpose of the detector system is to detect the ions and record
the relative abundance of every individual resolved ionic species.32 Therefore, LC-MS
was used in this research due to sensitivity and selectivity.
18

CHAPTER II
MATERIALS AND METHODS
2.1 Chemicals and Solutions
Temozolomide (>98%), anhydrous theophylline (≥99%), methanol (≥99.9%),
ethanol (≥99.5%) and ammonium acetate (≥99%) were purchased from Sigma Aldrich
(St. Louis, MO). Water was purified using the Millipore Milli-Q system (Milford, MA,
USA). Formic acid was purchased from Fluka and proteinase K was purchased from
Qiagen. Acidic methanol was prepared by taking 10 mL of 10 mM ammonium acetate
diluted to 50 mL with methanol (20:80, v/v).
2.2 Sample Preparation
Two groups of four mice brain tumor tissues were provided. Four mice were
injected with 0.9375 mg of TMZ while the other four were injected with saline solution.
The mice were sacrificed 12 hours post injection and the brains were resected then sliced
in half for a total of 16 samples. The brain samples were collected and kept at -80°C until
use. The brain tissues were thinly sliced with a razor blade and weighed to 30 mg.
19
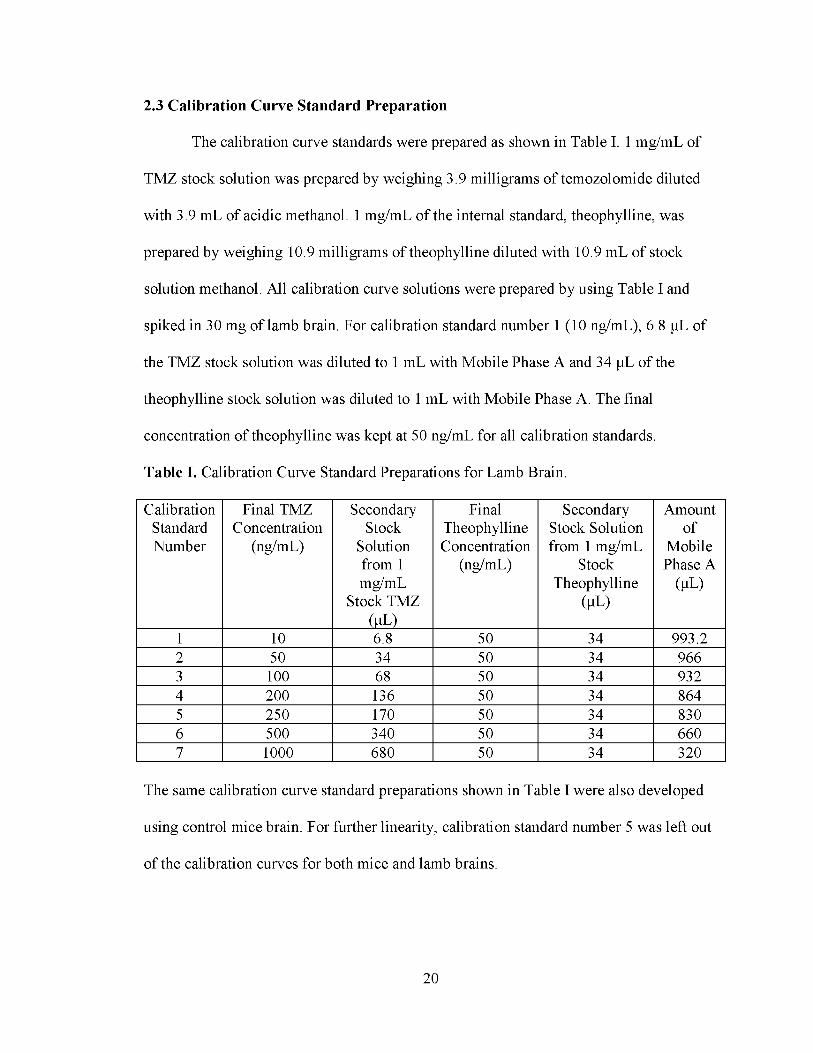
2.3 Calibration Curve Standard Preparation
The calibration curve standards were prepared as shown in Table I. 1 mg/mL of
TMZ stock solution was prepared by weighing 3.9 milligrams of temozolomide diluted
with 3.9 mL of acidic methanol. 1 mg/mL of the internal standard, theophylline, was
prepared by weighing 10.9 milligrams of theophylline diluted with 10.9 mL of stock
solution methanol. All calibration curve solutions were prepared by using Table I and
spiked in 30 mg of lamb brain. For calibration standard number 1 (10 ng/mL), 6.8 μL of
the TMZ stock solution was diluted to 1 mL with Mobile Phase A and 34 μL of the
theophylline stock solution was diluted to 1 mL with Mobile Phase A. The final
concentration of theophylline was kept at 50 ng/mL for all calibration standards.
Table I. Calibration Curve Standard Preparations for Lamb Brain.
CalibrationStandardNumber
Final TMZ Concentration
(ng/mL)
Secondary Stock
Solution from 1 mg/mL
Stock TMZ (μL)
FinalTheophyllineConcentration
(ng/mL)
Secondary Stock Solution from 1 mg/mL
StockTheophylline
(μL)
Amountof
Mobile Phase A
(μL)
1 10 6.8 50 34 993.22 50 34 50 34 9663 100 68 50 34 9324 200 136 50 34 8645 250 170 50 34 8306 500 340 50 34 6607 1000 680 50 34 320
The same calibration curve standard preparations shown in Table I were also developed
using control mice brain. For further linearity, calibration standard number 5 was left out
of the calibration curves for both mice and lamb brains.
20
2.4. HPLC-MS/MS Instrumentation
The instrumentation used was a Shaimadzu HPLC system (Kyoto, Japan) coupled
to an AB SCIEX Q-Trap 5500 triple quadropole mass spectrometer (MS) with Analyst
software Version 1.6.1. The HPLC was composed of a solvent reservoir, a degassing unit
(DGU-20A3R), a binary pump (LC-30AD), a flow controller (CBM-20A), a column
oven (CTO-10A) and an autosampler (SIL-30AC).
2.5 HPLC-MS/MS Optimization Parameters
High-performance liquid chromatographic separation was carried using a Waters
Symmetry C18 column (2.1 mm x150 mm, 5 μm). The oven temperature was 30°C, the
injection volume was 10 μL, while the flow rate was kept at 0.4 mL/min. Mobile phase A
consisted of 10 mM ammonium acetate in ultrapure water and 0.1% formic acid. Mobile
phase B consisted of 100% methanol. The chromatographic system was run on a linear
gradient from 5 to 30% Mobile Phase B for 6 minutes then increased to 90% and
decreased to 5% for 2 minutes.
The mass spectrometer was operated in multiple reaction monitoring (MRM)
positive-ion mode. High purity nitrogen (99.99%) was used as the nebulizer, auxiliary,
collision and curtain gases. The MRM transition of TMZ was m/z 195.1 → 138.1 and for
theophylline it was m/z 181.0 → 124.1 as shown in Figures 6 and 7 respectively.
21

Table II shows the optimized detection parameters of the mass spectrometer for
temozolomide and theophylline.
Table II. Optimized Parameters of TMZ and Theophylline (IS).
Analyte CurtainGas
IonSprayVoltage
Temperature IonSource Gas 1
IonSource Gas 2
DeclusteringPotential
EntrancePotential
TMZ 30.0psi
5500 V 100°C 10 psi 10 psi 150 V 10 V
IS 30.0psi
4000 V 100°C 10 psi 10 psi 150 V 10 V
2.6 Optimizing ZipTip Conditions
As TMZ is slightly soluble in water, C18 ZipTips Millipore were used. The
wetting solvent was 50% methanol in 0.1% formic acid, and the conditioning and
washing solvent was 0.1% formic acid. The loading sample consisted of 1 μL of 50
μg∕mL of TMZ, 1 μL of 50 μg∕mL of IS and 58 μL of Mobile Phase A. The elution
solvents consisted of a varying mixture of Mobile Phases A and B (Table III). The elution
22
samples were further diluted so that the final amount of methanol injected in the LC/MS
was 5%.
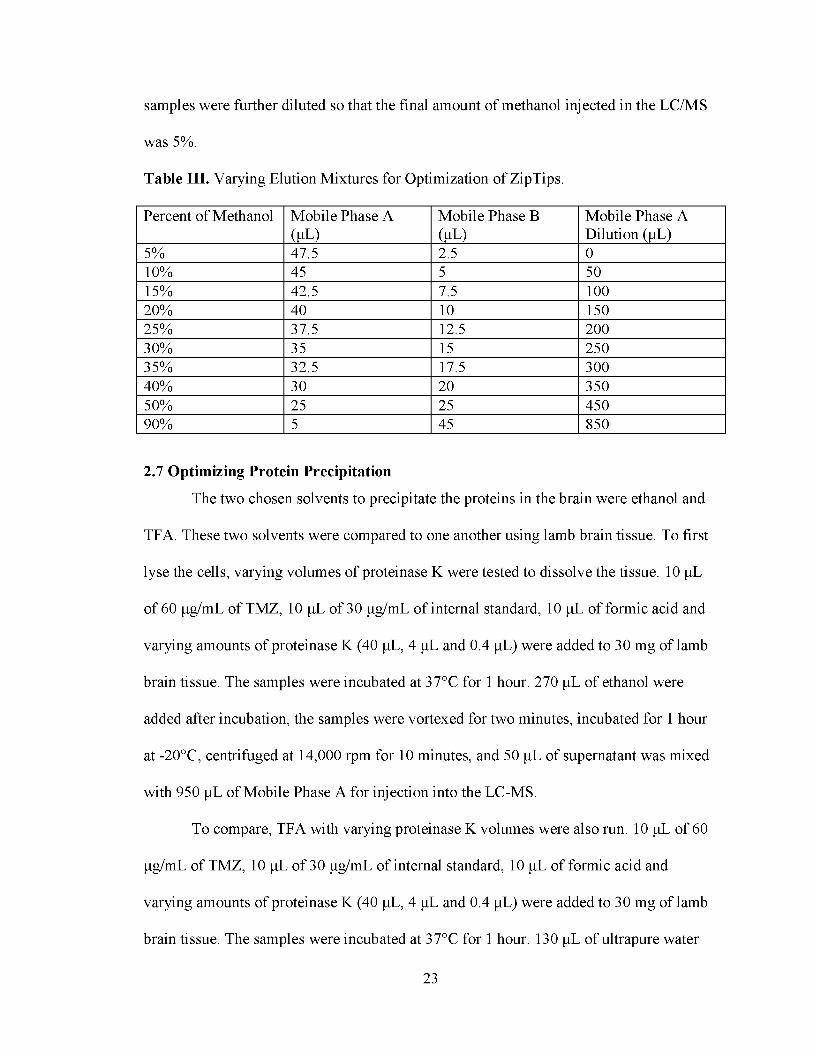
Table III. Varying Elution Mixtures for Optimization of ZipTips.
Percent of Methanol Mobile Phase A (ul)
Mobile Phase B (ul)
Mobile Phase A Dilution (μL)
5% 47.5 2.5 010% 45 5 5015% 42.5 7.5 10020% 40 10 15025% 37.5 12.5 20030% 35 15 25035% 32.5 17.5 30040% 30 20 35050% 25 25 45090% 5 45 850
2.7 Optimizing Protein PrecipitationThe two chosen solvents to precipitate the proteins in the brain were ethanol and
TFA. These two solvents were compared to one another using lamb brain tissue. To first
lyse the cells, varying volumes of proteinase K were tested to dissolve the tissue. 10 μL
of 60 μg/ml. of TMZ, 10 μL of 30 μg/ml. of internal standard, 10 μL of formic acid and
varying amounts of proteinase K (40 μL, 4 μL and 0.4 μL) were added to 30 mg of lamb
brain tissue. The samples were incubated at 37°C for 1 hour. 270 μL of ethanol were
added after incubation, the samples were vortexed for two minutes, incubated for 1 hour
at -20°C, centrifuged at 14,000 rpm for 10 minutes, and 50 μL of supernatant was mixed
with 950 μL of Mobile Phase A for injection into the LC-MS.
To compare, TFA with varying proteinase K volumes were also run. 10 μL of 60
Lg/ml of TMZ, 10 μL of 30 Lg/ml of internal standard, 10 μL of formic acid and
varying amounts of proteinase K (40 μL, 4 μL and 0.4 μL) were added to 30 mg of lamb
brain tissue. The samples were incubated at 37°C for 1 hour. 130 μL of ultrapure water
23
and 40 μL of trifluoroacetic acid (TFA) were added after incubation, the samples were
vortexed for two minutes, incubated for 1 hour at 4°C, centrifuged at 14,000 rpm for 10
minutes, and 50 μL of supernatant was mixed with 900 μL of Mobile Phase A and 50 μL
of methanol for injection into the LC-MS. As ethanol had greater recovery when
compared to TFA, ethanol was the chosen protein precipitation solvent. In addition, 40
uL of proteinase K dissolved the tissue best when compared to the other volumes. The
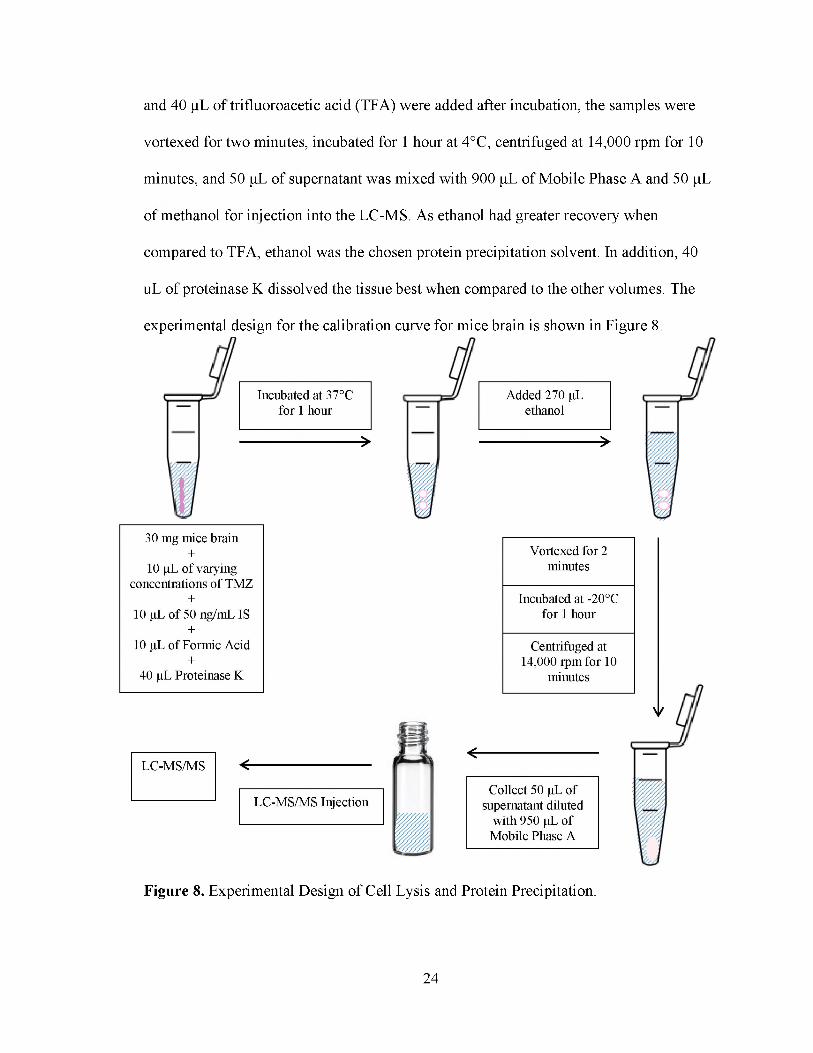
experimental design for the calibration curve for mice brain is shown in Figure 8.
Figure 8. Experimental Design of Cell Lysis and Protein Precipitation.
24
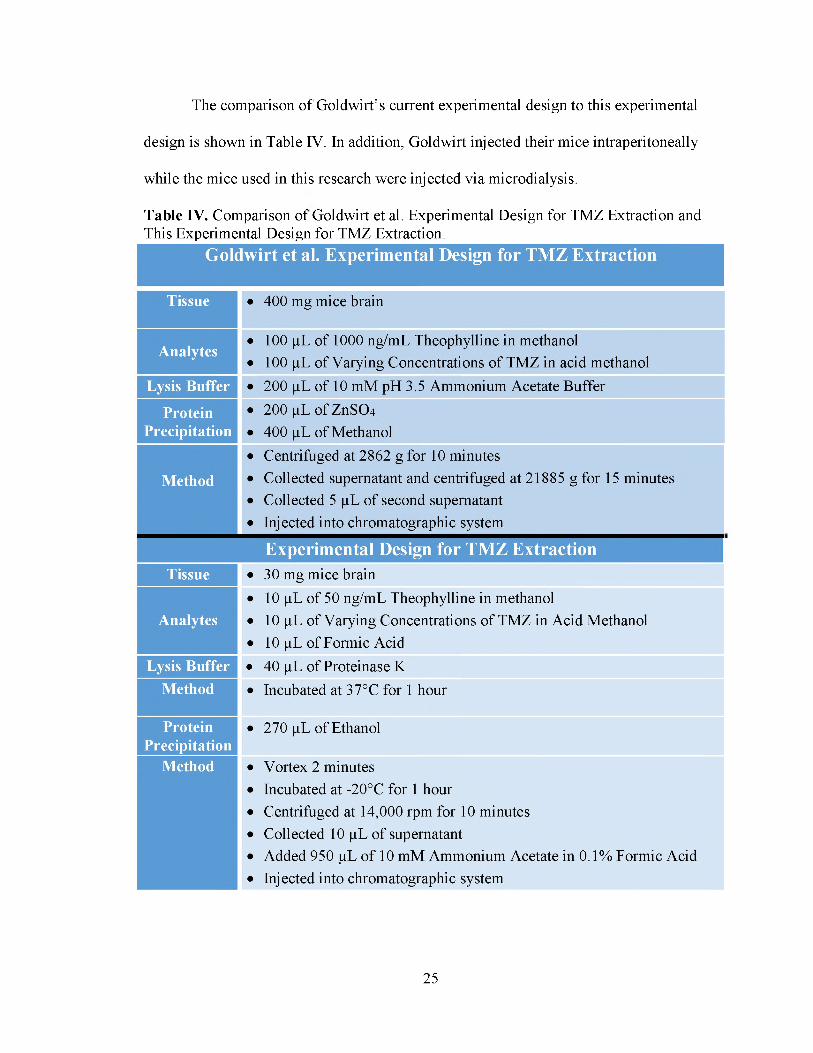
The comparison of Goldwirt's current experimental design to this experimental
design is shown in Table IV. In addition, Goldwirt injected their mice intraperitoneally
while the mice used in this research were injected via microdialysis.
Table IV. Comparison of Goldwirt et al. Experimental Design for TMZ Extraction and This Experimental Design for TMZ Extraction.
25

CHAPTER III
RESULTS AND DISCUSSIONS
3.1 Mass Spectrometry Infusion
For TMZ, MS infusion was done by injecting 1 Lg/mL of TMZ in acidic
methanol. The chromatograms for MS, CID and MRM are shown in Figures 9-11. The
mass spectrum showed the precursor of TMZ to be 195.1. The collision-induced
dissociation (CID) showed the product ion of TMZ to be 138.1. The MRM showed the
unique fragmentation ion for TMZ used for quantification.
For theophylline, MS infusion was done by injecting 1 Lg/mL of theophylline (IS)
in methanol. The chromatograms for MS, CID and MRM are shown in Figures 12-14.
The mass spectrum showed the precursor of IS to be 181.0. The collision-induced
dissociation (CID) showed the product ion of IS to be 124.1. The MRM showed the
unique fragment ion for theophylline.
26
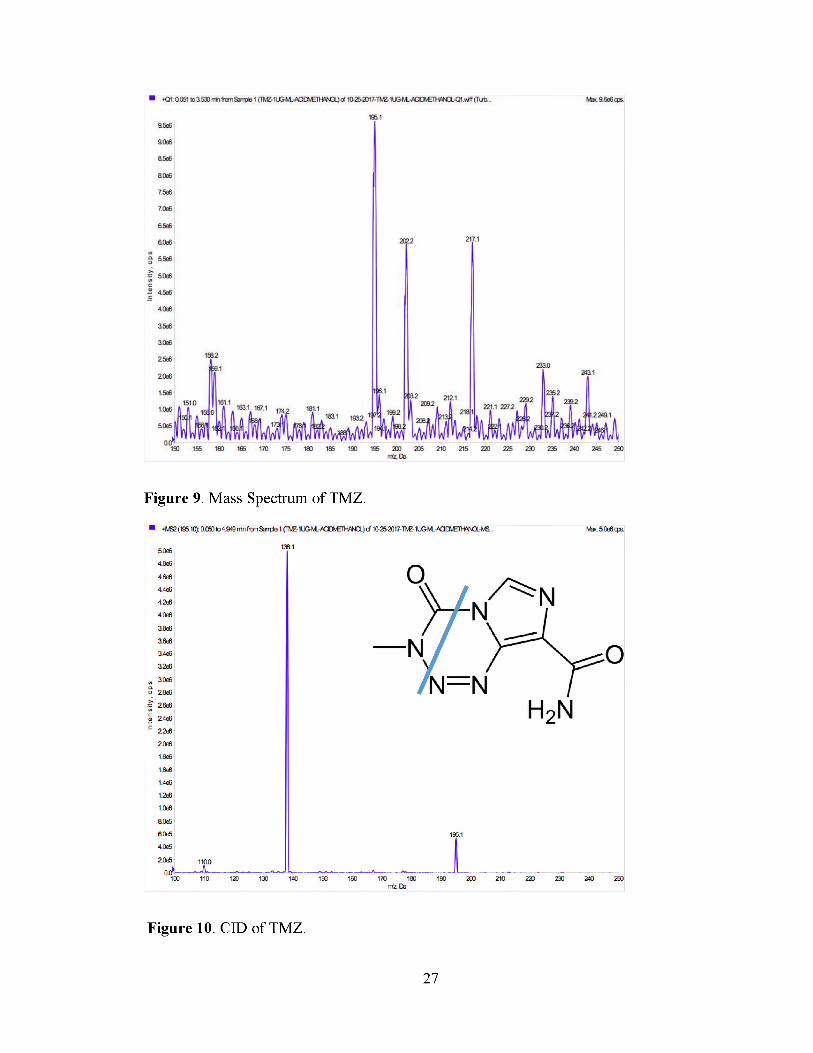
Figure 9. Mass Spectrum of TMZ.
Figure 10. CID of TMZ.
27
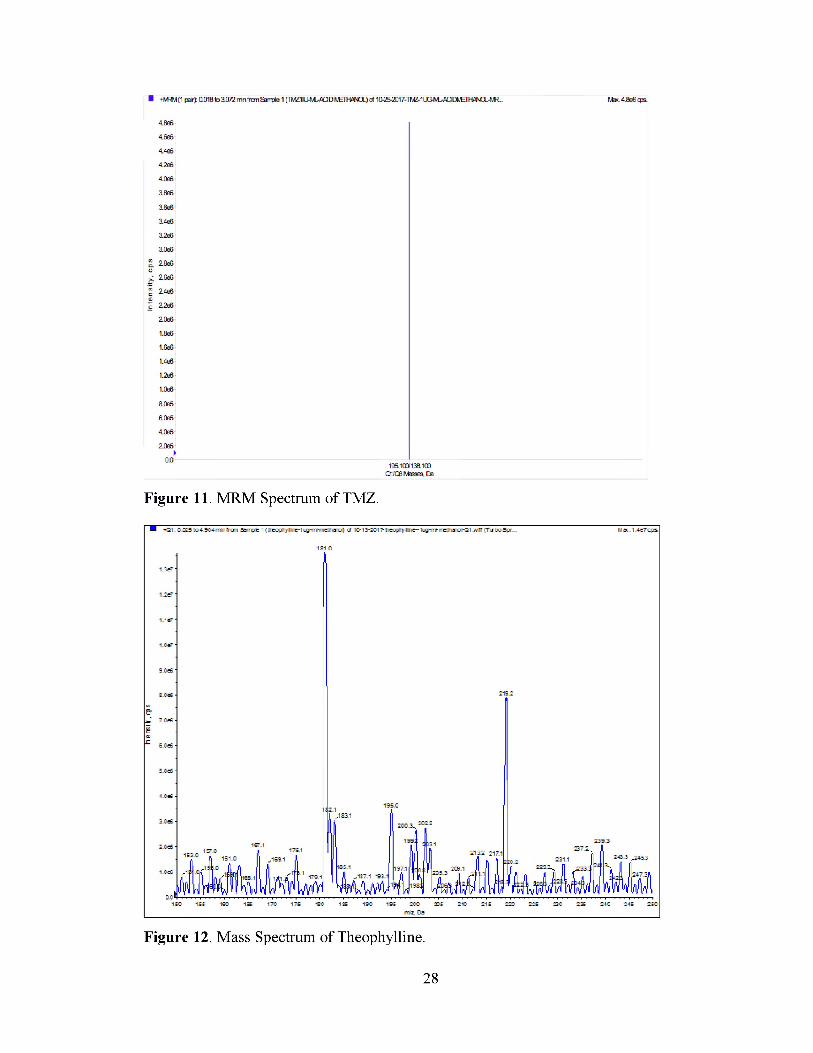
Figure 11. MRM Spectrum of TMZ.
28
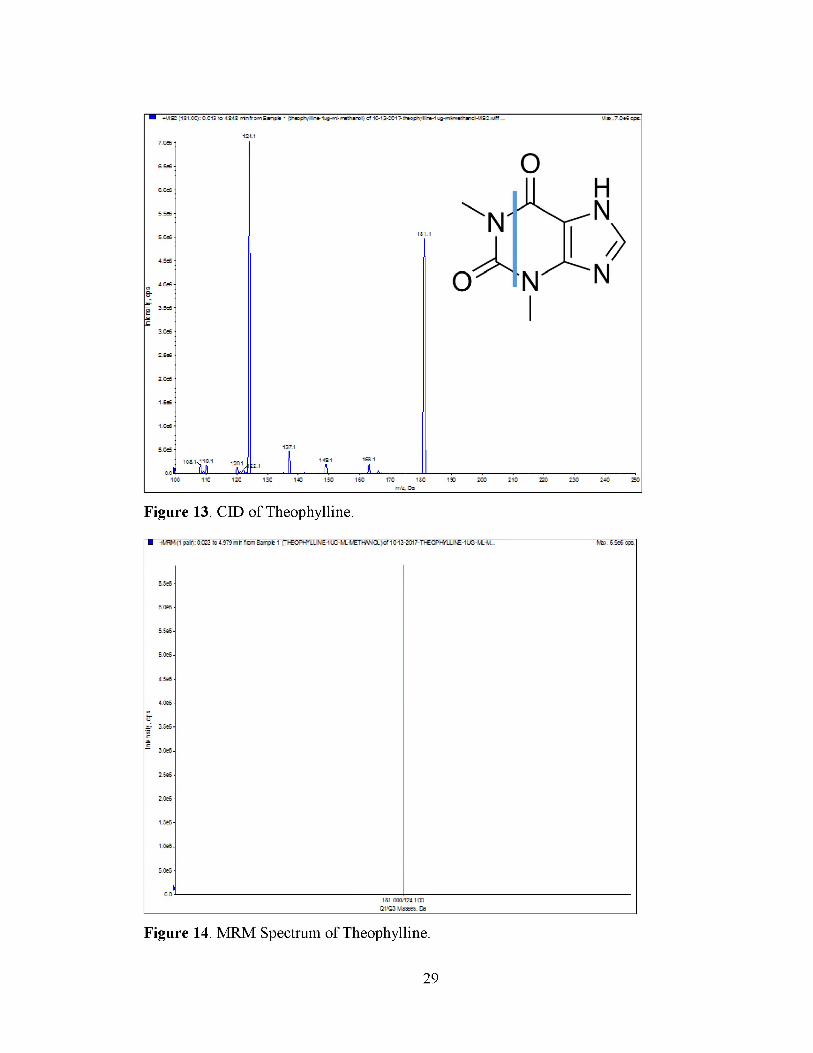
29

3.2 Method Application
As TMZ did not bind to the ZipTip columns using many different preparation
techniques and ZipTip solutions, protein precipitation was chosen as the better
application to recover TMZ. The LC-MS/MS method was used to quantitate TMZ in
mice brain to achieve the best recovery via protein precipitation. When comparing the
two solvents used for protein precipitation, ethanol was proven to be best due to fewer
matrix effects and less ion suppression. Slices of mice brain without TMZ were weighed
to 30 mg and used as the control standards. The resulting chromatograms are shown in
Figures 15-20. TMZ had a retention time near 2.5 minutes, while the internal standard
eluted later near 3.5 minutes.
Figure 15. Chromatogram of 30 mg Mice Brain Spiked with 10 ng/mL of TMZ and 50 ng/mL of IS.
30

Figure 16. Chromatogram of 30 mg Mice Brain Spiked with 50 ng/mL of TMZ and 50 ng/mL of IS.
Figure 17. Chromatogram of 30 mg Mice Brain Spiked with 100 ng/mL of TMZ and 50 ng/mL of IS.
31
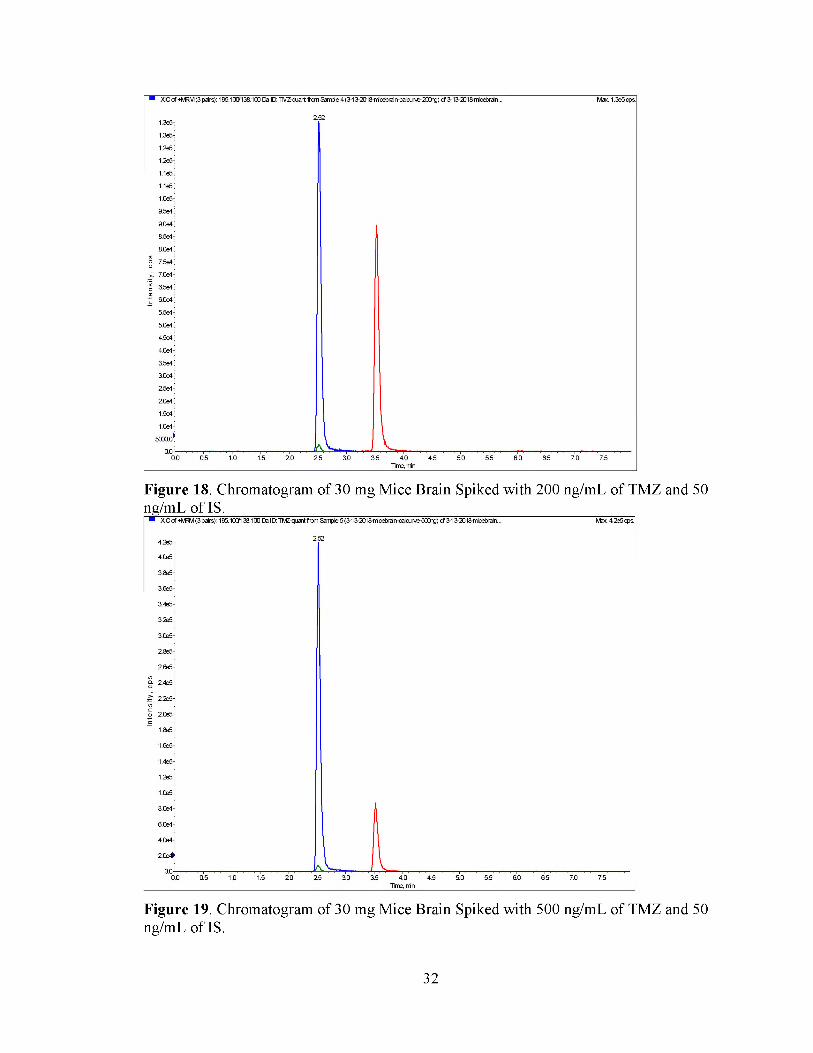
Figure 18. Chromatogram of 30 mg Mice Brain Spiked with 200 ng/mL of TMZ and 50 ng/mL of IS.
Figure 19. Chromatogram of 30 mg Mice Brain Spiked with 500 ng/mL of TMZ and 50 ng/mL of IS.
32
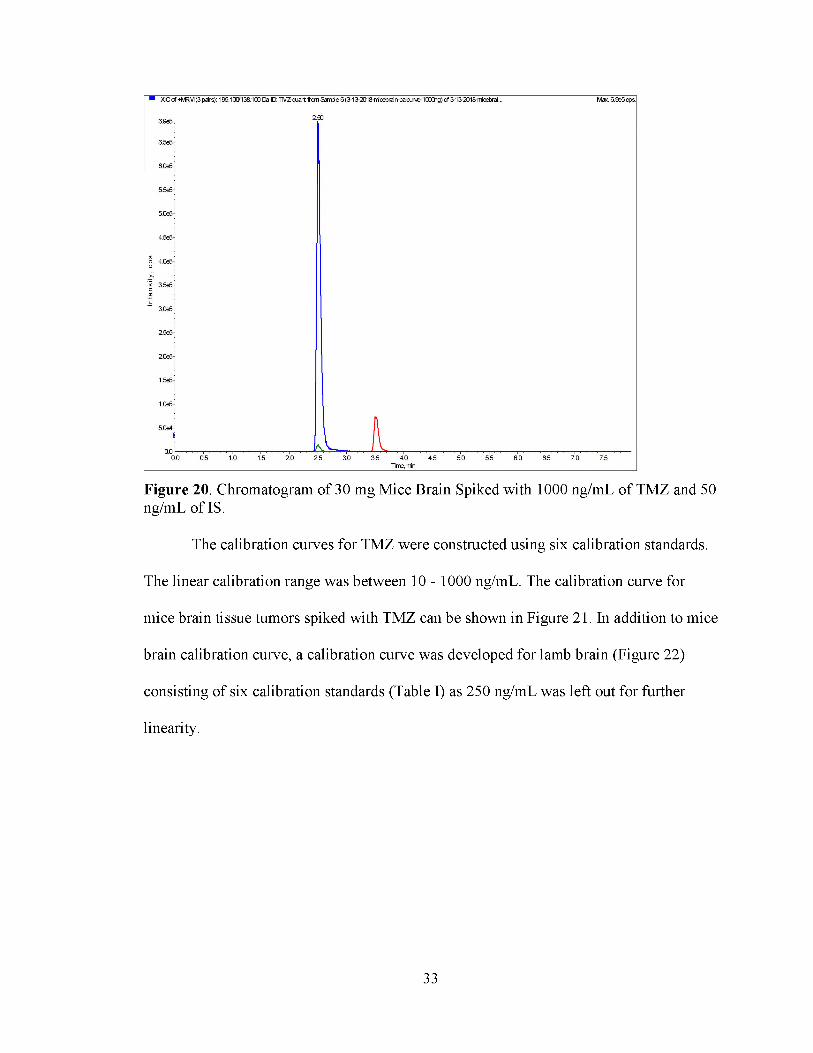
Figure 20. Chromatogram of 30 mg Mice Brain Spiked with 1000 ng/mL of TMZ and 50 ng/mL of IS.
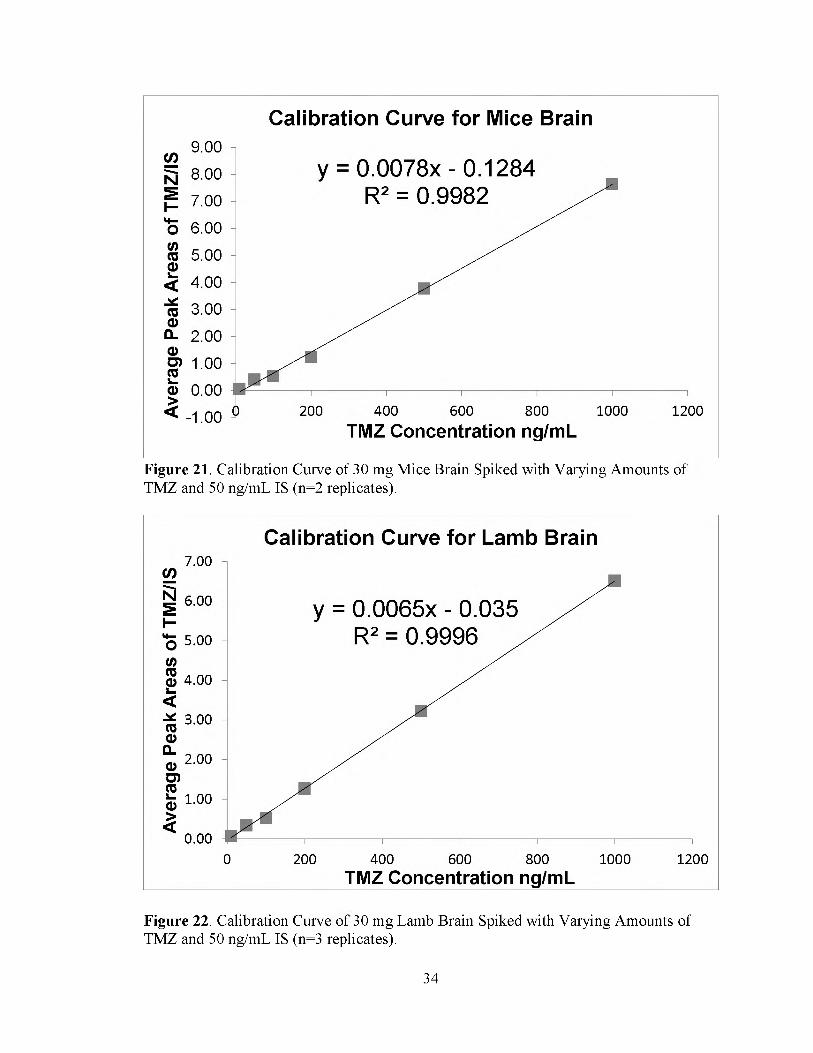
The calibration curves for TMZ were constructed using six calibration standards.
The linear calibration range was between 10 - 1000 ng/mL. The calibration curve for
mice brain tissue tumors spiked with TMZ can be shown in Figure 21. In addition to mice
brain calibration curve, a calibration curve was developed for lamb brain (Figure 22)
consisting of six calibration standards (Table I) as 250 ng/mL was left out for further
linearity.
33
Calibration Curve for Mice Brain
Figure 21. Calibration Curve of 30 mg Mice Brain Spiked with Varying Amounts of TMZ and 50 ng/mL IS (n=2 replicates).
Figure 22. Calibration Curve of 30 mg Lamb Brain Spiked with Varying Amounts of TMZ and 50 ng/mL IS (n=3 replicates).
34

3.3 Recovery of TMZ and Theophylline
The percent recoveries of the lamb brain were determined by comparing the mean
peak areas of spiking TMZ and IS before protein precipitation (n=3) with the mean peak
areas of spiking TMZ and IS after protein precipitation (n=2). Table V shows the mean
absolute recoveries for TMZ were consistent and ranged from 88.0%-138.6%. The
percent recovery values were found by taking the values spiking the analytes before
protein precipitation over the values spiking the analytes after protein precipitation and
multiplying by 100.
Table V. Percent Recoveries of TMZ.StandardConcentration(ng/mL)
Average Mean Peak Areas of Spiking TMZ/IS Before Protein Precipitation (n=3)
Average Mean Peak Areas of Spiking TMZ/IS After Protein Precipitation (n=2)
PercentRecovery
10 0.07 0.08 88%50 0.35 0.25 139%100 0.53 0.44 120%200 1.27 1.29 99%500 3.23 2.83 114%1000 6.51 6.68 97%
When compared to Goldwirt, the percent recoveries obtained were closer to 100%. As
mentioned prior, the extraction recovery of TMZ for Goldwirt was 67.7% for 125 ng/g,
61.0% for 1250 ng/g, and 61.4% for 12,500 ng/g. The differences in extraction
techniques are the protein precipitation and cell lysis solvents. Proteinase K was stronger
than 10 mM ammonium acetate/water/0.1% formic acid. For protein precipitation,
ethanol was used in this method, while methanol and zinc sulfate were used by Goldwirt.
The amount of ethanol used was about 80% of the total volume for protein precipitation,
while the amount of methanol used was Goldwirt was approximately 40% of the total
volume. The greater amount of alcohol used improved purification. Ethanol has a lower
35
dielectric constant than methanol, so it is able to reduce protein solubility leading to
better protein precipitation.
3.4 Matrix Effects
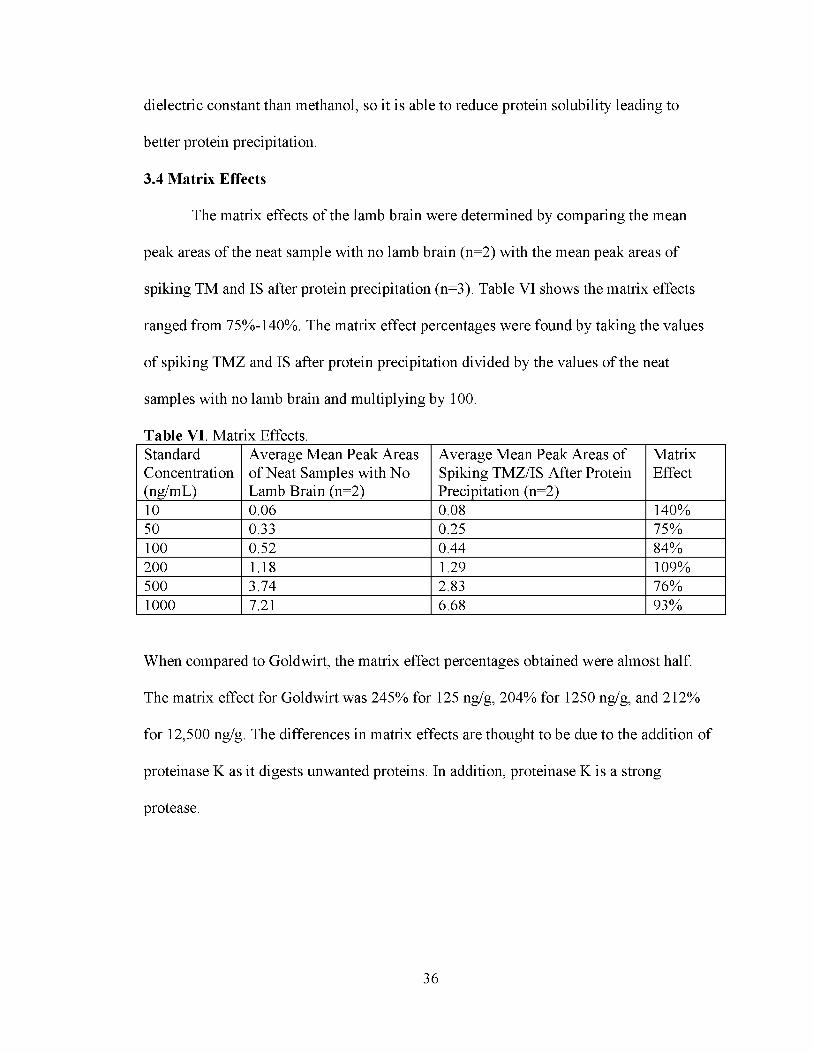
The matrix effects of the lamb brain were determined by comparing the mean
peak areas of the neat sample with no lamb brain (n=2) with the mean peak areas of
spiking TM and IS after protein precipitation (n=3). Table VI shows the matrix effects
ranged from 75%-140%. The matrix effect percentages were found by taking the values
of spiking TMZ and IS after protein precipitation divided by the values of the neat
samples with no lamb brain and multiplying by 100.
Table VI. Matrix Effects.StandardConcentration(ng/mL)
Average Mean Peak Areas of Neat Samples with No Lamb Brain (n=2)
Average Mean Peak Areas of Spiking TMZ/IS After Protein Precipitation (n=2)
MatrixEffect
10 0.06 0.08 140%50 0.33 0.25 75%100 0.52 0.44 84%200 1.18 1.29 109%500 3.74 2.83 76%1000 7.21 6.68 93%
When compared to Goldwirt, the matrix effect percentages obtained were almost half.
The matrix effect for Goldwirt was 245% for 125 ng/g, 204% for 1250 ng/g, and 212%
for 12,500 ng/g. The differences in matrix effects are thought to be due to the addition of
proteinase K as it digests unwanted proteins. In addition, proteinase K is a strong
protease.
36

CHAPTER IV
CONCLUSIONS
4.1. Conclusions and Future Directions
An LC-MS/MS method was developed to analyze temozolomide in mice brain
tumor tissue. As many studies focused on plasma, this method focused on brain tissue. In
comparison to Goldwirt et al., this method proved to obtain higher percent recoveries as
well as lower matrix effects. Many different techniques were employed in order to
achieve these goals. As TMZ was not able to bind to the ZipTip column, protein
precipitation was utilized along with proteinase K for cell lysis.
Future work will include studying the mice brain that were injected with TMZ
and quantifying the amount of drug in brain. To achieve this, larger slices of brain will be
taken in order to increase the chances of the location of the drug in the brain. In addition,
since 40 μL of proteinase K seemed to be most effective when compared to smaller
quantities, greater volumes of proteinase K will be studied. This research will also be
validated with mice brain samples.
37

REFERENCES
1. Schneider, T., et al. “Gliomas in adults.” Dtsch Arztebl Int, vol. 107, no. 45, 2010, pp.
799-808.
2. Friedman, H. S., et al. "Temozolomide and Treatment of Malignant Glioma," Clin.
Canc. Res., vol. 6, 2000, pp. 2585-2597.
3. Wick, W., et al. “New (alternative) temozolomide regimens for the treatment of
glioma.” Neuro-oncology, vol. 11, no. 1, 2009, pp. 69-79.
4. Lombardi, Melanie, and Mahfoud Assem. Glioblastoma. Codon Publications, 2017.
https://www.ncbi.nlm.nih.gov/books/NBK470004/ (accessed 18 January 2018).
5. Agarwal, S., et al. "Function of the Blood-Brain Barrier and Restriction of Drug
Delivery to Invasive Glioma Cells: Findings in an Orthotopic Rat Xenograt
Model of Glioma." Drug Metab. Dispos., vol. 41, 2013, pp. 33-39.
6. “Glioblastoma multiforme.” Cancer Treatment Centers of America,
https://www.cancercenter.com/brain-cancer/types/tab/glioblastoma-multiforme/
(accessed 20 January 2018).
7. “Anaplastic Astrocytoma.” National Organization for Rare Disorders, 2017,
https://rarediseases.org/rare-diseases/anaplastic-astrocytoma/ (accessed 20
January 2018).
8. “Anaplastic Astrocytoma.” Neurosurgeons of New Jersey, 2018,
https://www.neurosurgeonsofnewjersey.com/anaplastic-astrocytomas/ (accessed
21 January 2018).
38
9. Barker, C. A., et al. “Survival of patients treated with radiation therapy for anaplastic
astrocytoma.” Radiol. Oncol., vol. 48, no. 4, 2014, pp. 381-386.
10. Pan, Edward and Michael D. Prados. Holland-Frei Cancer Medicine. 6th ed., BC
Decker, 2003.
11. Peus, D., et al. “Appraisal of the Karnofsky Performance Status and proposal of a
simple algorithmic system for its evaluation.” BMC Medical Informatics and
Decision Making, vol. 13, no. 72, 2013, pp. 1-7.
12. “Anaplastic astrocytoma.” National Center for Advancing Translational Sciences,
2018, https://rarediseases.info.nih.gov/diseases/5860/anaplastic-astrocytoma
(accessed 21 January 2018).
13. Zhou, Q., et al. "Predicting Human Tumor Drug Concentrations from a Preclinical
Pharmacokinetic Model of Temozolomide Brain Disposition," Clin Cancer Res,
vol. 13, no. 14, 2007, pp. 4271-4279.
14. Liu, James K. “The role of temozolomide in the treatment of aggressive pituitary
tumors,” Journal of Clinical Neuroscience, vol. 22, no. 6, 2015, pp. 923-929.
15. “Temozolomide.” National Center for Biotechnology Information, PubChem
Compound Database,
https://pubchem.ncbi.nlm.nih.gov/compound/temozolomide#section=Top.
(accessed 21 January 2018).
39

16. Rai, R., et al. “Temozolomide analogs with improved brain/plasma ratios - Exploring
the possibility of enhancing the therapeutic index of temozolomide,” Bioorganic
& Medicinal Chemistry Letters, vol. 26, no. 20, 2016, pp. 5103-5109.
17. Barciszewska, A., et al. "A New Epigenetic Mechanism of Temozolomide Action in
Glioma Cells." PLOS One. 2015, pp. 1-12.
18. Whitelaw, B. C., et al. "Temozolomide in the management of dopamine agonist-
resistant prolactinomas," Clinical Endocrinology, vol. 76, 2012, pp. 877-886.
19. Canniff B., and Anderson, D. “E. coli MGMT Suicide Protein,” Biomolecules at
Kenyon, http://biology.kenyon.edu/BMB/jsmol2016/ADAO6/ADA012.html
(accessed 4 February 2018).
20. Shen, F., et al. "Determination of temozolomide in human plasma and urine by high-
performance liquid chromatography after solid-phase extraction." Journal of
Chromatography B, vol. 667, 1995, pp. 291-300.
21. Portnow, J., et al. “The neuropharmacokinetics of temozolomide in patients with
resectable brain tumors: potential implications for the current approach to
chemoradiation.” Clin Cancer Res, vol. 15, no. 22, 2009, pp. 7092-7098.
22. Goldwirt, L., et al. "Development of a new UPLC-MSMS method for the
determination of temozolomide in mice: application to plasma pharmacokinetics
and brain distribution study." Biomed. Chromatogr., vol. 27, 2013, pp. 889-893.
40

23. Kim, H., et al. "High-performance liquid chromatographic analysis and stability of
anti-tumor agent temozolomide in human plasma." Journal of Pharmaceutical
and Biomedical Analysis, vol. 24, 2001, pp. 461-468.
24. Patel P. M., et al. “Extended schedule, escalated dose temozolomide versus
dacarbazine in stage IV melanoma: Final results of a randomised phase III study
(EORTC 18032).” European Journal of Cancer, vol. 47, 2011, pp. 1476-1483.
25. Li, Pei and Barlett, M. G., "A review of sample preparation methods for quantitation
of small-molecule analytes in brain tissue by liquid chromatography tandem mass
spectrometry (LC-MS/MS)." Anal Methods, vol. 16, 2014, pp. 6183-6207.
26. Mammalian Cell Membranes: Responses of Plasma Membranes. Edited by G. A.
Jamieson and D. M. Robinson, vol. 5., Butterworths, 1977.
27. Gilar, M., et al “Advances in sample preparation in electromigration,
chromatographic and mass spectrometric separation methods,” Journal of
Chromatography A. vol. 909, 2001, pp. 111-135.
28. Aitken, A., “Sample Cleanup by Solid-Phase Extraction/Pipet-Tip Chromatography,
The Proteomic Protocols Handbook. Walker, John M., Humana Press, 2005, pp.
307-309.
29. Plank, J., “The Ins and Outs of Protein Concentration - Protein Precipitation,”
BitesizeBio, 2015, https://bitesizebio.com/5924/the-in%E2%80%99s-and-
out%E2%80%99s-of-protein-concentration-%E2%80%93-protein-precipitation/
(accessed 27 March 2018).
41
30. Skoog, D. A.; Holler, F. J.; Crouch, S. R. Principles of Instrumental Analysis, 6th ed.;
Brooks/Cole Cengage Learning: Belmont, 2007; pp. 336-472.
31. Editorial Team. High Performance Liquid Chromatography (HPLC): Principle,
Types, Instrumentation and Applications, 2015, https://laboratoryinfo.com/hplc/
(accessed 11 February 2018).
32. “Mass Spectrometry.” Premier Biosoft, 2018,
http://www.premierbiosoft.com/tech notes/mass-spectrometry.html (accessed 26
February 2018).
33. Peer, C. J., "Quantification of Temozolomide in Nonhuman Primate Fluids by
Isocratic Ultra-High Performance Liquid Chromatography-Tandem Mass
Spectrometry to Study Brain Tissue Penetration Following Intranasal or
Intravenous Delivery," Separations, vol. 3, no. 4, 2016, pp. 1-10.
42