development of electrochemical platform for dna sensing
TRANSCRIPT

Development of electrochemical platform for
DNA sensing
Thesis dissertation to qualify for Ph. D. in Nanoscience
Presented by:
Wilmer Alfonso Pardo
Supervised by:
Dr. Mònica Mir LlorenteDr. Josep Samitier
Departamento de Electrónica
Facultad de Física
Barcelona, 2016


Development of
electrochemical
platforms for DNA
sensing

A la sangre de mi sangre, porque somos fuego y fluidez
A ti, Madre
A ti, Hijo
A ustedes, Hermanos
A ustedes, Familia
Al universo, por ser fuego y fluidez
A.M.G.D.

Plasmar unas letras en muchas hojas de papel, es solo un pequeño reconocimiento
del largo y gran trabajo que mucha gente realizó durante este proyecto. Es difícil
establecer el alcance de la ayuda y del trabajo mutuo de las muchas personas que
estuvieron en mi camino durante la realización de esta tesis doctoral.
Miles de agradecimientos a:
El profesor Josep Samitier, agradezco su confianza y el brindarme la oportunidad de
pertenecer a este instituto, fue mi casa durante mi estadía en Barcelona, una buena
casa.
A la gente del grupo de nanobioingeniería por su compañía, aún a pesar de mi poca
participación en muchos de sus eventos. Especial mención a Miriam, gran trabajo y
¡¡¡mucho orden!!! A David, gracias por toda tu ayuda, ustedes dos son el alma del
laboratorio.
Los que ya no están, Reyes y Javier, por sus aportaciones a este trabajo; Rossella
por su humor negro y exageradamente crítico; Bogachan, gran amigo y compañero
de tertulias. A José Luis, siempre era bueno reír contigo. A las chicas de máster Ana
y Raquel, me veía en ustedes cuando empecé.
Erika, fue bueno tener a otra colombiana en casa… por y para todo lo que se vivió.
Las personas de Genomica S.A.U. comprometidas con la causa.
Samuel y Judit, porque ¿quién dijo que el trabajo no es divertido?
Las personas externas al laboratorio, a ellos y ellas, pilares y apoyos en cada
cambio estacional.
Alexa, por tu bonita compañía.
Harold, con especial cariño, después de todo, somos lo que hacemos.
Ximena, que me da lo mejor que puede una persona dar a otra, su tiempo…
¡Infinitas Gracias! … por todo lo que significas y edificas. Un beso eterno.
Barcelona, casi casi, otra Bogotá…y yo amo Bogotá.
Mi familia…Lo son todo.
Mònica… podría decir muchas cosas sobre ella, pero como ella lo sabe, no soy de
escribir mucho, más bien conciso y certero…usted, profe: miÁNGEL en Barcelona.
Por siempre agradecido.
A todos los anteriores y los que hicieron falta, gracias totales.

Index Motivation and work objective ............................................................................................................. 1
Outline of the thesis.............................................................................................................................. 3
Chapter one .......................................................................................................................................... 4
1.1 Introduction .................................................................................................................................... 5
1.2 DNA molecule ................................................................................................................................. 6
1.3 Biosensors ....................................................................................................................................... 8
1.3.1 Biosensor evolution ............................................................................................................... 13
1.4 Electrochemical DNA biosensors .................................................................................................. 15
1.5 DNA electrochemical sensing strategies ....................................................................................... 17
1.5.1 Direct DNA electrochemical detection .................................................................................. 18
1.5.2 Indirect DNA electrochemical detection ............................................................................... 19
1.5.2.1 Label-based systems with redox molecules or enzymatic complex ............................... 19
1.5.2.2 Redox indicators ............................................................................................................. 19
1.5.2.3 Nanostructure-based electrochemical amplification ..................................................... 20
1.6 Lab-on-a-chip ................................................................................................................................ 21
1.7 Trends in biosensors ..................................................................................................................... 23
1.8 Biochips ......................................................................................................................................... 24
1.9 Commercial DNA biochips and microarrays ................................................................................. 24
1.10 Summary ..................................................................................................................................... 29
1.11 References .................................................................................................................................. 31
Chapter Two ........................................................................................................................................ 42
2.1 Interfaces ...................................................................................................................................... 43
2.2 Self-assembled Monolayers (SAMs) ............................................................................................. 44
2.3 Thiol Self-assembled Monolayers ................................................................................................. 47
2.3.1 Chemistry, kinetic and structure of thiol SAMs ..................................................................... 47
2.3.2 Self-assembled monolayers preparation ............................................................................... 48
2.3.3 Self-assembled monolayers test ............................................................................................ 49
2.3.4 Capture probe and mercaptohexanol SAM (CP-MCH) .......................................................... 51
2.3.5 Lipoic acid maleimide-Polyethylene glycol SAM (LAM-PEG) ................................................. 51
2.3.6 Maleimide-PEG disulphide SAM (MalPEG) ............................................................................ 52
2.4 Techniques for SAM characterization ........................................................................................... 53
2.4.1 Surface Plasmon resonance (SPR) ......................................................................................... 54

2.4.1.1 SPR imaging .................................................................................................................... 56
2.4.1.2 Electrochemical SPR (eSPR) ............................................................................................ 57
2.4.2 Electrochemical techniques: Cyclic Voltammetry ................................................................. 58
2.4.3 X-ray Photoelectron Spectroscopy (XPS) ............................................................................... 60
2.4.4 Laser optical interferometry .................................................................................................. 61
2.4.5 Scanning tunneling microscopy (STM) ................................................................................... 62
2.5 Experimental sets .......................................................................................................................... 63
2.5.1 Gold surface characterization ................................................................................................ 64
2.5.2 Surface gold cleaning protocol .............................................................................................. 65
2.6 Results ........................................................................................................................................... 66
2.6.1 SPR characterization .............................................................................................................. 66
2.6.2 i-SPR Maleimide layer optimization ....................................................................................... 69
2.6.3 Nonspecific adsorption test ................................................................................................... 70
2.6.4 e-SPR Capture probe layer optimization ............................................................................... 71
2.6.4.1 CP concentration ............................................................................................................ 71
2.6.4.2 Target orientation ........................................................................................................... 72
2.6.5 XPS characterization .............................................................................................................. 74
2.7 Gold substrate annealing .............................................................................................................. 78
2.7.1 Annealing treatment .............................................................................................................. 79
2.7.2 STM results ............................................................................................................................ 79
2.7.3 Interferometry characterization ............................................................................................ 80
2.7.4 Electrochemical characterization of effective surface .......................................................... 81
2.7.5 Surface coverage characterization with SPR ......................................................................... 82
2.7.6 Electrochemical DNA sensor characterization ....................................................................... 85
2.8 Summary ....................................................................................................................................... 86
2.9 References .................................................................................................................................... 88
Chapter three ...................................................................................................................................... 94
3.1 Materials test ................................................................................................................................ 97
3.1.1 Experimental material test .................................................................................................... 97
3.2 Electrodes microfabrication techniques ....................................................................................... 98
3.2.1 Photolithography ................................................................................................................... 98

3.2.1.1 Substrate cleaning .......................................................................................................... 98
3.2.1.2 Metallic coating .............................................................................................................. 98
3.2.1.3 Photoresist Application .................................................................................................. 99
3.2.1.4 Positive and Negative Photoresist .................................................................................. 99
3.2.1.5 Mask Alignment and Exposure ..................................................................................... 100
3.2.1.6 Development ................................................................................................................ 100
3.2.1.7 Etching .......................................................................................................................... 101
3.2.2 Screen printing technique.................................................................................................... 101
3.3 Cartridge design .......................................................................................................................... 102
3.3.1 Biosensing Block .................................................................................................................. 103
3.3.1.1 Layer I: biosensors matrix ............................................................................................. 104
3.3.1.2 Layer II: Passivation layer ............................................................................................. 109
3.3.1.3 Layer III: Hybridization chamber ................................................................................... 114
3.3.1.4 Layer IV: Reference and counter electrodes ................................................................ 117
3.3.2 Biosensor block assembly .................................................................................................... 119
3.3.3 DNA spotting by nanoploter ................................................................................................ 122
3.3.4 PCR Block ............................................................................................................................. 125
3.3.4.1 Layer IV ......................................................................................................................... 127
3.3.4.2 Layer VI ......................................................................................................................... 127
3.3.4.3 Layer V: PCR chamber ................................................................................................... 128
3.4 Final cartridge: assembly ............................................................................................................ 131
3.5 Summary ..................................................................................................................................... 134
3.6 References .................................................................................................................................. 135
Chapter 4 .......................................................................................................................................... 136
4.1 Electrochemical assays in microfluidic cartridge ........................................................................ 137
4.2 Electrochemical cell assembly .................................................................................................... 137
4.3 Cleaning Array ............................................................................................................................. 139
4.4 Gold electrode characterization ................................................................................................. 140
4.5 Electrochemical array characterization ...................................................................................... 145
4.5.1 SAM immobilization in closed chamber .............................................................................. 145
4.5.2 SAM immobilization in open chamber ................................................................................ 146
4.5.2.1 Positive control ............................................................................................................. 148
4.5.2.2 Controls comparison..................................................................................................... 150
4.6 Limit of detection (LOD) .............................................................................................................. 151

4.7 Crossreactivity test...................................................................................................................... 153
4.8 Electrochemical signal amplification........................................................................................... 157
4.9 Thermal stability of MalPEG-CP interface ................................................................................... 159
4.10 Hybridization conditions optimization ...................................................................................... 162
4.10.1 Hybridization study ............................................................................................................ 162
4.10.2 Interface composition test................................................................................................. 162
4.10.3 Ratio MalPEG/CP optimization .......................................................................................... 163
4.10.4 Crossreactivity test ............................................................................................................ 165
4.11 Summary ................................................................................................................................... 167
4.12 References ................................................................................................................................ 168
Chapter 5 .......................................................................................................................................... 170
5.1 Conclusions ................................................................................................................................. 171
Chapter 6 .......................................................................................................................................... 174
Resumen en español ......................................................................................................................... 175
6.1 Introducción ................................................................................................................................ 176
6.2 Monocapa autoensamblada ....................................................................................................... 176
6.3 Celda electroquímica .................................................................................................................. 177
6.4 Integración de la biointerfaz de sensado en la celda electroquímico ........................................ 178
6.5 Conclusiones ............................................................................................................................... 179

Acronyms CDTI: Centro de Desarrollo Tecnológico Industrial
CENIT: Consorcios Estratégicos Nacionales de Investigación Técnica
IBEC: Institute for Bioengineering of Catalonia
UB: Universitat de Barcelona
POC: Point-of-care
LOC: Lab-on-a-chip
PCR: Polymerase Chain Reaction
DNA: Deoxyribonucleic acid
ssDNA: single strand DNA
dsDNA: double strand DNA
RNA: Ribonucleic acid
PNA: Peptide Nucleic Acid
CAU: Central Automatized Unit
OECD (OCDE): Organization of Economic Cooperation and Development
GMO: Genetically Modified Organism
IUPAC: International Union of Pure and Applied Chemistry
SELEX: Systemic Evolution of Ligands by Exponential Enrichment
SPR: Surface Plasmon Resonance
SPRi: Surface Plasmon Resonance imaging
eSPR: Electrochemical Surface Plasmon Resonance
RM: Resonant mirror
TIRF: Total Internal Reflection Fluorescence
GNP: Gold Nanoparticle
FET: Field Effect Transistors
PVC: Polyvinyl Chloride
ISFET: Ion Selective Field Effect Transistor
QCM: Quartz Crystal Microbalance
WE: Working Electrode
RE: Reference Electrode
CE: Counter Electrode
CV: Cyclic Voltammetry
DPV: Differential Pulse Voltammetry
SST: Single Surface Technique

DST: Double Surface Technique
ITO: Indium Tin Oxide
ASV: Adsorption Stripping Voltammetry
HRP: Horseradish Peroxidase
ALP: Alkaline Phosphate
MEMS: Microelectromechanical Systems
PDMS: Polydimethylsiloxane
NSA: Nonspecific adsorption
ALD: Atomic Layer Deposition
CVD: Chemical Vapor Deposition
PVD: Physical Vapor Deposition
MSA: Molecular Self-assembly
SAM: Self-assembled Monolayer
UHV: Ultra High Vacuum
PEG: Polyethylene Glycol
MCH: Mercaptohexanol
CP: Capture probe
Fc: Ferrocene
CP-MCH: Capture probe-Mercaptohexanol SAM
LAM-PEG: Lipoic Acid Maleimide-Polyethylene glycol SAM
MalPEG: Maleimide-Polyethylene glycol disulphide SAM
XPS: X-ray Photoelectron Spectroscopy
PSI: Phase Shift Interferometry
STM: Scanning Tunneling Microscopy
ECI: Electronic Control Interface
CEMIC: Centro de Ingeniería de Microsistemas para Instrumentación y Control
COP: Cycle Olefin Polymer
COC: Cycle olefin Copolymer
PC: Polycarbonate
PEEK: Polyether ether ketone
LOD: Limit of detection

1 | Universitat de Barcelona
Motivation and work objective
This thesis is framed within a research and development (R & D) project in
collaboration with the industry. This project was funded by Centro de Desarrollo
Tecnológico Industrial (CDTI) with a CENIT under the name of “New strategies
based on biomarkers for the detection and prognostic of cancer, and novel
treatments development and response prediction (ONCOLOGICA)”. Our part of the
project was established jointly with the molecular diagnostics company Genomica
S.A.U., the Nanobioengineering group in the Institute for Bioengineering of
Catalonia (IBEC), and the University ofBarcelona (UB). The main objective within
the project was the development of a commercial point-of-care (POC) diagnosis
system for cancer detection. For this purpose, a lab-on-a-chip (LOC) device was
developed, integrating a polymerase chain reaction (PCR) to amplified and label the
DNA sequences specific for this illness and an electrochemical DNA biosensor, to
specifically hybridize and detect the illness sequences in the LOC. The LOC
functionality requires electronics to move the fluidic pumping, the heating for the
PCR and the read-out for the electrochemical detection.
Four units integrate the overall device,a PCR thermocycler, a microfluidic system of
channels and confinement liquids chambers, an electrochemical biosensor array,
and a central automatized unit (CAU) to control previous described units. See
scheme 1 to whole system.
Scheme 1: POC device schematic

2 Motivation and work objective | Universitat de Barcelona
Regarding the processes of design, manufacture and development of the central
unit containing the electronics for the automatization of the heating with a peltier,
control of fluidic pumping and electrochemical read-out were in charge the group of
Dr. Manuel Puig of the UB. All information, corresponding to the development of
these systems belongs to other parallel doctoral thesis. Consequently, those results
are not shown in this thesis. Genomica Company has a commercialized colorimetric
macroscale kit for cancer detection where the PCR has been already optimized and
they adapt their PCR to the mini-PCR integrated in the cartridge. We developed part
of the characterization of the product obtained from the integrated PCR in the
cartridge. Confidential information about the details of the PCR developed by the
Genomica Company cannot be included in this thesis due to the private nature of
the project. The design of the microfluidic cartridge that integrates the PCR unit and
the biosensor unit was performed by our group, but supervised by Dr. Antoni
Homs. We developed the fabrication and characterization of the microfluidics
related with the electrochemical cell. We performed the design and fabrication of
the electrochemical biosensors integrated in the LOC. For this purpose, different
biosensors interfaces and biosensor configurations were studied based on the better
efficiency of the biosensor sensitivity and selectivity.
During the five years of development of this project, significant progress was
achieved. So, after hundreds of tests on materials, manufacturing techniques,
detection strategies and prototypes with different architectures, among other items,
it was decided to follow with the project and engage a company with the
technology for mass production of electronics and microfluidics of a similar device
based on the developments achieved so far. In the final part of the development of
this LOC, the German company Microfluidics ChipShop GmbH was incorporated into
the new project. The objective of this new project was the same that the above, but
with the main direction of obtaining a final commercial device.
ChipShop is contributing with their extensive experience in microfluidic issues and
so are responsible for the design that integrates alow-cost easy to fabricate
microfluidic systems and electrodes array, integrated with an affordable electronic
device that controls fluidics, heating and electrochemical readout, but based on the
results obtained so far.
At light of the new commercial nature of the final goal, the new changes proposed
by ChipShop are essential to reduce the manufacturing costs. They proposed a
change in the structure of the microfluidic cartridge and a reduction of the electro-
array size and geometry setting. We have characterized the microfluidics related

3 Outline of the thesis | Universitat de Barcelona
with the electrochemical cell and optimized the performance of the different
fabricated and designed electrochemical arrays. From these characterizations, we
collaborate in the improvement of the designs and fabrication techniques for the
fluidics and the arrays. We integrated and optimized the developed electrochemical
biosensors for the new electrochemical cell. The IBEC, Genomica S.AU.,
Microfluidics ChipShop GmbH and UB collaboration is even today.
Outline of the thesis
To achieve a better understanding of this document in each chapter we present an
order of definition, advantages and applicability of the concepts. In this
manner,chapter one presentsa biosensor and LOC definition and some generalities
and trends in the field of biosensors for medical diagnosis. The DNA sensors are
introduced especially those that working with electrochemical techniques. Then, the
hybridization event and the different strategies of duplex formation detection in
biosensors are described, followed by the state of the art of commercial DNA
arrays.
Chapter 2 is about the DNA biosensor interfaces, due to its importance in the
efficiency of the sensitivity and selectivity of these devices. The molecular
organization of the self-assembledDNA bioreceptor is studied under different type of
linkers. The optimization and characterization of the electrochemical biosensing
interface (BSI) for the functionalization of the gold surface electrodes on an ultraflat
surface and on the LOC is also reported.
Chapter 3is focused in the design, materials, fabrication, and characterization of the
microfluidic cartridge and the electrochemical array as well as its integration. The
evolution of the different designs, the fabrication techniques used for theseand the
differences observed in all the prototypes are explained.
Chapter 4 contains the integration of the biosensor interface optimized in chapter 2
with the fabricated cartridge introduced in chapter 3. The different optimizations of
the electrochemical DNA biosensor array obtained with the hybridization of the
amplified DNA sample are shown in this chapter.
Chapter 5 is dedicated to summarize all the work presented and general concluding
remarks.
Finally, chapter 6 is a summary in Spanish of the work.

4 Chapter one | Universitat de Barcelona
Chapter one

5 1.1 Introduction | Universitat de Barcelona
1.1 Introduction
During the last decades the convergence of the pure sciences (biology, physicsand
chemistry, among others) and technology (engineering, electronics, computing)
results in extraordinary achievements in various sectors, which have increased their
use over time.In general this union is called biotechnology or bioengineeringand
one of the best definition of this new field of study is given by the Organization of
Economic Cooperation and Development (OECD); "the application of scientific and
engineering principles to the processing of materials by biological agents"[1]. More
simply, biotechnology makes use of biological systems and processes to
manufacture useful products and provide services. Production may be carried out
by using intact organisms, such as yeasts and bacteria, or by using natural
substances (e.g. enzymes or nucleic acids) from organisms.
The new tools provide an approach to problem solving and these are considered as
a collection of essential outfits in the advancement of products in the
pharmaceutical, medical, chemical, biological and clinical industries, as well as in
research fields.
Within the field of research in biomedical applications, the current trend is to
develop point-of-care devices. These new technologies involve materials and
procedures capableof interact with living tissue or biomolecules.Most of the
designsand materials used in these platforms arealso mimickingbiosystems. Taking
advantage that offers millions of years of nature evolution, the use of
biomoleculesoffervery high selectivity to specific target for the functionality of the
biomaterial under study.
In this way, analytical chemistry is one of the fields benefited bybiotechnology. The
ability to detect bioanalytes on inorganic material opens fields for many
applications:
Disease diagnosis
o Cancer, Diabetes, viral infections[2-4]
Genetically Modified Organism(GMO) and food
o Transgenic food, gene determination[5-7]
Medicaland Forensic sciences
o Drug detectors, organic or inorganic traces, genetic identification,
and paternity[8-12]
Environmental issues

6 1.2 DNA molecule | Universitat de Barcelona
o Pollution, heavy metal identifications in air or water, toxins
concentration in aquatic ecosystems[13-18]
Industrial process control
o Gases detection, microorganism detection[19-23]
Veterinarian issues
o Parasite control, viral detections[24-26]
Military Security
o Biosecurity and biodefense, detection of dangerous chemical and
biological agents, explosive detection[27-30]
For this purpose,it is necessary to have a versatile tool. Biosensors are the most
recent and relevant platformsto build up a low cost, portable, selective and
sensitive analytical devices[31-37].
1.2 DNA molecule
The deoxyribonucleic acid (DNA) is one of the most widespread biomolecules used
in biosensors, due to its easy synthesis, stability but mainly because of the large
information that can be extracted from their sequences of bases.
DNA molecule is a polyelectrolyte chain and joint with the RNA formed the called
nucleic acids. DNA is an organic compound containing carbon, hydrogen, oxygen
and nitrogen and has a double helix structure, this mean that the DNA molecule is
really a molecule composed of two strands. Each one of these strands is a
polymeric compound of nucleotide subunits. Each nucleotide is composed of three
units: a sugar molecule called deoxyribose, a phosphate group and one of four
nitrogenous compounds called bases: adenine (A), thymine (T), cytosine (C) and
guanine (G). The deoxyribose molecule occupies the center of the nucleotide and in
its flanks there is a phosphate group (to a side) and a base (on the other side). The
phosphate group is in turn attached to the adjacent deoxyribose nucleotide chain.
Nucleotides of each of the two chains that form DNA establish a specific association
with the corresponding of the other strand. Due to the chemical affinity between
the bases, nucleotides containing adenine always engage with those containing
thymine, and cytosine containing those containing guanine (see Fig 1.1)[38].

7 1.2 DNA molecule | Universitat de Barcelona
Figure 1.1: DNA structure
The complementary bases are joined together by weak chemical bonds called
hydrogen bonds and these interactions are those that give the DNA its spiral shape.
This specific attraction between nucleotides is the base of hybridization process. A
single strand of DNA (ssDNA) will hybridize to another single strand of DNA if their
nucleotides sequences are complementary(figure 1.2). Besides, the
complementarity of nitrogenous bases responds to a specific order of consecutive
matching nucleotides. Electrochemical detection of the hybridization event (duplex
DNA formation) is based on changes of electrochemical behaviors. The detection
can be due to changes in the nucleic acids electroactivity, or labeling of the target
or the probe with electroactive species by covalently bounds, or nanoparticles
functionalized probes, or changes in various electrochemically detectable DNA
properties, which are related to changes in the DNA structure resulting from the
hybridization step[39]. For this work, the detection of this event is possible due to
the redox label that contains the DNA target in their structure.

8 | Universitat de Barcelona
Figure 1.2: Hybridization event
1.3 Biosensors
Biosensors arise as tools capable of producing continuous signals that are
proportional to the amount of binding molecules that react on the surface of a
sensor. Biosensors according withthe IUPAC (International Union of Pure and
Applied Chemistry) definition done in1999 are: "A device that use specific
biochemical reactions mediated by isolated enzymes, immunosystems, tissues,
organelles or whole cells to detect chemical compounds usually by electrical,
thermal or optical signals" [40].
In the literature, there are as many biosensor definitions as authors. There are
those who argue that a biosensor involves only bio-supramolecular structures [41,
42]; others include in their definition all systems involving any molecules related
with the life [43-47]. There are also those who take off this group to those devices
having electronic parts and/or integrated fluidic [48, 49], to name a few cases.
However, still out of this definitions are the non-enzymatic proteins and complex
biomolecules such as DNA and RNA types. For this reason, the scientific community
involved many more features to this definition as it advances in the use of these
devices. We can get a more complete definition based on new materials, structures

9 1.3 Biosensors | Universitat de Barcelona
and techniques used today. Thus, an integral and current definition of biosensor is
this one: biosensors are devices that detecting, monitoring and transmitting
information of biophysical and/or biochemical specific reactions with high
specificity, that occurring before, during and after over interfaces that involving a
bioelement (or several) as recognition element and one transducer (or more). This
transducer would be capable of transforming those changes in electrochemical,
electrical, optical, thermal, heat or sound output signals, among others, for further
processing of data [50, 51].
Inside this maelstrom of definitions, there is unanimity on the constituent
components of a biosensor, a recognition element and a transducer. The
recognition element or bioreceptor is a biomolecule able of recognizing, in a very
selective and sensitive way,the target analyte in a complex matrix. These
biomolecules are usually attached on the sensor surface, although in some cases
can be found in solution, performing a bulk detection. The transducers are tools
that transform this biological interaction event into a quantifiable output signal[52].
The particularity of a biosensor is that these two components are integrated into a
single device as shown in scheme 1.1. This combination allows the detection,
measurement and quantitation of the analyte without previous separation.
Scheme 1.1:Scheme of the different biosensor parts
Therefore, there are classifications of biosensors depending on the nature of its
constituent components. Considering the bioreceptor, the systems that use
antibodies as recognition element are called immunosensors [53], and are one of
the most widespread types of biosensors, with many applications mainly when it is
involved a biomarker protein.

10 1.3 Biosensors | Universitat de Barcelona
Among this classification, are included the enzymatic sensors, that uses enzymes as
intermediaries of a chemical process. In this category are the famous glucose
sensors [3]. These biosensors have been so commercially successful that represent
85% of the global market. However, they are not the only sensors that use
enzymes. There are transferases sensors for determining xenobiotics [54, 55], with
hydrolases for sucrose [56, 57], containing liasas for analysis of citric acid [58] and
isomerases for detecting hormones or their precursors [59], among others.
Also with the great knowledge offered by the Genome Project, made that nucleic
acidenjoyed a successful spread to this field.Inside these types of biosensors, the
bioreceptor is either ribonucleic acid (RNA) or deoxyribonucleic acid (DNA). There
are those that using natural or its synthetic forms of DNAs and RNAs. Ordinations
as varied as plasmids and peptide nucleic acid (PNA) are present as synthetics
bioelements [60-63]. The success of these biosensors is given by the extraordinary
affinity of the nitrogenous base pairs of the polyelectrolyte chains of these acids.
Furthermore, using amplified DNA fragments techniques, like Polymerase Chain
Reaction (PCR),makes this molecules easy to detect in a very sensitive way and so
the applications of DNA arrays or genosensors, as they are also called, are
countless [64-69].In addition, DNA is being used also for detecting any type of
analytes, besides ssDNA complementary strands, called in this case aptamers.
Using genomic libraries techniques and in vitro selection techniques, like Systemic
Evolution of Ligands by Exponential Enrichment (SELEX), the sequences of these
DNA molecules can be structured to link specifically to any kind of molecule..
The type of reaction that can be generated between the analyte and the bioelement
it can lead to other classification also. So, regarding the type of interaction if the
bioreceptor binds the analyte, the sensor is classified as an affinity sensor. On the
other hand, if the bioelement and analyte result in a chemical change that can be
used to measure the concentration of a product, the biosensor is called metabolic
sensor. Another possibility is that the bioreceptor is combined with the analyte and
it does not change chemically but converts it to a sub-product, then the biosensor
is called catalytic sensor [70, 71].
Furthermore, from the point of view of the transducer the classification of
biosensors are based on the type of reading of the output signal generated. So, the
thermometric biosensors are those involving a temperature sensor and it measures
the amount of heat generated in bioreactions. This is mainly employed in the food
and cosmetic industries [72-74].

11 1.3 Biosensors | Universitat de Barcelona
Piezoelectric materials such as quartz have a stable vibration frequencywhen an
electrical signal at certain frequencies is applied in the quartz disc. Thereby, a
defined mass and shapes of the piezoelectric transducer, brings a known oscillation
frequency that depends on the intensity of the electrical signal input. Thus, an
addition of tiny mass on the surface transducerproduces a change of the oscillation
frequency that can be measured electrically. It is the principle under acoustic
biosensors work[75, 76]. Another example of piezoelectric biosensor isthe
microcantilevers. In this case, a mechanical change is detected when the tip of the
cantilever bend with themicro-weight provided by the attached biomolecules after
the interaction with the bioreceptor attached on the cantilever [77-79]. Its
applications are mainly in the foodindustry and clinical analysis.
From the standpoint of optics, the common principle of these biosensors is the
behavior of light within the limits of two media with different refractive index. Some
fundamental properties such as intensity, phase and the reflected light angle are
measured directly and used to calculate the mass of analyte integrated in the
biosensor. The refractive index at the interface changes in proportion to the mass
changes at the surface, that is, upon binding of molecules [80]. Techniques such as
Surface Plasmon Resonance (SPR), Optical wave guiding or Resonant Mirror (RM)
and Total Internal Reflection Fluorescence (TIRF), Optical fibers, evanescent wave-
based sensor or fluorescence spectroscopy, DNA-gold nanoparticles (GNPs), among
others [81] are used to detect these changes.
An example of these optical sensors is the optical fiber, which is a dielectric physical
entity that carries information by electromagnetic waves, such as light.These waves
must have a direction parallel to the axis of the fiber core. Generally, optical fiber
sensors have the capture probe at one end. After hybridization with the target DNA,
measured changes in fluorescence intensity between the duplex and a fluorescent
label [82, 83]. SPR and evanescent wave genosensors measure changes in
superficial optical parameters of a metal-dielectric interface caused by a chemical or
biochemical reaction due to the hybridization event [84, 85].Optical biosensors
based on a change of color due to a chemical reaction, can be read out with
absorbancespectrophotometer, such enzyme linked oligonucleotide array or
directlywith the eyes as the pregnancy test biosensor based on GNP. In this last
case, the GNP has its fundament on the color change undergone by the gold
nanoparticle dispersed (red) when passing to larger aggregates (blue). These
platforms used a sandwich system of three single DNA strands. Two of them are
capture probes, which are functionalized respectively with GNP or on latex
microparticles and on the nitrocellulose substrate. The third target is the DNA

12 1.3 Biosensors | Universitat de Barcelona
target, which has the two complementary sequences of the capture probes on its
ends. When a double hybridization occurs, GNP or latex microparticles aggregates,
with a subsequent change on solution color [86].
Fluorescence spectroscopy is based on the use of fluorophores as a label directly to
the DNA target or indirectly in the case of the more voluminous quantum dots.
These nanocrystals are excellent labels for biomolecules because they are most
stable, monochromatic and brighter than other fluorophores[87]. Depending on its
size, onceare excited releases a very characteristic wavelength in the visible
spectrum. Thus, the labeled analyte is easily detectable. These quantum dots can
be incorporated to other optical techniques as SPR [88]. Besides the label of the
target, this fluorophores can be attached to the capture probe forming a beacon
platform, see figure 1.3. For this purpose, a specific shape of the capture probe is
required in a single strand DNA hairpin fashion. This capture probe is labeled in an
end with a fluorophore and in the other end with a quencher. The hairpin
configuration makes that fluorophore and quencher keep closer avoiding
fluorescence emission. When DNA target hybridize and duplex formation occurs, the
hairpin shape disappears, lifting far the fluorophore (or dye) from the quencher and
so,the fluorophore emits its fluorescence [89].
Figure 1.3: Molecular beacon platform a) fluorophore not excited, b) fluorophore excited
Although the optical biosensors are widespread, those have some limits. The big
disadvantage of the optical DNA biosensor is the high cost of labels and the
transductors, besides the difficulty for its miniaturization limited its applicability.
This has prevented its use beyond of the research or in laboratory analysis, where

13 1.3 Biosensors | Universitat de Barcelona
voluminous and expensive equipment are used by experimented technician to
perform genomic arrays.
Electrochemical biosensors overcome the limitations of cost and miniaturization
presented in optical biosensors and opens the possibility to apply these devices to
POC and home diagnosis as happened with electrochemical glucose sensors.
Biosensors with electrochemical transducers are based on the principle of
production or consumption of electrons or ions, from a redox solution, from a label
or even directly from the biomolecules. According the IUPAC definition (1999),
these biosensors may be potentiometric, amperometric, voltammetricsurface
charge using Field Effect Transistors (FET), see figure 1.4, and conductimetric. The
applications of them are in many branches of science, engineering and medicine.
Figure 1.4: Field Effect Transistors platform
1.3.1 Biosensor evolution
The majority of biosensors involve an immobilization step of the bioelement
recognition on the sensor area. Paradoxically, the first biosensor based on
enzymatic detection of glucose described in 1962 by Clark and Lyons[90]had no
enzyme immobilized directly on the electrode. This consisted of confining a solution
of glucose oxidase (bioreceptor) between two semipermeable dialysis membranes
connected to a platinum electrode (transducer) in order to detect the concentration
of glucose in a blood sample. They measure the oxygen concentration surrounding
to the electrode surface, which was proportional to the amount of glucose in the
sample. Thereafter several authors have marked the evolution of these devices. In
1962 Guilbault et. al. shows the first analytical application of a biosensor with an

14 1.3 Biosensors | Universitat de Barcelona
immobilized enzyme [91]. Guilbault and Montalvo in 1969 announced the first
potentiometric sensor based on the detection of urea using an ion selective
electrode to determine change of NH4+ions concentrations [92]. In 1975, first
immunosensor on a potentiometric transducer was presented byJanata. In this
system, he detected Concanavalin A through covalent attachment between the
lectin and a polyvinyl chloride (PVC) membrane on a platinum electrode [93]. In
1979,the first amperometric immunosensor showed by Aizawa analyzed human
chorionic gonadotropin by an amperometric oxygen electrode [94]. Bergveld
showed the first ion selective field effect transistor (ISFET) sensor in 1972 [95].
During the 80s electro-polymerization techniques [96]and biosensors improvements
such as flow injection and optical fibers were introduced. During this decade
(1983), the SPR biosensing principles were described [97-100], and the first gas
phase biosensor based on a quartz crystal microbalance (QCM) was reported [101].
During the 90s, the boom in biosensors increased due to the introduction of nucleic
acids as biorecognition elements. Consequently, the knowledge of decades of
development with enzymosensors and immunosensors were applied to this new
world of biosensors.
The use of nucleic acids in biointerfaces not only promoted the development of
analytical techniques with higher resolution but also paved the way for research
into new materials and processes. However, the greatest contribution of these was
made in the genomics area in both biological and clinical field. Techniques such as
PCR and bioinformatics tools have become inseparable in the construction of DNA
microarrays [48,102,103].
Compared to immunosensors, the introduction of smaller biomolecules, such as
nucleic acids, made more relevant the interface use. The chemical structure of DNA
also makes the functionalization of sensor surfaces more challenging. DNA works
excellently as biorecognition element because of its high physical and chemical
stability. In addition, its inherent specificity, which is the primary characteristic in
the detection of analytes, achieved by the specific hybridization of a DNA sequence
attached onto the sensor surface complementary to the sequence of the analyte.
The applications of DNA biosensors have their main role in identifying target
sequences for the medical diagnostic. However, it is not the only field in which is
can apply. Identifying different strains of microorganisms makes the genosensors
powerful tools in the field of biosafety. Moreover,it does not mean biosafety only in
the bioterrorism protection waybut to identify potential crop pests or pathogens in
the food production chain[104-106]. Moreover,they serve as an analytical tool in
the quality analysis of reservoirs of water for human and animal consumption. DNA

15 1.4 Electrochemical DNA biosensors | Universitat de Barcelona
biosensors are also powerful tool in clinical diagnosis to even to formulate the most
suitable treatment of each patient in a personalized medicine. Likewise, serve as
platformto aid in evolutionary biology to determine the similarities between taxa at
the genetic level or to evaluate the paternity of a child.
1.4 Electrochemical DNA biosensors
In the market of the DNA sensors, the optical sensors have a high influence in
many applications. However, the electrochemical biosensors have been gaining
ground due to its better advantages. The bioelectroanalysis in DNA biosensors
systems is an area than rapidly expanding because of its great benefits.
Electrochemical techniques offer a high specificity; high selectivity; fast results; low
costand application to portable systems. These are desirable characteristics in every
industry and area of expertise. The synergy of considering the great possibilities of
many applications that offers DNA detection in addition to the excellent benefits of
employing electrochemical transduction makes a powerful platforms for successfully
face the challenges that are ahead in this field. Others advantages of
electrochemical techniques instead of optical techniques are the easier data
management due to no special imagine transduction is required. Other plus is the
possibleposterior automation in combination with other types of the assays such as
microfluidic and/or thermoblocks.
The basic elements of thiselectrochemical system are atransducer which serves
asworking electrode (WE) or a system with multiple WEs functionalized with only
one or different DNA capture probes, a reference electrode (RE) and a counter
electrode (CE). In these biosensors,the capture probes are single strands DNA
(ssDNA) and its sequences are predefined depending on the target that we want to
detect.The target (analyte) is another ssDNA complementary to the capture probe
sequence. The hybridization between both chains of DNA produces a physical-
chemical change that is detected with the transductor. The varieties of
electrochemical techniques that can be used with these devices offer them great
flexibility and open fields to manypossible applications.
Electrochemical biosensors are commonly composed by three electrodes WE, RE
and CE. This configuration was introduced in the 50s, by the revolutionary
approach of Clark, that modifies the polarography technique of Czech Jaroslav
Heyrovsky, introducing other electrode than working like REto calibrate the main

16 1.4 Electrochemical DNA biosensors | Universitat de Barcelona
electrode, resulted in the polarographic electrode Clark type. In this system, the
accuracy increased and oxygen consumption was reduced when both electrodes
were coated with plastic and glass down to the tip. This allowed the measurement
of the oxygen partial pressures in blood and Clark could improve theirblood
oxygenation detection system[90].The electrochemicaltechnique that used Clark
was an amperometric technique connecting WEand RE in an electrolytic cell [107].
Afterwards, another electrode was also considered,anauxiliary or CE, in order to
pass the current through CEinstead of the REthat makes more stable this last
electrode.
The WE is generally the electrode where reactions take places and the surface of
this electrode is functionalized with the recognition bioelement. In the RE, no
current flows and it has a fixed potential and known in order to determine a
potential difference between this one and the WE. The CE balances the
overpotentials on the WE[108].Usually, with this three-electrode system operates
the different types of DNA electrochemical biosensors, although in some cases can
be used a pseudo reference-counter and use this electrode for both functions, but it
gives less stability to the readout.
There are different electrochemical techniques to monitor DNA hybridization.Main
ones are amperometry, voltammetry, potentiometry, and conductimetry; in all
cases, the sensor takes the name of the technique used.
Amperometric sensors are based on measuring a resulting current of a chemical
process of oxidation or reduction of an electroactive species. These oxidation-
reduction processes, also called redox, are usually carried out at constant potential
on the working electrode and it is monitored the current versus time[109]. This
type of detection usually involves enzymatic labelling of the target.
Voltammetric sensors are based on the potential-current response of a polarizable
electrode in a solution.In these techniques, current changes, as a function of the
potential applied in the system, are studied[110]. The process involves redox
reactions, of one or more electroactive speciesat the electron and mass transfer
mechanisms. The latter may be due to migration (movement of species by charge
difference), convection (movement of matter by physical changes) and diffusion
(species movement by concentration gradient). In most cases, the redox is carried
out under conditions such that diffusion mechanism is the fundamental process in
the transport of the electroactive species. In this way, the migration and convection
are minimized by the addition of an excess of supporting electrolyte and preventing
movement of agitation and temperature gradients.Within the numerous techniques

17 1.5 DNA electrochemical sensing strategies | Universitat de Barcelona
used in voltammetry, the techniques of cyclic voltammetry (CV) and Differential
Pulse Voltammetry (DPV) are the most used[111].
Potentiometric systems involve the detection of a potential difference between the
WEand theRE.This difference of signal is created due to the increase of charges
from the attached and hybridized DNA on the WE. In order to improve the
sensitivity PNA capture probes are used for these applications, since these
bioreceptors have uncharged nature[112].One type of potentiometric sensors are
the ISFETs and as potentiometric, are sensors that react to changes in the activity
of a specific ion.However, due to its design the measuring principle is the transistor
channel modulation by the voltage difference that exists between the electrolyte
solution and the device gate [113].
The conductimetric system usually uses two pair of electrodes called interdigitated
electrodes and between the electrodes are immobilized the DNA capture probes.
The device measures the conductivity across the pair of electrodes in turn with a
fixed frequency. In presence of hybridized DNA, local changes of conductivity in the
electrodes neighborhood are registered. These changes are depending on the DNA
concentration and a quantitative analytic system can be developed, as in previous
electrochemical techniques[114].
As shown, many of these systems measure the electron dynamics in the solutions
where DNAisembedded. For this, there must be an ionic or electronic exchange
near the surface of the working electrode. For this reason, the suitable choosing of
bioreceptor and electrolyte as well as the electrodes is vital to select the adequate
detection technique.
1.5 DNA electrochemical sensing strategies
Electrochemical biosensorsto detect the DNA duplex formation started with rather
primitive methods using carbon and gold electrodes in combination with redox
indicators.This type of biosensors are considers an indirect, since the hybridization
event is detected through a third molecule, a redox label. In addition, the fact that
this interaction was performed on the transductor sensors makes them a single
surface technique (SST). On the other hand, to improve the abilities of the
electrochemical analysis of DNA in biological matrices, about 10 years ago the
double surface technique (DST) was proposed. In this system, the DNA
hybridization was performed at one surface (usually magnetic beads, optimized for
capturing target DNA or RNA from biological materials) and

18 1.5 DNA electrochemical sensing strategies | Universitat de Barcelona
electrochemicaldetection of the DNA hybridization was done at the WEsurface.. DST
offered very high sensitivity and specificity in the analysis of real DNA samples, but
it required more manipulation than usual SST or an efficient microfluidic system.
On a more easy way, there are the direct DNA electrochemical biosensors, were the
detection of the DNA hybridization event is done in a label-free manner.
1.5.1 Direct DNA electrochemical detection
The direct DNA detection relies in the detection of the hybridization event without
require any external label. There are many approaches reported in the literature for
the direct electrochemical detection of DNA. One of the first examples was based on
the direct reduction and oxidation of DNA in a mercury electrode. Hence, the
amount of reduced or oxidized DNA reflects the amount of DNA captured by
tensiometric processes [115]. Alternatively, label-free detection based on guanine
oxidation signals at carbon electrodes, or later G oxidation with a mediator at
Indium Tin Oxide (ITO) electrodes, was used[116]. At gold electrodes, DNA was
attached to the surface by an attachedterminal −SH group (thiol), forming an
interface with standing-up DNA molecules. At carbon electrodes, unlabeled probe
DNA was lying flatly at the electrode surface attached through electrostatic by the
amine groups in the DNA bases. These techniques worked relatively well with
synthetic oligos targets. They were, however, mostly poorly efficient in the analysis
of real DNA samples. There are also methods to discriminate between single strand
and double strand of DNA through the direct reduction of DNA. One of them is an
accumulation of DNA strands on the electrode surface by electrostatic induction
before the detection step. This accumulation and detection is done by adsorption
stripping voltammetry (ASV)[117]. The purine bases of DNA, adenine and guanine,
can be oxidized electrochemically, and this process is more clearly detected using
carbon or ITO electrodes among other metals, or with polymer-coated electrodes
[116]. The problems with these DNA biosensors are the high potentials needed for
direct oxidation of nucleic acid and thehigh background currents. To eliminate these
interferences, researchers have developed physical separation techniques. An
example of this, it is the use of magnetic beads functionalized with capture probes.
After hybridization, the beads are separated with a magnetic field and the DNA
strands are depurinated in an acidic solution. In this way, free adenines and
guanines are easilydetected [118].
But the wider spread approaches are the ones in which the hybridized DNA strands
are detected indirectly, and done through the use of chemical electromediators,

19 1.5 DNA electrochemical sensing strategies | Universitat de Barcelona
that can be diffusional solutions or redox labels attached directly or indirectly to the
DNA. In previousexample,in order to reduce the high voltages observed, a
potential that oxidizes a diffusional electromediator to contact the DNA strand is
applied. Guanine present in the polyelectrolyte DNA chain come into play and it
reduces again the electromediator, producing a regeneration of it. The difference of
the electrochemical mediator signal before and after oxidation gives us an
estimation of the amount of guanine available in the system [119].The above
approachis highly sensitive, in the order of femtomoles, but its main problem is that
its use represents the destruction of the sample, and after adding the mediator is
not anymore a direct system.
1.5.2 Indirect DNA electrochemical detection
1.5.2.1 Label-based systems with redox molecules or enzymatic
complex
Due to the weakness of the direct methods, the approaches involving electroactive
labeling techniques into the target DNA strand took boom. To mention a few, these
labels can be ferrocene redox species or enzymatic labels such as horseradish
peroxidase (HRP) or alkaline phosphatase (ALP), which are attached through a
biotin for its subsequent reaction with enzyme-streptavidin [120]. In these
systems, the signal of the redox species or redox enzyme complex is the
hybridization evidence. There also indirect labels, where unlabeled DNA target,
after hybridize with immobilized capture probe, has a second hybridization in a
different sequence in its chain with a third strand of labelled DNA. The advantage of
this is that the labelled synthetic chain can carry multiple labels of the same or
different redox species with different redox potential. If there are two distinct redox
species, the double peak of detection allows a multidetection of DNA in the same
electrode[121]. This method is called the sandwich method and has countless
variations.
1.5.2.2 Redox indicators
Other electrochemical approach worth noting is the detection of hybridization using
redox reporter molecules or redox indicators. These techniques use an additional
step subsequent to hybridization to introduce non-covalently electroactive
molecules, which behave in three ways. The first of them are positively charged
molecules and are accumulated on the surface where hybridization occurs, taking

20 1.5 DNA electrochemical sensing strategies | Universitat de Barcelona
advantage of the high density of negative charges of DNAthat exists to increase its
redox capacity. The Co(phen)3+3 and Ru (NH3)6
+3 are examples thereof. In a
contrary way, the negatively charged [Fe(CN)6]4- is expelled from the electrode
surface when the DNA concentration increases. In the third case, are those
molecules that are intercalated within the duplex DNA and exploit redox
electrochemistry of purine bases for itself electroactive activity. The methylene blue
is a typical example [122].
1.5.2.3 Nanostructure-based electrochemical amplification
One of the great challenges in detecting DNA hybridization is the magnification of
the signal. For this purpose there are many strategies involving nanostructures of
different materials and shapes. The uses of gold nanoparticles, carbon nanotubes,
dendrimers, magnetic nanoparticles, electroactive polymers, nanoporous
membranes and others are the order of the day. These platforms can be
functionalized with capture probes and have their greatest strength in increasing
the area available for the immobilization of capture probes. It is simple, to larger
area more immobilized capture probes, more hybridization events and
electrochemical reading signal improved [123-128]. The above different
electrochemical sensing strategies are summarized in table 1.1.
Table 1.1: DNA electrochemical sensing summary
The versatility of biosensors allowed its application in many and varied platforms
with these features. In addition, easy integration with microelectronic systems

21 1.6 Lab-on-a-chip | Universitat de Barcelona
allowed the incorporation of other technologies around them [129-131]. Depending
on the application, these portable biosensor system requires its integration with
other sample processing for separation of certain compound, sample concentration
or/and amplification, among others. For this purpose, it is required biosensor
integration in fluidic-electronic systems, resulting in the creation of new devices,
the LOCs.
1.6 Lab-on-a-chip
LOC refers to technologies that allow operations, which normally require a
laboratory on a much-miniaturized scale, within a portable or handheld device (see
figure 1.5). In this scale, the analysis of samples can take place in situ, exactly
where the samples are generated, rather than being delivered to a laboratory.This
in turn, reduces manufacturing cost and increases the high performance capability.
Because the benefits of low cost, high performance and miniaturization, this
technology isa fundamental and powerful tool for clinical research, diagnostics, drug
development, toxicology studies and the selection of patients for trials clinicians.
The criterion of miniaturization, that has given the push for continuous progress of
microelectronics technology, opens these devices to a wider range of applications.
From the first mechanized microsensors on silicon in the 70s and
microelectromechanical systems (MEMS), scientific improvements are focused on
developing new platforms that offer advantages such as portability, speed of
results, measurement accuracy, selectivity among other features. For these
reasons, and many others, the LOCs and other variations such as, cell-on-a-chip,
organ-on-a-chip, and tissue-on-a-chips were created [132].
Figure 1.5: Schematic of the "Genotyper" LOC device, developed by researchers at the University of
Michigan, which could identify different strains of flu

22 1.6 Lab-on-a-chip | Universitat de Barcelona
These microsystems for analysis or laboratories mounted on a microdevices are
taking importance in chemical, biological, pharmaceutical and medical fields to
name a few. The LOCs can perform all the functions of conventional laboratory
equipment, with the advantages of made analysis in parallel and in multiplexed
portable systems.The possibility of separation and quantification of these molecules
on a single platform is the main advantages of LOCs. Because of this
compartmentalization of functions, these microlabs need lower sample volumes,
generating less waste and reducing costs in the purchase of expensive reagents.
When working with smaller volumes also we reduce the reaction times for getting
faster answers in biochemical reaction systems. Also, being contained in sealed
chambers the risk of biological contamination is less [132, 133].
With these specialized techniques, the traditional approaches of analytical
measurements are undergoing a fundamental transition. These changes are driven
by scientific advances that are creating micro and nano sensors closer to the
biomolecules size, making trend towards detection of multiple molecules [132,
133]. The idea of isolate individual molecules in confined spaces is more seductive
than conventional techniques; often focus on the behavior of a large number of
molecules.More and detailed information aboutchemical and physical events is
extracted in studies on micro and nanosensors that involves high volume of bulk
molecules.
Because of this, the miniaturizations of the basic components of the LOCs are very
relevant and are being designed using numerous strategies and materials [134,
135]. The microelectronic component, which is the integration of electrochemical
microcells in those devices for using electronic readouts,is mainly fabricated by
standard photolithographic process, inkjet printing or screen-printing. The materials
used for the fabrication of the electrodes are as varied as the applications: gold,
silver and platinum,different forms of carbon, among others. These materials are
ableof generating an output signal of a biochemical process while this occurs in its
surface. Regarding the microfluidic component, the materials used for these
platforms are usually inert polymers such as polydimethylsiloxane (PDMS)[136].
However, new trends are directed to the use of non-silicon-based polymers such as
halogenated vinyl, styrenic, acrylics and polyolefins [137, 138]. The techniques
used to manufacture the microchannels and compartments are going from
traditional photolithography to revolutionary 3D imprinting methods [139, 140] This
without leaving aside all microengineering that makes possible the integration,
separation and subsequent mixing of the sample. In addition to the flow conditions,

23 1.7 Trends in biosensors | Universitat de Barcelona
pumps and valves, sealing cameras and other features of these small airtight
devices.
There are many applications for LOCs such as microfluidic dispenser,
electrophoretic separator, lysis of cell, DNA amplification by PCR, concentration
gradient generator, micro bioreactor for immunoassay, integration of a real-time
PCR, fluid samples preparation, cellular analysis, and biochips with protein or DNA
microarrays.
1.7 Trends in biosensors
Since 20 years ago, with the introduction of new technologies, the advances in
detection techniques are even more specific and with higher resolution. With the
new generation of materials and the revolutionary techniques of micro and
nanofabrication, the tendency of the scientific community and the market is clear:
to develop low cost smart devices capable of detecting, with highly selectivity and
sensitivity, many analytes in one shot of any type of compounds. We talked about
three key words in the historical context of the biomicro or bionanotechnological
development: biosensors, miniaturization and integration. Each one defines what is
and what will be the main scientific research around the world. In addition, the
three joined the hopeless offered by the romantic idea of the perfect tool for the
new technological revolution. As result among these three words, a tradeoff is
created and when the field of research in biosensors is stagnant, the other features
picking up the reins for bringing a higher degree of complexity and smallness.
For the biosensors its future development and research depends on producing
advantageous characteristics as specificity, portability, economy, simplicity and
robustness. The specificity offers precision and the certainty that we will detect
what we want in a complex matrix, decreasing the probabilities of errors in our
conclusions. This has been achieved through the creation of nanostructures
accompanied by multiple geometries of various materials from amorphous
nanomagnetic iron particles to some very definite, as carbon nanotubes, or gold,
silicon, supramolecular systems and, of course, more complex biomolecules, among
others. Moreover, the portability of these devices and the economy in its
manufacturing process guarantees their mass use, as well as their access to remote
areas with difficult environments and economies. The miniaturization of these
devices guarantees the success in the use of resources, the smaller amounts of
reagents and sample required and its portability. Also, improve of device
robustness opens new possibilities of use. To the success of biosensors

24 1.8 Biochips | Universitat de Barcelona
development, the suitable choice of biorecognition element and the best
transduction system are the first steps to determine.
1.8 Biochips
A biochip is a biosensor whose recognition element is DNA or antibodiesin a
multiple matrix of biosensors. In this way, a miniaturized device that contains DNA
or antibodiesbiosensing matrix or microarray is a strict definition of the biochip. The
array matrix is a network of specific binding sites where hundreds of chemical
reactions can occur simultaneously. These platforms have been developed to allow
genomic, proteomic and large-scale functional analysis. In general, there are two
types of biochips: DNA microarrays and protein microarrays, both integrated in
microfluidic chips. These devices are platforms with multiple channels and the
integration of these systems with arrays of biomolecules confined to a substrate is
called LOC. The protein microarrays are the platform used mainly for expression of
protein profiles. These microarrays can be used to examine protein-protein,
protein-ligand or enzyme-substrate interactions on a single biochip. In contrast to
DNA chips, protein microarrays require more steps for its manufacture. They are
also much more chemically unstable because proteins may lose its tertiary or
quaternary structure. Regarding the DNA arrays, its main advantages are the great
facility to anchor the DNA molecule over the substrate; its chemical stability; the
high specificity of the hybridization event, among others. Its versatility popularized
its use, and allowed the resolution of initial problems. In recent years, advances in
the DNA biochips have overcome the problems of low hybridization efficiency, poor
sequence discrimination, low signal detection and tedious procedures inherent in
the previous technologies. Now is possible to produce miniaturized arrays that use
small volumes of reagents. Besides, the ability to perform multisequence detection
with optical and electrochemical techniques makes that this field continues to
growth[141].
1.9 Commercial DNA biochips and microarrays
Major pharmaceutical, technology and medical companies have been realized about
the huge market behind DNA arrays. For this reason, the most powerful
international companieshave bet for their creations, each having a relative
successful. In the market, there are several designs of devices involving DNA
biosensor technologies. The applications are diverse, food, drugs, cosmetics,

25 1.9 Commercial DNA biochips and microarrays | Universitat de Barcelona
environmental, etc. Our commercial summary is focused to devices with biological
and medical diagnostic applications using DNA biosensors.
There is a difference in the definition of the terms DNA Chip and DNA microarrays.
Usually DNA chips have a much lower density per unit area of bioreceptor whereas
DNA microarrays are highly dense. This differencearises from the different methods
of immobilization of the capture probes. In the DNA microarrays, the syntheses of
oligonucleotides are made in situ.
Affymetrix is the flagship company of the manufacture of DNA microarrays. They
use a photolithography method for in situ synthesis of probes. This method involves
a series of steps of light exposure dependent on where each nucleotide selectively
added to the chain loses its protection training to lead to elongation of the
sequence to be built [142]. The disadvantages of this method are several, the
method is costly and time consuming and the different steps may introduce errors
in the bioreceptor sequences[141, 142]. Meanwhile, in DNA chips, pre synthesized
oligonucleotides are spotted on the electrode for its immobilization mainly with
nanoplotting or inject printing.Genometrics, Inc. with VistaMorph and
VistaExpressand Hyseq, Inc. with its HyChipGenosensor are companies producing
with this method. A different way of DNA bioreceptor attaching is the one
commercialized by Nanogen, which anchor the capture probes on the substrate
byelectronic attraction of the negatively charged DNA molecules, generating an
electric field at the desiredelectrodes in the array and so that the DNA molecules
aredrive and adhered specifically in the streptavidinactivated electrodes[141, 142].
There is another method developed by Agilent, to fabricateDNA microarrays. This
involves transporting phosphoramides and activators to specific sites of the
substrate by inkjet printing, of any single base of the bioreceptor sequence. Here,
through traditional chemistry, the elongation of the probe is produced, which can
be up to 60 base pairs [143, 144]. Other companies with similar devices are
Clontech Laboratories and Rosetta Inpharmatics[145, 146].
The pin-based fluid transfer methods are developed primarily by BioRobotics, Ltd.
(MicroGrid II); Gene Machines (OmniGrid); Gentix, Ltd. (Q Array). The pin-based
technology use pins with a micro-capillary channel that contains the liquid that will
be deposited on the substrate. For a more detailed review of techniques and
companies, see following references[141, 142]. The common to all these explained
methods is that none used electrochemical techniques to detect their targets. The
majority of them use fluorescent scanners and in some cases such as; Millenium
Pharmaceuticals and Biocore (General Electric division) have SPR DNA chips and

26 1.9 Commercial DNA biochips and microarrays | Universitat de Barcelona
Sequenom, Ltd. uses DNA spectrochips for mass spectrophotometry detection.
Nevertheless, all this equipment are extremely costly and voluminous, where is
required a trained personnel for their use, only affordable for few analytic
laboratories in the world.
Regarding the electrochemical detection there are some biodevices available
commercially[147, 148]. Some examples are:
E-Sensor XT-8
GenMark Diagnostics offers e-Sensor XT-8 technologiesto detect a respiratory
viral DNA.This technology integrates microfluidics and electrochemical detection.
The signal indicating hybridization event is generated by voltammetric technique
using a reporter probe with label of ferrocene. Like general summary of the
system, the real sample is obtained and then the target DNA is separated and
amplified by PCR outside of the final cartridge. In this way, the platform is not
an integrated LOC. The DNA is subject to exonuclease reaction to create ssDNA.
Then, the ssDNA is injected in the XT-8 electrochemical-microfluidic system
cartridge. This cartridge contains a solution with the reporter probe. Once inside
the specific viral reporter probe is hybridized with the target DNA. Through of
pumping system the mix is introduced in microfluidic chamber wherein the
target DNA will have a second hybridization with the pre-assembled capture
probe. Finally, the electrochemical reading is carrying out. Figure 1.6 shows us
a schematized procedure for this typical sandwich system.

27 1.9 Commercial DNA biochips and microarrays | Universitat de Barcelona
Figure 1.6:GenMark e-Sensor technology schematic
Source: http://www.genmarkdx.com/technology/esensor.php
The technology developed by this company is not integrating the PCR in the device,
it requires a laboratory and trained personal and the part of the sensing integrated
in the cartridge is quite tricky with many steps and reagents, such as the use of
exonucleases and three ssDNA to form the sandwich complex.
CombiMatrix Diagnostics has developed oligonucleotide microarray platform
containing 12544 individually addressable microelectrodes in a semiconductor
matrix. This approach requires labeling of the target DNA with biotin, which
(after hybridization with immobilized capture probe) binds Horseradish
peroxidase (HRP) streptavidin conjugate. The HRP-catalyzed enzymatic reaction
involves an oxidation of 3,3',5,5'-tetramethylbenzidine (TMB), followed by
amperometric determination of the product. CombiMatrix core technology is

28 1.9 Commercial DNA biochips and microarrays | Universitat de Barcelona
based on a specially modified semiconductor adapted for biological applications,
which contains arrays of platinum microelectrodes. The CombiMatrix system has
the ability to measure the signal present at that electrode site. The two main
components are ElectraSenseTM Reader and ElectraSenseTM microarray with
hybridization cap. The figure 1.7 was taken and modified of [148] and show the
CombiMatrix assembly.
Figure 1.7:CombiMatrixElctroSenseTM, A) B) C) Microarray assembly of ElectraSenseTM, D)
ElectroSensorTM reader unit, E) F) microphotos of the electrodes and spots with oligonucleotide
probes,G) HRP-TMB reaction for electrochemical detection scheme, H) Image of microarray and the
position and intensity signal of probes from ElectraSenseTM reader
This company, as previous, does not integrates the PCR, which leave far from a
POC application both devices.
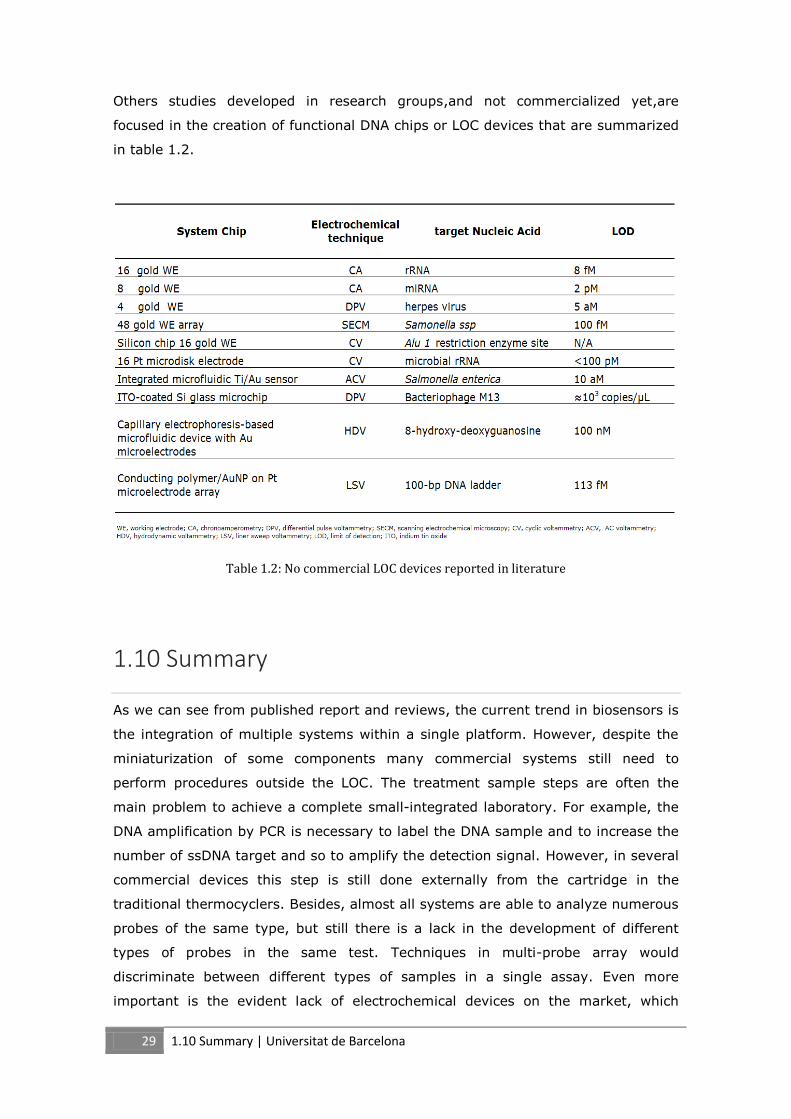
29 1.10 Summary | Universitat de Barcelona
Others studies developed in research groups,and not commercialized yet,are
focused in the creation of functional DNA chips or LOC devices that are summarized
in table 1.2.
Table 1.2: No commercial LOC devices reported in literature
1.10 Summary
As we can see from published report and reviews, the current trend in biosensors is
the integration of multiple systems within a single platform. However, despite the
miniaturization of some components many commercial systems still need to
perform procedures outside the LOC. The treatment sample steps are often the
main problem to achieve a complete small-integrated laboratory. For example, the
DNA amplification by PCR is necessary to label the DNA sample and to increase the
number of ssDNA target and so to amplify the detection signal. However, in several
commercial devices this step is still done externally from the cartridge in the
traditional thermocyclers. Besides, almost all systems are able to analyze numerous
probes of the same type, but still there is a lack in the development of different
types of probes in the same test. Techniques in multi-probe array would
discriminate between different types of samples in a single assay. Even more
important is the evident lack of electrochemical devices on the market, which

30 1.10 Summary | Universitat de Barcelona
provides many advantages to the LOC and makes it more competitive in the
market.
The device presented in this study overcome the limitations observed in the
diagnosis market devices with the development of an electrochemical multi-probe
DNA array for detection of different specific DNA sequences related with cancer.
The device integrates all the required steps to obtain in an easy way a direct
response after the sample introduction. The use of this equipment does not require
any other laboratory equipment or specialized personal, and can be use in POC
applications by the family doctor in medical centers.

31 1.11 References | Universitat de Barcelona
1.11 References
1. Azzam, W., A. Bashir, and O. Shekhah, Thermal study and structural
characterization of self-assembled monolayers generated from
diadamantane disulfide on Au(111). Applied Surface Science, 2011. 257.
2. Farjami, E., et al., "Off-on" electrochemical hairpin-DNA-based genosensor
for cancer diagnostics. Analytical chemistry, 2011. 83(5): p. 1594-1602.
3. Wang, J., Glucose Biosensors: 40 Years of Advances and Challenges.
Electroanalysis, 2001. 13(12): p. 983-988.
4. Amano, Y. and Q. Cheng, Detection of influenza virus: traditional approaches
and development of biosensors. Analytical and bioanalytical chemistry,
2005. 381(1): p. 156-164.
5. Feriotto, G., et al., Biosensor Technology and Surface Plasmon Resonance
for Real-Time Detection of Genetically Modified Roundup Ready Soybean
Gene Sequences. Journal of Agricultural and Food Chemistry, 2002. 50(5):
p. 955-962.
6. Tichoniuk, M., M. Ligaj, and M. Filipiak, Application of DNA hybridization
biosensor as a screening method for the detection of genetically modified
food components. Sensors, 2008. 8(4): p. 2118-2135.
7. Viswanathan, S., H. Radecka, and J. Radecki, Electrochemical biosensors for
food analysis. Monatshefte für Chemie - Chemical Monthly, 2009. 140(8): p.
891-899.
8. Neuži, P., et al., Revisiting lab-on-a-chip technology for drug discovery. Nat
Rev Drug Discov, 2012. 11(8): p. 620-632.
9. Ojanperä, I., M. Kolmonen, and A. Pelander, Current use of high-resolution
mass spectrometry in drug screening relevant to clinical and forensic
toxicology and doping control. Analytical and bioanalytical chemistry, 2012.
403(5): p. 1203-1220.
10. Scannell, J.W., et al., Diagnosing the decline in pharmaceutical R&D
efficiency. Nat Rev Drug Discov, 2012. 11(3): p. 191-200.
11. Kuczynski, J., et al., Experimental and analytical tools for studying the
human microbiome. Nat Rev Genet, 2012. 13(1): p. 47-58.
12. Hou, Y., et al., Microbial Strain Prioritization Using Metabolomics Tools for
the Discovery of Natural Products. Analytical chemistry, 2012. 84(10): p.
4277-4283.
13. Looser, M.O., A. Parriaux, and M. Bensimon, Landfill underground pollution
detection and characterization using inorganic traces. Water Research, 1999.
33(17): p. 3609-3616.

32 1.11 References | Universitat de Barcelona
14. Mattiasson, B., MIPs as Tools in Environmental Biotechnology, in Molecularly
Imprinted Polymers in Biotechnology, B. Mattiasson and L. Ye, Editors. 2015,
Springer International Publishing. p. 183-205.
15. Alam, A. and V. Sharma, Environmental Biotechnology-A Review.
Researcher, 2013. 5(4): p. 71-93.
16. Xie, J., et al., Analytical and environmental applications of nanoparticles as
enzyme mimetics. TrAC Trends in Analytical Chemistry, 2012. 39: p. 114-
129.
17. Golet, E.M., et al., Trace Determination of Fluoroquinolone Antibacterial
Agents in Urban Wastewater by Solid-Phase Extraction and Liquid
Chromatography with Fluorescence Detection. Analytical chemistry, 2001.
73(15): p. 3632-3638.
18. Malon, A., et al., Potentiometry at Trace Levels in Confined Samples: Ion-
Selective Electrodes with Subfemtomole Detection Limits. Journal of the
American Chemical Society, 2006. 128(25): p. 8154-8155.
19. Berger, R.G., Aroma biotechnology. 2012: Springer Science & Business
Media.
20. Omasa, K., et al., Air pollution and plant biotechnology: prospects for
phytomonitoring and phytoremediation. 2012: Springer Science & Business
Media.
21. Koutinas, M., et al., Bioprocess systems engineering: transferring traditional
process engineering principles to industrial biotechnology. Computational
and structural biotechnology journal, 2012. 3(4): p. 1-9.
22. Nikačević, N.M., et al., Opportunities and challenges for process control in
process intensification. Chemical Engineering and Processing: Process
Intensification, 2012. 52: p. 1-15.
23. Wijffels, R.H., O. Kruse, and K.J. Hellingwerf, Potential of industrial
biotechnology with cyanobacteria and eukaryotic microalgae. Current
opinion in biotechnology, 2013. 24(3): p. 405-413.
24. Tu, Z. and H. Zhang, [Controlled Veterinary Drug Delivery Systems against
Parasitic Infection]. Zhongguo ji sheng chong xue yu ji sheng chong bing za
zhi= Chinese journal of parasitology & parasitic diseases, 2015. 33(1): p.
58-63.
25. Amarante, M., et al., Species-specific PCR for the identification of Cooperia
curticei (Nematoda: Trichostrongylidae) in sheep. Journal of helminthology,
2014. 88(04): p. 447-452.

33 1.11 References | Universitat de Barcelona
26. Silva, M.V.B., et al., Identification of quantitative trait loci affecting
resistance to gastrointestinal parasites in a double backcross population of
Red Maasai and Dorper sheep. Animal Genetics, 2012. 43(1): p. 63-71.
27. Piorek, B.D., et al., Free-Surface Microfluidics/Surface-Enhanced Raman
Spectroscopy for Real-Time Trace Vapor Detection of Explosives. Analytical
chemistry, 2012. 84(22): p. 9700-9705.
28. Peng, L., et al., On-site Rapid Detection of Trace Non-volatile Inorganic
Explosives by Stand-alone Ion Mobility Spectrometry via Acid-enhanced
Evaporization. Scientific reports, 2014. 4.
29. Ma, Y., et al., Highly selective and sensitive fluorescent paper sensor for
nitroaromatic explosive detection. Analytical chemistry, 2012. 84(19): p.
8415-8421.
30. Yagur-Kroll, S., et al., Detection of 2, 4-dinitrotoluene and 2, 4, 6-
trinitrotoluene by an Escherichia coli bioreporter: performance enhancement
by directed evolution. Applied microbiology and biotechnology, 2015: p. 1-
12.
31. Carrascosa, L.G., et al., Nanomechanical biosensors: a new sensing tool.
TrAC Trends in Analytical Chemistry, 2006. 25(3): p. 196-206.
32. Minunni, M., et al., Biosensors as new analytical tool for detection of
Genetically Modified Organisms (GMOs). Fresenius' journal of analytical
chemistry, 2001. 369(7-8): p. 589-593.
33. Bagni, G., et al., Electrochemical biosensors as a screening tool of in vitro
DNA-drug interaction. Current Pharmaceutical Analysis, 2005. 1(3): p. 217-
224.
34. Bertók, T., et al., Electrochemical lectin based biosensors as a label-free tool
in glycomics. Microchimica Acta, 2013. 180(1-2): p. 1-13.
35. Kociketal, J., Biosensors-The tool for fast detection. Preparedness Against
Bioterrorism and Re-emerging Infectious Diseases, 2004: p. 191.
36. Mutlu, M., Biosensors in Food Processing, Safety, and Quality Control. 2010:
CRC Press.
37. Higson, S., Biosensors for medical applications. 2012: Elsevier.
38. Bruce Alberts, A.J., Julian Lewis, David Morgan, Martin Raff, Keith Roberts,
Peter Walter, Molecular Biology of the Cell. 6th edition ed. The Structure and
Function of DNA. 2002, New York: Garland Science.
39. Paleček, E. and M. Bartošík, Electrochemistry of Nucleic Acids. Chemical
reviews, 2012. 112(6): p. 3427-3481.

34 1.11 References | Universitat de Barcelona
40. Labuda, J., et al., Electrochemical nucleic acid-based biosensors: Concepts,
terms, and methodology (IUPAC Technical Report). Pure and Applied
Chemistry, 2010. 82.
41. Wang, L., et al., Recent advances in biocompatible supramolecular
assemblies for biomolecular detection and delivery. Chinese Chemical
Letters, 2013. 24(5): p. 351-358.
42. Piccinini, E., et al., Chemical Communications c5cc05837f.
43. Sukhorukov, G.B., et al., Multilayer films containing immobilized nucleic
acids. Their structure and possibilities in biosensor applications. Biosensors
and bioelectronics, 1996. 11(9): p. 913-922.
44. Takaoka, Y., A. Ojida, and I. Hamachi, Protein Organic Chemistry and
Applications for Labeling and Engineering in Live‐Cell Systems. Angewandte
Chemie International Edition, 2013. 52(15): p. 4088-4106.
45. Yang, H., Enzyme-based ultrasensitive electrochemical biosensors. Current
opinion in chemical biology, 2012. 16(3): p. 422-428.
46. Nöll, T. and G. Nöll, Strategies for ―wiring‖ redox-active proteins to
electrodes and applications in biosensors, biofuel cells, and nanotechnology.
Chemical Society reviews, 2011. 40(7): p. 3564-3576.
47. Kotanen, C.N., et al., Implantable enzyme amperometric biosensors.
Biosensors and bioelectronics, 2012. 35(1): p. 14-26.
48. Wang, J., Survey and summary from DNA biosensors to gene chips. Nucleic
acids research, 2000. 28(16): p. 3011-3016.
49. Park, M., S.-L. Tsai, and W. Chen, Microbial biosensors: Engineered
microorganisms as the sensing machinery. Sensors, 2013. 13(5): p. 5777-
5795.
50. Yang, M., M.E. McGovern, and M. Thompson, Genosensor technology and
the detention of interfacial nucleic acid chemistry. Analytica Chimica Acta,
1997. 346(3): p. 259-275.
51. Zhou…, M., Bioelectrochemical Interface Engineering: Toward the Fabrication
of Electrochemical Biosensors, Biofuel Cells, and Self-Powered Logic
Biosensors. Accounts of Chemical Research, 2011.
52. Monošík, R., M. Streďanský, and E. Šturdík, Biosensors-classification,
characterization and new trends. Acta Chimica Slovaca, 2012. 5(1): p. 109-
120.
53. Luppa, P.B., L.J. Sokoll, and D.W. Chan, Immunosensors—principles and
applications to clinical chemistry. Clinica Chimica Acta, 2001. 314(1–2): p.
1-26.

35 1.11 References | Universitat de Barcelona
54. Andreou, V.G. and Y.D. Clonis, Novel fiber-optic biosensor based on
immobilized glutathione S-transferase and sol–gel entrapped bromcresol
green for the determination of atrazine. Analytica Chimica Acta, 2002.
460(2): p. 151-161.
55. Choi, J.-W., et al., Optical biosensor consisting of glutathione-S-transferase
for detection of captan. Biosensors and bioelectronics, 2003. 18(12): p.
1461-1466.
56. Soldatkin, O., et al., Novel sucrose three-enzyme conductometric biosensor.
Materials Science and Engineering: C, 2008. 28(5): p. 959-964.
57. Surareungchai, W., et al., Dual electrode signal-subtracted biosensor for
simultaneous flow injection determination of sucrose and glucose. Analytica
Chimica Acta, 1999. 380(1): p. 7-15.
58. Prodromidis, M., et al., Bioelectrochemical determination of citric acid in real
samples using a fully automated flow injection manifold. Analyst, 1997.
122(10): p. 1101-1106.
59. Sheu, J.-T., et al., A possibility of detection of the non-charge based
analytes using ultra-thin body field-effect transistors. Biosensors and
bioelectronics, 2008. 23(12): p. 1883-1886.
60. Palchetti, I. and M. Mascini, Electrochemical Nucleic Acid Aptamer–Based
Biosensors. Electrochemical Biosensors, 2015: p. 75.
61. Radi, A.-E., Electrochemical Aptamer-Based Biosensors: Recent Advances
and Perspectives. International Journal of Electrochemistry, 2011. 2011.
62. Ananthanawat, C., et al., Surface plasmon resonance study of PNA
interactions with double-stranded DNA. Biosensors & bioelectronics, 2011.
26(5): p. 1918-1923.
63. Wang, J., DNA biosensors based on peptide nucleic acid (PNA) recognition
layers. A review. Biosensors and bioelectronics, 1998. 13(7): p. 757-762.
64. Mousa, S., Biosensors: the new wave in cancer diagnosis. Nanotechnology,
Science and Applications, 2010.
65. Liao, J.C., et al., Use of electrochemical DNA biosensors for rapid molecular
identification of uropathogens in clinical urine specimens. Journal of clinical
microbiology, 2006. 44(2): p. 561-570.
66. MacKay, S. and J. Chen. Biosensor systems and applications in genomics,
proteomics and metabolomics: A review. in Circuits and Systems (ISCAS),
2014 IEEE International Symposium on. 2014: IEEE.
67. Kuralay, F. and A. Erdem, DNA Biosensors, in Environmental Analysis by
Electrochemical Sensors and Biosensors. 2014, Springer. p. 313-330.

36 1.11 References | Universitat de Barcelona
68. Liang, H., et al., Functional DNA-containing nanomaterials: cellular
applications in biosensing, imaging, and targeted therapy. Accounts of
Chemical Research, 2014. 47(6): p. 1891-1901.
69. Ligaj, M., et al., Electrochemical DNA biosensor for the detection of
pathogenic bacteria Aeromonas hydrophila. Electrochimica Acta, 2014. 128:
p. 67-74.
70. Turner, A.P., Biosensors--sense and sensitivity. Science, 2000. 290(5495):
p. 1315.
71. Kang, Q., L. Yang, and Q. Cai, An electro-catalytic biosensor fabricated with
Pt–Au nanoparticle-decorated titania nanotube array. Bioelectrochemistry,
2008. 74(1): p. 62-65.
72. Mohanty, S.P. and E. Kougianos, Biosensors: a tutorial review. Potentials,
IEEE, 2006. 25(2): p. 35-40.
73. Bhand, S.G., et al., Fructose-selective calorimetric biosensor in flow injection
analysis. Analytica Chimica Acta, 2010. 668(1): p. 13-18.
74. Vermeir, S., et al., Microplate differential calorimetric biosensor for ascorbic
acid analysis in food and pharmaceuticals. Analytical chemistry, 2007.
79(16): p. 6119-6127.
75. Länge, K., B.E. Rapp, and M. Rapp, Surface acoustic wave biosensors: a
review. Analytical and bioanalytical chemistry, 2008. 391(5): p. 1509-1519.
76. Lec, R.M. and P. Lewin. Acoustic wave biosensors. in Engineering in Medicine
and Biology Society, 1998. Proceedings of the 20th Annual International
Conference of the IEEE. 1998: IEEE.
77. Abad, J., et al., Determination of organophosphorus and carbamate
pesticides using a piezoelectric biosensor. Analytical chemistry, 1998.
70(14): p. 2848-2855.
78. Tsai, J.-Z., et al., Resonant efficiency improvement design of piezoelectric
biosensor for bacteria gravimetric sensing. Bio-medical materials and
engineering, 2014. 24(6): p. 3597-3604.
79. Faegh, S., N. Jalili, and S. Sridhar, Ultrasensitive Piezoelectric-Based
Microcantilever Biosensor: Theory and Experiment. Mechatronics,
IEEE/ASME Transactions on, 2015. 20(1): p. 308-312.
80. Piliarik, M., H. Vaisocherová, and J. Homola, Surface plasmon resonance
biosensing. Methods in molecular biology (Clifton, N.J.), 2009. 503: p. 65-
88.
81. Teles, F. and L. Fonseca, Trends in DNA biosensors. Talanta, 2008. 77.

37 1.11 References | Universitat de Barcelona
82. Ko, S. and S.A. Grant, A novel FRET-based optical fiber biosensor for rapid
detection of Salmonella typhimurium. Biosensors and bioelectronics, 2006.
21(7): p. 1283-1290.
83. Liu, X. and W. Tan, A fiber-optic evanescent wave DNA biosensor based on
novel molecular beacons. Analytical chemistry, 1999. 71(22): p. 5054-5059.
84. Hutchinson, A.M., Evanescent wave biosensors. Molecular biotechnology,
1995. 3(1): p. 47-54.
85. Homola, J. and S.S. Yee…, Surface plasmon resonance sensors: review.
Sensors and Actuators B: Chemical, 1999.
86. Saha, K., et al., Gold nanoparticles in chemical and biological sensing.
Chemical reviews, 2012. 112(5): p. 2739-2779.
87. Leutwyler, W.K., S.L. Bürgi, and H. Burgl, Semiconductor clusters,
nanocrystals, and quantum dots. Science, 1996. 271(5251): p. 933-937.
88. Robelek, R., et al., Multiplexed hybridization detection of quantum dot-
conjugated DNA sequences using surface plasmon enhanced fluorescence
microscopy and spectrometry. Analytical chemistry, 2004. 76(20): p. 6160-
6165.
89. Huang, K. and A.A. Martí, Recent trends in molecular beacon design and
applications. Analytical and bioanalytical chemistry, 2012. 402(10): p.
3091-3102.
90. Clark, L.C. and C. Lyons, Electrode systems for continuous monitoring in
cardiovascular surgery. Annals of the New York Academy of sciences, 1962.
102(1): p. 29-45.
91. Guilbault, G.G., D.N. Kramer, and E.B. Hackley, New substrate for
fluorometric determination of oxidative enzymes. Analytical chemistry,
1967. 39(2): p. 271-271.
92. Guilbault, G.G. and J.G. Montalvo Jr, Urea-specific enzyme electrode.
Journal of the American Chemical Society, 1969. 91(8): p. 2164-2165.
93. Janata, J., Immunoelectrode. Journal of the American Chemical Society,
1975. 97(10): p. 2914-2916.
94. Aizawa, M., et al., Enzyme immunosenser: Ill. Amperometric determination
of human cherienic gonadotropin by membrane-bound antibody. Analytical
biochemistry, 1979. 94(1): p. 22-28.
95. Bergveld, P., Development, operation, and application of the ion-sensitive
field-effect transistor as a tool for electrophysiology. Biomedical Engineering,
IEEE Transactions on, 1972(5): p. 342-351.
96. Finkenstadt, V.L., Natural polysaccharides as electroactive polymers. Applied
microbiology and biotechnology, 2005. 67(6): p. 735-745.

38 1.11 References | Universitat de Barcelona
97. Kretschmann, E., Die bestimmung optischer konstanten von metallen durch
anregung von oberflächenplasmaschwingungen. Zeitschrift für Physik, 1971.
241(4): p. 313-324.
98. Kretschmann, E. and H. Raether, Notizen: Radiative Decay of Non Radiative
Surface Plasmons Excited by Light. Zeitschrift für Naturforschung A, 1968.
23(12): p. 2135-2136.
99. Liedberg, B., C. Nylander, and I. Lunström, Surface plasmon resonance for
gas detection and biosensing. Sensors and actuators, 1983. 4: p. 299-304.
100. Pockrand, I., et al., Surface plasmon spectroscopy of organic monolayer
assemblies. Surface Science, 1978. 74(1): p. 237-244.
101. Guilbault, G.G. and J.H. Luong, Gas phase biosensors. Journal of
biotechnology, 1988. 9(1): p. 1-9.
102. Tothill, I.E., Biosensors for cancer markers diagnosis. Seminars in Cell &
Developmental Biology, 2009. 20(1): p. 55-62.
103. Khlebodarova, T.M., et al., Application of bioinformatics resources for
genosensor design. Journal of bioinformatics and computational biology,
2007. 5(02b): p. 507-520.
104. Ward, E., et al., Plant pathogen diagnostics: immunological and nucleic
acid‐based approaches. Annals of Applied Biology, 2004. 145(1): p. 1-16.
105. Mousavi, S.R. and M. Rezaei, Nanotechnology in agriculture and food
production. J Appl Environ Biol Sci, 2011. 1(10): p. 414-419.
106. Bott, N.J., et al., Toward routine, DNA-based detection methods for marine
pests. Biotechnology advances, 2010. 28(6): p. 706-714.
107. CLARK JR, L.C. and E.W. CLARK, A personalized history of the Clark oxygen
electrode. International anesthesiology clinics, 1987. 25(3): p. 1-29.
108. Dietze, W., H.-P. Haar, and W. Obermeier, Electrochemical analysis system.
1994, Google Patents.
109. Roussel, T., et al., Amperometric Techniques, in Encyclopedia of Microfluidics
and Nanofluidics, D. Li, Editor. 2008, Springer US. p. 39-47.
110. Bard, A.J., M. Stratmann, and P. Unwin, Encyclopedia of Electrochemistry
volume 3: Instrumentation and Electroanalytical Chemistry. 2003: Wiley-
VCh.
111. Protti, P., Introduction to modern voltammetric and polarographic analisys
techniques. Editorial AMEL, 4ta. edición, Italia, 2001: p. 2-37.
112. Bockris, J.O.M. and A.K. Reddy, Modern electrochemistry: an introduction to
an interdisciplinary area. 2012: Springer Science & Business Media.
113. Wang, J., Analytical electrochemistry. 2006: John Wiley & Sons.

39 1.11 References | Universitat de Barcelona
114. Stradiotto, N.R., H. Yamanaka, and M.V.B. Zanoni, Electrochemical sensors:
a powerful tool in analytical chemistry. Journal of the Brazilian Chemical
Society, 2003. 14(2): p. 159-173.
115. Tomschik, M., et al., Reduction and oxidation of peptide nucleic acid and
DNA at mercury and carbon electrodes. Journal of Electroanalytical
Chemistry, 1999. 476(1): p. 71-80.
116. Palecek, E., Oscillographic polarography of highly polymerized
deoxyribonucleic acid. Nature, 1960. 188: p. 656-657.
117. Paleček, E., Adsorptive transfer stripping voltammetry: Determination of
nanogram quantities of DNA immobilized at the electrode surface. Analytical
biochemistry, 1988. 170(2): p. 421-431.
118. Wang, J. and A.-N. Kawde, Amplified label-free electrical detection of DNA
hybridization. Analyst, 2002. 127(3): p. 383-386.
119. Fan, Y., et al., TiO 2-graphene nanocomposite for electrochemical sensing of
adenine and guanine. Electrochimica Acta, 2011. 56(12): p. 4685-4690.
120. Alfonta, L., A.K. Singh, and I. Willner, Liposomes labeled with biotin and
horseradish peroxidase: A probe for the enhanced amplification of antigen-
antibody or oligonucleotide-DNA sensing processes by the precipitation of an
insoluble product on electrodes. Analytical chemistry, 2001. 73(1): p. 91-
102.
121. Vercoutere, W. and M. Akeson, Biosensors for DNA sequence detection.
Current opinion in chemical biology, 2002. 6(6): p. 816-822.
122. Zhu, L., et al., Electrochemical Behaviors of Methylene Blue on DNA Modified
Electrode and Its Application to the Detection of PCR Product from NOS
Sequence. Sensors, 2008. 8.
123. Cai, H., et al., Electrochemical detection of DNA hybridization based on
silver-enhanced gold nanoparticle label. Analytica Chimica Acta, 2002.
469(2): p. 165-172.
124. Du, P., et al., Electrochemical DNA biosensor for the detection of DNA
hybridization with the amplification of Au nanoparticles and CdS
nanoparticles. Bioelectrochemistry (Amsterdam, Netherlands), 2009. 75(1):
p. 37-43.
125. Zanoli, L.M., R. D'Agata, and G. Spoto, Functionalized gold nanoparticles for
ultrasensitive DNA detection. Analytical and bioanalytical chemistry, 2012.
402(5): p. 1759-1771.
126. Zhang, Q., et al., Applications of carbon nanotubes to electrochemical DNA
sensors: a new strategy to make direct and selective hybridization detection

40 1.11 References | Universitat de Barcelona
from SWNTs. Advances in Natural Sciences: Nanoscience and
Nanotechnology, 2011. 1.
127. Zhang, Y., et al., An electrochemical DNA sensor based on a layers-film
construction modified electrode. The Analyst, 2011. 136(20): p. 4204-4210.
128. Astruc, D., Electron-transfer processes in dendrimers and their implication in
biology, catalysis, sensing and nanotechnology. Nature chemistry, 2012.
4(4): p. 255-267.
129. Chin, C.D., V. Linder, and S.K. Sia, Lab-on-a-chip devices for global health:
past studies and future opportunities. Lab on a chip, 2007. 7(1): p. 41-57.
130. Nyholm, L., Electrochemical techniques for lab-on-a-chip applications. The
Analyst, 2005. 130.
131. Rackus, D.G., M.H. Shamsi, and A.R. Wheeler, Electrochemistry, biosensors
and microfluidics: a convergence of fields. Chemical Society reviews, 2015.
132. Temiz, Y., et al., Lab-on-a-chip devices: How to close and plug the lab?
Microelectronic Engineering, 2015. 132: p. 156-175.
133. Zhao, Y., et al., Lab-on-a-chip technologies for single-molecule studies. Lab
on a Chip, 2013. 13(12): p. 2183-2198.
134. Herold, K.E. and A. Rasooly, Lab on a Chip Technology: Fabrication and
microfluidics. Vol. 1. 2009: Horizon Scientific Press.
135. Giannitsis, A.T., Microfabrication of biomedical lab-on-chip devices. A review.
Estonian Journal of Engineering, 2011. 17.
136. Sia, S.K. and G.M. Whitesides, Microfluidic devices fabricated in poly
(dimethylsiloxane) for biological studies. Electrophoresis, 2003. 24(21): p.
3563-3576.
137. Taberham, A., et al., The fabrication of lab-on-chip devices from
fluoropolymers. Journal of Micromechanics and Microengineering, 2008.
18(6): p. 064011.
138. Nunes, P.S., et al., Cyclic olefin polymers: emerging materials for lab-on-a-
chip applications. Microfluidics and nanofluidics, 2010. 9(2-3): p. 145-161.
139. Fiorini, G.S. and D.T. Chiu, Disposable microfluidic devices: fabrication,
function, and application. BioTechniques, 2005. 38(3): p. 429-446.
140. Comina, G., A. Suska, and D. Filippini, PDMS lab-on-a-chip fabrication using
3D printed templates. Lab Chip, 2013. 14(2): p. 424-430.
141. Chang Ming Li, H.D., Qin Zhou, and Kai H. Goh, Electrochemical Sensors,
Biosensors and their Biomedical Applications. First Edition ed, New York:
Academic Press.
142. Heller, M.J., DNA microarray technology: devices, systems, and applications.
Annual review of biomedical engineering, 2002. 4(1): p. 129-153.

41 1.11 References | Universitat de Barcelona
143. Van Swearingen, A.E.D., et al., Combination therapy with MEK inhibition is
efficacious in intracranial triple negative breast cancer models. Cancer
Research, 2015. 75(15 Supplement): p. 2579-2579.
144. Siggers, T., et al., Characterizing the DNA Binding Site Specificity of NF-κB
with Protein-Binding Microarrays (PBMs). NF-kappa B: Methods and
Protocols, 2015: p. 609-630.
145. Srivastava, M., et al., Reduced PARP1 as a Serum Biomarker for Graft
Rejection in Kidney Transplantation. J Proteomics Bioinform, 2015. 8: p.
031-038.
146. Nakayama, S., et al., FOXD1 Expression Is Associated with Poor Prognosis in
Non-small Cell Lung Cancer. Anticancer research, 2015. 35(1): p. 261-268.
147. Castillo-León, J., Microfluidics and Lab-on-a-Chip Devices: History and
Challenges, in Lab-on-a-Chip Devices and Micro-Total Analysis Systems.
2015, Springer. p. 1-15.
148. Rodrigo, M.A.M., et al., Electrochemical Microarray for Identification
Pathogens: A. Int. J. Electrochem. Sci, 2014. 9: p. 3431-3439.

42 | Universitat de Barcelona
Chapter Two

43 2.1 Interfaces | Universitat de Barcelona
2.1 Interfaces
In electrochemical biosensors, the interface is the nanometric monolayer that links
the electrode with the bioreceptor, so it is a relevant connection from the micro
(the electrode) to the nanoscale (biomolecule)[149].
In electrochemical devices, the interface is the region where electron transfer
occurs from the solution bulk to the electrode surface. In this area occurs
desorption or absorption of molecules, diffusion of reagents, chemical reactions
among others.
In biosensors, the main objective of the interfaces is focused on the conception and
elaboration of functionalized surfaces of materials for biosensing. The idea is to
develop surface modification strategies to improve physical and chemical
parameters of the electrodes materials that are reflexed in a better performance of
the biosensors. In this way, the sensibility, efficiency and hardiness of the
biosensor are heightened. With this purpose, the interface is fundamental in
creating an antifouling sensor surface to reduce non-specific adsorption (NSA) of
undesired molecules, to help in the electron transfer forenhancing electrochemical
signal detection, to create a high surface anchoring area to link the bioreceptors,
among others[150]. Therefore, the biosensors interface is one of the main pillars in
the fabrication of these devices[151, 152].
Biosensor interfaces include the use of the nanostructures of diver materials and
shapes also. For electrochemical biosensing applications, the layer or multilayer
designs for the interface would include the specific biomolecule recognition to
posterior integration in microdevices that use electrochemical transducers[153].
One fundamental pillar of the biosensors is its behavior in the modern bioelectronic
circuits. The wide range of applications that involve the use of these microdevices
has led to rethink the old approaches for the bioelement immobilization. Besides,
with the advance in the nanofabrication techniques and the incorporation of new
materials, it has been possible design new architectures and 3D scaffolds[154,
155].
Bottom Up techniques are the principal methods for fabrication of self-organizing
functional systems in a nanometric scale from down, the transducer in our case, to
up, the whole layers of the biosensor [156-158]. For that, different techniques are
used such as Atomic Layer Deposition (ALD); excellent to produce core-shell
nanostructures and sol–gel nanofabrication; relevant to obtain functional metal

44 2.2 Self-assembled Monolayers (SAMs) | Universitat de Barcelona
oxide materials and some alloys. Moreover, Chemical Vapor Deposition (CVD) and
Physical Vapor Deposition (PVD) are vapor phase deposition techniques frequently
used in the synthesis of carbon nanostructures like nanotubes or sheets. One of the
most important bottom up technique due to its simplicity and low cost is the
molecular self-assembly technique (MSA)[159, 160]. These nanofabrication
methods are based in the spontaneous self-assembly of molecules without the
presence of outside interactions. Because of their spontaneous nature and ease of
manufacturing procedures, the self-assembly approach is widespread and currently
many researchers still consider it. However, the biophysics behind self-assemblyit is
still poor understood[161]. Its applications are mainly in biosensors, biotechnology
and biomedicine.
The self-assembly involves the term of self-organization and this is defined as the
spontaneous formation of hierarchical complex structures from
predesignedmolecules [162]. Molecular self-assembly mechanism has notable
implications in nanofabrication processes since its reducethe costly processes and
because does not require other techniques and difficult manufacturing steps[163].
Besides, it permits to create supramolecular structures susceptible to preset
patterns. This technique can be used for both biological molecules and biological
supramolecular structures as an integral part of the interface. This allows the
formation of thermodynamically stable structures more complex and functional.
Other advantage of MSA structures is their capacity of self-repair offering very
homogeneous interfaces.
2.2 Self-assembled Monolayers (SAMs)
SAMs are a type of MSA to the fabrication of single molecules layers on the
substrate. SAMs represent new fabrication mechanisms of structures and forms at
nanoscales, which traditional techniques do not include. They are in many fields of
technology and their study resulted in a multitude of learning about the interfacial
mechanics at the atomic level[164-166]. Although not represent the last frontier of
nanotechnology development, we can say that its use significantly expanded
research in surface science and materials. The SAMs are highly ordered and low-
dimensional molecular assemblies. These are formed spontaneously by adsorption
on different single crystal surfaces of different materials. Some authors

45 2.2 Self-assembled Monolayers (SAMs) | Universitat de Barcelona
considerSAM like dynamic nanostructures. Table 2.1 shows a summary of type of
moleculesand its counterpart substrates for its immobilization.
Table 2.1: Different self-assembled systems
The idea of self-assembled monolayers was in the mind of Jacob Sagiv in 80s early.
The adsorption of silane molecules on glass surface, offered a highest versatility on
the traditional Langmuir-Blodgett films. Then many researches introduced new
molecules on new materials to find self-assembled systems different to the silanes.
Nuzzo and Allara at Bell laboratories were the first in reporting the disulfide
molecules behavior on gold[167]. It is the most typical SAM system and it has been
the center of numerous studies. However, the complete physic-chemical processes
of the self-assembly is not clear yet. Scheme 2.1 shows some example of the
interactions chemistry and the different interface possibilities behinds SAMs.

46 2.2 Self-assembled Monolayers (SAMs) | Universitat de Barcelona
Scheme 2.1: Some Bottom Up interfaces and schematic sketch of SAM examples, a) n-
alkylphosphoric acid SAM, b) multilayer SAM nanodielectric (SAND), c) PEG-phosphoric acid SAM,
d) mixed SAM.
In general, SAMs have two principal components a crystalline substrate –generally
a metal or glass- and one molecule with both a “head group” in one end and a
“functional group” in the other end. The head group should have specific affinity for
the substrate and the functional group offers a reactive group for its interaction
with other molecule or biomolecule. In figure 2.1, we can see a most simplified
scheme of the structure of SAMs.

47 2.3 Thiol Self-assembled Monolayers | Universitat de Barcelona
Figure 2.1: Typical representation of self-assembled monolayer
2.3 Thiol Self-assembled Monolayers
Nowadays the alkylthiolate monolayers are the most widespread SAMs used in
biological applications[168-170]. The strong dative binding gives high stability of
gold-sulphur interactions and allows the functionalization of many different
nanostructures. The strong adsorption of sulphur-based compounds like thiols,
disulphides, sulphides, and other related molecules on crystalline metals, especially
gold (Au) and silver (Ag) make of these systems tools friendly which electronics
and easy to use in laboratories[171-174]. The ability to control the interface
modifications with a molecular level approach and the capacity to characterize the
molecular buildings are other advantages of the alkylthiolate SAMs[175-179].
In this project, we chose the thiol-SAMs due to its big advantages exposed above
and its notorious applications in DNA biosensors. Different types of SAM were
tested to compare its performance in the development of biosensor.
2.3.1 Chemistry, kinetic and structure of thiol SAMs
During the SAM formation, alkanethiols chemisorption takes place on gold surface.
This process can be considered as an oxidative addition of the S-H bind to the gold
surface and posterior elimination of hydrogen byreductive procedure. When a clean
gold surface is used, the hydrogen of the thiolated group is removed as a hydrogen
molecule (H2). It must be noted that in this reaction, the molecule chemisorpted on
gold is an alkane-thiolate and the exact behavior is currently unknown[180-183].
However, the most accepted theory is that the shared pair of electrons to form this

48 2.3 Thiol Self-assembled Monolayers | Universitat de Barcelona
type of covalent bond, called dative bond, are coming from the same atom, the
thiol in this case, that interacts strongly with the two vacant of the gold atoms on
the substrate. Regarding other sulphur-based molecules, the chemisorption
mechanisms have been little studied. However, many proposals incorporates Au-
adatom model[184-188]. Besides, this studies generally working with ultraplanar
gold with perfect hexagonal unit cells. This model proposes a continuous interaction
between the adsorbates and the gold surface. The dynamical reconstruction of the
surface involves the formation of thiolate–adatom moieties. In this way, thiolate–Au
complexes have been proposed as the building blocks of SAMs not only for planar
surfaces, but also for the case of thiol-capped Au nanoparticles. Regarding (111)
crystalline organization the model is valid but the amorphous geometries not.
The SAM structure depends of several factors and their kinetic of formation
also[189, 190]. The size of the adsorbed molecule, the alkyl chain length, the
crystal organization of gold, temperature, pressure, surface clean among others,
are factors to take into account during the SAM formation[191-193]. The most
common kinetic of SAM formation consist in many steps; the first one of them
involves the physisorption of molecules followed by chemisorption of these. Then,
with the molecules in parallel configuration to substrate surface, the ordered
domains appear on the substrate. Therefore, to add more molecules we obtain a
tilted transition in the configuration of alkyl chains. Finally, the defect correction is
carrying out due to the movement and reorganization of these molecules on the
substrate. For further information about the SAM formation, we can see ref [152,
194-200]
2.3.2 Self-assembled monolayers preparation
The SAMs formation can be done by spontaneous adsorption from a liquid medium
or gaseous phase. The gas method is used under conditions of ultra-high vacuum
(UHV) when the application requires. In other hand, the assembly from a solution is
an effective method for most applications, especially those requiring contact with
crystalline solid surfaces. Due to the nature of the project, the immobilization
method from solution was chosen. The protocol to follow is simple; the substrate
used to form the monolayer is dipped in a solution containing the thiolated
molecule. To achieve reproducibility in the manufacture of the SAM, the preparation
and clean conditions should be optimal.

49 2.3 Thiol Self-assembled Monolayers | Universitat de Barcelona
2.3.3 Self-assembled monolayers test
Considering the information in the literature, three different self-assembling
systems were tested in order to choose the one that offer the best results in our
platform. In order to reduce NSA two interfaces were chosen with polyethylene
glycol (PEG) integrated in the linker, since these molecules is a well-recognized
antifouling molecule. Two different anchored thiolated molecules were used in each
system, a disulphide molecule in one case and a thioctic acid in the other case.
These two linkers are including a maleimide group at one end for labelling with the
capture probe. Both systems were compared with the most widespread interface
reported in biosensors, a mixed monolayer of 6-mercapto-1-
hexanolmercaptohexanol (MCH) and thiolated-DNA. The working oligos used in the
experimental part of this work are common elements in the three SAMs. The first
one is the 23-mercapture probe (CP), and it has in the 5‟ end a thiol group. In all
these platforms, this thiolated-DNA capture probe is used for its direct attachment
on gold, in the case of the mixed monolayer with MCH, or for the interactions of the
thiol moiety with the maleimide group at the end of the surface-attached linker.
The second oligo is the PCR amplified target DNA. It has different lengths,
depending on the different sequences that will be detected in the array.The 5‟ end
of the target is labelled with ferrocene (Fc) redox molecule, by means of a Fc-
labelled primer used in the PCR,that gives the electrochemical signal required to
detect the hybridization event. For the full detection of the cancer, there were
fourteen different CPs with their corresponding target DNA.
Another molecule in common, in each one of the monolayer tested, is the MCH. In
one case because it is part of the monolayer and in the case of the interfaces based
in PEG, because it is the molecule used to block the free maleimide groups still
unreacted with the thiolated-CP. MCH is a short alcohol molecule of six carbon with
a sulfhydryl group at its end (see figure 2.2). Generally is used to avoid the non-
specific adsorption (NSA) and like antifouling agent over the gold surface. This NSA
can interfere with detection measures either concealing them or giving false
positives. NSA is one of the major problems in biosensing interfaces and so it is
very relevant the study of an appropriate interface. Other function of the MCH is to
serve like spacer between bigger molecules. Because of its small size the kinetic of
reaction with the gold surface is often faster that the longer molecules and it could
be used as a spacer between the bioreceptors on the sensor surface, for improving
its next interaction with the target.

50 2.3 Thiol Self-assembled Monolayers | Universitat de Barcelona
Figure 2.2: 6-Mercapto-1-hexanol structure
Table 2.2 shows the conditions involved in each interface. For each immobilized
layer. The distinct immobilization times tested gave us crucial information about
possible reorganizations in the SAMs formation dynamics. Some of the buffers,
times PCR conditions and temperature settings were in the original confidential
protocol of the company Genomica S.A.U, and so there are not introduced in this
thesis. There were washing steps after each immobilization step in order to avoid
NSA, the formation of disulfide bonds and to clean the SAM surrounding
environment. After having the particular SAM interface, the target DNA was
immobilized under flow. The idea was to detect the hybridization event and to
observe the kinetic behavior. Electrochemical measurements were done before
target DNA injection to discard possible contaminations. The electrochemical
reading performed after hybridization permit us to detect the duplex formation.
Moreover, SPR optical technique was parallel used to characterize all the
immobilization steps on the biosensor.
Table 2.2: Fixed features during the molecular self-assembly of the biosensor

51 2.3 Thiol Self-assembled Monolayers | Universitat de Barcelona
2.3.4 Capture probe and mercaptohexanol SAM (CP-MCH)
The first interfacetested was the most typical SAMreported[201]; the CP-MCH
mixed monolayer. Both molecules have a thiol in one of its end and these functional
groups are anchorage on the gold surface. The concentrations used for both
molecules were 1 μM in a ratio of 1:9 for CP and MCH respectively. For this SAM
formation was necessary only one-step, being just necessary the immersion of the
gold substrate where was done only one time.
2.3.5 Lipoic acid maleimide-Polyethylene glycol SAM
(LAM-PEG)
One of the two PEG-based linker is a 5-[(3R)-dithiolan-3-yl] pentanoic acid-C4-
NHCO-EG6-C2-maleimide (LAM) where EG is ethylene glycol unit. The LAM
molecule (see figure2.3) has a thioctic acid (lipoic acid derivate) with two sulfur
atoms in a pentagonal cycle binding between them by disulfide bond, these two
atoms are gold anchor. This linker has a PEG arm in its alkyl chain, as we
introduced before, the PEG inclusion was to decrease the NSA. Finally, this linker
has a maleimide group in the other end. The maleimide group is very reactive with
single thiolated molecules and in this way we are anchored the thiol of capture
probe on the sensor surface. This SAM has three formation steps. The initial level
consists in a SAM of the LAM in 1 μM concentration. The second level has two
molecules and two immobilization steps, one for each molecule added. First the
thiolated CP (1 μM) was interacted with the maleimide moiety. Then the 1 μM MCH
was added to block the remaining maleimide and gold surface still unreacted.
Figure 2.3: Lipoic acid maleimide structure

52 2.3 Thiol Self-assembled Monolayers | Universitat de Barcelona
2.3.6 Maleimide-PEG disulphide SAM (MalPEG)
The other PEG-based linker tested is a HO-EG6-C11-S-S-C11-EG6-NHCO-Maleimide
(MalPEG). This molecule has a maleimide disulphide with two PEG arms. Each arm
has an alkyl chain and then a six PEG subunit. One arm ends with hydroxyl group
and the other with maleimide group (see figure 2.4). Like in the above molecule,
this group will reacted with the thiol group of the CP and/or the thiol of the MCH.
The SAM formation process is similar than LAM-PEG SAM, the monolayer
immobilization consists in three steps also. In a similar way, first the monolayer of
MalPEG was immobilized, then the CP and finally the MCH molecule is introduced
into the double layer system. The concentration used for each molecule was 1 μM.
Figure 2.4: Maleimide-PEG disulphide structure
Figure 2.5 schematize each of the SAM systems used during the experimental sets.
It is notorious the double level of the SAMs that uses the PEG based linkers. There
are few reported articles related with these two PEG linkers and these papers are
focused on the formation of monolayers but without any practical application. In
this project, we used a biosensor interface and we studied its effect in the biosensor
performance.

53 2.4 Techniques for SAM characterization | Universitat de Barcelona
Figure 2.5:Three SAMs system tested, a) CP-MCH, b) LAM-PEG, c) MalPEG
2.4 Techniques for SAM characterization
Even though the self-assembly process is far from being completely controlled, we
can monitor whether certain characteristics during their formation process. SAM
characterization is important in the development of an optimal biosensing platform,
as we introduced before. There are several techniques to characterize a SAM. In
literature, we found infinity of studies, depending of the work aim. We summarized
some of them in table 2.3. In this work, we do not contemplate deep structural
organization study of the monolayer, but in the benefits that different types of
interfaces bring to our electrochemical DNA biosensor. In this sense, we have
studied optically and electrochemically the surface coverage, stability and NSA of
different interfaces to check the improvements on the selectivity and sensitivity in
the electrochemical DNA sensor. In practical terms, we optimize optical and
electrochemically a sensing interfaces for subsequent integration into a LOC device
(see chapter three for more detail)

54 2.4 Techniques for SAM characterization | Universitat de Barcelona
Table 2.3: Techniques for SAM characterization
The techniques used for the characterization of the SAMs in this work are explained
following.
2.4.1 Surface Plasmon resonance (SPR)
One of the optical techniques more efficient in the study of surface-interface
interactions is SPR[202-204]. The mechanism of surface plasmon is well known
today and we can found several publications discussing their properties in detail.
Surface Plasmons are surface electromagnetic waves that propagate parallel along
a metal/dielectric interface. They are sensitive to small changes at interface, as the
adsorption of molecules on the surface. Plasmon excitation requires polarized light
and it occurs when plane-polarized light is reflected under flat angles from a thin
metal film deposited on a glass substrate. At a specific angle (θ) the photons
interact with the free electron cloud in the thin metal film, causing a drop in the
intensity of the reflected light. When a layer is added in the substrate, this angle
shifts due to changes in the refractive index of the interfacial surrounding of the
SPR metal substrate.
Thus in a multilayer interface, the change in properties of the dielectric layer
requires a change in the conditions of surface plasmon excitation for each layer.
This indicates a change in the incidence light angle for the plasmons excitation,
which depend on the optical thickness (refractive index) of the layers involved. That

55 2.4 Techniques for SAM characterization | Universitat de Barcelona
angle shift is just the base for monitoring the molecules attachment on the SPR
sensor. In this way, we can determine the molecules surface coverage in each
adlayer.
The typical SPR optical sensor comprises a system which contains a source of
optical radiation and an optical structure in which plasmon is excited, a transducing
medium which interrelates the optical and biochemical domains, and an electronic
system supporting the optoelectronic components of the sensor and allowing data
processing.
The method used for surface plasmon optical excitation in this work is the
Kretschmann configuration[97] show in figure 2.6a. The technique is sensitive to
molecular events occurring in an interaction volume defined by the extension of the
evanescent electric field of the surface plasmon, extending a few hundred
nanometers into the surrounding medium.
Figure 2.6: a) Scheme of Kretschmann configuration SPR b) scan method measure c) kinetic method
measure
There are two measurement modes in SPR technique. One of them is the scan
method (figure 2.6b) and involves measurement of reflectivity in function of
incidence angle that allows having the minimum reflectivity angular position.
Measuring θ shift produced by the adlayer adsorption, and having as input the
refractive index of the same, the thickness of the immobilized layers can be fitted
and calculated. The second method is a kinetic measurement (figure 2.6c). The aim

56 2.4 Techniques for SAM characterization | Universitat de Barcelona
of this reading is to monitor the growth of a film in function of time and so, the
progress and the kinetics of surface adsorption process.
For this work, we used the ResTec (RT-2005) spectrometer, with a custom-made
setup, developed by Prof. Wolfgang Knoll (Material Science) at the Max-Planck-
Institute for Polymer Research in Mainz, Germany (see figure 2.7). In this
apparatus the plasmon excitation is achieved with a standard 633 nm He (Helium)-
Ne (Neon) laser. A sensitive silicon detector senses the reflected light. The software
used to control the SPR and to monitor the results is Wasplas. The software used to
data processing was Winspall that it is based on the Fresnel equations and the
matrix formalism. The characterization results obtained with these experiments are
usually the optical thickness [nm] and/or surface coverage [ng/cm2] of each
adlayer.
Figure 2.7:Restec SPR picture
2.4.1.1 SPR imaging
During the first optimization stages of the different SAMs systems, the SPR imaging
(SPRi) platform of GWC technologies was used[205]. Comparing with the previous
SPR introducedtheimaging SPR permits the visualization of the whole chip through
a video CCD camera. This design enables to analyze the array, or chip, in each

57 2.4 Techniques for SAM characterization | Universitat de Barcelona
active spot providing information simultaneously, see figure 2.8. In this system, a
broad-beam monochromatic polarized light from a laser diode (at a specific
wavelength) illuminates the completely functionalized area of the SPRi chip surface
(which is mounted within the instrument detection chamber). The high-resolution
CCD video camera provides real-time difference images across the array with up to
16active sites distributed on thegold spots. As the above SPR system, it captures all
of the local changes at the surface of the chip providing detailed information on
molecular binding, biomolecular interactions and kinetic processes. The main
advantage of this equipment is that we can to perform until 16 different
measurements at the same experiment.
Figure 2.8: SPRi equipment and chip picture
2.4.1.2 Electrochemical SPR (eSPR)
The e-SPR cell was designed exclusively for this project to perform the SPR
measurements in the RESTECequipment but also to carry out electrochemical
measurements on the same gold SPR chip[206]. Two pieces of different materials,
Teflon and Polyether ether ketone (PEEK) were used for this purpose. Both are
thermoplastic materials and are unreactive to almost any organic molecule. Some
molecules adsorption tests were conducted and the results were optimal for each
case. Figure 2.9 show the design and final product. The final cell works like usual
electrochemical cells, three electrodes were included inside theoptical SPR cell. For

58 2.4 Techniques for SAM characterization | Universitat de Barcelona
this purpose, it was integrated into the cell an Ag/AgCl RE screw up into the cell
and a platinum wire as CE was inserted into the cell with external connection. The
gold chip substrate was used for plasma excitation in SPR and as WE in the
electrochemical cell. It was externally connected with a spring pin connector.
Figure 2.9: e-SPR cell schematic
2.4.2 Electrochemical techniques: Cyclic Voltammetry
Electrochemical techniques were used in this work to characterize the
immobilization biosensor interface but more importantly, to readout the signal from
the electrochemical DNA biosensor developed in this project. For the
electrochemical detection of target, the PCR amplified DNA labeled with Fc was
used. The cyclic voltammetry (CV) technique is used to determine the diffusion
coefficients and redox potentials of electroactive species. This technique is based on
applying a sweep potential to the working electrode in both the forward direction
and the reverse. This means that a triangular potential sweep is performed (figure
2.10a). This potential sweep begins at an initial value (Eior E0) to a final value (Ef).
In this type of techniques, the slope of the variation of potential is known as scan
rate. It is clear that not necessarily the end of the potential sweep has to match the
initial value, so it would be more appropriate to mention that there are three
important potential values, the initial potential, cutting anode potential (Ea) and
cutting cathode potential court (Ec). The sweep can be initiated in either direction

59 2.4 Techniques for SAM characterization | Universitat de Barcelona
(anode or cathode) and this technique allows repeating this cycle as timesas
necessary. Figure 2.10b show a schematic diagram of this technique.
Figure 2.10: a) Potential change as a function of time. b) Typical curve obtained in CV
For a reversible system, like ferrocene (see figure 2.11), the current-potential
response obtained is similar to that presented in figure 2.10b.Whereas the sweep
starts at the anode sense, we see that to the reaching the appropriate potential
value for starting the oxidation reaction, the current increases notoriously to a
certain current peak value. Then the voltage is going to where the oxidation is not
favored, and so the current decline as the potential is increased. Once it reaches
the anodic potential value, the potential scan is reversed and the cathodic current
increases and so the corresponding reduction reaction is obtained. The cycle ends
in the cathodic potential value cutting, where in the majority of cases this value
coincides with the initial potential value. Two important values into this oxidation-
reduction process analysis are the current values obtained at the maximums, called
anodic peak current (epa) and cathodic peak current (ipc) respectively. For these
experiments, CH660C potentiostat from CH Instruments was used.

60 2.4 Techniques for SAM characterization | Universitat de Barcelona
Figure 2.11 Ferrocene redox process
2.4.3 X-ray Photoelectron Spectroscopy (XPS)
Also known as ESCA (Electron Spectroscopy for Chemical Analysis), the XPS is a
technique to determine the chemical composition of surfaces[207-211]. For
comprehend the XPS technique we should understand the photoelectric
photoemission effect. So, when a photon of the incident radiation used in the XPS
encounters an atom, three things may happen: that the photon passes through it
without interaction; that the photon is scattered by an electron with its respective
energy loss and, finally, the photon interacts with an electron transferring all its
energy and emitting the electron (see figure 2.12). Normally, when a surface is
bombarded with X-rays, core level electrons are first emitted. The energy used in
the X-ray may vary according to the application. The emitted electrons kinetic
energy can be measured by the analyzer. In this way, the difference between the
used photon energy (in our case Al Kα 1486.6 eV) and the kinetic energy recording
in the analyzer, give us the binding energy and this parameter is like a fingerprint
of an element. This technique working in the first 5 nm of the surface and each
photoemission peak area is proportional to the number of emitters in the sample
analysis.

61 2.4 Techniques for SAM characterization | Universitat de Barcelona
Figure 2.12: Energy transfer scheme of XPS
This characterization technique was used to perform an elemental chemical analysis
of the atoms of our immobilized sensor surface.
2.4.4 Laser optical interferometry
Interferometry is a technique that uses the superposition of light waves in order to
produce interference. The physical principle used is that two light waves coincide in
phase are amplified while two waves in phase opposition are canceled. The
difference between these fringes interference patterns gives information about
some properties of the original state of the waves. These patterns of interference
can be constructive or destructive and the image obtained is called interferogram.
Interferometry is an important research technique in the fields such as astronomy,
seismology, plasma physics, biomolecular interactions, surface profiling, and
microfluidics among others. A variant of this technique is the Phase Shift
Interferometry (PSI), based on optical phase shifting, which uses the difference in
intensity as an alternative to fringes patterns. It also uses filtered light, and the
reference surface is translated instead of the objective. PSI takes advantage of the
wave properties of light to analyze surface characteristics, in particular surface
height variations. For evaluation of areal surface topography, the source light beam
is separate in two, so that it follows two independent paths, one of which includes a
reference surface and the other the object surface. Then, the separated light beams
are recombining again and directed to a digital camera that measures the resultant
light intensity over multiple image points simultaneously. The intensity of the
recombined light exhibits high sensitivity to the differences in path lengths,
effectively comparing the object surface (surface under study) with the reference

62 2.4 Techniques for SAM characterization | Universitat de Barcelona
surface (integrated in the apparatus) with nanometer resolution. The interferometer
used for these experiments was the Wyko NT 9300 by Veeco Instruments, shows in
figure 2.13, which use the Mirau interferometer configuration instead the typical
Michelson configuration. For additional information about this technique, see the
references.This technique provides a complete topographic profile of gold surface.
Figure 2.13: Interferometer configurations, a) Mirau, b) Michelson, image takes and adapted of
Veeco Instruments brochures
2.4.5 Scanning tunneling microscopy (STM)
In the early 1980's two IBM scientists, Binnig & Rohrer developed a new technique
for studying surface structure, scanning tunneling microscopy (STM)[212-214]. The
technique is based upon scanning a conducting tip just above a surface. A bias
applied between the two can allow electrons to tunnel through the vacuum between
them, monitoring some interaction between the tip and the surface. The name of
the technique arises from the quantum mechanical tunneling-type mechanism by
which the electrons can move between two surfaces (see figure 2.14). The resulting
tunneling current is a function of tip position, applied voltage, and the local density
of states (LDOS) of the sample. Information is acquired by monitoring the current
as the tip's position scans across the surface, and is usually displayed in image
form. The STM with atomic resolution requires a well-defined, atomically flat
electrode surface, ultra-high vacuum (UHV), extreme conditions of cleanness, sharp
tips, excellent vibration control, and sophisticated electronics.

63 2.5 Experimental sets | Universitat de Barcelona
Figure 2.14: STM equipment (upper) with tip-surface detailed a) macroscale, b) microscale c)
tunneling effect schematic
2.5 Experimental sets
The goal of this part of the project is to establish a thiol linker optimal interface that
maximize the hybridization efficiency and subsequent detection of specific target
DNA (amplified by mini-PCR) on a DNA electrochemical biosensor integrated in a
LOC cartridge. In order to optimize and characterize the sensor interface, it was
performed on alternative single gold chip instead of the biosensor matrix cartridge.
SPR technique was chose to characterize the gold substrate and the SAM formation
processes. However, the sets of experiments were established thinking in the final
device. In this way, two methods of immobilization were conducted. The first was
by immersion or stationary phase (batch) of the monolayer and the second
immobilization by flow or dynamic phase (flow). For each experiment set three
replicates are performed. All chips were measured first in bare (without adsorbate)

64 2.5 Experimental sets | Universitat de Barcelona
by SPR, for determining the state of the gold substrate. The flow chips were
measured by the same technique after each added layer.
The batch chips were removed from the SPR cell for its functionalization and placed
again after SAM attachment for following with the monitoring of subsequent steps.
Prior to hybridization, the batch chips were measured in the SPR cell to determine
the change in the reflective angle regarding the bare measurement. All
hybridizations were done at 59º C and under flow to discard uncertainties in the
comparisons.
2.5.1 Gold surface characterization
The first stage in the development of this interface is the gold surface
characterization. The substrates used to optimize our biosensing platform were
evaporated planar gold chips (see figure 2.15). The different shapes of chips have
not relevant in this study and only depended of the company wherein were
purchased. The common features of the chips were a BK7 glass substrate,
evaporated with a layer of 2 nm of chrome and finally a layer of 50 nm gold. The
BK7 glass is used in optical detectiondue to its low refractive index and its low
dispersion. The chrome is used like intermediate layer for binding strongly the gold
on the glass surface. The gold is used in electrochemical biosensors due to its
conductive properties and its reactivity with the thiolates molecules and in SPR for
its excitation of the plasmon. At difference of the typical studies in literature
focused in SAM characterization, our gold is not monocrystalline. This means that
we have an amorphous and rough surface, instead of an ultraplanar surface with
crystalline structure.
Figure 2.15: Different gold chips used to SAM optimization

65 2.5 Experimental sets | Universitat de Barcelona
The first characterization of the chips was to determine the correct thickness of
each metal layer in the substrate. The right metal thickness is required to have an
exact fitting of the thickness of subsequent interface immobilized layers. An angle
scan measure was made and compared with Winspall software simulation (version
3.0.2.0).
Table 2.4 shows the values of different optical constants where n is refractive index
and K is extinction coefficient of each material of the chip required for the
simulation of each independent layer. The ε‟ and ε” optical parameters are not used
during simulations.
Table 2.4: Simulation values for fitting SPR, the values in blue or red corresponding at different
temperatures
In order to have a homogeneous and reproducible interface, the substrate has to be
perfectly cleaned. To remove impurities from the gold surface, different cleaning
treatments were performed. Solutions as piranha, super-piranha, ethanol and
sulfuric acid were used, as well as sonication methods in ethanol and UV exposure
also. After many trials, the best cleaning method that was found is described in the
following protocol.
2.5.2 Surface gold cleaning protocol
Wash the gold surface with liquid soap directly under running water in order to
remove possible fat from the skin
Immersion of the gold chip in a piranha solution in ratio 5:1 (5 ml of sulfuric
acid: 1 ml of hydrogen peroxide) for 5 minutes
Wash it in distilled water

66 2.6 Results | Universitat de Barcelona
Immersion of the gold chip in a solution of absolute ethanol and sonicate for 10
minutes
Dried with nitrogen
Exposure the chip to UV for 5 minutes
The results of the optical scan after cleaning and its corresponding simulation can
be seen in figure 2.16. We can note the similar behavior between the simulation
and the measurements and the decrease minimum reflective angle value after
cleaning.
Figure 2.16: SPR angle scan of: (black squares) surface gold without cleaning treatment; (red
spots), gold surface after cleaning treatment; (red line), simulation fitting
2.6 Results
2.6.1 SPR characterization
The optical optimization of the biosensor interface was performed with SPR.As we
already introduced, the technique is sensitive to changes in the optical properties in

67 2.6 Results | Universitat de Barcelona
a solid-liquid interface, and any interaction between the sensor and the interface
and between the probe and the target is detected.
The SPR kinetic measurement was monitored during the SAM formation at a fixed
angle, following the increase of intensity (R(%)) versus time. Figure 2.17 show the
normal behavior during the distinct immobilizations steps.
Figure 2.17:SPR kinetic measurement of the biosensor formation
The comparison of the SPR angle shift due to capture probe immobilization and its
hybridization with the PCR DNA amplified sample is summarized in figure 2.18. We
can see the angle shift, which implies a change in the refractive index of the gold-
solution interface, due to the adhesion of the molecules on the SPR sensor. The
blue columns give us information about the immobilization of the CP over the
respective interface. The red columns show us the average of the angle shift due to
the amount of duplex formation between the immobilized CP and the target. The
errors bars showed the irreproducibility within each system. In the immobilization
of CP-MCH interface the shift was not significant in comparison with the others
systems and it is more irreproducible than the other platforms. The small size of
the MCH molecule may bring to this molecule a faster reaction kinetic with the gold
surface, diminishing the available places to anchor the CP. The low hybridization
efficiency results observed in this platform support this hypothesis. On the other
hand, LAM-PEG interface shows high amount of CP immobilized perhaps due to the

68 2.6 Results | Universitat de Barcelona
higher hydrophilicity compared with MCH and also due to its stronger thioctic acid
anchoring molecule. The same hydrophilic chemistry applies in the MalPEG
interface. However, unlike this, the MalPEG linker has two PEG branches, having a
higher spacing between functional maleimide groups and so less places to attach
the CP. Therefore, the unbranched LAM linker has less charge interaction between
linkers and steric restrictions for immobilization of the linker.
However, during the hybridization process we observed much lower hybridization
efficiency in the LAM platform, where the CP immobilization was much higher.
Meanwhile the contrary is observed in the MalPEG platform. The reason for that
may be the higher CP molecules density in the sensor with LAM could prevents the
duplex formation due to steric or charge hindrance from the negative charged CP to
the negative DNA target. Contrary to LAM-PEG interface, the MalPEG system offer
good hybridization efficiency. The two arms of this molecule give a sufficient
spacing between maleimide molecules and so CP, avoiding possible electrostatic
repulsion and dodging steric hindrances successfully. The MalPEG SAM was chosen
as functionalization biointerface due to its high hybridization efficiency and good
reproducibility.
Figure 2.18: Shift angle (θ) of SPR results with different interfaces

69 2.6 Results | Universitat de Barcelona
2.6.2 i-SPR Maleimide layer optimization
The second stage in the interface optimization is the determination of the critical
concentrations of the components of the chosen SAM, with the purpose of
improving the hybridization efficiency. Maleimide-PEG layer is the first component
to optimize. The assay would include a hybridization efficiency test with a fixed CP
concentration (1 μM) and different maleimide concentrations. For these test five
concentrations of maleimide-PEG were used; 1 μM, 5 μM, 10 μM, 20 μM, 100 μM.
Each concentration has three repetitions. In this case, the SPR sensor used is SPRi
that permits a multidetection ofSPR spots at the same time (figure 2.19). The
immobilization procedure was the same as the used in the above assays. The
MalPEG layer was immobilized first. Then we immobilized the CP layer, followed by
5 μM MCH. Finally, the target DNA was injected in the system. Between each
immobilization layer a cleaning step was performed.
Figure 2.19:SPRi chip with different maleimide-PEG concentrations
The results are shows in figure 2.20. The lowest concentrations (1 and 5 μM) show
problems during the CP immobilization due to low amount of maleimide reactive
groupson the surface. Besides, the great irreproducibility into the spots in these
concentrations is shown in its negative average of CP immobilization. The 100 μM
concentration has a similar irreproducibility that the lowest concentrations in the CP
immobilization. Is not until the 10 and 20 μM concentrations of maleimide that the
results shows a good behavior, being 20 μM the one that has lower irreproducibility
in the CP immobilization. It is also under this concentration where the hybridization
of the target has a saturated signal. Therefore, we used 20 μM of MalPEG for next
experiments.

70 2.6 Results | Universitat de Barcelona
Figure 2.20: Maleimide-PEG concentration optimization with SPRi
2.6.3 Nonspecific adsorption test
Several checks were performed in order to test the selectivity of the measured
hybridization and discard that the measured signal is not coming from NSA. The
trials consist in immobilizing a CP and hybridize it with a non-complementary DNA,
and with complementary target DNA over a gold surface with and without MalPEG
linker.
The figure 2.21 represents the results of these NSA test. Is notorious the NSA in
the control without MalPEG. In this case, without the attachment of the MalPEG
linker what we have on the sensor surface is the direct interaction of the SH group
of the thiolated CP and the subsequent blocking with MCH; it is, basically, the
mixed MCH-CP platform immobilized in two steps. As can be appreciates in the
graph this interface is giving high irreproducibility as in previous results and high
NSA, that does not allow to detect differences between the complementary and not-
complementary hybridization. In fact, it is surprising the bad results presented by
the mixed SAM of CP-MCH, being one of the most reported interfaces. However, we
should be noted that the majority of reported works are done with short synthetic
DNA target, without any extra molecules. Nonetheless, in this work, we are
hybridizing long DNA target amplified by PCR and so it contains a large mixture of
other molecules, such as the primers, Taq polymerase, free nucleotides, and DNA

71 2.6 Results | Universitat de Barcelona
strands bits, among others, being our system more closed to a real sample and
then with more probabilities of attachment of undesired molecules.
On the other hand, the platform with MalPEG linker shows again good hybridization
response and negligible NSA, which demonstrates the good performance of the PEG
chain in the linker.
Figure 2.21: MalPEG SAM non-specific adsorption results
2.6.4 e-SPR Capture probe layer optimization
2.6.4.1 CP concentration
To optimize the CP layer a 20 μM fixed MalPEG concentrations was used. We tested
three concentrations of CP; 5, 7.5, 10 μM. The immobilization protocol was the
same used in previous experiments. This optimization was already performed in the
e-SPR, so, both electrochemistry and SPR readouts were done at the same sensor
chip. Figure 2.22 shows the results obtained with both characterization techniques.
It is notorious the higher sensibility obtained from the same SPR sensor with
electrochemistry than with SPR. In low concentrations of CP, 5 and 7.5 μM the SPR
is just able to detect low hybridization signal, meanwhile electrochemical detection
given already a saturated signal at 5 μM. The concentration of 10 μM is chosen for
its good results in both techniques.

72 2.6 Results | Universitat de Barcelona
Figure 2.22: Electrochemical (up) and optical (down) results for CP layer optimization after
hybridization with Fc-DNA target
2.6.4.2 Target orientation
Due to the length of our Fc-labeled targets DNA, the complementary sequence of
the capture probe into them is not equidistant from the 5'and 3' ends of the target.
In this way, depending on the end in which CP was functionalized with the thiol
group, the target hybridize in a complete different configuration respect to the WE
and the Fc moiety. Because this translocation, the sequence that has the ferrocene

73 2.6 Results | Universitat de Barcelona
molecule, which is even in the 5‟ end of target DNA, can be closer or farther away
to sensor surface, see figure 2.23. To improve the electrochemical response,
different assays were performed with thiolated capture probes in both 5‟ and 3'
ends. When the hybridization is done with 3‟ thiolated CP, the ferrocene label is
closer to surface, this mean that the electron transfer is faster and efficient and
facilitates the duplex detection. In contrary way, when we use the 5‟ thiolated CP,
the redox label is further from the surface and the electron flow is lower. The
electrochemical difference between both thiolated CPs is more than twice.
Regarding SPR characterization, the CP 5‟ thiolated hybridization efficiency is higher
because of the lower steric hindrance given by the short number of residues
rearranged on the surface, while that the hybridization is more difficult in the 3‟
thiolated CP due to the higher steric hindrance. Figure 2.24 summarizes the results
obtained. Due to a higher electrochemical signal, and thinking in the next step of
SAM integration with the electrochemical cartridge, the capture probe 3„ thiolated is
selected as working oligonucleotide hereafter.
Figure 2.23: Different configurations of Fc-labeled DNA hybridization with a) 5’ thiolated CP and b)
3’ thiolated CP. The green sequence is the Fc label site and the blue sequence is the complementary
sequence of CP. Red line indicates the distance of the redox molecule regarding the surface. The
number of mer indicates the not equidistant position of the complementary CP sequence regarding
to the ends

74 2.6 Results | Universitat de Barcelona
Figure 2.24: Electrochemical (up) and SPR (down) response of 5’ and 3’ thiolated CP
2.6.5 XPS characterization
Once chosen the MalPEG SAM as the best option for the interface, the interaction of
each layer with the sensor was studied with XPS. Therefore, a chip with only
MalPEG layer, a second chip with MalPEG and CP layers, and finally a third chip with
MalPEG, CP, and MCH layer were analyzed with XPS. The figures 2.25, 2.26 and
2.27 show the different atomics percentages in each adlayer. Elements like
hydrogen (H), gold (Au) and carbon (C) were discarding in the analysis due to its
high percentages in each chip. We focused in oxygen (O), sulphur (S), nitrogen (N),
and phosphorous (P) atoms because these elements are fundamental parts and
characteristic objectives of each immobilized layer.

75 2.6 Results | Universitat de Barcelona
Figure 2.25: XPS analysis of MalPEG layer with atomic percentage
Figure 2.26: XPS analysis of MalPEG + CP layer with atomic percentage

76 2.6 Results | Universitat de Barcelona
Figure 2.27: XPS analysis of MalPEG + CP+ MCH layer with atomic percentage
Figure 2.28 summarizes the results of the XPS analysis obtained with the different
added layers. In the MalPEG layer, we found that the O and S percentages are
higher. This result reinforces the correct MalPEG linker immobilization on the sensor
surface. The amount of oxygen represents the PEG chain on each arm of the linker
molecule and the sulphur element indicates the presence of the gold-sulphur bond.
When the CP is introduced in the next layer, the N percentages increase due to the
presence of nitrogenous bases from the DNA in the interface.
Figure 2.28: Schematic summary of the XPS analysis a) MalPEG layer immobilization, b) CP layer
immobilization, c) MCH layer immobilization

77 2.6 Results | Universitat de Barcelona
Furthermore, the S percentage decreases maybe due to the shielding effect of the
CP chain tilt on the first layer. When MCH is introduced in the sensor, the idea is
that this molecule block the maleimide unreacted and the empty gold surface, but
this molecule helps in the reorganization of the CP position lining up this DNA
molecule. This effect has been already observed and reported in mixed monolayer
of MCH and thiolated CPs. The XPS results observed after MCH show this hypothesis
because the percentage of sulphur is increased due to the disappearance of the
shielding effect. In addition, due to the lineup of the CP chains, the nitrogenous and
phosphorous percentages is the double, because the DNA bases are more exposed,
reinforcing our predictions.
Finally, the figure 2.29 shows a scheme of the definitive SAM components and its
possible interactions. The materials used for this interface were the maleimide-
polyethylene glycol disulfide supplied by ProChimia; 6-Mercapto-1-hexanol was
purchased in Sigma-Aldrich; all aqueous solutions were prepared in double distilled
water. The DNA capture probe was manufactured by Metabion International AG.
The DNA target complementary was amplified by polymerase chain reaction (PCR)
with Qiagen PCR reagents.

78 2.7 Gold substrate annealing | Universitat de Barcelona
Figure 2.29: Final components of biosensing interface in immobilization order, Maleimide-PEG
disulfide linker (black box), CP 3’ thiolated (green box), and MCH molecule like blocker and spacer
agent (red box); target DNA (blue box). Boxes overlays show the interactions between molecules
2.7 Gold substrate annealing
In order to have a more ordered SAM of the biosensor interface and so enhance the
electrochemical detection, another improvement introduced in the MalPEG platform
was the gold surfaces flattening by means of annealing. This method is a heating
treatment wherein a material changes some of its properties such as
crystallography organization, strength, hardness, and roughness. The heating of
the apparently gold surface, melted the gold grains and produces terraces
hypothetically unilamelars. The effect of the annealing on gold substrates has been
characterized with scanning tunneling microscopy (STM) and optical interferometry
(OI). Like in previous experiments, SPR and electrochemical techniques have been

79 2.7 Gold substrate annealing | Universitat de Barcelona
used to characterize the monolayer distribution of the bioreceptors and to measure
the target hybridization efficiency on annealed substrate to compare with untreated
substrates.
2.7.1 Annealing treatment
The gold substrates purchased from Menzel-Gläser consist in BK7 glass square
chips of 2 cm2 with refraction index (n) 1.5151 and coated with 2 nm of chromium
and 50 nm of gold, which were deposited by evaporation with an Edwards Auto 306
evaporator. This is a common method for thin film deposition, but the obtained
surfaces have pebble-type structures with high roughness and contain gold islands.
The annealing treatment on these substrates restructures the crystallographic
organization of gold, leading the formation of flat terraces with a pronounced (111)
texture. For the annealing treatment, it was used a butane flame for 5 minutes at a
distance of 3 cm from the chip, making a zigzag movement onto gold surface. The
chips were cooled under argon atmosphere at room temperature. For its cleaning, it
was sonicated in ethanol for 5 minutes and then it was dried with nitrogen. Finally,
the chip was placed in UV for 10 minutes. Annealing is a widespread method to
obtain ultra-flat surfaces for nanometric characterizations methods, but it has never
been applied in biosensor applications. This transition is temperature dependent
[215], and influenced by the distance between the flame and the gold surface and
the heating time [216].It is reported that the gold layer thickness also influences
the quality of the new flat terraces [217].
2.7.2 STM results

80 2.7 Gold substrate annealing | Universitat de Barcelona
Figure 2.30: Images of STM characterization of un-treated (left side) and annealed substrates (right
side)
The typical gold evaporated SPR chips are no truly flat. A quick look on the STM
characterization (figure 2.30) reveals the differences in shape, size and the
condition of the gold grains before (left) and after (right) surface heating
treatment. The fusion of the gold islands found on the un-annealed substrates,
generates after heating grain enlargement organized as flat terraces, giving
homogeneity to the surface nanostructure. The gold grain size average in the
pebble-type un-treated substrate is 14 nm, while it is reduced to 4 nm after the
gold restructuration by the annealing process, reducing the surface roughness of
the substrate.
2.7.3 Interferometry characterization
Nanoscale characterization blinds us to another important surface characteristic,
the waviness. It is a broader view of roughness and its measurement permits to
observe periodic irregularities, whose spacing is greater than the roughness length.
The roughness and waviness of gold surface does not depend exclusively on the
method in which is deposited the metal on the substrate, but also strongly depends
on the nature of the solid support. It is commonly believed that the supports are
stable solids. However, high temperatures and frequent shelling during the
processes of gold deposition have effects on them. Some of the consequences of
thisprocessare the waviness and roughness.

81 2.7 Gold substrate annealing | Universitat de Barcelona
Figure 2.31 Roughness and waviness factors measured by optical interferometry of un-treated
surface (A) and annealed surface (B).
Figure 2.31 shows the differences between the arithmetic average of absolute
values (Ra factors) in both roughness and waviness. The interferometry results
show a decrease of four times on roughness of the annealed surface versus the
untreated gold (0.04 nm vs. 0.16 n, respectively). Large-scale measures allow us to
say that annealing is not only a method for forming flat terraces of low roughness
but also masked glass support defects. This heating treatment helps to reduce the
waviness of the glass substrate from 0.66 nm to 0.37 nm.
2.7.4 Electrochemical characterization of effective surface
To measure the effective conductive area in both type of nanostructure gold
electrode surface, cyclic voltammetries were carried out in sulfuric acid for
measuring the experimental active area. For its mathematical calculation, this
formula reported in literature [218] was used:
Area = QAu*(rAu/rO2) 2/n Q0
Where QAu is the area under the curve of the sulfuric acid reduction peak; (rAu/rO2)
2is the square of the atomic radius ratios between the gold substrate and the
adsorbed oxygen; n is the number of electrons involved in oxygen oxidation and Q0
is the reference charge for reduction of an oxide monolayer on polycrystalline gold.
For these experiments, Q0 equal to 390μC cm-2 was considered [219].
Table 2.5 shows the results obtained with this electrochemical characterization. The
variations of the real active area of gold after annealing and un-treated are
compared with the geometric theoretic area of the electrode. From this results, it
can be observed that the electrochemical roughness factor (= experimental area/
theoretical area) [220]in un-treated surface is 2.4; while in the annealed electrode
is only 1.2. Thus, the decrease of the roughness and the effective area after
annealing treatment is nearly 50%, which approaches annealed surfaces to the
theoretical value of ultra-flat surfaces.

82 2.7 Gold substrate annealing | Universitat de Barcelona
Table 2.5: Experimental and theoretical values of electrode areas characterized by CV and surface
coverage (Γ) for the different immobilization stages for annealed and un-treated surfaces measured
with SPR.
2.7.5 Surface coverage characterization with SPR
Once the nano-structuration of both studied substrates, pebble-type un-treated
gold and annealed flat terraces-type gold, has been characterized. The effect of the
substrates roughness was studied in the performance of DNA biosensors.
SPR offers a deep understanding about the amount of biomolecules attached on the
chip surface in each step of the biosensor set up.
The theoretical values proposed in the table, were calculated taking into account
shielding diameters of the MalPEG (1.17 nm) [221]as the basement of the
bioreceptor immobilization and dsDNA diameter (2.55 nm) to consider the
hybridized DNA in a perfect geometrical distribution of the biomolecules on the
surface.
The differences observed on the roughness and effective area, are reflected in the
adsorption rates of molecules in each type of substrate. The experimental values
measured in the ultra-flat annealed substrate shows a very similar bioreceptor
surface coverage compared with the theoretical one. It was assumed that the
theoretical values are calculated under a virtual flat surface, and the closer surface
coverage values obtained on the annealed surface reveals that the treatment helps
to achieve this goal, giving well-ordered and packed monolayers. On the other side,
the grainy surface of the un-treated gold has larger area of gold for the
immobilization of bioreceptor interface.
The visible differences between the monolayer immobilization efficiency reflect
structural changes of the gold surface (see figure 2.32). The reorganization of the

83 2.7 Gold substrate annealing | Universitat de Barcelona
crystalline structure formed on flat terraces of gold, decreases the available places,
also observed on the reduction of the effective area of the gold surface. For this
reason, the bioreceptor molecules diminish its surface coverage on the annealed
treated surfaces, comparing with un-treated substrate that has higher roughness
and so higher effective area and bioreceptor immobilization.
Figure 2.32: SAM immobilization schemes from annealed (A) and un-treated (B) substrates. Note a
well ordered system in annealed surface
However, although more receptors site were deposited on the pebble-type surface,
the amount of hybridized DNA molecules are lower comparing with the annealed
flat chip, being the double of targets detected on the annealed one. Considering the
theoretical value calculated for the covering of ds DNA molecules, in the case of
ultra-flat substrate was observed 32% of efficiency, while this percentage is reduce
to 14% in the case of the rough surface.
Dates show in figure 2.33 confirmed the varied distribution of biomolecules on the
different nanostructured substrates. This figure shows the increase of intensity due
to the SPR chip covering. The change of intensity is measured under equal
refractive index conditions on the chip before and after biomolecules incubation.
Therefore, the shift of intensity is only due to the modification of the resonant
oscillation of excited plasma with the adsorbed molecules on the gold chip. As it
was commented in the previous table, higher adsorption of the bioreceptors is
observed on the rough un-treated surface. However, higher hybridization is
detected on the ultra-flat chip.

84 2.7 Gold substrate annealing | Universitat de Barcelona
Figure 2.33: SPR responses from bioreceptor and target DNA layer on annealed and untreated
substrates.
The new surface organization on the ultra-flat substrates turns out in the formation
of immobilization patterns that reduce both steric hindrances and electrostatic
repulsion. The monolayer formation has been studied to form the thiol chains
approximately 3𝑥 3 𝑅30° angle titled to the gold surface [222].In a planar
annealed surface, the deposited molecules have the similar angle. However, in the
case of a pebble-type surface the monolayer follows the distortions of the flat
surface. Thus, the well-ordered and organized distribution, in similar direction of
the bioreceptors, in the planar configuration, contrast with the random orientation
of the highly packed linking sites on the un-treated substrate. This chaotic
distribution of the negatively charged bioreceptors hinders the entrance of the
negatively charged DNA target.
Moreover, many of the features of the SAMs depend directly of the crystalline
organization substrate where they are deposited. By changing this surface
organization also changes the thermal stability and kinetics of chemisorptions of the
head groups on gold and thus its distribution, covering and angle with respect to
the surface are different [223].
These small but important changes greatly enhance the hybridization efficiency,
being the increase in more than twice in surface coverage DNA hybridization,
although annealed substrate contains lower amount of bioreceptors.

85 2.7 Gold substrate annealing | Universitat de Barcelona
2.7.6 Electrochemical DNA sensor characterization
Figure 2.34: Electrochemical responses from the sensor immobilized and hybridized with target-Fc
on annealed and un-treated substrates.
From the electrochemical point of view, pebble-type electrodes have some
drawbacks comparing with ultra-flat substrates. The ions adsorbed on the rough
electrodes have a larger area for adsorption, and so higher capacitance effect
[224]. In this way, the electron transfer from the ferrocene label to the electrode
becomes more difficult, thus decreasing the signal obtained. Moreover, the charge
redistribution between molecules in the ordered assembled interface has a
beneficial effect on electron transport and charge transfer [225], helping in the
transport of the electrons from the redox label to the electrode, and thus in the
sensitivity of the electrochemical biosensor [224].The distance between oxidation
and reduction peaks, the reversibility of a redox reaction and reproducibility of
electrochemical measurements, are affected by the state and nature of the
substrate [226].
Besides the fact that the flat electrodes have beneficial effects on the
electrochemical read-out, the well-ordered distribution of the bioreceptors on
annealed electrodes, as surface coverage characterization with SPR, demonstrate
higher efficient hybridization of the target DNA.
Also the electrochemical characterization of the DNA biosensor on evaporated
wrinkled gold electrodes and on annealed flat gold surfaces, shown higher

86 2.8 Summary | Universitat de Barcelona
hybridization efficiency in the sensor previously treated with annealing (see figure
2.34). In electrochemical sensors, the improvement is much clearer than in optical
detection, being more than twice in magnitude the current observed in the
annealed system. These results are due to the synergy effects on annealed
substrates of both factsless steric hindrance for the target hybridization in a more
ordered distribution of the bioreceptors, and easier transfer of the charge and less
capacitance on the electrode.
The selectivity and the low non-specific fouling achieved by the biosensor interface
is demonstrated with the low signal obtained in the controls without capture probe
and with mutated capture probe in both type of substrates.
2.8 Summary
In summary, the three interfaces compared the most successful one was the
MalPEG, which contains two branches of PEG and a better spacing for the target
hybridization. The optimization of each biosensor layer resulted in; 20 μM MalPEG
SAM, 10 μM of CP, and the MCH like blocking and spacer agent presented the best
results of hybridization detection during the optimization and characterization of the
SAM. In addition, it was demonstrated that the annealing treatment on commercial
gold evaporated substrates has a beneficial effect on the biosensor performance.
The transition between the nanoparticulate substrate to the laminar-annealed
surface has deep consequences over the biomolecules distribution, interaction, and
so in the sensitivity of the sensor. The heating treatment causes the molecular
rearrangement of the gold, forming ultra-flat terraces. The pebble-type un-treated
substrates, with higher surface area demonstrate broader bioreceptor coverage.
However, the flat annealed surface favors improved and well-ordered bioreceptors
patterns with its subsequent lower steric hindrance for the hybridization of the DNA
target. The organization, more homogeneous of the monolayers in annealed
substrates, results in a high quality monolayers and sensors. Moreover, an ordered
charged bioreceptors interface facilitates the transfer of electrons from the redox
label to the electrode and reduce the capacitance effects. This involves
improvements in both the hybridization efficiency and electrochemical reading,
making the annealing a powerful tool in the optimization of biosensors interfaces.
However,annealing gold pre-treatment is just limited to substrate that could handle
the high temperatures required. As will be presented in next chapter, the cost

87 2.8 Summary | Universitat de Barcelona
required for the fabrication of the cartridge limit the type of materials used for this
project and the polymers used are not compatible with annealing.

88 2.9 References | Universitat de Barcelona
2.9 References
149. Gill, A., et al., Biocompatible interfaces for biosensors. International Journal
of Environmental Analytical Chemistry, 2005. 85.
150. Oliveira, O.N., et al., Nanomaterials for Diagnosis: Challenges and
Applications in Smart Devices Based on Molecular Recognition. ACS Applied
Materials & Interfaces, 2014. 6(17): p. 14745-14766.
151. Kim, P., et al. An electrochemical interface for integrated biosensors: IEEE.
152. Wong, E.L., E. Chow, and J.J. Gooding, DNA recognition interfaces: the
influence of interfacial design on the efficiency and kinetics of hybridization.
Langmuir : the ACS journal of surfaces and colloids, 2005. 21(15): p. 6957-
6965.
153. Kim, D. and D. Kang, Molecular Recognition and Specific Interactions for
Biosensing Applications. Sensors, 2008. 8.
154. Gao, T., et al., Assembly of Selective Biomimetic Surface on an Electrode
Surface: A Design of Nano–Bio Interface for Biosensing. Analytical
chemistry, 2015. 87(11): p. 5683-5689.
155. Gao, Y., L.K. Wolf, and R.M. Georgiadis, Secondary structure effects on DNA
hybridization kinetics: a solution versus surface comparison. Nucleic acids
research, 2006. 34(11): p. 3370-3377.
156. Philp, D. and J.F. Stoddart, Self‐assembly in natural and unnatural systems.
Angewandte Chemie International Edition in English, 1996. 35(11): p. 1154-
1196.
157. Shimomura, M. and T. Sawadaishi, Bottom-up strategy of materials
fabrication: a new trend in nanotechnology of soft materials. Current
Opinion in Colloid & Interface Science, 2001. 6(1): p. 11-16.
158. Zhang, Y., et al., Bottom‐Up Molecular Tunneling Junctions Formed by
Self‐Assembly. Israel Journal of Chemistry, 2014. 54(5‐6): p. 513-533.
159. Huie, J.C., Guided molecular self-assembly: a review of recent efforts. Smart
Materials and Structures, 2003. 12(2): p. 264.
160. Barth, J.V., G. Costantini, and K. Kern, Engineering atomic and molecular
nanostructures at surfaces. Nature, 2005. 437(7059): p. 671-679.
161. Chen, D. and J. Li, Interfacial design and functionization on metal electrodes
through self-assembled monolayers. Surface Science Reports, 2006. 61.

89 2.9 References | Universitat de Barcelona
162. Whitesides, G.M., J.P. Mathias, and C.T. Seto, Molecular self-assembly and
nanochemistry: a chemical strategy for the synthesis of nanostructures.
1991, DTIC Document.
163. Khoo, H., et al., Self-Assembly in Micro- and Nanofluidic Devices: A Review
of Recent Efforts. Micromachines, 2011. 2.
164. Ulman, A., Formation and Structure of Self-Assembled Monolayers. Chemical
reviews, 1996. 96(4): p. 1533-1554.
165. Gooding, J.J. and S. Ciampi, The molecular level modification of surfaces:
from self-assembled monolayers to complex molecular assemblies. Chemical
Society reviews, 2011. 40(5): p. 2704-2718.
166. Gooding, J.J., et al., Self‐assembled monolayers into the 21st century:
recent advances and applications. Electroanalysis, 2003. 15(2): p. 81-96.
167. Nuzzo, R.G. and D.L. Allara, Adsorption of bifunctional organic disulfides on
gold surfaces. Journal of the American Chemical Society, 1983. 105(13): p.
4481-4483.
168. Arya, S.K., et al., Recent advances in self-assembled monolayers based
biomolecular electronic devices. Biosensors & bioelectronics, 2009. 24(9): p.
2810-2817.
169. Frasconi, M., F. Mazzei, and T. Ferri, Protein immobilization at gold-thiol
surfaces and potential for biosensing. Analytical and bioanalytical chemistry,
2010. 398(4): p. 1545-1564.
170. Wei, F., P.B. Lillehoj, and C.-M.M. Ho, DNA diagnostics: nanotechnology-
enhanced electrochemical detection of nucleic acids. Pediatric research,
2010. 67(5): p. 458-468.
171. Love, J.C., et al., Self-assembled monolayers of thiolates on metals as a
form of nanotechnology. Chemical reviews, 2005. 105(4): p. 1103-1169.
172. Ferretti, S., et al., Self-assembled monolayers: a versatile tool for the
formulation of bio-surfaces. TrAC Trends in Analytical Chemistry, 2000.
19(9): p. 530-540.
173. Delamarche, E., B. Michel, and H.A. Biebuyck…, Golden interfaces: The
Surface of Self‐Assembled Monolayers. Advanced …, 1996.
174. O'Dwyer, C., G. Gay, and B.V. de, The nature of alkanethiol self-assembled
monolayer adsorption on sputtered gold substrates. Langmuir, 2004.
175. Badia, A. and R.B. Lennox…, A dynamic view of self-assembled monolayers.
Accounts of chemical research, 2000.
176. Canaria, C.A., Self-assembled monolayers for the study of biological targets.
Self-assembled monolayers for the study of biological targets, 2008.

90 2.9 References | Universitat de Barcelona
177. Carrascosa, L.G., et al., Understanding the role of thiol and disulfide self-
assembled DNA receptor monolayers for biosensing applications. European
biophysics journal : EBJ, 2010. 39(10): p. 1433-1444.
178. Durmaz, F., A modular approach to functional self-assembled monolayers. A
modular approach to functional self-assembled monolayers, 2006.
179. Lud, S.Q., et al., Controlling surface functionality through generation of thiol
groups in a self-assembled monolayer. Langmuir : the ACS journal of
surfaces and colloids, 2010. 26(20): p. 15895-15900.
180. Aponte, M.I., Effect of alkanethiol self-assembled monolayers on the plastic
and elastic deformation of gold (111) films. Effect of alkanethiol self-
assembled monolayers on the plastic and elastic deformation of gold (111)
films, 2010.
181. Bashir, A., Growth and structural characterization of self-assembled
monolayers (SAMs) on gold made from functionalized thiols and selenols.
Growth and structural characterization of self-assembled monolayers (SAMs)
on gold made from functionalized thiols and selenols, 2008.
182. Edinger, K., et al., Formation of self-assembled monolayers of n-alkanethiols
on gold: a scanning tunneling microscopy study on the modification of
substrate morphology. Langmuir.
183. Lee, S., et al., The influence of packing densities and surface order on the
frictional properties of alkanethiol self-assembled monolayers (SAMs) on
gold: a comparison of SAMs …. Langmuir, 2000.
184. Yu, M., et al., True nature of an archetypal self-assembly system: mobile
Au-thiolate species on Au(111). Physical review letters, 2006. 97(16): p.
166102.
185. Torres, E., P.U. Biedermann, and A.T. Blumenau, The role of gold adatoms
in self-assembled monolayers of thiol on Au(111). International Journal of
Quantum Chemistry, 2009. 109.
186. Maksymovych, P., et al., Gold adatom as a key structural component in self-
assembled monolayers of organosulfur molecules on Au(111). Progress in
Surface Science, 2010. 85.
187. Maksymovych, P., D.C. Sorescu, and J.T. Yates, Gold-adatom-mediated
bonding in self-assembled short-chain alkanethiolate species on the Au(111)
surface. Physical review letters, 2006. 97(14): p. 146103.
188. Cortés, E., et al., Enhanced stability of thiolate self-assembled monolayers
(SAMs) on nanostructured gold substrates. Langmuir : the ACS journal of
surfaces and colloids, 2009. 25(10): p. 5661-5666.

91 2.9 References | Universitat de Barcelona
189. Addato, M.a., et al., Alkanethiol Adsorption on Platinum: Chain Length
Effects on the Quality of Self-Assembled Monolayers. The Journal of Physical
Chemistry C, 2011. 115.
190. Chaudhuri, A., et al., (2√3×3)rect. phase of alkylthiolate self-assembled
monolayers on Au(111): A symmetry-constrained structural solution.
Physical Review B, 2009. 79.
191. Gannon, G., et al., Molecular dynamics study of naturally occurring defects
in self-assembled monolayer formation. ACS nano, 2010. 4(2): p. 921-932.
192. Hamoudi, H., et al., On the self assembly of short chain alkanedithiols.
Physical chemistry chemical physics : PCCP, 2008. 10(45): p. 6836-6841.
193. Wolf, H., H. Ringsdorf, and E. Delamarche…, End-group-dominated
molecular order in self-assembled monolayers. The Journal of …, 1995.
194. Schwartz, D.K., Mechanisms and kinetics of self-assembled monolayer
formation. Annual review of physical chemistry, 2001. 52: p. 107-137.
195. Millone, M.A., et al., Self-assembly of alkanedithiols on Au(111) from
solution: effect of chain length and self-assembly conditions. Langmuir : the
ACS journal of surfaces and colloids, 2009. 25(22): p. 12945-12953.
196. Pensa, E., et al., The Chemistry of the Sulfur-Gold Interface: In Search of a
Unified Model. Accounts of chemical research, 2012.
197. Vericat, C., et al., Thiol-capped gold: from planar to irregular surfaces.
Journal of Physics: Condensed Matter, 2008. 20.
198. Vericat, C., et al., Self-assembled monolayers of thiols and dithiols on gold:
new challenges for a well-known system. Chemical Society reviews, 2010.
39(5): p. 1805-1834.
199. Vericat, C., et al., Surface characterization of sulfur and alkanethiol self-
assembled monolayers on Au(111). Journal of Physics: Condensed Matter,
2006. 18.
200. Vericat, C., M.E. Vela, and R.C. Salvarezza, Self-assembled monolayers of
alkanethiols on Au(111): surface structures, defects and dynamics. Physical
chemistry chemical physics : PCCP, 2005. 7(18): p. 3258-3268.
201. Gong, P., et al., Hybridization behavior of mixed DNA/alkylthiol monolayers
on gold: characterization by surface plasmon resonance and 32P radiometric
assay. Analytical chemistry, 2006. 78(10): p. 3326-3334.
202. Wijaya, E., et al., Surface plasmon resonance-based biosensors: From the
development of different SPR structures to novel surface functionalization
strategies. Current Opinion in Solid State and Materials Science, 2011. 15.

92 2.9 References | Universitat de Barcelona
203. Willander, M. and S. Al-Hilli, Analysis of biomolecules using surface
plasmons. Methods in molecular biology (Clifton, N.J.), 2009. 544: p. 201-
229.
204. Willets, K.A. and R.P. Van Duyne, Localized surface plasmon resonance
spectroscopy and sensing. Annual review of physical chemistry, 2007. 58: p.
267-297.
205. Malic, L., T. Veres, and M. Tabrizian, Nanostructured digital microfluidics for
enhanced surface plasmon resonance imaging. Biosensors & bioelectronics,
2011. 26(5): p. 2053-2059.
206. Kang, X., G. Cheng, and S. Dong, A novel electrochemical SPR biosensor.
Electrochemistry Communications, 2001. 3(9): p. 489-493.
207. Bourg, M.C. and A. Badia…, Gold-sulfur bonding in 2D and 3D self-
assembled monolayers: XPS characterization. The Journal of Physical …,
2000.
208. Lee, C.-Y.Y., et al., Fluorescence, XPS, and TOF-SIMS surface chemical state
image analysis of DNA microarrays. Journal of the American Chemical
Society, 2007. 129(30): p. 9429-9438.
209. Vance, A.L., et al., XAS and XPS characterization of monolayers derived
from a dithiol and structurally related disulfide-containing polyamides.
Langmuir, 2002.
210. Techane, S.D., L.J. Gamble, and D.G. Castner, Multi-technique
Characterization of Self-assembled Carboxylic Acid Terminated Alkanethiol
Monolayers on Nanoparticle and Flat Gold Surfaces. The journal of physical
chemistry. C, Nanomaterials and interfaces, 2011. 115(19): p. 9432-9441.
211. Shen, G., M.F. Anand, and R. Levicky, X-ray photoelectron spectroscopy and
infrared spectroscopy study of maleimide-activated supports for
immobilization of oligodeoxyribonucleotides. Nucleic acids research, 2004.
32(20): p. 5973-5980.
212. Lüssem, B., et al., STM study of mixed alkanethiol/biphenylthiol self-
assembled monolayers on Au(111). Langmuir : the ACS journal of surfaces
and colloids, 2006. 22(7): p. 3021-3027.
213. Azzam, W., et al., Combined STM and FTIR characterization of
terphenylalkanethiol monolayers on Au(111): effect of alkyl chain length and
deposition temperature. Langmuir : the ACS journal of surfaces and colloids,
2006. 22(8): p. 3647-3655.
214. Wang, W., T. Lee, and M.A. Reed, Electron tunnelling in self-assembled
monolayers. Reports on Progress in Physics, 2005. 68.

93 2.9 References | Universitat de Barcelona

94 Chapter three | Universitat de Barcelona
Chapter three

95 Chapter three | Universitat de Barcelona
In previous chapter, we show the development and optimization of an
electrochemical DNA biorecognition interface. As we already introduced in the
motivation of this thesis, this biosensor interface is an integral part in the
development of a high-tech device within an industrial project with the company
Genomica S.A.U. The main objective of this project is the construction,
commissioning and validation of a LOC device ableof detecting various
polymorphisms in cancer DNA samples on a single platform and its subsequent
introduction by the company into the diagnosis market. The new device is a
portable cartridge that incorporates mechanical, electrical and heating elements
with electronic and microfluidic systems. The multisystem device will be able to
amplify DNA by PCR and detect real DNA samples electrochemically. The main idea
is that the device will be an effective tool in the diseases diagnostic in early stages
of those and directly used in the medical center by the doctor, to give to the patient
a direct and faster diagnosis. It not intended to replace traditional techniques but to
complement them and to expedite their diagnosis. The main components of this
LOC are:
Electrochemical detection system or potentiostat
Electrochemical DNA biosensor array
Automatized system of temperature ramps to perform amplification of DNA by
PCR
Microfluidic platform cartridge
An Electronic Control Interface (ECI) provides acquisition and data processing
software and involves the potentiostat, the mini-PCR and the fluidics components.
This ECI will be in contact through a fluidic cartridge that integrates the mini-PCR
chamber and the electrochemical biosensor detection area.
The aim of this chapter is to show the various stages of manufacture of the
biosensor platform part. This device consists of two main blocks: the PCR block
involving microfluidic designs and biosensing block involving electrochemical
designs and hybridization chamber.
The conceptual framework in which the work takes place is given by a joint interest
between a biotech company and a scientific institute. Today, the market of
electrochemical DNA biosensors for the detection of diseases is a fertile field for the
advancement of interdisciplinary research. For this fundamental reason, the
commercial-academic background of this project becomes relevant within the
development thereof.

96 Chapter three | Universitat de Barcelona
The biotechnology company that propels the project is Genomica SAU, who
optimized the multi-PCRDNA amplification to be performed in the mini-PCR, and the
scientific research institute that provides the nanobiotechnological support is the
Institute for Bioengineering of Catalonia (IBEC), where we developed the
optimization, fabrication, integration and validation of the electrochemical
biosensor. In another area of our group, supervised by Dr. Antoni Homs, it was
performed the fluidics part. The aforementioned interdisciplinary of the project
involves also staff from other groups like CEMIC, in the Electronics Department of
the Faculty of Physics of the University of Barcelona. This group is where was
developed the electronics for the controls of the temperature ramps in the Peltier,
required for the PCR, and the electrochemical multi-read-out of the biosensors in
the arrays and the software to control both equipment, which was supervised by
Prof. Manel Puig.
The final LOC device should be able to manipulate the sample and reproduce the
complete sensing protocol including the PCR and the hybridization and detection
steps in a closed package. It is interesting to be able to manufacture the complete
device in a short number of steps and materials in order to make its final
fabrication cheaper and easier, and so more efficient its commercialization.
Most of the microfluidical structures and LOC parts are desired make in a low cost
polymeric material due to its high resistance comparing with glass, and its qualities
for mass production.To accomplish this objective, a study to determine the desired
material properties has been conducted. As a result, several issues have been
designated as critical in order to choose the proper material. These include:
Considering the cartridge manufacturing, we should take into account:
Material affordable for mass production
Suitable for molded (milling, hot embossing or injection molding)
Thermal or plasma activated and/or solvent sealing between LOC parts
achievable
Material with low impurities (reduction of material variability)
Chemical resistance during cleaning procedures
Chip surface modification availability
Possibility of patterning metals on top of it
Resistance to casual impacts (in hospital and other critical environments it is
important to reduce the risks of the cartridge breaking down)
Gamma ray and hot steam sterilization possible
Disposability (low environmental impact), ecological reasons and commercial
advantage in front of environmental friendly policies

97 3.1 Materials test | Universitat de Barcelona
The points to consider in the cartridge material for reagents and electrodes
preparation are the next:
High heat resistance (up to 100ºC is desired for PCR and for target
denaturation)
Chemical resistance to acid compounds, alkali solutions, and soft solvents,
among others is important for the handling of reagents, electrodes cleaning.
To consider in the cartridge in relation to the reagents storage;
Material with low biomolecules fouling
Low permeability (reduction of LOC properties changes during storage)
Chemical resistance (especially important for on-chip reagent storage)
3.1 Materials test
3.1.1 Experimental material test
In order to suit to above requirements, or most of them, some proposed materials
were cycle olefin polymer (COP), cycle olefin copolymer (COC) and some types of
polycarbonate (PC). COP shows superior optical properties and this could be an
advantage to use fluorescent markers for the setup of some parts of the assay,
such as the PCR, in the initial prototypes. Biocompatibility tests based on nucleic
acid absorbance were done to further support the material choice.
The COP films tested were:
Zeonor 1060R
Zeonor 1420R
Zeonex 330R
The COC films tested were:
TOPAS 5013
TOPAS 6013
TOPAS 6015
TOPAS 8007
The PC films tested were:
TECANAT Ensinger
Makrolon 2458 Bayer
For biocompatibility test of these polymers was done with pieces of 2x2 cm2withsix
wells of 2 mm of diameter and 1 mm in depth, fabricated with hot embossing. The

98 3.2 Electrodes microfabrication techniques | Universitat de Barcelona
study was conducted by depositing about 3000 copies of DNA in each well of the
different plastic samples and incubates for30 minutes. The recovered sample was
evaluated by RT-PCR to compare with the original sample amount, and so to
determine the genetic material absorbed in each one. No significant differences
between the polymers evaluated were observed and all can be applicable to our
device from the viewpoint of biocompatibility.
Regarding the properties related to permeability, chemical resistance and possible
surface modifications, the COP and COC films gave better response.
Because of the high variability in the optical properties of COCs films, it was
discard. In this way, and considering that all prerequisites were fulfilled the COP
Zeonor 1420R was chosen as main material to manufacture the disposable
cartridge.
Besides COP, other materials like gold, silver, silver chloride, different glues and
Teflon among the most important, were used for the LOC fabrication.
3.2 Electrodes microfabrication techniques
3.2.1 Photolithography
Photolithography is the process of transferring nano and micrometric geometric
shapes on a mask to the working surface. The steps involved in the
photolithographic process (explained in more detail below) are substrate cleaning,
metallic coating, photoresist application (positive and negative), mask
alignment,exposure and finally the development.
3.2.1.1 Substrate cleaning
In the first step, the COP substrate is chemically cleaned to remove particulate
matter on the surface as well as any traces of organic, ionic and/or metallic
impurities. The cleaning consist in submerge the COP sheet into the Piranha
solution for 30 minutes and then expose it to UV light for 10 minutes.
3.2.1.2 Metallic coating
The better adhesion of the metal layer on COP plastic was achieved with sputtering
than evaporation. Sputtering is a technique used to deposit thin films of material

99 3.2 Electrodes microfabrication techniques | Universitat de Barcelona
onto a substrate surface. There are two traditional sputtering techniques: the
physical vapor deposition (PVD) and chemical vapor deposition (CVD), based on
physical interactions and chemical reactions respectively. The first step that follows
these techniques is to create gaseous plasma and then acceleratethe ions ofthis
plasma into the material source, gold in our case. The gold is eroded by the
plasmaions, via energy transfer, and it is ejected in particle clusters or atoms.
These particles travel in a straight line unless they encounter something, in our
case, the COP surface. In this way, the COP surface is coated by a thin gold film,
where the gold thickness is time dependent.
3.2.1.3 Photoresist Application
After gold deposition, the photoresist is applied on the gold surface. High-speed
centrifugal whirling or “spinning” of the photoresist is the standard method for
applying the coatings. This technique produces a thin uniform layer of photoresist
on the gold, with thickness dependent of rpm (revolutions perminute) and time.
3.2.1.4 Positive and Negative Photoresist
There are two types of photoresist: positive and negative (see figure 3.1). For
positive resists, it is exposed with UV light wherever the underlying material wants
to be removed. In these photoresists polymers, the exposition to the UV light,
changes the chemical structure of the resist so that it becomes more soluble in the
developer. The exposed resist is then washed away by the developer solution,
leaving windows of the bare underlying material. The mask, therefore, contains an
exact copy of the pattern that wants to beremained on the surface. In this work, we
used the positive approach.
Negative photo resists polymer behaves in the opposite manner. Exposition to the
UV light causes the polarization of the negative photoresist polymer, and so it is
more difficult to dissolve. Therefore, itremains on the surface wherever it is
exposed, and the developer solution removes only the unexposed portions. Masks
used for negative photoresists, therefore, contain the inverse (or photographic
"negative") of the pattern to be transferred. Negative resists were popular in the
early history of integrated circuit processing, but positive resist gradually became
more widely used since they offer better process controllability for small geometry
features.

100 3.2 Electrodes microfabrication techniques | Universitat de Barcelona
Figure 3.1: Scheme showing the two different types of photoresist
3.2.1.5 Mask Alignment and Exposure
The basic principle behind of a photoresist coating is the change in solubility of the
resist in a developer upon exposure to light (or other types of exposing radiation).
Thus, a spatial variation in light energy incident on the photoresist will cause a
spatial variation in solubility of the resist in the developer. In this step, the mask,
which contains the required pattern, is accurately aligned with the pattern on the
working surface. For this purpose, mask aligner equipment is used to control the
right position of the mask on the substrate and its distance. The photoresist is
exposed through the pattern on the mask with a high intensity ultraviolet light.
3.2.1.6 Development
The last step in the photolithographic process is the development. At low-exposure
energies, the negative resist remains completely soluble in the developer solution.
As the exposure is increased above threshold energy, more of the resist film
remains after development. At exposures two or three times the threshold energy,
very little of the resist film is dissolved. For positive resists, the resist solubility in
its developer is finite even at zero-exposure energy. The solubility gradually
increases until, at some threshold, it becomes completely soluble. In this procedure

101 3.2 Electrodes microfabrication techniques | Universitat de Barcelona
the developer solution, remove the exposed or unexposed photoresist, leaving this
area of the substrate opened for the next step.
3.2.1.7 Etching
During this step, a chemical agent removes the metallic surface of the substrate in
the areas that are not protected by photoresist. This procedure can be done in two
ways, with a liquid called wet etching, or with plasma called dry etching. Following
this step is necessary to remove the remaining photoresist on the covered gold.
3.2.2 Screen printing technique
The process of screen-printing is used for array fabrication and it does not
requirethe use of clean room that makes faster, cheaper and more simple the
process. However, the resolution obtained with this technique is much lower than
photolithography. The procedure consists of transferring a conductive or dielectric
ink or paste through a patterned screen or mash onto a substrate held on the
reverse of the screen. The ink passage is blocked in areas where no image are
patterned, instead allowing the passage of the ink in the areas of drawing, since
they have the open mesh, see figure 3.2. This technique allows drawings of
electrodes of the order of micrometers.
Successive layers can be deposited by this procedure on different ink layers and
repeat patterns can be designed onto the same screen to enhance production
speed. The most common substrates are the polycarbonate, polyester, glass fiber
or ceramic. Each ink layer is deposited through the corresponding mask providing a
specific pattern. These masks are prepared by photolithographic techniques.
In our case the conductive ink are made of gold and give rise to the formation of
the array and the conductive tracks on the COP substrate. Functional materials can
also be part of the formulation and more recently, nanosized metals and carbon
nanotubes were used for this purpose.

102 3.3 Cartridge design | Universitat de Barcelona
Figure 3.2: Screen printing process scheme
3.3 Cartridge design
The entire structure of the cartridge is conceived in a sandwich format. The
constituents parts were optimized independently but considering the entire device
to facilitate their eventual integration[227]. Many advantages were observed in
this sandwich format, compared with the usual planar cartridge, where all the
components of the LOC are in the same level. In this case, gravity helps in the flow
of the liquids; the same Peltier may be used for heating the PCR and for the
hybridization temperature in the detection area. and the electrochemical cell leave
at the same distance the counter electrode to all the working electrodes that forms
the arrays, having the same reproducible entrance of the current to all the working
electrodes. However, this sandwich platform brings more challenges than the planar
LOCs in the fabrication of the vertical fluidic channels and in the two layers
connections in the electrochemical cell.
Microfluidic of the miniaturized PCR system and the hybridization-detection
chamber were the first elements made in parallel. It took into account parameters
of electrical connectivity, fluidic complex and thermal behavior in the whole
cartridge in order to minimize possible changes during the final integration with the
external actuation device, wherein will be held the electrochemical reading and the
fluidic control. Figure3.3 shows the cartridge structure. To facilitate the reading of
this design, the different layers were separated and numbered with roman
numerals. The development of the device is explained layer by layer in next
section. In each layer description, we found the design and material evolution as

103 3.3 Cartridge design | Universitat de Barcelona
well as the different fabrication techniques. Thus, first we explain the fabrication
process of the biosensing block followed by the layers corresponding to the PCR
block.
The steps that will carry out this LOC are the next; first, a blood sample will be
extracted from the patient and inserted in a tube with the PCR reagents. This mix
will be inserted by the fluidic pump until the PCR chamber. There will be performed
all the amplification steps with the PCR temperature cycles to obtain millions of
copies of the initial DNA sample labelled. Details about this process are introduced
in the next PCR block section. This DNA labelled sample is dehybridized at 100 ºC in
a mix 1:1 ratio with hybridization solution and flow it to the hybridization-detection
chamber. There will be incubated this mixture at 59ºC for 1 hour and then the
hybridized duplex will be electrochemically detected.
Figure 3.3: Cartridge sandwich components scheme
3.3.1 Biosensing Block
This block constitutes the part where the biorecognition electrochemical interface
presented in chapter two is integrated. Therefore, it contains the electrochemical
sensing platform that is functionalized with the specific DNA capture probes of
interest. It serves as both hybridization chamber and electrochemical cell for
detection of target DNA. It contains four layers (I, II, III, IV) listed below.

104 3.3 Cartridge design | Universitat de Barcelona
3.3.1.1 Layer I: biosensors matrix
The first layer contains the 64 gold working electrodes required for the
immobilization of the 14 capture probes selective for the detection of the target of
interest as well as negative or internal controls to check, considering three
repetitions for each immobilized capture probe. Also the pattern include all the pad
for the connection of the WE with the potentiostat and REand CE pads, that will be
connected from the upper layers by means of a conductive vertical channel.
This layer is a COP sheet of 188 µm thick that contained all the electronic paths and
the WE on an 8x8 matrix. This is a rectangular pattern of circular electrodes that
connect with lines of gold to the ends of the sheet. This layer is wider that the other
layers because have exposed in each lateral sides the gold paths for its connection
with the potentiostat. The first two golden paths of the right and left ends have not
direct connection to the central points. These lines are connecting by conductive
silver ink with both the REand CE in layer IV. The rest of gold paths are direct
connections at WE or gold spots in the biosensors array matrix. Figure 3.4 shows
us the dimensions in mm of the original gold pattern in a) and the general parts in
b).

105 3.3 Cartridge design | Universitat de Barcelona
Figure 3.4: a) Original gold pattern mask dimension. b) Main parts of the layer I
The fabrication of the gold electrodes pattern on layer I was performed with two
techniques; photolithography, in our IBEC installations, and by screen printing
technique, fabricated in Atic S.A. Company. For the fabrication of these screen-
printing arrays, DEK 248 equipment was used. The mask used in this fabrication is
showing in figure 3.5.
Figure 3.5: Screen-printed layer I mask detail

106 3.3 Cartridge design | Universitat de Barcelona
During the first tests, these chips made by screen-printing showed that the
resolution of the technique was less than initially expected. Because of this, many
of the conductive tracks were short-circuited, disabling its use as a biosensor.
Therefore, we proceeded in two directions: the first was to change the arrangement
of the electrodes of the array spacing more the conductive tracks and second,was
manufactured the arrays by another technique, photolithography. The first option
(figure 3.6) involved changes in more than one layerof full biosensing block. The
two alternatives were developed in parallel by not excessively delay the fabrication
of the full biosensor block. Due to the good results obtained with the
photolithographic technique, the fabrication with screen-printing was dismissed.
Figure 3.6: Screen-printed redesigned mask to increase the distances between pads and spots
In the photolithographic approach, gold deposition was conducted with sputtering
processes. This method is performed on completely clean COP sheets. The
fabrication was made in theIBEC clean room under controlled temperature and
humidity conditions of the clean room. The equipment used forthis fabrication can
be seen in figure 3.7.

107 3.3 Cartridge design | Universitat de Barcelona
Figure 3.7: IBEC photolithography equipment, a) Sputtering, b) Sputtering cell, c) spinner, d) mask
aligner
It should be noted that the metal deposition by sputtering over COP sheets is not a
standardized process and optimum conditions were obtained after a long process of
optimization. At the end of optimized process, COP sheet that contain a gold face
completely covered tightly adhering was obtained (figure 3.8).
Figure 3.8: COP sheet covered with thin gold film
Once deposited the gold this must be selectively removed to uncover the structure
of desired electrodes. To achieve this, areas corresponding to the electrodes

108 3.3 Cartridge design | Universitat de Barcelona
pattern are protected and then harsh chemicals baths are applied to the COP. The
selective protection is made by depositing a thin uniform photoresist film by
spinning over all gold layer. This resist is exposed to selective treatment of UV light
through a mask containing the electrode design (figure 3.9). UV light sensitizes the
resist layer in a selective form and it allows protecting only a certain gold
areasduring development step.
Figure 3.9: Photolithography mask of the WEs array
The resulting COP is subjected to a harsh chemical treatment for gold. At the end,
we only had a gold protected by the resin previously revealed. The last step was
done to remove the resin remaining on gold paths with other specific dissolvent,
getting the gold matrix on completely clean COP. The resolution of this process
based on photoresists depends on the resolution of the light and the quality of the
mask used. Low cost masks (fabricated in acetone) used for this process allows
resolutions of up to 10 µm, well below 200 µmobtained by screen printing
technique initially used. The resulted array with this technique is shown in figure
3.10. We can see that is obtained a more shine gold because this gold sputtering
deposition method gets much less rough metal surfaces than screen printing.
Furthermore, conductive tracks present no short circuit between them, being a
better resolution in the whole pattern.

109 3.3 Cartridge design | Universitat de Barcelona
Figure 3.10: Fabrication of biosensor matrix by (up) photolithography and (below) screen-printed
comparison
3.3.1.2 Layer II: Passivation layer
The function of this layer is to define the area of the WEspotsand separate those
from the gold pads. We can see the dimensions of layer II in figure 3.11. In the
original design, the idea was to make passivation pattern in a sheets of COP and
then fuse them together with layer I and layer III by pressure-temperature
techniques combined with solvents. However, after several assays with different
chemical treatments, pressures and temperatures the adhesion of this layer was
not strong enough and leaks of the liquid was observed between layer I and layer
III. Because of this, to facilitate manufacturing and reduce costs of the device the
COP mask of layer IIwas changed to a new insulating layer of resin, fabricated with
SU8, above the layer I. The photolithographed mask used in this occasion can be
seen in figure 3.12.

110 3.3 Cartridge design | Universitat de Barcelona
Figure 3.11: Original COP layer I design, a) dimensions of the mask, b) mask where the black
regions represents the laser mechanized positions
This layer was deposited by photolithography, that allows stick this film directly
above layer I by selective deposition of an insulating material. As a result it is also
facilitated the alignment of the layers II, and I but difficult the fusion between layer
III and layer I due to material incompatibilities. Therefore, the design of the
photoresist mask of layer II was changed to left more free COP area to bind with
layer III. The new design solved this problem (figure 3.13); the new photoresist
material layer was maximized to leave discovered the biggest surface area of COP
in layer I. This allows keep using the technique of sealing layers by fusion with
pressure, temperature and solvents, between layer I and III.

111 3.3 Cartridge design | Universitat de Barcelona
Figure 3.12: Photoresist mask in acetate of layer II used for the passivation fabrication on layer I.
Black represents the desired pattern
Figure 3.13: Final layer II photoresist mask used for the passivation fabrication on layer I. Black
represents the desired pattern
The process for depositing the insulating resin and subsequent development is
analogous to that used to define the gold electrodes in layer I. To cover the desired
areas with the electrical insulator we used photolithographic techniques. These are
based on the selective illumination of resins that react to specific wavelengths,
changing its polymeric structure, and making them more or less resistant to

112 3.3 Cartridge design | Universitat de Barcelona
solvents. For this passivation, the substrate is the biosensor array of layer I that
previously has been cleaned to delete superficial impurities. Subsequently, working
in a pristine environment of controlled light, a thin layer of 2.5μm thickness
ofSU8photosensitive resin compatible with biomolecules is deposited.
Spin-coating speed is selected according to the viscosity of the resin to obtain
desired SU8 thickness at the end of the process. After the deposition, the resin is
fixed by a thermal cure at 95 ° C for 2 minutes. At that point, the mask of figure
3.13 is aligned with the biosensor array by means of the mask aligner machine and
the alignment marks patterned in layer I. The assembly is subjected to a controlled
ultraviolet light exposure. Note that the masks have been made in three sets of
chips to maximize the utilization of the manufacturing process and to minimize
prototyping costs. This number is the maximum of arrays that can be done atonce
with the sputteringand photolithography equipment in IBEC clean room.
The alignment between the sheets and passivation mask is crucial. Microscope
control in the photolithographicprocess was performed to check the positioning of
both sheets controlling the points (T-shaped and L) reference. Once aligned, they
are subjected to light exposure that will make the exposed parts of the resin alter
their polymeric structure. Finally, a bath was given with a specific relatively weak
solvent for the resin. The parts of the resin that through the mask were subjected
to ultraviolet light were detached from the plates, releasing areas of desired
electrical contact.
In figure 3.14, we can see the final detail of the passivation by photolithography
near the circular electrodes and gold tracks as well as the different steps during this
procedure.

113 3.3 Cartridge design | Universitat de Barcelona
Figure 3.14: Layer II photolithography procedure steps a) spinning, b) thermal cure, c) ultraviolet
light calibration, d) layer alignment, in lower figures show a passivated electrodes details
To optimize the photolithographed passivation layer, several passivates were
tested. The main reason of this comparison was the unusual electrochemical
behavior after fabrication processes, of certain polymer tested. The initial
photoresist was the AZ5214 and presented some reactivity in the electrochemical
measurements. So, other materials like as AZ3750, Epoxy resin, SU8 and SiO2 were
tested also. After deposition of each one on the biosensors array, we followed the
same cleaning protocol to performelectrochemical test. A CV for each fabrication
sets was performed. Four cycles with potential values from +0.35 V to +0.90 V at a
scan rate of 0.05 mV/s were recorded measuring on the fabricated array the redox
response of ferrocyanide 100 µM in 10 µM of NaCl. After of some tests, the SU8
was chosenasmaterial to fabricate the layer II due to its low electroactivity and high
chemical resistant. The final protocol to passivate the arrays was:
COP substrate with a thin film of 200 nm of gold
Spinner the SU8 in two stages:
5 minutes to 500 rpm - Acceleration - 500 rpm
30 minutes to 2000 rpm - Acceleration - 1000 rpm
With these parameters, we obtain a height of approximately 2.4 µm.
Soft hotplate bakes for1minute at 65ºC and 2 minutes at 95°C.

114 3.3 Cartridge design | Universitat de Barcelona
UV light exposure, with acetate passivation mask, in mask aligner for4.1
seconds
Post hotplate bake for 1minute at 65°C and 1 minute at 95°C.
The sample is developed with a liquid developer prescribe by manufacturer of
Developer SU8 resin for 1 minute and then rinsedwith isopropanol and dry with N2.
3.3.1.3 Layer III: Hybridization chamber
It is an intermediate layer with a central hexagonal hole, which matches the space
occupied by the gold electrodes array matrix in layer I and has to be aligned with
the hexagonal shape of the passivated SU8 pattern in layer II. Besides, also
contains microchannels, where a conductive ink connects both the REand CE in
layer IV with their respective gold paths in layer I (see figure 3.15)
Figure 3.15: Layer III dimensions
Like the previous layer, it also was made of COP and its assembly would be through
the same technique of surface modification solvent ( cyclohexane) and then apply
pressure at a certain temperature. Again, this technique had problems. Trends to
deform and detached after the sealing treatment were constant. For that reason,
the manufacturing strategy was changed for this layer.
As a solution to the problem, it was decided to replace the layer III of COP by a
double-sided adhesive layer of 200 µmin height. The adhesive is called Scapa and
withstands temperatures of 110°C. This change facilitates the assembly of the
layers II, III and IV. The main drawback added to this change was the impossibility
to use the cutting process performed with laser high precision technique used for
COP sheets (figure 3.16).

115 3.3 Cartridge design | Universitat de Barcelona
Figure 3.16 a) COP laser positions mask. b) COP layer III by laser
In this way, many methods were tested and finally it was chosen a cutting plotter
for cost-benefits reasons. The machine used for this cutting pattern is a plotter
Craft Robo CE 5000-40-CRP, performed in IBEC laboratory.
Regarding the mask design for layer III fabrication, figure 3.17 shows the
introduced changes in the connection microchannels and hybridization chamber.
Figure 3.17: Layer III design evolution, a) original COP/Laser design, and b) final double-sided
adhesive/plotter design
After optimization of the techniques and material for layer III, we proceeded to
unify it with the other layers. So, with the new design of this layer, the layers I, II
and III were assembled. During assembly the alignment of the connecting
microchannels of the layer III with the gold paths in layer I was complicated. It was
decided to test the old mask layer II presented the figure 3.12. In this way, two
assemblies of the first three layers schematized in figures 3.18 and 3.19 were
tested.

116 3.3 Cartridge design | Universitat de Barcelona
Figure 3.18: Layers I, II, and III first assembly design, can be note the mask used for layer II.

117 3.3 Cartridge design | Universitat de Barcelona
Figure 3.19: Layers I, II, and III, second assembly design, can be note the other mask used for layer
II.
Complications presented in the assembly of figure 3.18, arose after injecting the
silver conductive ink in the connection microchannels. The ink was spread on other
gold paths in the layer I creating short circuits. However, due to a larger area of
passivation on the gold of layer II used in the second assembly, this problem was
solved. Because of the change in the material of the layer III, the sticking problem
that generated this mask of the layer II disappeared, and so it is not a problem to
use with this configuration.
3.3.1.4 Layer IV: Reference and counter electrodes
The layer IV (figure 3.20) was made in COP of 188 µmand has printed the
REandCE. This printing is done by screen-printing of the Ag/AgCl (Dupont 5874)
and carbon (Dupont 7105) for RE and CE respectively, using masks shows in the
figures 3.21 and 3.22. The machine used for this fabrication was a DEK printer and
the arrays were fabricated by Atic S.A.

118 3.3 Cartridge design | Universitat de Barcelona
The conductive parts of the layer IV are connected with gold paths in layer I,
through the vertical microchannels, in layer III. To achieve this connection those
channels are filled with liquid silver paint or conductive silver epoxy and then dried.
Layer IV also contains two holes (numbers 1 in figure 3.20) corresponding to the
input and output of the test sample.
Figure 3.20: Screen-printed counter (H black shaped) and reference electrode (gray squares)
dimensions of the whole piece

119 3.3 Cartridge design | Universitat de Barcelona
Figure 3.21: Screen-printed for Ag/AgCl reference electrode mask
Figure 3.22: Screen-printed for carbon counter electrode mask
3.3.2 Biosensor block assembly
A scheme of the complete assembly of this block is shows in figure 3.23. To correct
alignment of each one of the layers, there are alignment marks in T or triangle (Δ)

120 3.3 Cartridge design | Universitat de Barcelona
shape. The vertical channel to connect the RE and CE with layer I is shows also in
this figure through the difference layers where this vertical channel cross.
Figure 3.23: Lateral disaggregated scheme of layers I, II, II, and IV, complete assembly. Note the
alignment marks and the conductive silver ink microconnections
After of fabrication of the different layers, the standard joint procedure consisted of
a series of steps detailed below. The layer I and layer II were united by the same
photolithographic manufacturing process. Then, layer I was immobilized with the
different DNA CPs following the protocol optimized in chapter two and with the use
of nanoploter as detailed in the next section. The layer III, made of adhesive
material on both sides of the layer, was aligned and bonded by one side in the layer
I/layer II. Then, the silver conductive ink is placed directly into the microchannels
of the layer III before sealing with the layer IV. This is done without removing the
protective double-sided adhesive on the side of the sheet adhesion with layer IV
(see figure 3.24a). Thus, the protection of the same adhesive serves as guide of
the ink. Once the liquid (paint or epoxy) begins to dry the protection of the
adhesive is removed,leaving perfectly defines its shape(see figure 3.24b). The ink
chosen was Conductive Epoxy CW2400 of CircuitWorks.

121 3.3 Cartridge design | Universitat de Barcelona
Figure 3.24: Microchannels filled with silver ink, a) with side up adhesive. b) Without side up
adhesive, note the well-define shape of the microchannels
Finally, the layer IV aligns and adheres to the adhesive, sealing the cartridge. This
method is especially useful when conductive epoxy is used instead of silver paint
due to their higher viscosity. The complete assembly of biosensing part of the
cartridge can be seen in the figure 3.25. All the electrical connections of the chip
can be accessed from one single side. In this sandwich structure can be incorporate
other operations placing with planar structures on top of this one. This could
facilitate the use of a smaller peltier or PCR systems. Besides, this shape allows
that the sample preparation can be done in similar planar structures around this
one.

122 3.3 Cartridge design | Universitat de Barcelona
Figure 3.25: Schemes of a) Layers of biosensor block. b) Whole biosensor block
To finish the part of the electrochemical cell fabrication is necessary to put luer-lock
connectors in the microfluidic inputs and outputs holes in layer IV to facilitate the
insertion of liquid into the cell. Each connector wasjoined using epoxy adhesive. See
figure 3.26.
Figure 3.26: Biosensor block a) Top side view with luer-locks in input and output holes. b) down
side view
3.3.3 DNA spotting by nanoploter
To perform the deposition of the capture probes on the gold arrays with volumes in
nanoliters, automated equipment Nanoplotter NP 2.0 GeSiM with a nano-Tip STMP
0148 was used (seen figure 3.27).

123 3.3 Cartridge design | Universitat de Barcelona
Figure 3.27: Nanoplotter use for the capture probes immobilization
The main parameter to be optimized for this deposition is the drop volume
necessary to cover completely each circular gold electrode avoiding that the liquid
expands into the adjacent electrodes. This volume depends on the hydrophobicity
of the substrate, so in the case of a hydrophobicsubstrate, lower volume is
necessary to cover each spot. The hydrophilic nature of the substrate was
established through an oxidation process with Piranha solution.
The equipment dispenses a drop volume of 0.4 nL in each deposition. Since a
volume of 0.4 nL does not completely cover the surface of each spot, it is necessary
to increase the number of drops deposited in each electrode. Therefore, the
parameter optimized really was the number of drops needed to cover adequately
each one of the 64 god spots. The optimization is carried out with concentrated
black ink soluble in water, since the test of the drop covering of the spot was done
by naked eyes(see figure 3.28).

124 3.3 Cartridge design | Universitat de Barcelona
Figure 3.28: Detail of a black ink spotting during the optimization of protocol for immobilization
nanoploter
The substrate surface was cleaned before deposition of the probes, making that
acquire a hydrophilic nature by chemical treatment. This last consistson immersing
the array in deactivated Piranha (5:1) for 10 seconds, and then wash with MilliQ,
dry with N2, sonicate in absolute ethanol for 5 minutes, dry with N2, expose in UV
cleaner for 5 minutes, and keep under argon atmosphere until measurement.
During the optimization, parameters of the nanoplotter,such as pulse width, voltage
and frequency, were adjusted to achieve a single drop of more rounded shape (see
figure 3.29). The optimized values for these parameters were 17 μs, 80 V and 200
Hz, respectively.
Figure 3.29: Image of NPC16 software in the stroboscope section wherein the drops is observed
After many tests with different numbers of drops, a number of 180 drops were
optimized to cover completely the surface of each spot. At a frequency of 200 Hz,
the time needed to deposit 180 drops was 0.9 seconds/spot. Therefore, the total
time required to cover the full array of spots was 57.6 seconds, regardless of the
time of the tip transfer from one spot to another.

125 3.3 Cartridge design | Universitat de Barcelona
3.3.4 PCR Block
The function of this block is to contain biological samples and other reagents during
the PCR amplification process. The PCR is a technique used to make multiple copies
of a segment of the DNA of interest, usingcontinuous cycles of heating and cooling
to make many copies of a specific region of DNA, generating a large amount of
copies from a small initial sample. First, two short DNA sequences called primers
are designed to bind to the start and end of the area of DNA target that want to be
amplified. Then, the DNA template that contains the target sequence to amplify is
added to a tube that contains primers, free nucleotides, and an enzyme called Taq
polymerase. Then, the mixture is heated until 100 ºC approximately, to denature or
separate the double-stranded DNA template intwo single strands. Then, when the
temperature is decreased, the primers anneal to the complementary matches on
the DNA target template. At a slightly higher temperature, the enzyme Taq
polymerase begins to bind to the primer sequences and adds nucleotides to extend
the new second strand. Following the synthesis and at the end of the first cycle,
each double-stranded DNA molecule consists of one new and one old DNA strand.
In subsequent cycles, the process of denaturing, annealing and extending are
repeated to make additional DNA copies (see figure 3.30). After a determined
number of cycles, as many as billion copies of the target DNA sequence are
produced from a single starting molecule.

126 3.3 Cartridge design | Universitat de Barcelona
Figure 3.30 PCR process whole schemes. Image taken of https://www.neb.com/
In the scheme of figure 3.31, we can see the different layer that made up the part
corresponding to the PCR block in this LOC. This block will be joined to the Peltier-
heating device during the complete system integration. This cartridge component
was divided in layers also, like the biosensor block. All layers would be done of COP
and coupled by solvents, pressure and thermal techniques. The layers that
constituted this block were the layer IV, layer V and layer VI.

127 3.3 Cartridge design | Universitat de Barcelona
Figure 3.31: Initial design of the whole cartridge components scheme
3.3.4.1 Layer IV
In original design, the layer IV belonged to both constitutive cartridge blocks. In its
downside, include the pattern of the RE and CE, and its upside is in contact with the
biological sample, worked like inert surface floor in the PCR chamber. This layer
contains the in/outlet holes that will contact the flow of the liquid from the PCR to
the electrochemical cell. Due to that, the development of this block was done in
parallel with the biosensor block, and so the layer IV was replaced by other layer
of COP of 188 μm while the complete assembly was accomplished.
3.3.4.2 Layer VI
As the up side of layer IV, layer VI is very simple with the only aim of contain the
liquids injected in layer V. As other layers this is made of COP and has the same
lateral dimensions that the layer IV;188 µm. The sheet has two machined holes
that serve as input and output sample. In figure 3.32, the outline of the different
dimensions of the layer VI prototype is shown.

128 3.3 Cartridge design | Universitat de Barcelona
Figure 3.32: Original design of layer VI
3.3.4.3 Layer V: PCR chamber
This layer is what defines the fluidic cell containing the liquid during the PCR. It is
an intermediate sheet with a central hollow and very similar to layer III. The design
of this layer can see in figure 3.33. The layer was made in COP with a thickness of
188 µm.
Figure 3.33: Original design and dimensions of layer V
In early test versions, the hole of 1 mm of diameter to communicate the PCR
chamber with the hybridization chamber was removed, because the PCR and
detection blocks were not yet together. The COP cuts were made with laser
technique as in previous layers.
During the assembly of the three layers (IV, V, and VI) of this block, the fusion of
COP presents many problems. The main two problems were, in several cases the
temperature applied in the hot-embossing seal on the central part of the hexagonal
area in layer VI with the layer IV, due to the tiny thickness inside the cell that were
melted together. Similar problems were also observed in the first trials in biosensor

129 3.3 Cartridge design | Universitat de Barcelona
block sealing. Another important problem were the leaks observed during the PCR,
the high temperature need it for the PCR, produce high pressure inside the cell,
breaking the sealing between layers.
Contrary to what was done with the biosensor block, where the layer III was
replaced by an adhesive double sided sheet, layer V should continue to be made
with COP, or alternatively in a material compatible with PCR.
As a solution to the problem, it was decided to change the design of PCR block and
replace the V and VI of COP layers by a micromachined sheet. This design avoids
one sealing step and increase the sealing area with the layer IV. For this purpose,
the hexagonal cell was changed to a loop shape cell. The design is shown in figure
3.34. In this new layer, the channel is machined directly onto a 1 mm COP sheet
with a channel depth of 0.5 mm.
Figure 3.34: New design of PCR block
A theoretical simulation study was performed to optimize the new loop design for
the PCR cell in order to dismiss the risk of turbulence (figure 3.35). In this study
was tested a correct filling of the liquid and the pressure during filling. The pressure
observed was not more than 0.05 bars that ensure the tightness of the PCR block.
Moreover, during the process of cell redesign, the volume of 50 µl of sample was
remained at all times to maintain the specifications set in the beginning.

130 3.3 Cartridge design | Universitat de Barcelona
Figure 3.35: Liquid flow simulations in the new PCR block, velocity (left) pressure (right)
Manual microfluidic tests for checking the filling and emptying speed of the channel
and thermal conductivity for establishing possible deformations of the cell were
performed. All this optimization and simulation as well as the integration of the two
blocks were supervised and conducted by Dr. Antoni Homs. The final PCR block is
showed in figure 3.36.

131 3.4 Final cartridge: assembly | Universitat de Barcelona
Figure 3.36: New PCR block with loop channel like PCR chamber
3.4 Final cartridge: assembly
Microfluidic optimization tests of biosensor and PCR blocks were successful and so,
we proceeded to the assembly both blocks. After the replacement of the original
hexagonal PCR chamber for the loop channel, the prototype manufacture was
greatly simplified. Now, the sealing between layers IV with the new PCR block was
performed in one-step. This seal was much easier, since it was the union of only
two structures of COP-COP surfaces. In addition, the channel to seal was much
narrower and deeper than the original hexagonal chamber, and so no problem of
sealing the two covers was encountered.
The seal between the blocks was made with the technique of surface modification
using cyclohexane. The surfaces under cyclohexane were the upside layer IV of the
biosensor block and downside of the PCR block. Then, the surfaces were aligned
and subjected to pressure at a certain temperature. After a lapse, we gained the
complete cartridge.
In the first experiments to test the integrated cartridge with the electrochemical
detection systems (potentiostat) and mini-PCR, some design faults were detected.
The most important observation was the complicated architecture that should arm

132 3.4 Final cartridge: assembly | Universitat de Barcelona
the electronic device to integrate the fluidics, Peltier and array connectors in the
small area of the cartridge. It should be recalled that the connection pads in layer I
are face up and needs to be connected from the top part of the cartridge, where the
Peltier and the fluidic inlet are placed, and this left short space for the Peltier and
the heating of it affected the electrochemical readout.
In order to solve the inconvenient and future problems is decided modify the layer
LOC order.
The new assembly architecture of the two blocks was thought to change the
electrochemical connections to the contrary side of the peltier position. Changes
introduce in the LOC allowed eliminate minor but remaining problems during
manufacture. Besides, the number of layer decreases from six to five. The new
modifications incorporates a principal COP layer (200 μm) that has, at the same
time, the loop channel PCR chamber and the biosensor array matrix patterned on
the other side of the COP. Thus, the PCR block and biosensor block is joined by
layer I now.
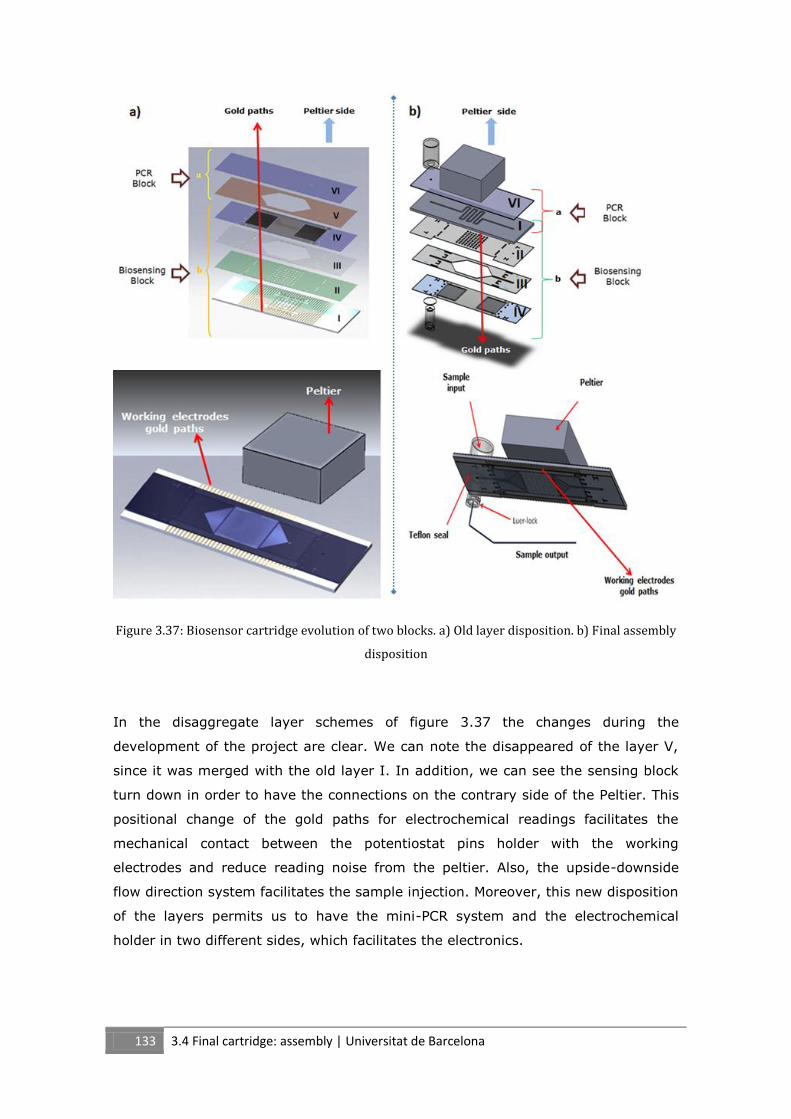
133 3.4 Final cartridge: assembly | Universitat de Barcelona
Figure 3.37: Biosensor cartridge evolution of two blocks. a) Old layer disposition. b) Final assembly
disposition
In the disaggregate layer schemes of figure 3.37 the changes during the
development of the project are clear. We can note the disappeared of the layer V,
since it was merged with the old layer I. In addition, we can see the sensing block
turn down in order to have the connections on the contrary side of the Peltier. This
positional change of the gold paths for electrochemical readings facilitates the
mechanical contact between the potentiostat pins holder with the working
electrodes and reduce reading noise from the peltier. Also, the upside-downside
flow direction system facilitates the sample injection. Moreover, this new disposition
of the layers permits us to have the mini-PCR system and the electrochemical
holder in two different sides, which facilitates the electronics.

134 3.5 Summary | Universitat de Barcelona
3.5 Summary
Studies ofdifferent materials and microfabrication techniques were performed to
design and fabricated a sandwich type cartridge that integrates in a small size and
sample volume; DNA amplification and labelling with a mini-PCR and DNA
hybridization detection with an electrochemical array. The prototype was designed
on different layers that were joined in a sandwich manner. This chapter explains
the different testsand redesigns of some of the layers presented in the overall
development of the cartridge. The PCR and biosensing blocks were optimized first
separately,in a parallel way, and then integrated. Thinking even about of the future
integration of the systems, as well as in the low cost character of the cartridge, the
improvements introduced were done to overcome problems encountered and to
allow a good handling of the elements during the array functionalization process.
The assembly of the materials chosen like COP and the double-side adhesive was
successful, and allowing to develop a new concept of sandwich cartridge for
integrating a mini-PCR and a multiarray in a LOC for medical diagnosis.

135 3.6References | Universitat de Barcelona
3.6References
227. Sin, M.L., et al., System Integration - A Major Step toward Lab on a Chip.
Journal of biological engineering, 2011. 5: p. 6.

136 | Universitat de Barcelona
Chapter 4

137 4.1 Electrochemical assays in microfluidic cartridge | Universitat de Barcelona
4.1 Electrochemical assays in microfluidic cartridge
After optimization of the electrochemical interface or SAM on the single electrode
gold presented in chapter 2, and the optimization of materials and manufacturing
processes for the LOC cartridge reported in chapter 3, we proceed to integrated
both techniques to perform electrochemical testing in the final prototype cartridge
in order to establish an effective protocol for both hybridization and detection.
The characterization and commissioning of the electrochemical cartridge was
performed at all stages with each one of the probes of the study. Nevertheless, the
showed results are the obtained only with the target4 for confidentiality reasons.
The CV is the technique used for the array characterization and hybridization
detection.The main objective of this chapter is to present the protocols evolution of
some procedures such as gold surface functionalization, electrochemical
characterization, and hybridization detection strategies on the final array cartridge
and results obtained with the electrochemical array cartridge prototype with one of
the targets under study.
4.2 Electrochemical cell assembly
As a quick summary, the cartridge for electrochemical detection is the cornerstone
in the development of point-of-care device. This cartridge contains the biosensor
matrix, which is a photolithographed 64 working electrodes made of gold. Each
electrode is connected to the outside by means of gold path in order to establish
physical contact with a multipotentiostat system. The cartridge also contains the
REand CE in the hybridization chamber. Figure 4.1 shows both sides of the layer
containing the RE and CE. In figure 4.2 can be appreciate the assembly of the
electrochemical cell, containing the three different layers

138 4.2 Electrochemical cell assembly | Universitat de Barcelona
Figure 4.1: CE and RE layer upside and downside views
Before sealing the electrochemical cell, all the WE in the array are functionalized
with the specific bioreceptor.
Many immobilization tests were performed with different strategies according to the
experiments performed. For this reason, it was sometimes the formation of the
SAM conducted with closed electrochemical cell and sometimes with an open cell.

139 4.3 Cleaning Array | Universitat de Barcelona
Figure 4.2: Electrochemical cell assembly, Top, open chamber. Down, closed chamber
4.3 Cleaning Array
Depending on the electrodes fabrication technique the gold surface of the fabricated
electrodes in the array presented waste of the materials or reagents with which
these were in contact. Some of these residues showed electrochemical activity
during a measurement test. In addition, the dirtiness may avoid monolayer
formation processes on the gold surface. To characterize this problem,
electrochemical tests on bare array were performed.
The technique used for this purpose was CV with buffer 10 mM sodium chloride
(NaCl). We tested several cleaning protocol that involved the use of sulfuric acid,
for electrochemical desorption of impurities on gold, piranha solution to eliminate
organic traces, UV exposition to oxidase all organic compound on the surface, and
sonication in ethanol, among others. After each cleaning procedure, the array was
tested electrochemically again to test the cleaning method efficiency, but also
considering the degradation of the array pattern and the plastic substrate. After

140 4.4 Gold electrode characterization | Universitat de Barcelona
several test, piranha solution method was choose. The procedure is simple; the
Piranha solution is prepared with sulfuric acid and hydrogen peroxide in a ratio of
5:1 respectively. This mixture is then left at room temperature for 30 minutes to
obtain deactivated piranha. Then the array is washed in a Petri dish rinsing it with a
Pasteur pipette with the deactivated Piranha solution for 2 minutes.
4.4 Gold electrode characterization
The electrochemical characterization of each one of the 64 gold spots represented a
challenge due to the multi-readings of the array that requires a stable multi-
connector. In the absence of the final microfluidic-electrochemical cartridge, due to
its parallel construction, other measurement platforms were created and built.
Figure 4.4a show one of these alternative models composed of two parts of PEEK
material, the bottom piece served as support and anchors of the cartridge, the
upper piece contained a number of contact pins for each gold path on the electrode
array (figure 4.4b). Regarding the microfluidic-electrochemical cartridge (figure
4.4c), a new PDMS layer containing a hold with hexagonal shape of the
electrochemical cell between the RE/CE layer and the WE-array layer was
introduced, to function as sealant between the other two layers. For the fabrication
of the PDMS layer, a Teflon mold (Figure 4.3) was fabricated with the negative cell
pattern into the mold. The PDMS was prepared mixing Sylgard 184 elastomer,
which consists of pre-polymer and curing agent, a plastic cup in a ratio 10:1 (w/w)
respectively. Then, the mix was shaken vigorously for five minutes until the entire
mixture is place in a desiccator to degas for 30 minutes approximately. Finally, the
mixture was placed slowly into a Teflon mold that has the patterned structure.

141 4.4 Gold electrode characterization | Universitat de Barcelona
Figure 4.3 Teflon mold and PDMS layer
The three pieces of the cartridge, 2 electrode layers and PDMS layer, were holded
with four screws sandwiched with the PEEK layers, which pressure the PDMS layer
and contain the liquid inside the cell (figure 4.4b). The idea with this structure was
to help during the electrochemical measure since was easier to controls de cell
liquid and connect each WE with the commercial potentiostat wires (figure 4.5).
Figure 4.4 Alternative platform to electrochemical measures, a) PEEK pieces photography, b)
general assembly scheme, c) Cartridge layers

142 4.4 Gold electrode characterization | Universitat de Barcelona
Figure 4.5: Alternative multi-connector by electrochemical measurements, a) pieces in PEEK
material, b) complete multi-connector system, c) hybridization chamber windows in down view
The results with this platform were not satisfactory. The cable tangle was difficult to
handle and brought confusion in the electrochemical connections. In addition, the
stiffness of the cables pulled the pins of its place and the gold paths contact losing
touch. Considering also that at this point of the project we need to measure with a
8 channels commercial potentiostat and so it was not required to connect the whole
64 WE at the same time, a smaller easier to use connector was developed.
Therefore, the next tool to perform multiple electrochemical measurements was the
electrochemical caliper. The figure 4.6 shows us the homemade multiplexer
contacts.

143 4.4 Gold electrode characterization | Universitat de Barcelona
Figure 4.6: Homemade electrochemical caliper
With this tool, we perform easily electrochemical measurements and allowing us to
measure eight electrodes at the same time with a commercial eight multi-channel
CH instruments potentiostat. This improvement significantly decreased the time
spent during the array characterization and the irreproducibility of the results.
The next step was to generate a current map of the electrode matrix to establish
possible differences in the electrochemical readouts in the whole array. Figure 4.7
shows us distinct current zones in the array. This characterization was performed
with 5 mM of K4[Fe(CN)6] / PBS solution. The CV measurements were done from -
0.23 to +0.55 V with a scan rate of 0.05 mV/s. The map is obtained from the
oxidation peak of third CV cycle of the four performed.

144 4.4 Gold electrode characterization | Universitat de Barcelona
Figure 4.7: Electrode matrix current map
From the reading of the 64 spots that comprise the array, the map of currents
could be established. All areas of the matrix are represented and despite the
differences between the peripheral and the central area, these do not become
significant, being just a difference of 3.4 *10-11 (A) between the most different
areas.
During the electrochemical characterization of the array some fabrication problems
were found, figure 4.8 summarizes the observed damages. Some of the harms
were on the gold parts of the biosensing platform, probably, due to the continuous
and extensive use of the electrochemical connections. The scratched is another
problem that appears after setting up the cell by the friction between layers.
Moreover, in other cases appear after fabrication due to an incorrect adsorption of
the metal on the plastic. To solve these problems, the thickness of gold layer was
increased from 100 nm to 200 nm inthe array fabrication. In posterior test with the
new arrays, there were not damages over the gold after electrochemical analyses.

145 4.5 Electrochemical array characterization | Universitat de Barcelona
Figure 4.8: Damages after electrochemical measurements. a); b); c); d) reticulated marks on
passivated gold. e) and f) Gold paths disruptions
4.5 Electrochemical array characterization
4.5.1 SAM immobilization in closed chamber
The closed chamber concept is referred to the protocol in which the bioreceptors
are immobilized on the array and the subsequent steps were done under flow with
the cell closed. The biosensor building block characterization was done layer by
layer added. This experiments set were performed to observe the electrochemical
response of each adlayer. All measures were done without any redox solution,
sowith NaCl 10 mM in the electrochemical cell to discard possible masking of peaks
from undesired molecules. The CV parameters were the next; potential range from
-0.1 to +0.8 V with a scan rate of 0.05 mV/s. It should be noted that all these tests
were performed for all other capture probes individually. The surface modification
protocol has a sequence of steps;the first one was the bare gold surface
characterization to assure a clean platform. The second step was the MalPEG
disulfide (thiolated linker) layer immobilization. Then, the capture probe was
attached and characterized. In addition, the free gold surfaces and the unreacted
maleimide groups were fully covered to avoid NSA with MCH.Finally, the ferrocene
labeled target DNA was injected into the cell to obtain a duplex formation and its

146 4.5 Electrochemical array characterization | Universitat de Barcelona
subsequent electrochemical detection. After each immobilization steps, a cleaning
procedure was done. The CV characterization was carried out after each adlayer
also; we wanted to test that none of the added reagents could give a redox
response competing with the target DNA redox labeled.
Figure 4.9 shows the electrochemical behavior observed from each adlayer. We can
note the difference between the layers without redox molecule within its interface.
From those results we can assure that, none of the added reagents in the biosensor
gives a redox signal. The duplex formation labelled with ferrocene was detected and
confirm us the well performance of the array.
Figure 4.9: CV current obtained from adlayer in the electrochemical characterization
4.5.2 SAM immobilization in open chamber
Next experiments were performed with the microfluidic chamber opened in order to
have the flexibility of performing distinct hybridization assays in the same array.
Meanwhile in closed chamber strategy, the SAM composition has tobe the same for
all gold electrodes in the array.
To start taking advantage of this feature in the next experiments we analyzed the
NSA on gold sensors, and the specificity of DNA duplex formation. For this purpose
three different controls were done; one without CPs immobilized (MalPEG + MCH +

147 4.5 Electrochemical array characterization | Universitat de Barcelona
Target DNA), another with a mutated CP with the sequence of one of the others
target that will be detected in the multiarray (MalPEG + MCP + MCH + Target
DNA). Both controls are to test the unselective hybridization of the ferrocene
amplified target and the adsorption of the other molecules that could give
electrochemical signal. The last control was focused in the detection of the signal
from remaining ferrocene-labeled primers that could left over after PCR
amplification. For this purpose, a CP with the primer sequence was used, (MalPEG +
CPPr + MCH + Target DNA). The last sample is the positive assay that hybridizes
with the complementary CP the target DNA (MalPEG + CCP + MCH + Target DNA).
These four different modifications of the MalPEG SAM are shows in figure 4.10,
where 16 gold electrodes for each modification were used.
In this section applies to mention that the target solution is a mixture of amplified
DNA and PCR reagents, wherein besides the target DNA, one of the primers is
labeled with ferrocene also.
Figure 4.10: Different functionalization to determine NSA (red area), target DNA specificity (gray
area), redox ferrocene behavior (purple area),and normal hybridization (blue area)

148 4.5 Electrochemical array characterization | Universitat de Barcelona
To immobilize the distinct SAMs in open chamber the protocol involved next steps.
For each immobilization, a micropipette was used and the contained solution was
dripped manually and carefully on the respective gold electrodes. For MalPEG layer,
which was common to all SAMs, a drop was placed on the entire electrodes array.
This incubation was left for two hours. Then a cleaning step was performed. The
second layer was different for each area on the array. The respective molecules
were immobilized in small volumes that were placed dropwise in each area of the
spots, and left to react with maleimide for 1 hour.
In case of (MalPEG + MCH + Target DNA), lacking of CP layer, the respective
electrodes were covered with Tris buffer solution. The following immobilizations
(MCH and target DNA) were common to all SAMs, so for next steps the
hybridization cell was sealed. Thereby the immobilization of these layers was made
by fluidic filling. Each immobilization lasted 1 hour. Like even, between each
immobilization a cleaning step was performed.
4.5.2.1 Positive control
The SAM immobilization with the complementary CP of the target DNA was our
positive control. This control is generally used to compare the expected response
with changes in other controls. In figure 4.11, we can see the electrochemical
measurement after each adlayer. The ferrocene peak detection is notorious in the
increase of current observed at 0.65 V (green line); this is an indicative of a correct
hybridization event.

149 4.5 Electrochemical array characterization | Universitat de Barcelona
Figure 4.11: Electrochemical response of each adlayer in the same electrode (number 30). Bare gold
(red line), MalPEG layer (blue line), CP-MCH layer (brown line), and duplex formation (green line)
One thing that is noticeable from the initial trials was the redox behavior of the
ferrocene molecule. In literature, the oxidation peak of this molecule with a 20-mer
oligo conjugated is located approximately at 0.1 V. However, our target DNA has
106 mer and the electronic transfer is different from the short 20 mer synthetic
DNA target reported. The simple fact that the DNA strand that we use is longer
than reported in literature implies a much higher density of negative charge on the
surface. This higher density is due to the polyelectrolytic nature of DNA and its
known negative charge density. The anion accumulation near the interface of the
gold surface slows down the electron transport and decreases the reversibility of
the redox ferrocene process, also the higher distance where is found the ferrocene
in our system respect to the electrode, slow down the electron transport. During
our experimental sets measured, the ferrocene oxidation peak appeared at 0.75 V.
This value is closer to helical peptides ferrocene labelled with similar length used in
other studies and reported in literature [228-231]. The similarities can be seen in
figure 4.12.

150 4.5 Electrochemical array characterization | Universitat de Barcelona
Figure 4.12: CV from different ferrocene platforms, a) helical peptides and b) our developed sensor
After many optimizations and experiments, the electrochemical detection protocol
was established. We perform a cyclic voltammetry technique in NaCl 10 μM at a
scan rate 0.05 V/s, from 0.3 V to 0.9 V. For electrochemical measurements
analysis, we take the values of cationic ip from each measurement.
4.5.2.2 Controls comparison
The comparison between the different controls gives us more clues about the
performance of our platform, which are summarized in figure 4.13. Regarding the
NSA control (no CP control), we observed low current, so we could consider that the
PEG and MHC molecules carry out their role as antifouling agents.
The mutated CP control vs positive control comparison allows us to infer the correct
configuration of the CP sequence on the maleimide layer and the good selectivity of
the hybridization, comparing with the control without CP signal. Probably the sensor
surface covered with a negatively charged non-complementary NSA; prevent better
the NSA of other DNA molecules, due to charge repulsion.
We can also affirm that the spacing between CP molecules is sufficient to allow the
formation of the complementary duplex. This control also allows establishing the
high specificity of the selected capture probe sequence.

151 4.6 Limit of detection (LOD) | Universitat de Barcelona
The complementary CP and CP primer control comparison assays, let us dismiss the
idea that the “free” ferrocene labeled primers remaining from the PCR and
contained in the same solution that our target DNA, can interfere in the
electrochemical detection signal of duplex.
Figure 4.13: CV electrochemical responses of the controls immobilized in the biosensor (open
chamber)
4.6 Limit of detection (LOD)
Once both; the array functionality with the electrochemical detection of DNA duplex
was established and the manual immobilization protocol was optimized, our next
step was to determine the minimum amount of DNA that we could detect in the
array. To achieve this, different number of DNA copies before PCR amplification
procedure were taken and amplified, following the same protocol. The initial DNA
copies numbers of Diana 4 were, 100000, 500000, 100000, 50000, 10000, 5000,
1000, and 50. The amplification cycles were standardized in 30 for all experiments.
The idea was to obtain several post-PCR solutions with different initial copies of PCR
amplified target DNA. Then three arrays were immobilized following the scheme in
figure 4.14, for reproducibility studies.

152 4.6 Limit of detection (LOD) | Universitat de Barcelona
Figure 4.14: Array functionalization scheme for different DNA concentrations
The different steps for biosensor immobilization were made manually layer by layer
in an open chamber. The results obtained of these trials to find the LOD can be
seen in figure 4.15. Fifty initial copies of DNA for PCR amplification were not enough
for being detected with the good sensitivity of electrochemical detection. However,
no problems for detection of subsequent concentrations was encountered which
show good reproducibility. The higher concentrations (1000000; 500000) showed
much more irreproducibility. Maybe due to surface saturation of DNA strands, this
may interfere with the transport of electrons. Other possible reasons can be an
irreproducible amplification during the PCR cycles, due to DNA strand saturation.
The 100000 experimental sets had a strange behavior, being its electrochemical
signal lower than expected but with good reproducibility. This made us to think that
perhaps this concentration would be the saturation point of the system, affecting on
the PCR amplification and/or in the electron transport. Regarding other
concentrations, we can say that the reproducibility was lower and the detection
signal was acceptable. Our detection limit was quite low; 1000 initial copies of DNA
before the PCR amplification process. However, because our system uses multiple
capture probes, with different targets length, for the next optimization we decided
to take the 50000 initial DNA copies concentration due to its low irreproducibility
and high signal detection.

153 4.7 Crossreactivity test | Universitat de Barcelona
Figure 4.15: CV electrochemical response for different DNA concentrations
4.7 Crossreactivity test
Having established the ideal working concentration of initial target DNA copies, the
next step was to test the crossreactivity between two of the target that will be
detected in the final array. In the final prototype for cancer detection 14 different
CPs will be immobilized on the array, for the detection of 14 different targets DNA
labelled with ferrocene. The objectives of these experiments are two, to determine
whether the SAM works fine for other capture probes with longer targets and to
establish possible cross-reactions between different targets and immobilized
capture probes on the array. The capture probe of target DNA Diana 8 was
randomly chosen for these experiments.
The array immobilization experiments sets is show in figure 4.16, were was tested
the next systems; SAM with CP Diana 4 and SAM with CP Diana 8 were hybridized
with target Diana 8 and target Diana 4 respectively; with these two systems we
established the possible crossreactivity between these two DNA targets. In other
words, we probed the non-specificity between these DNA targets. Other two
systems with CP Diana 4 and CP Diana 8 were hybridized with its respective target
DNA; these experiments give us information about the correct MalPEG SAM
behavior for different capture probes. A set of measurements with mutated target

154 4.7 Crossreactivity test | Universitat de Barcelona
(a synthetic ferrocene-labelled ssDNA external to the project) and negative control
without CP incubated with target DNA Diana 4 would strengthen our study of the
capture probes specificity.
Figure 4.16: Array functionalization scheme for crossreactivity test
Regarding the duplex formation detection with different capture probes and its
respective target DNA, we obtained good results, figure 4.17 shows those
responses. As in previous experiments, this test was performed in triplicate, to test
the reproducibility of the responses. We detected hybridization event in each one of
the capture probes tested, Diana 4 and Diana 8. However, some differences were
observed in the current obtained from the two systems. These variabilities could be
understood due to its DNA structural differences.

155 4.7 Crossreactivity test | Universitat de Barcelona
Figure 4.17: Diana 4 and Diana 8 electrochemical detection signals
Figure 4.18: Structural differences during the hybridization event to Diana 4 and Diana 8, the
purple arrows indicates the distance of ferrocene label to surface

156 4.7 Crossreactivity test | Universitat de Barcelona
The higher signal and reproducibility corresponding to the hybridization detection of
target DNA 8 comparing with target DNA 4. Taking into consideration the two
structures of the target 4 and 8 after hybridization (figure 4.18), the longer
sequence of target 8 could make think in a more difficult hybridization, but there is
another important factor in the hybridizationdetection that is the position of
ferrocene. In the target 8 hybridization, the ferroceneis found in a shorter distance
from the electrode andthe lower packing density of the DNA strand on gold surface
in this case would facilitate the electron transport. Therefore, in this case, this
configurational change allows that the current obtained in this system is higher.
Figure 4.19: Summary of multiprobe functionalization test
Having a look in the crossreactivity response observed in the control (figure 4.19),
the non-specificity of the target DNA Diana 4 over mutated CP and CP 8 and
viceversa were giving the same current. These controls current were about 3 times
lower than Diana 4, which show the lower response and about 4 times lower than
Diana 8, which makes this crossreactivity clearly different from the positive signals.

157 4.8 Electrochemical signal amplification | Universitat de Barcelona
4.8 Electrochemical signal amplification
Despite the excellent results of ferrocene as redox label on these targets, during
the trial conducted with longer targets that have the complementary CP sequence
farthest of the ends, its behavior was unpredictable. In some target, the signals
obtained were too low and another was very irreproducible, the explanations of
these responses could be several[232-239], however the figure 4.20 schematizes
some hypotheses that were proposed. The main reason that may have influenced
was probably a deficit in the electrons transport due to the conformational changes
of the DNA strands during the hybridization. Some targets are too long and its
hybridization is difficult, moreover a higher number of basesimplicate a higher
steric hindrances as well as higher charge density on the surface sensor.
Figure 4.20:Possible hybridization kinds and its subsequent problems in longer target DNAs, a) lower
hybridization events, b) free CP due to electronegative tilts of closer segments of target DNA, c)
accumulation of negative charges on the sensor surface because a high density of DNA strands and d) steric
hindrances due to spatial conformations

158 4.8 Electrochemical signal amplification | Universitat de Barcelona
Because the large differences between the currents obtained with different DNA
targets, a different label to targets was proposed. The idea was to obtain similar
electrochemical responses in all targets tested. However, a direct label with other
redox molecule will give the same problems that the ferrocene. It was necessary to
look for an electrochemical diffusional mediated system to avoid the distance
effects with the electrode and redox molecules that produce more amounts of
electrons for each label to amplify the current and reduce the irreproducibility. In
this way, the biotin-streptavidin-horseradish peroxidase (HRP) complex was
proposed. Unlike that the ferrocene system, wherein the detection was directly due
to the redox nature of the molecule itself, these complex requires three steps to be
activated. During the PCR amplification instead of to use ferrocene-labeled primers,
biotin-labeled primers were used to obtain fromPCR amplification biotin-labeled
targets (figure 4.21). After of the hybridization in the sensor surface, the second
step consists in the incubation of the streptavidin-HRP complex for15 minutes to
bind on the biotin withthe target DNA. This enzymatic complex (biotin-streptavidin-
HRP) has higher specificity. The last step was to introduce in the system a mix of
tetramethylbenzidine (TMB) and hydrogen peroxide (H2O2) in 1:1 ratio. This
solution is preincubated on the biosensor surface t for 10 minutes, to produce with
the catalytic effect of peroxidase high amount of electronsbefore the
electrochemical reading.

159 4.9 Thermal stability of MalPEG-CP interface | Universitat de Barcelona
Figure 4.21: Target DNA labels (left) ferrocene (right) biotin, the label position into the target
sequence is the same indistinctly of the system
This lapse is enough to initiate the redox reaction between the HRP and H2O2,
releasing water and oxygen and reducing TMB on the electrode surface (figure
4.22). This reaction is time dependent due to ithas a limiting agent, the peroxide,
but it has high concentration to avoid its consumption. This reaction was detected
by chronoamperometry since it is much faster that CV and permits the correct
measurements of all sensors with few time.
Figure 4.22: Biotin label and its complex redox scheme
4.9 Thermal stability of MalPEG-CP interface
As mentioned above, the presented electrochemical DNA array will be integrated in
a LOC in a sandwich format with a mini-PCR. The work was conducted in parallel,
with theother research groups mentioned before, and we tested each development,
component or improvement directly in the array.
The mini-PCR arrangement involves a peltier mechanism that works as
thermocycler for the different PCR amplification processes. In the final architecture

160 4.9 Thermal stability of MalPEG-CP interface | Universitat de Barcelona
of the device this peltier is closer to the electrodes matrix. This means that abrupt
temperature changes during PCR amplification can affect the stability of the
immobilized monolayers of biomolecules on gold electrodes.
We begin to notice this effect when we incorporated the hybridization process with
the thermocycler system. During the hybridization, the inner temperature of the
chamber must be 59°C to facilitate the duplex formation. However, the PCR
amplification steps require higher temperatures for de-hybridization (95ºC) and
polymerization (72ºC). The heat transfer between materials may produce a heating
on the electrochemical chamber, and depends on the applied temperature, it may
affect the thiol-gold breaking bonds and so the bioreceptors desorption.
To test the thermal stability of MalPEG-CP SAM we performed a set of SPR
experiments that included different temperatures post MalPEG immobilization.
The main goal was to determinate a possible desorption of molecules regarding
temperature. In this way, we follow the optimized protocol and we immobilized a
MalPEG interface for two hours, then, we link up this linker with the CP and we
blocked with MCH for one hour.
Afterward, it was incorporated the target DNA labeled with biotin and incubated for
1 hour, with its subsequent incubation for one hour with streptavidin-HRP. Between
each step, we performed a washing step. The electrochemical readouts were done
with a mixture of TMB and H2O2 following the protocol explained in previous
section.

161 4.9 Thermal stability of MalPEG-CP interface | Universitat de Barcelona
Figure 4.23: SPR minimum refractive coefficient of MalPEG after each indicated temperature
Figure 4.23 summarized the behavior of the MalPEG SAM under different
temperatures. We can see the loss of reflectivity when the temperature was
increased up to 50ºC. These results clearly show desorption of molecules on the
gold surface. Some groups has studied the single thiol gold bound stability with
temperature, considering that at temperatures higher than 60 occurs the breaking
of this bound in spherical gold nanoparticles [240].
Several results of these experiments arose. The hybridization temperature was
reduced from 59 ºC to 37 °C degrees lower than the temperature of the initial
protocol to avoid desorption problems. Also, the structure of the cartridge sandwich
was redesigned. Initially the layer where the array was patterned was directly
touching the PCR cell and it was interchanged by the RE/CE layer in order to left
more far the WEs layer from the Peltier.

162 4.10 Hybridization conditions optimization | Universitat de Barcelona
4.10 Hybridization conditions optimization
4.10.1 Hybridization study
Thermal tests of the hybridization were done this time with controls to ensure that
the reduction of the hybridization temperature is not affecting the selectivity of the
biosensor. The systems tested were; SAM without CP as negative control, normal
SAM with complementary CP Diana 4 as positive control, SAM with mutated CP as
mutated control, and a SAM with a CP of other DNA target as crossreactivity
control. Figure 4.24 show the results obtained at 37ºC and 59ºC. The duplex
formation in the positive control was favored at 37ºC; the current obtained was 1.6
time higher, with better reproducibility. Also, the mutated control was benefited by
the lower temperature. Regarding negative and crossreactivity controls, the NSA it
does not change.
Figure 4.24: Hybridization temperature optimization
4.10.2 Interface composition test
In order to optimize the new platform based on HRP detection instead of ferrocene,
the configurations of the biosensor interface was also studied, since the way of
detection is very different from a direct electron transfer of ferrocene, to a
diffusional mediation with HRP, and so the interface may affect a lot in the
biosensors performance. Experiments with LAM molecule compared with disulfide
MalPEG was tested again. The objective was to determine if disulfide MalPEG

163 4.10 Hybridization conditions optimization | Universitat de Barcelona
molecule was still the best thiolated linker of the capture probe on gold surface, be
recalled that the concentrations used during this trials were the same that the
established in chapter two. The two molecules were tested with biotin-labeled PCR
amplified target 4, the experimental sets with target 4CP are de positive control,
with non-complementary CP are the controls 1, and without CP are the controls 2.
In the results showed in figure 4.25, we find that the maleimide disulfide was still
the best option as can be appreciated. These outcomes may be due to the
structural differences of the two linkers. In the case of LAM o unique PEG branch is
immobilized for each linker molecule, meanwhile disulfide MalPEG has two. Thus,
MalPEG is covering better the biosensor surface with PEG molecule, which helps in
the reduction of NSA. Moreover, the second PEG branch in the disulfide, kept a
distance between CPs that may help in the reduction of steric hindrances during the
hybridization of the biotin-labeled target DNA, improving both the efficiency of the
duplex formation and the electron transfer process.
Figure 4.25: Thiolated linker comparison, LAM (lipoic acid maleimide), DS (disulfide MalPEG)
4.10.3 Ratio MalPEG/CP optimization
To follow with the biosensing interface optimization, test of different ratio of
MalPEG:CP concentrations were performed. First the MalPEG concentration was
tested under fixed CP concentration of 10 µM, the negative control was, as even, a
system without CP. Figure 4.26 shows the ratios of MalPEG in µM tested and its
corresponding electrochemical detection.

164 4.10 Hybridization conditions optimization | Universitat de Barcelona
Figure 4.26: Different MalPEG concentration (µM) with CP fixed concentration at 10 μM
An increasing trend of the current is observed in the results, when the MalPEG
concentration rises up. The values of 40 μM and 30 μM where the ones chosen for
being tested with different concentration of CP. Figure 4.27 summarizes the
experiments sets with fixed MalPEG concentrations at 40 and 30 µM and with
different CP concentrations; 10, 20, 30, 40, 50, and 60 µM.
Figure 4.27: Different CP concentrations with MalPEG fixed concentration at 40 μM (blue) and at 30
μM (green)

165 4.10 Hybridization conditions optimization | Universitat de Barcelona
As a clear differences from the previous results at different concentrations of
MalPEG, where a clear decreasing trend was observed, in the case of different CPs
concentrations a Gaussian tendency is observed in MalPEG fixed concentration at
30 µM. However, in both fixed concentrations the maximum value is characteristic
of the ratio 1:1 of MalPEG:CP. Finally, the ratio 30:30 was chosen to optimize the
biosensor in the next experiments due to its high signal between all systems tested.
4.10.4 Crossreactivity test
We continued testing all probes on the array in order to detect the behavior of each
one and to establish possible crossreactivity with other CPs. Several experiments
were performed and each time that a new improvements in the platform arrived,
was tested with the new SAM on the array. In figures 4.28 and 4.29, we can see
some electrochemical results obtained during the development of the project. Is
notorious the low cross-reactivity between the distinct CP.
Figure 4.28: Target DNA hybridization detection of Diana 3

166 4.10 Hybridization conditions optimization | Universitat de Barcelona
Figure 4.29: Target DNA hybridization detection of Diana 5
A summary of hybridization detection results of each CP tested and its
crossreactivity with some of the CPs is shown in figures 4.30 and 4.31. An excellent
behavior in general is observed. The difference in the intensity of the signal is due
to several factors such as the length of the respective target DNA that affects on
the hybridization efficiency and the electrochemical readout. Another possible factor
is the PCR amplification efficiency, which is also dependent on the DNA target
length where the longer DNA strands are more difficult to amplify.
Figure 4.30: Summary of electrochemical results for all CPs

167 | Universitat de Barcelona
Regarding the cross-reactivity, we can see in figure 4.31, the low interference
between each DNA target and the non-complementary CPs.
Figure 4.31: Crossreactivity of the different Diana tested
4.11 Summary
The electrochemical characterization of the gold array integrated into the
cartridge,initially found several problems that were solved,like thickness of gold
film, forthe manufacturing of the array.The gold WE surface manually and
automatically functionalized with the nanoplotter with the optimized interface. ,

168 4.12References | Universitat de Barcelona
Crossreactivity with other CPs in the array and NSA and positive controls were
tested, giving good electrochemical results. However, due to the lower signal
presented in some targets, the electrochemical amplification method was changed
from a ferrocene label to an enzymatic HRPlabel. In this way, the target DNA
wasnot label with ferrocene, but with biotin to label it with streptavidin-HRP. The
advantage of this change of label is the higher, fasterand more
reproducibleresponse, but with a negative counterpart of having more steps and
reagents into the system.Because of this change, the ratios between the
components of the SAM were changed and optimized again to exclude future
inconveniences and improve signal.
4.12References
228. Watanabe, J., T. Morita, and S. Kimura, Effects of dipole moment, linkers,
and chromophores at side chains on long-range electron transfer through
helical peptides. The journal of physical chemistry. B, 2005. 109(30): p.
14416-14425.
229. Morita, T. and S. Kimura, Long-range electron transfer over 4 nm governed
by an inelastic hopping mechanism in self-assembled monolayers of helical
peptides. Journal of the American Chemical Society, 2003. 125(29): p.
8732-8733.
230. Takeda, K., T. Morita, and S. Kimura, Effects of monolayer structures on
long-range electron transfer in helical peptide monolayer. The journal of
physical chemistry. B, 2008. 112(40): p. 12840-12850.
231. Kai, M., et al., Distance dependence of long-range electron transfer through
helical peptides. Journal of peptide science : an official publication of the
European Peptide Society, 2008. 14(2): p. 192-202.
232. Giese, B., Long-distance charge transport in DNA: the hopping mechanism.
Accounts of chemical research, 2000. 33(9): p. 631-636.
233. Hüsken, N., et al., Impact of single basepair mismatches on electron-
transfer processes at Fc-PNA⋅DNA modified gold surfaces. Chemphyschem :
a European journal of chemical physics and physical chemistry, 2012.
13(1): p. 131-139.
234. Tao, N.J., Electron transport in molecular junctions. Nature nanotechnology,
2006. 1(3): p. 173-181.

169 4.12References | Universitat de Barcelona
235. Anne, A. and C. Demaille, Electron transport by molecular motion of redox-
DNA strands: unexpectedly slow rotational dynamics of 20-mer ds-DNA
chains end-grafted onto surfaces via C6 linkers. Journal of the American
Chemical Society, 2008. 130(30): p. 9812-9823.
236. Bumm, L.A., J.J. Arnold, and T.D. Dunbar…, Electron transfer through
organic molecules. The Journal of …, 1999.
237. Giese, B., Long-distance electron transfer through DNA. Annual review of
biochemistry, 2002. 71: p. 51-70.
238. Giese, B., Electron transfer in DNA. Current opinion in chemical biology,
2002. 6(5): p. 612-618.
239. Sun, P. and M.V. Mirkin, Kinetics of electron-transfer reactions at
nanoelectrodes. Analytical chemistry, 2006. 78(18): p. 6526-6534.
240. Li, F., et al., Thermal Stability of DNA Functionalized Gold Nanoparticles.
Bioconjugate chemistry, 2013. 24(11): p. 1790-1797.

170 Chapter 5 | Universitat de Barcelona
Chapter 5

171 5.1 Conclusions | Universitat de Barcelona
5.1 Conclusions
The constant search for methods and alternatives for DNA detection and the need
for many applications of portable and low cost devices has popularized the
integrated systems of sample analysis. Today, we found in the market several kinds
of LOCs for this purpose. Most of them use optical detection techniques, making
expensive and impractical mass adoption of these technologies in clinical
laboratories. For these reasons, the incorporation of electrochemical techniques for
DNA detection has become not only an excellent tool but also the future of these
portable devices.
This work presents the development of a new platform in multiprobe LOC
electrochemical DNA detection. This prototype has been focused in its final
commercial application for cancer detection in the framework of an industrial
project joined with abiotech company. The nanostructured distribution of the
biomolecules on the biosensor surface is one of the main features that affects in the
successful of DNA biosensor performance. The self-assembly of this bioreceptors is
the principal tool used for its attachment and distribution on the surface. Many self-
assembling materials, such as thiols and dithiols, are of particular interest due to its
ability to anchor on metal surfaces. The easy formation of stable heterogeneous
structures is in many points of view, one of the biggest attractive of self-assembled
monolayers. Their great number of applications, ranging from the stabilization of
many nanostructures and nano-objects through the surfaces functionalization to
their interaction with biological molecules like DNA, SAMs made the best
bioinorganic platform in biosensors. Multiple studies have characterized gold-
sulfhydryl links as distribution geometry between the molecules assembled.In
addition, there are data about the molecular orientation, packing density, and
molecular adsorption patterns of SAM among other things. However, these studies
have been mainly based in thiol-gold interaction leaving aside other types of
sulfhydryl groups, like the disulfides and lipoic acid derivate linkers used in this
work.
Our goal in this project, in first place, was to establish the optimal conditions that
maximize the hybridization efficiency and subsequent detection of specific target
DNA, amplified by PCR. In this way, we compared the behavior of three different
SAMs in single gold chips; a SH-DNA/MCH mixed monolayer (thiol-based SAM), a
HO-EG6-C11-S-S-C11-EG6-NHCO-Maleimide-SH-DNA monolayer (MalPEG-based

172 5.1 Conclusions | Universitat de Barcelona
SAM) and finally a lipoic acid derivate with maleimide-SH-DNA monolayer (LAM-PEG
based SAM). The results show that the MalPEG SAM offers the best conditions for
the detection, with better sensitivity and selectivity of the different DNA targets.
Techniques such as XPS, SPR, and CV electrochemical technique were used for
both; determining the SAM structure and measure the hybridization efficiency. The
different characterization of phases during the dynamic chemisorption of gold-thiol
bond helps us to improve the distribution geometry of functionalized thiol domains
on gold. Moreover, the modification of the gold surface through annealing showed
great advantages for the electrochemical detection of target DNA. However, due to
the low cost nature of the end cartridge and the characteristics of the materials
used, it was not possible to apply this technique in the cartridge array of 64
electrodes.
The electrochemical array for DNA detection was integrated in a LOC with a mini-
PCR chamber for the amplification of the DNA sample in a portable and low cost
device. For this purpose, it was fabricated a cartridge in a sandwich format that
integrates both chambers. The original model of the cartridge configuration
consisted of seven layers, containing within these layers two with electrodes; one
with the counter and reference electrodes serigraphed and another with a64
working electrodes array, fabricated in gold by photolithography.
Some challenges were solved like; leaks, deformation by heat, and chemical or
physical degradation of the material, among others. In addition, the technique used
to join the layers of sandwich not gives the expected results. For these reasons,
some layers were redesigned and/or made of other materials obtaining finally an
efficient cartridge for the purpose of the project.
Regarding the functionalization of the integrated array both, the automatic
immobilization by plotterand manualincubation, showed a correct behavior and it
coulddetected the target DNA without mishap. Because of the multi array
configurations, the crossreactivity and NSA was deeply tested and was done in
parallel with the positive controls. The functionalization with multiple capture
probes was successful, giving good electrochemical results. However, in order to
improve the reproducibility and sensitivity ofthe electrochemical results, there was
a change in the redox label in the biosensor. The hybridization signal was amplified
by changing the label of the target DNA from the redox ferrocene molecule to a
more efficient electrocatalyticenzyme complex.

173 5.1 Conclusions | Universitat de Barcelona
The integration of the central automatized unit, the PCR thermocycler, the
microfluidic cartridge, the confinement of the liquids into the cartridge chambers,
andthe integration of the electrochemical biosensor arrayare still in process.

174 Chapter 6 | Universitat de Barcelona
Chapter 6

175 | Universitat de Barcelona
Resumen en español

176 6.1 Introducción | Universitat de Barcelona
6.1 Introducción
El presente trabajo de tesis doctoral está enmarcado en el proyecto de
investigación y desarrollo (I+D) conjunto entre la empresa privada de biotecnología
de diagnóstico molecular Genómica S.A.U., el Instituto de Bioingeniería de Cataluña
(IBEC), la Universidad de Barcelona y la empresa privada alemana ChipShop
Microfluidics.
El objetivo principal del proyecto es la fabricación, puesta en marcha y
comercialización de un dispositivo de diagnóstico temprano para detección de
secuencias de ADN involucradas con el cáncer. El dispositivo multisistema, o lab-
on-a-chip (LOC), está conformado por una unidad central de automatización (UCA),
un sistema de Peltier como elemento de control térmico que hacen parte de un
sistema en miniatura de amplificación de ADN o reacción en cadena de polimerasa
(mini-PCR) y una plataforma de biosensado (cartridge) compuesta por una matriz o
array electroquímico y un sistema fluídico tipo loop con múltiples compartimentos
para confinación de líquidos. Cada grupo se encarga de una parte del desarrollo del
proyecto y paralelamente se integran algunos sistemas para su optimización.
6.2 Monocapa autoensamblada
El objetivo de ésta tesis fue la creación, caracterización y optimización de la
plataforma de reconocimiento bioquímico entre dos hebras de ADN sencillas de
longitudes disímiles pero con algunas secuencias complementarias, para la
posterior detección electroquímica de un evento de hibridación entre éstas, y su
integración en el cartridge. Para la creación de ésta plataforma, se optó por utilizar
una monocapa autoensamblada (SAM) de tioles como interfaz de bioreconocimiento
de las 14 secuencias de ADN que hacen parte del proyecto. Durante la
optimización de esta interfaz se utilizaron chips de oro individuales así como varias
moléculas para la inmovilización de las sondas de captura, siendo elegidas tres:
una molécula de disulfuro con dos brazos de poli etilenglicol (PEG) y un grupo
malaimida en el extremo de uno de ellos. Este enlazador (o MalPEG linker)
reacciona con la superficie de oro debido a la interacción dativa entre los átomos de
azufre del disulfuro y los átomos de oro de la superficie de los chips. Al mismo

177 6.3 Celda electroquímica | Universitat de Barcelona
tiempo, el grupo malaimida reacciona con el grupo tiol de la sonda de captura,
inmovilizándola. Los grupos PEG funcionan como antifouling. La siguiente molécula
es la primera hebra de ADN, que trabaja como sonda de captura (CP) de la
segunda hebra de ADN (ADN objetivo) y está inmovilizada sobre el chip de oro
gracias al linker. La tercera molécula es el mercaptohexanol (MCH) que hace las
veces de agente antifouling-reforzando la labor de los grupos PEG-y agente
bloqueante de grupos malaimida que no reaccionaron con el CP. Las tres moléculas
una vez inmovilizadas sobre la superficie de oro, conforman el biosensor
electroquímico.
Para establecer los ratios entre las tres moléculas anteriores se realizaron una serie
de pruebas con técnicas como: la resonancia de plasmones superficiales (SPR) y la
voltametría cíclica (CV). Además, se caracterizó la formación de la SAM mediante
análisis de componentes químicos por espectroscopia de fotoelectrones emitidos
por rayos X (XPS) despuésde cada capa de molécula incubada. La detección
electroquímica de la hibridación de ADN es posible debido al marcaje redox con la
molécula de ferroceno que tiene la hebra de ADN objetivo en su secuencia y que es
introducido por medio de una amplificación por PCR. Despuésde múltiples
experimentos y controles de adsorción no específica (NSA) así como de reactividad
cruzada, los ratios finales optimizados en los chips de oro de los componentes de la
SAM fueron 20 µM de MalPEG: 10 µM de CP. El mercaptohexanol fue estandarizado
a 10 µM.
6.3 Celda electroquímica
Durante la fabricación del cartucho electroquímico se presentaron algunos
problemas durante la fusión de capas así como de respuesta al estrés de algunos
materiales. Debido a esto, rediseño de patrones como también introducción de
nuevos materiales fueron llevados a cabo. El uso de distintas técnicas de
microfabricación también fue necesario durante el ensamblaje.
El cartridge está dividido en dos bloques principales, el bloque de
biosensadoelectroquímico y el bloque de PCR. El bloque electroquímico está
compuesto de 4 capas que juntas conforman una celda electroquímica de tres tipo
de electrodos el de trabajo, el auxiliar y el de referencia. Así, la capa I está hecha
de una ciclo-olefina (COP) y contiene un array electroquímico fotolitografiado de 64
sensores de oro que funcionan como electrodos de trabajo o working electrodes

178 6.4 Integración de la biointerfaz de sensado en la celda electroquímico | Universitat de Barcelona
(WE) y que contienen la superficie de oro que va ser funcionalizada con la SAM del
apartado anterior. Además, cada uno de los sensores tiene una pista de oro que
termina en un lado de la capa y que sirven como conexión entre el cartridge y el
potenciostato. La capa II es una película fotolitografiada, de resina SU8, sobre la
capa I que define el área de los sensores de oro que debe ser funcionalizada y que
aísla la superficie de oro de las pistas. La capa III es una adhesivo doble cara que
posee un agujero hexagonal que trabaja como cámara de hibridación. Esta capa
une las capas I y II con la capa IV sellando la celda electroquímica. La capa IV de
COP tiene impresos, por medio de screen printing, los electrodos de referencia (RE)
y auxiliar (CE) en Ag/AgCl y carbono respectivamente. La conexión entre estos dos
electrodos y sus respectivas pistas de oro, para que tengan un punto de conexión
con el potenciostato, está hecha a través de un canal microfluídico vertical que se
rellena de una resina conductora de plata durante el ensamblaje del bloque. Esta
capa también posee dos orificios que hacen las veces de entrada y salida de
líquidos de la celda electroquímica.
En lo que concierne al bloque de PCR, éste tuvo un cambio de diseño estructural
con respecto a la idea original. Se pasó de un sistema de tres capas de COP (capa
IV, capa V y capa VI) con una celda de PCR tipo hexagonal, a una pieza
mecanizada del mismo material con un canal microfluídico tipoloop de solo dos
capas, la que posee el canal y la que lo sella. La función de este bloque es el de
contener las soluciones durante los procesos de amplificación de ADN por medio de
la mini-PCR. Está en contacto directo con la Peltier y está comunicado con el bloque
electroquímico por medio de canales fluídicos verticales. La unión de los bloques se
realiza a través de una técnica que involucra una modificación en la superficie del
COP y posteriores procesos de unión por presión y temperatura.
6.4 Integración de la biointerfaz de sensado en la
celda electroquímico
La integración de la SAM optimizada en los chips de oro y el cartridge
electroquímico, se realizó a través de dos formas; la primera de ellas fue un goteo
por etapas, y por micropipeta, de las soluciones que contenían los componentes de
la SAM sobre cada una de los 64 sensores de oro. La segunda forma fue hacer

179 6.5 Conclusiones | Universitat de Barcelona
exactamente lo mismo pero de forma automatizada con un nanoploter, para mayor
control en volúmenes cobertura y tiempos de incubación. Los mayores problemas
durante estos ensayos de integración radicaron en la baja señal electroquímica
obtenida en algunos DNA objetivos. En ensayos tempranos se utilizó la molécula de
ferroceno como marcaje pero, debido a estos resultados con algunos ADN
objetivos, fue remplazado por la molécula biotina, cuya función es enlazar al
sistema de sensado un complejo enzimático con mayor eficiencia en el transporte
de electrones. Este complejo enzimático comprende la unión de la estreptavidina-
HRP (horseradish peroxidase) a la biotina, es altamente específico y amplifica la
señal de un evento de hibridación mucho más que la molécula de ferroceno. Para
éste último sistema de marcaje y después de varios controles de NSA y de
reactividad cruzada sobre el biosensor electroquímico, las concentraciones
optimizadas finales de los componentes de la SAM son de 30 µM tanto de linker
como de CP. Con respecto al MCH se estandarizó en 100 µM. Estas nuevas
relaciones ofrecen excelentes resultados electroquímicos en los distintos ADN
objetivos que han sido probados.
6.5 Conclusiones
La elección de una monocapa autoensamblada como plataforma de anclaje de las
sondas de captura sobre la superficie del oro, por medio de un linker MalPEG, fue
acertada. Es un método eficaz para la posterior hibridación y detección de un ADN
objetivo convirtiendo a esta SAM en una excelente interfaz de biosensado.
La combinación de técnicas y materiales de fabricación para una configuración en
sándwich de los bloques constitutivos del cartridge, resultó satisfactoria;
disminuyendo al máximo las fugas de líquido, las deformaciones por calor y el
desgaste por uso.
La integración de la interfaz de bioreconocimiento al array electroquímico, supuso
cambios tanto en los ratios de los componentes de la SAM como del marcaje redox
de las hebras de ADN objetivos. Los diferentes procesos de fabricación de los
sensores de oro entre los chips sencillos y el array de 64 electrodos, así como los
cambios de substrato entre ellos, fueron la causa más posible para una menor señal
de detección de la hibridación. Sin embargo, los nuevos ratios de los componentes

180 6.5 Conclusiones | Universitat de Barcelona
constitutivos y la incorporación del sistema enzimático redox solvento sin mayores
complicaciones este problema.