development of efficient and cost-effective distributed
TRANSCRIPT
Computers & Geosciences 37 (2011) 1476–1489
Contents lists available at ScienceDirect
Computers & Geosciences
0098-30
doi:10.1
n Corr
Researc
E-m
journal homepage: www.elsevier.com/locate/cageo
Development of efficient and cost-effective distributed hydrologicalmodeling tool MWEasyDHM based on open-source MapWindow GIS
Xiaohui Lei a, Yuhui Wang a,b,n, Weihong Liao a, Yunzhong Jiang a, Yu Tian a,c, Hao Wang a
a China Institute of Water Resources and Hydropower Research, Beijing 100038, Chinab School of Environmental Science and Engineering, Donghua University, Shanghai 201620, Chinac School of Civil Engineering, Tianjin University, Tianjin 300072, China
a r t i c l e i n f o
Article history:
Received 27 April 2010
Received in revised form
13 March 2011
Accepted 23 March 2011Available online 14 April 2011
Keywords:
Efficient and cost-effective
MWEasyDHM tool
Open-source GIS
MapWindow GIS
EasyDHM model
Calibration
Visualization
04/$ - see front matter & 2011 Elsevier Ltd. A
016/j.cageo.2011.03.016
esponding author at: China Institute of Wate
h, Beijing 100038, China.
ail address: [email protected] (Y. Wang).
a b s t r a c t
Many regions are still threatened with frequent floods and water resource shortage problems in China.
Consequently, the task of reproducing and predicting the hydrological process in watersheds is hard and
unavoidable for reducing the risks of damage and loss. Thus, it is necessary to develop an efficient and cost-
effective hydrological tool in China as many areas should be modeled. Currently, developed hydrological
tools such as Mike SHE and ArcSWAT (soil and water assessment tool based on ArcGIS) show significant
power in improving the precision of hydrological modeling in China by considering spatial variability both
in land cover and in soil type. However, adopting developed commercial tools in such a large developing
country comes at a high cost. Commercial modeling tools usually contain large numbers of formulas,
complicated data formats, and many preprocessing or postprocessing steps that may make it difficult for
the user to carry out simulation, thus lowering the efficiency of the modeling process. Besides, commercial
hydrological models usually cannot be modified or improved to be suitable for some special hydrological
conditions in China. Some other hydrological models are open source, but integrated into commercial GIS
systems. Therefore, by integrating hydrological simulation code EasyDHM, a hydrological simulation tool
named MWEasyDHM was developed based on open-source MapWindow GIS, the purpose of which is to
establish the first open-source GIS-based distributed hydrological model tool in China by integrating
modules of preprocessing, model computation, parameter estimation, result display, and analysis.
MWEasyDHM provides users with a friendly manipulating MapWindow GIS interface, selectable multi-
functional hydrological processing modules, and, more importantly, an efficient and cost-effective
hydrological simulation tool. The general construction of MWEasyDHM consists of four major parts:
(1) a general GIS module for hydrological analysis, (2) a preprocessing module for modeling inputs, (3) a
model calibration module, and (4) a postprocessing module. The general GIS module for hydrological
analysis is developed on the basis of totally open-source GIS software, MapWindow, which contains basic
GIS functions. The preprocessing module is made up of three submodules including a DEM-based
submodule for hydrological analysis, a submodule for default parameter calculation, and a submodule
for the spatial interpolation of meteorological data. The calibration module contains parallel computation,
real-time computation, and visualization. The postprocessing module includes model calibration and model
results spatial visualization using tabular form and spatial grids. MWEasyDHM makes it possible for
efficient modeling and calibration of EasyDHM, and promises further development of cost-effective
applications in various watersheds.
& 2011 Elsevier Ltd. All rights reserved.
1. Current conditions and barriers of applications ondistributed hydrological model system in China
Many regions in China are still threatened with frequent floodsand water resource shortage problems. Consequently, it is helpfulto reproduce and predict the hydrological process in watersheds
ll rights reserved.
r Resources and Hydropower
for reducing the risk of damage and loss. However, it seems a highcost to adopt developed commercial tools in such a large devel-oping country. Thus, to develop an efficient and cost-effectivehydrological tool in China is necessary.
1.1. The development of distributed hydrological modeling systems
Since the appearance of the first hydrological model called theStanford Watershed Model, many similar models have beencreated and used in various applications around the world.Recently, attributed to the rapid development of computational
X. Lei et al. / Computers & Geosciences 37 (2011) 1476–1489 1477
technology, several successful applications of distributed hydro-logical models were developed such as SWAT (Shen et al., 2009;Romanowicz et al., 2005; Schuol et al., 2008). Except for a fewwidely used distributed hydrological models, many of thesemodels lack an integral software system for model building andcalibration (Viviroli et al., 2009). These traditional models insteadmanually adopt ways to achieve model building, computation,and calibration. Generally speaking, the steps can be summarizedas follows:
(1)
First, preprocessing all underlying hydrological, meteorologi-cal, and social–economic data with commercially developedGIS software like ArcView, ArcGIS, etc., or depending on someother software for the purpose of model building. The mainconcerned steps are probably the DEM extraction and burningwith surveyed river networks, slope calculations, flow direc-tion determinations, accumulation computations, digitalstream extractions, catchment delineations, etc. The processesof hydrological or meteorological data involve data interpola-tion temporally such as linear interpolation and spatiallyThiessen polygon (Croley and Hartmann, 1985) or kriginginterpolation (Kebaili Bargaoui and Chebbi, 2009).(2)
Then manually carrying out sensitivity analysis of the modelparameters and calibrating model parameters to find a globaloptimum in feasible parameter space. This process involvesquite complicated calculation procedures with many datatypes, each containing a large amount of information. Someglobal well-known models like SWAT may take advantage ofoptimization tools like SWATCUP (SWAT-CUP2 manual(SWAT-CUP2, 2008)) that can be adopted to enhance the modelcalibration. For others, Elias G. et al. (2007) present a diagnosticstudy on the multiobjective, automatic calibration of the SWATmodel. The calibration routine is developed using a NSGA-IIalgorithm (nondominated sorting genetic algorithm II). How-ever, some widely accepted models in China such as theXinanjiang (Ren-Jun, 1992) model may have been developedwithout integrating any autocalibration tools. As a result, onlysenior professionals who are very familiar with the modelstructure can smoothly finish the model building process andcarry out calibrations without optimization algorithms.(3)
Postprocessing of calculation results. Generally speaking, theresult presenting and analysis of hydrography can be obtainedusing mathematical tools (Matlab and Excel, etc.), which mayrequire additional effort.However, with the rapid development of spatial technology,especially GIS and RS, there are some quite well GIS integrateddistributed hydrological models, e.g., Mike SHE (Abbott et al.,1986) and SWAT (Neitsch et al., 2005). These models can greatlysimplify the modeling and calibration process, and enable users toreduce repetitive steps in establishing distributed hydrologicalmodels, upgrading the efficiency of modelers, and to reach anideal simulation precision (Hormann et al., 2009).
Hydrological models, which are integrated with GIS softwareproviding users with useful interfaces, can be categorized intothree classes: (1) distributed hydrological model systems basedon commercial GIS software, (2) open-source GIS software-baseddistributed hydrological model systems, and (3) distributedhydrological model systems independent of GIS software. Thesecategories will be described in more detail below.
(1)
Distributed hydrological model systems based on commercial GISsoftware: Well-known distributed hydrological models likeArcSWAT are developed on the commercial software ArcGIS(Schuol et al., 2008), that can provide good integration formodel building and greatly decrease the modeling difficulties
for users. The spatial data calculation of ArcGIS is quitereliable, however, usually not affordable for users especiallyfor small labs. In addition, commercial full-functional GISsoftware may require large disk space but actually notnecessary in hydrological modeling.Some other existing distributed hydrological models, forexample, ArcView SWAT and the preprocessing functions ofthe Wetspa model (water and energy transfer between soil,plants, and atmosphere model) developed at the University ofBrussels (Wang et al., 1997; Batelaan et al., 1996), have takenadvantage of ArcView GIS. ArcView GIS software, althoughproviding users with editable AVX (Arcview scripts) and notas complicated as ArcGIS, is a non-open source softwarewhich limits the capability of further development for hydro-logic models and still not cost-effective enough.
(2)
Distributed hydrological model systems based on open-sourceGIS software: In addition to commercial GIS software, thereare many widely spread open-source software systemsincluding GRASS (Castrogiovanni et al., 2005; McMichaelet al. (2006) (Geographic Resources Analysis Support System,2010)), MapWindow (Smakhtin and Eriyagama, 2008; Usingthe MapWindow ActiveX Control, 2008), QGIS (Quantum GISProject team, 2009), OpenJUMP (OpenJUMP GeographicInformation System, 2008), uDig (uDig GIS Framework forEclipse, 2009), and SharpMap (2009), that can be used indifferent operating systems (OS), including MS Windows,Unix, and Linux. In addition, they are developed in variouslanguages, i.e., Java, Cþþ, C#, VB.Net, etc.Different from commercial GIS software, open-source GISsoftware is popular among GIS tool developers due to itsopen-source, strong extensibility, and free to use (Corozaet al., 1997). At present, well-known distributed hydrologicalmodels developed based on open-source GIS software arelisted: (1) MWSWAT (George and Leon, 2008) and (2) BASINS4(BASIN4 Environmental Protection Angency, 2009). Thesemodels are developed on the basis of the open-source GISsoftware MapWindow. The main purpose of developing dis-tributed hydrological model systems based on open-source GISis to decrease the application cost of the model system, and toenable users to obtain the system without or at a lower cost.
(3)
Distributed hydrological model independent of any GIS software:Moreover, there are some distributed hydrological modelsindependent of any GIS software, which have their ownprofessional GIS modules well integrated into their softwaresystems such as HEC-HMS (William et al., 2010), Mike SHE(Abbott et al., 1986), and JAMS (Kralisch and Krause, 2006).Models with independent GIS software have the ability tofully integrate with hydrological models and can achievemore specialized operations in modeling. However, thesemodel systems usually could only provide relatively simpleGIS functionality and high developing cost.(4)
Comparison between different model systems: The three kindsof distributed hydrological model systems noted above havetheir own advantages and disadvantages, respectively, as listedin Table 1. Commercial GIS software-based hydrological modelsare usually quite powerful and have adopted some efficienthydrological analysis algorithms. Thus it can be relatively easyto develop new software modules on the basis of this GISsoftware through the dynamic link library (DLL). However, highsoftware costs restrict the further application of this modelingsystem to some extent, especially in developing countries. Thegreatest advantage of open-source GIS software is that it is freeof charge and draws on a large code-sharing community.In some circumstances, commercial GIS software is morepowerful than open-source GIS and enjoys continually functional
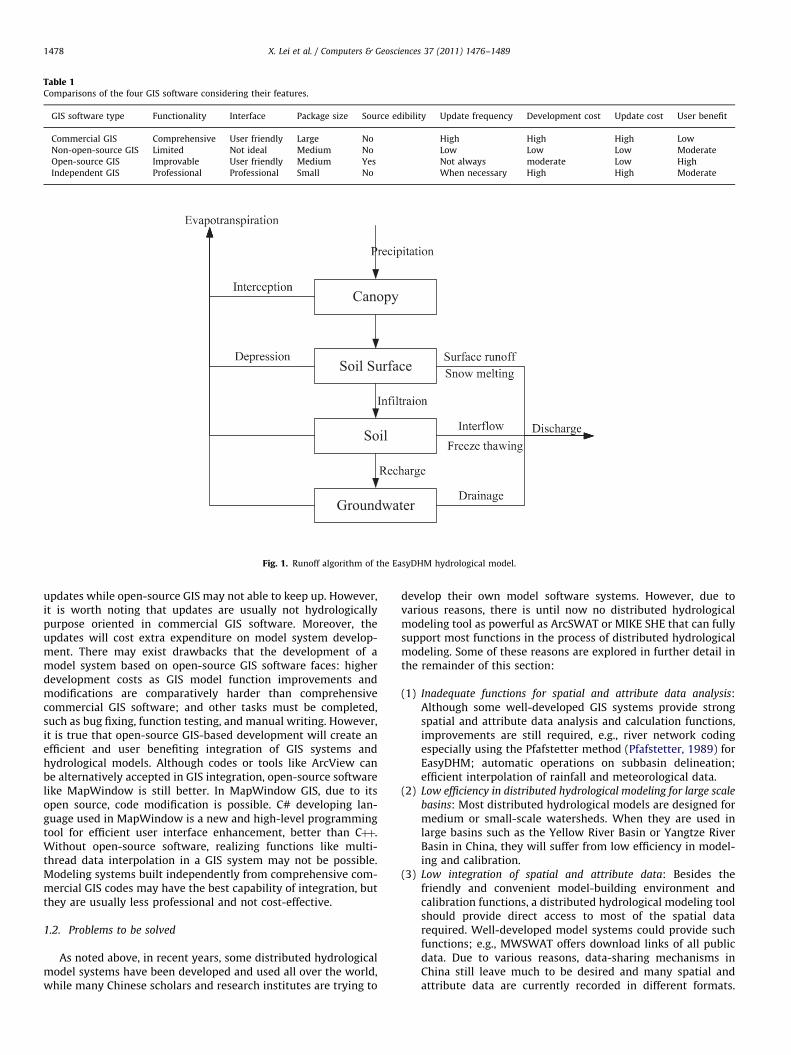
Fig. 1. Runoff algorithm of the EasyDHM hydrological model.
Table 1Comparisons of the four GIS software considering their features.
GIS software type Functionality Interface Package size Source edibility Update frequency Development cost Update cost User benefit
Commercial GIS Comprehensive User friendly Large No High High High Low
Non-open-source GIS Limited Not ideal Medium No Low Low Low Moderate
Open-source GIS Improvable User friendly Medium Yes Not always moderate Low High
Independent GIS Professional Professional Small No When necessary High High Moderate
X. Lei et al. / Computers & Geosciences 37 (2011) 1476–14891478
updates while open-source GIS may not able to keep up. However,it is worth noting that updates are usually not hydrologicallypurpose oriented in commercial GIS software. Moreover, theupdates will cost extra expenditure on model system develop-ment. There may exist drawbacks that the development of amodel system based on open-source GIS software faces: higherdevelopment costs as GIS model function improvements andmodifications are comparatively harder than comprehensivecommercial GIS software; and other tasks must be completed,such as bug fixing, function testing, and manual writing. However,it is true that open-source GIS-based development will create anefficient and user benefiting integration of GIS systems andhydrological models. Although codes or tools like ArcView canbe alternatively accepted in GIS integration, open-source softwarelike MapWindow is still better. In MapWindow GIS, due to itsopen source, code modification is possible. C# developing lan-guage used in MapWindow is a new and high-level programmingtool for efficient user interface enhancement, better than Cþþ.Without open-source software, realizing functions like multi-thread data interpolation in a GIS system may not be possible.Modeling systems built independently from comprehensive com-mercial GIS codes may have the best capability of integration, butthey are usually less professional and not cost-effective.
1.2. Problems to be solved
As noted above, in recent years, some distributed hydrologicalmodel systems have been developed and used all over the world,while many Chinese scholars and research institutes are trying to
develop their own model software systems. However, due tovarious reasons, there is until now no distributed hydrologicalmodeling tool as powerful as ArcSWAT or MIKE SHE that can fullysupport most functions in the process of distributed hydrologicalmodeling. Some of these reasons are explored in further detail inthe remainder of this section:
(1)
Inadequate functions for spatial and attribute data analysis:Although some well-developed GIS systems provide strongspatial and attribute data analysis and calculation functions,improvements are still required, e.g., river network codingespecially using the Pfafstetter method (Pfafstetter, 1989) forEasyDHM; automatic operations on subbasin delineation;efficient interpolation of rainfall and meteorological data.(2)
Low efficiency in distributed hydrological modeling for large scalebasins: Most distributed hydrological models are designed formedium or small-scale watersheds. When they are used inlarge basins such as the Yellow River Basin or Yangtze RiverBasin in China, they will suffer from low efficiency in model-ing and calibration.
(3)
Low integration of spatial and attribute data: Besides thefriendly and convenient model-building environment andcalibration functions, a distributed hydrological modeling toolshould provide direct access to most of the spatial datarequired. Well-developed model systems could provide suchfunctions; e.g., MWSWAT offers download links of all publicdata. Due to various reasons, data-sharing mechanisms inChina still leave much to be desired and many spatial andattribute data are currently recorded in different formats.
X. Lei et al. / Computers & Geosciences 37 (2011) 1476–1489 1479
It would be a long-term and difficult mission to integrate thespatial and attribute data of the whole of China required bydistributed hydrological modeling in MWEasyDHM.
2. Structure of MWEasyDHM system
EasyDHM (Lei and Yu, 2009; Lei et al., 2009, 2010) is featured ascontaining easy rain-runoff generation processes and comprehen-sive preprocess and postprocess modules. As depicted in Fig. 1, therain-runoff mechanism includes 5 main steps: interception, evapo-transpiration, depression storage, infiltration, and ground water
DEM based General
PreprocessingModule
Model compuModule
hydrological analysis
Open-source GIS M
Parameter estimation on runoff generation
Parameter estimation on runoff confluence
Algorithms andhydrological a
General GIS sohydrological
Grid / vector data ma
Real-time cal
Parallel comp
Metrological data intepolation
Fig. 2. System structure of th
Fig. 3. Main functional menu of
recharge. Since the model system of the distributed hydrologicalmodel EasyDHM is developed taking advantage of open-source GISsoftware MapWindow, we name this modeling system as MWEa-syDHM (MapWindow-based easy distributed hydrological modelingtool), the system structure of which is shown in Fig. 2.
The MWEasyDHM modeling tool mainly consists of fourstructural parts: (1) general GIS software for hydrological analy-sis; (2) preprocessing module; (3) computational module; and(4) postprocessing module. MWEasyDHM contains many func-tions, which are involved in many algorithms and procedures.These functions are encapsulated into different modules. Besides,considering the language model developers used, the whole
ation Post-processingModule
apwindow
tools for nalysis
ftware for analysis
nagement tool
LH-OAT Global sensitivity analysis
Single/Multi-objective optimization
GLUE uncertainty analysis
culation
utation
C++
C#
VB.Net
Fortran
Octave
...
Result display
e MWEasyDHM system.
the MWEasyDHM system.
X. Lei et al. / Computers & Geosciences 37 (2011) 1476–14891480
platform will be organized as an integration of all functionalcomponents and algorithms, and the development languages ofMWEasyDHM tool includes Cþþ, C#, VB.Net (programming lan-guages suitable for interface development), and Fortran (a com-putational efficient language for scientific research). The mainfunction menu of MWEasyDHM system is displayed in Fig. 3.
3. Main hydrological function of MWEasyDHM system
3.1. General GIS software for hydrological analysis
General GIS software for hydrological analysis is a mostimportant part of MWEasyDHM, which includes not only suchfunctions as GIS spatial display, table query, and data manage-ment, but also spatial analysis, data format conversion, andprojection functions required during the processing of distributedhydrological modeling.
Some new functions can be obtained by add-on functionsduring the development and reconstruction of MapWindow,listed as follows:
(1)
Since original conversion algorithms of vector and grid dataare only capable of dealing with simple objects (such assimple river networks), these algorithms are improved forvarious complex objects (complicated river networks withmultioutlets).(2)
Improve efficiency of grid data loading and outputting. Thespatial data are read and stored in the format of grids andshape files, making it easier to conduct spatial calculation andconversion between different data format.(3)
The original version of add-on functions was developed inEnglish. Much effort has been made to convert these modulesinto Chinese, thus enhancing the tool to favorably support aChinese system environment.3.2. Preprocessing module
Preprocessing module is the most complicated part inthe hydrological modeling process, including: (1) the generalhydrological analysis submodule based on DEM, containing cal-culations of flow direction, flow accumulation, flow length, slope,
DEM reconditioningGrid mask
Projection DEM Filling pits
Flow direction
Flow Accumulation
Raster/vectorconversion
Stream Link calculation
Stream Order calculation
Grid algebra
Stream Network generation
1. Spatial datacalculation
2. DEM based hyd
... ...
Fig. 4. Main functions of general hydrological ana
digital river networks extraction, etc.; (2) calculation of variousrunoff generation parameters, including parameters related to soilphysical properties and parameters related to land cover andterrain; (3) calculation of various confluence parameters, includ-ing parameters related to unit characteristics and channel char-acteristics; (4) spatial interpolation of meteorological data,including several kinds of spatial interpolation algorithms. Duringthe development of MWEasyDHM, difficulties in the process ofdistributed hydrological modeling (e.g., large number sets of dataconcerned, complicated algorithms, and numerous calculationsteps) were classified and summarized, and the simplification ofdistributed hydrological modeling procedures was achieved bydesigning new algorithms or integrating external algorithms.
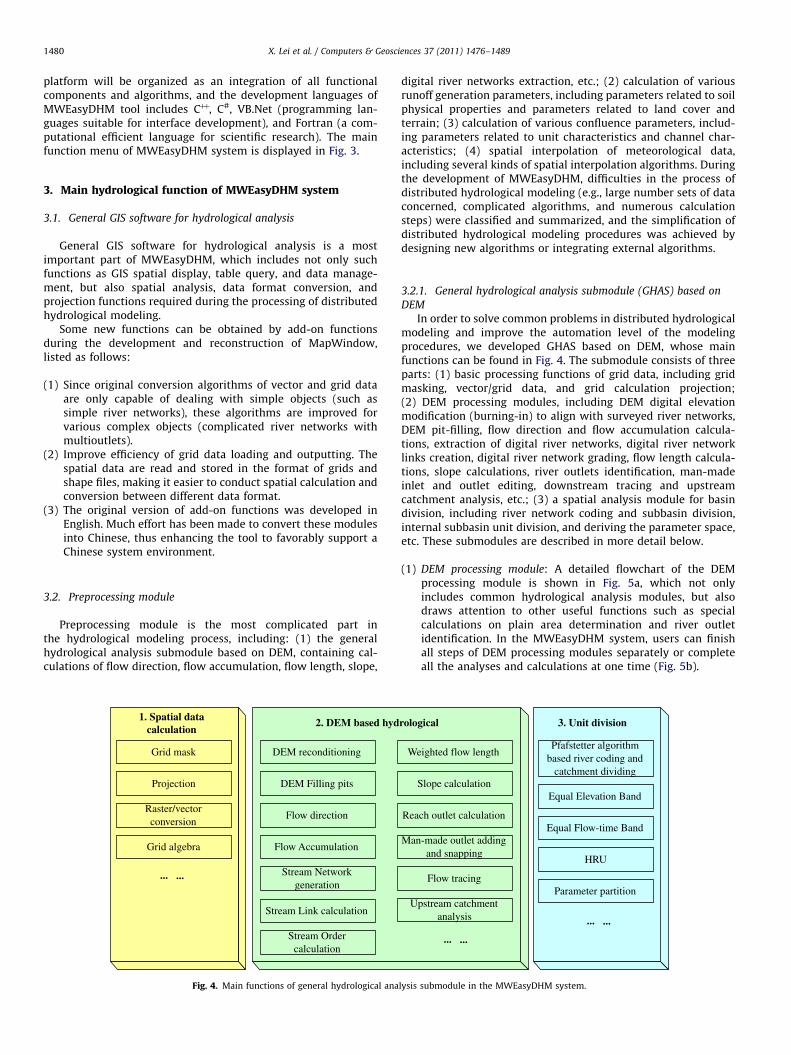
3.2.1. General hydrological analysis submodule (GHAS) based on
DEM
In order to solve common problems in distributed hydrologicalmodeling and improve the automation level of the modelingprocedures, we developed GHAS based on DEM, whose mainfunctions can be found in Fig. 4. The submodule consists of threeparts: (1) basic processing functions of grid data, including gridmasking, vector/grid data, and grid calculation projection;(2) DEM processing modules, including DEM digital elevationmodification (burning-in) to align with surveyed river networks,DEM pit-filling, flow direction and flow accumulation calcula-tions, extraction of digital river networks, digital river networklinks creation, digital river network grading, flow length calcula-tions, slope calculations, river outlets identification, man-madeinlet and outlet editing, downstream tracing and upstreamcatchment analysis, etc.; (3) a spatial analysis module for basindivision, including river network coding and subbasin division,internal subbasin unit division, and deriving the parameter space,etc. These submodules are described in more detail below.
(1)
We
S
Rea
Man
U
rolog
lysis
DEM processing module: A detailed flowchart of the DEMprocessing module is shown in Fig. 5a, which not onlyincludes common hydrological analysis modules, but alsodraws attention to other useful functions such as specialcalculations on plain area determination and river outletidentification. In the MWEasyDHM system, users can finishall steps of DEM processing modules separately or completeall the analyses and calculations at one time (Fig. 5b).
ighted flow length
lope calculation
ch outlet calculation
-made outlet adding and snapping
Pfafstetter algorithm based river coding and
catchment dividing
Equal Elevation Band
Equal Flow-time Band
HRU
Parameter partitionFlow tracing
pstream catchment analysis
ical 3. Unit division
... ...
... ...
submodule in the MWEasyDHM system.
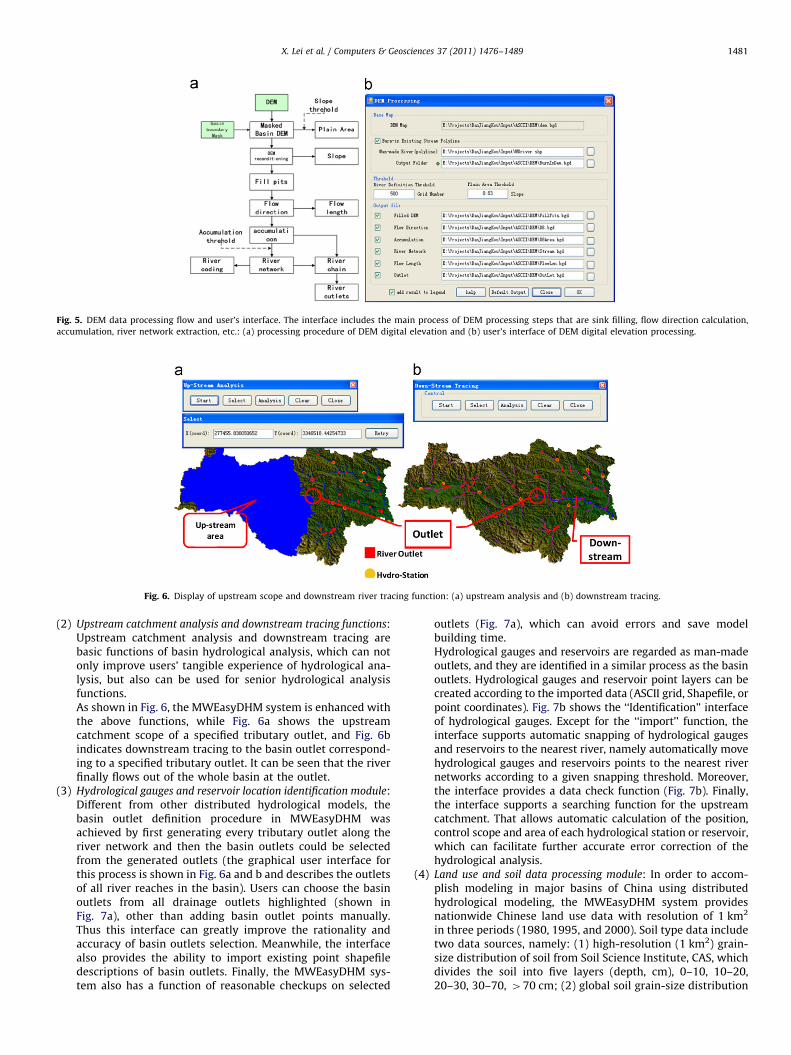
Fig. 5. DEM data processing flow and user’s interface. The interface includes the main process of DEM processing steps that are sink filling, flow direction calculation,
accumulation, river network extraction, etc.: (a) processing procedure of DEM digital elevation and (b) user’s interface of DEM digital elevation processing.
Fig. 6. Display of upstream scope and downstream river tracing function: (a) upstream analysis and (b) downstream tracing.
X. Lei et al. / Computers & Geosciences 37 (2011) 1476–1489 1481
(2)
Upstream catchment analysis and downstream tracing functions:Upstream catchment analysis and downstream tracing arebasic functions of basin hydrological analysis, which can notonly improve users’ tangible experience of hydrological ana-lysis, but also can be used for senior hydrological analysisfunctions.As shown in Fig. 6, the MWEasyDHM system is enhanced withthe above functions, while Fig. 6a shows the upstreamcatchment scope of a specified tributary outlet, and Fig. 6bindicates downstream tracing to the basin outlet correspond-ing to a specified tributary outlet. It can be seen that the riverfinally flows out of the whole basin at the outlet.(3)
Hydrological gauges and reservoir location identification module:Different from other distributed hydrological models, thebasin outlet definition procedure in MWEasyDHM wasachieved by first generating every tributary outlet along theriver network and then the basin outlets could be selectedfrom the generated outlets (the graphical user interface forthis process is shown in Fig. 6a and b and describes the outletsof all river reaches in the basin). Users can choose the basinoutlets from all drainage outlets highlighted (shown inFig. 7a), other than adding basin outlet points manually.Thus this interface can greatly improve the rationality andaccuracy of basin outlets selection. Meanwhile, the interfacealso provides the ability to import existing point shapefiledescriptions of basin outlets. Finally, the MWEasyDHM sys-tem also has a function of reasonable checkups on selectedoutlets (Fig. 7a), which can avoid errors and save modelbuilding time.Hydrological gauges and reservoirs are regarded as man-madeoutlets, and they are identified in a similar process as the basinoutlets. Hydrological gauges and reservoir point layers can becreated according to the imported data (ASCII grid, Shapefile, orpoint coordinates). Fig. 7b shows the ‘‘Identification’’ interfaceof hydrological gauges. Except for the ‘‘import’’ function, theinterface supports automatic snapping of hydrological gaugesand reservoirs to the nearest river, namely automatically movehydrological gauges and reservoirs points to the nearest rivernetworks according to a given snapping threshold. Moreover,the interface provides a data check function (Fig. 7b). Finally,the interface supports a searching function for the upstreamcatchment. That allows automatic calculation of the position,control scope and area of each hydrological station or reservoir,which can facilitate further accurate error correction of thehydrological analysis.
(4)
Land use and soil data processing module: In order to accom-plish modeling in major basins of China using distributedhydrological modeling, the MWEasyDHM system providesnationwide Chinese land use data with resolution of 1 km2in three periods (1980, 1995, and 2000). Soil type data includetwo data sources, namely: (1) high-resolution (1 km2) grain-size distribution of soil from Soil Science Institute, CAS, whichdivides the soil into five layers (depth, cm), 0–10, 10–20,20–30, 30–70, 470 cm; (2) global soil grain-size distribution
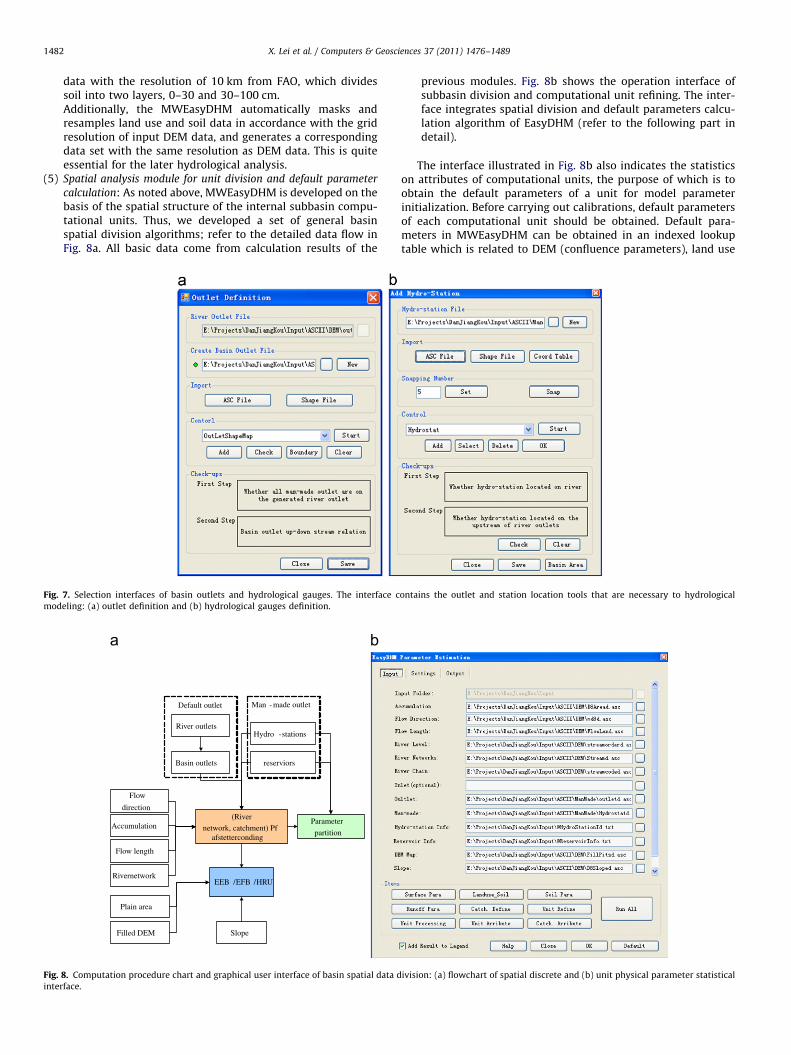
Fig.inter
Fig.mod
X. Lei et al. / Computers & Geosciences 37 (2011) 1476–14891482
data with the resolution of 10 km from FAO, which dividessoil into two layers, 0–30 and 30–100 cm.Additionally, the MWEasyDHM automatically masks andresamples land use and soil data in accordance with the gridresolution of input DEM data, and generates a correspondingdata set with the same resolution as DEM data. This is quiteessential for the later hydrological analysis.
(5)
Spatial analysis module for unit division and default parametercalculation: As noted above, MWEasyDHM is developed on thebasis of the spatial structure of the internal subbasin compu-tational units. Thus, we developed a set of general basinspatial division algorithms; refer to the detailed data flow inFig. 8a. All basic data come from calculation results of the
Flow
direction
Accumulation
Rivernetwork
Slope
Flow length
River outlets
Plain area
Filled DEM
(River
network, catchment) Pfafstetterconding
EEB /EFB /HRU
Basin outlets
Hydro -stations
reserviors
Parameter
partition
Default outlet Man - made outlet
8. Computation procedure chart and graphical user interface of basin spatial data divisi
face.
7. Selection interfaces of basin outlets and hydrological gauges. The interface conta
eling: (a) outlet definition and (b) hydrological gauges definition.
previous modules. Fig. 8b shows the operation interface ofsubbasin division and computational unit refining. The inter-face integrates spatial division and default parameters calcu-lation algorithm of EasyDHM (refer to the following part indetail).
The interface illustrated in Fig. 8b also indicates the statisticson attributes of computational units, the purpose of which is toobtain the default parameters of a unit for model parameterinitialization. Before carrying out calibrations, default parametersof each computational unit should be obtained. Default para-meters in MWEasyDHM can be obtained in an indexed lookuptable which is related to DEM (confluence parameters), land use
on: (a) flowchart of spatial discrete and (b) unit physical parameter statistical
ins the outlet and station location tools that are necessary to hydrological
X. Lei et al. / Computers & Geosciences 37 (2011) 1476–1489 1483
(root depth, interception capacity, etc.), and soil type (conductivity,porosity, field capacity, etc.). In a catchment scale unit considered inMWEasyDHM, spatial statistics should be completed to obtain thedefault parameter of a catchment.
The module is called ‘‘general’’ in that its functions are applic-able to most distributed hydrological models. Such functions asDEM processing module, upstream and downstream tracing, man-made points and outlets identification, land use, or soil datapreprocessing are commonly used in all kinds of distributedhydrological models, regardless of whether they are based on agrid or the subunit scale. The function of the basin spatial divisionmodule is applicable to most distributed hydrological models thattake subbasins or other units (such as HRU) as the calculation unit.
3.2.2. Default model parameter calculation
One key characteristic and advantage of distributed hydro-logical models is that parameters have physical meanings and canbe calculated directly from underlying data. For this reason, thedistributed hydrological model has the capability of being appliedin ungauged basins.
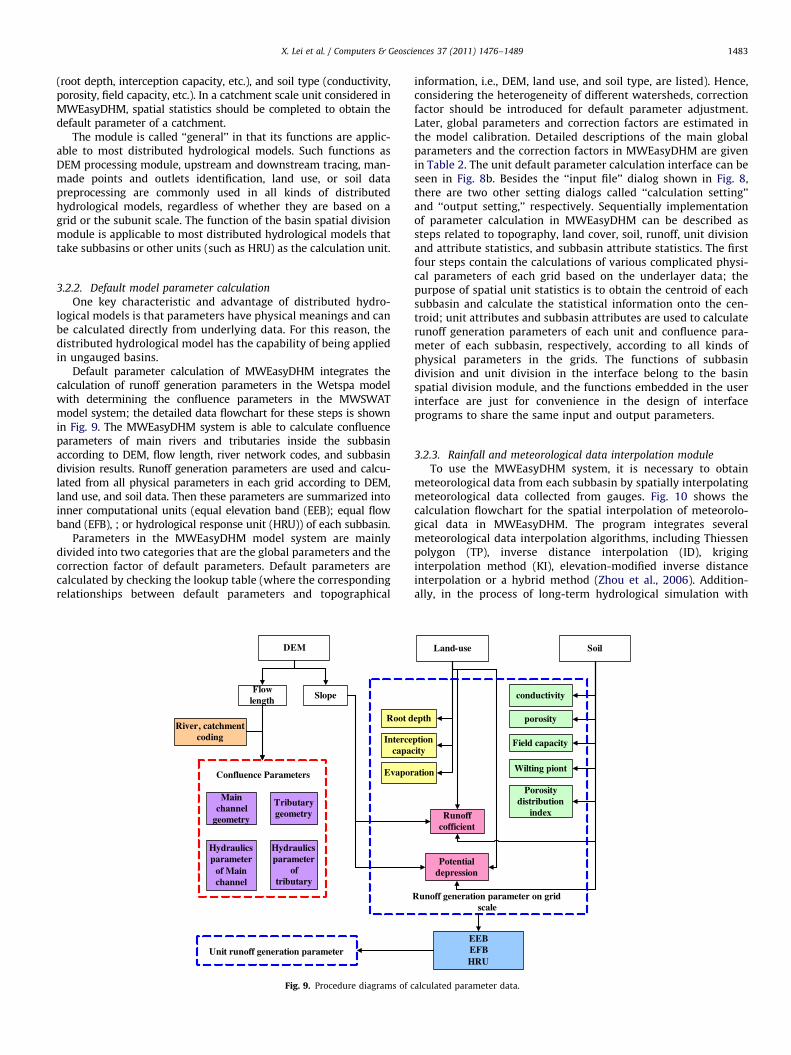
Default parameter calculation of MWEasyDHM integrates thecalculation of runoff generation parameters in the Wetspa modelwith determining the confluence parameters in the MWSWATmodel system; the detailed data flowchart for these steps is shownin Fig. 9. The MWEasyDHM system is able to calculate confluenceparameters of main rivers and tributaries inside the subbasinaccording to DEM, flow length, river network codes, and subbasindivision results. Runoff generation parameters are used and calcu-lated from all physical parameters in each grid according to DEM,land use, and soil data. Then these parameters are summarized intoinner computational units (equal elevation band (EEB); equal flowband (EFB), ; or hydrological response unit (HRU)) of each subbasin.
Parameters in the MWEasyDHM model system are mainlydivided into two categories that are the global parameters and thecorrection factor of default parameters. Default parameters arecalculated by checking the lookup table (where the correspondingrelationships between default parameters and topographical
DEM
Flow length
River, catchment coding
Slope
Main channel
geometry
Root d
Intercecapa
Evapor
Tributary geometry
Confluence Parameters
Hydraulics parameter
of Main channel
Hydraulics parameter
of tributary
Unit runoff generation parameter
Fig. 9. Procedure diagrams of c
information, i.e., DEM, land use, and soil type, are listed). Hence,considering the heterogeneity of different watersheds, correctionfactor should be introduced for default parameter adjustment.Later, global parameters and correction factors are estimated inthe model calibration. Detailed descriptions of the main globalparameters and the correction factors in MWEasyDHM are givenin Table 2. The unit default parameter calculation interface can beseen in Fig. 8b. Besides the ‘‘input file’’ dialog shown in Fig. 8,there are two other setting dialogs called ‘‘calculation setting’’and ‘‘output setting,’’ respectively. Sequentially implementationof parameter calculation in MWEasyDHM can be described assteps related to topography, land cover, soil, runoff, unit divisionand attribute statistics, and subbasin attribute statistics. The firstfour steps contain the calculations of various complicated physi-cal parameters of each grid based on the underlayer data; thepurpose of spatial unit statistics is to obtain the centroid of eachsubbasin and calculate the statistical information onto the cen-troid; unit attributes and subbasin attributes are used to calculaterunoff generation parameters of each unit and confluence para-meter of each subbasin, respectively, according to all kinds ofphysical parameters in the grids. The functions of subbasindivision and unit division in the interface belong to the basinspatial division module, and the functions embedded in the userinterface are just for convenience in the design of interfaceprograms to share the same input and output parameters.
3.2.3. Rainfall and meteorological data interpolation module
To use the MWEasyDHM system, it is necessary to obtainmeteorological data from each subbasin by spatially interpolatingmeteorological data collected from gauges. Fig. 10 shows thecalculation flowchart for the spatial interpolation of meteorolo-gical data in MWEasyDHM. The program integrates severalmeteorological data interpolation algorithms, including Thiessenpolygon (TP), inverse distance interpolation (ID), kriginginterpolation method (KI), elevation-modified inverse distanceinterpolation or a hybrid method (Zhou et al., 2006). Addition-ally, in the process of long-term hydrological simulation with
Land-use Soil
epth
ption city
ation
Runoff cofficient
Potential depression
conductivity
porosity
Field capacity
Wilting piont
Porosity distribution
index
Runoff generation parameter on grid scale
EEBEFBHRU
alculated parameter data.
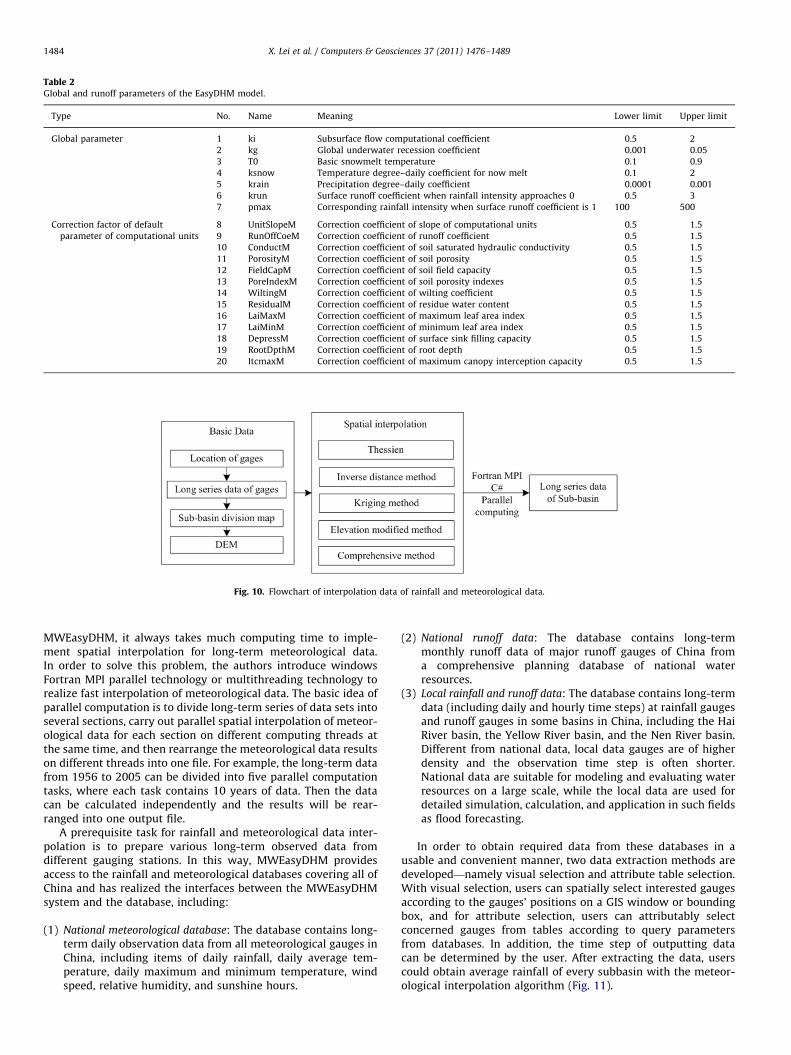
Fig. 10. Flowchart of interpolation data of rainfall and meteorological data.
Table 2Global and runoff parameters of the EasyDHM model.
Type No. Name Meaning Lower limit Upper limit
Global parameter 1 ki Subsurface flow computational coefficient 0.5 2
2 kg Global underwater recession coefficient 0.001 0.05
3 T0 Basic snowmelt temperature 0.1 0.9
4 ksnow Temperature degree–daily coefficient for now melt 0.1 2
5 krain Precipitation degree–daily coefficient 0.0001 0.001
6 krun Surface runoff coefficient when rainfall intensity approaches 0 0.5 3
7 pmax Corresponding rainfall intensity when surface runoff coefficient is 1 100 500
Correction factor of default
parameter of computational units
8 UnitSlopeM Correction coefficient of slope of computational units 0.5 1.5
9 RunOffCoeM Correction coefficient of runoff coefficient 0.5 1.5
10 ConductM Correction coefficient of soil saturated hydraulic conductivity 0.5 1.5
11 PorosityM Correction coefficient of soil porosity 0.5 1.5
12 FieldCapM Correction coefficient of soil field capacity 0.5 1.5
13 PoreIndexM Correction coefficient of soil porosity indexes 0.5 1.5
14 WiltingM Correction coefficient of wilting coefficient 0.5 1.5
15 ResidualM Correction coefficient of residue water content 0.5 1.5
16 LaiMaxM Correction coefficient of maximum leaf area index 0.5 1.5
17 LaiMinM Correction coefficient of minimum leaf area index 0.5 1.5
18 DepressM Correction coefficient of surface sink filling capacity 0.5 1.5
19 RootDpthM Correction coefficient of root depth 0.5 1.5
20 ItcmaxM Correction coefficient of maximum canopy interception capacity 0.5 1.5
X. Lei et al. / Computers & Geosciences 37 (2011) 1476–14891484
MWEasyDHM, it always takes much computing time to imple-ment spatial interpolation for long-term meteorological data.In order to solve this problem, the authors introduce windowsFortran MPI parallel technology or multithreading technology torealize fast interpolation of meteorological data. The basic idea ofparallel computation is to divide long-term series of data sets intoseveral sections, carry out parallel spatial interpolation of meteor-ological data for each section on different computing threads atthe same time, and then rearrange the meteorological data resultson different threads into one file. For example, the long-term datafrom 1956 to 2005 can be divided into five parallel computationtasks, where each task contains 10 years of data. Then the datacan be calculated independently and the results will be rear-ranged into one output file.
A prerequisite task for rainfall and meteorological data inter-polation is to prepare various long-term observed data fromdifferent gauging stations. In this way, MWEasyDHM providesaccess to the rainfall and meteorological databases covering all ofChina and has realized the interfaces between the MWEasyDHMsystem and the database, including:
(1)
National meteorological database: The database contains long-term daily observation data from all meteorological gauges inChina, including items of daily rainfall, daily average tem-perature, daily maximum and minimum temperature, windspeed, relative humidity, and sunshine hours.(2)
National runoff data: The database contains long-termmonthly runoff data of major runoff gauges of China froma comprehensive planning database of national waterresources.(3)
Local rainfall and runoff data: The database contains long-termdata (including daily and hourly time steps) at rainfall gaugesand runoff gauges in some basins in China, including the HaiRiver basin, the Yellow River basin, and the Nen River basin.Different from national data, local data gauges are of higherdensity and the observation time step is often shorter.National data are suitable for modeling and evaluating waterresources on a large scale, while the local data are used fordetailed simulation, calculation, and application in such fieldsas flood forecasting.In order to obtain required data from these databases in ausable and convenient manner, two data extraction methods aredeveloped—namely visual selection and attribute table selection.With visual selection, users can spatially select interested gaugesaccording to the gauges’ positions on a GIS window or boundingbox, and for attribute selection, users can attributably selectconcerned gauges from tables according to query parametersfrom databases. In addition, the time step of outputting datacan be determined by the user. After extracting the data, userscould obtain average rainfall of every subbasin with the meteor-ological interpolation algorithm (Fig. 11).
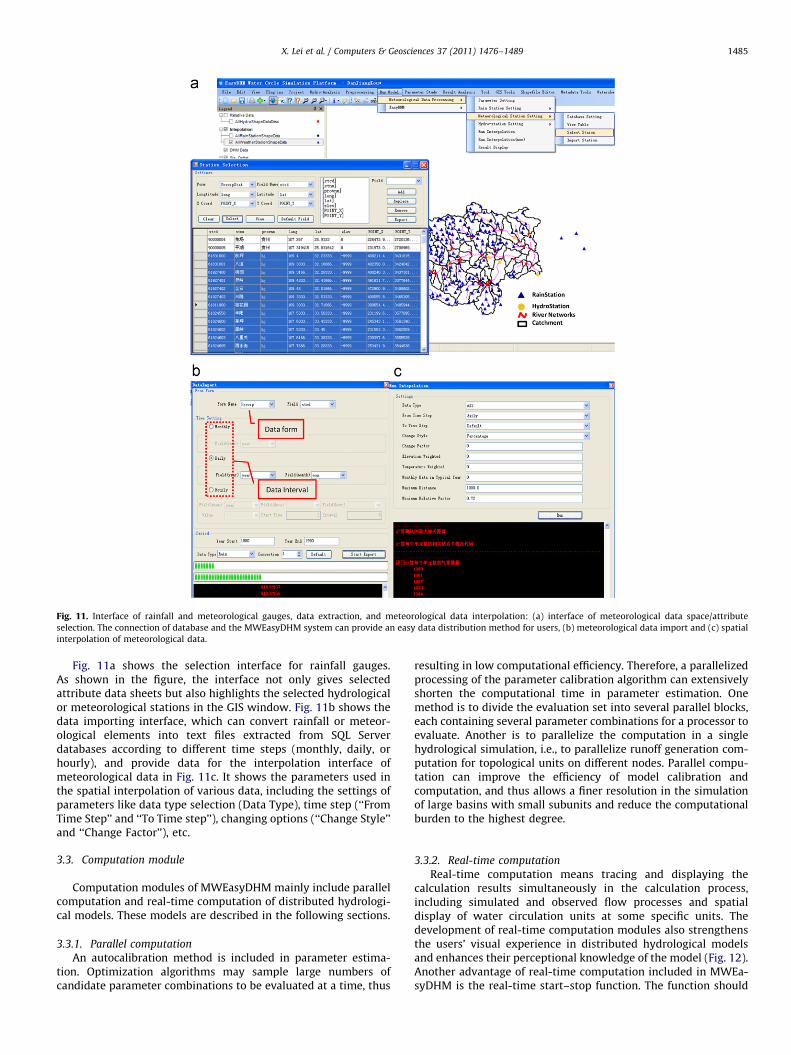
Fig. 11. Interface of rainfall and meteorological gauges, data extraction, and meteorological data interpolation: (a) interface of meteorological data space/attribute
selection. The connection of database and the MWEasyDHM system can provide an easy data distribution method for users, (b) meteorological data import and (c) spatial
interpolation of meteorological data.
X. Lei et al. / Computers & Geosciences 37 (2011) 1476–1489 1485
Fig. 11a shows the selection interface for rainfall gauges.As shown in the figure, the interface not only gives selectedattribute data sheets but also highlights the selected hydrologicalor meteorological stations in the GIS window. Fig. 11b shows thedata importing interface, which can convert rainfall or meteor-ological elements into text files extracted from SQL Serverdatabases according to different time steps (monthly, daily, orhourly), and provide data for the interpolation interface ofmeteorological data in Fig. 11c. It shows the parameters used inthe spatial interpolation of various data, including the settings ofparameters like data type selection (Data Type), time step (‘‘FromTime Step’’ and ‘‘To Time step’’), changing options (‘‘Change Style’’and ‘‘Change Factor’’), etc.
3.3. Computation module
Computation modules of MWEasyDHM mainly include parallelcomputation and real-time computation of distributed hydrologi-cal models. These models are described in the following sections.
3.3.1. Parallel computation
An autocalibration method is included in parameter estima-tion. Optimization algorithms may sample large numbers ofcandidate parameter combinations to be evaluated at a time, thus
resulting in low computational efficiency. Therefore, a parallelizedprocessing of the parameter calibration algorithm can extensivelyshorten the computational time in parameter estimation. Onemethod is to divide the evaluation set into several parallel blocks,each containing several parameter combinations for a processor toevaluate. Another is to parallelize the computation in a singlehydrological simulation, i.e., to parallelize runoff generation com-putation for topological units on different nodes. Parallel compu-tation can improve the efficiency of model calibration andcomputation, and thus allows a finer resolution in the simulationof large basins with small subunits and reduce the computationalburden to the highest degree.
3.3.2. Real-time computation
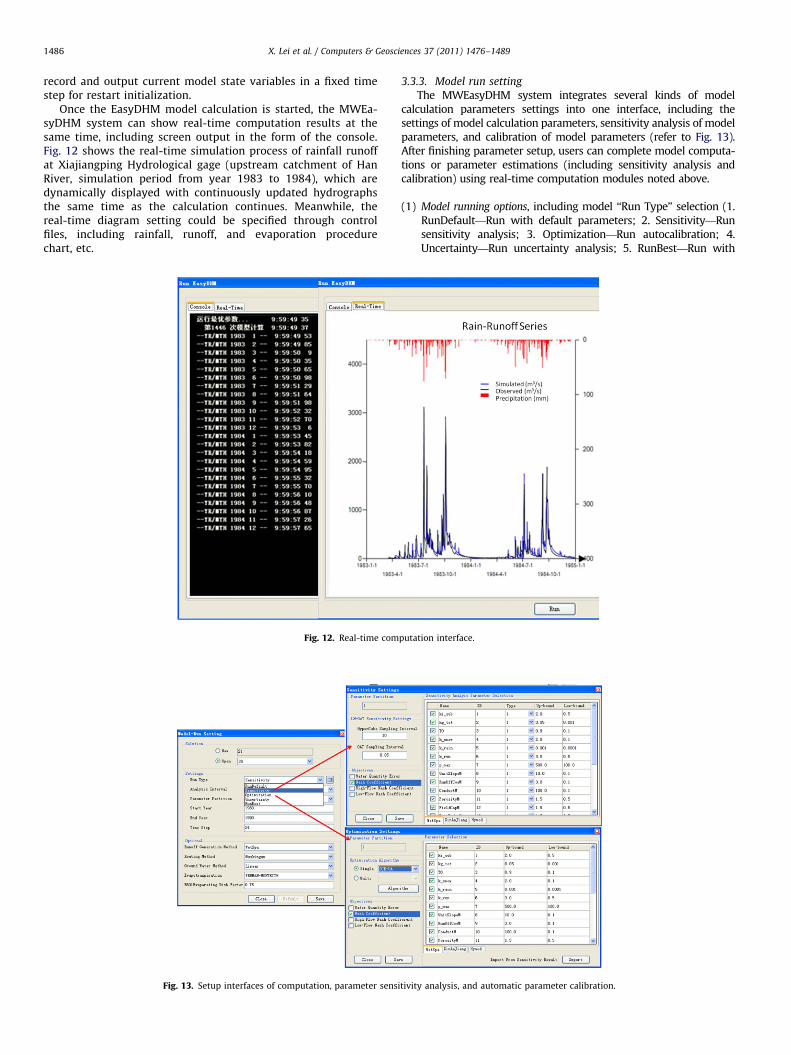
Real-time computation means tracing and displaying thecalculation results simultaneously in the calculation process,including simulated and observed flow processes and spatialdisplay of water circulation units at some specific units. Thedevelopment of real-time computation modules also strengthensthe users’ visual experience in distributed hydrological modelsand enhances their perceptional knowledge of the model (Fig. 12).Another advantage of real-time computation included in MWEa-syDHM is the real-time start–stop function. The function should
X. Lei et al. / Computers & Geosciences 37 (2011) 1476–14891486
record and output current model state variables in a fixed timestep for restart initialization.
Once the EasyDHM model calculation is started, the MWEa-syDHM system can show real-time computation results at thesame time, including screen output in the form of the console.Fig. 12 shows the real-time simulation process of rainfall runoffat Xiajiangping Hydrological gage (upstream catchment of HanRiver, simulation period from year 1983 to 1984), which aredynamically displayed with continuously updated hydrographsthe same time as the calculation continues. Meanwhile, thereal-time diagram setting could be specified through controlfiles, including rainfall, runoff, and evaporation procedurechart, etc.
Fig. 12. Real-time com
Fig. 13. Setup interfaces of computation, parameter sensi
3.3.3. Model run setting
The MWEasyDHM system integrates several kinds of modelcalculation parameters settings into one interface, including thesettings of model calculation parameters, sensitivity analysis of modelparameters, and calibration of model parameters (refer to Fig. 13).After finishing parameter setup, users can complete model computa-tions or parameter estimations (including sensitivity analysis andcalibration) using real-time computation modules noted above.
(1)
putat
tivity
Model running options, including model ‘‘Run Type’’ selection (1.RunDefault—Run with default parameters; 2. Sensitivity—Runsensitivity analysis; 3. Optimization—Run autocalibration; 4.Uncertainty—Run uncertainty analysis; 5. RunBest—Run with
ion interface.
analysis, and automatic parameter calibration.
X. Lei et al. / Computers & Geosciences 37 (2011) 1476–1489 1487
best calibrated parameters), ‘‘Parameter Partition’’ selection,‘‘Start Year’’, ‘‘End Year,’’ and ‘‘Time Step’’ setting.
(2)
Optional parameters, including runoff generating method(1. Wetspa model; 2. Xinanjiang model; 3. Hymod Model),routing method (1. Muskingum method; 2. Variable storagemethod; 3. Manning routing method), groundwater simulationalgorithm (1. linear reservoir; 2. nonlinear reservoir), evapo-transpiration algorithm (1. Priestley–Taylor; 2. Penman–Monteith; 3. Hargreaves; 4. Use observation), and evaporationpan (E601) coefficient.MWEasyDHM will select different simulation options in termsof selectable parameters and carry out computations, with defaultparameters by choosing ‘‘RunDefault’’ or with optimal parametersby choosing ‘‘Run BestPar.’’ When the ‘‘Run-type’’ is set to‘‘Sensitivity’’ or ‘‘Calibration’’, MWEasyDHM will carry out corre-sponding parameter sensitivity analysis and autocalibrationwithin the chosen time period.
3.4. Postprocessing module
Postprocessing modules include LH-OAT global sensitivityanalysis, single or multiobjective parameter calibration, spatialdisplay, and statistical analysis of model results.
3.4.1. Parameter estimation module
The development of automatic parameter estimation modulesallows the user to avoid the tedious manual model calibration,and improves the stability and reliability of parameter estimation,which can make the process more efficient. In Fig. 13, theparameter estimation of MWEasyDHM can be set. Once ‘‘Sensi-tivity’’ is chosen, a dialog box of ’’Sensitivity Analysis’’ will pop up,from which evaluation objectives and sampling parameters canbe set. Similarly, when ‘‘Optimization’’ is chosen, the dialog box ofparameter optimization setup will pop up, from which corre-sponding optimization methods (single/multiobjectives) can bechosen and users can choose the parameters and optimizationobjectives corresponding to the selected optimization method. Asnoted above, MWEasyDHM mainly adopts the LH-OAT globalparameter sensitivity analysis method and the SCE-UA globalautomatic parameter calibration method to realize automaticestimation of model parameters.
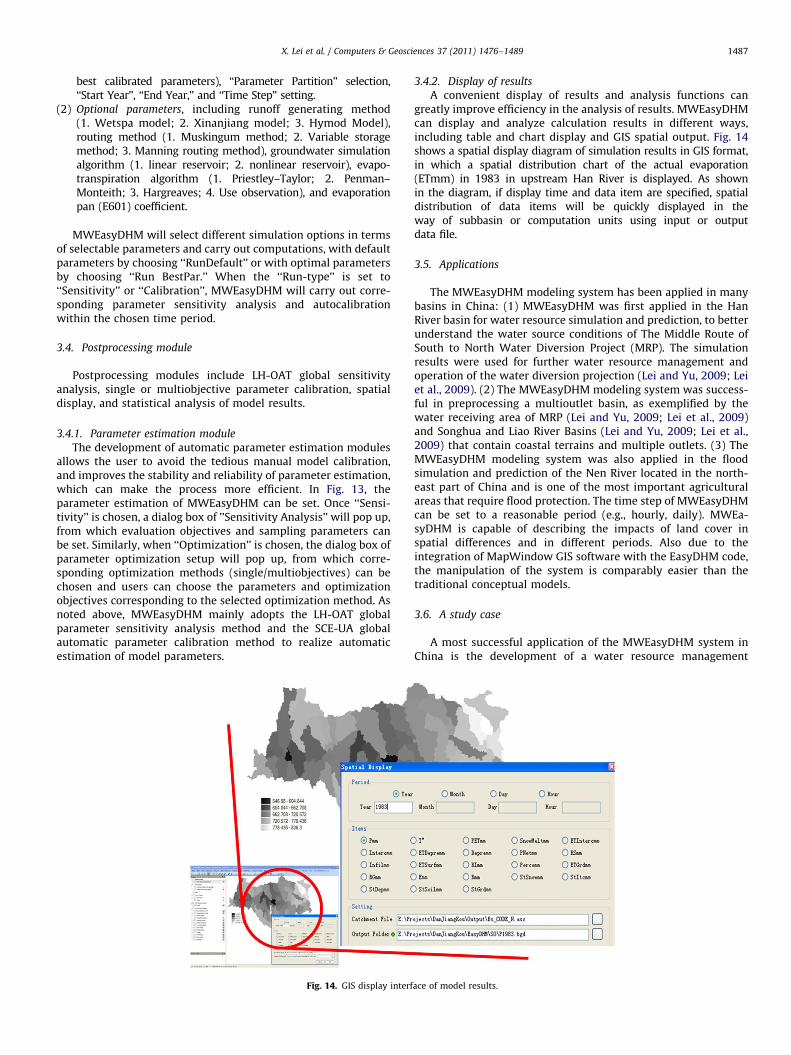
Fig. 14. GIS display interf
3.4.2. Display of results
A convenient display of results and analysis functions cangreatly improve efficiency in the analysis of results. MWEasyDHMcan display and analyze calculation results in different ways,including table and chart display and GIS spatial output. Fig. 14shows a spatial display diagram of simulation results in GIS format,in which a spatial distribution chart of the actual evaporation(ETmm) in 1983 in upstream Han River is displayed. As shownin the diagram, if display time and data item are specified, spatialdistribution of data items will be quickly displayed in theway of subbasin or computation units using input or outputdata file.
3.5. Applications
The MWEasyDHM modeling system has been applied in manybasins in China: (1) MWEasyDHM was first applied in the HanRiver basin for water resource simulation and prediction, to betterunderstand the water source conditions of The Middle Route ofSouth to North Water Diversion Project (MRP). The simulationresults were used for further water resource management andoperation of the water diversion projection (Lei and Yu, 2009; Leiet al., 2009). (2) The MWEasyDHM modeling system was success-ful in preprocessing a multioutlet basin, as exemplified by thewater receiving area of MRP (Lei and Yu, 2009; Lei et al., 2009)and Songhua and Liao River Basins (Lei and Yu, 2009; Lei et al.,2009) that contain coastal terrains and multiple outlets. (3) TheMWEasyDHM modeling system was also applied in the floodsimulation and prediction of the Nen River located in the north-east part of China and is one of the most important agriculturalareas that require flood protection. The time step of MWEasyDHMcan be set to a reasonable period (e.g., hourly, daily). MWEa-syDHM is capable of describing the impacts of land cover inspatial differences and in different periods. Also due to theintegration of MapWindow GIS software with the EasyDHM code,the manipulation of the system is comparably easier than thetraditional conceptual models.
3.6. A study case
A most successful application of the MWEasyDHM system inChina is the development of a water resource management
ace of model results.

0
20
40
60
80
100
120
140
160
180
2000
500
1000
1500
2000
2500
3000
3500
1 16 31 46 61 76 91 106
121
136
151
166
181
196
211
226
241
256
271
286
301
316
331
346
361
376
391
406
421
436
451
466
481
496
511
526
541
556
571
586
601
616
631
646
661
676
691
706
721
Precipitation(mm/day)
Discharge(m3 /s)
Time(day)
Precipitation
Simulation
Observation
Fig. 15. Simulation results of Xiangjiaping catchment (a catchment located on the upstream of the Han River Basin).
X. Lei et al. / Computers & Geosciences 37 (2011) 1476–14891488
system on the upstream of the Han River Basin, which is the mainfunctional catchment for the MRP project. The description ofmodeling processes can be displayed in Figs. 2 to 3. The mainhydro-analysis function was added as a plug-in where multiplemanipulation of DEM analysis and station identification can behandled or processed at one time (Fig. 2). After DEM processingand the catchment outlet definition, upstream and downstreamanalysis can be carried out. The next step is mainly focused on themodel parameter calculation (Fig. 7b) relating to surface, soil,catchment, and unit statistics. The following step is mainly aboutdata distribution and model computation start setup. The real-time display can be seen in Fig. 12. The left part of Fig. 12 showsthe simulation process of Xiangjiaping catchment while the rightpart shows the real-time display on simulated discharge (in blueline), observed discharge (in black line), and the precipitation (inred bar). The hydrograph evaluation result at Xiangjiaping catch-ment with calibrated parameters is illustrated in Fig. 15. A 2-yearsimulation is conducted to present the good correlation betweendaily observation (green dot line) and simulated discharge (inblack line) at the hydro-station of Xiangjiaping catchment fromyear 1983 to 1984. The Nash coefficient of the simulation reachedto 0.84, promising a good hydrological reproduction.
4. Conclusion
The open-source GIS-based MWEasyDHM tool provides afriendly GIS-based modeling environment to carry out efficientdistributed hydrological modeling with various hydrological ana-lysis modules, computational and result visualization modules,and spatial output functions. The MWEasyDHM tool has success-ful applications in many watersheds of China. The application inthe Han River also shows the capability of high hydrologicalreproduction precision and spatial visualization.
Effort should be expended to make the tool efficient forpractical water resource management and flood control.
Therefore, in summary, based on MapWindow GIS, an efficientand cost-effective hydrological simulation tool with MWEa-syDHM has potential in hydrological modeling and promises afoundation for further development and applications in practicalwater resource management and flood control.
References
Abbott, M.B., Bathurst, J.C., Cunge, J.A., 1986. An introduction to the European system:Systeme hydrologique Europeen (SHE). Journal of Hydrology 87, 61–77.
BASIN4 Environmental Protection Agency, 2009. /http://www.epa.gov/waterscience/basins/S.
Batelaan, O., Wang, Z.M., De Smedt, F., 1996. An adaptive GIS Toolbox forHydrological Modelling. Application of Geographic Information Systems inHydrology and Water Resources Management. IAHS Publication.
Castrogiovanni, E.M., La Loggia, G., et al., 2005. Design storm prediction andhydrologic modeling using a web-GIS approach on a free-software platform.Atmospheric Research 77 (1–4), 367–377.
Coroza, O., Evans, D., et al., 1997. Enhancing runoff modeling with GIS. Landscapeand Urban Planning 38 (1–2), 13–23.
Croley, T.E., Hartmann, H.C., 1985. Resolving Thiessen polygons. Journal ofHydrology 76 (3–4), 363–379.
Elias, G., et al., 2007. Multi-objective automatic calibration of SWAT using NSGA-II.Journal of Hydrology 341 (3–4), 154–176.
George, C., Leon, L.F., 2008. WaterBase: SWAT in an open source GIS. The OpenHydrology Journal 2, 1–6.
Hormann, G., Koplin, N., et al., 2009. Using a simple model as a tool toparameterize the SWAT model of the Xiangxi River in China. QuaternaryInternational 208 (1–2), 116–120.
Kebaili Bargaoui, Z., Chebbi, A., 2009. Comparison of two kriging interpolationmethods applied to spatiotemporal rainfall. Journal of Hydrology 365 (1–2),56–73.
Kralisch, S., Krause, P., 2006. JAMS—a framework for natural resource model.Lei, X.H., Jiang, Y.Z., Wang, H., et al., 2010. Distributed Hydrological Model EasyDHM
II. Application. Journal of Hydraulic Engineering 41 (8), 893–908 (in Chinese).Lei, X.H., Zhou, Z.H., Ding, X.Y., et al., 2009a. Study on the treatment of boundary
river and coast line in the watershed subdivision of distributed hydrologicalmodel. Journal of China Hydrology 29 (6), 1–5.
Lei, X., Yu, T., 2009. General catchment delineation method and its application intothe middle route project of China’s south-to-north water diversion. The HKIETransactions 17 (2), 1–7.
McMichael, C.E., Hope, A.S., et al., 2006. Distributed hydrological modeling inGeographic Resources Analysis Support System (GRASS), 2010, GRASS devel-opment team. /http://grass.itc.it/S.
Neitsch, S.L., Arnold, J.G., Kiniry, J.R., Williams, J.R., 2005. Soil and water assess-ment tool theoretical documentation (Version 2005).
OpenJUMP Geographic Information System, 2008. /http://www.openjump.org/S.Pfafstetter, O., 1989. Classification of Hydrographic Basics: Coding Methodology.
Departamento Nacional de Obras de Saneamento, Esri, USA.Quantum GIS Project team, 2009. /http://www.qgis.org/S.Ren-Jun, Z., 1992. The Xinanjiang model applied in China. Journal of Hydrology
135 (1–4), 371–381.Romanowicz, A.A., Vanclooster, M., et al., 2005. Sensitivity of the SWAT model to
the soil and land use data parametrisation: a case study in the Thylecatchment, Belgium. Ecological Modelling 187 (1), 27–39.
Schuol, J., Abbaspour, K.C., et al., 2008. Estimation of freshwater availability in theWest African sub-continent using the SWAT hydrologic model. Journal ofHydrology 352 (1–2), 30–49.
SharpMap easy-to-use mapping library for use in web and desktop applications,2009. /http://www.codeplex.com/SharpMapS.
Shen, Z.Y., Gong, Y.W., et al., 2009. A comparison of WEPP and SWAT for modelingsoil erosion of the Zhangjiachong Watershed in the Three Gorges ReservoirArea. Agricultural Water Management 96 (10), 1435–1442.
Smakhtin, V.U., Eriyagama, N., 2008. Developing a software package for globaldesktop assessment of environmental flows. Environmental Modeling & Soft-ware 23 (12), 1396–1406.
SWAT-CUP2, 2008. SWAT Calibration and Uncertainty Programs, version 4,Department of Systems Analysis, Integrated Assessment and Modelling(SIAM), Eawag, Swiss Federal Institute of Aquatic Science and Technology,Duebendorf, Switzerland, 95 pp.
uDig GIS Framework for Eclipse, 2009. /http://udig.refractions.net/S.

X. Lei et al. / Computers & Geosciences 37 (2011) 1476–1489 1489
Using the MapWindow ActiveX Control, 2008. MapWindow Open Source Team./http://www.mapwindow.org/S.
Viviroli, D., Zappa, M., et al., 2009. An introduction to the hydrological modelingsystem PREVAH and its pre- and postprocessing-tools. Environmental Model-ing & Software 24 (10), 1209–1222.
Wang, et al., 1997. A distributed model for water and energy transfer between soil,plants and atmosphere (WetSpa). Phys. Chem. Earth 21 (3), 189–193.
William, A., Scharffenberg, Matthew, Fleming, J., 2000. Hydrologic ModelingSystem HEC-HMS Technical Reference Manual. U.S. Army Corps of EngineersHydrologic Engineering Center.
Zhou, Z.H., Jia, Y.W., Wang, H., et al., 2006. Interpolating precipitation in space andtime in large-scale basin based on rain gauges. Journal of China Hydrology 26
(1), 6–11.