development of dsm detection with airborne/spaceborne sar data
TRANSCRIPT
Development of DSM Detection with
airborne/spaceborne SAR data
Takaki OKATANIGeographic Information Analysis Research Division
Geography and Crustal Dynamics Research Center
Geospatial Information Authority of Japan
Introduction:
This presentation is based on author’s researches
in 1998 to 2000. The researches were concerned
to ways of developing DSM (Digital Surface Model)
using airborne and spaceborne SAR (Synthetic
Aperture Radar) data. This presentation introduces
those studies.*As elevation models that were detected with X-Band or C-Band SAR data
corresponded not with earth’s surface but the top of trees or buildings, so the
models that are mentioned in this presentation, are DSMs.
0)What‘s SAR(Synthetic Aperture Radar)
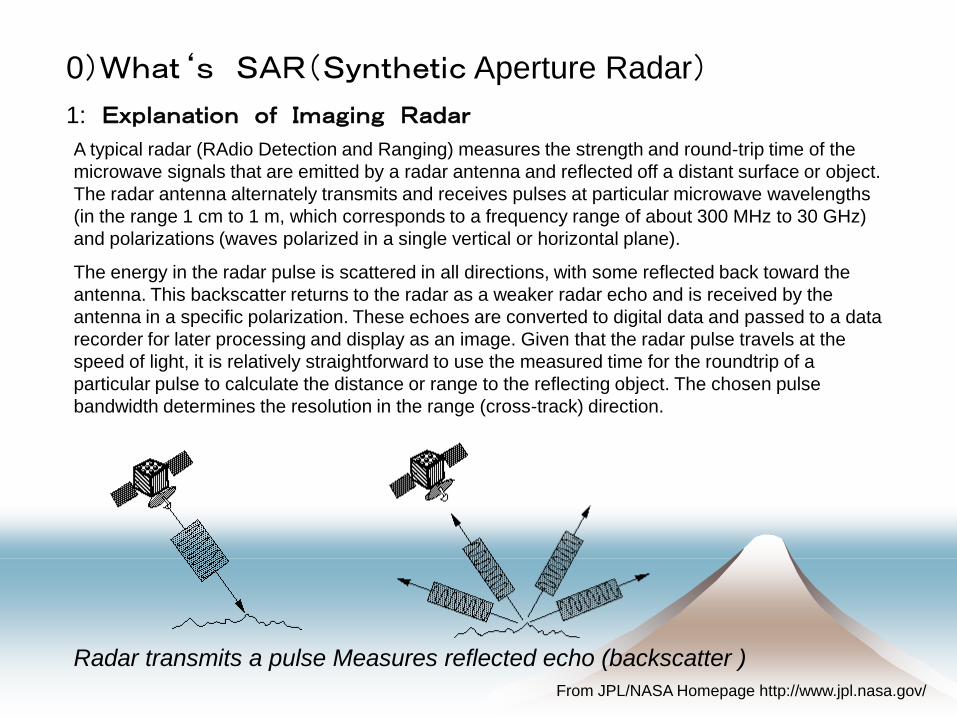
A typical radar (RAdio Detection and Ranging) measures the strength and round-trip time of the
microwave signals that are emitted by a radar antenna and reflected off a distant surface or object.
The radar antenna alternately transmits and receives pulses at particular microwave wavelengths
(in the range 1 cm to 1 m, which corresponds to a frequency range of about 300 MHz to 30 GHz)
and polarizations (waves polarized in a single vertical or horizontal plane).
The energy in the radar pulse is scattered in all directions, with some reflected back toward the
antenna. This backscatter returns to the radar as a weaker radar echo and is received by the
antenna in a specific polarization. These echoes are converted to digital data and passed to a data
recorder for later processing and display as an image. Given that the radar pulse travels at the
speed of light, it is relatively straightforward to use the measured time for the roundtrip of a
particular pulse to calculate the distance or range to the reflecting object. The chosen pulse
bandwidth determines the resolution in the range (cross-track) direction.
Radar transmits a pulse Measures reflected echo (backscatter )
1: Explanation of Imaging Radar
From JPL/NASA Homepage http://www.jpl.nasa.gov/

0)What‘s SAR(Synthetic Aperture Radar)
The length of the radar antenna determines the resolution in the azimuth (along-track) direction of
the image: the longer the antenna, the finer the resolution in this dimension. Synthetic Aperture
Radar (SAR) refers to a technique used to synthesize a very long antenna by combining signals
(echoes) received by the radar as it moves along its flight track. Aperture means the opening used
to collect the reflected energy that is used to form an image. In the case of a camera, this would be
the shutter opening; for radar it is the antenna. A synthetic aperture is constructed by moving a real
aperture or antenna through a series of positions along the flight track.
As the radar moves, a pulse is transmitted at each position; the return echoes pass through the
receiver and are recorded in an 'echo store.' Because the radar is moving relative to the ground, the
returned echoes are Doppler-shifted. Comparing the Doppler-shifted frequencies to a reference
frequency allows many returned signals to be "focused" on a single point, effectively increasing the
length of the antenna that is imaging that particular point. The trick in SAR processing is to correctly
match the variation in Doppler frequency for each point in the image: this requires very precise
knowledge of the relative motion between the platform and the imaged objects.
2: Constructing “Synthetic Aperture”
From JPL/NASA Homepage http://www.jpl.nasa.gov/

0)What‘s SAR(Synthetic Aperture Radar)
Synthetic aperture radar is now a mature technique used to generate radar images in which fine
detail can be resolved. SARs provide unique capabilities as an imaging tool. Because they provide
their own illumination (the radar pulses), they can image at any time of day or night, regardless of
sun illumination. And because the radar wavelengths are much longer than those of visible or
infrared light, SARs can also "see" through cloudy and dusty conditions that visible and infrared
instruments cannot.
Radar images are composed of many dots, or picture elements. Each pixel (picture element) in the
radar image represents the radar backscatter for that area on the ground: darker areas in the image
represent low backscatter, brighter areas represent high backscatter. Bright features mean that a
large fraction of the radar energy was reflected back to the radar, while dark features imply that very
little energy was reflected. Backscatter for a target area at a particular wavelength will vary for a
variety of conditions: size of the scatterers in the target area, moisture content of the target area,
polarization of the pulses, and observation angles. Backscatter will also differ when different
wavelengths are used.
3: Radar Image
From JPL/NASA Homepage http://www.jpl.nasa.gov/

0)What‘s SAR(Synthetic Aperture Radar)
A useful rule-of-thumb in analyzing radar images is that the higher or brighter the backscatter on the
image, the rougher the surface being imaged. Flat surfaces that reflect little or no microwave
energy back towards the radar will always appear dark in radar images. Vegetation is usually
moderately rough on the scale of most radar wavelengths and appears as grey or light grey in a
radar image. Surfaces inclined towards the radar will have a stronger backscatter than surfaces
which slope away from the radar and will tend to appear brighter in a radar image. Some areas not
illuminated by the radar, like the back slope of mountains, are in shadow, and will appear dark.
When city streets or buildings are lined up in such a way that the incoming radar pulses are able to
bounce off the streets and then bounce again off the buildings (called a double- bounce) and
directly back towards the radar they appear very bright (white) in radar images. Roads and
freeways are flat surfaces so appear dark. Buildings which do not line up so that the radar pulses
are reflected straight back will appear light grey, like very rough surfaces.
3: Radar Image
From JPL/NASA Homepage http://www.jpl.nasa.gov/
Imaging different types of surface with radar

0)What‘s SAR(Synthetic Aperture Radar)
As SAR data contains not positional information, but a distance between sensor and feature on
earth’s surface expressed in phase, so a hilltop in a SAR Image moves toward the sensor (point B
on the ground is expressed in B’ in the SAR image. This phenomena is called “fore-shortening”) . In
addition to this limitation, area which cannot be seen from the sensor (line between B and C shown
in the figure) is not able to express in SAR image (this area is called “shadow”).
4: Unique characteristics of SAR image
0)What‘s SAR(Synthetic Aperture Radar)
SAR data originally involve both brightness and phase, and the data (Single look complex (SLC) SAR
data)expressed as arrays of complex numbers. The modules of the complex values produce the
traditional radar images where variations of the brightness (the amplitude of the signal) reflect spatial
variations of the physical characterisitcs of the ground surface (the reflector). In each SAR image pixel,
the phase (the argument of the complex value) represents a measure modulo-l/2 (l is the radar
wavelength) of the distance between the radar antenna and the ground.
If the two images are acquired at two different times, the interferometric fringe is sensitive to any
displacement of the ground parallel to the radar line of sight, occurring during the acquisition time
interval. The sensitivity of the interferogram to topography increases with the interferometric baseline
(the spatial separation of the two orbits), whereas the sensitivity to ground displacement is independent
of the satellite configuration. For spaceborne systems, sensitivity to ground displacement is in general
a few thousand times greater than the sensitivity to topography, allowing scientists to detect
displacements of a few millimeters.
5: Interferometric SAR
From JPL/NASA Homepage http://www.jpl.nasa.gov/

0)What‘s SAR(Synthetic Aperture Radar)
6: two ways to detect DSM using SAR data
There are 2 ways to develop DSM using SAR data. One is stereo-matching and the other is In-
SAR analysis. Altitude of location of a certain object might be calculated using stereo-matching
method. Although a position of the object shown in a SAR image is differ from that in an aerial
photograph, similar method can be used if geometric difference among SAR and aerial
photograph is considered. Also In-SAR analysis is available if two or more observations are
performed at the same area and movement among those observations are correctly removed.
If two observations are performed simultaneously, DSM would be detected more easily.

1)Development of DSM Detection with airborne SAR data
About GSI-SAR

About GSI-SAR
Frequency/Wavelength 9.555GHz(3.1cm)
Bandwidth 100MHz
Anntena gain >20dB
Anntena beam width >6°(horizontal), >25°(vertical)
Distance between anntenas >60cm
Off-nadir angle 55-75°
Polarization HH
Resolution Azimuth1.5m/Range:1.5m
Platform Aircraft:Cessna-208-JA8212
Example(Mt.Tsukuba)
Specifications:
1)Development of DSM Detection with airborne SAR data

Obtained data:Ito City(Feb.1999)、Mt.Tsukuba(Oct.1999)
Upper: Ito City
Lower: Mt.Tsukuba
1)Development of DSM Detection with airborne SAR data

DSM obtained by In-SAR analysis using simultaneously observed data
(Left: Ito City Right: Mt.Tsukuba)
As topography in Ito City is not so steep, number of pixels data are lost is
relatively small. On the other hand, in case of Mt. Tsukuba, there are many
pixels that cannot be observed from the aircraft as topography is relatively
steep. Whole topographic feature cannot be seen from this sole image.
1)Development of DSM Detection with airborne SAR data

south
4-directions observation data
were combined to obtain whole
topographic feature of Mt.
Tsukuba
41%
76%
94%
一 方 向 単 独
二 方 向 合 成
四 方 向 合 成
Ratio of data obtained at Mt. Tsukuba
1)Development of DSM Detection with airborne SAR data
4-d combined
2-d combined
Only 1 image
north
west east
E-W
combined
S-N
combined
4-d combined

Accuracy of DSMs were validated by comparing SAR’s DSMs and DSM
obtained by automatically stereo-matched aerial photographs (Residual
between aerial photograph and GCP was less than 20cm).
(Unit:m) Aver a g ed r es i dua l (a bs o l u t e v a l ue ) S t a nda r d dev i a t i on o f r es i dua l s
Ito City 7.5 9.7Mt. Tsukuba (E) 9.1 7.7Mt. Tsukuba (W) 11.1 13.6Mt. Tsukuba (S) 7.5 8.8Mt. Tsukuba (N) 7.7 9.6Mt. Tsukuba (E-W) 9.9 11.4Mt. Tsukuba (S-N) 7.5 9.5Mt. Tsukuba (4D) 7.4 9.0
Standard deviations of residuals were around 10m, and this might allow
us to apply SAR’s DSM to 1:50,000 scale topographic map.
1)Development of DSM Detection with airborne SAR data

Application use
SAR image can be converted to
orthoimage using positional
information of platform.
Various information, such as
flooding area and other disaster
information, might be combined
easily with this orthoimage SAR
1)Development of DSM Detection with airborne SAR data
Original SAR image
SAR orthoimage Improved DSM
4-d combined DSM
Missing data were filled
with neighborhood data
by re-sampling method
3D image

Application use
Image developed by SAR
orthoimage and aerial photograph
combined data which HSI
conversion was performed.
Extent of disaster such as flood,
might be detected effectively with
information from not only hue and
saturation in aerial photograph but
intensity of back-scatters of
microwaves.
1)Development of DSM Detection with airborne SAR data

Conclusion
・DSM with accuracy of around 10m might be obtained by airborne SAR
⇒Rough topographic feature can be obtained
・Whole topographic feature in steep area can be obtained with
4-directions observations
⇒This approach might be effectively applied in volcanic area
・Application use such as SAR orthoimage might be used for disaster detection
⇒SAR image is effectively used in case of bad weather as optical sensor cannot be
obtain data under clouds
1)Development of DSM Detection with airborne SAR data

Study area is Mt. Tsukuba, the same as airborne’s, but different way,
stereo-matching method with information of back-scatter intensity was
applied.
2)Development of DSM Detection with spaceborne SAR data
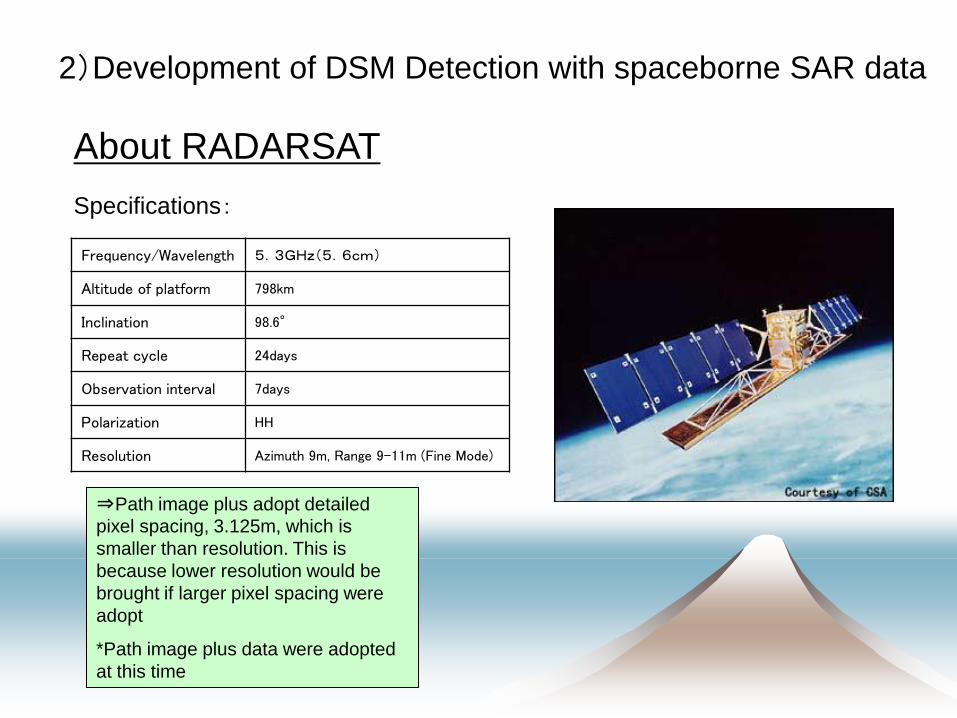
About RADARSAT
Specifications:
Frequency/Wavelength 5.3GHz(5.6cm)
Altitude of platform 798km
Inclination 98.6°
Repeat cycle 24days
Observation interval 7days
Polarization HH
Resolution Azimuth 9m, Range 9-11m (Fine Mode)
⇒Path image plus adopt detailed
pixel spacing, 3.125m, which is
smaller than resolution. This is
because lower resolution would be
brought if larger pixel spacing were
adopt
*Path image plus data were adopted
at this time
2)Development of DSM Detection with spaceborne SAR data

SAR Image(unclear relative to airborne SAR because of low resolution)
(Left:1998.12.22, Right:1998.12.29)
2)Development of DSM Detection with spaceborne SAR data

Altitude was calculated by orbit data of the platform and difference of
fore-shortening values among observations
2)Development of DSM Detection with spaceborne SAR data
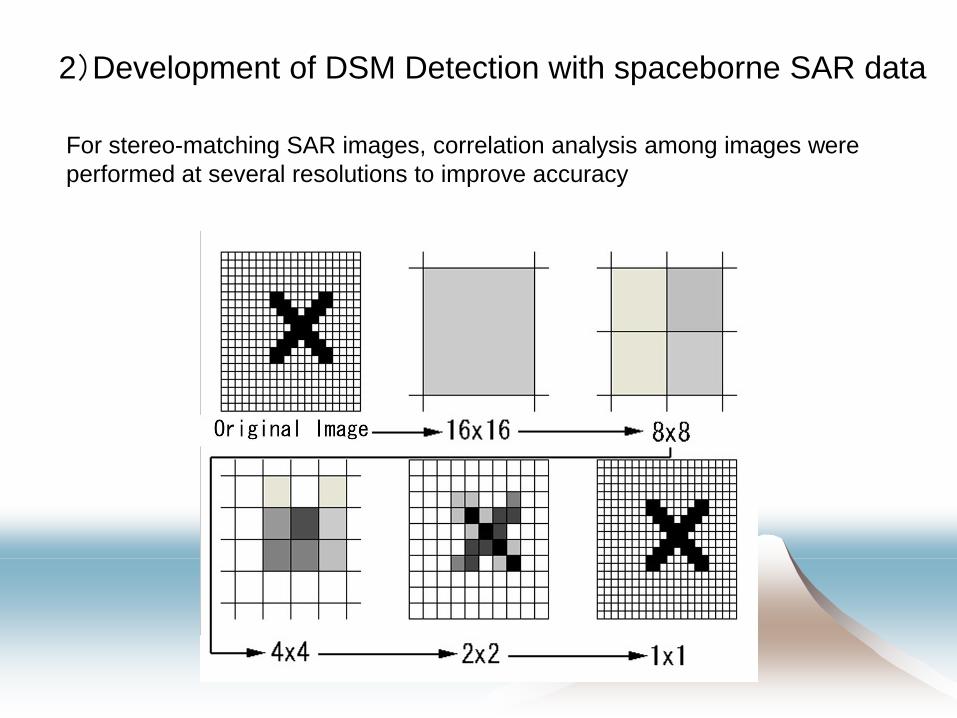
For stereo-matching SAR images, correlation analysis among images were
performed at several resolutions to improve accuracy
2)Development of DSM Detection with spaceborne SAR data

Stereo-matching DSM from two RADARSAT images is as follows; the figure
shows the relationship between SAR DSM and DSM by aerial photographs
2)Development of DSM Detection with spaceborne SAR data

Difference of 1 pixel (3.125m) fore-shortening corresponds altitude difference around 16m
⇒SAR DSM can detect approximate height at every 16m, such as, 0m, 16m, 32m…
Residuals of SAR DSM compared to air-photo DSM was around 30m in absolute average, and
around 40m in standard deviation
⇒As DSM cannot detect detailed altitude difference less than 16m and 16m can be brought
through higher resolution, 3.125m, while actual resolution remains 9m or so, this is understandable
that calculated standard deviation of residuals remained around 40m
*As difference of incidence angle between two images were around 5 degrees, altitude difference
smaller than 16m could not be recognized. If images with larger incidence angle difference were
adopted, detectable height difference could be smaller (But if images with larger incidence angle
difference were adopted, coherence between images would be worsen and this might deteriorate
quality of DSM).
2)Development of DSM Detection with spaceborne SAR data

Conclusions
・Rough topographic feature (with c.a. 40m standard deviation in residuals)
was detected by RADARSAT images with stereo-matching method
Future improvement of DSM can be expected as satellite with more detailed SAR
sensor will be launched. Also, proper selection of stereo-pair images might
improve roughness of created DSM by SAR, if images with larger incidence
angle difference were adopted, detectable height difference could be smaller
2)Development of DSM Detection with spaceborne SAR data
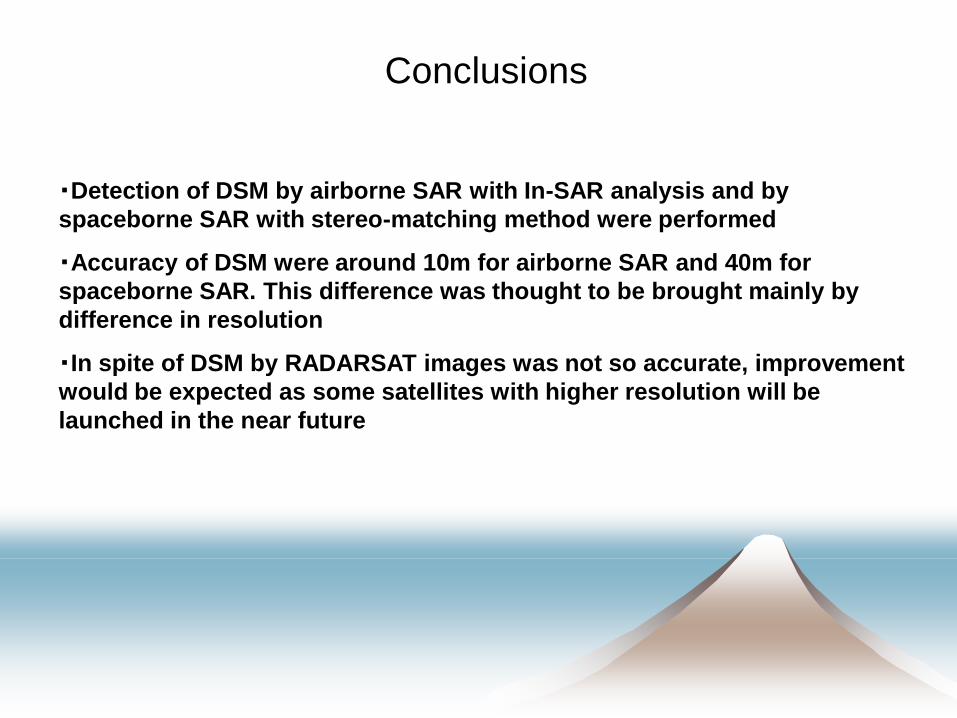
Conclusions
・Detection of DSM by airborne SAR with In-SAR analysis and by
spaceborne SAR with stereo-matching method were performed
・Accuracy of DSM were around 10m for airborne SAR and 40m for
spaceborne SAR. This difference was thought to be brought mainly by
difference in resolution
・In spite of DSM by RADARSAT images was not so accurate, improvement
would be expected as some satellites with higher resolution will be
launched in the near future

Thank you for your attention !