development of cowpea-fortified weaning food; consumer …
TRANSCRIPT

DEVELOPMENT OF COWPEA-FORTIFIED WEANING FOOD; CONSUMER EXPECTATIONS, FUNCTIONAL AND CHEMICAL PROPERTIES
BY
YVONNE MAANU KLUVITSE
A THESIS SUBMITTED TO THE DEPARTMENT OF NUTRITION AND FOOD SCIENCE, UNIVERSITY OF GHANA, IN PARTIAL FULFILMENT OF THE REQUIREMENTS FOR THE AWARD OF AN M.Phil IN FOOD SCIENCE.
MAY, 1995

& 3 4 3 3 5 Gj - w ' &
I f 51) L| Lj ‘ 6 6 K ^ \QMD

iDECLARATION
I CERTIFY THAT THIS WORK WAS CONDUCTED BY ME UNDER SUPERVISION IN THE DEPARTMENT OF NUTRITION AND FOOD SCIENCE, UNIVERSITY OF GHANA, LEGON
YVONNE MAANU KLUVITSE (CANDIDATE)
PROF. S. SEFA-DEDEH (SUPERVISOR)

ii
DEDICATION
To MAMA and DADDY I could not have made it this far without either
of you

ABSTRACT
Questionnaires were administered to a hundred and thirty- two mothers (132) selected at random at four (4) mother and child welfare clinics in Accra in order to obtain their views and expectations of cowpea-fortified weaning formulations. Majority of these mothers (>80%) prepared infant weaning porridges from raw ingredients, eg. fermented maize dough, and were willing to incorporate cowpea into their infant porridges and other foods if it was available as a raw or pre-cooked flour on the market. Factors that motivated the mothers in the selection of an infant weaning food included the cost and nutritional value of the product. The child's acceptance of the food, usually maintained its continued use.
Germinated cereal flours (of maize, millet and sorghum) were added to 3-day fermented maize dough in attempt to degrade the starch by the action of alpha and beta- amylases in the cereal malt and thereby reduce its bulk density. The cereals were sprouted for 2,3 and 4 days and then incorporated into fermented maize dough at concentrations of 5% and 10% (dry matter basis). Sorghum malt in comparison to millet and maize malts was not effective in terms of lowering the hot and cold paste viscosities of the fermented maize dough. Millet and maize malts liquified the dough considerably. The effect of 4-day sprouted cereal malt was most pronounced whilst the optimum
iii

activity of maize malt observed after three days of sprouting.
The effects of maize dough fermentation and its fortification with steamed cowpea on proximate as well as oligosaccharide composition, physicochemical and functional characteristics were also studied. A 5x4x2x2 factorial experiment with cowpea level (0, 5, 10, 15, 20 %) , fermentation time (0, 24, 48 72 h) , fermentation method (single-component and multi-component) and cowpea steaming time (0, 4 min) as thevariables was performed. The cowpeas were dehulled, steamed, dried at 65 °C for 24 h and milled into flour. Maize was soaked in water (18 h) , drained and milled into flour. The maize-cowpea blends were made into a 50% moisture dough, fermented for the specified periods, dried at 65 °C and milled into flour. Moisture, protein, ash and fat content were measured Stachyose, raffinose and other sugars were extracted from the samples and analyzed using High Pressure Liquid Chromatography (HPLC).
The protein content of the maize-cowpea blends increased with level of cowpea in the blend; the ash and fat contents were not influenced by process variables. The pH of the samples were affected by fermentation time, steaming and the level of cowpeas in the blend. Cowpeas was the main source of sucrose, stachyose and raffinose and maize the source of glucose/galactose. Fermentation caused , a reduction in stachyose and
iv

glucose/galactose. The mixing of cowpea flour with fermented maize dough prior to drying (single component fermentation) gave similar effects on sugar concentrations as detected in the cofermented samples (multi-component fermentation).
Fermentation can therefore reduce anti-nutritional factors and non-digestible components in legumes. The process can be used to develop acceptable weaning foods from maize-cowpeNa blends.
Models were developed to predict Brabender viscosity from Brookfield viscosity determined at various spindle speeds (10, 2 0, 50rpm), solids concentration of samples and temperatures. R2 of the models could explain 95.32% - 98.32% of the variation observed. There was high correlation (R = 84.51% - 95.97%) between the viscosity measurements made by both instruments.
V

ACKNOWLEDGEMENTI am most grateful to Prof. S. Sefa-Dedeh without whose immense encouragement, support and patience this work could not have been done.
I wish to thank Prof. R.D. Phillips for his valuable contribution and assistance, Sandra 0'Pry and Larry Hitchcock, for their technical assistance and Tina Henson, Jan Kelly, Amerley and Aforo Dankwa for their prayer support.
I say 'thank you' to my siblings for their financial support, my colleagues especially Kwesi Saalia and Michael Adjei, for their comments and contributions and the National Service Personnel of Nutrition and Food Science Dept especially Sharon Komey and Edem Senanu for typing my script and always cheering me up.
Finally, I would like to show my appreciation to you; Therese- Marie, Witoon, Kofi, OT, Gloria, Linda, Nii Adjei, Kaki, Connie and Dr Freddie Phillips, for being there when I needed you
vi
MAY GOD RICHLY BLESS YOU !

TABLE OP CONTENTS
DECLARATION............................................... iDEDICATION. ............................... iiABSTRACT...................................................iiiACKNOWLEDGEMENT........................................... viTABLE OF CONTENTS....... viiLIST OF FIGURES........................................... xiLIST OF TABLES........................................... xiii
INTRODUCTION.............................................. 11.1 The weaning period - a crucial period in
the life of an infant........................... 1
1.2 The shortcomings of traditionalweaning diets.... 21.3 Weaning food formulation ................. 31.4 Main objectives. ........................... 4
LITERATURE REVIEW. ....................................... 6
2.1 The characteristics of a weaning food.......... 6
2.2 The requirements of a weaning food............. 8
2 .3 The development of weaning foods............... 92.4 Traditional food technologies and
infant feeding.................................. 10
2.4.1 Germination.................. 11
2.4.2 Fermentation.......................... 122.5 The choice of cowpea as a fortification
agent........................................... 13
2.6 Functional and chemical properties ofweaning foods................................... 15
vii
PAGE

2.6.1 Functionality of cowpea-fortifiedpreparations.......................... 17
2.7 The benefits of consumer inputs inproduct development............................. 19
MATERIALS AND METHODS.................................... 213.1 Materials...................................... 213.2 Methodology.................................... 21
3.2.1 Field Surveyquestionnaire administration......... 21
3.2.2 Laboratory Studies................... 223.2.2.1 To investigate the effect of the
addition of cereal malt (sorghum, millet and maize) on the viscosityof cooked cereal based porridges .... 22
3.2.2.2 To investigate the effects of cowpea steaming and fermentation conditions on the proximate composition and the sugar concentration in maize-cowpea blends............... 25
3.2.2.3 Assesment of the Brookfield viscometer, a simple tool for measuring the viscosity of cooked gruelsand to compare it to the Brabender viscoamylograph ..................... 2 8
3.2.3 Chemical analyses.................... 293.2.3.1 Determination of mono-, di-, and
oligosaccharides..................... 293. 2. 3. 2 Proximate analyses.................. 2 93. 2.3. 3 Physico-chemical properties......... 3 0
3. 2. 3. 3.1 pH and Acidity ................ 3 03.2. 3.4 Functional Properties............... 3 0
3.2. 3.4.1 Water absorption............... 3 03. 2. 3.4.2 Cooked Paste viscosity ........ 31
viii

RESULTS AND DISCUSSION ................................... 334.1 Mothers' perceptions of quality attributes
in a cowpea based infant weaning food ......... 334.1.1 Background data on respondents........ 334.1.2 The use of cowpeas in infant
food preparation..................... 3 94.1.3 Preferences indicated for various
cereals in a cereal-legume blend..... 454.1.4 Cowpea Variety preferences
indicated ............................ 4 84.1.5 Characteristics mothers preferred
in infant food formulations ......... 504.1.6 Sensory evaluation of some
quality characteristics inweaning foods ........... 54
4.2 Effect of cereal malt on the viscosityof fermented maize dough....................... 564.2.1 Product description ......... 564.2.2 Brabender Viscoamylograph
viscosity indices ................... 564.2.2.1 Pasting temperature................... 574.2.2. 2 Peak Viscosity ....................... 584.2.2.3 Viscosity at 95°C .................... 584.2. 2.4 Viscosity at 95°C-HOLD ............... 594.2.2.5 Viscosity at 50°C .................... 614.2.2.6 Viscosity at 50°C-HOLD ............... 654.2.3 Effect of cereal type on the
pasting characteristics of fermented maize dough-cerealmalt blend ..................... 67
ix3.2.4 Data Analyses............................ 32

4.3 The effects of cowpea steaming and fermentation on the chemical and functional properties of maize-cowpeablends ......................................... 724.3.1 Product description .................. 724.3.2 Product composition .................. 724.3.3 pH and Acidity ....................... 724.3.4 Sugars and oligosaccharides .......... 774. 3.4.1 Cowpea ............................... 774. 3.4. 2 Maize ................................ 784.3.4.3 Fermented maize-cowpea blends ........ 79
4. 3.4. 3.1 Co-fermentation................ 794.3.4.3.2 Blend after maize
fermentation ................... 834.3.5 Water absoption capacity ............. 87
4.4 The use of Brookfield viscometer to measure the viscocity of cooked gruels and it comparison with the Brabender viscoamylograph ................................ 894.4.1 Apparent viscosity determined
at 10 rpm ............................ 894.4.2 Apparent viscosity determined
at 2 0 rpm ........... ................ 934.4.3 Apparent viscosity determined
at 50 rpm ........................... 9 6CONCLUSION .......... 99
RECOMMENDATION ........................................... 102REFERENCES ............................................... 103APPENDICES .................... 119
X

Fig. 1 Fermented maize dough fortified with cereal malt . 23Fig. 2 Maize-cowpea blends prepared for analyses.......... 26Fig. 3 Educational background of the respondents......... 34Fig. 4 Number of children born to each respondent......... 3 8Fig. 5 Foods prepared at home with the incorporation
of cowpeas......................................... 40Fig. 6 Foods proposed to be suitable for the incorporation
of cowpea flour.................................... 43Fig. 7 Preferences indicated for various cereals in a
cereal-legume blend................................46Fig. 8 Cowpea variety preferences......................... 49Fig. 9 Colour preferences for infant foods................ 51Fig. 10 Effect of sprouting time on the viscosity of
fermented maize dough-cereal malt blends at 95°C-HOLD..........................................60
Fig. 11 Effect of sprouting time on the viscosity offermented maize dough-cereal maltblends at 50°C..................................... 62
Fig. 12 Effect of sprouting time in the viscosity offermented maize dough-cereal malt blends at 50 °C-H0LD..........................................66
Fig. 13 The effect of sprouted sorghum on thepasting characteristics of 3-dayfermented maize dough.............................. 68
Fig. 14 The effect of sprouted maize on thepasting characteristics of 3-dayfermented maize dough.............................. 69
Fig. 15 The effect of sprouted millet on thepasting characteristics of 3-dayfermented maize dough.............................. 70
Fig. 16 pH profiles: Effect of steam treatmentand cowpea concentration on the traditional lactic acid...................................... 73
xiLIST OF FIGURES PAGE

Fig.
Fig.
Fig.
Fig.
Fig.
Fig.
Fig.
Fig.
Fig.
Fig
Fig.
Fig.
XII
17 Effect of addition of cowpeas on acid production during traditional lactic acid fermentation of maize dough........................................ 76
18 Effect of fermentation on the sugar levelsin co-fermented maize-cowpea blends.............. 80
19 Effect of fermentation on the sugar levelsin co-fermented maize-cowpea blends.............. 81
20 Effect of fermentation on glucose concentration in co-fermented maize-cowpea blends.............................................82
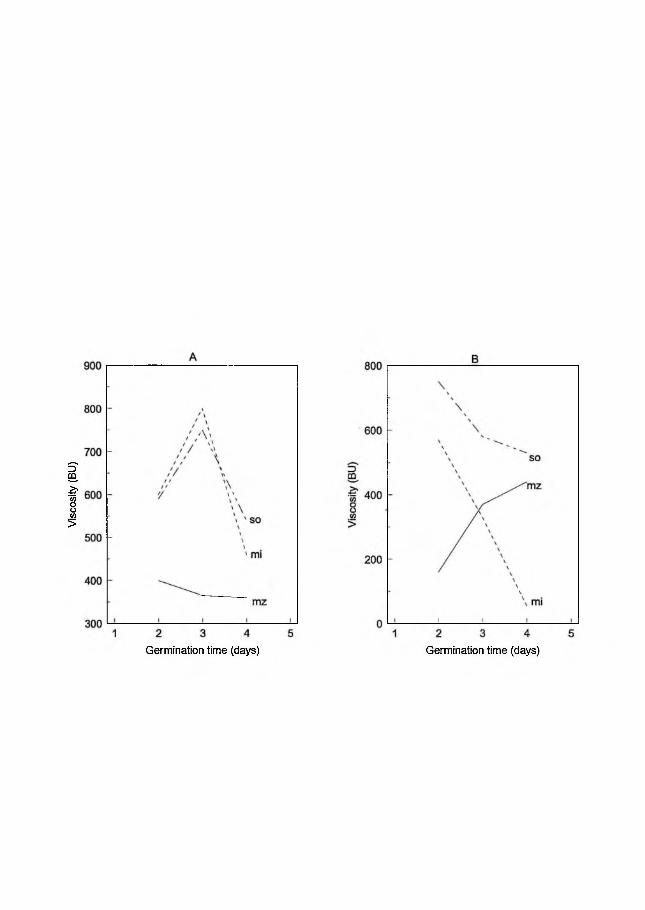
21 Effect of fermentation on the sugar levelsin fermented maize-cowpea blends................. 84
22 Effect of fermentation on the sugar levelsin fermented maize-cowpea blends...................85
23 Effect of fermentation on glucose concentration on fermented maize-cowpea blends.............................................86
24 Models to predict Brabender viscosity from Brookfield viscosity at lOrpm, temperatureand concentration of maize slurries.............. 91
25 Models to predict Brabender viscosity from Brookfield viscosity at lOrpm, temperatureand concentration of maize slurries.............. 92
26 Models to predict Brabender viscosity fromBrookfield viscosity at 20rpm, temperature and concentration of maize slurries............... 94
2 7 Models to predict Brabender viscosity fromBrookfield viscosity at 20rpm, temperature and concentration of maize slurries............... 95
2 8 Models to predict Brabender viscosity fromBrookfield viscosity at 50rpm, temperature and concentration of maize slurries............... 97
Fig. 29 Models to predict Brabender viscosity from Brookfield viscosity at 50rpm, temperature and concentration of maize slurries....... 98

xiiiLIST OF TABLES
Table 1 Proposed model composition forsupplementary foods.............................. 7
Table 2 Chemical composition of whole seeds offour local cowpea varities................ 14
Table 3 Occupation of respondents....................... 3 6Table 4 Age of youngest child........................... 3 9Table 5 Incorporation of cowpea into food............... 41Table 6 Reasons for feeding fermented maize dough
porridge to their children....................... 53Table 7 Motivating factors that control the
purchase of proprietary weaning foods........... 54Table 8 Significant F-values for results of ANOVA....... 58Table 9 Effects of millet malt on cooked paste
viscosity of maize dough at 50°C and 50°C-HOLD.... 64Table 10 Effect of maize malt on cooked paste
viscosity of maize dough at 50°C and 50°C-HOLD.... 64Table 11 Effect of sorghum malt on cooked paste
viscosity of maize dough at 50°C and 5C)oC-H0LD. ... 64Table 12 Chemical composition of cowpea and maize......... 72Table 13 Levels of mono-, di- and oligosaccharides
as determined in cowpea............................ 78Table 14 Levels of mono- and disaccharides as
determined in maize................................ 78Table 15 Table of significant F-values for ANOVA.......... 87Table 16 ANOVA summary table for water absorption
capacity of cowpea-maize blends. . .................88
PAGE

1.01
INTRODUCTION
1.1 The weaning period - a crucial period in the life of an infantInfants in developing countries generally show
satisfactory growth during the first 6 months of life when they are almost exclusively breastfed (Cameron and Hofvander, 1971). Thereafter, there is the need to introduce supplementary foods in order to meet the infants increased nutritional requirements for protein, energy and other nutrients. Weaning foods are offered to the child with the dual purpose of supplementing nutrient intake and gradually weaning the infant off breastmilk (Cameron and Hofvander,1971)
Cameron and Hofvander (1971) observd that "One of the greatest dangers of weaning period can be the results of the change over from sterile breast milk and its anti-infective factors to animal milk and semi-solid and solid foods, often acquired, stored and fed in unhygienic and unsanitary fashion. In fact, the weaning process is associated with the highest rate of infection, particularly of the gastrointestinal tract, that the child will encounter in its entire lifetime".
The resultant "weaning diarrhoea" may easily precipitate Protein Energy Malnutrition (PEM) leading to death if not handled properly. Nutrition is closely linked with health as it

influences infection. Each year, about 13 million infants die in the developing countries. Though the immediate cause of a majority of these deaths is parasitic and infectious diseases, most of the children die due to malnutrition (ACC/SCN, 1988) .
Many approaches are needed to improve child survival and growth in developing countries. Among these are improved sanitation, breastfeeding promotion, immunizations, diarrhoeal disease control and the provision of safe and nutritious weaning foods (Jansen, 1992)
1.2 The shortcomings of traditional weaning diets
The diet of most people in developing countries is based on processed cereal grains such as maize, sorghum, and rice or roots and tubers such as yam and cassava (Bressani, 1985) . These foods, because they are eaten in large quantities, provide the bulk of protein, but the quality of this protein leaves much to be desired.
Traditional weaning porridges are usually made from these local staples and the result is gruels that have low nutritional value as they are not adequate sources of micro- and macronutrients (Brown, 1991). During cooking the starch in these staples bind water, requiring considerable amounts of water to bring the consistency of the porridge to a level suitable for child feeding. This lowers the energy and nutrient density of the porridge considerably. This high volume/high
2

viscosity characteristic, referred to as dietary bulk makes it difficult for infants fed on these gruels to satisfy their nutrient requirements. This is considered as a major problem of malnutrition in areas where cereals and starchy staples are the main food (Ljungqvist et al., 1981).
The use of adult diet as weaning food is also a common practice but this is desirable if the nutrient density isadequate and the food is made easily digestible. Otherpractices such as food taboos and intrafamilial food distributions may also work to the detriment of the infant who is not yet able to fend for his/herself.
1.3 Weaning food formulation
Work has been done towards the development of some high-protein weaning foods from local staples (Eyeson and Plahar, 1988, Akpapunam and Sefa-Dedeh, 1994). The approach that has been commonly adopted has been the fortification of cereals with locally available legumes e.g. soya beans, cowpeas, etc.
Food grain legumes, because of their high protein content, in general constitute the natural protein supplement to staple diets. Protein quality is synergistically improved in
mixes because of the lysine contributed by the cowpea and methionine contributed by the cereal (Bressani and Elias, 1980) .
3

The use of processing methods such as extrusion, puffing, toasting, malting, steam treatment, dry roasting and fermentation have also been researched in attempt to reduce dietary bulk, antinutritional factors, undesirable flavours associated with legume utilization and inhibit bacteria pathogens. Although some of these technologies may be effective in producing optimum weaning diets they may be too technical or unacceptable to the rural population. Mensah and Sefa-Dedeh (1991), stressed the need to employ simple and inexpensive local technologies which can be adapted at home level to ensure wider acceptance among the population.
This study was aimed at investigating the effectiveness of traditional processing technologies; germination , fermentation and steaming in the development of a high-protein multimix of desirable functional and physico-chemical quality.
1.4 Main Objectives:
1. To obtain the views and perceptions on the quality attributes expected and the factors considered in the selection of a weaning food by mothers.
2. To investigate the effect of adding sorghum, millet and maize malts on the viscosity of cooked cereal-based porridges.
4

5
3. To determine the effects of traditional processes such assteaming and fermentation on the concentration of mono-,di- and oligosaccharides in cowpea/maize blends by the use of High Pressure Liquid Chromatography (HLPC).
4. To investigate the effect of cowpea fortification on theproximate composition, physico-chemical and functional properties of fermented maize dough.
5. To assess the use of the Brookfield viscometer, a simpletool for measuring the viscosity of cooked gruels and tocompare it to the Brabender viscoamylograph.

62 . 0 LITERATURE REVIEW
2.1 The characteristics of a weaning food
The term "weaning food" usually describes solid or semisolid food designed to be fed to an infant either partially on fully weaned from the breast (Jansen, 1992) . In general, weaning foods should be soft so that they are easy for babies to chew, swallow and digest. They should not be irritating to the baby's digestive tracts and should be free of contamination (Mitzner et al., 1984).
In many traditional societies, the weaning child seldom receives specially formulated weaning foods. The child is instead gradually introduced to adult foods, starting with softer carbohydrate rich varieties (Mitzner et al., 1984).Often such foods do not contain all the nutrients that the child needs, or they are so dilute that the infant, whose stomach is small, cannot consume enough to supply the nutrients necessary for growth and development. In attempt to address this issue, food mixtures, specially formulated for the weaning child have been developed.
Weaning foods, when combined with other foods that are being consumed, need to ensure that the nutritional needs of the infant or young child are met according to national and international standards. Establishing a definite nutritional standard for weaning foods is difficult because of the great

variety of conditions under which they are used. The needs of a child may vary considerably depending on age, breastmilk consumption, consumption and nature of the home diet, amount of supplement consumed and other factors.
The product course of action is to develop a supplementary food with nutrient levels such that when combined with low income, heavily cereal-based diet, the nutrient requirement of the targeted child are met. The Codex Alimentarius Commission has proposed a model composition for supplementary foods designed to be fed to infants 4-6 months onwards and to infants (FAO/WHO, 1985).(Table 1)
7
Table 1 Proposed Model Composition for Supplementary Foods3
Per H O O ■Q
Amount Per lOOKcal PerlOOkJ
Proteinb (g) 20 5.2 1 . 2Fat (g) 10 2 . 6 0 . 6Crude fibre (g) 5 1. 3 0.3Vitamin A as retinol (/xg) 400 100 24Vitamin D cholecalcif erol (/xg) 10 2.5 0 . 6Vitamin E (alpha-tocopherol)(mg) 5 1. 25 0.3Ascorbic acid (mg) 20 5.2 0 . 12Thiamin (mg) 0.5 0 . 12 0 . 03Riboflavin (mg) 0 . 8 0 .20 0 . 05Niacin (mg) 9 2 . 2 0 . 57Vitamin B6 (mg) 0 . 9 0 . 22 0 . 06Folic acid (/xg) 100 27 6Vitamin B12 (/xg) 2 0 . 52 0 . 1 2Calcium (mg) 800 200 48Phosphorus (mg) 800 200 48Iron (mg) 10 2 . 7 0 . 6Iodine (ncr) 70 18 4 . 5“ Data from Joint FAO/WHO Food Standards program. Codex Alimentarius Commission.b Protein should have score of 65 and a PER of 2 .2 (casein=2.5) .

2.2 The requirements of a weaning food
The quality of the weaning diet as well as the quantity should be of primary concern in the formulation or improvement of weaning foods.
Whereas the concept of dietary quantity usually refers to the total amount of food energy which can be measured, dietary quality remains rather vaguely defined and difficult to measure (Brown, 1991). Among specific characteristics of a weaning diet that may contribute in quality determination are:
- energy density- macro and micronutrient density- digestibility and bioavailability- diversity of diet- absence of antinutritional factors- appropriate organoleptic characteristics for age
Most attention has been directed towards the fulfilment of protein and energy requirement because of the widespread occurrence of protein energy malnutrition (PEM) and linear growth retardation in developing countries. But the heavy dependence on cereals and root crops among the poorer segments in developing countries has resulted in the prevalence of other nutrient deficiencies e.g. vitamin A, iodine and zinc.
Macro-and micronutrients are both essential to optimum
8

growth and development of the weaning infant therefore the diet must adequately meet the child's requirements.
2.3 The development of weaning foods
In developing countries, weaning foods can be divided into two categories (Jansen, 1992):
1 . common household foods (e.g. corn,cassava, rice, yam,2 . mixtures specially formulated for infants nutritional
needs.
Techniques commonly employed in weaning food development include the formulation of high-quality protein foods and the enrichment of traditional foods by the incorporation local staples. The high-quality protein mixes are developed using local staples and/or imported ingredients and are usually processed on industrial scale. The use of sophisticated technology e.g. extrusion, drum drying may elevate the cost of production and hence the end product cost.
The rationale behind the supplementation of a staple food is that the nutritional quality of a commonly used food may be enhanced by the addition of small amounts of other foods that are rich sources of nutrients limiting the nutritional utilization of the staple food. This alternative may be less expensive than producing a new food and may be more easily
9

adopted (Jansen, 1992). Local food processing methods can be made use of in the processing of these foods. These technologies appear to be very attractive since they are traditional and so would be expected to be not only feasible, but perhaps more culturally acceptable and more effectively promoted than a new behaviour pattern (Ashworth and Draper,1992).
Weaning foods must thus be cheap, culturally acceptable, made of locally available foods and easily and quickly cooked.
2.4 Traditional food technologies and infant feeding
Food processing technologies, traditional and sophisticated facilitate the utilization of food by converting the raw materials into diverse end products with desirable characteristics.
In most developing countries, weaning foods are based on local staples, usually cereals. These cereals are normally made into gruels by the help of processing methods developed through the years based on traditional home practices. Common food technologies used in the preparation of these gruels include germination and fermentation and legume fortification. Unit operations such as dehulling, size reduction, soaking and drying play an important role in the development of product quality.
10

2.4.1 GerminationMalting is a traditional practice in developing countries
primarily used in the production of alcoholic drinks and nonalcoholic beverages. During germination of the grains, a- amylase and E-amylase activity is developed. These enzymes effectively degrade starch granules reducing their water binding capacity. Germination among the low-cost methods available to reduce the high viscosity of cereal-based gruels seems to be the most effective (Desikachar,1980). Although the viscosity effect is recognised in some communities in India and Africa, germination is not widely used in making weaning foods, perhaps because the preparation of germinated flour is rather time- consuming (Mosha and Svanberg, 1983). The incorporation of a small amount of germinated grain, amylase rich flour (ARF) to a cereal gruel has been reported to produce a remarkable reduction in viscosity (Hansen, 1989; Marero et al, 1988) . Germination does carry certain advantages form the point of view of safety by the removal of toxic and anti-nutritional substances such as the removal of lectin and haemagglutinins (Nnanna and Phillips,1988) . But there is also the danger of contamination in the case of porridge to which ARF is added to porridge after cooking. This method has some constraints with respect to handling and proper application particularly by illiterate mothers (Ashworth and Draper, 1992; Gopalas et al 1982) .
11

Roasting the malted grain is one of the options that have been investigated (Gopalas et al, 1988) but this makes the processing more involving and energy requiring.
Akpapunam and Sefa-Dedeh (1994), incorporated ARF into the maize dough prior to fermentation. This was done with the intention of utilizing the antimicrobial effect of fermented maize dough to inhibit pathogenic bacteria concurrently with the viscosity reduction potential of the ARF. They reported that increases in viscosity due to fermentation overshadowed the viscosity reduction potential of ARF. It may be desirable to add the malt flour to the dough after fermentation.
Germination is also reported to increase free amino acids and sugars in cereals (Parameswasan and Sadasivam, 1992) .
2.4.2 Fermentation
Solid state fermentation of cereals is widely applied in the processing of cereals for the preparation of a wide variety of dishes (Obiri-Danso, 1994). In Ghana, the traditionally recommended weaning porridge is prepared from fermented maize dough. The soaking of the grains in excess water allows the selection of desirable microorganisms, such as lactic acid bacteria, yeasts and moulds (Akinrele and Bassir, 1967). The activity of these microorganisms reduces pH and increases the titratable acidity of the substrate. A number of fatty acids are also produced (Akinrele, 1970; Muller, 1970; Plahar and
12

Leung, 1982) .The sour taste developed as a result of the acids produced
is a desirable sensory attribute. This tangy taste has been reported to appeal to infants especially those who are ailing and unable to feed properly (Phillips and Abbey, 1989) . In
In 1990, Mensah et al studying the properties of fermented maize dough observed significant inhibition of pathogenic bacteria. Cooking the dough into porridge reduced the antimicrobial effect but there was still significant inhibition of pathogen. This antimicrobial property could be an important strategy for the reduction of the high levels of faecal bacteria in weaning foods in developing countries.
The increase of niacin and riboflavin contents (Cameron and Hofvander, 1971) and the release of phosphorus from phytate (Lopez et al, 1983) are among the several benefits derived from the fermentation of maize. The lactic fermentation of cowpeas by the lactic acid bacteria (Lactobacillus plantarum, Lactobacillus fermenti) has been reported to eliminate flatulence causing oligosaccharides (Duszkiewicz-Reinhard et al. 1994) . Legume has also been reported to improve protein digestibility (Barampama and Simard, 1994)
13

2.5 The choice of cowpeas as a fortification agent14
Food grain legumes represent the main protein source consumed by a majority of the population in developing countries (Bressani, 1993) . Cowpea (Vigna uncruiculata) is a popular legume that is widely used in West Africa and it serves as a an economic source of proteins and calories (Nnanna and Phillips, 1990) (Table 2) . Cowpea also provides thiamine and riboflavin to the diet. In addition to its nutritional impact, legume protein reduces plasma low density lipoprotein when consumed.
Table 2 Chemical cowpea
varietiescomposition of whole
VARIETIES
seeds of four local
NutrientAsontem
Varieties Avivi Bencrola Soronko
Moisture * 14 .16 14.29 14 .62 15 .20Protein (%) a 24 .11 26.74 24 . 62 25 .47Fat (%) 1.61 2 . 10 1.79 2 . 00Crude Fat (%) 4.64 3 . 97 4.11 3 . 81NFE e 51.43 48 . 98 51.11 50.20Ash (%) 4 . 14 3 . 92 3 .75 3 . 32Minerals (mg/lOOg) Na 1.51 1.65 1.57 1.27Ca 2.32 2 .24 2 .26 2.15Fe 11. 50 9 .10 12 . 02 9.19* All values were reported on dry matter basis. ' 1 x 6 . 2 5e Nitrogen Free Extract calculated by difference. Source : Osei, (1994)
Though cowpea is cultivated worldwide, in 1981 it was reported that two thirds of the total crop worldwide, was harvested on the African continent (Bressani and Elias, 1980) .

However, the utilization of cowpea as food is below its potential. The underutilization of legumes has been attributed to factors such as the prolonged cooking times required to prepare legume-based foods, methionine deficiency in legume protein, presence of heat stable and heat labile factors that interfere with digestion and gastro-intestinal distress and flatulence associated with legume consumption (Phillips, 1993) . The nutritional quality of starchy legumes is further limited by the inherent resistance of major globulins to digestion.
To utilize cowpeas as a more acceptable source of inexpensive protein, it is desirable to reduce the level of antinutritional factors and develop food applications. The use of some traditional technologies such as germination (Nnanna and Phillips, 1990), soaking and cooking (Abdel-Gawad, 1992), lactic acid fermentation (Reddy and Salunkhe, 1980, Mital and SteinKraus, 1974) (Duskzieiwicz-Reinhard, 1994) and dehulling (Akinyele and Akinlosotu, 1982) have been used to effectively reduce the levels of antinutritional factors in legumes. Steaming and roasting are known to reduce the undesirable beany flavour and also eliminate the effects of heat-labile antinutrients in cowpea.
2.6 Functional and chemical properties of weaning foods
Specific functional characteristics are required for every food system (Pour-El, 1981). Functional property of a food is
15

important because it indicates the utility of products in specific applications and therefore reflect the properties encountered by their use during the preparation of usable products (Sefa-Dedeh, 1993).
The functionality of food depends on its chemical composition and properties. This is because food is made up of aggregates of biological molecules including fats, carbohydrates and proteins which react constantly depending on their environments. It is this reaction and interaction between food constituents and determines the functionality of that particular food system.
The ultimate application of cereals and legumes is the conversion into edible forms for human consumption. The application of processing technology e.g. temperature, enzymes, size reduction, hydration in weaning food production affects the chemical properties and therefore the functionality of the food.
Viscosity and water absorption characteristics are important functional properties of cereal-based porridges. Starch, a major carbohydrate in cereals and legumes, has the ability to absorb water suspension of the granules is heated above gelatinization temperature (Rasper, 1982) . The swelling of the granules and their consequent disintegration on prolonged heating leads to significant changes in viscosity and other rheological properties of the paste that are characteristic of the particular type of starch.
16

Since the effects of mixing different components is not simply additive; evaluation of the individual components is at best only a partial predictive tool (Scheon, 1977). Therefore, in product formulation, the determination of functional properties of the components of the mixture and the end product are clearly of prime importance and must be measured.
2.6.1 The functionality of cowpea-fortified preparations
The important role grain legumes play in the diets of many populations in protein-deficient countries has prompted research on various aspects of legume utilization (Sefa-Dedeh and Yiadom- Farkye, 1988).
One such area is that of raw material/product functionality desirable for efficient processing and consumer acceptability. Much research has been published on cowpeas which can promote the development of processes and products for the consuming public (Sefa-Dedeh, and Demuyarko, 1994; Akinyele and Akinlosotu, 1991; Phillips et al., 1988; Abbey and Ibeh, 1988) .
The chemical composition of cowpea, like most edible legumes contains 2 0-30%, about 62% soluble carbohydrates and small amounts of other nutrients (Bressani, 1985; Phillips, 1993) . Because the protein content of legumes is higher than in most vegetables, the other major component; carbohydrates is often neglected.
17

The amylase in the starch of cowpeas, influences starch solubility and many functional properties such as swelling water absorption and pasting (Bressani, 1985) . The protein in cowpea also gives rise to some functional characteristics including foaming, shipping and binding properties which are desirable sensory quality characteristics especially in fried foods.
Functionality studies of cowpeas on model systems provide insights into the compatibility of cowpea as a food ingredient, and therefore the success with which cowpeas can be incorporated into various foods (McWatters, 1985). This is important as the nutritional benefits of food fortification cannot be at the expense of sensory and functional quality of a product is to be acceptable to consumers (Bressani, 1985).
The cowpea-fortification of cereal products markedly improves the protein content of the mixture and this influences the rheological properties of the blend. Cowpea-Fortification to cereal porridges has been reported to increase the total nutrient density by more than two-fold as a result of a reduction in viscosity (Marero et al., 1980; Malleshi et al.,1989) . Malleshi et al. , 1980 described this decrease inviscosity to be comparable to the dextrogenic effect of a- and S-amylases in germinated cereal.
Sefa-Dedeh and Osei (1994) reported a marked increase in water absorption of steamed and unsteamed cowpea fortified maize
18

dough. The change in functionality accompanying the cowpea fortification of cereal-based porridges is desirable.
2.7 The benefits of consumer input in product development
Consumer input in the product development is important especially when a product is targeted at a specific market. Acceptability of a product is a necessary quality index, as it motivates a potential customer to purchase the product. Product acceptability may encompass other quality criterion such as taste, flavour, colour and functionality of the product.
Consumer data is useful at different stages of the development cycle:
(a) product concept development(b) product optimization(c) end product evaluation
At the conception state it is crucial to obtain data on the potential uses of the product, market available, perceptions and preferences expected in a product. This information may be the basis of a number of decisions to be taken. Consumer information is best obtained through interaction with potential customers.
Product optimization and product evaluation measures may involve some amount of quality assessment. Because of the complexity of physical, chemical and sensory properties of many
19

foods, qualitative as well as instrumental measurements are needed to obtain optimum information.
The total impression of aroma, flavour, taste, texture and colour for example that are acceptable or preferred in a particular product are best determined through the application of sensory analysis arranged for potential consumers. Consumer input information obtained during product development can save a producer the cost of altering a finished product to suit the consumer (Jellinek, 1985).
Qualitative research is a valuable tool used to collect consumer data in the product development cycle.
20

3.0 MATERIALS AND METHODS21
3.1 Materials
Sorghum (Sorghum bicolor), millet (Eleusine coracana), maize (Zea mays) and cowpeas (Vigna unguiculata) were used in the experiments. An improved variety of maize (Abelehii) was purchased from Ejura Farms for the experimental work carried out. Dent corn and Blackeye peas obtained from the Centre for Food Safety and Quality Enhancement (CFSQE), was used for the experimental work performed at the University of Georgia, U.S.A. All the grains and samples were stored at a cold room temperature of 4°C during the experimental period.
3.2 Methodology
3.2.1 Field survey - questionnaire administrationBackground data and information on the,expectations of the
cost and quality attributes that are desirable in a weaning food was obtained by the means of a questionnaire (Appendix ) . Consumer oriented sensory evaluation was also conducted on four (4) manufactured and two (2) traditional weaning foods. Mothers were asked to rank the samples based on their preference for, or degree of liking with respect to colour, texture and consistency. The questionnaire was administered to mothers selected at random from four (4) locations in Accra where they

attend Child Welfare Clinic. The four locations were: ThePrincess Marie Louise Hospital, Adabraka and Labadi polytechnics and the Public Health Services Unit of the Kaneshie Polytechnic for the neighbourhood.
3.2.2 Laboratory studies
3.2.2.1 To investigate the effect of the addition of cereal malt (sorghum, millet and maize) on the viscosity of cooked cereal based porridges.
Maize, millet and sorghum were soaked separately in water for 18 hours at room temperature (Fig. 1). The steep water was drained and the grain allowed to germinate in sterilized woven baskets lined with sterilized jute sacks. The grains were watered lightly twice each day to ensure that the jute sacking was always moist as this would facilitate optimum seed germination. The grains were allowed to germinate for 24, 48, 72 and 96 hours dried in a solar dryer (for an average of 8
hours a day for 5 days) to a moisture content of 7.9- 8 .8%. The dried grains were rubbed between the palms to remove the vegetative parts from the seed, the former was discarded. The seeds were milled into fine flour to pass through a 1mm sieve using a Hammer Mill (Christy and Morris Ltd, Chelmsford, England).
22

Fig. 1 Fermented maize dough fortified with cereal malt.23
Maize Maize/millet/sorghum
Clean Clean
Soak (16 - 18 hours)
Mill
Mix
Solar dry
Mill
Soak (12hours)
Sprout ( 1 - 4 days)
Flour sample

Whole maize grains were soaked in water (1:3,w/v) at room temperature for 16-18 hours. The steep water was drained and the grain milled using a disc attrition mill (Agro Grinding Mill, No. 2A, India) . The resulting meal was kneaded into a dough after bringing the moisture content to 50% by adding water. The dough was then allowed to ferment at room temperature for a period of 1-3 days in a container. Weighed quantities of cereal malt flours were added to the fermented maize dough and the mixture kneaded thoroughly and solar dried. The solar dried meal was milled into flour in a Hammer mill.
Experimental Design
A ( 3 x 3 x 2 ) factorial experimental design was used. Principal factors investigated in the experimental design were:
i. sprouting time allowed for cereals : 2, 3, 4 days;11. cereal malt concentration in dough : 5%, 10%; iii. type of cereal sprouted : maize, millet, sorghum.
Cooked paste characteristics of 8% slurries of the doughs were analyzed using the Brabender Viscoamylograph. The data was subjected to analysis of variance.
24

3.2.2.2 To investigate the effects of cowpea steaming andfermentation conditions on the proximate composition and the sugar concentration in maize-cowpea blends
Whole cowpeas were soaked in water for 4 minutes to loosen the seed coats (Sefa-Dedeh, 1994) . The seeds were drained and dehulled using a disc attrition mill. The hulls were separated by flotation in water. One portion was dried in an oven temperature of 65°C for a period of 20-24 hours the remaining portion was steamed for 4 minutes. Subsequently the steamed seeds were oven dried at 65°C and milled into flour samples using a disc attrition mill. Whole maize grains were soaked in water (1:3,w/v) at 28°C for 18 hours. The steep water was drained and the grain milled using a disc attrition mill (Agro Grinding Mill, No.2A, India) . Figures 2A & B are the flow diagrams for the processes.
Several formulations were prepared by the addition of weighed portions of dehulled and steamed cowpea flour to maize meal before fermentation. The resulting meal was kneaded into a 50% moisture dough, allowed to ferment at room temperature for a period of 1-3 days. Other blends were formulated by the addition of cowpea flours to the maize dough after fermentation. The preparations were dried in a oven at 65°C and milled into flour.
25

Fig. 2 Maize-cowpea blends prepared for analyses.
(a) Unsteamed CowpeaMAIZE
IcleanIsoak (16-18 hours)Imill
meal
26
hydrateImeal
(50% moisture)ferment
(1-3 days)
COWPEAclean
Isoak (4 mins)IdehullIoven dry (65°C)ImillIflour
oven dry (65°C) millIflour

27(b) Steamed Cowpea
MAIZEIclean
soak (16-18 hours) !mill
millIflour
COWPEAIcleanIsoak (4Idehull
mins)
mins)(65°C)

Design of Experiment
A 5x4x2x2 factorial experimental design was used. The variables under study were ;
a) cowpea level (0, 5, 10, 15 and 20%)b) fermentation time (0, 1, 2 and 3 days)c) steam treatmentd) fermentation method
Samples were evaluated for moisture, water absorption, protein, fat, ash and mono-, di- and oligosaccharides. Also evaluated was pH and acidity of the dough prior to dehydration.
3.2.2.3 Assessment of the Brookfield viscometer, a simple toolfor measuring the viscosity of cooked gruels and tocompare it to the Brabender viscoamylograph.
Whole maize grains are soaked in water (1:3,w/v) at 28°Cfor 24 hours and fermented for 4 8 hours (see 3.2.2.2)
Design of experiment
Viscosities of 6%, 8% and 10% (dry matter basis) slurries of the fermented and non-fermented flours prepared were determined on the Brookfield viscometer and Brabender viscoamylograph. The data was correlated and subjected to multiple regression analysis.
28

3.2.3 Chemical analyses
3.2.3.1 Determination of mono-,di- and oligosaccharides
Sugars were extracted from maize/ cowpea blends using a mixture of chloroform: methanol (l:l,v/v) and water as in Havel et al,1977. Extract was concentrated under vacuum, made to 5ml with de-ionized distilled water. The extract was filtered with 0.22m PTFE filters and stored in 5ml ampoules at a cold room temperature of 0°C. 10/xL samples were analyzed by HighPerformance Liquid Chromatography (HPLC) using a Hitachi system equipped with a Hewlett Packard integrator and Shimadzu refractive index detector. Separation was done on a 220 x 4.6mm amino propyl column (amino-spheri-5, Brownlee Labs, Santa Clara) eluted with a 70:30 v/v mixture of acetonitrile: water which contained 0.01% tetraethylene pfejitamine (TEPA) as recommended by Aitzemuller (1978) . Quantification was against authentic external standards of the sugars detected and a lactose internal standard.
3.2.3.2 Proximate analyses
The crude protein (N x 6.25), fat, and ash contents were determined by AACC methods 46-12, 30-20 and 08-03 respectively (AACC,1983).
29

3.2.3.3 Physico-chemical properties3.2.3.3.1 pH and Acidity
AACC (1983) method No. 02-31 was used with modification. Ten grams of the fresh dough samples was mixed with 100 mL of distilled water and allowed to stand for 3 0 minutes with intermittent mixing. The supernatant was collected and its pH measured. Ten mL aliquot of the filtrate was made up to 100 mL with distilled water and titrated against 0.IN NaOH to phenolphthalein end point. Titratable acidity was expressed as gram lactic acid per 100 g of dry sample. All determinations were performed in duplicate.
AOAC (1975) method No. 14.022 was used to determine the pH.
3.2.3.4 Functional Properties
3.2.3.4.1 Water AbsorptionThe method of Sosulski (1962) was used with modification.
Five grams of flour was mixed with 3 0g of water and allowed to stand for a period of 3 0 minutes. The suspension was centrifuged at 3000rpm for 20 minutes. The amount of water absorbed was measured as the increase in weight of the flour sample after all the supernatant had carefully been decanted. Results were reported on dry matter basis.
30

3.2.3.4.2 Cooked Paste Viscosity(a) Brabender Viscoamylograph CharacteristicsAACC method No, 22-10 (1983) was used with modifications.
The cooked paste viscosity and pasting characteristics of an 8% slurry (dry matter basis), of flour samples was determined by the use of the Brabender Viscoamylograph (Viskograph PT 100, Brabender Instrument Inc. Duisburg, West Germany) equipped with a 700cmg sensitivity cartridge. The weighed sample was mixed with water and made up to 500mL in a volumetric flask. The suspension was heated at the rate of 1.5°C / minute to 95°C, held at this temperature for 30 minutes, cooled at 1.5°C /minute at 50°C and held at this temperature for 30 minutes. The slurry was agitated at 75 rpm (bowl speed).
(b) Brookfield Viscosity Measurements
Viscosity measurements were made on 500ml portions of 6%, 8% and 1 0% (dry matter basis) slurries of flour samples by the use of the Brookfield viscometer (Model RVTB+). Each slurry was heated to 95°C, held at constant temperature for 30 minutes and then cooled to 50°C. Viscosity was measured at 95°C (initially and after holding for 30 minutes), 80°C, 70°C, 60°C and 50°C. Measurements were taken at four spindle speeds 10, 20, 30 and 50 rpm.
31

Viscosity profile indices : Pasting temperature, peakviscosity, viscosity at 95°C, viscosity after 30 minutes at 95°C, viscosity at 50°C, viscosity after 30 minutes at 50°C and maximum setback viscosity were measured from viscosity measurements taken on both viscometers.
3.2.4 Data Analysis
All the statistical analysis and graphical presentations were done using Statgraphics (Graphic Software System, STCC, Inc. USA) and Freelance softwares.
32

334.0 RESULTS AND DISCUSSION
4.1 Mothers' perceptions of quality attributes in a cowpea based infant weaning food
4.1.1 Background data on respondentsThe environment plays a great role in a child's growth and
health. Micro-environmental conditions such as livingconditions and sanitation have been implicated in the synergism of malnutrition and infection (Tomkins and Watson,1989). The influence of the macro-environment, including social, economic and cultural variables on child rearing practices is also well established. In addition, various maternal attributes have also been shown to be important in the aetiology of malnutrition (Subbulakslimi and Udipi,1990). Education is a key variable which in addition to women's decision making power, has been shown to influence their knowledge about food and health although the relationship to nutrition is not completely clear (Holmboe-Ottensen,1989).
A total of a hundred and thirty-two (132) mothers were interviewed. On the average, the respondents had a wide range of educational experience and also were from different walks of life. A tenth of the mothers had had no formal education (10.61%) whilst 63.64% had at least secondary level education (Fig.3). Those respondents who had technical, vocational or commercial training (13.64%) included secretaries, nurses.

34
Fig. 3 Educational background of the respondents
Tech/Voc/Com = Technical/ Vocational/Commercial


dressmakers and caterers. Literacy is an essential maternal attribute. This is because it enables the mother to respond to nutrition education and better understand the basic principles of infant nutrition. Nutrition education is essential for creating awareness of desirable weaning practices among mothers. It is important to note that most of the mothers interviewed were educated (ie. 89.4%); and were employed (82.6%). This means that a large number of the respondents were in the position to supplement the family income and respond to nutrition education. Mothers with a good understanding of proper child nutrition will be an important factor that could facilitate effective improvement of infant nutritional status.
35

The largest group of the respondents interviewed (45.5-s) were classified as traders (Table 3) . This number included food vendors, petty traders and wholesale traders. The unemployed respondents, the majority of which were housewives (91.3% of the unemployed were housewives), totalled 17.4% of the subject population whilst the percentage of mothers in government employment and private business were 13.6% and 22.7% respectively. Those in government employment included teachers, nurses, secretaries and receptionists. The self-employed or those employed by private organizations included hairdressers, seamstresses, caterers and teachers. The respondentsrepresented a cross-section of different status and socioeconomic class. The wide background of the sample is advantageous in that the information gathered will not only reflect the behaviour of views of one but rather a cross-section of socio-economic groups.
Table 3 Occupation of Respondents
36
Occupation No. of mothers Percentage of mothers
Traders 60 45.5Privately employed 30 2 2 .7Unemployed 23 17.4 |Government employed 18 13 .6
Student 1 0 . 8TOTAL 132 100

Some studies carried out, directly related the child's nutritional status to the income earned by the mother or father. A field study in Ghana revealed that even when both the father and the mother were employed, it was the income of the mother that made the most significant impact on the nutritional status of the children (Holmboe-Ottensen et al,1989).
The primary responsibility for child care lies with women. There are many variables that affect women's role and child care activities. These include constraints such as availability of money or level of income, time and energy that largely depend on her employment status and the socio-economic level of the household.
Seventy percent (70.0%) of the responding population had less than three children (Fig. 4). Whilst more than a third of the mothers had more than two children. More than half the mothers had a child that was less than a year old at the time of the interview, and therefore were in the position to give accurate information on everyday infant feeding practices.
Nearly forty percent (39.4%) of these children were below six months of age (Table 4) . The majority of mothers were young women (who had had only one or two children) and therefore would benefit from mother and child nutrition and health care education given at the public health centres. The illiterate mothers are bound to benefit too since the education is given in the local Ghanaian languages.
37

38
Fig. 4 Number of children born to each respondent

Number of Respondents

39Table 4 Age of youngest child
Age of last child Number of Respondents
Percentage of Respondents
Less than 1 month old 10 7.6Less than 2 months old 15 11.4Less than 3 months old 22 16.7Less than 6 months old 52 39.4Less than 12 months old 90 68 .2
Less than 18 months old 98 74 . 2Less than or equal to 24 months
107 81.1
Above 24 months of age 25 18.9
4.1.2 The use of cowpeas in infant food preparationCowpea is an important source of protein in Ghana. Its
consumption spans across different age groups. In the population study, 17.4% of mothers indicated that they fed cowpea to their children everyday (Table 5) and on the average, 72% of the mothers fed their children cowpeas at least once a week in a variety of different foods. The most popular dishes into which cowpea was used was rice and beans (Waakye) and beans and gari (Fig. 5). Apapransa was the least popular dish among the respondents. Other dishes fed to the infants into which cowpea was incorporated included banku, porridge, stews and soups, akasa and mpotompoto.

40
Fig. 5 Foods prepared at home with the incorporation of cowpeas

Num
ber
of R
espo
nden
ts
Stew Soup Mpotompoto Akara
_L Rice/Gari Porridge Banku Apapransa

41Table 5 Incorporation of cowpea into infant dietsFrequency per week Number of
mothersPercentage of mothers
0 37 28 . 01 17 12.92 17 12.93 27 20.44 9 5.85 1 0 . 8
6 1 0 . 8
7 23 17.4TOTAL 132 100
Mothers who did not feed cowpeas to their infants were thirty-seven in number (28%). One of the mothers who happened to be unemployed, indicated that cowpeas was too expensive whilst nine mothers believed that their infants were too young to be fed cowpeas in any form as they knew that cowpeas could cause gastric problems in young children. Nine of the mothers gave no reason for not offering cowpeas to their infants whilst four mothers said it was not safe for their infants since cowpeas was known to cause diarrhoea when fed to young children. Thirteen of the mothers said their infants rejected foods made with cowpeas. One mother preferred soybeans which had been recommended to her by a public health nurse.
The identification of diarrhoea, vomiting, abdominal pains and gas as side effects of cowpea consumption is in agreement with the reports of other workers (Hussain et al.1992: Wagner et al,1977) .

One possible contributing factor of abdominal discomfort and other symptoms that has been proposed is the co-existence of parasitic infection. Ascaris lumbricoides, a common intestinal parasitic infection of adults and children in the third world countries, produces an anti-enzyme polypeptide ascarase that neutralizes trypsin and chymotrypsin (Hussain et al,1992) thereby inhibiting digestion. The diarrhoea occurring after eating cowpeas may be due to an increase in stool water content caused both by hypersmolar effects of the products of fermentation of the non-digestible alpha-galactosides in the colon and by the generation of water in the fermentation.
The majority of the mothers responded positively to the use of a processed form of cowpeas and proposed various foods to which this product could be added (Fig 6) . The foods mothers proposed to incorporate cowpea flour into, were the same foods which they already prepared with cowpeas in the home (Figs. 5 &6) . Rice and beans, and Beans and gari were however not proposed for the obvious reason that the beans in these dishes remains whole after cooking and therefore using beans in a powdered form would be inappropriate. This also implies that cowpea flour could be used in the home without having to introduce new recipes. Majority of the mothers saw porridge as a potential food for the incorporation of cowpeas and this could increase the likelihood of the introduction of cowpeas into the diet of an infant in the home. A hundred and eighteen (89.4%) of the mothers said they would incorporate cowpeas into food
42

43
Fig. 6 Foods proposed to be suitable for the incorporation ofi cowpea flour

Num
ber
of R
espo
nden
ts
100
80
60
40
20
Stew Porridge Soup Banku Mpotompoto Apapransa Akara

44
given to their infants if it was in a powdered form. Only four of these mothers rejected the idea of a pre-cooked flour which could be incorporated into different foods eaten by infants in particular and the family as a whole. This resulted in a total of a hundred and twelve (84.8%) respondents who would welcome a pre-cooked and powdered form of cowpeas as a product on the market.
Pre-cooking cowpea is known to remove the undesirable beany flavour associated with cowpeas. Heat treatment can also reduce the levels of heat labile antinutrients such as enzyme inhibitors, oligosaccharides and improve the digestibility of protein in the legume. Therefore pre-cooking treatments such as steaming applied to cowpea prior to its processing into flour would facilitate the production of a product of improved nutritional value.
Nearly all of these mothers (96.4%), a hundred and eight in all, indicated a willingness to pay more money for a product of this nature, that is more than the equivalent weight of raw cowpeas would cost on the market.

Some of the mothers who did not feed cowpeas to their children in the home used industrial processed weaning foods including Vitalmix; a cereal/legume blend which has cowpea as one of its ingredients . This implies that some of the mothers who do not incorporate cowpeas into food given to their infants may be prepared to use it in the processed form as in proprietary weaning formulations. More than half of mothers fed proprietary foods to their infants during the weaning period. The products mentioned included Cerelac , Babeena and Vitalmix. These respondents indicated that these products were stored for a maximum of four weeks after the seal of the product was broken. A similar shelf-life period was indicated to be desirable for any proposed ready-to-eat infant formula by 95.8% of the mothers who responded positively to the idea of a processed cowpea flour being available* on the market. The remaining fifteen respondents opted for a longer lasting product.
4.1.3 Preferences indicated for various cereals in a cereal legume blend.
When asked which cereal they would prefer in a cowpea- cereal infant formulation, the mothers indicated a minimum of one and a maximum of three cereals. Ninety-two (92) of the mothers indicated maize; forty-five (45) indicated rice; nineteen (19) indicated millet; nine (9) indicated wheat and four (4) indicated sorghum (Fig. 7).
45

46
Fig. 7 Preferences indicated for various cereals in a cereal legume blend

Maize Rice Millet Wheat SorghumType of cereal

47
Maize was the popular choice since it is a staple that is grown widely in different parts of the country. Though rice is not widely cultivated in Ghana, it is imported and sold at a cheaper price than rice cultivated locally therefore it is affordable to a wider socio-economic group. Sorghum and millet were not popular choices probably because they are grown mainly in the north and are traditional staples for those who live in that region whereas maize is the cereal staple on which most traditional foods of both the northerners and southerners are based. The substitution of sorghum with maize for the production of cereal malt in the production of alcoholic beverages in the southern part of Ghana. Wheat is hardly grown in West Africa (Dako, 1983) and therefore not a common constituent of traditional foods.

48
4.1.4 Cowpea Variety Preferences indicated by respondentsColour is an important preference characteristic of cowpea
for farmers, traders and consumers (Dankyi,1993) . The main colours of the common varieties being white, red and brown. Generally the white variety of cowpeas (Ayiyi) was preferred by 65.1% of the respondents to the red (Ejura Red), brown (Asontem and Soronko) and black (Amantin) varieties. Only nine of the mothers interviewed had no preferences for a particular variety of cowpeas (Fig. 8). The white variety was preferred for its colour, taste,tendency to soften quickly and because it was readily available in the market all year around. Some of the mothers said its colour allowed its incorporation into other foods without altering the original colour or imparting some undesirable colour to the food. The brown, red and black varieties on the other hand, were believed by some mothers to be more nutritious and to have a low susceptibility to insect infestation. Koura (1976), reported that the insect,Callosobruchus maculatus, a well known, primary pest of cowpea in Ghana, preferred black-eye cowpea to other varieties.

49
Fig. 8 Cowpea variety preferences

Ayiyi 65.1%
Ejura red 13.7%Asontem 7.6%

Though the pigmented varieties are known to have tannins in their seed coats, some traditional processing methods commonly used in the preparation of cowpea eg soaking, dehulling, etc. are known to reduce the polyphenol level to some extent (Desphande et al, 1982).4.1.5 Characteristics mothers preferred in infant foods
formulationsSome of the mothers interviewed (44.7%) preferred infant
foods which had a light brown colour whilst others (46.2%) preferred milky coloured food (Fig 9). The remaining mothers had no colour preference for the weaning food they fed to their children. The majority of the mothers (84.8%) preferred to sweeten porridges that they fed to their infants. Most mothers used sugar whilst a few sweetened infant porridges with honey.Mothers who had very young infants preferred a weaning gruel of a light consistency. The reasons given include the need for infant to be able to ingest and digest the food easily. The older infants were given gruels of relatively medium to thick consistency to ensure satiety.
50

51
Fig. 9 Colour preferences for infant foods A = Light brown B = Cream C = No preference

A - Light brown B - Cream C - No prefernce

52
Though a few found this too inconvenient and time consuming a significant number, (90%) of the mothers preferred to prepare weaning porridge for their children from the basic ingredients if pre-cooked and/or partially cooked ingredients such as cowpea flour were available in the market. This response was however encouraging and suggested that the market existed for locally processed infant formulas in both ready-to- eat and semi-processed forms.
As many as 69% of the mothers fed their infants on traditional fermented maize dough porridge during the weaning period (Table 6) . This gave an indication that though convenience was an attribute desired in the choice of an infant formula, as many mothers would prepare weaning porridges from raw ingredients. Most mothers indicated that fermented maize dough porridge was easy to prepare and in their opinion, nutritious enough for infant feeding purposes. Reasons such as, the low cost of the ingredients in comparison to value added imported and locally made infant porridges and the need for variety in the diet were other reasons that were given. Above all, some respondents admitted that fermented maize dough porridge was a natural choice over other traditional preparations probably because it was a commonly used a weaning gruel and a popular breakfast food. Fermented cereal porridges are commonly eaten in the country and since maize is a popular staple grown in the Southern parts, fermented maize dough is

more popular whereas millet and sorghum gruels are more commonly eaten in the northern parts of Ghana.
53
Table 6 Reasons for feeding fermented maize dough porridge to their children
Reasons Number of Respondents
Percentage of Respondents
No Reason 42 31.8Low cost and Convenience
21 15.9
Child likes it 13 9.8Nutritious 10 7.6On advice from clinic 6 4 . 5Not applicable 40 30.3
TOTAL 132 100
Mothers who use proprietary weaning foods for their children were asked what motivated them to choose the particular food(s) they use currently. Mothers gave as many reasons as they wished (Table 7). Nutritional value and cost of the food were the most common answers received. The mothers who were illiterate explained nutritional value as the tendency of another child previously fed on that particular food to have gained weight and remained healthy. Some literate mothers said that when choosing a new brand of proprietary food, they compared the nutrition information on the package of the new brand to the one they were currently using. They selected the new one only if the nutrient content indicated was improved with respect to protein, vitamins and minerals. Convenience was also

a reason why mothers purchase proprietary weaning foods for their infants and the child's acceptance of the food,in some cases maintained its continued use.
54
Table 7 Motivating factors that control the purchase of proprietary weaning foods.
Reasons Number of RespondentsNutrient value 49Cost 43Convenience 15Expiry date 14Child likes it 9No reason 8Not Applicable 13
4.1.6 Sensory evaluation of some quality characteristics inweaning foods
Sensory evaluation was conducted with the mothers because they are the infant food purchasing population. It was aimed at finding out the mothers' perceptions of the infant foods texture, colour and consistency. Many biases due to the difference in the ages of the infants of the mothers evaluating the product for desirable consistency were noted. The respondents were given the opportunity to evaluate coded samples of a variety of proprietary infant foods- Cerelac, Nutrend, Babeena and Frisocreme (prepared for a six month old infant as directed on the package) and two traditional weaning porridges- fermented maize dough porridge (koko) and roasted maize flour

porridge (Tom brown) . Subjects were requested to arrange these samples in order of preference or degree of acceptability withrespect to texture, colour and consistency (one attribute at atime) . The porridges were given scores 1 to 6, 1 indicating the most preferred and six representing the least preferred porridge) and the average response to each sample wascalculated. Friedmann's tables was used to analyze the data.
Results of the sensory evaluation revealed that with respect to colour, Babeena and Frisocreme were the mostpreferred. Both infant formulas are milky in colour whilst cerelac the next preferred had a light brown colour. A significant dislike for the colour of fermented maize dough porridge, which was a popular gruel fed to infants of 69.7% of the mothers present, was indicated. This could mean that colour was not a major determinant in the mothers' choice of weaning food for their child. This is because more than two-thirds of the respondents fed a porridge to their infants whereas the same group of mothers expressed a significant dislike for its colour. Cost was probably a major factor as revealed earlier.
More mothers chose Frisocreme as a first choice in terms of texture, that is smoothness or particle size as reflected in the prepared mixture. Frisocreme made the smoothest porridge preferred. The more granular preparations such as Babeena and Roasted maize porridge were least preferred.
55

4.2 Effect of cereal malt on the viscosity of fermentedmaize dough
4.2.1 Product DescriptionThe products formulated were free flowing flours. Sorghum
malt imparted a reddish tinge to the fermented maize dough, whilst maize malt containing blends were slightly darker than fermented maize flour. The colour intensity of the blends increased with increasing malt concentrations. Millet malt did not have any visible effect on the colour of fermented maize dough.
4.2.2 Brabender Viscoamylograph viscosity indicesThe Brabender viscoamylograms present useful information
on the hot and cold paste viscosity characteristics of starch based foods.
The effectiveness of cereal malt in reducing bulk or increasing the caloric density of traditional fermented maize gruels, depends largely on the activity of the constituent amylases or on their potential to breakdown polysaccharides in the fermented maize dough. The effectiveness of sorghum, millet and maize malt incorporated into a 3-day fermented maize dough at 5% and 10% concentrations was investigated using the Brabender Viscoamylograph to measure the cooked paste characteristics of the fermented maize dough-cereal malt mixtures. The following indices were recorded for each sample: pasting temperature, peak viscosity, viscosity at 95°C and after
56

holding for 30 minutes (95°C-HOLD) and viscosity at 50°C and after holding for 20 minutes (50°C-HOLD).
4.2.2.1 Pasting temperaturePasting temperature is indicated by the temperature at
which the first detectable viscosity is measured by the amylograph. Pasting temperature was observed to decrease for fermented maize dough/millet malt blends when the sprouting time for millet malt was increased. This occurred both at 5% and 10% levels of malt concentration(Appendices 2,3 & 4). A similar trend was observed in maize malt containing blends at the 10% concentration.
Increasing the time allowed for sprouting in sorghum preparation, from 2 to 3 days increased the pasting temperature of the blend produced with the malt, however for the 4-day sprouted sorghum containing mixtures, pasting temperatures were observed to be relatively low.
Statistical analyses of the results indicated that the type of cereal sprouted and the time allowed for the sprouting, significantly affected (p s 0.05) the temperature at which the samples pasted (Table 8) . Significant interactions between the above factors indicated that the effect of the sprouting time allowed was dependent on the type of cereal malted.
57

Table 8 Significant F-values results for Analysis of Variance (ANOVA)
58
FACTORSPASTING
TEMPERATUREPEAK
VISCOSITYVISCOSITY AT 95°C
VISCOSITYAT 95°C-HOLD
VISCOSITY AT 50°C
VISCOSITY AT 50°C-HOLD
Sprouting time (S) 27.324 10.618 7.119Cereal type (C) 18.079 9.267 7.856 8 .351 56.099 25.637Maltconcentration(M) 11.305 5.134S x C 16.419S x M -C x M - - - 12.199 7.408
4.2.2.2 Peak viscosityThis index is linked to the ease of cooking of samples
analyses. It is measured as the highest value of viscosityattained by the slurry during the heating cycle (25°C-95°C).
Generally the presence of malt in the fermented maize dough/ cereal blends seemed to decrease the viscosities. Similar observations were made by Akpapunam and Sefa-Dedeh (1994) with fermented maize dough/maize malt blends. Peak viscosity attained by maize malt containing blends were relatively low (Appendices 2,3 &4). Analysis of variance(ANOVA) indicated that malts of different cereals had significant effect on the peak viscosity of fermented maize dough (Table 8).
4.2.2.3 Viscosity at 95°CThe viscosity of the samples at 95°C were equivalent to
their peak viscosities recorded for. For the blends containing 4-day millet, viscosities were drastically reduced from 320-

180BU and 100-40BU when the malt was incorporated at 5% and 10% levels respectively (Appendices 2,3 &4). Akpapunam and Sefa- Dedeh (1994) also reported the peak viscosity of fermented maize dough-maize malt blends to be equivalent to their viscosity measured at 95°C only after three days of fermentation.
ANOVA indicated that the type of cereal malted significantly affected (p s 0.05) the viscosity attained by the fermented maize dough/cereal malt mixture at 95°C (Table 8).
4.2.2.4 Viscosity at 95°C-HOLDThe viscosity attained by a sample after holding the
temperature constant at 95°C for 30 minutes (95°C-HOLD) gave an indication of the ease of breakdown of the cooked paste. The addition of cereal malt to fermented maize dough was observed to decrease the viscosity at 95°C-HOLD (Appendices 2,3 &4).Viscosity of fermented maize dough-cereal malt samples at 95°C- HOLD are presented in Fig. 10.
Millet malt containing blends had the lowest viscosity when the malt had been sprouted for 4 days whilst the 2-day and 3-day millet malt containing blends had relatively high viscosities. Maize malt sprouted for 3 days seems to produce a greater viscosity reduction effect on fermented maize dough as compared to the 2-day and 4-day sprouted maize preparations.
59

60
Fig. 10 Effect of sprouting time on the viscosity of ferments maize dough-cereal malt blends at 95°C-HOLD
A = 5% cereal malt concentration in maize dough B = 10% cereal malt concentration in maize dough
so = sorghum mi = millet mz = maize

Visc
osity
(B
U)
Germination time (days) Germination time (days)

4.2.2.5 Viscosity at 50°CViscosities measured at 50°C are most significant with
respect to the eating quality of weaning foods as they reflect the eating consistency of the product.
During the cooling cycle (95°C to 50°C), the consistency of the fermented maize dough-cereal malt thickened considerably but to a lesser extent as compared to that of fermented maize dough to which no malt had been added (Appendices 2,3 & 4) . The viscosities measured at 50°C for fermented maize dough/cereal malt mixtures are presented in Fig. 11.
When maize malt was incorporated into fermented maize dough at 5% level, the viscosity of the blend decreased. Sprouting for 2 days, 3 days and 4 days effected a percentage reduction of >50% in the viscosity of maize dough (Table 10). The viscosity reducing potential of of sorghum and millet was lowest for the 3 day sprouted samples. The 4 day sprouted samples had a greater viscosity reduction on maize dough (41% and 49.7% respectively) (Fig 11).
At 10% maize malt concentration in fermented maize dough, the activity of the malt appeared to decrease as sprouting was prolonged. The opposite trend was observed for the fermented maize dough-millet malt blends. The 4-day millet malt at 10% concentration in the blend drastically reduced the viscosity of the dough (86.9% reduction) (Table 9).
61

62
Fig. 11 Effect of sprouting time on the viscosity of fermented maize dough-cereal malt blends at 50°C
A = 5% cereal malt concentration in maize dough B = 10% cereal malt concentration in maize dough
so = sorghum mi = millet mz = maize
Visc
osity
(B
U)
Germination time (days) Germination time (days)

Sorghum malt containing blends were thicker than the blends containing millet or maize malt. This suggests that the amylases in sorghum were comparatively less active at this temperature.
Results of viscosity measurements taken at 50°C suggest that the effect of incorporation (at 5% concentration) of maize malt and (at 10% concentration) of maize malt and 4-day sprouted millet malt is most desirable (Tables 9-11) . These blends would produce weaning gruels of at least consistency and therefore high bulk density. The cereal malts under the above conditions produced more than fifty percent reduction in the viscosity of fermented maize dough.
Analysis of variance indicated that all the process variables; sprouting time, malt concentration and the type of cereal sprouted significantly affect the viscosity of the fermented maize dough/cereal malt blends at 50°C. Significant interaction between cereal type and malt level were indicated (Table 8).
63

Table 9 Effect of millet malts on cooked paste viscosity of fermented maize dough at 50°C and 50°C-HOLD
64
SPROUTING TIME LEVEL OF MALT VISCOSITY REDUCTION (%)(DAYS) (%) 50°C 50 °C-HOLD
2 5 34 .4 *3 12 .6 17.64 49.7 4.22 10 33 .3 *3 25.7 54 . 64 86 . 9 69.7
* - No reduction in Viscosity
Table 10 Effect of maize malts on Cooked Paste Viscosity offermented maize dough at 50°C and 50° C-HOLD
SPROUTING TIME LEVEL OF MALT VISCOSITY REDUCTION (%)(DAYS) (%) 50°C 50°C-HOLD2 5 56.3 12 . 63 60.1 49 . 64 60 . 6 27.72 10 57 .4 31.13 56.3 42 . 84 48 . 6 36 .1
Table 11 Effect of sorghum malts on Cooked Paste Viscosity offermented maize dough at 50°C and 50°C-HOLD
SPROUTING TIME LEVEL OF MALT VISCOSITY REDUCTION (%)(DAYS) (%) 50 °C 5Q°C-HOLD2 5 35.5 *3 18.3 *4 41. 0 *2 10 7 .1 *3 25 . 7 0 . 844 29 . 0 *
* No reduction in Viscosity

4.2.2.6 Viscosity at 50°C-HOLDThe viscosities of the blends were measured after keeping
the temperature constant at 50°C for 20 minutes (5Q°C-H0LD). During this holding period, viscosities of all the blends showed an increase in viscosity (Fig. 13, 14 & 15).
Blends that had 5% maize malt concentration had the lowest viscosities at this temperature. The viscosity reducing effect of the 2-day and the 4-day maize malts was lower than that of the 3-day malt (Table 10). Maize malt that had been sprouted for three days reduced the viscosity of maize dough by almost 50%. Prolonged sprouting appeared to decrease the viscosity of reducing potential of the maize malt. The effect of millet malt incorporated into fermented maize dough at 5% concentration followed a similar trend as maize malt though it showed a relatively lower viscosity reduction effect on the maize dough (Fig. 12).
Increasing the concentration of maize malt in the blends improved its viscosity reducing effect on fermented maize dough, except in the case of the 3-day sprouted maize. The viscosity of fermented maize dough-millet malt blends decreased drastically with prolonged sprouting of the millet (4-day sprouting) (Fig. 12) . The samples that had the lowestviscosities at this index were; at 10% malt concentration in fermented maize dough, the 3-day millet and maize malt containing blends and at 5% malt concentrations, the blends containing 3-day sprouted maize malt (Fig. 14 and 15) . At 50°C-
65

66
Fig. 12 Effect of sprouting time in the viscosity of fermented maize dough-cereal malt blends at 50°C-HOLD
A = 5% cereal malt concentration in maize dough B = 10% cereal malt concentration in maize dough
so = sorghum mi = millet mz = maize

Visc
osity
(B
U)
Germination time (days)

HOLD the effect of sorghum malt on fermented maize dough was greatly inhibited. Some of the fermented maize dough-sorghum malt blends were observed to be thicker than fermented maize dough.
Statistical analysis indicated that the viscosity of fermented maize dough/cereal malt mixtures at this index is significantly affected (p s 0.05) by the type of cereal sprouted, the time allowed for sprouting and the level of malt incorporation into the fermented maize dough. There was significant interaction between the level of malt and the type of cereal malted (Table 8).
4.2.3 Effect of cereal type on the pasting characteristicsof fermented maize dough-cereal malt blends
A closer look at a graphical representation of the amylograms of the fermented maize dough-cereal malt blends containing sorghum malt showed that in comparison with the malts of maize and millet, sorghum exerted a low viscosity reducing effect on fermented maize dough during the heating cycle (Figs. 13,14 & 15). During the cooling cycle viscosity of the blends increased and at 50°C, all the blends had a lower viscosity than fermented maize dough to which no malt had been added. On holding the temperature constant for 2 0 minutes some of the blends thickened to attain higher viscosities than fermented maize dough.(that is , at 50°C-HOLD).
67

68
Fig. 13 The effect of sprouted sorghum on the pasting characteristics of 3-day fermented maize dough
A = 5% cereal malt concentration in maize dough B = 10% cereal malt concentration in maize dough
2 = 2 days of sprouting 3 = 3 days of sprouting 4 = 4 days of sprouting c = control, no sprouting

Viscosity (Brabender Units)
Viscosity (Brabender Units)
>
□0

69
Fig. 14 The effect of sprouted maize on the pasting characteristics of 3-day fermented maize dough
A = 5% cereal malt concentration in maize dough B = 10% cereal malt concentration in maize dough
2 = 2 days of sprouting 3 = 3 days of sprouting 4 = 4 days of sprouting c = control, no sprouting

Viscosity (Brabender Units)
Viscosity (Brabender Units)
CD

70
Fig. 15 The effect of sprouted millet on the pasting characteristics of 3-day fermented maize dough
A = 5% cereal malt concentration in maize dough B = 10% cereal malt concentration in maize dough
2 = 2 days of sprouting 3 = 3 days of sprouting 4 = 4 days of sprouting c = control, no sprouting

Viscosity (Brabender Units)
Viscosity (Brabender Units)

Figure 14 shows that blending maize malt with fermented maize dough, lowered both hot and cold paste viscosities. Sprouting maize for 3 days resulted in the lowest viscosities (at both concentration levels of 5% and 10%). When fermented maize dough/maize malt blends were analyzed.
The incorporation of 4-day sprouted millet into fermented maize dough at 5% concentration was observed to result in high peak viscosity and a markedly low pasting temperature of 69.3°C (Fig. 15) . The addition of 10% malt to fermented dough resulted in a greater reduction in viscosity than 5% level of addition.
Statistical analysis of the viscosity indices measured indicated that the hot paste viscosities of the blends were significantly affected by the type of cereal malted (ie. peak viscosity, viscosity at 95°C and viscosity at 95°C-HOLD) whereas the viscosities at 50°C and 50°C-HOLD were significantly affected by all the three process variables investigated; type of cereal, concentration of malt in the blend and the time allowed for sprouting during malt preparation (Table 8). This gives an indication that the amylases in the different malts behaved differently at high and at low temperatures.
71

4.3 The effects of cowpea steaming and fermentation on thechemical and functional properties of maize-cowpea blends
4.3.1 Product DescriptionThe fermented maize-cowpea blends prepared were cream-
coloured flours. The blends which had been fermented appeared darker, with their intensity increasing with the duration of fermentation. However, cowpea addition had no visible effect on the colour of the blends.
4.3.2 Product compositionThe results show that cowpea had a high ash content, whilst
maize showed relatively higher fat content (Table 12).
Table 12 Chemical composition of cowpea and maize
_______________________________ cowpea__________ maize_____Moisture (%)2 7.6812 4.9854Protein (%)1'2 10.8935Crude fat (%)2 2.8634 3.8962Ash (%)2 3.7924 1.1637
1 N x 6.24 2 dry matter basis
4.3.3 pH and Acidity
The solid-state fermentation of maize dough had a drastic effect on pH. Within the first 24 h of fermentation the pH dropped from 6.3 to 4.0 (Fig. 16). After 72 h of fermentation the pH of the dough was 3.87. Fortification with up to 10% of unsteamed cowpeas yielded fermented dough with comparable pH as
72

73
Fig. 16 pH profiles: Effect of steam treatment and ooupEconcentration on the traditional lactic acid fermentation of maize dough
A = unsteamed cowpea-fortification at concentrations of 0 20%
B = steamed cowpea-fortif ication at concentrations of 0 - 20 %
5s = 5% steamed cowpea10s = 10% steamed cowpea15s = 15% steamed cowpea20s = 20% steamed cowpea

FERMENTATION TIME (h) FERMENTATION TIME (h)

the unfortified maize dough. Samples containing 15-20% cowpeas however showed a relatively high pH (Fig. 16). The proteins in the cowpeas may have contributed to the high pH.
Steaming of cowpeas prior to addition to maize appeared to promote fermentation (Fig. 16B). These samples had relatively lower pH than their unsteamed samples. Fortification up to 15% steamed cowpea provided samples with comparable pH as the 100% maize samples. The data suggests that maize may be fortified with cowpea up to 15% level and fermented to produce a dough of low pH.
Analysis of variance on the data showed that only fermentation time had a significant effect (p s 0.05) on dough pH. Duncan's multiple comparison tests indicated that the unfermented maize samples were distinctly different from the fermented samples. The samples fermented for 24 h were significantly different from those fermented for 72 h. The 48 h- fermented samples however compared favourably with the other two samples (Appendix 11).
74

75
The major carboxylic acids produced during the fermentation of maize dough have been identified as lactic, butyric, acetic and propionic acids (Plahar and Leung, 1982). The acidity of maize dough increased with fermentation. The addition of cowpea lowered the acidity of the maize dough (Fig.17). Steaming the cowpeas prior to addition to the maize lead to a higher production of acid during fermentation for 48 h. However, acidity dropped drastically during the final 24 hours of the fermentation period monitored (72 h) . Analysis of variance on the data showed that fermentation time had a significant (p < 0.05) effect on acidity. In addition the acidity level associated with each fermentation time was dependent on whether the cowpea has been steamed (Appendix 12).
The ability of the cowpea-fortified maize dough system to ferment and produce acids comparable to the traditional maize dough system is beneficial. Mensah et al. (1990) reported that the antimicrobial properties of fermented maize dough due to acids produced during fermentation. This was reported to reduce the incidence of diarrhoea in infants consuming fermented maize porridge. The cowpea-fortified maize dough will have two important attributes, (a) antimicrobial properties and (b) high protein content. This will make it useful in the formulation of weaning foods.

76
Fig, 17 Effect of addition of cowpeas on acid production;during traditional lactic acid fermentation of maize! doughA= unsteamed cowpea-fortification at concentrationsof!
0 20%B = steamed cowpea-fortification at concentrations of
0 20%5s = 5% steamed cowpea10s = 10% steamed cowpea15s = 15% steamed cowpea20s = 20% steamed cowpea

AC
IDIT
Y (%
)
5O10
15
20
0£g<:
FERMENTATION TIME (h) FERMENTATION TIME (h)

4.3.4.1 CowpeaXylose, fructose, glucose, galactose, sucrose, maltose,
raffinose and stachyose were determined in different concentrations in whole cowpea (Table 13). Dehulling lead to an increase in the concentration of all sugars except for maltose, glucose and galactose. This suggests that maltose,glucose/galactose are concentrated in the seed coat. Steam treatment of cowpeas lead to a decrease in almost all the sugars with the exception of sucrose, glucose and galactose.
The a-galactosides are known to constitute the major portion of sugars in legume seeds (Fleming, 1980), Stachyose was observed to be the major oligosaccharide, followed by raffinose in the cowpea samples as reported by other workers (Akpapunam and Markakis, 1979; Abdel-Gawad, 1992; Sosulski et al, 1982). The levels of stachyose and raffinose increased with dehulling. This observation was contrary to reports by other workers (Akinyele and Akinlosotu, 1991) who detected a decrease in oligosaccharide levels after dehulling cowpea seeds. The longer pre-soaking period of 4 hours allowed in their experiment may have facilitated leaching or initiated the process of fermentation in the seed resulting in Q!-galactosidase activity on the oligosaccharides.
774.3.4 Sugars and oligosaccharides

Table 13 Levels of mono-, di-, ologosaccharides determined in cowpea (Vigna unguiculata) samples (mg/lOOg dry matter)
78
COWPEASAMPLES XYLOSE FRUCTOSE
GLUC0SE+GALACTOSE SUCROSE MALTOSE RAFFINOSE STACHYOSE
WHOLE 0.380 0.012 0.337 1.652 0 .118 0.552 2.545DEHULLED 0.612 0.436 0 1.828 0.051 0.630 3 .661DEHULLED& STEAMED 0 .332 0.068 0 .028 2.034 0.039 0.234 3 .340
4.3.4.2 Maize
Maize was observed to have high concentrations of glucose and galactose. Other sugars detected in the maize were xylose and fructose (Table 14) . The effects of fermentation on the concentration of the sugars varied. During the first 24 hours of fermentation, the concentration of fructose and glucose and galactose decreased. Xylose and maltose however showed a slight increase in concentration. Further fermentation for 24 h showed an increase in all the sugars except xylose, fermentation for 72 h showed a drastic reduction in the concentration of glucose/galactose and maltose (Table 14) . The levels of maltose, glucose and galactose appeared to increase during the first 48 hours of fermentation and then drop drastically after 72 hours. Sucrose, raffinose, and stachyose were not detected in the maize samples.Table 14 Levels of mono- and disaccharides as determined in
maize (zea mays) samples (mg/lOOg dry matter)
MAIZE SAMPLES GLUCOSE +FERMENTATION TIME/HRS XYLOSE FRUCTOSE GALACTOSE MALTOSE
0 0.705 1.093 9.636 0.21024 0.788 0.678 9 . 566 0.27748 0.481 0 .690 10.213 0 .43872 0.473 0 .597 1. 056 0.140

4.3.4.3 Fermented Maize-Cowpea Blends4.3.4.3.1 Co-fermentation
Fermented maize and cowpea blends showed varied effects of process variables on sugar and oligosaccharide concentration. In the system in which cowpea was co-fermented with maize (Figs. 18 & 19) the effects of process variables on xylose concentration was not conclusive. Xylose was derived from both the maize and cowpeas. The co-fermentation of maize with steamed cowpeas (10,15 and 20%) appeared to increase the xylose concentration (Figs. 19 B,C & D) up to 48 h of fermentation after which a decrease was observed. The system containing unsteamed cowpeas however showed a consistent decrease in xylose concentration with the 20% cowpea-fortified system (Fig. 18D) . The sugars which are derived solely from cowpeas; sucrose, raffinose and stachyose seemed to be affected by fermentation. A general decrease with fermentation and complete removal were observed. The sugars predominantly from maize, i.e glucose/galactose (Fig.20), maltose and fructose (Fig.18 & 19) showed a general reduction with fermentation. Steaming of the cowpeas appeared to assist this reduction.
79

80
Fig. 18 Effect of fermentation on the sugar levels in co- fermented maize-cowpea blends
A = 5% unsteamed cowpea B = 10% unsteamed cowpea C = 15% unsteamed cowpea D = 20% unsteamed cowpea

Con
cent
ratra
tion
mg/
100g
sa
mpl
e C
once
ntra
tion
mg/
100g
sa
mpl
e
Xylose Fructose Sucrose Maltose Raffinose Stachyose
Sugars
Sugars
Sugars
Sugars

81
Fig. 19 Effect of fermentation on the sugar levels fermented maize-cowpea blends
A = 5% steamed cowpea B = 10% steamed cowpea C = 15% steamed cowpea D = 2 0% steamed cowpea
in co-

Con
cent
ratra
Uon
m
g/10
0g
sam
ple
Con
oenl
rallo
n m
g/10
0g
sam
ple
Xylose Fructose Sucrose Maltose Raffinose Stachyose
Sugars
Xylose Fructose Sucrose Maltose Raffinose Stachyose
Sugars
Xylose Fructose Sucrose Maltose Raffinose Stachyose
Sugars
Sugars

82
Fig. 20 Effect of fermentation on glucose concentration in co fermented maize-cowpea blends
A = unsteamed cowpea-fortified blends B = steamed cowpea-fortified blends

Cowpea
concentration (%
dry m
atter) Cow
pea concentration
(%
Concentration mg/100g sample
O N> CT> 0 0 O
301ra
Concentration mg/100g sample

83
4.3.4.3.2 Blend after maize fermentationThis system showed an interesting trend. Sugars such as
sucrose, raffinose and stachyose derived solely from cowpeas showed great reduction in concentration with fermentation time (Fig.21 & 22). This reduction was more pronounced in the 5, 10 and 15% cowpea-fortified fermented maize system. Apart from xylose, all other sugars i.e. glucose/galactose (Fig.23), fructose and maltose showed a general reduction with process variables. The data suggest that the fermented maize dough with its 50-55% moisture is an important media for the reduction of sugars and oligosaccharides derived from cowpeas. It is proposed that the reactions involving the sugars and oligosaccharides from cowpeas may have occurred from the time of mixing with the fermented maize dough to the early part of drying at 65°C.
The data from the two fermented maize-cowpea systems was subjected to analysis of variance. Table 15 is a summary of the significant F-values from the analysis. Xylose was not affected by any of the process variables. Fermentation time had a significant effect on fructose, glucose/galactose, maltose, raffinose and stachyose concentrations (Table 15). The level of cowpeas in the blend affected the glucose/galactose and stachyose concentrations. Steam treatment affected only the maltose concentration. Significant interactions were found between fermentation time and all other process variables.
84
Fig. 21 Effect of fermentation on the sugar fermented maize-cowpea blends
A = 5% unsteamed cowpea B = 10% unsteamed cowpea C = 15% unsteamed cowpea D = 20% unsteamed cowpea
levels U

Con
cent
ratra
tlon
mg/
100g
sa
mpl
e C
once
ntra
tion
mg/
100g
sa
mpl
e
Xylose Fructose Sucrose Maltose Raffinose Stachyose Sugars
Xylose Fructose Sucrose Maltose Raffinose Stachyose
Sugars
Sugars
Sugars

85
Fig. 22 Effect of fermentation on the sugar fermented maize-cowpea blends
A = 5% steamed cowpea B = 10% steamed cowpea C = 15% steamed cowpea D = 2 0% steamed cowpea
levels ini

Con
cent
ratra
tion
mg/
100g
sa
mpl
e C
once
ntra
tion
mg/
100g
sa
mpl
e

86
Fig. 23 Effect of fermentation on glucose concentration on. fermented maize-cowpea blends
A = unsteamed cowpea-fortified blends B = steamed cowpea-fortified blends

Cow
pea concentration
(% dry
matter)
Cowpea
concentration (%
Concentration mg/100g sample
o r o - f ^ o o o o r o - ^
Concentration mg/1 OOg sample

Table 15. Table of significant f-values87
PROCESSVARIABLES Fructose
Glucose + Galactose maltose Raffinose Stachyose
Fermentation time Fortification level Steam treatment
43.079 48.9724.074
3 .501 5.400
5.142 20.37210.453
Fermentation time x Fortification level Fermentation time x Steam Treatment Fermentation time x Method of Fermentation Steam x Method of fermentation
2.7674.651
4 .278
3 .746 7.025
3 .7533 .262
9.392
4.3.5 Water Absorption CapacityProcess treatments of raw material are known to affect
their hydration properties (Phillips et al, 1988) . Water absorption capacity was measured at room temperature (2 6°C) to determine the behaviour of the cereal-legume flours in cold water. This is an important index which can give valuable information on the behaviour of the blend during processing.
Addition of cowpea improved the water absorption potential of fermented maize dough (Appendix 18). This was probably due to the influence of added protein in the blends. Proteins are mainly responsible for the bulk of water uptake and to a lesser extent the starch and cellulose at room temperature. Sefa-Dedeh and Osei (1994) made similar observations on a cowpea fortified fermented maize dough system.
Steam treatment of cowpeas was observed to increase its water absorption capacity from 166.8349% 221.9613%.
For the unfermented and 24-hour fermented maize-cowpea blends, steam treatment of cowpea seemed to cause a decrease in water absorption potential. However, after 48 hours and 72 hours

of fermentation the steamed cowpea fortified blends had higher water absorption capacities. Sefa-Dedeh and Demuyarko (1994) reported that steamed cowpea flour possessed better water absorption than raw cowpea flour.
The gelatinization of starch and the denaturation of protein that is the result of the application of heat treatment to cowpeas has been suggested to improve the water imbibing capacity of cowpea and mung bean proteins (Abbey and Ibeh, 1988; del Rosario and Flores, 1981).
Analysis of Variance indicated that cowpea fortification level and the method of fermentation applied significantly affected the water absorption capacity of the blends. The effects of steaming the cowpeas prior to its incorporation into the maize dough was not statistically significant (Table 16).
88
Table 16 Anova summary table for water absorptioncapacities of cowpea-maize dough blends
Source of Variation SS df MS F-ratio
MAIN EFFECTS 2240.6534 6 373.44223 5.891
replication 17.4044 1 17 .40437 0.275cowpea level 1290.4169 3 430.13897 6.786*steam treatment 0.5816 1 0.58164 . 009mode of fermentation 937.1160 1 937.11597 14.783*Residual 7607.7652 120 63 .389710TOTAL CORR. 9847.4186 126

4.4 The use of the Brookfield viscometer to measure the viscosity of cooked gruels and its comparison with the Brabender viscoamylograph.The Brabender viscoamylograph and the Brookfield viscometer
were used to determine the viscosity of the reconstitutedfermented maize flours at concentrations of 6%, 8% and 10%. Viscosity measurements taken by the use of the Brabenderviscoamylograph was observed to correlate significantly with viscosity measurements made on the same samples using the Brookfield viscometer at various spindle speeds (10, 20 and50rpm). Regression models were developed to predict the Brabender viscosity of the samples. From the coefficient dependent variables; concentration, time and brookfield viscosities determined at the various spindle speeds.Coefficients of the variables in the models and their contribution to the observed response variabilities were summarized in Appendix 26.
Analysis of variance indicated that the concentration of the flour had a significant effect ( psO.05) on viscositymeasurements made using both instruments. The effect of temperature was not statistically significant.
4.4.1 Apparent Viscosity determined at 10 rpmThe model developed to predict viscosity (In Brabender
units) at a spindle speed of 10 rpm could explain 95.32% of the variation in the viscosity (Appendix 26). The quadratic effect
89

of concentration was the most dominant variable, contributing 54.54% of the variation. The other critical variables were the temperature and the interaction between temperature and brookfield viscosity which contributed 18.98% and 21.80% respectively. Response surface plots of the model showing the relationship between brabender viscosity and brookfield viscosity are shown in figures 24 & 25.
At all solid concentrations brabender viscosity increased linearly with increasing brookfield viscosity (Fig. 24). For the same model, when solids concentration was constant at 6% (Fig. 25A and 10% (Fig. 25B) , the surface plots showed that slurry temperature did not seem to have any effect on brabender viscosities. However, at higher brookfield viscosities, increasing the slurry temperature increased the brabender viscosity (Fig. 25A & B). This suggests that Brookfieldviscometer is more sensitive than the brabender amylographs for the measurement of viscosity at low temperatures.
90

91
Fig. 24 Models to predict Brabender viscosity from Brookfield viscosity at lOrpm, temperature and concentration of maize slurriesA = Temperature of 95°CB = Temperature of 50°CRegression equation:
Z = 54.964716 - 2.501844X! + 2 .170264X22 +4.206249E-6 X 3X 3
Z = Brabender viscosityXx = TemperatureX2 = ConcentrationX3 = Brookfield viscosityR2 = 0.953278

so,IM ^
SOL-XO330HCEHTRATXOH C/O
CcP')

92
Fig. 25 Models to predict Brabender viscosity from Brookfield viscosity at lOrpm, temperature and concentration of maize slurriesA = Concentration of 6%B = Concentration of 10%Regression equation:
Z = 54.964716 - 2.501844Xx + 2.170264X% +4.206249E-6X1X3
Z = Brabender viscosity= Temperature
X2 = ConcentrationX3 = Brookfield viscosityR2 = 0.953278

/*»%
c 9^


93
4.4.2 Apparent Viscosity determined at 20 rpmAt 2 0 rpm spindle speed , regression analysis of the
process variables and viscosity measurements gave a model which could explain 95.35% of the variations in viscosity measurements.
The variables contributing most to the R2 was the quadratic effect of concentration (54.54%) and the interaction between temperature and brookfield viscosity (40.35%). Interaction between concentration and brookfield viscosity also contributed 0.46% to the model.
Response surface plots based on the model (Figs. 26 & 27) showed that at both high and low temperatures (50 - 95°C) the was a linear relationship between brookfield and brabender viscosities. The effect of temperature on brabender viscosity was dependent on the brookfield viscosity (Fig.27) . At low viscosities, solid concentrations seemed to have little effect on viscosities measures,(Fig.26) however as the sample solid concentration was increased, brabender viscosity was observed to be dependent on brookfield viscosities.
This implied that brookfield viscometer is more sensitive to changes in viscosity at lower temperatures and less sensitive to viscosity changes at low concentrations as compared to the brabender visco-amylograph.

94
Fig. 26 Models to predict Brabender viscosity from Brookfield viscosity at 20rpm, temperature and concentration of maize slurriesA = Temperature of 95°CB = Temperature of 50°CRegression equation:
Z = -16.932988 + 1.407992X% +0.000026X^3 -0.000035X2X3
Z = Brabender viscosityXx = TemperatureX2 = ConcentrationX3 = Brookfield viscosityR2 = 0.953558

3ani«a3dW3X
T>
(000
0f
'*•'
)

95
Fig. 27 Models to predict Brabender viscosity from Brookfield viscosity at 20rpm, temperature and concentration of maize slurriesA = Concentration of 6%B = Concentration of 10%Regression equation:
Z = -16.932988 + 1.407992X22 +0.000026X^3 -0 .000035X2X3
Z = Brabender viscosityXx = TemperatureX2 = ConcentrationX3 = Brookfield viscosityR2 = 0.953558

cd31
[0 °0 so*nOS
*■>
c-/.->,0 °° sox-nos
*•>

96
4.4.3 Apparent viscosity determined at 50 rpmThe regression model developed to predict viscosity
(Brabender units) from concentration temperature and viscosity measurements taken at 50 rpm could explain 98.32 % of thevariation. Brookfield viscosity was the most important variable contributing 92.49% to the R2- Other critical variables were the linear and quadratic effect of temperature and the interaction between brookfield viscosity and the process variable.
Response surface plots made from the model (Figs. 28 & 29) show a linear relationship between the viscosity measurement from both instrument. The effect of temperature and concentration on the brookfield and brabender viscosities was similar to that observed when brookfield viscosity measurements were taken at 2 0 rpm.
The results suggest that in spite of the difference in sensitivity there is a high correlation (R = 0.8451 0.9597)between the viscosity measuring instruments. Therefore the brookfield viscometer which can be used to determine viscosity of smaller quantities of sample within a shorter time can be used to a high degree of accuracy.

97
Fig. 28 Models to predict Brabender viscosity from Brookfield viscosity at 50rpm, temperature and concentration of maize slurriesA = Temperature of 95°CB = Temperature of 50°CRegression equation:
Z = 1164.386945 + 0.004312X3 - 57.189164X! +0.704201X21 + 0.000191X^3 - 0 .000808X2X3
Z = Brabender viscosityX-l = TemperatureX2 = ConcentrationX3 = Brookfield viscosityR2 = 0.983238


98
Fig. 2 9 Models to predict Brabender viscosity from BrookfieJeviscosity at 50rpm, temperature and concentration @1 maize slurriesA = Concentration of 6%B = Concentration of 10%Regression equation:
Z = 1164.386945 + 0.004312X3 - 57.189164XJ +0.704201X2! + 0.000191X^3 - 0 .000808X2X3
Z = Brabender viscosityX-l = TemperatureX2 = ConcentrationX3 = Brookfield viscosityR2 = 0.983238
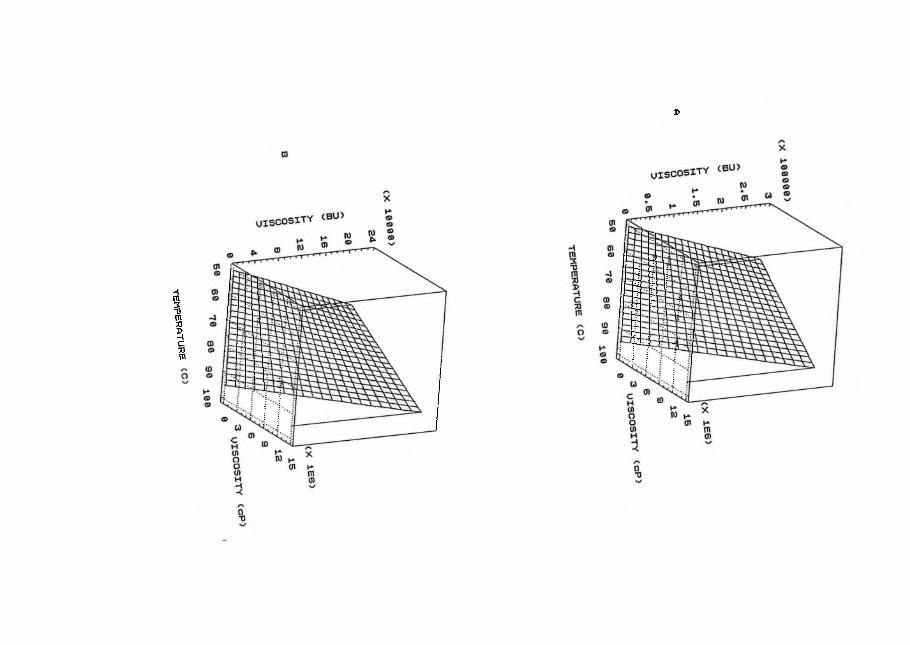
3anJ-
WM3dW
3J-
V

CONCLUSIONThough ctonvenience is one of the factors that motivates mothers to purchase proprietary weaning foods, many mothers (%) prepared infant weaning porridges from raw ingredients eg. fermented maize dough. Majority of the mothers ( >80%) were willing to incorporate raw or pre-cooked cowpea flour into foods prepared in the home for their infants and the rest of the family if such a product was available on the market. Among the many foods proposed, porridge was the most popular. It was observed that some of the mothers interviewed who were unwilling to introduce cowpeas into their infants diet, were feeding their infants proprietary weaning foods that contained some amount of cowpea (probably unknown to them) eg Vitalmix. These responses imply that a cowpea-cereal blend or cowpea flour product would find Market if it can be made to meet the expectations of the average mother.
Nutritional value and cost were the major contributory factors that motivated mothers to pourchase a particular brand of infant formulation. The high protein content of the improved varieties of cowpeas and the relatively low cost of plant protein sources, would facilitate the production of a low-cost, but nutritious infant formulation.

1 0 0
3. Quality characteristics of infant porridges such as consistency, texture and colour varied widely. the consistency desired depended on the age of the infant. The mothers primary concerns were to enable the child to swallow the food easily and to ensure satiety. A wide variety of textures was acceptable to mothers; grainy and rough to smooth, acceptable colour ranged from milky to brown. Colour was not a major factor that controlled the mothers choice of a weaning food. This is because mothers expressed a significant dislike for the colour of fermentedmaize.dough porridge which was currently being used by more
i -t-ha c. Ninety percent ( > 90%) of the mothers in feeding \ •their infants.
4. The use of cereal malt can effectively decrease the viscosity of fermented maize dough. The addition of malt after the fermentation of the maize dough allows the action of the amylase to overcome the viscosity increasing effect of fermentation in cereals. Millet malt and maize malt markedly reduced the viscosity of fermented maize dough at 5% and 10% concentrations, the effect of the amylases increased with increasing sprouting time allowed.
5. Fermentation and steam treatment of cowpeas may be used to produce high-protein blends with reduced anti-nutritional

factors without a significant change in the pH and acidity profiles of the raw material (Fermented maize dough).
In spite of the difference in sensitivity of the Brookfield viscometer and the Brabender viscoamylograph, extremes of solids concentration and temperature, there was high correlation between the viscosity measurements taken by both instruments. The high R2 derived from the regression models developed to predict Brabender viscosity from Brookfield viscosities at various spindle speeds implies that the Brookfield viscometer may be used to measure viscosity to a high degree of precision. This is of advantage as the Brookfield viscometer can be used to measure small amounts of sample and also instantaneous viscosity measurements may be made under a particular condition. However the Brabender amylograph is programmed to measure over a prescribed time setting. Both instruments have their uses and may be ideal for use in different situations.

RECOMMENDATIONS1. There is need to carry out tests on the cowpea- maize
blends to determine the occurrence of off-flavours and/or toxic compounds that may have been formed duringco-fermentation of the maize-cowpea mixtures.
2. A study of the pasting characteristics of the fermented maize-cowpea blends after the addition of maize/millet malt would yield valuable information.
3. There is also the need to carry out microbiological studies to ascertain the effect of cowpea and cereal malt on the anti-microbial properties of fermented maize dough and fermented maize dough porridge.
4. Further work needs to be done to find out the factors that affect or control the mechanism of breakdown or release of sugars during fermentation in the maize-cowpea system.
The above recommendations for further study would facilitate the development of a safe, nutritious, low-cost infant formulation by the use of traditional technologies. This would improve the utilization of cowpeas, especially in infant feeding. This, with more studies could be used as an intervention to curb Protein Energy Malnutrition in children in the rural areas.
102

REFERENCESAbbey, B. W. and Ibeh, G. O. 1988. Functional properties of raw
and heat processed cowpea (Vigna unguiculata, Walp.) flour. J. Food Sci. 53:1775-1777.
Abdel-Gawad, A. S. 1992. Effect of domestic processing on oligosaccharide content of some dry legume seeds. Food Chemistry 46:25-30.
ACC/SCN 1988. Malnutrition and Infection, a Review by Tomkins, A. and Watson, F. ACC/SCN, October, 1988.
Aitzetmuller, K. 1978. Sugar analysis by High Performance Liquid Chromatography using silica columns. J .Chromatogr. 156:354-358.
Akinrele, I. A. 1970. Fermentation Studies on maize during the preparation of traditional African Starch-cake food. J.Sci. Food Agric. 21:619.
Akinrele, I. A. and Bassir, O. 1967. The nutritive value of Ogi, a Nigerian infant food. Journal of Tropical Medicine and Hygiene. 70:279-280
103

Akinyele, I. O. and Akinlosotu, A. 1991. Effects of Soaking, Dehulling) and Fermentation on the oligosaccharides and nutrient content of cowpeas (Vigna unguiculata) . Food Chemistry 41:43-53.
Akpapunam, M. A and Markakis, P. 1981. Physicochemical and Nutritional Aspects of cowpea flour. J. Food Sci. 46(3):972-973.
Akpapunam, M. A. and Sefa-Dedeh,S. 1994. Traditional lacticacid fermentation, malt addition and quality development in maize-cowpea weaning blends. Food Nutr. Bull. In Press.
Approved Methods of the American Association of Cereal Chemists (AACC), 8th Edition 1983 (Containing Annual Supplements 1984-1990)
Ashworth, A. and Draper, A. 1992. The potential of traditional technologies for increasing the energy density of weaning foods. A Critical Review of existing knowledge with particular reference to malting and fermentation. WHO/CDD/EDP/92.4.
Association of Official Analytical Chemists (AOAC), (1975).Official Methods of Analysis, 12th Edition. Washington, D.C.
104

Barampama, Z. and Simard, R. E. 1994. Oligosaccharides, anti- nutritional factors and protein digestibility on dry beans as affected by processing. J.Food Sci. 59 (4) :833-838.
Bourne, M. C. 1982. Food Texture and Viscosity: Concept and Measurement. Academic Press.
Bressani, R and Elias, L. G. 1983. Guidelines for the development of Processed and Packaged weaning foods. Food Nutrition Bulletin, Vol. 5 No. 3.
Bressani, R. and Elias, L. G. 1980. Nutritional value of Legume crops for Humans. In Summerfield,R.J. and Bunting,A.H. eds.,Advances in legume science, London, UK.
Bressani.R. 1985. Nutritive value of cowpea. In cowpea Research,Production and Utilization. Ed. Singh,S.R. and Rachie,K.O., John Wiley and sons Ltd.
Bressani, R. 1993. Grain quality of beans. Food Reviews International.9(2):237-297.
Brown, K. H. 1991. The importance of Dietary quality versus quantity for weanlings in the developed countries: AFramework for Discussion. Food Nutr.Bull.13 (2) :86-93 .
105

Cameron, N. and Hofvander, Y. 1971. Manual on feeding infants and young children. Advisory Group of the UN Systems.
Dako, D. Y. 1983. Cereal Utilization in West Africa. Proc. Int. Assoc. Cereal Chem. Symp. Amino Acid Compn. and Biol. Value of Cereal Proteins. Budapest, Hungary. (Ed) R.Lsaztity and N. Hidvegi.
Deffenbaugh, L. B and Walker, C. E. 1989. Comparison of starch pasting properties in the Brabender Viscoamylograph and the Rapid Visco-analyzer. Cereal Chem. 66 (6) :493-499.
del Rosario, R. R. and Flores, D. M. 1981. Functional properties of four types of mung bean flour. J. Sci. Food Agric, 32: 175-180.
Desikacher, H. S. R. 198 0. Development of weaning foods with high caloric density and low paste viscosity using traditional technologies. Food Nutr. Bull. 2(4):21
Desphande, S. S., Sathe, S. K., Salunkhe, D. K. and Cornforth, D. P. 1982. Effects of dehulling of phytic acid, polyphenols and enzyme inhibitors of dry beans (Phaseolus vulgaris L.). J.Food Sci.47:1846-1850.
106

Duszkiewicz-Reinhard, W., Gujska, E. and Khan, K. 1994, Reduction of Stachyose in legume flours by lactic acid bacteria. J.FoodSci. 59 (1) :115-117.
El-Faki, H. A, Bhavanishangar, T. N. and Tharanathan, R. N. 1983. Flatus effects of Chick pea (Cicer arietinum) , Cowpea (Vigna sinensis) and Horse gram (Dolichos biflorus) and their isolated carbohydrate fractions. Nutrition Reports International 27 (5) :921-929.
Elias, L. G. , de Fernandez, and D. G. , Bressani, R. 1979. Possible effects of seed coat polyphenolics on the nutritional quality of bean products. J.Food Sci. 44:524- 527.
FAO/WHO/ONTJ 1985. Energy and Protein requirements. Technical Report Series No. 724.
Fleming, S. E. 1980. Measurement of hydrogen production in the rat as an indicator of flatulence activity. J.Food Sci.45:1012-1018.
Gopaldas, T., Mehta, P., Patil, A. and Ghandhi, H. 1986. Studies on reduction in viscosity of thick rice gruels with small quantities of an amylase-rich cereal malt. Food and Nutr. Bull. 8:42-47.
107

Gopaldas, T., Desphande, S. and John, C. 1988. Studies on a wheat-based amylase rich food. Food Nutr. Bull. 10(3) :55- 59.
Hansen, M. , Pedersen, B., Munck, L. and Eggum, B.O. 1989. Weaning foods with improved energy and nutrient density prepared from germinated cereals. 1. Preparation and dietary bulk of gruels based on barley. Food Nutr. Bull. 11(2):40-44.
Havel, E., Tweeten, T. N., Seib, P. A, Wetzel, D. L. and Liang, Y. T. 1977. Oligosaccharides released during hydration of textured Soy -as determined by High Performance Liquid Chromatography. J.Food Sci 42 (3) : 666-668.
Holmboe-Ottesen, G. , Mascarenhas, O. and Wandel, M. 1989. Women's role in Food Chain Activities and the Implications for Nutrition. United Nations Administrative Committee on Co-ordination- subcommittee on Nutrition. ACC/SCN State- of-the-Art Series. Nutrition Policy Discussion Paper No.4.
Hussain, M. A., Akinyele, I. O. and Omololu, A. 1992. Maternal perceptions of gastro-intestinal problems in the feeding of cowpeas (Vigna unguiculata) to young children in rural Ibadan, Nigeria. Food Nutr Bull.14(1):55-58.
108

Improving the Nutritional Status of children during the weaning period. 1984., ed. Mitzner, K. Scrimshaw, N. Noiigan, R. A manual for policy makers, program planners and field workers.
Jansen, G. K. 1992. Centrally processed weaning foods for use in developing countries. Food Reviews International 8(3): 3 07-345. Marcel and Dekker Inc.
Jellinek, G. 1985. Sensory Evaluation of Food. Theory and Practice. International Publishers in Science and Technology.
Koura, A., El-Halfway, N., Sheheta, T. and Darkal, W. 1976.Preference of Cowpea weevil, C. maculatus (F) to some legume seed and weight loss due to the insect infestation.
Liener, I. E. 1975. Effect of anti-nutritional factors on the quality and utilization of legume protein. In Protein Nutritional Quality of Foods and Feeds, ed. Friedman M. Marcell Dekker, Inc., New York
Ljungqvist, B. G., Mellander, 0. and Svanberg, U. 1981. Dietary bulk as a limiting factor for nutrient intake in pre-school children. A problem description. J.Trop. Pediatr. 27: 68- 73 .
109

Lopez, Y. , Gordon, D. T. and Fields, M. L. 1983. Release of Phosphorus from phytate by natural lactic acid fermentation. J.Food Sci. 48:953-954.
Maeda, E. E., Sule, C. N. and Samuel, M. J. 1991. Effect of sprouting on bean nutritional quality. In Development of high protein-energy foods from grain legumes, ed.Sefa- Dedeh, S. Proceedings of an International Workshop, University of Ghana.
Malleshi, N. G. , Daodu, M. A. and Chandrasekhar, A. 1989. Development of weaning food formulations based on malting and roller drying of sorghum and cowpea. International J. of Food Sci. and Technology 24(5) : 519.
Malleshi, N. G. and Desikachar, H. S. R. 1986. Studies on comparative malting characteristics of some tropical cereals and millets. J.Inst.Brew.92:175-176.
Marero, L. N., Payumo, E. N., Aguinaldo, A. R. and Homma, S. 1980. Malto-oligosaccharide composition of flours, weaning foods and gruels prepared from germinated rice, corn, mungbean and cowpea. J. Nutr. Sci. and Vitaminology, 36(1): 55-64.
110

Marero, L. M., Payumo, E. M., Librando, E. C., Lainez, W. N. Gopez, M. D. and Homma, S. 1988. Technology of Weaning Food Formulations prepared from germinated cereals. J.Food Sci.1391-1395.
McWatters, K. H. 1985. Functionality of cowpea meal and flour in selected foods. Cowpea Research, Production and Utilization.ed. Singh,R.K. and Rachie,K.O. John Wiley & Sons Ltd.
Mensah, E. 0. and Sefa-Dedeh, S. 1991. Traditional food processing technology and high protein food production. Food and Nutr. Bull. 13(l):43-49
Mensah, P. A., Tomkins, A. M. , Drasar, B. S. and Harrison, T. J. 1988. Effect of fermentation of Ghanaian maize dough on the survival and proliferation of 4 strains of Shigella flexnerii. Transactions of the Royal Society of Tropical Hygiene and Medicine 82:635-636.
Mensah, P. P. A., Tomkins, A. M., Drasar, B. S. and Harrison, T. J. 1990. Fermentation of cereals for reduction of bacterial contamination of weaning foods in Ghana. Lancet 336 (8708) : 140-143.
Ill

Mital, B. K. and Steinkraus, K. H. and Naylor, H.B. 1974.Growth of lactic acid bacteria in Soy milks J.Food Sci.39:1018-1022.
Montgomery, R. D. 1979. Cyanogens. In Toxic constituents of plants food stuffs ed.Leiner,I.E . Academic Press, New York.
Mosha, C.M. and Svanberg, U. 1990. The acceptance and intake of bulk reduced weaning foods: The Lunganga village study.Food Nutr. Bull 12(1):69-71.
Mosha, A. C. and Svanberg, U. 1983. Preparation of weaning foods with high nutrient density using flour of germinated cereals. Food Nutr. Bull. 5(2):10-14.
Muller, H. G. 1970. Traditional cereal processing in Nigeria and Ghana. Ghana Journal of Agricultural Science.3:187-195
Nnanna, I. A. and Phillips, R. D. 1988. Changes in oligosaccharides Content,Enzyme activities and dry matter during controlled germination of cowpeas (Vigna unguiculata) . J.Food Sci. 53 (6) : 1782-1786 .
Nnanna, I. A. and Phillips, R. D. 1990. Protein and Starch Digestibility and Flatulence potential of germinated
112

cowpeas (Vigna unguiculata) . J. Food Sci.55 (1) :151-153 .
Obiri-Danso, K. 1994. Microbiological Studies on Corn Dough Fermentation. Cereal Chem. 71 (2) :186-188.
Onigbiade, A. 0. and Onobun, V. 1993. Effects of pH on some cooking properties of cowpea (Vigna unguiculata). Food chemistry. 47 : 125-127.
Osei, A. K. 1994. Physico-chemical characteristics of Cowpea varieties (Vigna unguiculata (L) Walp). M.Phil thesis submitted to the Department of Nutrition and Food Science,University of Ghana.
Osei, A. K. and Sefa-Dedeh, S. 1993. Performance of steam treated cowpea in solid state fermentation of cereal dough- "Aboloo" system. Paper presented at 13th National Maize and Legumes Workshop. Ghana Grains Development Project.
Osei, A. K. and Sefa-Dedeh, S. 1993. Characteristics of some cowpea (Vigna unguiculata (L) Walp) varieties. Paper presented at 13th National Maize and Legumes Workshop. Ghana Grains Development Project.
Parameswaran, K. P. and Sadasivam, S. 1994. Changes in the carbohydrates and nitrogenous components during germination
113

of proso millet (Panicum miliiaceum). Plat Food Hum, Nutr. 46:
Phillips, R. D., Chinnan, M. S., Branch, A. L., Miller, J. and McWatters, K. H. 1988. Effects of pretreatment on functional and nutritional properties of cowpea meal, J. food Sci. 53(3): 805-809.
Phillips, R. D. 1993. Starchy legumes in human nutrition,health and culture. Plant Food Hum. Nutr. 44:195-211.
Plahar, W. A. and Leung, H. K. 1982. Effect of moisture content on the development of carboxylic acids in traditional maize dough fermentation. J.Sci.Food Agric. 33:555.
Plahar, W. A., Leung, H. K. and Coon, C. N. 1983. Effects of dehydration and Soy fortification on Physicochemical, Nutritional, and Sensory properties of Ghanaian fermented maize meal. J.Food Sci. 48 (4) : 1255-1259.
Pour-El, A. 1981. Protein functionality, classification, definition and methodology In: Protein Functionality inFoods. J. P. Cheny (Ed) pi. ACS Symposium Series No. 147, American Chemical Society. Washington DC.
114
Rao, V. S. and Vakil, U. K. 1983. Effects of Gamma-irradiation
on Flatulence-causing oligosaccharides in Green Gram (Phaseolus areus). J.Food Sci.48:1791-1795.
Rasper, V. 1982. Theoretical aspects of Amylographology. In " The Amylograph Handbook" Ed. Shuey,W.C.,Tipples,K.H. American Association of Cereal Chemists.
Reddy, N. R. and Salunkhe, D. K. 1980. Changes in Oligosaccharides during germination and cooking of Black Gram and fermentation of Black Gram/ Rice blends. Cereal Chem 57:356-360.
Reddy, N. S., Sathe, S. K. and Salunkhe, D, K. 1982. Phytate in legumes and cereals. Advan. Food Res. 28:1.
Schoen, H. N. 1977. Functional properties of proteins and their measurement In: Food Proteins. Whiteker, J. R. andTannenbaum S. R. Avi Publishing company Inc.
Sefa-Dedeh, S. 1994. Private Communication.
Sefa-Dedeh, S. and Demuyarko, B. 1994. Effects of steaming and storage on physico-chemical properties of cowpea (Vigna unguiculata) seeds and flour, unpublished.
115
Sefa-Dedeh, S. 1993. Evaluation of the physicochemical and

processing characteristics of improved varieties of maize grown in Ghana. Report submitted to University Research
Committee, Legon.
Sefa-Dedeh, S. 1984. An old processing method,a new protein food. Food Nutr.Bull. 6(l):77-80.
Sefa-Dedeh, S. 1989. Harnessing Traditional Food Technology for Development.In Harnessing Traditional Food Technology for Development. ed. Sefa-Dedeh ,S. and Orraca-Tetteh,R. Proceedings of a workshop, University of Ghana,Legon.
Sefa-Dedeh, S. and Farkye-Yiadom, N. A. 1988. Some functional characteristics of cowpea, Bambara bean and their products, J .Can. Inst.Fd. Sci. Tech. Vol. 21 (3) :226-270.
Sefa-Dedeh, S. and Osei, A. K. 1994. Application of Response Surface Methodology to cowpea fortification of a fermented cereal steamed cake. A paper presented at the Annual Meeting of the Institute of Food Technologists (IFT),U.S.A.,Atlanta,Georgia.June 25-29.
Sosulski, F. M. 1962. The Centrifuge method for Determining flour absorption in Hard Red Spring Wheats. Cereal Chemistry. 39: 344-350.
116

Sosulski, F. W., Elkowicz, L. and Reichert, R. D. 1982. Oligosaccharides in Eleven Legumes and their air-classified protein and starch fractions. J.Food Sci. 47(2) :498-502.
Subbulaksmi, G. and Udipi, S. A. 1990. Environmental factors, maternal attributes and children's age at introduction of supplementary foods in rural and urban Maharashtra and Gujarat. Food Nutr.Bull. 12 (4) :318-324.
Svanberg, U. , Lorri, W. and Sandberg, A. S. 1993. Lactic fermentation of Non-tannin and High tannin cereals: effects on in vitro estimation of iron availability and phytate hydrolysis. J.Food Sci. 58 (2) :408-412.
Swanston, J. S., Rao, N. S., Subramanian, V. and Taylor, K. 1994. The influence of some aspects of grain quality on malting potential in sorghum. J.Cereal Sci. 19:91-97.
Tomkins, A. and Watson, F. 1989. Malnutrition and Infection: A Review. ACC/SCN State of the art series. UN Nutrition Policy Discussion paper No.5.
Wagner, J. R. , Carson, J. F., Becker, R., Gumbmann, M. R. and Danhof, I. E. 1997. Comparative flatulence activity of beans fraction for man and the rat. J.Nutr.107:680-689.
117

118
APPENDIX 1Dear Survey Participant, Madam, Miss, Mrs.We are seeking your permission to ask you some questions concerning you family, your eating habits, your infant feeding practices and your preferences for certain quality attributes in infant foods. We are doing this not to criticize or embarrass you because we know how difficult it is to keep our children healthy and well fed. Rather, we want to do it as part of a study which will help usdevelop better foods for children and therefore benefit all thechildren of Ghana.We promise that your answers to these questions will be kept confidential. That is, you and your child will not be identified as part of the survey to anyone else and you will be identifiedonly by a code number to make sure this is true. I promise tocarefully control access to this information and to use it only for the purposes we state in this letter.If you agree to participate in this survey, please sign your name below or carefully state your agreement to the person who has given you this letter or read it to you. Thank you for your cooperation.Sincerely,
Prof. S. Sefa-DedehDepartment of Nutrition and Food Science University of Ghana, Legon.
Participant Code
Signature of consenting participant____________
Signature of witness to oral or written consent
Signature of witness to oral or written consent

119
UNIVERSITY OF GHANA DEPARTMENT OF NUTRITION AND FOOD SCIENCE
PRODUCT DEVELOPMENT - FORMULATION OF A COST EFFECTIVE COWPEABASED WEANING FOOD
A survey of mothers' perceptions on the quality attributes expected in a weaning food.
Date...........Location........
Background data1. Mother's occupation..........................................2. Highest level of education mother attained:
None[ ] Prim[ ] Sec[ ] Tech[ ] Univ[ ] Other [ ]3. Number of children [ ] 4. Age of last child [ ]Section a5. Do you incorporate cowpeas into the foods you give your
children? y[ ]/n[ ].6. If yes, how often ? ........... Times a week.7. If no, why not ?.............................................
8. In what form do you use cowpeas at home ?
9. If you were given cowpea flour how would you use it? y [ ] /n [ ] .
10. Into which foods would you incorporate the flour?

11. Would you prefer a flour which has been pre-cooked and therefore cooks quicker than raw cowpeas? y[ ]/n[ ] .
12. If cowpea flour is to be mixed with cereal, which will you prefer ?maize[ ] sorghum[ ] rice[ ] wheat[ ] millet[ ]
13. Do you have preference for a particular cowpea variety for feeding your child? y[ ]/n[ ]
14. If yes, please give reasons...............................
120
15. I have these cowpea samples, which of them would you want a weaning flour to be made from? (select one and give reasons)CHOICE REASONS[ ] .....
16. What colour do you think a weaning food should be?
17. Should weaning foods be sweetened...... or unsweetened... ?18. What consistency should a weaning food have and why ?
CONSISTENCY REASONS9999
Light ..............................................
Medium
Thick

1 2 1
19. If the components were available, e.g. cowpea flour, would you make your own weaning foods at home? y[ ]/n[ ] .
2 0. If no, why?...............................................
21. Which of these weaning foods do you use ? POODS REASONSFarex ...............................
Vitalmix/Weanimix
Cerelac
Nutrend
Frisocreme
Others

1 22
22. What factors do you consider when purchasing a weaning food? (cost, convenience, nutrition information on label, size of package, expiry date, etc.).................................
23. How long do you normally keep weaning foods after purchase?a package/tin..........( ) grammes lasts.............. f°................. weeks or ..............days.
24. Would you be willing to buy a pre-cooked cowpea productwhich costs slightly more than the same weight of the raw cowpea? y [ ]/n[ ]
25. What size of package would prefer ? Enough for1 [ ] 2 [ ] 3 [ ] other[ ] months.
26. What price would you be prepared to pay for a weaning foodpackaged for a single feeding ? ................cedis.
Section b27. Arrange the following weaning foods in order of preference
with respect to the following characteristics:
1 2 3 4 5 6i CONSISTENCY
COLOURTEXTURE

123
Appendix 2 Cooked paste viscosities of fermented maize- cereal malt blends
T y p e o f c e r e a l m a l t e d
m a l tl e v e l(%)
s p r o u tt i m e(days)
p a s t i n gt e m p(°c)
p e a kv i s e(bu)
v i s e9 5 ° c(bu)
v i s e 9 5 ° c h (bu)
v i s e5 0 ° c(bu)
v i s e 5 0 ° c h (bu)
m a i z e 5% 2 8 4 .2 14 0 14 0 14 5 4 0 0 5 2 0
M i l l e t 87. 5 17 0 17 0 1 8 5 6 0 0 78 0
S o r g h u m 83 .3 21 0 2 1 0 2 1 5 5 9 0 6 0 0
M a i z e 3 8 5 . 5 90 90 1 1 0 3 6 5 3 0 0
M i l l e t 82 . 7 2 0 0 2 0 0 2 1 0 8 0 0 4 9 0
S o r g h u m 84 .2 19 0 1 9 0 2 1 0 7 5 0 6 6 0
M a i z e - 4 8 0 . 9 13 0 1 3 0 1 3 0 3 6 0 4 3 0
M i l l e t 6 9 . 3 32 0 10 0 10 0 4 6 0 57 0
S o r g h u m 8 2 . 0 17 0 17 0 18 5 5 4 0 6 0 0
Appendix 3TYPE OFCEREALMALTED
MALTLEVEL
(%)
SPROUTTIME(days)
PASTINGTEMP(°C)
PEAKv i s e(BU)
v i s e95°C(BU)
v i s e95°C H
(BU)
v i s e50°C(BU)
v i s e50°C H
(BU)
MAIZE 10 2 8 0 .4 120 120 120 160 410
MILLET 84 . 0 190 190 200 570 640
SORGHUM 8 3 .6 190 190 220 750 740
MAIZE 3 8 1 .8 110 110 110 370 340
MILLET 8 1 .6 140 140 115 330 270
SORGHUM 85 .6 190 190 200 580 590
MAIZE 4 83 .2 110 110 120 440 380
MILLET 7 0 .0 180 40 20 55 170
SORGHUM 8 0 .2 190 190 205 530 670
Appendix 4
FERMENTATIONTIME(days )
PASTINGTEMP(°C)
PEAKv i s e(BU)
v i s e95°C(BU)
v i s e9 5 °C H
(BU)
v i s e50°C(BU)
v i s e50°C H
(BU)
MAIZEDOUGH
3 8 4 .9 200 200 225 915 595

124Anova summary tables for Brabender viscosity indices Appendix 5 Pasting temperatureS o u rce o f v a r i a t i o n SS d f M.S. F - R a t i o
M a in E f f e c t s S p r o u t i n g T ime
22 6 .86 61 113 6 .51444
52
4 5 .373 22 268 .257 22 2
1 8 .163 *2 7 .3 2 4 *
Type o f C e r e a l 90 .32444 2 4 5 .1 6 2 2 2 18 .0 7 9 *
M a l t C o n c e n t r a t i o n 0 .02722 1 0 .0 272 22 0 .0 1 1
2 - F a c t o r I n t e r a c t i o n s
17 0 .44444 8 21 .3 0 5 5 5 6 8 .5 2 9 *
S p r o u t i n g Type o f T im e . C e r e a l
1 6 4 .05889 4 4 1 .0 1 4 7 2 2 1 6 .4 1 9 *
S p r o u t i n g M a l t T im e . Cone
0.19444 2 0 .0 972 22 0 .0 3 9
Type o f C e r e a l M a l tCone
6 .1 911 1 2 3 .0 955 56 1 .2 3 9
R e s id u a l 9 .992222 4 2 .4 980 55 6
T o t a l ( c o r r ) 40 7 .30 27 8 17
Appendix 6 Peak viscosityS o u rc e o f V a r i a t i o n SS d f MS F - r a t i o
MAIN EFFECTS S p r o u t i n g T ime
29 54 4 .44 4 2 0 11 .1 11
52
5 9 08 .8 89 10 05 .5 56
4 . 4 2 2 ’0 .7 5 3
Type o f C e r e a l 24 84 .4 44 2 12 422 .222 9 .2 6 7 *
M a l t C o ne . 2 6 8 8 .8 8 9 1 2 6 8 8 .8 8 9 2 .0 1 2
RESIDUAL 16 033 .333 12 13 36 .1 1 1 1
TOTAL(CORR.) 45 57 7 .77 8 17
Appendix 7 Viscosity at 95 °CS o u rc e o f V a r i a t i o n SS d f MS F - r a t i o
MAIN EFFECTS 22 97 2 .22 2 5 45 94 .4 44 4 3 .9 16*
S p r o u t i n g T im e 25 33 .3 33 2 12 66 .6 66 7 1 .0 8 0
Type o f C e r e a l 18433 .333 2 92 16 .6 66 7 7 .8 56*
M a l t L e v e l 20 05 .5 56 1 20 05 .5 55 6 1 .7 1 0
RESIDUAL 14 077 .778 12 11 73 .1 48 1
TOTAL(CORR) 37 050 .000 17

125■Appendix 8 V i s c o s i t y a t 9 5 °C- HOLD
S o u rce o f V a r i a t i o n SS d f MS F - r a t i o
m a i n EFFECTS 35 794 .444 5 7 1 58 .8 89 4 . 7 1 2 ’
S p r o u t i n g T ime 88 11 .1 11 2 4 4 0 5 .5 5 6 2 . 899
Type o f C e r e a l 25 377 .778 2 1 2 68 8 .8 8 9 8 .3 51*
M a l t L e v e l 1505 .556 1 1 6 05 .5 56 1. 057
RESIDUAL 18233.333 12 15 19 .4 44 4
TOTAL(CORR.) 54027 .778 17

126Appendix 9 Anova Summary Table for Viscosity at 50°CS o u rce o f V a r i a t i o n SS d f MS F - r a t i o
MAIN EFFECTS 550811 .11 5 11 0162 .22 28 .9 4 8 *
S p r o u t i n g T ime 80 811 .11 2 4 0 4 0 5 .5 6 1 0 .618 *
Type o f c e r e a l 42 6977 .78 2 21 34 8 8 .8 9 56 . 099*
M a l t l e v e l 43022 .22 1 4 3 02 2 .22 1 1 .305 *
2 - F a c t o r i n t e r a c t i o n s 189877 .78 8 23 73 4 .72 2 6 . 2 3 7 ’
s p r o u t t im e * c e r e a l t y p e 61 622 .22 4 15 40 5 .55 6 4 .0 4 8
s p r o u t t i m e * m a l t l e v e l 35 411 .11 2 17 70 5 .55 6 4 .6 5 3
c e r e a l t y p e * m a l t l e v e l 92 844 .44 2 4 6 42 2 .22 2 1 2 .199 *
RESIDUAL 15222.222 4 38 05 .5 55 6
TOTAL (CORR.) 75 5911 .11 17
Appendix 10 Anova Summary Table for Viscosity at 50 °C HOLDS o u rc e o f V a r i a t i o n SS d f MS F - r a t i o
MAIN EFFECTS 32 3005 .56 5 6 4 60 1 .11 14 .129 *
S p r o u t i n g t im e 65 10 0 .00 2 32 55 0 .00 7 .1 19*
Type o f c e r e a l 234433 .33 2 11 72 16 .6 7 2 5 .6 3 7 *
M a l t l e v e l 23 47 2 .22 1 2 3 47 2 .22 5 .1 3 4
2 - F a c t o r i n t e r a c t i o n s 169355 .56 8 2 1 16 9 .44 4 .6 3 0
s p r o u t t i m e * c e r e a l t y p e 91866 .67 4 22 96 6 .6 6 7 5 . 023
s p r o u t t i m e * m a l t l e v e l 97 44 .4 4 2 4872 .222. 1 .0 6 6
c e r e a l t y p e * m a l t l e v e l 67 74 4 .44 2 33 87 2 .22 2 7 .4 08*
RESIDUAL 18 28 8 .88 9 4 4 5 72 .2 22
TOTAL (CORR.) 51 0650 .00 17

127ANOVA Summary Table for pH and Acidity Appendix 11 pHS ou rce o f V a r i a t i o n SS d f MS F - R a t i o
MAIN EFFECTS 47 .146 47 7 8 5 . 893310 2 5 .2 0 1 *F e r m e n ta t io n T ime 4 5 .723290 3 1 5 .241 97 6 5 .1 7 5 *CowpeaF ° r t i f i c a t i o n l e v e l 1 .343085 4 0 .3 357 71 0 .2 8 1 5
Steam T re a tm e n t 0 .080102 1 0 .0 801 02 0 .3 4 3
2 -FACTOR INTERACTIONS 4 .6 762025 19 0 .2 461 15 9 1 .0 5 2
Ferm tim e*Cow pea l e v e l 2 .8 373350 12 0 .2 364 44 6 1 .0 1 1
F e rm t im e * S te a m in g 1 .0381075 3 0 .3 460358 0 .2697
Cowpea l e v e l * S t e a m in g 0 .8007600 4 0 .2 001 90 0 0 .5 1 7 1
RESIDUAL 2 .8 061 80 0 12 0 .2 338483
TOTAL(CORR.) 54 .628860 39
Appendix 12 Acidity
S o u rc e o fV a r i a t i o n SS d f MS F - R a t i o
MAIN EFFECTS 7 .1 562539 8 0 . 8945317 7 1 .32 *F e r m e n t a t i o n T ime 7.0495064 3 2 .3 498 35 5 1 8 7 .35 *CowpeaF o r t i f i c a t i o n l e v e l 0 .0961850 4 0 .0 240460 1. 917
Steam T r e a tm e n t 0 .0105625 1 0 .0 105625 0 .3 8 6 5
2 -FACTOR INTERACTIONS 0 .9 246981 19 0 .0486683 3 .880*
F erm t im e*C ow pea l e v e l 0 .6308206 12 0.0525684 0 .430
F e r m t im e * S te a m in g 0 .2723275 3 0.0907758 4 .191*
Cowpea l e v e l * S t e a m i n g 0 .0215500 4 0 .0053875 0 .7 8 4 7
RESIDUAL 0 .1 505100 12 0 .0125425
TOTAL(CORR.) 8 .2 314 62 0 39

128
Appendix 13 Levels of mono-, di- and oligosaccharides determinedin fermented maize/cowpea blends
cowpea level%
fermentationtime/h
xylose fructose
glu/gal
sucrose maltose
raffinose
stachyose
5 0 0.313 0.931 11.747 0 0.600 0.156 0.139
24 0.196 0.546 0 . 946 0 0.306 0 0
48 0.3 92 0.709 8 . 926 0 0.091 0 0.02972 0.603 0.353 1.281 0.094 0.505 0.053 0
10 0 _ _ - -
24 0.923 1.107 11.063 0.3 04 0 . 564 0.391 048 0.136 0.442 5.852 0 0 .221 0 0.00372 _ _ _ _ -
15 0 0.381 1.080 8.066 0.173 0.649 0 0.06224 0.935 1.060 9.201 0.248 0.645 0.099 048 0.425 0.657 5 . 523 0 0.270 0 0.02572 1.161 0.096 1.078 0.060 0 . 551 0 . 053 0
20 0 0.244 0.905 7 .150 0 0.383 0 0 . 06224 0.301 0.676 9.066 0.302 0.275 0 048 0 .159 0.498 5 .411 0 0.206 0 0 . 00772 0.646 0.070 0.959 0.020 0.639 0 0

129Appendix 14 Levels of mono-, di- and oligosaccharides determined
in fermented maize/ steamed cowpea blends
Steam Cowpea l e v e l %
Ferm ent a t i o n t i m e / h r
XYLOSE FRUCTOSE
GLU/GAL
SUCROSE MALTOSE
RAF-FINOSE
STACH-YOSE
5 0 0 . 892 1 .1 1 4 9 .0 4 9 0 0 .2 9 6 0 .5 7 8 0
24 0 .4 76 0 .6 0 1 7 .2 4 1 0 .0 3 6 0 .2 9 9 0 .0 6 0 0
48 0 .8 53 0 0 .3 0 8 0 .2 3 5 0 .3 1 4 0 0 . 024
72 0 .5 04 0 .1 7 9 2 .7 1 7 0 . 094 0 .7 8 4 0 . 023 0 .1 7 7
10 0 0 . 597 0 .9 22 1 2 .7 2 8 0 0 .4 4 2 0 .0 6 6 0 .1 7 7
24 0 .4 95 0 .8 5 1 7 .2 4 0 0 .0 6 7 0 .2 9 9 0 .0 6 0 0
48 0 .4 9 1 0 0 .2 7 6 0 .1 4 0 0 .2 7 5 0 .1 6 1 0
72 0 .7 2 7 0 .5 62 1. 849 0 0 .3 3 0 0 0 .0 0 7
15 0 0 . 501 0 .8 6 2 1 0 .1 9 0 0 .0 2 7 0 .403 0 .0 1 6 0
24 - _ _ _ _
48 1 .7 3 4 0 0 .6 6 1 0 .3 02 0 .3 5 3 0 0 . 025
72 0 . 541 0 .3 8 4 2 .9 3 3 0 0 .2 4 9 0. 002 0 .1 1 1
20 0 0 . 717 1 .0 7 3 1 2 .2 0 4 0 . 040 0 .2 4 4 0 .0 1 6 0
24 0 .5 4 7 0 .9 04 8 .419 0 .2 3 2 0 .3 2 8 0 .1 3 7 0 .2 4 1
48 0 . 658 0 .0 5 5 0 .6 4 6 0104 0 .3 3 4 0 .6 8 4 0 . 056
72 0 .7 6 8 0 .3 8 8 4 .252 0 .2 9 7 0 .4 5 7 0 0 .6 0 4

130Appendix 15 Levels of mono-, di- and oligosaccharides determined in co
fermented maize/ cowpea blends
Cowpea l e v e l %
Ferm ent a t i o nt i m e / h r
XYLOSE FRUCTOSE
GLU / GAL
SUCROSE MALTOSE
RAFFINOSE
STACHYOSE
5 0 0 .7 1 9 0 .3 9 9 4 .6 7 6 0 .2 6 5 0 .7 7 4 0 .4 2 2 0 .1 4 3
24 0 .0 5 6 0 .5 0 1 8 .4 9 5 0 0 .4 5 4 0 0
48 0 .5 60 0 .0 2 4 0 .9 42 0 . 056 0 .5 3 9 0 0 .0 1 6
72 0 .8 5 1 0 0 .9 0 6 0 .122 0 .5 8 8 0 . 024 0 .3 2 4
10 0 0 .5 2 5 0 .3 85 4 .0 8 3 0 .3 03 0 .9 6 5 0 .3 3 1 0 .3 2 3
24 0 .4 8 5 0 .7 7 1 7 .9 6 7 0 0 .3 2 8 0 .0 4 3 0
48 0 .7 96 0 .5 0 8 2 . 049 0 0 .8 9 0 0 .0 0 9 0 .1 8 1
72 0 .5 2 1 0 .4 8 1 4 .3 7 0 0 0 .0 8 9 0 .0 9 9 0
15 0 0 .4 8 9 1 .0 7 9 7 .6 83 0 .2 2 4 0 .5 8 6 0 .9 2 0 0 .1 6 0
24 0 .2 2 7 0 .7 3 9 7 .6 0 0 0 0 .3 7 9 0 .0 0 1 0
48 0 .4 78 0 .5 8 0 4 .7 4 2 0 0 .4 8 9 0 .140 0 .0 1 8
72 0 .2 0 4 0 .4 0 8 4 . 831 0 0. 087 0 0 .0 4 0
20 0 0 . 950 0 .4 23 4 .5 7 3 0 . 723 1 .0 6 1 0 .4 5 1 0 .3 1 6
24 0 . 393 0 .9 3 2 8 .243 0 0 .1 8 8 0 . 011 0 .1 3 6
48 0 .2 72 0 .4 5 4 4 .6 6 1 0 .1 8 4 0 .4 5 0 0 0 . 056
72 -

131Appendix 16 Levels of mono-/ di- and oligosaccharides determined in co
fermented maize/ steamed cowpea blends
Steam Cowpea l e v e l %
Ferm ent a t i o nt i m e / h
XYLOSE FRUCTOSE
GLU/GAL
SUCROSE MALTOSE
RAF-FINOSE
STACH-YOSE
5 0 0 .5 9 9 0 .9 4 9 7 .6 9 0 0 .1 6 7 0 .2 7 5 0 .0 1 7 0 .3 0 8
24 0 .8 23 0 .9 23 5 .1 3 3 0 .1 0 5 0 0 0 .5 8 4
48 0 .1 36 0 .0 7 9 0 .5 7 4 0 .3 3 1 0 .1 0 3 0 .0 0 8 0 .1 3 4
72 0 .6 2 7 0 .2 7 7 3 .334 0 .6 8 7 0 .1 9 6 0 0 .0 5 6
10 0 0 . 517 1 .0 3 6 10 . 727 0 .1 0 5 0 .5 1 3 0 .0 3 1 0 .3 5 0
24 0 .6 5 9 1 .0 1 6 1 2 .5 2 4 0 0 .2 3 5 0 .5 2 4 0
48 0 . 779 0 .5 88 0 0 0 .4 1 8 0 0
72 0 .7 3 7 0 0 .4 5 1 0 .1 4 9 0 .6 2 3 0 0
15 0 0 .3 9 9 0. 992 11. 808 0 .117 0 .4 5 6 0 .0 9 3 0 .3 0 6
24 0 .4 9 0 0 .7 1 7 7 .9 0 9 0 0 .3 0 1 0 .0 3 6 0 .0 2 6
48 0 . 783 0 .4 1 6 1 .1 2 5 0 0 .4 9 5 0 .8 8 1 0 . 006
72 0 .3 5 0 0 2 .8 9 6 0 0 0 . 002 0 .1 7 8
20 0 0 .5 5 5 0 .9 0 4 1 0 .152 0 .1 12 0 .3 8 5 0 .1 2 3 0 .1 7 7
24 0 . 748 1 .2 8 9 1 0 .2 0 1 0 0 .5 4 9 0 .2 2 1 0 .0 0 2
48 0 .8 0 8 0 3 .6 1 5 0 .2 8 6 0 .495 0 .8 8 1 0 . 006
72 0 .2 1 9 0 .3 9 0 4 .4 5 8 0 1 .1 9 9 0 0 .5 9 9

132Appendix 17
Chemical composition of fermented maize/cowpea blends (% dry matter)
Fermentation Time (Days)
Unsteamed Cowpea level(%)
Ash. Protein_ w _
FacJ1L Fermentation Time (Days)
Steamed AshCowpea level (%)_____ (%L
Protein(%)8.39149.128910.241610.455111.64648.9402
8.5240 9.9355 11.1104 11.0808 11.9299 8.9641 10.4586 10.4194 10.4414 11.1812
Fat (%) 3.6755
2.9867 3,0394 3.1734 2.8340 3.4471 3.4056 3.2543 2.7758 2.7722 3,9822 3.9351 2.9703 3.5749 3.5961 3.7455 3.8094 3.6542 4.1597 3.8021
1520
1.20751.31291.45811.54531.54021.24871.35611.43681.48591.55841.16881.37011.48171.54661.54001.29161.36211.47471.56221.7158
8.39149.8486
8.524010.154711.203911.304011.43608.9641
10.313511.476211.399912.3576
3.67553.2832
3.44714.18453.50893.80623.56573.98223.81453.10463.33193.74553.29423.79233.04063.5182
510
1015
510
1520
1.20751.32141.38021.44831.59111.24871.27191.44451.50791.61831.16881.59401.60571.77421.29161.57521.49381.53431.5827
Chemical composition of co-fermented maize/cowpea blends (% dry matter)
Fermentation Unsteamed Ash Protein Fat Fermentation Steamed Ash Protein FatTime (Days) Cowpea levels(%) (%) (%) (%) Time (Days) Cowpea levels m (%) (%) (%)
0 0 1.2075 8.3914 3.6755 0 0 1.2075 8.3914 3.67555 1.2774 9.4278 3.1417 5 1.3293 8.9486 3.504210 1.3739 10.1073 2.9505 10 1.4247 3.485615 1.4789 10.4133 2.5499 15 1.5089 10.7986 3.003420 1.5798 11.6344 2.9814 20 1.6170 11.4505 2.8317
1 0 1.2487 8.9402 3.4471 1 0 1.2487 8.9402 3.44715 1.3623 9.6984 3.0076 5 1.2945 9.6153 3.605010 1.4285 10.4657 3.4284 10 1.3234 10.4386 3.288815 1.5196 11.0861 2.8101 15 1.6167 10.5906 2.883320 1.4947 11.5734 2.8672 20 1.6544 11.7751 2.6690
2 0 1.1688 8.5240 3.9822 2 0 1.1688 8.5240 3.98225 1.3987 10.7508 - 5 1.4592 10.2827 3.362710 1.4729 11.6403 3.6635 10 1.5586 10.9039 3.478915 1.5562 10.6421 3.7985 15 1.7213 11.9695 3.852720 1.6640 11.1063 3.7221 20 1.7298 12.5383 3.4718
3 0 1.2916 8.9641 3.7455 3 0 1.2916 8.9641 3.74555 1.4270 10.0533 3.B883 5 10.1708 3.494610 1.4673 8.3886 3.3681 10 1.4777 11.0548 4.090515 1.5784 10.8925 3.3850 15 1.6152 11.5873 3.858120 1.6662 11.7885 2.8726 20 1.6790 12.3447 3.5579
Appendix 18 Wa(%
far* m rrnon 4- Q «19 4 t»Q / s V\ 1 on/1 owoo. j. b>j.os wi.dry matter basis)
Fermentation Unsteamed Water Absorption Water Absorption Fermentation Steamed Water Absorption Water AbsorptionTime (Days) Cowpea of cofermented of fermented Time (days) Cowpea of cofermented of fermentedLevels{%) maize/cowpea
blends (%)*maize/cowpea blends (%)1
Levels(%) maize/cowpea blends (%) *
maize/cowpea blends (%)10 0 114.6731 114.6731 0 0 114.6731 114.67315 142.6048 136.6179 5 121.1686 129.861510 - 140.0624 10 121.7534 135,8566
15 144.9571 140.5073 15 121.8169 133.205320 137.3242 146.1079 20 135.1617 140.48521 0 118.6975 118.6975 l 0 118.6975 118.69755 124.1301 132.2226 5 115.4199 125.423610 124.2137 139.5657 10 130.6627 122.108415 121.8473 146.8585 15 113.3782 115.419920 134.0411 133.8545 20 136.0908 133.65142 0 120.7402 120.7402 2 0 120.7402 120.74025 127.1835 133.3353 5 136.2266 137.458210 130.1206 145.6074 10 142.3521 146.700915 134.2309 128.7172 15 147.8524 148.108020 137.0246 143.9276 20 144.1065 152.92933 0 114.2845 114.2845 3 0 114.2845 114.28455 122.7185 143.0052 5 148.5680 138.056310 136.0395 131.9409 10 129.3342 149.265215 138.8272 132.8310 15 148.3491 148.068420 139.9509 144 .3295 20 134.0860 153.37731 - Averages of Duplicate Measurements.

133Anova summary tables for mono -, di-> and oligosaccharides
Appendix 19 Xylose concentration
source of variation SS df — M.S. F-RatioMain Effects Fermentation time
0.59142950.0025817
93
0.0657144 0.0008606
0.8870.012
Fortification level U.3117150 4 0 .0779288 1.051Steam treatment u.2168544 1 0.2168544 0.0423Method of fermentation 0.313533 1 0.0313533 0.4232-Factor Interactions
1.5939728 27 0.0590360 0.797
Fermentation x Level of Time Fortification
0.7819158 12 0.0651596 u.879
Fermentation x Steam Time Treatment
0.3245593 3 0.1081864 x .460
Fepientation x Method of 0.1704578 Time Fermentation
3 0.056B193 0.767
Level of x Steam Fortification Treatment
0.1132419 4 0.0283105 0.382
Level of x Method of 0.2260110 Fortification Fermentation
4 0.0565027 0.762
Steam x Method of 0.0360240 Treatment Fermentation 1 0.0360240 0.0486
Residual /.. 8904001 39 0.0741128Total (corr)
Appendix 20 Fructose concentration
Source of variation SS df M.S. F-RatioMain Effects 5.2752642 Fermentation time 4.9582625 9
30.58614051.6527542
15.278*43.079*
Fortification level 0.3391280 4 0.0847820 2.210Steam treatment 0.0000025 1 0.0000025 0.000Method of fermentation 0.0261057 1 0.026157 u.6802-Factor 2.4122705 Interactions
27 0.0893595 2.329*
Fermentation x Level of 1.2738375 Time Fortification
12 0.1061531 2.767*
Fermentation x Steam 0.5353396 Time Treatment
3 0.1784465 1.651*
Fermentation x Method of 0.1340722 Time Fermentation
3 0.0446907 1.165
Level of x steam 0.0558618 Fortification Treatment
4 0.0139655 0.364
Level of x Method of 0.3084440 Fortification Fermentation
4 0.0771110 2.010
Steam x. Method of 0.1641303 Treatment Fermentation
1 0.1641303 1.278*
Residual x .4962711 39 0.0383659Total (corr)

134Appendix 21 Glucose end Galactose concentration
Source of variation SS MS F-Ratio
Main Effects Fermentation time
657.61098 583 .45325
93
73.06789194.48442
18.399148.972*
Fortification level 64.71585 4 16.17896 4.074*Steam treatment 0.49920 1 0.49920 0.126Method of fermentation z. 89473 1 2.89473 0.7292-Factor Interactions
319.02549 27 11.815759 2.975'
Fermentation x Level of Time Fortification
178.53605 12 14.878004 3.746*
Fermentation x Steam Time Treatment83.69254 3 27.897514 7.025*
Fermentation x Method of 21.19755 Time Fermentation3 7.065849 1.779
Level of x Steam Fortification Treatment
11.49094 4 -i.872734 0.723
Level of x Method of 11.54861 Fortification Fermentation
4 2.887152 0.727
Steam x Method of 6.08376 Treatment Fermentation
1 6.083759 1.532
Residual 154.8876 39 3.9713529Total (corr)
Appendix 22 Maltose concentration
Source of variation SS df MS F-RatioMain Effects Ferment at ion time
0.74855720.3113298
93
0 .083173 0.1037766
2.086'3.501
Fortification level 0.2513254 4 0.0628313 2.120Steam treatment 0.1600696 1 0.1600696 5.400*Method of fermentation 0.0275873 1 0.0275873 0.9312-Factor Interactions
x.4303056 27 0.0529743 x. 787*
Fermentation x Level of Time Fortification
0.6520405 12 0.0543367 x. 833
Fermentation x Steam Time Treatment
0.225637 3 0.0752179 2.538
Fermentation x Method of 0.337039 Time Fermentation
3 0.112346 3.753*
Level of x Steam Fortification Treatment
0.0514112 4 0.0128528 0.434
Level of x Method of 0.0805966 Fortification Fermentation
4 0.0201491 0.680
Steam x Method of 0.0564429 Treatment Fermentation
1 0.0564429 1.904
Residual 1.1560114 39 0.0296413Total (corr)

135Appendix 23 Sucrose concentration
Source of variation SS d ? M S
Main Effects 0.1461420 Fermentation time 0.0255815
93
0.01623800.0085272
0.9580.503
Fortification level 0.1057392 4 0.0264348 1.560
Steam treatment o.0012271 1 0.0012271 0.072Method of fermentation u.0121874 1 0.0121874 0.7192-Factor 0.7726717 Interactions
27 0.0286175 1.689
Fermentation x Level of 0.2894190 Time Fortification
13 y.0241183 1.423
Fermentation x Steam 0.1867422 Time Treatment
3 0.0622474 3.674
Fermentation x Method of 0.1887156 Time Fermentation
3 0.0629052 3.713
Level of x Steam 0.014831 Fortification Treatment
4 0.0026208 0.155
Level of x Method of 0.1020402 Fortification Fermentation
4 0 .0255100 1.506
Steam x Method of u.0012471 Treatment Fermentation 1 0.0012471 0.074
Residual 0.6608184 39 0.0169441Total (corr)
Appendix 24 Raffinose concentration
Source of variation SS df MS F-RatioMain Effects 0.9530883 9 0.1058987 2.672’Fermentation time 0.6112358 3 0.2037453 5.142*Fortification level 0.2482588 4 0.0620647 1.566Steam treatment 0.194740 1 u.194740 0.491Method of fermentation 0.0803002 1 0.803002 2.0262-Factor Interactions
x.3840029 27 u.0541724 j. .367
Fermentation x Level of Time Fortification
0.6500692 12 u.0541724 x. 367
Fermentation x Steam Time Treatment
0.3877878 3 0.1292626 3.262*
Fermentation x Method of Time Fermentation
0.0954391 3 0.0318130 0.803
Level of x Steam Fortification Treatment
0.1671551 4 0.041788B 1.055
Level of x Method of Fortification Fermentation
0.0681994 4 0.0170499 0.430
Steam x Method of Treatment Fermentation
0.0068087 1 0.0068087 0.172
Residual Total (corr)
1.5454332 39 0.0396265 407.30278 17

136Appendix 25 Stachyose concentration
Source of variation SS df MS F-RatioMain Effects Fermentation time
1.71314380.9065902
93
0.19034930.3021967
12.832' 20.372'
Fortification level 0.6202431 4 0.1550608 10.453*Steam treatment 0.0223155 1 0.0223155 1.504Method of fermentation 0.0755554 1 0.0755554 a.0932-FactorInteractions
1.8763592 27 o. 0694948 h. .685*
Fermentation x Level of Time Fortification
1.6717886 12 u.0694948 4.685’
Fermentation x Steam Time Treatment
0.0576387 3 0.019212 x .295
Fermentation x Method of 0.0520636 Time Fermentation
3 0.0173545 x. 170
Level of x Steam Fortification Treatment
0.0426785 4 0.0106696 u.719
Level of x Method of 0.0051440 Fortification Fermentation 4 0.0012860 0.087
Steam x Method of 0.0002518 Treatment Fermentation 1 0.0002518 0.017
Residual u. 5785274 39 u.0148340Total (corr)

Appendix 26Coefficients of variables and their contribution to R2
137
Variable lOrpm R2 20rpra R2 50rpm R2- 2 .5 0 1 8 0 .1 898 - -5 7 .1 8 9 1 6 4 0 .0 0 0 0 2 9 4 7
X3 0 .0 043 12 * 0 .9 2 4 9
X j2 0 .7 042 01 * 0 .0 0 1 5 6 7
X2j 2 .1 7 0 3 * 0 .5 4 5 4 -1 6 .9 3 2 9 0 .5 454
X AXjX3 4 . 2062E-6* 0 .2 1 8 0 0 .000026* 0 .4 0 3 5 0 .0 001 91 * 0 .0 4 6 0 6
^ X j ____________ ;_______________________ -0 .0 0 0 0 3 5 0 .0 045 68 0 .0 0 0 8 0 8 0 .0 1 0 6 8
s ! 0 ■ 9532____________________0 . 9535____________________ 0 . 9832X-l t e m p e r a t u r e X2 c o n c e n t r a t i o n X3 B r o o k f i e l d v i s c o s i t y * - s i g n i f i c a n t a t p s 0 .0 5