development of an urban classification method using a ... … · is ndbi (the normalized difference...
TRANSCRIPT

Development of an urban classification method using a built-up index
JIN A LEE, SUNG SOON LEE, KWANG HOON CHI
Dep.Geoinformatic Engineering, University of Science & Technology
Dep. Geoscience Information, Korea Institute of Geoscience and Mineral Resources Korea-Japan Cooperation Foundation for Industry and Technology
KIGAM, Gajeong-dong, Yuseong-gu, Daejeon KOREA
[email protected], [email protected], [email protected], http://www.ust.ac.kr
Abstract: - This study suggests a standard city classification method using a built-up index (BUI), and assesses its performance. In previous studies, it was difficult to choose a classification method and evaluate accuracy when using images taken from different sensors (TM, ETM) or during different time periods. Therefore, this study proposes a revised method that can address such issues. After determining the critical value of the BUI based on the values of selected samples, images were classified according to critical value. This method was applied to the Cheonan and Asan areas in Korea to evaluate urban development, and the results indicate that the urban areas studied increased 1.6 times and 2.1 times, for Cheonan and Asan, respectively. A thematic map was created that shows the directions of urban development. As the new method uses critical value by selecting sample pixels in urban and non-urban areas, there is no need to separately compute accuracy, which simplifies the procedure. Moreover, this method is very efficient in classifying cities over multiple time periods, and hence is expected to see broad use in the future. Key-Words: - landsat, TM, ETM+, the Normalized Difference Vegetation Index, the Normalized Difference Built-up Index, classification, development, reclassification 1 Introduction Urban growth management is critical in the continued growth of a city. The trend specified, using conventional land surveys by department authorities, focuses on land usage, and is often inaccurate in its depictions of how studied lands are actually used. Moreover, it requires a lot of time and money, as it uses field surveys or aerial photos. Remote sensing using a satellite does not have such disadvantages, and it is especially efficient for time-series analyses. There are a number of studies that categorize urban areas and vegetation areas based on the Vegetation Index. In these cases, the critical value that distinguishes these areas is often determined by the researcher. There are also a lot of cases of land cover classification using a variety of classification techniques. The performance of these methods was assessed using high-resolution images, aerial photos, digital maps and land cover maps[1] An error matrix was created for the randomly extracted pixels, and producer’s accuracy, user’s accuracy and overall accuracy were computed in order to evaluate the
accuracy of all classification techniques[2][3]. Workload can be very high in cases of classifying images from multiple time periods. Moreover, the DN value includes many errors. When several objects are contained within one pixel, it is difficult to regard DN as a representative value. Hence, it is necessary to find an efficient and logical way to define DN using a simple procedure, taking into account potential errors. The purpose of this study is to provide a simple application method employing a built- up index (BUI) that can be used in classifying non-urban and urban areas using images from multiple time periods. The study presents a thematic map that shows the progress of urban development by overlapping three images taken at different times. A standardized method that can be commonly applied to different images is required. Based on this method, the direction of urban development and its size can be examined.
SELECTED TOPICS in POWER SYSTEMS and REMOTE SENSING
ISSN: 1792-5088 39 ISBN: 978-960-474-233-2

2 Research method
Fig.1 Landsat Images (RGB). Cheonan City and Asan City (360km2) were selected as the research areas. Landsat images (115-35) from 1991.8.28 (TM5), 2001.9.16 (ETM 7+) and 2006.9.22 (TM5) were used(Fig.1). The size of the two cities has dramatically increased since the nineties due to higher populations resulting from city development. Compared to the national population growth rate of 1.1 from 1992 to 2007, the population in Cheonan City (right-side) and Asan City (left-side) grew at rates of 1.8 and 1.5, respectively. The resident area has greatly increased, as an apartment complex was built on what was previously a rice field. In addition, local economic development has caused significant population growth. For example, an expanded industrial complex has provided increased employment opportunities[4]. NDVI = ( Band 4 – Band 3 ) / ( Band 4 + Band 3 ) (1) NDBI = ( Band 5 – Band 4 ) / ( Band 5 + Band 4 ) (2) Built-Up Index = NDBI – NDVI (3)
The most commonly used index for examining vegetation distribution is NDVI (the Normalized Difference Vegetation Index) (1). Another applied indicator of vegetation distribution used in this study is NDBI (the Normalized Difference Built-up Index) (2), which is useful in monitoring the distribution of urban areas. Zha[5] reported that the accuracy of extracting urban areas, based on a previous method that uses the difference between NDVI and NDBI, was approximately 92.6%. In this study, the non-urban and urban areas are distinguished based on a built-up index (BUI). The non-urban areas include forest land, farmland (rice fields and upland fields) and parks, while commercial fields, public fields, resident areas and empty land belong to the urban area category. Samples were selected with an interval of 300m in order to determine critical value using a conventional method; the critical value was determined based on the linear relationship among these values, and critical value provided an index for binary classification of the images. After overlapping images from three different time periods, the images were reclassified considering the timing order. 3 Research results 3.1 BUI distribution and determination of
critical value The figure depicts the relative values of extracted BUI (1991) and BUI (1991) in the sample, and also shows the relative relationship of BUI in 2006. BUI takes the form of high values in the urban areas and low values in the non-urban areas. When simplifying the graph, the sample value of areas that transformed from non-urban to urban is located on the upper left side and show that this transformation was greater in 2006 compared to 2001(Fig.2). At a selected point, areas that had been classified as either urban or non-urban for three consecutive years were chosen. This is because BUIs with no or less changes over time were appropriate as criteria for comparing each image. The sample data were used to find relationships among the time periods. Considering the differences in information of B3, B4 and B5, linear correction was required for each case. However, it is more convenient make corrections using a critical value by comparing BUIs instead of fixing them individually.
SELECTED TOPICS in POWER SYSTEMS and REMOTE SENSING
ISSN: 1792-5088 40 ISBN: 978-960-474-233-2
-0.8
-0.6
-0.4
-0.2
0
0.2
0.4
0.6
0.8
-1.2 -1 -0.8 -0.6 -0.4 -0.2 0 0.2 0.4 0.6
BUI ( 1991 )
BU
I ( 2
001
)
y = 0.8279x + 0.2591R2 = 0.7525
-0.8
-0.6
-0.4
-0.2
0
0.2
0.4
0.6
0.8
-1.2 -1 -0.8 -0.6 -0.4 -0.2 0 0.2 0.4 0.6
BUI ( 1991 )
BU
I ( 2
001
)
BUIUrbanNon-urbanThe linear equation
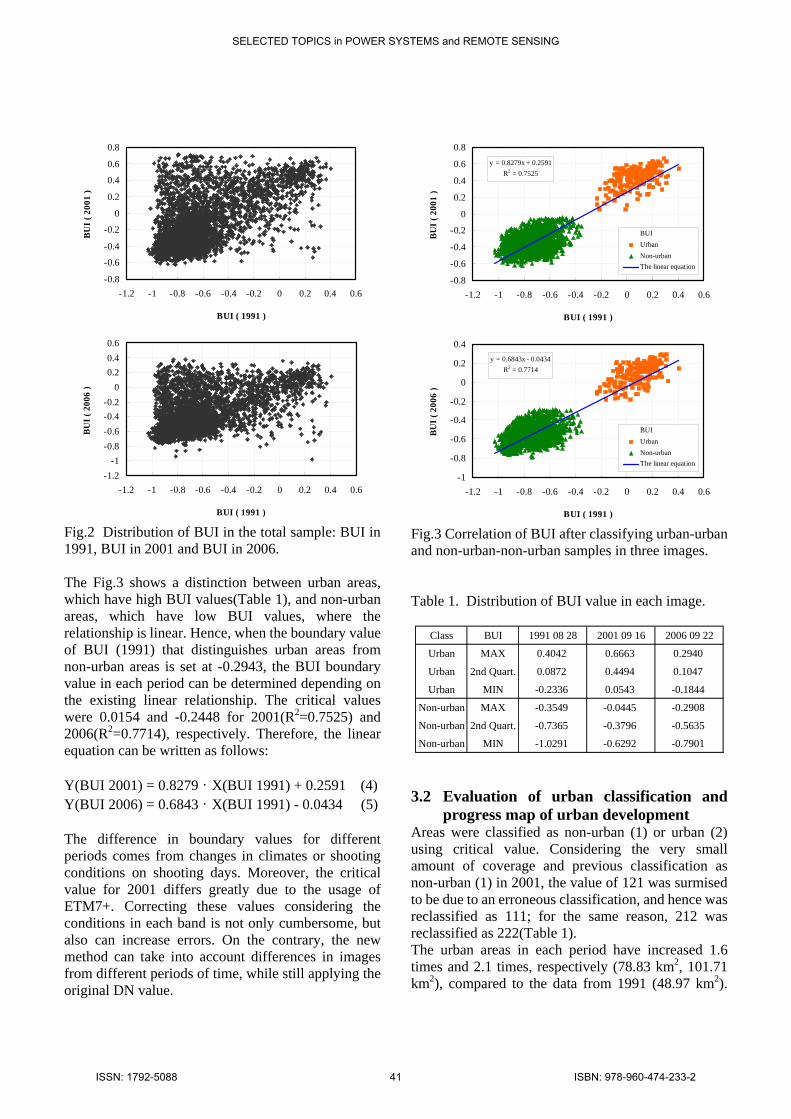
Fig.2 Distribution of BUI in the total sample: BUI in 1991, BUI in 2001 and BUI in 2006. The Fig.3 shows a distinction between urban areas, which have high BUI values(Table 1), and non-urban areas, which have low BUI values, where the relationship is linear. Hence, when the boundary value of BUI (1991) that distinguishes urban areas from non-urban areas is set at -0.2943, the BUI boundary value in each period can be determined depending on the existing linear relationship. The critical values were 0.0154 and -0.2448 for 2001(R2=0.7525) and 2006(R2=0.7714), respectively. Therefore, the linear equation can be written as follows: Y(BUI 2001) = 0.8279 · X(BUI 1991) + 0.2591 (4) Y(BUI 2006) = 0.6843 · X(BUI 1991) - 0.0434 (5) The difference in boundary values for different periods comes from changes in climates or shooting conditions on shooting days. Moreover, the critical value for 2001 differs greatly due to the usage of ETM7+. Correcting these values considering the conditions in each band is not only cumbersome, but also can increase errors. On the contrary, the new method can take into account differences in images from different periods of time, while still applying the original DN value.
-1.2-1
-0.8-0.6-0.4-0.2
00.20.40.6
-1.2 -1 -0.8 -0.6 -0.4 -0.2 0 0.2 0.4 0.6
BUI ( 1991 )
BU
I ( 2
006
)
y = 0.6843x - 0.0434R2 = 0.7714
-1
-0.8
-0.6
-0.4
-0.2
0
0.2
0.4
-1.2 -1 -0.8 -0.6 -0.4 -0.2 0 0.2 0.4 0.6
BUI ( 1991 )
BU
I ( 2
006
)BUIUrbanNon-urbanThe linear equation
Fig.3 Correlation of BUI after classifying urban-urban and non-urban-non-urban samples in three images. Table 1. Distribution of BUI value in each image.
Class BUI 1991 08 28 2001 09 16 2006 09 22
Urban MAX 0.4042 0.6663 0.2940
Urban 2nd Quart. 0.0872 0.4494 0.1047
Urban MIN -0.2336 0.0543 -0.1844
Non-urban MAX -0.3549 -0.0445 -0.2908
Non-urban 2nd Quart. -0.7365 -0.3796 -0.5635
Non-urban MIN -1.0291 -0.6292 -0.7901
3.2 Evaluation of urban classification and
progress map of urban development Areas were classified as non-urban (1) or urban (2) using critical value. Considering the very small amount of coverage and previous classification as non-urban (1) in 2001, the value of 121 was surmised to be due to an erroneous classification, and hence was reclassified as 111; for the same reason, 212 was reclassified as 222(Table 1). The urban areas in each period have increased 1.6 times and 2.1 times, respectively (78.83 km2, 101.71 km2), compared to the data from 1991 (48.97 km2).
SELECTED TOPICS in POWER SYSTEMS and REMOTE SENSING
ISSN: 1792-5088 41 ISBN: 978-960-474-233-2

The six reclassified categories were painted in different colors to show the direction of urban development. The areas with changes can be easily found by comparing the progress map of urban
evelopment with previous RGB images(Fig.1).
s binary classification and classification method.
d Table 2 Each image’re
Fig.4 Progress map of urban development:
eclassification after binary image overlaps.
hed for the newly built express railway in
ties have begun to enter the Cheonan and Asan areas.
2 2 2 222 222
R Cheonan (Fig. 4 : right-side) is expanding to the north and west of the existing urban area. A new resident area and an industrial complex are located in the North, while the Western area contains both a new resident area and the Cheonan Asan Station, a station establis2004. Asan (Fig.4 : left-side) has also expanded a little from its previous size near Onyangonchun-1dong and Onyangonchun-2dong. In Tangjung-myun in Asan, land purchases and development have progressed with the intention of building a facility for Samsung Electronics (Fig. 4 : center, orange color). Thanks to this move, industrial facili
The area that has changed from urban to non-urban area is painted in green. The figure shows that such an area, in a dense green color, is located near the river. Looking closely, this area was classified as empty land in August 1991, while green vegetation was growing in it in September 2001. This can be attributed to seasonal changes, as precipitation increases in August, after which thick bush covers the area in September. 4 Conclusion 1991 2001 2006 Overlay Reclass
1 1 1 111 1111 1 2 112 1121 2 1 121 1111 2 2 122 1222 1 1 211 2112 1 2 212 2222 2 1 221 221
This study suggested a standard urban classification method using a built-up index (BUI). The proposed method was applied to urban classification in the research area in order to evaluate its performance. 1) The method classifies urban and non-urban areas according to a critical value determined using a sample whose characteristics are well known. This procedure makes it unnecessary to recalculate accuracy. 2) As the measuring range of each band differs according to the shooting point, the critical value of BUI also changes. Since BUI is determined based on correlations, each period’s critical value is related with the others instead of being completely separate. 3) For the reclassification, the features of the pixels were determined using the interaction among the classification results from the three time periods. Hence, the areas suspected of erroneous classification could be readdressed, eventually achieving the original purpose by correcting these errors. The new method is efficient in that the procedure of extracting urban areas using BUI is relatively simple. Moreover, this study is significant in that it suggests an optimized and logical method of classifying several images taken during different time periods. In Cheonan and Asan City, the increased urban areas were computed based on the final progress map of urban development. Comparing this with the RGB image indicated that the developed urban areas were accurately captured. The study results provide reference materials for future urban development planning, and these methods can be applied to other cities around the world.
SELECTED TOPICS in POWER SYSTEMS and REMOTE SENSING
ISSN: 1792-5088 42 ISBN: 978-960-474-233-2

References: [1] Salman Qureshi, Syed Jamil Hasan Kazmi, Jürgen
H. Breuste, Ecological disturbances due to high cutback in the green infrastructure of KarachI : Analyses of public perception about associated health problems, Urban Forestry & Urban Greening, Vol.9, No.3, 2010, pp. 187-198.
[2] Patrick Griffiths ., Patrick Hostert, Oliver Gruebner, Sebastian van der Linden, Mapping megacity growth with multi-sensor data, Remote Sensing of Environment, Vol.114, No.2, 2010, pp. 426-439.
[3] Fusun Balik Sanli, Filiz Bektas Balcik, Cigdem Goksel, Defining temporal spatial patterns of mega city Istanbul to see the impacts of increasing population, Environmental Monitoring and Assessment, Vol 146. No.1-4, 2008, pp. 267-275.
[4] H. Taubenböck, M. Wegmann, A. Roth, H. Mehl, S. Dech, Urbanization in India - Spatiotemporal analysis using remote sensing data, Computers, Environment and Urban Systems, Vol.33, No.3, 2009, pp. 179-188.
[5] Zha,Y., Gao, J., Ni, S., Use of normalized difference built-up index in automatically mapping urban areas from TM imagery, International Journal of Remote Sensing, Vol.24, No.3, 2003, pp. 583-594.
SELECTED TOPICS in POWER SYSTEMS and REMOTE SENSING
ISSN: 1792-5088 43 ISBN: 978-960-474-233-2