development of an automated cloud water collection system for use in atmospheric monitoring networks
TRANSCRIPT

Pergamon Atmospheric Environment Vol. 31, No. 13, pp. 2003S2010, 1997 0 1997, Elsevier Science Ltd
PIL: S1352-2310(%)00325-l All rights reserved. Printed in Great Britain
1352-2310/97 $17.(10 + 0.M)
DEVELOPMENT OF AN AUTOMATED CLOUD WATER COLLECTION SYSTEM FOR USE IN ATMOSPHERIC
MONITORING NETWORKS
RALPH E. BAUMGARDNER National Exposure Research Laboratory U.S., Environmental Protection Agency,
Research Triangle Park, NC 27711, U.S.A.
KEITH G. KRONMILLER ManTech Environmental Technology, Inc., P.O. Box 12313, Two Triangle Drive,
Research Triangle Park, NC 27709, U.S.A.
and
JAMES B. ANDERSON, JON J. BOWSER and ERIC S. EDGERTON
Environmental Science and Engineering, Inc., 4915 Prospectus Drive, Suite J, Durham, NC 27713, U.S.A.
(First received 3 October 1995 and in final form 10 October 1996. Published April 1997)
Abstract-An automated cloud water collection system for unattended operation at remote sites is described. This system consists of a cloud water collector, sample accumulator, sample storage unit, and electronic control unit. Threshold values for liquid water content, wind speed, and temperature were set with the electronic control unit to initiate automatic collection of cloud water samples. The automated system was tested in the summer of 1994 at two remote sites: Whitetop Mountain, VA, and Whiteface Mountain, NY. During this period, it successfully collected 449 hourly cloud water samples. 0 1997 Elsevier Science Ltd.
Key word index: Cloud water chemistry, cloud liquid water content, acidic deposition, cloud water collector.
INTRODUCTION
The phenomenon of cloud water deposition to terres- trial ecosystems has been the subject of a number of studies during the past 25yr and has been recently reviewed by Vong et al. (1991a, b) and Mohnen and Vong (1993). The hydrologic input of cloud water is important to ecosystems-30 to 50% of the total water budget may be derived from clouds; however, it is the chemistry of clouds that has drawn the most recent attention. Cloud water of low pH and high ionic strength has been reported at several sites along the spine of the Appalachian Mountains (Falconer and Falconer, 1980; Scherbatskoy and Klein, 1983; Schemenauer et al., 1995) and on the West coast of the U.S. (Jacob et al., 1985). Results from the EPA spon- sored Mountain Cloud Chemistry Project (MCCP) indicate that the cloud water deposition of acidic ions in the Appalachian Mountains at elevations greater than 8OOm may be equal to or greater than acidic deposition by precipitation (Mohnen et al., 1990).
A consistent body of evidence supports the con- clusion that acidic cloud water has predisposed high elevation Red Spruce to winter injury in the north- eastern Appalachians. This winter damage, in conjunc- tion with other mortality factors, has produced a regional decline (Eagar and Adams, 1992). In the southern Ap- palachians, studies indicate that soil chemistry in high elevation forests has changed with increased levels of acidic deposition (McLaughlin et al., 1990, 1991).
The Clean Air Act Amendments of 1990 (CAAA) require the development and implementation of an air monitoring network to determine the spatial distribu- tion and trends in total acidic deposition. Special emphasis is given to deposition in high elevation for- ests, To meet the requirements of the CAAA, the Clean Air Status and Trends Network (CASTNet) has been implemented by the Environmental Protection Agency in cooperation with other federal and state agencies.
The CASTNet design provides for sites to measure wet and dry acidic species, and cloud water chemistry.
2003

2004 R. E. BAUMGARDNER et al.
For routine monitoring of wet and dry acidic species, automated monitoring techniques have previously been utilized that meet the requirements for net&ork operation. However, a totally automated cloud water collection system for unattended operation at remote sites has not been available. This report describes the design of such a system for unattended operation in monitoring networks.
Manual collection techniques have been used in the majority of studies of cloud water chemistry (Falconer and Falconer, 1980; Daube et al., 1987). Manual cloud water collectors have been evaluated by Herring et al. (1987) and Mohnen and Kadlecek (1989). A computer controlled automated fog collector was described by Fuzzi et al. in 1990. This design utilized a fog presence detector to initiate sampling. The system consisted of three units, a fog detector, a sampling unit, and a com- puter controller. In 1993, Aneja and Kim reported the integration of a manual cloud collector and an auto- mated real-time rain sampler which measured some aspects of cloud chemistry in semi-real time, but was not capable of total automation and unattended operation.
SYSTEM DESIGN
Information gathered during the Mountain Cloud Chemistry Project (Mohnen et al., 1990; Vong et al., 1991) was reviewed in developing the automated cloud water collection system. Data from the MCCP revealed that the major factors determining cloud water deposition in Appalachian Mountain forests are cloud liquid water content (LWC), wind speed, and cloud frequency. In general, mountains in the Northern Appalachians are exposed to higher wind speeds and longer cloud events with higher LWC than those in the Southern Appalachians. MCCP data also show the importance of discriminating between pre- cipitating and non-precipitating cloud events. The automated system described here is responsive to a range of LWCs, wind speeds, cloud durations, and samples only non-precipitating clouds.
A diagram of the cloud water collection system is shown in Fig. 1. The system combines an automated cloud water collector (consisting of four components; the string collector, the sample accumulator, the sample storage unit, and the electronics control unit) with a particle volume monitor (PVM) in conjunction with a temperature sensor, rain detector, and wind speed monitor. The PVM is used for monitoring liquid water content and to indicate cloud presence. The wind speed monitor (model 05305) and the tem- perature sensor (model 43347) are from R. M. Young. The rain sensor is a modified Aerochem-Metrics sen- sor. The PVM monitor is a Gerber Scientific, Inc, model PVM-100 (Gerber, 1984; Gerber et al., 1993). A data logger in communication with the cloud water collector and meteorological sensors stores the me- teorological and cloud LWC data, and sets the thre- shold values of parameters that initiate sampling.
The collector system, TVA designed (Imhoff, 1993, personal communication), utilizes a passive cloud col- lector which uses wind speed to affect cloud impaction on 0.4mm Teflon strings (Mohnen and Kadlecek, 1989; Falconer and Falconer, 1980). When there are no clouds, it is protected within an external enclosure. During cloud events, a motor driven shaft elevates and exposes the collector (Photo 1). A spray nozzle with rinse pump is utilized to clean the teflon strings with deionized water at the end of each sample period (Fig. 1).
Although we chose in the CASTNet program to have the pH and conductivity measurements of the cloud water samples performed on-site by a field tech- nician, the sample accumulator, designed by Kronmil- ler et al. (1990) is capable of field pH measurements in semi-real time. If the automated pH system is utilized, the cloud water is analyzed as it is collected using an Orion 611 meter and glass combination electrode (Orion 91-62 filled with 0.1 MKCl) held inside an auxiliary sampling cell that can be filled, drained, and flushed between samples with deionized water. Accu- rate measurements can be obtained in the field by electronic monitoring of the changing pH response until a programmable delta pH is found (change per unit time) or an expiration of a programmable time- out has occurred. Quality control is assured by in- cluding a reservoir of weak sulfuric acid solution (pH = 4.0) and control valves to automate the daily (programmable) QC sequence. Conductivity can also be measured automatically inside the sample accumu- lator using an Amber Science 1062 Digital Conductiv- ity Meter and 1515 Conductivity Dip Cell (Au). The analog conductivity value, slope response, and tem- perature are digitized in the microcontroller and re- corded along with the pH for the sample. The conductivity meter automatically corrects for varying temperatures. Calibration of the meter is routinely performed by the operator during site visits.
The sample storage unit consists of 24 1-L polyethy- lene sample bottles contained in a circular wire sup- port and housed in a commercial refrigerator (see Fig. 1). A computer-controlled distributor arm is mounted above the sample bottles to direct the in- flowing cloud water from the accumulator to each sample bottle (American Sigma, PN737, PN1322 and PN1807).
The electronic control unit provides for the system integration and is the result of careful selection of components based on experience obtained from the MCCP and other studies. The system components were selected for operation over a wide range of tem- peratures (- 5 to 60°C) possibly encountered during cloud water collection. The control unit provides for operator feedback by means of a two line by 40 character liquid crystal display with EL backlighting and a sixteen key moisture resistant keypad. A small 24 character per line impact printer is also provided for recording data and producing a hard copy record of events and system parameters.

Automated cloud water collection system
Waste Waler
t Collector
Motor
QoudCallector
A Spray Nozzle
Mlcctor Fnnnel
Pinch Solenoid
Collector Tower
Deionized Rinse Water
iciiigz Monitor
Temperature Sensor I
Fig. 1. Overall diagram of collection system
The primary component of the control unit is an serial ports, an 8 channel 10 bit analog to digital integrated microcontroller board (Octagon Systems converter, keypad port, LCD display port, and two 24 SBS-2300H). Included on this board is the micro- bit digital ports for connecting to bit input and output processor, reprogrammable non-volatile memory for drivers. A real-time clock circuit with battery program storage (EEPROM), non-volatile memory protection provides the system with time keeping. The for variable and data storage (B-RAM), as well as two board also contains a BASIC language interpreter.

2006 R. E. BAUMGARDNER et al.
Photo 1. Exposed collection tower
Modifications to the software operating system can be made in the field to tailor individual automated cloud water collection systems to special requirements, such as low/high liquid water content.
The microcontroller board interfaces to a 24 posi- tion input/output opto-isolated solid state relay board (Octagon Systems G4 PB-24) which contains individual modules to sense and control peripheral system components such as level sensors, micro- switches, solenoid pinch valves (for directing collected cloud water flowing through the system), drive motor for the string collector, and collector bottle distributor arm.
In addition to the line printer mentioned pre- viously, a serial port connection provides a means to download all system activity messages contained in the non-volatile memory. A PC communication pro- gram (Octagon Systems Smart Link III) provides this capability as well as the software needed to program or modify the operating program inside the microcon- troller.
QUALITY ASSURANCE AND CONTROL
Since 1980, manual measurements of acidic cloud water have set the standards for quality assurance. During manual collection, field/site and permanent laboratory facilities are available with buffers, re- agents and any other apparatus needed to obtain high quality data. With the automated cloud water collec-
tion system, the approach is to perform an initial characterization of the apparatus, then, after a normal period of automatic use, re-evaluate and affirm the measurement quality.
For the systems without automated pH and con- ductivity measurements, the primary requirement is to verify the overall system cleanliness. To do this, the operator manually activates the cloud water collect- ing sequence and collects the rinse water that has flowed through the system. This rinse sample is ana- lyzed for acidity or ionic content and corrective ac- tions can be performed if needed (e.g. a change of contaminated tubing). In the automatic pH/conduct- ivity units, the internal QC sequence provides a de- tailed record of the pH data. If these results show an abnormality, a non-scheduled site visit can be made to identify and correct the problem or re-calibrate the pH meter.
The PVM liquid water content measurements, as well as the meteorological data, are also important QC considerations. In the CASTNet program, the PVM is calibrated and the zero is adjusted by the site operator. The Particle Volume Monitor (PVM) from Gerber Scientific measures in situ, and in real time, the integrated volume suspended water droplets with a stated precision of 0.002gm-3. A narrow beam from a 780 nm laser diode irradiates the droplets in the open air along a 40 cm path, and the amount of forward scatter is measured (Gerber, 1984). The PVM translates this information into data on liquid water content and mean particle size of ambient clouds.
Under field conditions in our study, the PVMs are calibrated at least every two weeks. An empirical estimate of uncertainty or possible error can be de- termined by reviewing the records to determine the correction or readjustment of these PVMs. Span ad- justments are rarely needed. Zero adjustments (close to the 0.05 grnm3 level) are most commonly per- formed, usually an adjustment of 0.01 or 0.02 gme3. The average zero adjustment required was 0.007 gme3 (including when no adjustments was needed). When the stated precision of 0.002 is added, the average uncertainty becomes 0.009 gmm3. The meteorological instruments are calibrated at the be- ginning and end of the field season and also in the middle of summer. The site operator is responsible for reporting any problem or suspicious data to the CAS- TNet staff, who respond immediately to check and replace or repair the instrument in question.
SYSTEM OPERATION
A normal sequence of operation for the automated cloud collection system is described. The Gerber PVM monitors liquid water content (LWC) data in real time. The cloud water collector and PVM are interfaced with the data logger, wind speed, rainfall and temperature sensors. When the liquid water content of a cloud exceeds 0.05 g m- 3 and wind speed is higher
Automated cloud water collection system 2007
than 2.5 ms-’ and ambient air temperature is above freezing (practically, > 2”), and there is no rainfall, the cloud water collector is activated and projected out of its protective housing (summarized below).
IF: cloud LWc~0.05 grne3
wind speed>2.5 ms-’ temperature > freezing rainfall = none
THEN: cloud collector activated
After the cloud water collector is moved out of its shield, the accumulation sequence begins after a one minute delay to condition the Teflon collector strings. Initial cloud water wets and conditions the strings and is then discarded. The cloud water droplets collect on the strings and flow into the accumulator. The accu- mulator collects until the one liter volume is reached or until an hour has elapsed. The accumulator is emptied into the storage bottle. The sample distribu- tor moves to the next position and is readied for the next sample. Multiple samples may be collected for one cloud event or one sample for each cloud event or one sample for multiple cloud events. If, during a cloud event or at the end of an event, one of the measured parameters drops below its threshold value (for a five-minute average), sampling is terminated. The teflon strings of the collector are rinsed by the de-ionized water from the spray nozzle, the collector motor is reversed and the collector retreats into the collector shield. All of these determinations are based on five-minute averages, except for the response to rainfall, which is immediate. Within the context of the CASTNet study, a cloud is operationally defined as having a liquid water content of 0.05 gmm3 or higher. The wind speed threshold of 2.5 ms- ’ or higher was established based on experience with the passive string collector. Cloud water collection is inefficient at low wind speeds. The droplets are not impacted on the strings and very low collection volume results. The analytical laboratory requires at least 40ml for sample analysis, a volume normally produced only at wind speeds of 2.5 m s- 1 and higher.
The main implication of this cutoff point is that the CASTNet data set does not include samples from slow-moving clouds. However, because of the design constraints of the passive string collector, these slow- moving clouds would not yield sufficient sample vol- umes for analysis, resulting in the loss of the same subset of events.
NETWORK OPERATION
In 1994 the CASTNet automated cloud water col- lection system was deployed through the summer sampling season at two high altitude sites: Whitetop Mountain in southwestern Virginia, and Whiteface Mountain in northeastern New York. Both were cloud water collection sites during the MCCP Pro- gram.
Whitetop Mountain (36”38’2O”N, 81”36’19”W) is located in the Mount Rogers National Recreation Area of the Jefferson National Forest 6 km southwest of Mount Rogers, the highest peak in Virginia. The CASTNet site on Whitetop (at 1686 m or 5532 ft) is on the main ridgeline of the Appalachian range, stra- tegically located to intercept air from several direc- tions. The cloud water collector tower and PVM were positioned on an elevated deck above a research trailer, which housed the data logger and cloud collec- tor electronics.
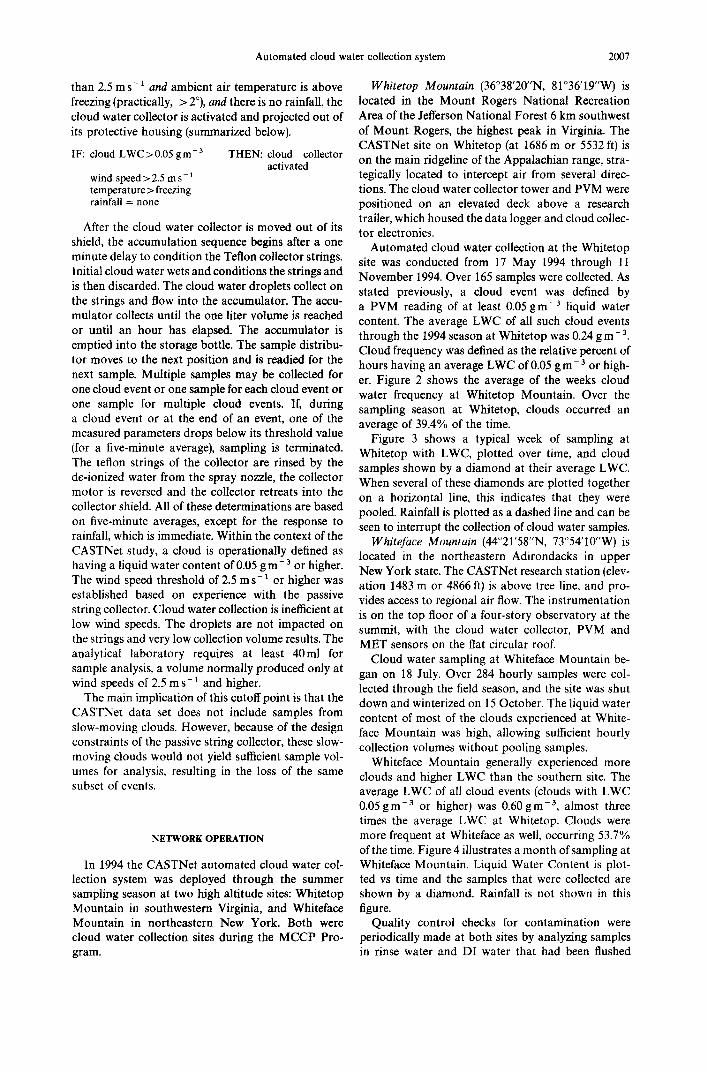
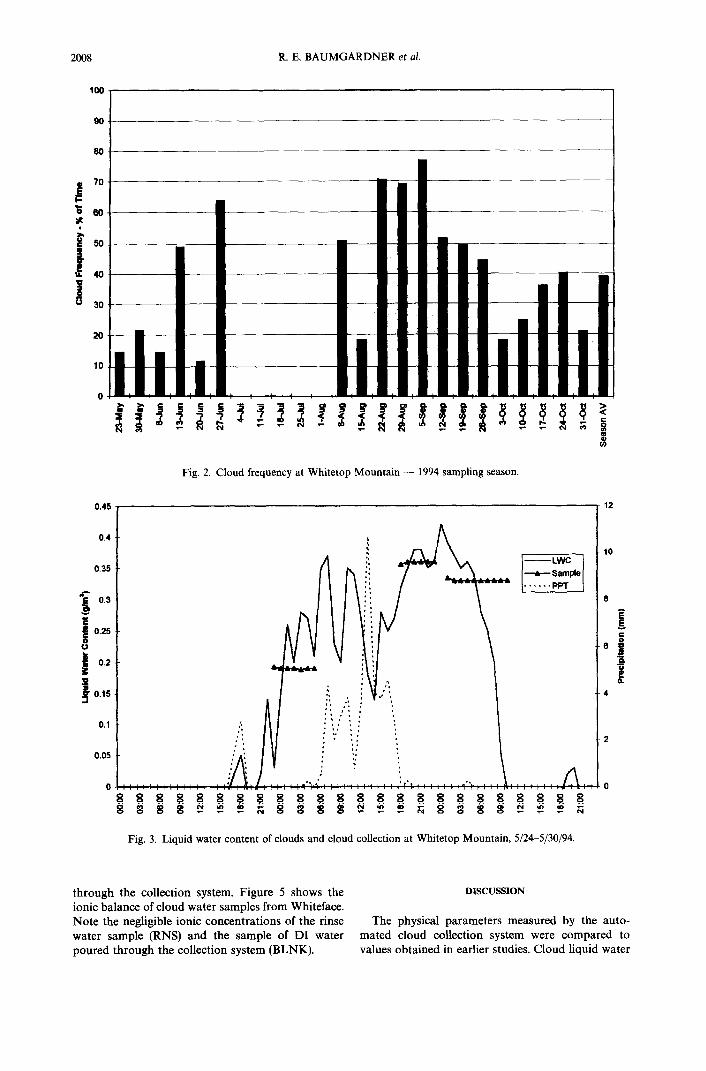
Automated cloud water collection at the Whitetop site was conducted from 17 May 1994 through 11 November 1994. Over 165 samples were collected. As stated previously, a cloud event was defined by a PVM reading of at least 0.05 grnw3 liquid water content. The average LWC of all such cloud events through the 1994 season at Whitetop was 0.24 g rnm3. Cloud frequency was defined as the relative percent of hours having an average LWC of 0.05 gm-3 or high- er. Figure 2 shows the average of the weeks cloud water frequency at Whitetop Mountain. Over the sampling season at Whitetop, clouds occurred an average of 39.4% of the time.
Figure 3 shows a typical week of sampling at Whitetop with LWC, plotted over time, and cloud samples shown by a diamond at their average LWC. When several of these diamonds are plotted together on a horizontal line, this indicates that they were pooled. Rainfall is plotted as a dashed line and can be seen to interrupt the collection of cloud water samples.
Whiteface Mountain (44”21’58”N, 73”54’1O”W) is located in the northeastern Adirondacks in upper New York state. The CASTNet research station (elev- ation 1483 m or 4866 ft) is above tree line, and pro- vides access to regional air flow. The instrumentation is on the top floor of a four-story observatory at the summit, with the cloud water collector, PVM and MET sensors on the flat circular roof.
Cloud water sampling at Whiteface Mountain be- gan on 18 July. Over 284 hourly samples were col- lected through the field season, and the site was shut down and winterized on 15 October. The liquid water content of most of the clouds experienced at White- face Mountain was high, allowing sufficient hourly collection volumes without pooling samples.
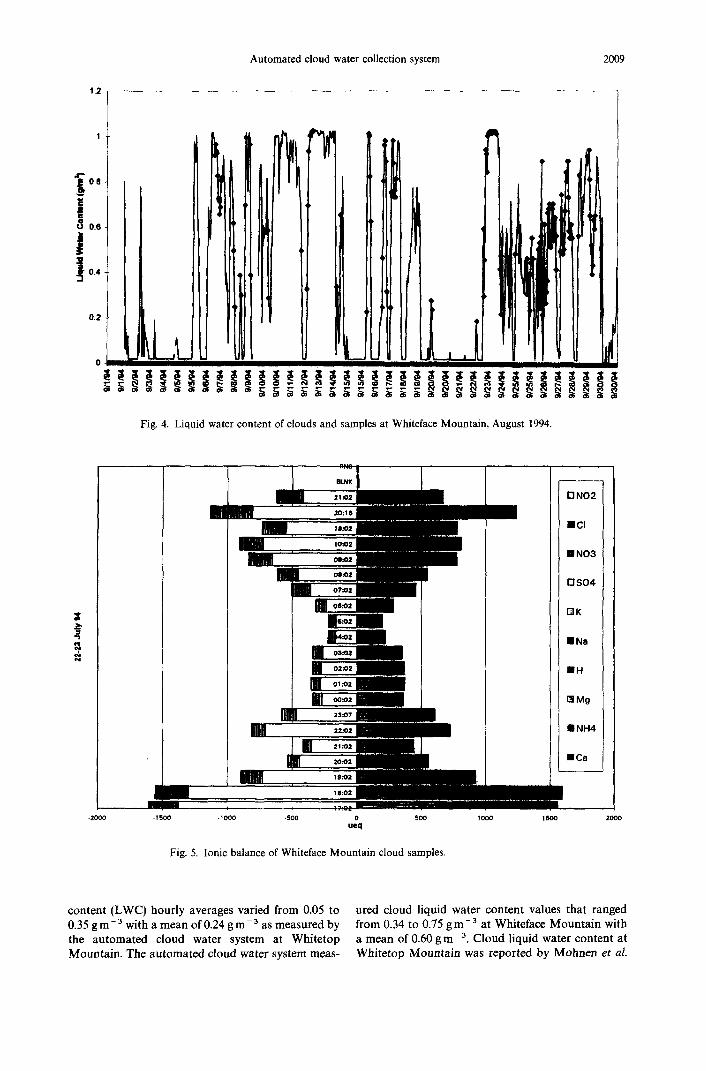
Whiteface Mountain generally experienced more clouds and higher LWC than the southern site. The average LWC of all cloud events (clouds with LWC 0.05 g me3 or higher) was 0.60 g rne3, almost three times the average LWC at Whitetop. Clouds were more frequent at Whiteface as well, occurring 53.7% of the time. Figure 4 illustrates a month of sampling at Whiteface Mountain. Liquid Water Content is plot- ted vs time and the samples that were collected are shown by a diamond. Rainfall is not shown in this figure.
Quality control checks for contamination were periodically made at both sites by analyzing samples in rinse water and DI water that had been flushed
2008 R. E. BAUMGARDNER et al.
20
10
Fig. 2. Cloud frequency at Whitetop Mountain - 1994 sampling season.
0.45 12
0.4 '-
0.35
f 0.3
j 0.25 ..
0
t 0.2 .-
P B 3 0.15 --
0.1 --
0.05 --
otnt-:::::::::::
88s 88 88882
Fig. 3. Liquid water content of clouds and cloud collection at Whitetop Mountain, S/24-5/30/94.
8 -z E
6 B .o %
4
2
through the collection system. Figure 5 shows the DISCUSSION
ionic balance of cloud water samples from Whiteface. Note the negligible ionic concentrations of the rinse The physical parameters measured by the auto- water sample (RNS) and the sample of DI water mated cloud collection system were compared to poured through the collection system (BLNK). values obtained in earlier studies. Cloud liquid water
Automated cloud water collection system 2009
1.2
1
3 0.8
i 0.0
1
1 0.4
0.2
0
r
Fig. 4. Liquid water content of clouds and samples at Whiteface Mountain, August 1994.
ON02
??CI
II NO3
OS04
??K
??Na
??Mg
??NH4
Fig. 5. Ionic balance of Whiteface Mountain cloud samples
content (LWC) hourly averages varied from 0.05 to ured cloud liquid water content values that ranged 0.35 g me3 with a mean of 0.24 g mV3 as measured by from 0.34 to 0.75 gme3 at Whiteface Mountain with the automated cloud water system at Whitetop a mean of 0.60 gmm3. Cloud liquid water content at Mountain. The automated cloud water system meas- Whitetop Mountain was reported by Mohnen et al.

2010 R. E. BAUMGARDNER et al.
(1990), to have a mean value of 0.21 gmm3 and at Whiteface Mountain a range of 0.10-0.80 gmm3 and mean of 0.44 gme3. LWC was measured by Mohnen using the technique described by Valente et al. (1989) which draws a volume of water through a paper filter at a known flow rate. The filter was then weighed. The automated cloud water collection system measured cloud liquid water content within the range of values reported from these studies. Cloud frequency at Whitetop Mountain occurred 39.4% of the time and at Whiteface Mountain clouds occurred 57% of the time. Cloud frequency is defined as the percent of hours having a cloud liquid water content of 0.05 g m- 3. Cloud frequency varied from 25.7 to 41% of the time at Whitetop Mountain for the four year period (19861989) during the Mountain Cloud Chemistry Project and 25.3 to 42.4% of the time at Whiteface Mountain for the same four year period (Mohnen et al., 1990).
CONCLUSION
Cloud deposition of acidic ions to mountain ecosys- tems is significant. The Clean Air Act Amendments of 1990 mandated the study of the distribution of acidic ions with special emphasis on high altitude forests. In order to assess cloud water input to these forests, we have developed an automated cloud water collection system for unattended operation at remote sites. The automated cloud water collection system and selected results of the first field test are described.
The automated cloud water collection system pro- ved to be responsive to a wide range of liquid water contents, wind speeds, and cloud durations, and selec- tively sampled only non-precipitating clouds. In con- junction with a PVM for continuous measurement of cloud liquid water content, a data logger and me- teorological instrumentation, the system functioned to collect hourly cloud water samples for chemical analysis, as well as salient associated information.
REFERENCES
Aneja, V. P. and Kim, D. (1993) Chemical dynamics of clouds at Mt. Mitchell, North Carolina, AWMA, 43, 1074-1083.
Daube, B., Kimball, K. D., Lamar, P. A. and Weathers, K. L. (1987) Two new ground-level cloud water sampler designs which reduce rain contamination. Atmospheric Environ- ment 21, 893-900.
Eagar, C. and Adams, M. B. (Ed.) (1992) Ecology and Decline of Red Spruce in the Eastern United States, Ecological Series, Vol. 96 pp. 395-411. Springer, Berlin.
Falconer, R. E. and Falconer, P. D. (1980) Determination of cloud-water acidity at a mountain observatory in the Adirondack Mountains of New York State. J. geophys. Res. 85C, 7365-7470.
Fuzzi, S., Cesari, G., Evangelisti F., Facchini, M. C. and Orsi, G., (1990) An automatic station for fog water collection. Atmospheric Environment &IA, 2609-2614.
Gerber, H. (1984) Liquid water content of fogs and hazes from visible light scattering. J. Clim. Appl. Met. 23, 1247-1252.
Gerber, H., Arends, B. G. and Ackerman, A. S. (1993) New microphysics sensor for aircraft use. Atmospheric Res. 00, 1-18.
Herring, S. V., Blumenthal D. L., Brewer, R. L., Gertlen, A. A., Hoffman M., Kadlecek J. A. and Pettas K. (1987) Field intercomparison of five types of fogwater collectors. Envir. Sci. Technol. 21, 654663.
Jacob, D. J., Waldman, J. M., Munger, J. W. and Hoffman, M. R. (1985) Chemical composition of fogwater collected along the California coast. Envir. Sci. Technol. 19. 730-736. Kronmiller, K. G., Ellenson, W. D., Baumgardner, R. E., Stevens, R. K. and Paur, R. J. (1990) Development and evaluation of an acid precipitation monitor for fractional event sampling with capability for real-time pH and con- ductivity measurement. Atmospheric Environment 24A, 523-536.
McLaughlin, S. B., Andersen, C. P., Edwards, N. T., Roy, W. K. and Layton, P. A. (1990) Seasonal patterns of photo- synthesis and respiration of red spruce saplings from two elevations in declining Southern Appalachian stands. Canad. J. Forest Res. 20, 485495.
McLaughlin, S. B., Anderson, C. P., Hanson, P. J., Tjoelker M. G. and Roy W. K. (1991) Increased dark respiration and calcium deficiency of red spruce in relation to acidic deposition at high -elevation Southern Appalachian Mountain sites. Canad. J. Forest Res. 21. 12341244.
Mohnen, V. A. and Kadlecek, J. A. (1989) Cloud chemistry research at Whiteface Mountain. Tellus 41B, 79-91.
Mohnen. V. A.. Aneia. V. P.. Bailev. B.. Cowline. E.. Goltz M. S., Healey, J., Kadlecek, J. A.,.Me&her, J.,%fueller, S. F. and Sigmond, J. T. (1990) An assessment of atmospheric exposure and deposition to high elevation forests in the Eastern United States. EPA/600/3-90/058.
Mohnen, V. A. and Vong, R. J. (1993) A climatology of cloud chemistry for the eastern United States derived from the mountain cloud chemistry project. Enuir. Rev. 1, 38854.
Schemenauer R. S., Banic C. M. and Urquizo N. (1995) High elevation fog and precipitation chemistry in southern Quebec, Canada. Atmospheric Environment 29,233>2352.
Scherbatskoy and Klein R. M. (1983) Response of spruce and birch foliage to leaching by acidic mists. J. Enuir. Quality 12, 189-195.
Valente, R., Mallant, R., McLaren, S., Schemenauer, R. S. and Stogner, R. (1989) Field intercomparison of ground based cloud physics instruments at Whitetop Mountain, VA. Journal of Atmospheric and Oceanic Technology 6, 396-406
Vong, R. J., Bailey, B. H., Markus, M. J. and Mohnen, V. A. (1991a) Factors governing cloud water composition in the Appalachian Mountains. Tellus 42B, 435-453.
Vong, R. J., Sigmon, J. T. and Mueller, S. F. (1991b) Cloud water deposition to Appalachian forests. Em_%-. Sci. Tech- nol. 25, 1014-1021.