development of an analytical method to highlight nicotine ... · pdf filehighlight nicotine...
TRANSCRIPT

1
MASTER IN ANALYTICAL CHEMISTRY
FOR THE NORWEGIAN PHARMACY DEGREE
CANIDIDATUS PHARMACIAE
Distinct composition and pharmacokinetic profiles of smoke
and smokeless tobacco products:
Development of an analytical method to
highlight nicotine consumption as a doping
agent
Ida Engelsen Lange
May 2010
Swiss Laboratory for Doping Analysis
University of Lausanne Hospital Center
Lausanne, Switzerland
Natural Products and Medicinal Chemistry Research Group
Department of Pharmacy
Faculty of Health Sciences
University of Tromsø, Norway

2
PREFACE
This report reflects work done at the Swiss Laboratory for Doping Analysis in Lausanne,
Switzerland. All analytical work was performed during the period of October 2009- May
2010. The external supervisor of this work was Francois Marclay, PhD student at the Swiss
Laboratory for Doping Analysis, and the internal supervisor was Professor Einar Jensen at the
University of Tromsø.

3
ACKNOWLEDGEMENTS
First and foremost I would like to thank my dear class mate, roommate and friend; Eirin
Berge Steinshamn. I could not have found a better travel companion. She has always been
positive and encouraging me when I needed it the most. The stay here in Switzerland is soon
to be over, but good memories of all the skiing trips, excursions and pub nights we attended
together will last.
I would also like to thank Professor Einar Jensen for establishing the contact with the Swiss
Anti Doping Laboratory, and for giving me good advices in the writing process. As well, my
thanks goes to Dr. and P-D Martial Saugy, the director of this laboratory, for welcoming me
as a master student and giving me access to all necessary equipment and facilities.
I further would like to express my gratitude towards my external supervisor Francois Marclay,
how has been of great help during my work. He deserves a gold medal for all the hours he has
spent helping me interpreting quantitative validation data.
Additionally, I would like to thank the entire staff at the Swiss Anti Doping Laboratory, all
contributed to help me with practical work or everyday issues concerning transport, logistics
and which of the city’s facilities that should be checked out. Especially, PhD student Flavia
Baboud, shall have thanks for always answering my questions and encouraging me troughout
this work, and for helping us getting in touch with the University of Geneva, where we got
accepted to pass our examination in BIO-3305. Lisbeth Aasmoe, Anine T. Andersen, Dr
Serge Rudaz and Catherine Rey-Mermey who made this cooperation between the universities
possible, all deserve credits. Their goodwill enabled prolongation of the stay here in
Switzerland by 3 weeks, and saved me many worries and costs. I will have them in mind
while sunbathing on the shores of Lac Leman in June.
Last, the greatest thanks go to my family who has supported me during all the difficult periods
encountered throughout this study.
Lausanne, 20.05.2010
Ida Lange

4
TABLE OF CONTENTS
1 ABSTRACT ........................................................................................................................................ 6
2 ABBREVIATIONS ............................................................................................................................... 7
3 INTRODUCTION ............................................................................................................................... 8
3.1 Doping in sports ..................................................................................................................... 8
3.2 Aim of the project .................................................................................................................. 9
3.3 Tobacco, general background ................................................................................................ 9
3.3.1 Different tobacco consumption patterns .......................................................................... 9
3.3.2 The chemical components of tobacco ............................................................................... 9
3.4 Nicotine ................................................................................................................................ 13
3.4.1 Pharmacological effects and doping potential ................................................................ 13
3.4.2 Absorbtion and metabolism ............................................................................................ 16
3.5 Choosing Biomarkers for tobacco exposure ........................................................................ 19
3.5.1 Major tobacco alkaloids................................................................................................... 20
3.5.2 Minor tobacco alkaloids .................................................................................................. 21
3.5.3 Tobacco specific nitrosamines ......................................................................................... 21
3.5.4 Tobacco additives as biomarkers..................................................................................... 22
3.5.5 The selected biomarkers ................................................................................................. 22
3.6 Basic principles of the analytical procedure ........................................................................ 23
3.6.1 Sample preparation ......................................................................................................... 23
3.6.2 HPLC (High performance liquid chromatography) .......................................................... 24
3.6.3 Mass analyser (ESI-MS/MS) ............................................................................................. 26
3.6.4 LC-MS/MS ........................................................................................................................ 29
3.7 Method validation ................................................................................................................ 30
4 EXPERIMENTAL .............................................................................................................................. 33
4.1 Reagents and chemicals ....................................................................................................... 33
4.2 Material and equipment ...................................................................................................... 34
4.3 Sample preparation and extraction ..................................................................................... 35
4.4 Liquid chromatography- tandem mass spectrometry conditions ....................................... 37
4.4.1 Method Validation ........................................................................................................... 38
4.4.2 Method application to snus and cigarette samples ........................................................ 39
5 RESULTS AND DISCUSSION ............................................................................................................ 40
5.1 Method development .......................................................................................................... 40
5.1.1 Chromatography and mass spectrometry ....................................................................... 40

5
5.1.2 Sample preparation ......................................................................................................... 42
5.1.3 SPE ................................................................................................................................... 43
5.2 Method Validation ............................................................................................................... 46
5.2.1 Selectivity ......................................................................................................................... 46
5.2.2 Quantitative validation .................................................................................................... 48
5.2.3 Method sensitivity ........................................................................................................... 50
5.3 Application of the method ................................................................................................... 50
6 CONCLUSION ................................................................................................................................. 52
7 FURTHER PERSPECTIVES ................................................................................................................ 53
8 REFERENCES .................................................................................................................................. 54
9 APPENDIX ...................................................................................................................................... 57
9.1 Method validation ................................................................................................................ 57
9.1.1 Fragmentation patterns ................................................................................................... 57
9.1.2 Mobile phase gradients ................................................................................................... 67
9.1.3 MCX solide phase extraction method ............................................................................. 67
9.2 Method validation ................................................................................................................ 68
9.2.1 Trueness and precision .................................................................................................... 68
9.2.2 Accuracy profiles and correlation curves ........................................................................ 69
9.2.3 Chromatograms ............................................................................................................... 74
9.3 Method application .............................................................................................................. 76
9.3.1 Concentration ratios ........................................................................................................ 76
9.3.2 Trueness and linearity parameters .................................................................................. 77
9.3.3 Chromatgrams ........................................................................... Erreur ! Signet non défini.

6
1 ABSTRACT
Nicotine is a pharmacological active compound found in the tobacco plant, and works as a a
stimulant of the central nervous system. Evidence is presented that use of nicotine may have
beneficial effects on athletes’ performance. Nicotine is known to cause weight loss and to
improve mental capacity by enhancing concentration and relieving anxiety. Additionally,
improved exercise endurance after nicotine administration has been demonstrated. By using
nicotine containing medications or smokeless tobacco products, athletes can benefit from
these effects without most of the health risk associated with smoking.
Nicotine is primarily consumed in the form of tobacco, but a large variety of nicotine
containing medications exists as well. The most common forms of tobacco consumption
patterns are smoking as cigarette and pipes, and smokeless tobacco, in the form of chewing
tobacco, snus and snuff. Depending on the type of product, the tobacco compositions of
nicotine, and other compounds naturally present in tobacco, differ to a large extent. Levels of
each compound measurable in biological fluids depend on the chemical composition and the
distinct pharmacokinetic profile of the consumed product. Theoretically, these variations in
levels of investigated compounds could be used to differentiate between nicotine consumption
patterns.
In this project, compounds of interest for discriminating between the use of smoke and
smokeless tobacco were identified and an LC-MS/MS method involving SPE sample
preparation was developed and validated in order to determine concentration levels of these
compounds in urine specimens. Further, concentration levels of these molecules were
measured in urine specimens from smokers and smokeless tobacco users, and interpretation of
preliminary results indicated some variability. Still there is a long way to go before the
method is suited to highlight nicotine consumption for a doping purpose.

7
2 ABBREVIATIONS
EPO: erythropoietin
ESI: electron spray ionization
FDA : U.S Food and Drug Administration
HLB : hydrophilic lipophilic balance
ICH: International Comitte of Harmonistion
IOC: The International Olympic Committee
LLE: liquid phase extraction
LOQ: limit of quantification
LTQ: linear ion trap quadrupole
MCX : mixed mode cation exchange)
MRM: multiple reaction monitoring
MS: mass spectrometry
SIM: single ion monitoring
SPE: solid phase extraction
Trans-OH-cot : trans-3-hydroxycotinie
TSNA: tobacco specific nitrosamines
TSQ: triple stage quadrupole
ULOQ: upper limit of quantification
WADA: World Anti-Doping Agency
8
3 INTRODUCTION
3.1 Doping in sports
The term doping can be defined as a practice that consists in the absorbtion of specific
substances or the practice of specific medical acts in order to artificially enhance one’s
physical or mental capacities[2]. Doping creates different conditions of competition, and
might as well represent an actual or potential health risk to the athlete[3].
Doping is not a new phenomenon, either in sport or society in general. Doping has been
accepted in many cultures, including the western one. In some sports doping has a long
tradition, and the trend has accelerated from 1960 to the present day. The number of different
types of substances that are used has increased considerably. In particular, the misuse of blood
doping has become more common. In association with Tour de France in 1998, it was
revealed extensive abuse of EPO, growth hormones, anabolic steroids and amphetamines.
Both public authorities and sports organizations realized then that it was necessary to unite the
forces in the fight against doping. This led to the creation of the World Anti-Doping Agency
(WADA) 10 November 1999[4]. Its mission is to promote, coordinate and monitor the fight
against doping in sport in all forms. WADA’s key activities include scientific research,
education, development of anti-doping strategies, and monitoring of the World Anti Doping
Code- the document harmonizing anti-doping policies in all sports and all countries[5]. This
document contains the list of substances and methods that are prohibited in sports[6].
Doping controls are carried out at all international championships and major events to enforce
in practice this lists of prohibited drugs, narcotics and methods. In addition unannounced spot
checks in the training periods are also conducted. The doping analyses are performed on urine
and / or blood samples by one of the 35 WADA approved doping laboratories around the
world. If there is found traces of banned drugs (positive samples), the penalty is usually
exclusion from all sports for a period of two years[4].

9
3.2 Aim of the project
The purpose of this study is to develop an analytical method to highlight nicotine
consumption as a doping agent.
The first phase of this project is to identify compounds of interest for discriminate between
the use of smoke and smokeless tobacco.
In the second phase, an analytical method to determine concentration levels of these
compounds of interest in urine specimens should be developed and validated.
Then, the concentration levels of these molecules should be determined in urine specimens
from smokers and smokeless tobacco users, in order to highlight variability due to either form
of consumption.
3.3 Tobacco, general background
3.3.1 Different tobacco consumption patterns
Tobacco is a common term for a variety of products made from dried leaves of tobacco plants
[7]. Tobacco has two principal use patterns. Either it is smoked, or used as smokeless tobacco.
Smoke tobacco exists in various forms as cigarettes, cigars and pipes. This kind of tobacco is
inhaled as smoke. There are three main forms of smokeless tobacco; snus, snuff, and chewing
tobacco. Snus is a finely ground tobacco, packaged as dry, moist, or in sachets.
The user places a pinch or dip between the cheek and the gum. Sniffing dry snuff through the
nose is common in some European countries.
Chewing tobacco is available in loose leaf, plug, or twist forms, with the user putting a wad of
tobacco inside the cheek. Smokeless tobacco is sometimes called "spit" or "spitting" tobacco
because people spit out the tobacco juices and saliva that build up in the mouth[8].
3.3.2 The chemical components of tobacco
The tobacco plant is a species of the nightshade family, Solanaceae, which includes numerous
varieties. The tobacco plant is not a typically tropical or subtropical growth, it can be grown
in temperate areas with sufficient warm summers[7]. This plant is naturally rich in a variety of
chemical components, such as tobacco alkaloids and tobacco specific nitrosamines (TSNA).
In addition to the chemical components found in the tobacco leaves themselves, about 600
different additives are being added to the tobacco products during fabrication[9]. These
additives and production methods vary from factory to factory[10]. Analyses of cigarette
smoke have discovered over 4000 different chemical compounds[11]. About 30 carcinogens

10
have been identified in chewing tobacco and snuff. The tobacco specific N-nitrosamines
(TSNA) and the polycyclic aromatic hydrocarbons (PAH) are among the major contributors
to the carcinogenic activity of tobacco products[12].
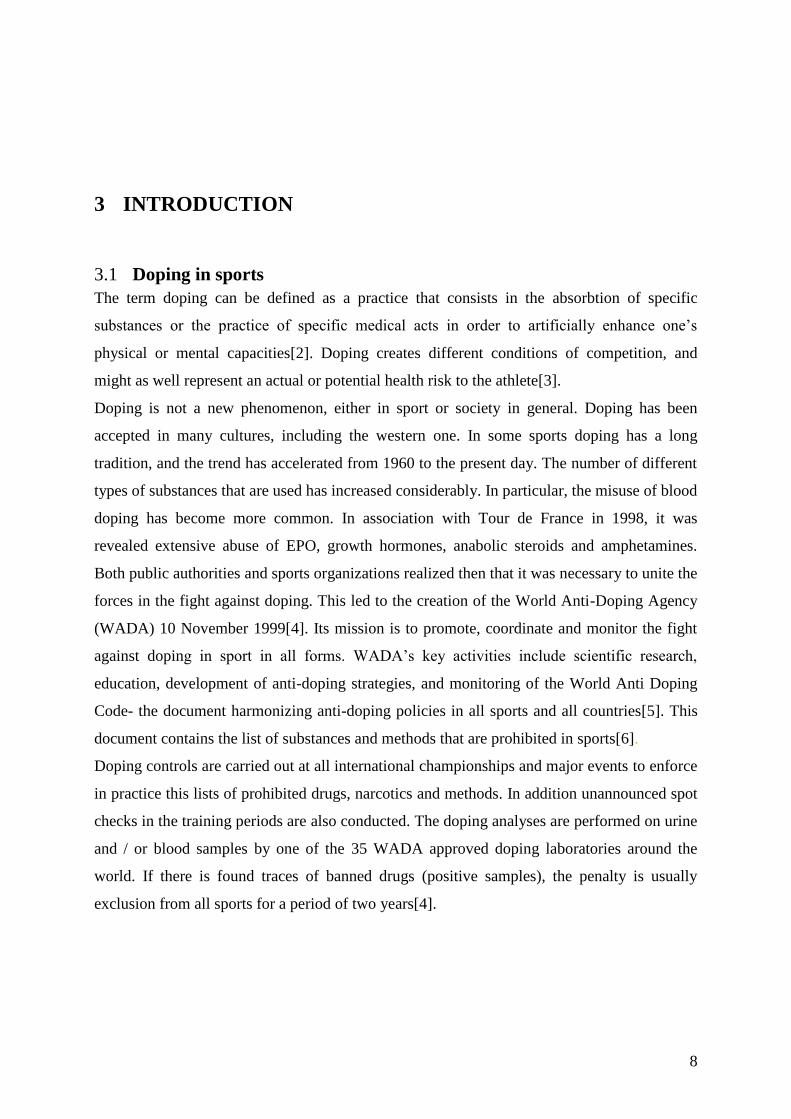
3.3.2.1 Tobacco alkaloids
Tobacco alkaloids are a large group of nitrogen-containing compounds found in plants. Many
of them affect the central nervous system and are strong poisons, or used as drugs[13]. The
addictiveness of nicotine is the cause of the continuing use of tobacco products.
Nicotine is occurring to the extent of about 1.5% by weight in commercial cigarette tobacco
and accounting for about 95% of the total alkaloid content [14, 15].
Snus and pipe tobacco contain concentrations of nicotine similar to cigarette tobacco, whereas
cigar and chewing tobacco have only half of the nicotine concentration of the cigarette
tobacco[14].
Nornicotine, anabasine, myosmene, nicotyrine and anatabine make up for 8-12 % of the total
alkaloid content of tobacco products. In some varieties of tobacco, nornicotine concentrations
exceed those of nicotine[16].
In animals, some of these alkaloids other than nicotine are pharmacologically active, but less
potent than nicotine. Little is known about their effects in humans [15].
During the production and storage some of the tobacco alkaloids are chemically converted to
carcinogenic nitrosamines compounds [15, 17].
11
Figure 1 Structure of some tobacco alkaloids [14, 15, 17]
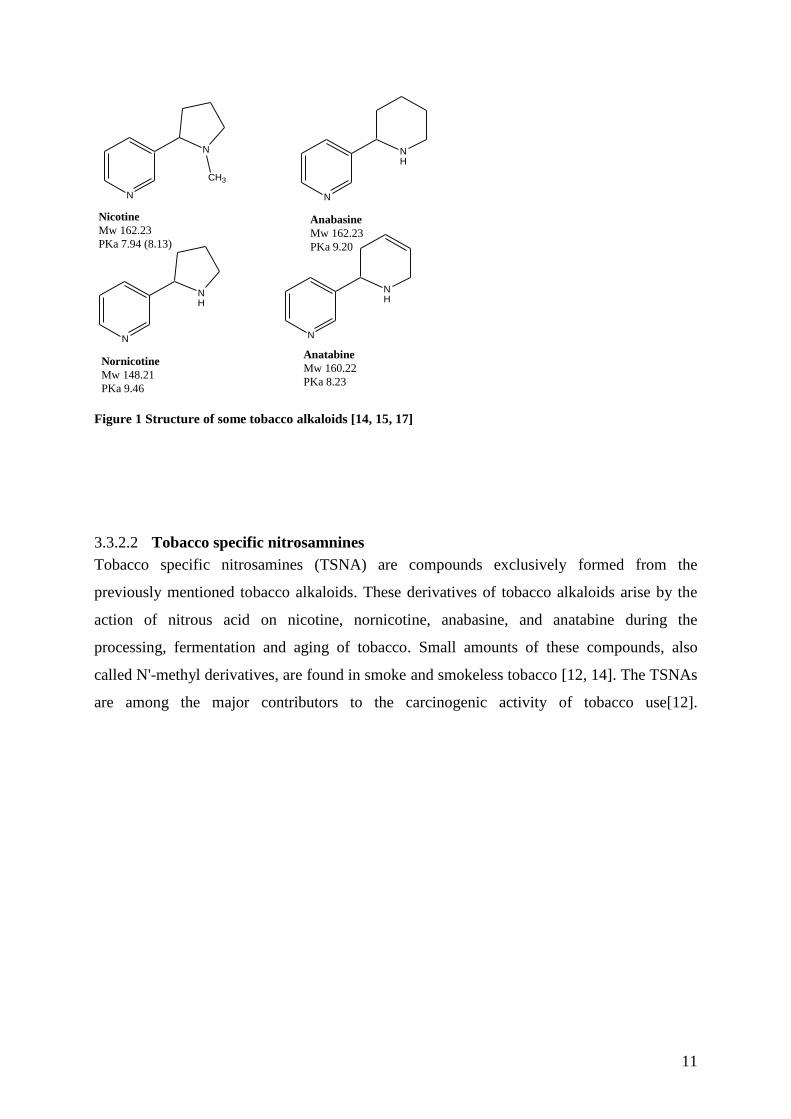
3.3.2.2 Tobacco specific nitrosamnines
Tobacco specific nitrosamines (TSNA) are compounds exclusively formed from the
previously mentioned tobacco alkaloids. These derivatives of tobacco alkaloids arise by the
action of nitrous acid on nicotine, nornicotine, anabasine, and anatabine during the
processing, fermentation and aging of tobacco. Small amounts of these compounds, also
called N'-methyl derivatives, are found in smoke and smokeless tobacco [12, 14]. The TSNAs
are among the major contributors to the carcinogenic activity of tobacco use[12].
N
N
CH3
N
NH
N
NH
N
NH
Nicotine
Mw 162.23
PKa 7.94 (8.13)
Nornicotine
Mw 148.21
PKa 9.46
Anabasine
Mw 162.23
PKa 9.20
Anatabine
Mw 160.22
PKa 8.23
12
Figure 2 Structures of tobacco-specific nitrosamines and their precursors [18].
3.3.2.3 Tobacco additives
Natural herbs, spices, essences and artificial additives have been added to tobacco products
for several years. Over 600 different additives are being added to tobacco products during
fabrication[9]. These additives vary amongst the different tobacco products and from factory
to factory[10].
A great number of tobacco ingredients are added to enhance the natural tobacco taste and to
give the distinctive flavour characteristics of specific products and brands[19]. Other
substances are added to tobacco in order to prevent rapid loss of moisture. These additives are
called moisturizers. These make the tobacco moist and preserve physical and sensory
properties for a long time. Frequently used substances in this group are glycerol, propylene
glycol and dietylenglycol. In order to improve the physical properties of tobacco, texturizing
agents are added. These compounds enable tobacco products to withstand mechanical stress
during manufacturing and transportation. Naturally occurring components such as cellulose,
dextrin, gum, pectin and starch are commonly used. Combustion modifiers are another group
of additives, used in cigarette paper to control the combustion properties of cigarettes. Citric
acid and phosphoric acid are examples of such compounds.
N
N C H 3
N
O N
O = N C H 3
N
N H
N
N O
C H 3
N = O
N
N O H
C H 3
N = O
N
O H
N O = N
C H 3
N N K N N A N N N
N
N
N = O
N
N H
N
O H
N O = N
C H 3
O
N
N
N = O
N A B
N
N H
N
N
N = O
N A T
N i c o t i n e N o r n i c o t i n e A n a b a s i n e A n a t a b i n e
N N A L i s o - N N A L i s o - N N A C
T o b a k k - a l k a l o i d e r ( f o r g j e n g e r e f o r n i t r o s a m i n
Tobacco alkaloi
n e
Tobacco alkaloids
13
In cigarette paper, adhesives are another necessity. Starch, polyvinyl acetate and certain vinyl-
based copolymers are commonly used. Last but not least, preservatives are added to protect
the tobacco product against microbial decomposition. Relevant substances in this group are
potassium salts of propionic acid, sorbic acid, benzoic acid and 4-hydroxsybenzoacid.
The amount of additives does in some cases exceed 10 % of the weight in U.S. cigarettes, of
which sugars, flavouring and moisturizing agents make up the majority [20].
3.4 Nicotine
3.4.1 Pharmacological effects and doping potential
To ensure that the initiation of this project is justified, the effects of nicotine and its potential
as a doping agent must be addressed.
If nicotine or any other substance or method shall be considered for inclusion on the
Prohibited List of WADA at least two of the following criteria must be met:
The substance or method (alone or in combination with other substances or methods)
has the potential to enhance sport performance,
the use of the substance or method represents an actual or potential health risk to the
athlete
the use of the substance or method is against sports ethics[21].
This must be supported by medical or other scientific evidence, pharmacological effect or
experience. Whether or not nicotine in the form of smokeless tobacco meets these criteria is
further discussed in this section.
Most athletes avoid using cigarettes because of the negative physiological effects of smoking.
Smoking impairs performance by causing airway constriction, additionally the carbon
monoxide in smoke combines with haemoglobin, making less haemoglobin available for
oxygen transport, resulting in a decreased maximal oxygen uptake for heavy smokers[22].
Thus, professional athletes rarely smoke tobacco.

14
The prevalence of smokeless tobacco use amongst athletes is suspected to be high in certain
sports on the other hand. Participants in team sports were remarkable smokeless tobacco users
already in the 1980s, especially ice hockey and floor ball players. By the mid 1980s and early
1990s the prevalence of smokeless tobacco use among professional baseball players was
about twice high that of the general population of males in the same age range. In the early
90s it was estimated that about 45 % of the premiere professional athletes in USA were using
smokeless tobacco[23]. In 2003 the prevalence was still high, with 30–36% of the major
league players reporting regular use[24]. Without doubt, smokeless tobacco use is popular
amongst athletes, and incidences of smokeless tobacco use in athletics are likely to increase in
parallel with the expanded use in society as a whole[25]. This trend could be explained by the
athletes’ repulsion of cigarettes, but there is some evidence supporting nicotine might be
performance enhancing.
Nicotine action is mediated trough the nicotinic acetylcholine receptors. These receptors
respond endogenously to acetylcholine in the periphery and central nervous system. Nicotine
acts on these receptors and cause neuronal excitation.
The peripheral effects of nicotine are mainly caused by the excretion of catecholamine, such
as adrenaline and noradrenaline from the medulla. When reaching receptors in heart and lung
tissues, the catecholamine’s causes cardiovascular effects. These effects consist of an increase
in pulse rate and blood pressure and mobilisation of blood sugar and fatty acids [26].
Repeated exposure leads to development of tolerance to these effects, thus other mechanisms
are more likely responsible of the performance enhancing capacities of nicotine.
It is suggested that nicotine might prolong endurance by a central mechanism that involves
nicotinic receptor activation and/or altered activity of dopaminergic pathways[27]. This was
demonstrated by a study of nicotine administration on exercise endurance. A significant
improvement in performance was observed, with ten out of twelve subjects being able to
cycle for a longer period with nicotine administration (17% ±7%, P<0.05)[27]. Additionally,
nicotine is reported to improve coordination and produce faster motor responses[28]. These
effects of nicotine could be beneficial in most sports.
15
Evidence is presented supporting the involvement of nicotinic acetylcholine receptors in
relieves of anxiety[29]. As well as reducing anxiety, nicotine is reported to cause increased
cognitive performance, arousing and alertness. These beneficial effect on mental capacity, has
been demonstrated by a reduced stress-related decline in performance after nicotine
consumption[26, 30] [29]. In sports like ski jumping, where control of the nerves is essential;
use of nicotine could provide a considerable advantage.
Another effect of nicotine is weight loss associated with serotonin release[28]. In sports
competing in weight categories such as different martial arts, a lower bodyweight would be
beneficial. As well in many endurance sports lowering the bodyweight could be
advantageous.
The suspicion about the doping potential of nicotine is confirmed by another study in which
baseball players using smokeless tobacco were asked about the reason for their tobacco use.
This study revealed use of smokeless tobacco because it helped them to relax. Players
reported smokeless tobacco use as a coping strategy, or as a concentration or weight control
aid, and some even believed that it helped to improve their field performance[24].
If nicotine has the potential to enhance performances, use of smokeless tobacco enables the
athletes to benefit of them without most of the harmful effects associated with smoking.
If this is the case, nicotine may be used with the intention of artificially enhancing physical or
mental capacities. The intentional use of a substance in order to enhance performance is
defined as doping, and would violate the spirit of sports.
This evidence suggests that nicotine could meet one of the previously mentioned WADA
criteria for inclusion of new substances and methods on the Prohibited List[21].
As previously mentioned, smokeless tobacco is associated with less risk than cigarettes;
however the risk is still appreciable. A systematic review of the relation between smokeless
tobacco and cancer in Europe and North America addressed the risk of developing pancreatic
cancer. In this case, the authors concluded that the overall data suggest a possible indication
that "smokeless tobacco" use increases the risk of developing pancreatic cancer[31]. Other
published studies also support these findings [32, 33].

16
Snus has also been blamed for increasing the risk of developing a number of other cancers
such as prostate, biliary cancer, bladder cancer, kidney cancer, larynx cancer, nasal cancer,
haematopoietic and lymphoid cancers, however, more evidence is needed before one can deny
or confirm this hypothesis[31]. There are as well great uncertainties concerning the potential
risks for cardiovascular events associated with snus use. A systematic review concluded that it
seems possible that there is a moderate risk of cardiovascular disease associated with the use
of snus[34].
This opens for the discussion whether or not nicotine, meets the second criteria for inclusion
on the Prohibited list; that the use of the substance or method represents an actual or potential
health risk to the athlete[21].
If a substance meets two of the previously mentioned criteria, it should be considered for
addition to WADA’s “Prohibited List of Substances and Methods”. However, lack of
prevalence data on use and means to distinguish between smoke and smokeless tobacco
consumptions is the main reason nicotine has not been considered for addition to this list.
Development of such an analytical method is thereby valuable, and the initiation of the project
is justified.
3.4.2 Absorbtion and metabolism
Nicotine is a weak base with a pKa around 8.0, but the presence of both a pyrrolidine and
pyridine nitrogen give nicotine dibasic properties. At pH lower than 2.7, nicotine exists in the
diprotonated form (two charges), at pH ranges from 4.5 to 7.0 it is dominated by the
monoprotonated form (1 charge), and at pH above 7.0 nicotine is mostly neutral[35].

17
Figure 3 Illustration of the pH dependent absorbtion of nicotine
The rate of nicotine absorbtion through the biological membranes is a pH dependent process
because unionised organic bases are lipophilic (fat soluble) while ionized organic bases are
hydrophilic (water soluble). By increasing the amount unionised nicotine in relation to ionized
nicotine, the physiological effects of nicotine are enhanced[19].
In tobacco smoke, the pH is acidic (about 6). As a consequence, only a negligible amount of
nicotine is absorbed from the mucous membranes in the mouth because less than 1% of
nicotine is unionised (free). By increasing the pH of smoke tobacco, the amounts of free
nicotine are increasing. At pH 8.0, the amount of free nicotine is increased to approximately
50%. The main routes of nicotine absorbtion in smokers who inhale, are trough the alveoli of
the lungs. When tobacco smoke reaches the small alveoli of the lung, nicotine is rapidly
absorbed independently of smoke pH. This is presumably because of the huge surface area of
the alveoli and small airways, which facilitate transfer across cell membranes.

18
The oral bioavailability of nicotine is about 45 %. Bioavailability is incomplete because of
first pass metabolism. The nicotine absorbtion through the gastrointestinal tract is poor
because of the acidic nature of the stomach juice, but is well absorbed in the small intestine,
which has a more alkaline pH and a larger surface area[16, 26]. Snus and nicotine-containing
medications are buffered to alkaline pH, thus absorbtion of nicotine through the oral mucosa
is facilitated[19].
After absorbtion, nicotine enters the bloodstream and is distributed to body tissues. The
plasma half life of nicotine after cigarette smoking averages about 2 hours because of the
extensive metabolism of nicotine[14]. The nicotine metabolic pathway is complex and
involves the formation of a number of Phase I metabolites through oxidation, hydroxylation
and N-demethylation, and, also Phase II metabolites through conjugation with glucuronic
acid[36] There are evidence of interindividual differences in nicotine metabolism.
Polymorphism of the CYP 2A6 gene has a major impact on nicotine clearance. Gender-
related effects, disease states, and various inhibitors and inducers affect individual rates of
nicotine metabolism[14]. Quantitative aspects of the pattern of nicotine metabolism have been
elucidated in humans. About 90% of a systemic dose of nicotine can be accounted for as
nicotine and nicotine metabolites in urine[14] In average, 75% of the nicotine dose is
converted to cotinine, which in turn is also extensively metabolized. About 10-15% of this
cotinine dose is excreted unchanged in urine. The remainder is converted to other metabolites,
mainly trans-3-hydroxycotinie [14, 16]. Nicotine, cotinine and trans-3-hydroxycotinieare all
subjected to Phase II metabolism and are transformed to their respective glucuronide acid
conjugates (See Figure 4). In most smokers, nicotine and these five metabolites constitutes >
80 % of the absorbed nicotine dose [37].

19
N
NCH3
N
NCH3
CH3
N
NCH3
O
N
N
CH3
O
OH
O
O
OH
OHC2OH
OH
N
N
CH3
O
N
N
CH3
N
N
CH3
O
N
N
CH3
OOH
OH
OH-C2O
N
NH
N
N
CH3
O
HO
N
N
CH3
O
OOH
OH
OH-C2O
N
N
CH3
O
O
NICOTINE (8-10 %)
Cotinine (10-15 %)
Trans-3'-Hydroxycotinine glucoronide
(7-9 %)
Cotinine glucoronide (12-17 %)
Cotinine N-oxide (2-5 %)
Nornicotine (1-2 %)
Nicotine glucoronide (3-5 %)
Trans-3'-Hydroxycotinine
(33-40%)
Other metabolites (<10%)
5'-Hydroxycotinine (<1,6 %)
Nicotine-iminium ion
Nicotine isomethonium ion
Nicotine- N'-oxide
(70-80%)
Figure 4 Primary routes of nicotine metabolism [25]
3.5 Choosing Biomarkers for tobacco exposure
In order to develop a method with sufficient discriminating power to distinguish between
different tobacco consumption patterns, compounds of interest must be identified.
This molecule should meet following requirements on its own or paired with other molecules;
tobacco specific, not measurable in significant amounts after exposure from other
sources
specific to a particular form of tobacco
present in sufficient amounts to be detected in body fluids, preferentially urine
In addition, it would be beneficial if the compound was not metabolically derived from
nicotine. This would be necessary in order to differentiate between nicotine from tobacco and
nicotine containing medicine.
The amount of the different chemical compounds measured in body fluids will vary
depending on the formulation of the tobacco product and their pharmacokinetic properties.
20
In the following sequences, different strategies of choosing these compounds will be
considered. From this section on, these compounds are referred to as biomarkers.
3.5.1 Major tobacco alkaloids
A better strategy would be to have a closer look at the composition of the tobacco plants. This
would greatly enhance the chances of finding a tobacco selective biomarker.
In general the presence of the tobacco alkaloids in human tissues can be attributed to use of
tobacco products[11]. Though low levels of nicotine have been found in tea and edible plants,
nicotine derived from dietary sources is insignificant compared with the amounts derived
from tobacco use [11, 38]. Concentrations of nicotine and its metabolites in biological fluids
are frequently used to ascertain whether or not a person is using tobacco and to estimate
nicotine intake [15]. Because nicotine is almost extensively metabolized only a small
percentage is excreted unchanged in urine (See section 3.4.2). Analysis of nicotine alone in
biological samples can provide insufficient information due to its short half-life and the
dependency of the analytical result on the time of sampling. Therefore it would be more
useful to test for nicotine metabolites which have longer half-lives and detection windows
compared to nicotine[36]. Cotinine and trans-3’-hydroxycotinine have longer half-lives and
are therefore considered as potentially more useful biomarkers for the assessment of exposure
to nicotine[36].
The ratio of nicotine:cotinine in urine of smokeless tobacco users and cigarette smokers
showed a significant difference between groups in one study [38].This is a good indication
that it might be possible to distinguish between consumption of the different tobacco products
when comparing the ratio of these metabolites in urine samples. In most smokers,
measurements of urinary nicotine, cotinine, trans-3-hydroxycotinine and their respective
glucuronic acid conjugates accounts for more than 80 % of the absorbed nicotine dose[37].
Therefore nicotine and these 5 metabolites are of great interest as biomarkers in this project,
(Figure 4). Because the glucuronic acid conjugate requires a more sophisticated and time
consuming sample preparation than the other biomarkers of interest, they were not further
investigated.

21
However, nicotine and its metabolites are present in nicotine-containing medications to
various degrees. Discrimination between nicotine from smoke, smokeless tobacco and
nicotine containing medication using only these biomarkers is probably insufficient.
3.5.2 Minor tobacco alkaloids
Minor alkaloids are present in tobacco, but not in nicotine-containing medications.
In most tobacco strains, nornicotine and anatabine are the most abundant of the minor
alkaloids, followed by anabasine. This order of abundance is the same in cigarette tobacco
and oral snuff, chewing, pipe and cigar tobacco. Nornicotine levels are the highest in cigar
tobacco, and anatabine levels are lowest in chewing tobacco and oral snuff [14]. Anabasine as
a percentage of the total alkaloids was significantly lower in oral snuff than in cigarette and
pipe tobacco [15]. The low levels of anabasine in oral snuff are due to the conversion to N-
nitrosanabasine and/or other degradation [15, 17]. Urine levels of the minor alkaloids are
shown to correlate well with systemic nicotine intake from various tobacco products and
could be useful to determine the origin of nicotine [15]. Urinary anabasine can be used as a
biomarker of tobacco use to monitor compliance to nicotine therapy. Patients abstaining from
tobacco typically use to have a urinary anabasine concentration < 2 μg/L. The mean anatabine
concentrations in urine of cigarette smokers (22ng/ml) were about half those found in urine of
smokeless tobacco users(41-45ng/ml), despite similar nicotine and cotinine levels, and
although smokeless tobacco products contain considerably lower levels of anatabine than
cigarette tobacco. A likely explanation is that anatabine is decomposed to a much greater
extent than is nicotine in burning tobacco, resulting in lesser absorbtion by cigarette smokers
than by smokeless tobacco users [38]. In subjects abstaining from tobacco but using nicotine
gum, anabasine and anatabine levels have been found to be below the cut off point of 2
ng/mL[38]. This makes the minor tobacco alkaloids promising as biomarkers to distinguish
between smoke and smokeless tobacco, as well as the use of nicotine containing medications.
3.5.3 Tobacco specific nitrosamines
The total amount of the TSNAs; NNN, NAT, and NAB, were significantly higher in urine of
smokeless tobacco/snus users compared to smokers[39]. Daily exposure to tobacco-specific
nitrosamines is estimated to about 20 μg in smokers and 68 μg in smokeless tobacco users.
This is presumably due to the conversion of tobacco alkaloids into nitrosamines during the
manufacturing and storage of smokeless tobacco products [15] (See Figure 5). Comparative

22
studies have generally shown lower levels of tobacco-specific nitrosamines in Swedish snus
than in similar products sold on the American continent[32]. Because of the considerable
differences in the concentration of the nitrosamines in the different brands of snus the
nitrosamines are less promising as biomarkers. Therefore these compounds were not further
investigated.
3.5.4 Tobacco additives as biomarkers
One possibility to discriminate between nicotine from smoke and smokeless tobacco could
theoretically be based on differences in additives used during the manufacturing of the
tobacco products. Due to legal requirements, any tobacco company that sells cigarettes in a
European country must submit a list of additives to the Department of Health in the current
country. A serious attempt to get access to this complete list of the chemical composition of
the different tobacco products in Norway was performed. The tobacco industry considers
these additives as a trade secret, and prohibits anyone who views the lists from sharing the
content with external toxicologists or others, therefore this request was denied.
In 1994, a list of the 599 additives used in the manufacture of cigarettes by the five major
American cigarette companies was published[9]. This list does not specify which compounds
are used in the different brands and makes it impossible to identify ingredients common to
one type of tobacco product.
Many of these substances are expected to be transformed formed during heating and / or
combustion as well[19]. This would further complicate the use of additives as biomarkers.
In addition, most of the tobacco additives are used in the manufacture of cigarettes and other
tobacco products approved for use by the FDA GRAS list[20]. This would mean that most of
the additives are commonly used in food and commercial products; thereby their specificity as
biomarkers to tobacco exposure is most likely insufficient.
Therefore neither tobacco additives were selected as biomarkers in this project.
3.5.5 The selected biomarkers
In order to develop a relatively time and cost efficient sample preparation step with a high
discriminating potential, the following compounds were chosen to investigate their potential
as biomarkers to distinguish between smoke and smokeless tobacco use:

23
nicotine (major tobacco alkaloid)
cotinine (nicotine metabolite, major tobacco alkaloid)
trans-3-hydroxycotinine (nicotine metabolite, major tobacco alkaloid)
anatabine (minor tobacco alkaloid)
anabasine (minor tobacco alkaloid)
nornicotine (minor tobacco alkaloid as well as nicotine metabolite)
Table 1 Concentration of the selected biomarkers expected to be measured in urine [15-17, 38, 40]
Expected urinary concentration levels (ng/mL): low medium high non tobacco user
nicotine 2 250 1000 < 20 cotinine 2 375 1500 <20 trans-OH-cot 10 625 2500 <50 anatabine 2 50 200 <2 anabasine 2 50 200 <2
nornicotine 2 50 200 <15
3.6 Basic principles of the analytical procedure
3.6.1 Sample preparation
Urine is often the body fluid of choice for human exposure assessment due to a broad
detection window and relatively non-invasive aspect of sample collection[41]. Urine is an
aqueous solution consisting of mostly water, and about five percent metabolic wastes such as
urea, dissolved salts, and organic compounds. In humans, all the water soluble wastes are
excreted by the kidneys, highly diluted in the form of urine. The sample preparation step
allows isolation of the compounds of interest and adequate up-concentration necessary in
order to reach the limit of detection looked for.
3.6.1.1 Solid phase extraction (SPE)
In solid phase extraction the analytes are being retained on a sorbent that contains different
functional groups depending on the type of column. As the solution pours trough the column,
the analytes are being retained by strong interactions with these groups on the surface of the
sorbent. The general setup for any SPE procedure consists of four steps: (1) conditioning the
SPE material by means of methanol or acetonitrile to rise the functional groups, followed by
water to remove the organic solvent form the cartridge, (2) application of the aqueous

24
biological sample to the SPE material, (3) removal of interferences by a washing step, and (4)
eluting the analytes. The most widely applied packings are based on silica or chemically-
modified silica. On these C18 – or C8-materials, the analyte retention is based on
hydrophobic interactions. Another popular packing is copolymers in mixed mode materials,
where the retention is based on combined hydrophobic interaction and ion-exchange
interactions[42].
Figure 5 Schematic diagram of a solid-phase extraction procedure[1]
3.6.2 HPLC (High performance liquid chromatography)
Chromatography is a physical separation method in which the components to be separated are
selectively distributed between two immiscible phases: a mobile phase flowing through a
stationary bed. In liquid chromatography, this mobile phase is a liquid[42]. High performance
liquid chromatography is basically a highly improved form of column chromatography where
the solvent is being forced through the column under high pressures, which allows the use of
smaller particle size for the column packing material. This provides faster and better
separation of the analytes. The column is a steel tube filled with fine-diameter packing
material. Liquid chromatography columns are typically 100-300-mm long and have an
25
internal diameter of 3-4.6 mm. The mobile phase is pumped from a bottle, trough an injector,
into the column, and out to the detector. Before injection to the column, the sample should be
dissolved in the mobile phase or a similar solvent. When injected, the sample flows with the
mobile phase trough the column[42]. The chromatographic process occurs as a result of
repeated sorption/desorption steps between the liquid phase and the stationary phase, during
the movement of the analytes along the stationary phase. Figure 6 illustrates the intra- and
intermolecular interactions between analyte molecules and mobile and stationary phase
important in sorption/desorption.
HPLC can be divided into two categories depending on the relative polarity of the solvent and
the stationary phase: Normal phase and Reversed phase.
In Normal phase HPLC, the column is filled with tiny silica particles, and the solvent is non-
polar. Polar compounds in the mixture are tighter retained to the polar silica than non-polar
compounds when eluting through the column. Therefore non-polar compounds will elute
more quickly from the column[43].
Reversed phase HPLC is the most applied form of HPLC. By attaching long hydrocarbon
chains to the surface of the silica, the columns are modified to become non-polar. Frequently
used are the silica C18 columns, containing hydrocarbon chains with 18 carbon atoms. When
a polar solvent is used, strong attractions between the polar solvent and polar molecules in the
mixture will occur. Spending most of their time moving with the solvent, the polar molecules
are less retained will elute from the column first[43]. Non-polar compounds in the mixture
will tend to form attractions with the hydrocarbon groups because of Van der Waals
interactions (Figure 6).

26
Figure 6 Various functional groups bound to the silica surface and various interaction between theese
groups and different analytes[42].
The time taken for a particular compound to travel through the column to the detector is
known as its retention time. This time is measured from the time at which the sample is
injected to the point at which the analyser measures maximum peak intensity for that
compound. Different compounds have different retention times. For a particular compound,
the retention is influenced by the nature of the stationary phase, the eluent/solvent
composition and pH together with the column temperature[42].
3.6.3 Mass analyser (ESI-MS/MS)
The separated analytes enter the mass spectrometer via the electrospray source. The eluent
from the HPLC is nebulized into small droplets by a combined action of a strong electric
potential between needle and counter electrode, and a high speed concurrent N2 flow. This
results in small droplets with an excess charge (positive or negative depending on the
operation mode of the ion-source.) In their flight between the ESI needle and the ESI source
block, neutral solvent molecules evaporate from the droplet surface. As a result, the droplet
size decreases. This reduces the distance between the excess charges at the droplet surface.
After some time, the surface tension of the liquid can no longer accommodate the increasing
Coulomb repulsion between the excess charges at the surface. At this point, a Coulomb
S i
O O H
O H
H 2 N
H O S i
N H 2
H O
S i
C N S i
V a n d e r W a a l s I n t e r a c t i o n D i p o l e - D i p o l e I n t e r a c t i o n
H y d r o g e n B o n d i n g
H y d r o g e n B o n d i n g

27
explosion (Figure 9) leads to disintegration of the droplets. This process may be repeated a
number of times, leading to smaller and smaller offspring droplets. Eventually gas phase ions
are generated and can be mass analyzed[42].
Figure 8 Electron spray ion source, reprinted with permission from Terje Wasskog
The mass spectrometer basically consists of five parts: sample introduction, ionization, mass
analysis, ion detection, and data handling[42].
After the ions have been produced, separation and filtration according to their mass-to-charge
(m/z) is performed on a mass analyser. Most commonly used for mass analysis, is the
quadrupole mass filter. This mass analyser consists of four hyperbolic or cylindrical rods that
are placed in parallel in a radial array. Opposite rods are charged by a positive or negative
+ - + -
+ - + -
- + - + -
+ -+ - +
-+-+
- + -
- + -
-
+
-
-
Spray needle tip
(capillary)
3-4kV
Multiply
charged droplet
Droplet
evaporating
Ions evaporating
from surface of
droplet
+
-
- +
-+
+
- -
+
- -
Figure 8 ref 1
Figure 7 Illustration of the mechanism of Electron spray ionization [1]

28
direct current potential at which an oscillating radiofrequency alternating-current voltage is
superimposed. Ions are introduced into the quadrupole filter, and begin to oscillate in a plan
perpendicular to the rod length as they traverse trough the quadrupole filter. At a given
combination of direct-current and alternating current applied to the rods, the trajectories of the
ions of one particular m/z are stable, and are transmitted towards the detector. Ions with other
m/z do not pass the filter because of their unstable trajectories, and are discharged on the rods
and lost in the vacuum system[42]. Triple stage quadrupole (TSQ) system was designed to
cleave ions into their daughter ions. Use of this triple quadrupole system allows so-called
MS/MS analysis.
The triple-quad system consists of a scanning (Q1) quadrupole analyser for separating the
original ion(s), an unscanned quadrupole that serves as a collision cell to fragment the ions
sent to it by collision with a heavy gas molecule, and a scanning (q) quadrupole(/hexapole)
that can separate the fragments produced in the (Q2) unit[43]. (Figure 9)
Figure 9 Triple quadrupole system, reprinted with permission from Terje Wasskog
The mass analyser system used in this project, a linear ion trap quadrupole (LTQ), is a square
array of precision-machined and precision-aligned hyperbolic rods. Each rod is cut into three
sections. Ions are ejected during scan out trough the center section rods. Quartz spacers act as
electrical isolators between adjacent rods. The four rods of each section can be considered to
be two pairs of two rods each. Application of voltage to the rod pairs produces a two
dimensional quadrupole field with the mass analyser cavity which drives ionic motion in the
redial direction[44]. Mass separation further based on the same principles as the TSQ.

29
Figure 10 Linear ion trap quadrupole (LTQ) rod assembly [44]
Mass spectrometry can be performed in two general data-acquisition modes: full-spectrum
analysis, where a series of mass spectra is acquired, and selected-ion monitoring (SIM), where
the ion abundances of preselected ions are acquired. In quadrupole instruments, acquisition
SIM mode provides a substantial gain in signal-to-noise ratio(S/N)[42, 43]. The following
four different MS/MS operating modes exist:
Table 2 MS/MS operating modes
Q1 Q2 Technique
SIM Scan MRM
SIM SIM Product ion scan
Scan SIM Parent ion scan
Scan Scan Neutral loss
3.6.4 LC-MS/MS
An LC/MS system is an HPLC pumping system, injector and column coupled to a mass
spectrometer through some type of evaporating ionizing interface (ESI). A computer system
coordinates the components of the system together by providing control of the HPLC for
flow, solvent gradient and remote starting of injection and the gradient run. It also provides
control of the ion source parameters, mass spectrometry scan range and lens in addition to
access and process data from the ion detector amplifier. The digital data is then processed by
the computer software to provide a total ion chromatogram and the molecular weights of the
compounds in the peaks detected using mass spectrometer’s spectral data[42, 43]. Coupling
MS with LC as a separation technique provides a valuable mean for identification and
quantitation.

30
Figure 11 Overview triple quadruple-MS, Reprinted with permission from Terje Wasskog, the Finningan
LTQ mass analyser is based on same principle, except separation is 2D instead of 3D as demonstrated in
this figure.
3.7 Method validation
Bioanalytical method validation includes all of the procedures that demonstrate that a
particular method used for quantitative measurements of analytes in a given biological matrix
is reliable and reproducible for its intended use. This following section is a brief presentation
of important parameters of such a validation process.
The precision of an analytical method describes the closeness of individual measures of an
anlayte when the procedure is applied repeatedly to multiple aliquots of a single homogenous
volume of biological matrix. In order to meet both FDA [45] and IHC[46] guidelines,
precision should be measured using a minimum of 9 determinations over a minimum of 5
concentrations levels covering the specified range. The precision determined at each
concentration level should not exceed 15% of the coefficient of variation (or 20% for the
LLOQ). Precision is subdivided into estimates of repeatability (CVr), and intermediate
imprecision (CVR). Repeatability expresses the precision within the same run, while
SPE HPLC ESI MS/MS
Figure 12 Overview of the analytical procedures used in this thesis

31
intermediate imprecision express precision between measurements performed in different
days. Precision is for both categories expressed as RSD, relative standard deviation (%).
Trueness, is described as the closeness of agreement between the average value obtained from
a large serious of test results and an accepted reference value. The measure of trueness is
usually expressed in terms of bias. Trueness is related to the systemic errors of an analytical
procedure[46].
Figure 13 Illustration of validation parameters, trueness
The accuracy of an analytical method describes the closeness of mean test results obtained by
the method to the true value of the analyte. Accuracy is determined by replicate analysis of
samples containing known amounts of the analyte. Accuracy should be measured using a
minimum of 5 determinations per concentration. A minimum of 3 concentration in the in the
expected concentration range is recommended by the FDA[45] ICH, on the other hand
suggests a minimum of 9 determinations over a minimum of 3 concentration levels covering
the specified range[46]. The mean value should be within 15% of the actual value (20% for
LLOQ). The deviation of the mean from the true value serves as the measure of accuracy.
Accuracy is defined as the percent relative error (%RE) and was calculated using the
following formula %RE = (E − T)(100/T) where E is the experimentally determined
concentration and T is the theoretical concentration[45]

32
Figure 14 Illustration of validation parameters, accuracy
The linearity of an analytical procedure is its ability to obtain test results which are directly
proportional to the concentration (amount) of analyte in the sample. Method linearity should
be determined concurrently during the accuracy study. Correlation between recalculated
values and theoretical values, expressed as y = ax + b, y is the recalculated values, x is the
slope of the curve, x is the theoretical values and b is the value where the curve crosses the y
axis. Slope values should be as close to 1 as possible, and R2 values above 0,995, for the
method to be considered linear and valid over the selected range. The measured values should
be as close as possible to the theoretical values[45].
The true performance of the method-bias and precision are unknown. The experiments
performed during the validation phase will only provide estimates of bias and precision. How
reliable those estimates are depends on the experiments. Design and sample size have to be
carefully chosen in order to obtain reliable estimates.
Detection limit (LO ) is the lowest amount of analyte in a sample which can be detected but
not necessarily quantitated as an exact value[46].
Quantitation limit (LOQ) is the lowest amount of analyte in a sample which can be
quantitatively determined with suitable precision and accuracy. The quantitation limit is a
parameter of quantititative assays for low levels of compounds in sample matrices, and is used
particularly for the determination of impurities and/or degradation products [46].

33
Selectivity is defined as the ability of a method to differentiate an analyte in the presence of
other components in the sample. Selectivity should be assessed by analyzing at least six
sources of blank samples of appropriate matrix. Each blank should then be tested for
interference and selectivity should be established at the LOQ[45].
The recovery of an analyte in an assay is the detector response obtained from an amount of the
analyte added to and extracted from the biological matrix, compared to the detector respons
obtained for the true concentration of the pure standard. Recovery pertains to the extraction
efficiency of an analytical method within the limits of variability. Recovery of the analyte
need not be 100%, but consistent, precise and reproducible. Recovery experiments should be
performed by comparing the analytical results for extracted samples at three concentration
levels (low, medium and high) with unextracted standards that represents 100% recovery.
Stability of the analyte in biological matrix at intended storage temperatures should be
established. The influence of freeze-thaw cycles should be tested by a minimum of 3 cycles at
2 concentrations in triplicate[45].
4 EXPERIMENTAL
4.1 Reagents and chemicals
Nicotine, cotinine, anabasine and anatabine and were purchased from Sigma-Aldrich
(produced by Fluka). Trans-3’-hydroxycotinine and anatabine were obtained from Toronto
Research Chemicals. The internal standards (R,S)-Anatabine-2,4,5,6-d4 and Trans-3’-
hydroxycotinine- methyl-d3 were purchased from Toronto Research Chemicals, whereas
Nicotine-D4 was supplied by LGC Standards, (produced by Cerillant) and Cotinine-D3 was
supplied by Prochem, (produced by Cerillant). Methanol (> 99, 9%) was obtained from Merck
Chemicals (Darmstadt, Germany). Acetonitrile HPLC (> 99, 9%) was purchased from
Biosolve Chemicals (Valkenswaad, Netherlands). Ammonium hydroxide (>25 %) was
supplied by Sigma-Aldrich (prodused by Fluka Analytical)
KH2PO4(99.5-100.5 %) , Na2HPO4 (>98 %) and HCl( >37 %) fuming was purchased from
Sigma-Aldrich (St. Louis, USA). Formic acid was supplied by Sigma-Aldrich, produced by
Fluka Analytical. NaOH pellets (>99 %) was purchased from VWR International (Leuven
Belgium). Liquid nitrogen TP 100 and Helium (99%) Alphagaz-HE (collision gas) was

34
supplied by Carbagas(Domididier, Switzerland). The nitrogen gas was produced by the N2-
Mistral-Ofrom DBS nitrogen generator. Purchased from Analythical Instrument (Vigonza,
Italy). All chemicals and reagents were HPLC grade (≥99% purity)
Ultrapure water was produced by a Milli-Q Gradient A10 water purification system with a Q-
Gard® 2 and a Quantum™ EX Ultrapure organex cartridge purchased by Millipore Corp.
N
N
CH3
D
D
D
D
N
N
O
CD3
N
NH
D
D
D
DN
N
O
CD3
OH
Nicotine-d4
Mw 166.26
pKa 7.94 (8.13)
Cotinitine-d3
Mw 179.11
PKa 4.88
Trans-3'-hydroxycotinine- methyl-d3
Mw 195.23
PKa 4.50
(R,S)-Anatabine-2,4,5,6-d4
Mw 164.24
PKa 8.23
Figure 15 Chemical structures of reference standards
4.2 Material and equipment
The LC-MS/MS system used for the assay comprised a Rheos 2000 CPS-LC system pump
(Flux Instrument, Basel, Switzerland) and a HTS Pal autosampler (CTC analytics AG,
35
Zwingen, Switzerland) coupled to a linear ion trap mass spectrometer LTQ-MS
(ThermoFinnigan, San Jose, CA, USA), equipped with an atmospheric pressure
ionisation(API) interface, Ion MAX™. Mass spectrometric analysis was conducted using a
Quattro Premier XE™ triple quadrupole mass spectrometer (Waters ® Corporation, Milford,
MA) with MassLynx™ v 4.1 software. The separation was performed on a Luna® HILIC
Phenomenex 150 x 2.0 mm column with 3 µm particles, 200 Å pore diameters.
For evaporation of the samples, a Pierce ReactiVapTM III Evaporator with 24 ports,
(Pierce&Rochford, USA) was used. For centrifugation a Multifuge 3S from Thermo electron
corporation (Osterode, Germany) or a Heraeus Multifuge 3S+ from Thermo Scientific
(Osterode, Germany) was used. Oasis®
HLB (1cm3 x 30 mg) SPE cartridges was obtained
from Waters Corporation (Milford, MA, US) VisiprepTM
24 was used for extraction of all the
samples prepared by SPE, and the vacuum pump used was a KNF neuberger vacuumpump
(Balterswil, Switzerland).
4.3 Sample preparation and extraction
One ml urine sample and 1 ml phosphate buffer (0. 2 M, pH 7) were transferred into a tube
and 10 µL of a 10ng/mL internal standard solution was added. The samples were centrifuged
for 10 min at 3500 rpm.
The Oasis HLB (1cm3 x 30 mg) SPE cartridges were conditioned with 1.0 ml of methanol, 1
ml of H20 prior to loading with 2 ml of buffered sample solution.
1 ml of 2% NH4OH/H2O solution was used to rinse the cartridges prior to eluting with 1 mL
MeOH.
Extracts were collected in conical tubes and evaporated carefully to dryness under a stream of
air at 50 °C. Extracted urine residues were reconstituted in 500μL of a solution of the HPLC
mobile phase constituents’ acetonitrile and formate buffer (0.1 M, pH 3) in 90:10 (v/v), and
transferred into microvials. This SPE technique was developed on the basis of a previously
published method:[41].

36
Pre-treatment 1 ml Urine sample
1 ml Ph. Buffer (0, 2 M, pH 7) +IS
Centrifugation 2500 rpm for 5 min
SPE: Conditioning 1 ml MeOH
1 ml H2O
Sample loading 2 x 1 ml Urine/Ph. Buffer (0. 2 M, pH 7)
solution
Rinsing 1 ml 2 % NH4OH/H20
Eluting 1 ml MeOH, collected in conical tubes
Wash 2 250 µl CH3OH
Evaporation Gently for 35 min w/air, 50
oC,
Re-dissolving 500 µl 9:1 ACN/
Formate buffer (0.1M, pH 3)
Transferring sample into microvials 500 µl of 5 % NH4OH in CH3OH
Figure 16 Extraction method used on Oasis HLB cartridges

37
4.4 Liquid chromatography- tandem mass spectrometry conditions
For the chromatographic separations, 0,1M ammonium formate buffer, pH 3 and acetonitrile
were used as mobile phase with the following gradients:
Table Table 3 HPLC optimal gradient table
No Time
(min)
% Solvent
A
%
Solvent B
Flow rate
(µl/min)
0 0 2 98 250
1 3 2 98 250
2 7 65 35 250
3 10 65 35 250
4 11 2 98 250
5 13 2 98 250
Solvent A: Formiate buffer pH 3
Solvent B: Acetonitrile
Before every set of analyses a conditioning step was performed at a flow rate of 250 μL
min−1 for 10 min, the injected volume was 10 μL. The column and the autosampler tray
temperatures were set at 30 °C and 4 °C, respectivley.
The mass spectrometer was operated in positive ESI mode. One MRM transitions was
monitored for each analyte. MS operating conditions were set as follow: spray voltage= 5.0
kV; heated capillary voltage and temperature of 10V and 320°C, respectively; ionization
width of 1.5 Da; activation time= 30 ms; activation q of 0.250 and scan time was fixed at 30
ms. Sheath gas, auxiliary gas and sweep gas (nitrogen) were set at 20, 5 and 1,5 respectively.
Analyte-specific normalized collision energies, MRM transitions and retention times are
provided in table 5.
Table 4 Liquid chromatography-electro spray ionization-tandem mass spectrometry parameters
Analyte tR
(min)
tR SD
(min)
Collision
energy
(AU)
MRM transitions
Nicotine 3.38 0.19 25 163.10 → 132
Nicotine-d3 3.39 0.04 25 167.10 → 134
Cotinine 2.19 0.01 28 177.10 → 98
Cotinine-d3 2.16 0.18 28 180.10 → 100
Trans-OH-cot 2.36 0.01 26 193.10 → 134
Trans-OH-cot-d3 2.37 0.01 26 196.10 → 134
Anatabine 5.28 0.15 23 161.10 → 144
Anatabine-d4 5.3 0.14 23 165.10 → 148
Anabasine 6.21 0.16 25 163.10 → 146
Nornicotine 7.03 0.07 26 149.10 → 132

38
4.4.1 Method Validation
4.4.1.1 Collection of anayte free urine
Analyte-free urine used in method development and validation was collected from nicotine-
abstinent members of the Swiss anti doping laboratory, unexposed to environmental smoke
the last 48 h.
For the quantitative validation, urine samples were collected from two individuals at 9 am of
the initiation day. The urine was merged in one bottle, stored in the fridge and used during the
following days of the validation.
4.4.1.2 Choice of internal standards
As internal standard the deuterated standards of nicotine, cotinine, trans-3-hydroxycotinie and
anatabine, respectively nicotine-d4, cotinine-d3, trans-3-hydroxycotinie -d3 and anatabine-d4
were purchased. These are presented with structural formulas in Table 16.
When calculating the peak area ratios, the peak area of the standard was divided on the peak
area of the respective internal standard. The internal standard was not available for the
compounds anabasine and nornicotine, thus anatabine-d4 was used as refrence standard for
these two analytes as well. Since anatabine, anabasine and nornicotine have quite similar
chemical properties, it was defendable to use anatabine-d4 as internal standard for anabasine
and nornicotine as well.
4.4.1.3 Assessment of specificity
The specificity of the method was assessed by the analysis of analyte-free urine samples from
six individuals. All individuals were nicotine abstinent and non-exposed to significant
amounts of environmental smoke the last 48 hours. The urines were collected from both males
and females, all personnel within the Swiss anti doping laboratory. In addition, urine of one
child was analysed as well. Each sample was treated according to the developed method to
highlight the absence of interfering peaks observed at the retention times for nicotine,
nicotine-d3, cotinine, cotinine d-3, trans-3-hydroxycotinie, trans-3-hydroxycotinie -d3,
anatabine, anatabine-d4, anabasine and nornicotine. For each individual urine, following
analysis were performed; one analysis of pure (analyte free) urine, a second analysis of pure
urine spiked with 100 ng/mL of the respective IS. And a third analysis of pure urine spiked
spiked with100ng/mL of anabasine and nornicotine standards, since their respective internal
standards were not available. In total18 urine samples were extracted and treated to assess the
specificity of the analytes.

39
4.4.1.4 Quantitative analysis
Quantitative analysis was performed for all the selected biomarkers within the range of 10 to
10000 ng/mL for nicotine, cotinine and trans-3-hydroxycotinie, and the range of 10 to 500
ng/mL for anatabine, anabasine and nornicotine.
The calibration process was performed over three days. Calibration standards at two
concentration levels (k=2) and validation standards at three concentration levels (k=3) were
prepared in triplicate (n=3) for each day. Concentrations levels of the calibration and
validation standards are given in Table 6.
Table 5 Table of spiked amounts of calibration and validator standards (ng/ml)
Analyte Calibration standards
(ng/mL)
Validator standards
(ng/ml)
Nicotine 10, 10000 10, 5000, 8500
Cotinine 10, 10000 10, 5000, 8500
Trans-OH-cot 10, 10000 10, 5000, 8500
Anatabine 10, 500 10, 250, 400
Anabasine 10, 500 10, 250, 400
Nornicotine 10, 500 10, 250, 400
Calibration curves for each analyte were plotted with peak ratio values of analyte peak area
over internal standard peak area. Estimates of trueness, repeatability and intermediate
precision were calculated at each concentration level. Trueness was expressed in percent as
the closeness of agreement between the average concentration obtained from the
measurements and the theoretical concentrations. Assessment of precision was performed by
calculating repeatability (CVr), expressed the precision within the same run, and intermediate
imprecision express as precision between the measurements of different days. Both
repeatability and intermediate precision was expressed in percent as relative standard
deviation (RSD).
4.4.2 Method application to snus and cigarette samples
The present analytical procedure was applied for the determination of nicotine, cotinine,
trans-3-hydroxycotinie, anatabine, anabasine and nornicotine in urine of one smoker (female)
and one snuser (male). Both volunteers had been nicotine deprived over night.

40
The first urine sample was collected one hour after consuming of one unit of the respective
tobacco product. The next three urine samples were collected throughout the day. Two
calibrators at the LOQ and ULOQ determined during method validation were used for the
generation of the calibration curve. The ability of the assay to determine reliable
concentrations of the analytes was assessed by using Quality Control (QC) samples. Two
quality control (QC) samples were prepared at a one concentration level (100ng/mL, of each
analyte and internal standard). The QC samples were used as a reference to determine
suitability of the calibration curve to calculate concentration levels in unknown samples. The
obtained calibration curve was used to back-calculate the concentrations of samples.
Trueness, expressed as bias, was determined at each concentration level.
5 RESULTS AND DISCUSSION
5.1 Method development
5.1.1 Chromatography and mass spectrometry
5.1.1.1 Selecting MS parameters
Each compound was infused separately by a Hamilton syringe (250µl) to the MS for detection
of the precursor and fragment ions. The daughter ion with highest intensity that was specific
for its representive biomarker. See table 3
Collision energies (AU) were selected for the individual analytes through manual tuning. The
optimal collision energy that optimized the fragmentation of the precursor ion towards the
fragment ion response was chosen in order to obtain the highest abundance response of the
fragment ion. See Table 3 and 4. Appendix for the respective ms-spectres for the chosen
transitions for each analyte.
5.1.1.2 Selecting chromatographic parameters
When choosing HPLC column, a Waters X Bridge C18 column, (150 x 2.0 mm, with 3 µm
particles) was compared to a Luna® HILIC Phenomenex (150 x 2.0 mm, 3 µm particles)
column. On the Waters X Bridge column, which is a traditional reversed- phase
chromatography column, the retention decreases with increasingly polarity of the analyte. In
this project, tobacco alkaloids should be separated. The tobacco alkaloids are basic

41
compounds, and are on ionic form when the pH is below their pKa value. On ionic form, such
analytes show little retention on traditional C-18 sorbents.
A buffer is frequently used to control the pH, and indirectly the degree of ionization of such
polar compounds. Phosphate buffers are widely applied in this purpose, since they cover a
wide pH range and show good buffer capacity. However, in LC-MS/MS application,
phosphate buffers must be replaced by volatile alternatives, such as ammonium formate[42].
These buffer solutions have inferior buffer capacities than the phosphate buffers, thus they are
less suited to prevent ionization of the analytes. Because of this problem, the polar alkaloids
are expected to have poor retention on this column, which was demonstrated during method
development experiments. On this column, it was difficult to obtain good separation of the
analytes. Compositions of mobile phase are given in table 4 in the appendix.
The Luna® HILIC Phenomenex columns retain a water-enriched layer on the surface of the
silica, which facilitates the transfer of polar compounds into the stationary phase for increased
retention. Separation is achieved through the partitioning of polar solutes from a high
concentration, water-miscible, organic mobile phase into this hydrophilic environment,
resulting in increased retention of polar solutes and elution in the order of increasing
hydrophilicity[47]. On this column, ionization of the alkaloids is an advantage, providing
optimal condition for separating the selected biomarkers by hydrophilic interactions with the
sorbent of the column. This column allows retention for polar compounds such as the
alkaloids, and the elution order is typically the opposite of that for reversed phase with the
most polar compounds eluting after the non-polar compounds, resulting in an alternative
selectivity[2, 47]. As expected, better separation was observed on this column compared to
the Waters-X-bridge. Satisfactory separation of all the analytes was obtained; therefore this
column was further used in this project. Ammonium phosphate buffer solution (0,1M pH 3)
and acetonitrile was chosen as mobile phases. Experiments with different mobile phase
compositions were performed, demonstrating better separation obtained by graded mobile
phase composition than with isocratic. The best suited gradients for separating the analytes on
the Luna® HILIC Phenomenex column is given in Table 2.

42
Figure 17 Chromatogram presenting separation of the selected analaytes obtained on the Luna® HILIC
Phenomenex column. RT: retention time.
5.1.2 Sample preparation
5.1.2.1 LLE vs. SPE
Several sample preparation techniques for nicotine and its metabolites in biological specimens
have been described in the literature; protein precipitation, centrifugal clarification, solid
phase extraction and liquid-liquid extraction [41, 48-50].
Solid phase extraction methods gave the best peak-to-noise ratios in initial experiments, and
were therefore chosen for further investigation.
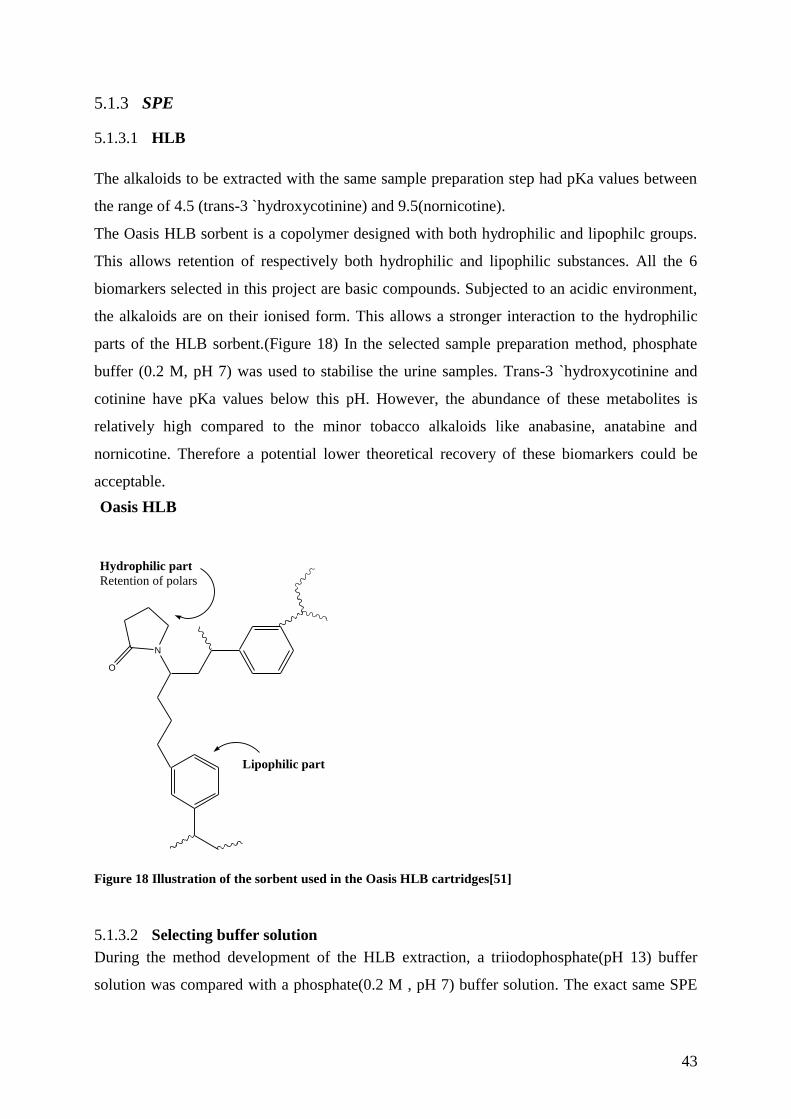
43
5.1.3 SPE
5.1.3.1 HLB
The alkaloids to be extracted with the same sample preparation step had pKa values between
the range of 4.5 (trans-3 `hydroxycotinine) and 9.5(nornicotine).
The Oasis HLB sorbent is a copolymer designed with both hydrophilic and lipophilc groups.
This allows retention of respectively both hydrophilic and lipophilic substances. All the 6
biomarkers selected in this project are basic compounds. Subjected to an acidic environment,
the alkaloids are on their ionised form. This allows a stronger interaction to the hydrophilic
parts of the HLB sorbent.(Figure 18) In the selected sample preparation method, phosphate
buffer (0.2 M, pH 7) was used to stabilise the urine samples. Trans-3 `hydroxycotinine and
cotinine have pKa values below this pH. However, the abundance of these metabolites is
relatively high compared to the minor tobacco alkaloids like anabasine, anatabine and
nornicotine. Therefore a potential lower theoretical recovery of these biomarkers could be
acceptable.
N
O
Oasis HLB
Hydrophilic part
Retention of polars
Lipophilic part
Figure 18 Illustration of the sorbent used in the Oasis HLB cartridges[51]
5.1.3.2 Selecting buffer solution
During the method development of the HLB extraction, a triiodophosphate(pH 13) buffer
solution was compared with a phosphate(0.2 M , pH 7) buffer solution. The exact same SPE
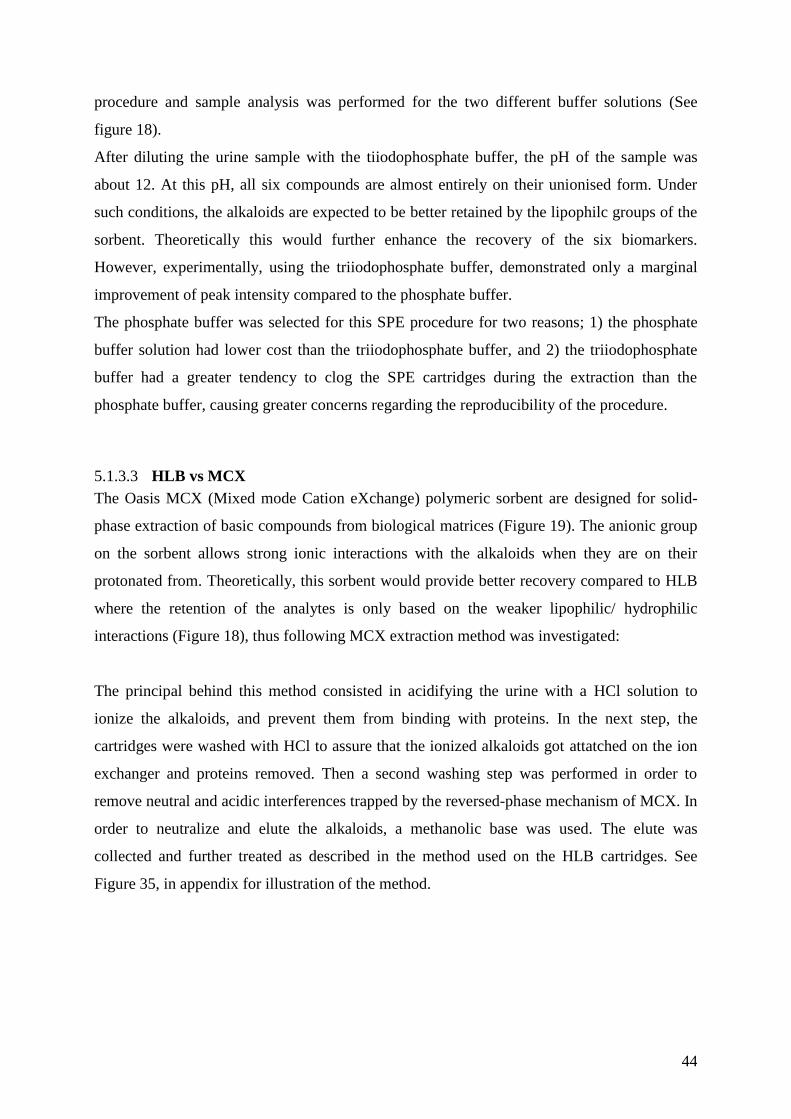
44
procedure and sample analysis was performed for the two different buffer solutions (See
figure 18).
After diluting the urine sample with the tiiodophosphate buffer, the pH of the sample was
about 12. At this pH, all six compounds are almost entirely on their unionised form. Under
such conditions, the alkaloids are expected to be better retained by the lipophilc groups of the
sorbent. Theoretically this would further enhance the recovery of the six biomarkers.
However, experimentally, using the triiodophosphate buffer, demonstrated only a marginal
improvement of peak intensity compared to the phosphate buffer.
The phosphate buffer was selected for this SPE procedure for two reasons; 1) the phosphate
buffer solution had lower cost than the triiodophosphate buffer, and 2) the triiodophosphate
buffer had a greater tendency to clog the SPE cartridges during the extraction than the
phosphate buffer, causing greater concerns regarding the reproducibility of the procedure.
5.1.3.3 HLB vs MCX
The Oasis MCX (Mixed mode Cation eXchange) polymeric sorbent are designed for solid-
phase extraction of basic compounds from biological matrices (Figure 19). The anionic group
on the sorbent allows strong ionic interactions with the alkaloids when they are on their
protonated from. Theoretically, this sorbent would provide better recovery compared to HLB
where the retention of the analytes is only based on the weaker lipophilic/ hydrophilic
interactions (Figure 18), thus following MCX extraction method was investigated:
The principal behind this method consisted in acidifying the urine with a HCl solution to
ionize the alkaloids, and prevent them from binding with proteins. In the next step, the
cartridges were washed with HCl to assure that the ionized alkaloids got attatched on the ion
exchanger and proteins removed. Then a second washing step was performed in order to
remove neutral and acidic interferences trapped by the reversed-phase mechanism of MCX. In
order to neutralize and elute the alkaloids, a methanolic base was used. The elute was
collected and further treated as described in the method used on the HLB cartridges. See
Figure 35, in appendix for illustration of the method.
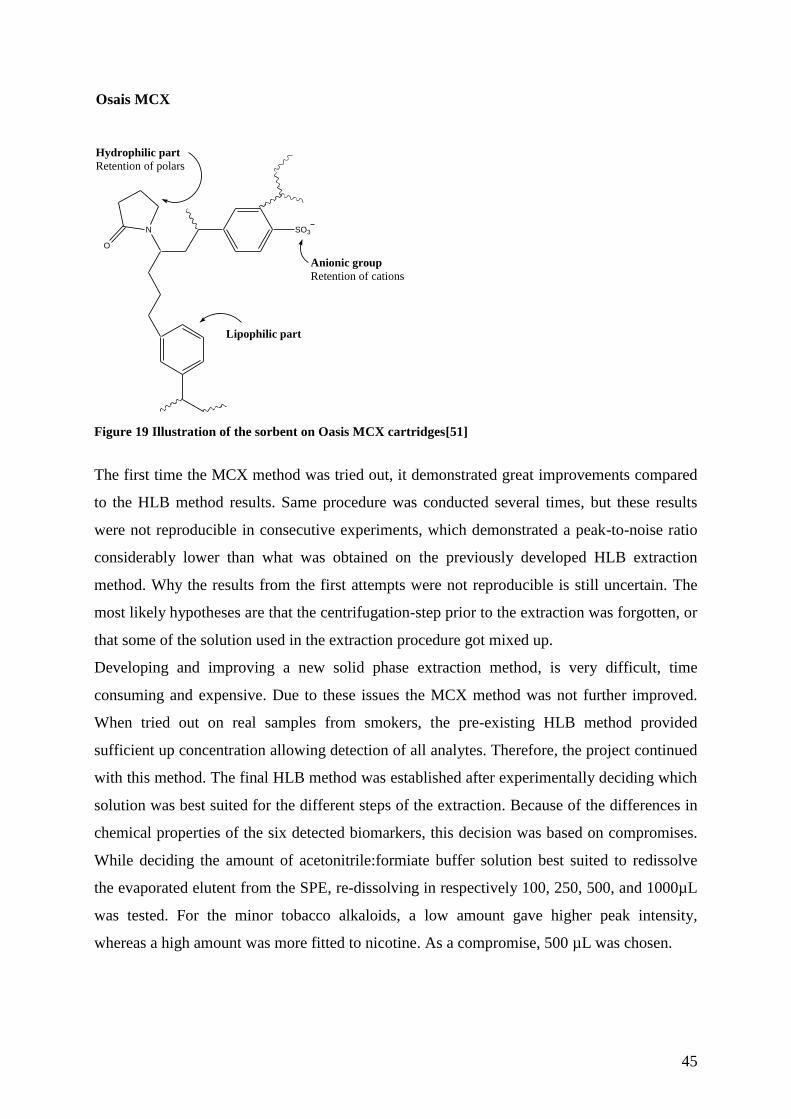
45
N
O
SO3
Osais MCX
Hydrophilic part
Retention of polars
Lipophilic part
Anionic group
Retention of cations
Figure 19 Illustration of the sorbent on Oasis MCX cartridges[51]
The first time the MCX method was tried out, it demonstrated great improvements compared
to the HLB method results. Same procedure was conducted several times, but these results
were not reproducible in consecutive experiments, which demonstrated a peak-to-noise ratio
considerably lower than what was obtained on the previously developed HLB extraction
method. Why the results from the first attempts were not reproducible is still uncertain. The
most likely hypotheses are that the centrifugation-step prior to the extraction was forgotten, or
that some of the solution used in the extraction procedure got mixed up.
Developing and improving a new solid phase extraction method, is very difficult, time
consuming and expensive. Due to these issues the MCX method was not further improved.
When tried out on real samples from smokers, the pre-existing HLB method provided
sufficient up concentration allowing detection of all analytes. Therefore, the project continued
with this method. The final HLB method was established after experimentally deciding which
solution was best suited for the different steps of the extraction. Because of the differences in
chemical properties of the six detected biomarkers, this decision was based on compromises.
While deciding the amount of acetonitrile:formiate buffer solution best suited to redissolve
the evaporated elutent from the SPE, re-dissolving in respectively 100, 250, 500, and 1000µL
was tested. For the minor tobacco alkaloids, a low amount gave higher peak intensity,
whereas a high amount was more fitted to nicotine. As a compromise, 500 µL was chosen.

46
5.2 Method Validation
5.2.1 Selectivity
The selectivity of the four the internal standars was visually determined by absence of
interfering peaks at the selected MRM transitions in the negative urine samples. In the
samples spiked with the IS, one peak appeared in each chromatogram absent in the samples of
blank urine. This experiment suggests sufficient selectivity of all internal standards in urine
(Figure 20) Selectivity of nicotine, cotinine, trans-3’-hydroxycotinine, anatabine, anabasine
and nornicotine was confirmed by the absence of interfering peaks at the selected MRM
transitions with good peak shape and a S/N of >3 with a RT within ±2% of the corresponding
deuterated analogue.(Figure 21) Whereas for anatabine and nornicotine, selectivity was
established by comparing blank urine to urine spiked with the respective standards, since the
deuterated analogues were not available. Peaks appeared in the urine spiked with the
standards, and absence of interfering peaks at the selected MRM transitions with a RT within
±2% of the corresponding analogue demonstrated selectivity of these compounds (Figure 22).
This experiment ensures the selectivity of the method.
Figure 20 Selectivity test of internal standards, no interferences observed in the blank urine at selected MRM
transitions at ±2% of the RT observed in the samples spiked with IS

47
Figure 21 Selectivity test nornicotine and anabasine, blank (negative) urine compared to spiked urine, no
interferences observed in the blank urine at selected MRM transitions at ±2% of the RT observed in samples
spiked with standards
Figure 22 Selectivity test nicotine, cotinine, trans-OH cotinine and anatabine. Negative urine was compared
to the negative urine spiked with IS-only, no interferences observed in the negative urine at selected MRM
transitions with a RT within ±2% of the corresponding analogue.

48
5.2.2 Quantitative validation
The calibration curve was plotted with nominal concentration to peak area ratios (peak area of
standard/peak area of internal standard). The peaks were automatically integrated on the
Xcalibur program, and calibration graphs were generated using Microsoft® Office Excel 2007.
Un-weighted and weighted (1/x, 1/x2
and log x)
standard curve fittings were evaluated, and
un-weighted linear regression was established as the best suited for the detected analytes.
With un-weighted linear regression, linearity determination coefficients (R2) were obtained of
> 0.985 for nicotine, >0.985 for cotinine, >0.982 for trans-3-hydroxycotinie, >0.980 for
anatabine and >0.976 for anabasine, and > 0.961 for nornicotine, respectively. Repeatability
values were estimated to be within ranges of 7.1-13.6 % at each concentration level for all the
analytes, and intermediate imprecision was estimated at 9.0-15.0%, respectively. Accuracy
profile for each analyte is given in the Appendix. At all concentration ranges for each analyte,
the accuracy was estimated to be within acceptance criteria of ± 30 %. In this simplified
validation method, calibration standards were prepared at only two concentration levels (k=2).
Additionally, the mean recalculated value should be within 15% of the theoretical value at all
concentration ranges except for the LLOQ (within 20%). The selected acceptance criteria of ±
30% is outside these recommendations. For the aim of this project a wider accuracy
acceptance range was tolerated.
Figure 23 Correlation between recalculated values and theoretical values of nicotine. The red points
represent the mean measured values; the blue lines represent the estimated deviation from the mean. The
theoretical values should be as close as possible to the measured values. Correlation curves of cotinine,
trans-3-hydroxycotinie, anatabine, anabasine and nornicotine are given in the appendix.
49
Figure 24 Accuracy profile of nicotine, See appendix for accuracy profile of the other analytes.
According to the FDA and ICH guidelines, the standard curve should consist of a minimum of
six standards points over the entire range of expected concentrations. In order to meet this
criteria with the selected validation design, the calibration standards should have been
prepared at three concentration levels (k=3), instead of two.
In the first attempt of validation, the calibration was performed with three successive series, at
six calibration standards levels (k=6) and five validation standards concentration levels (k=5),
prepared in triplicate (n=3). However, sufficient linearity was not obtained. In the first
attempts, this was due to wrong composition of solvent used in re-dissolution of the extracted
samples. The second attempt was unsuccessful presumably due to inaccurate measurements.
This suspicion was confirmed by six consecutive reinjection of same sample that revealed
>20% variation in the peak area of standard/peak area of internal standard ratios. The
equipment got fine tuned, and quantitative validation was reattempted. Satisfying accuracy
profiles were obtained for all three series. Unfortunately, the working solutions had been
incorrectly prepared. This was discovered first after fully validation had been completely
conducted and all data processed. These problems encountered during quantitative validation
required introduction of a simplified validation. If the method should be applied to routine
analysis, a more robust quantitative validation must be preformed, including determinations of
matrix effect and total extraction recovery for each analyte as well.
0.0%
20.0%
40.0%
60.0%
80.0%
100.0%
120.0%
140.0%
0 1000 2000 3000 4000 5000 6000 7000 8000 9000
Accuracy profile Nicotine

50
5.2.3 Method sensitivity
Method sensitivity was experimentally determined during the quantitative validation. The
LOQ was defined as the lowest standard in the calibration graph that produced a S/N ratio of
≥10 for the selected MRM transitions with acceptable precision and accuracy. The LOQ was
determined as 10ng/mL for nicotine, cotinine and trans-3-hydroxycotinie, anatabine,
anabasine and nornicotine. Whereas the ULOQ was experimentally demonstrated at 10000
ng/mL for nicotine, cotinine and trans-OH-cotinine and 500 ng/mL for anatabine, anabasine
and nornicotine.
5.3 Application of the method
At least one of the QC samples at each concentration levels (>3) should be within 15% of the
nominal value. In this experiment, only one concentration level of QC samples was prepared,
of which neither of the duplicates passed the acceptance criteria set by FDA guidelines.
According to FDA requirements, the run should have been rejected if it was applied in routine
analysis.
This experiment was conducted with objective to evaluate whether or not the developed
method could work as intended, thus the result could still provide useful information.
Regardless of these concerns in relation to the reliability of the method, the results were
interpreted.
In urine of the cigarette smoker, the analytes were detected within the following concentration
ranges; 10.5-676.6 ng/mL for nicotine, 202.9-339,0 ng/mL for cotinine, 550-1047 ng/mL for
trans-3-hydroxycotinie, 9.9-19.8 ng/mL for anatabine, 6.6-15.3 ng/mL for anabasine and 13.3-
63.9 ng/mL for nornicotine. Whereas for the snuser, the analytes were detected within the
ranges of 6.1-63.7 ng/mL for nicotine, 133.4-201.8 ng/mL for cotinine, 345.4-416.4 ng/mL
for trans-3-hydroxycotinie, 345.4-450.1 ng/mL for anatabine, 5.4-7.0 ng/mL for anabasine
and 7.5-31.9 ng/mL for nornicotine. (See table 5 for further information)

51
Table 6 Measured analyte concentration (ng/mL), (* = < LOQ, - = < LOD)
measured analyte concentration (ng/ml)
nicotine cotinine trans-OH-cot anatabine anabasine nornicotine
cigarette samples
1. sample 676.6 339 1047.5 19.8 15.3 63.9
2. sample 109.5 202.9 550 9.9* 6.6* 25.8
3. sample 14.7 269.5 725 - - 13.3
4. sample 10.5 299.4 937.7 - - 18.3
snus samples
1. sample 39.4 201.8 416.4 - - 7.5*
2. sample 63.7 180.9 345.4 5.4* 6.4* 19.6
3. sample 6.8* 163.1 356.7 7* 6.3* 31.9
4. sample 6.1* 133.4 450.1 - - 12.7
These measurements suggest that smokers accumulate higher levels of nicotine, cotinine and
trans-3-hydroxycotinie than snusers. The measured urinary concentration of tobacco alkaloids
is influenced by variations in tobacco product composition, as well as inter-individual
differences in the pharmacokinetic of the respective alkaloids measured. When urine is
collected from smokers and snusers after free tobacco use, they tend to have about the same
nicotine and cotinine levels despite these differences in tobacco composition.This may be
attributed to individual adjustments of tobacco consumption frequency in order to obtain most
favourable nicotine plasma concentrations. The participants of this experiment consumed only
one tobacco-unit each, thus they were not able to compensate for any such influencing factors
as they presumably would have done in “real” life. Due to these issues, comparing ratio of the
measured analytes would provide more useful information.
According to the literature, best chances of finding ratio differences are by comparing
nicotine:cotinine, nicotine:anatabine, and nicotine:anabasine ratios[38]. When interpreting the
measured results, no such difference was observed in the nicotine:cotinine ratio between the
snus and cigarette samples(See table 8). However, differences in nicotine:anatabine,
cotinine:anatabine and trans-3-hydroxycotinie:anabasine were observed between the two
groups. The nicotine:anatabine and trans-3-hydroxycotinie:anabasine ratio values were
remarkable higher in the cigarette samples than in the snus samples, indicating a higher
consentation of the minor tobacco alkaloids compared to the major tobacco alkaloids in the
urine of snus users. The same trend was seen in the nicotine:anatabine ratios as well, even
though there was a slightly overlap between the groups. These findings correlates well with

52
results presented in a published study, where higher nicotine:anatabine ratio in urine of
smokers than smokeless tobacco users was observed [38].
Table 7 Ratio range intervals. √: overlap of concentration ranges between the two compared groups, ×: no overlap in ratio ranges between the groups (This table is a simplified presentation of information from
table 10, see appendix.)
investegated ratios
ratio ranges
cigarette samples snus samples overlap
nicotine: cotinie 0.0-2.0 0.0-0.4 √ nicotine: trans-OH-cot 0.0-0.7 0.0-0.2 √ nicotine: anatabine 11.1-34.2 1,0-11.8 (√) nicotine: anabasine 16.6-44.2 1.1-10.0 × nicotine: nornicotine 0.6-10.6 0.2-5.3 √ cotinine: anatabine 17.1-20.5 23.3-33.5 × cotinine: anabasine 22.2-30.7 25.9-28.3 √ cotinine: nornicotine 5.3-20.3 5.1-29.9 √ trans-OH-cot: anatabine 52.3-55.6 51.0-64.0 √ trans-OH-cot: anabasine 68.5-83.3 54.0-56.6 × trans-OH-cot: nornicotine 16.4-54.5 11.2-55.5 √
However, these are only preliminary results, and no conclusions can be drawn due to
inadequate reliability of the method and limited number of samples measured. Still, these
findings suggest that some of the selected biomarker ratios, especially
nicotine:anabasine, nicotine:anatabine, cotinine:anatabine, cotinine:anabasine and
trans-3-hydroxycotinie:anabasine could be used to distinguish between the different tobacco
consumption patterns.
6 CONCLUSION
A LC-MS/MS method for the simultaneous extraction and quantification of nicotine,
cotinine, trans-3-hydroxycotinie, anatabine, anabasine and nornicotine from human urine has
been developed and validated. The applied SPE technique, allowed a simple and cost-reduced
sample preparation. Such considerations are important to make when developing a novel
methods intended for use in routine screening of prohibited substances.
Some preliminary results were obtained, especially in concentration ranges of the major
alkaloids; nicotine, cotinine and trans-3-hydroxycotinie in relationship to the minor tobacco

53
alkaloids; anatabine and anabasine, indicating a higher concentration of minor tobacco
alkaloids compared to major tobacco alkaloids in the urine of snusers than smokers. These
findings correlate well with results presented in a published study [38]. These elevated
amounts are presumably caused by heat induced decomposition of minor tobacco alkaloids
when the tobacco is burned, such as the case for the smoked tobacco products. This would
correspondingly lead to lower absorbtion of respective alkaloids by cigarette smokers than by
smokeless tobacco users, as indicated by these preliminary results.
Despite promising potential, the developed method was demonstrated as unreliable during the
method validation for its application in routine work. However, analysis were performed on a
Luna® HILIC Phenomenex column, thus this project provides interesting information
concerning its capacity to separate ionic compounds. This column is relatively new on the
market; hence there is a lack of published studies in which it has been used.
7 FURTHER PERSPECTIVES
If a better sample extraction procedure was obtained, the presented method could have great
potential to differentiate between the nicotine consumption patterns. The main issues
concerning this method are inadequate sensitivity and high degree of bias, both parameters
most plausible linked to the sample preparation step. If there was more time available, the
MCX sample preparation method described in the method development discussion, would be
reattempted and improved. If not satisfying result were obtained, there could still be ways to
achieve better and more accurate sample preparation on the HLB columns. Finding a more
appropriate buffer solution not clogging the HLB cartridges could be a good strategy to
improve this method. If it was possible to develop a well functioning SPE method, it should
further be validated according to FDA and IHC guidelines. Finally, the method must be
applied in a clinical study of optimal size and designed in order establish whether or not these
reported differences in ratios between the groups really are significant or attributed by
confounders.

54
8 REFERENCES
1. Flanagan, R.J., Fundamentals of analytical toxicology. 2007, Chichester: John Wiley
& Sons. XXXVII, 505 s.
2. Swiss Laboratory for Doping Analysis ; Available from:
http://www.doping.chuv.ch/en/lad_home/lad-qui-sommes-nous/lad-qui-sommes-nous-
def-dopage.htm.
3. Doping i idrett. Available from: http://www.snl.no/doping/i_idrett.
4. Antidoping Norway Available from: http://www.antidoping.no/internett/medisinsk-
info/hva-er-doping/dopingens-historie/.
5. WADA. Available from: http://www.wada-ama.org/en/About-WADA/.
6. WADA. The 2010 Prohibited List, International Standard. Available from:
http://www.wada-ama.org/Documents/World_Anti-Doping_Program/WADP-
Prohibited-list/WADA_Prohibited_List_2010_EN.pdf.
7. Store Norske Leksikon. Fakta om tobakk; Available from: http://www.snl.no/tobakk.
8. Stepanov, I., et al., New and traditional smokeless tobacco: comparison of toxicant
and carcinogen levels. Nicotine Tob Res, 2008. 10(12): p. 1773-82.
9. List of additives in cigarettes. 15 October 2009 at 22:33
Available from: http://en.wikipedia.org/wiki/List_of_additives_in_cigarettes
10. Store Norske Leksikon. Fakta om snus ; Available from: http://www.snl.no/snus.
11. Torano, J.S. and H.J.M. van Kan, Simultaneous determination of the tobacco smoke
uptake parameters nicotine, cotinine and thiocyanate in urine, saliva and hair, using
gas chromatography-mass spectrometry for characterisation of smoking status of
recently exposed subjects. Analyst, 2003. 128(7): p. 838-843.
12. Hoffmann, D. and M.V. Djordjevic, Chemical composition and carcinogenicity of
smokeless tobacco. Adv Dent Res, 1997. 11(3): p. 322-9.
13. Leksikom, S.N. 16.03.10]; Available from: http://snl.no/alkaloider.
14. Hukkanen, J., P. Jacob, and N.L. Benowitz, Metabolism and disposition kinetics of
nicotine. Pharmacological Reviews, 2005. 57(1): p. 79-115.
15. Jacob, P., 3rd, et al., Minor tobacco alkaloids as biomarkers for tobacco use:
comparison of users of cigarettes, smokeless tobacco, cigars, and pipes. Am J Public
Health, 1999. 89(5): p. 731-6.
16. Pharmacokinetics, metabolism and pharmacodynamics of nicotine. p. 112-155.
17. Xu, X., M.M. Iba, and C.P. Weisel, Simultaneous and sensitive measurement of
anabasine, nicotine, and nicotine metabolites in human urine by liquid
chromatography-tandem mass spectrometry. Clin Chem, 2004. 50(12): p. 2323-30.
18. Hecht, S.S., DNA adduct formation from tobacco-specific N-nitrosamines. Mutat Res,
1999. 424(1-2): p. 127-42.
19. folkehelse, S.i.f. Toksikologisk vurdering av tilsettingsstoffer i tobakksprodukter
20. Food and Drug Administration, The FDA GRAS list. Available from:
http://www.fda.gov/Food/FoodIngredientsPackaging/GenerallyRecognizedasSafeGR
AS/GRASSubstancesSCOGSDatabase/default.htm.
21. World Anti-Doping Code. Available from: http://www.wada-ama.org/en/World-Anti-
Doping-Program/Sports-and-Anti-Doping-Organizations/The-Code/.
22. Strauss, R.H., Sports medicine. 1991, Philadelphia: Saunders. xv, 582 s.
23. Connolly, G.N., C.T. Orleans, and A. Blum, Snuffing Tobacco out of Sport. American
Journal of Public Health, 1992. 82(3): p. 351-353.

55
24. Severson, H.H., et al., Smokeless tobacco use among professional baseball players:
survey results, 1998 to 2003. Tob Control, 2005. 14(1): p. 31-6.
25. Escher, S.A., et al., Smokeless tobacco, reaction time, and strength in athletes.
Medicine and Science in Sports and Exercise, 1998. 30(10): p. 1548-1551.
26. Yildiz, D., Nicotine, its metabolism and an overview of its biological effects. Toxicon,
2004. 43(6): p. 619-32.
27. Mundel, T. and D.A. Jones, Effect of transdermal nicotine administration on exercise
endurance in men. Exp Physiol, 2006. 91(4): p. 705-13.
28. Karch, S.B., Drug abuse handbook. 2006, Boca Raton: CRC/Taylor & Francis. 1267
s.
29. Yildiz, D., Nicotine, its metabolism and an overview of its biological effects. Toxicon,
2004. 43(6): p. 619-632.
30. Rang, H.P. and M.M. Dale, Rang and Dale's pharmacology. 2007, Edinburgh:
Churchill Livingstone Elsevier. XIII, 829 s.
31. Lee, P.N. and J. Hamling, Systematic review of the relation between smokeless
tobacco and cancer in Europe and North America. BMC Med, 2009. 7: p. 36.
32. Luo, J., et al., Oral use of Swedish moist snuff (snus) and risk for cancer of the mouth,
lung, and pancreas in male construction workers: a retrospective cohort study.
Lancet, 2007. 369(9578): p. 2015-20.
33. Lee, P.N., Circulatory disease and smokeless tobacco in Western populations: a
review of the evidence. Int J Epidemiol, 2007. 36(4): p. 789-804.
34. Critchley, J.A., et al., Is smokeless tobacco a risk factor for coronary heart disease? A
systematic review of epidemiological studies. European Journal of Cardiovascular
Prevention & Rehabilitation, 2004. 11(2): p. 101-12.
35. Lochmann, H., et al., Determination of tobacco alkaloids in single plant cells by
capillary electrophoresis. J Chromatogr A, 2001. 917(1-2): p. 311-7.
36. Miller, E.I., et al., A novel validated procedure for the determination of nicotine, eight
nicotine metabolites and two minor tobacco alkaloids in human plasma or urine by
solid-phase extraction coupled with liquid chromatography-electrospray ionization-
tandem mass spectrometry. J Chromatogr B Analyt Technol Biomed Life Sci. 878(9-
10): p. 725-37.
37. Murphy, S.E., et al., A comparison of urinary biomarkers of tobacco and carcinogen
exposure in smokers. Cancer Epidemiol Biomarkers Prev, 2004. 13(10): p. 1617-23.
38. Jacob, P., 3rd, et al., Anabasine and anatabine as biomarkers for tobacco use during
nicotine replacement therapy. Cancer Epidemiol Biomarkers Prev, 2002. 11(12): p.
1668-73.
39. Stepanov, I. and S.S. Hecht, Tobacco-specific nitrosamines and their pyridine-N-
glucuronides in the urine of smokers and smokeless tobacco users. Cancer Epidemiol
Biomarkers Prev, 2005. 14(4): p. 885-91.
40. Castrucci, B.C., et al., Tobacco use and cessation behavior among adolescents
participating in organized sports. American Journal of Health Behavior, 2004. 28(1):
p. 63-71.
41. Heavner, D.L., et al., Validation and application of a method for the determination of
nicotine and five major metabolites in smokers' urine by solid-phase extraction and
liquid chromatography-tandem mass spectrometry. Biomed Chromatogr, 2005. 19(4):
p. 312-28.
42. Niessen, W.M.A., Liquid chromatography-mass spectrometry. 2006, Boca Raton,
Fla.: Taylor & Francis. 608 s.
43. McMaster, M.C., LC/MS: a practical user's guide. 2005, Hoboken, NJ: Wiley-
Interscience. XII, 165 s.
56
44. Corporation, T.p.T.E., Finnigan LTQ Harware Manual, in 97055-97013.
45. (FDA), U.S.F.a.D.A. Guidance for Industry, Bioanalythical method validation.
Available from:
http://www.fda.gov/downloads/Drugs/GuidanceComplianceRegulatoryInformation/G
uidances/UCM070107.pdf.
46. Agency, E.M. ICH Q2 R1 Validation of analytical procedures, Text and Document.
Available from: http://www.ema.europa.eu/pdfs/human/ich/038195en.pdf.
47. Inc., P. Explore Luna Hilic Columns. Available from:
http://www.phenomenex.com/cms400min/litlib/luna/luna_hilic_broch.pdf.
48. Hoofnagle, A.N., et al., Specific detection of anabasine, nicotine, and nicotine
metabolites in urine by liquid chromatography-tandem mass spectrometry. Am J Clin
Pathol, 2006. 126(6): p. 880-7.
49. Man, C.N., et al., Simple, rapid and sensitive assay method for simultaneous
quantification of urinary nicotine and cotinine using gas chromatography-mass
spectrometry. J Chromatogr B Analyt Technol Biomed Life Sci, 2006. 844(2):p. 322-7
50. Pellegrini, M., et al., Liquid chromatography/electrospray ionization tandem mass
spectrometry assay for determination of nicotine and metabolites, caffeine and
arecoline in breast milk. Rapid Commun Mass Spectrom, 2007. 21(16): p. 2693-703.
51. Corporation, W. Oasis product description. Available from:
http://www.waters.com/waters/nav.htm?cid=513209.
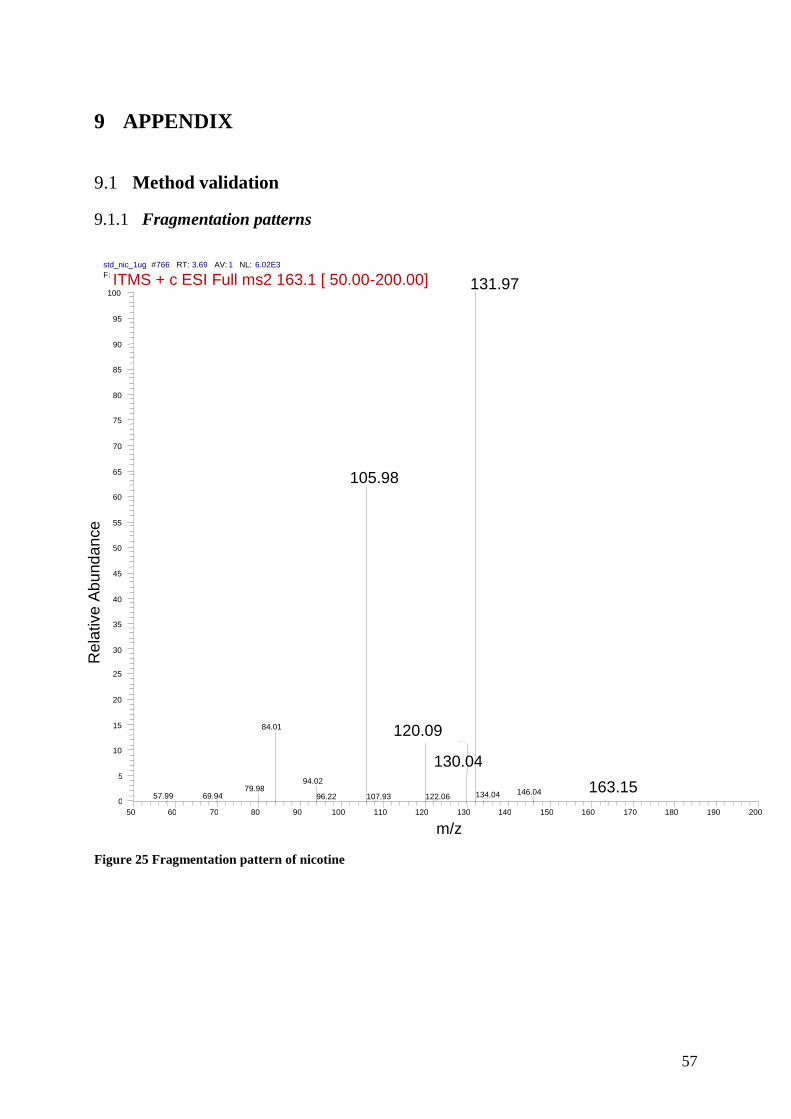
57
9 APPENDIX
9.1 Method validation
9.1.1 Fragmentation patterns
30
35
40
45
50
55
60
65
70
75
80
85
90
95
100
Rela
tive
Ab
und
an
ce
131.97
105.98
84.01
130.04
120.09
94.02 79.98 146.04 134.04 163.15
57.99 69.94 122.06 107.93 96.22
std_nic_1ug # 766 RT: 3.69 AV: 1 NL: 6.02E3
F: ITMS + c ESI Full ms2 163.1 [ 50.00-200.00]
50 60 70 80 90 100 110 120 130 140 150 160 170 180 190 200
m/z
0
5
10
15
20
25
Figure 25 Fragmentation pattern of nicotine

58
c1010_02 # 742 RT: 3.59 AV: 1 NL: 5.60E4
F: ITMS + c ESI Full ms2 [email protected] [ 50.00-200.00]
50 60 70 80 90 100 110 120 130 140 150 160 170 180 190 200
m/z
0
5
10
15
20
25
30
35
40
45
50
55
60
65
70
75
80
85
90
95
100
Rela
tive
Ab
und
an
ce
136.07
110.03
109.08
139.02
135.12
134.05 85.03
86.11 123.05 108.06 122.03 83.98 97.04 149.10 133.08 111.06 58.12 87.14 72.03 80.95 152.00 165.22 106.18 68.25
Figure 26 Fragmentation pattern of Nicotine-d4
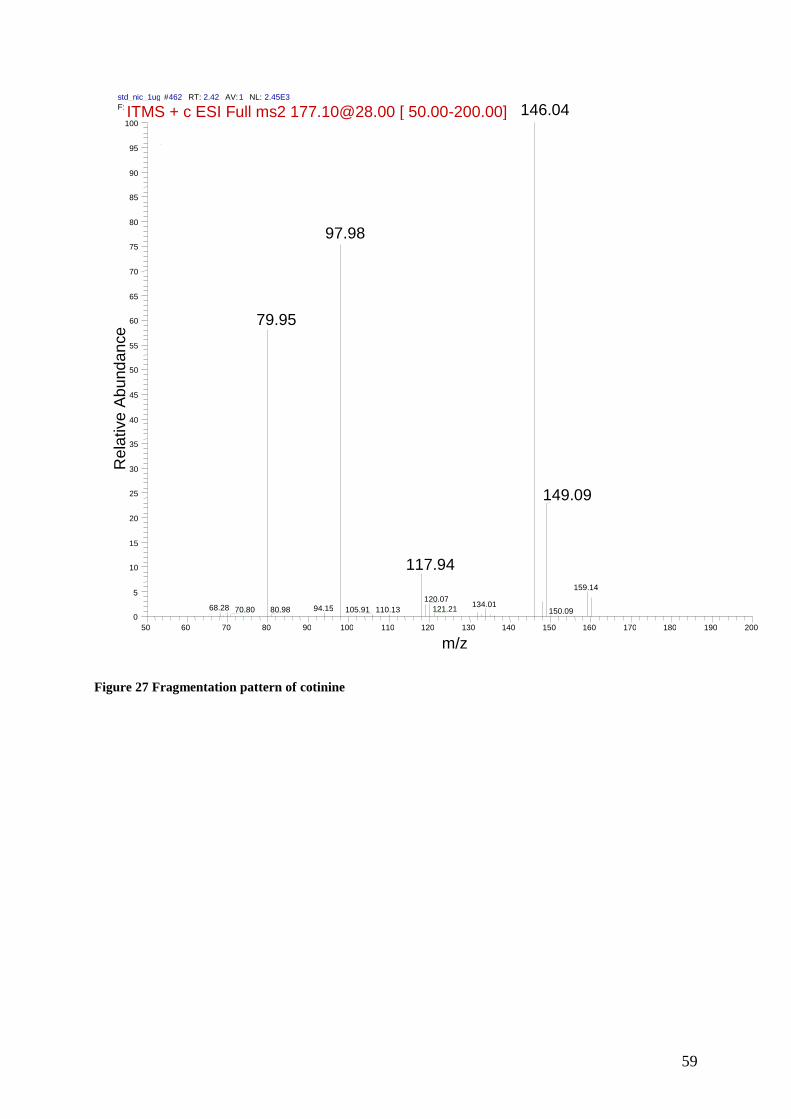
59
Figure 27 Fragmentation pattern of cotinine
std_nic_1ug # 462 RT: 2.42 AV: 1 NL: 2.45E3
F: ITMS + c ESI Full ms2 [email protected] [ 50.00-200.00]
50 60 70 80 90 100 110 120 130 140 150 160 170 180 190 200
m/z
0
5
10
15
20
25
30
35
40
45
50
55
60
65
70
75
80
85
90
95
100 R
ela
tive
Ab
und
an
ce
146.04
97.98
79.95
149.09
117.94
159.14 120.07
134.01 68.28 94.15 121.21 70.80 110.13 80.98 105.91 150.09
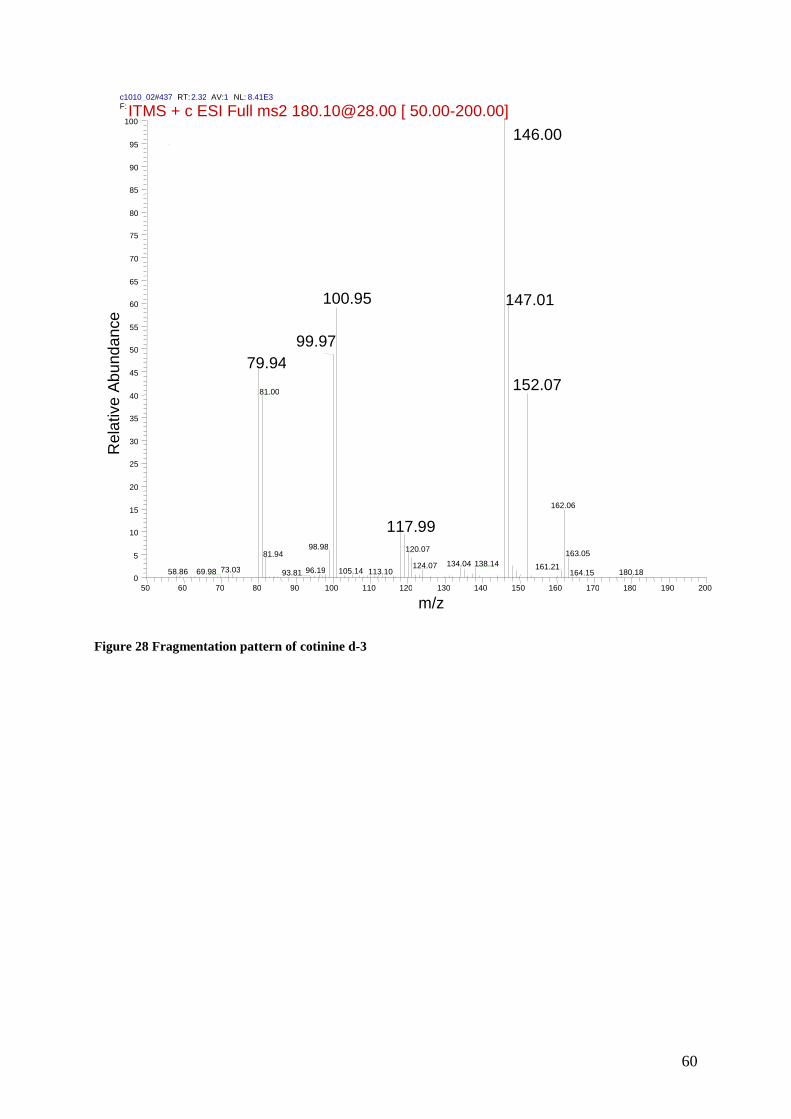
60
Figure 28 Fragmentation pattern of cotinine d-3
c1010_02 # 437 RT: 2.32 AV: 1 NL: 8.41E3
F: ITMS + c ESI Full ms2 [email protected] [ 50.00-200.00]
50 60 70 80 90 100 110 120 130 140 150 160 170 180 190 200 m/z
0
5
10
15
20
25
30
35
40
45
50
55
60
65
70
75
80
85
90
95
100 R
ela
tive
Ab
und
an
ce
146.00
147.01 100.95
99.97
79.94
152.07 81.00
162.06
117.99 98.98 120.07
163.05 81.94 134.04 138.14 124.07 161.21 73.03 96.19 105.14 113.10 69.98 58.86 180.18 93.81 164.15

61
Figure 29 Fragmentation pattern of tans-oh-cotinine
std_nic_1ug # 506 RT: 2.61 AV: 1 NL: 1.99E3
F: ITMS + c ESI Full ms2 [email protected] [ 50.00-200.00]
50 60 70 80 90 100 110 120 130 140 150 160 170 180 190 200
m/z
0
5
10
15
20
25
30
35
40
45
50
55
60
65
70
75
80
85
90
95
100 R
ela
tive
Ab
und
an
ce
134.05
149.09
118.08
157.11 165.17 105.95 144.06 175.08
85.94 116.01 177.94 80.01 193.28 93.90 59.03 122.16 152.21 97.99 132.25 137.11
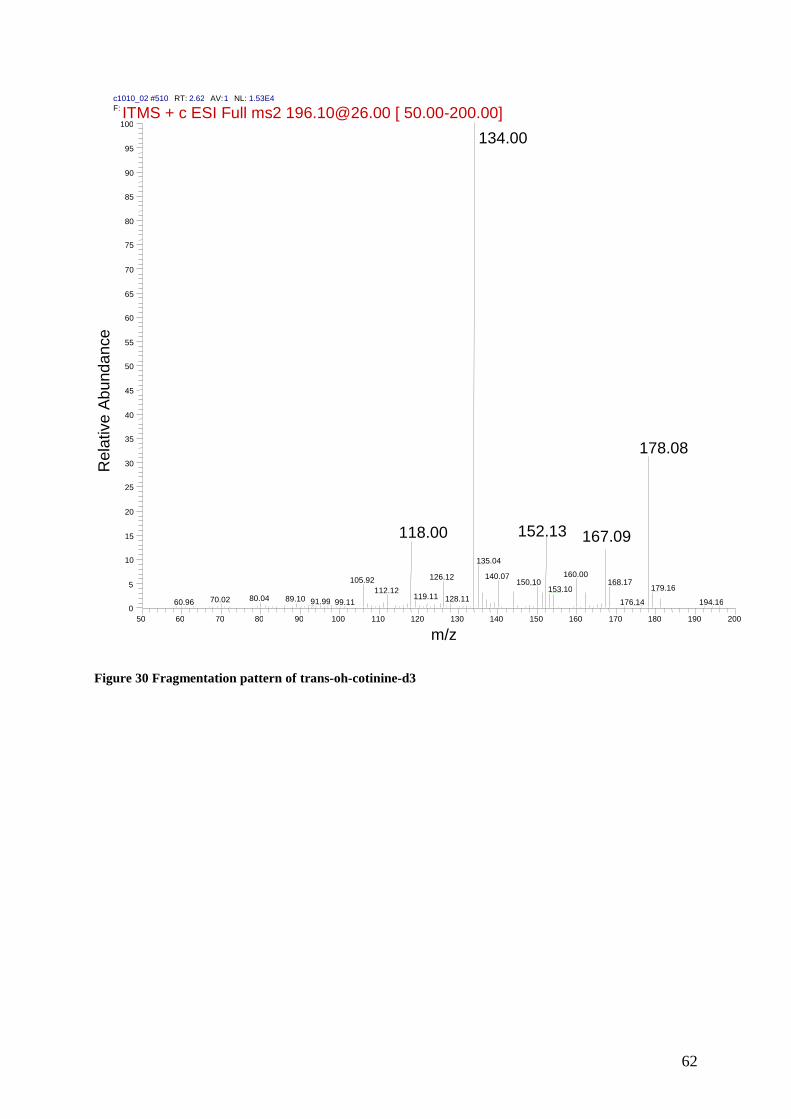
62
Figure 30 Fragmentation pattern of trans-oh-cotinine-d3
c1010_02 # 510 RT: 2.62 AV: 1 NL: 1.53E4
F: ITMS + c ESI Full ms2 [email protected] [ 50.00-200.00]
50 60 70 80 90 100 110 120 130 140 150 160 170 180 190 200
m/z
0
5
10
15
20
25
30
35
40
45
50
55
60
65
70
75
80
85
90
95
100
Rela
tive
Ab
und
an
ce
134.00
178.08
152.13 118.00 167.09
135.04 160.00 140.07 126.12 105.92 168.17 150.10
179.16 153.10 112.12 119.11 80.04 128.11 89.10 70.02 91.99 194.16 176.14 60.96 99.11

63
Figure 31 Fragmentation pattern of anatabine
std_nic_1ug # 1495 RT: 6.73 AV: 1 NL: 3.38E2
F: ITMS + c ESI Full ms2 [email protected] [ 50.00-200.00]
50 60 70 80 90 100 110 120 130 140 150 160 170 180 190 200
m/z
0
5
10
15
20
25
30
35
40
45
50
55
60
65
70
75
80
85
90
95
100 R
ela
tive
Ab
und
an
ce
106.04
132.14
146.05
120.03
93.99
84.06
134.01 130.10
136.33 117.99 80.02 129.15 163.07
92.19 117.13 105.05 69.82

64
Figure 32 Fragmentation pattern of anatabine-d4
c1010_02 # 751 RT: 3.63 AV: 1 NL: 5.60E4
F: ITMS + c ESI Full ms2 [email protected] [ 50.00-200.00]
50 60 70 80 90 100 110 120 130 140 150 160 170 180 190 200
m/z
0
5
10
15
20
25
30
35
40
45
50
55
60
65
70
75
80
85
90
95
100 R
ela
tive
Ab
und
an
ce
136.02
138.98
110.08
109.07
135.06 134.08
85.04 122.01 108.07
84.01 97.00 149.10 133.12 111.07 81.07 58.08 70.93 87.08 163.18 166.93
175.97 107.07

65
Figure 33 Fragmentation pattern of anabasine
std_nic_1ug # 1495 RT: 6.73 AV: 1 NL: 3.38E2
F: ITMS + c ESI Full ms2 [email protected] [ 50.00-200.00]
50 60 70 80 90 100 110 120 130 140 150 160 170 180 190 200
m/z
0
5
10
15
20
25
30
35
40
45
50
55
60
65
70
75
80
85
90
95
100
Rela
tive
Ab
und
an
ce
106.04
132.14
146.05
120.03
93.99
84.06
134.01 130.10
136.33 117.99 80.02 129.15 163.07
92.19 117.13 105.05 69.82

66
Figure 34 Fragmentation pattern of nornicotine
std_nic_1ug # 1610 RT: 7.21 AV: 1 NL: 5.42E2
F: ITMS + c ESI Full ms2 [email protected] [ 50.00-200.00]
50 60 70 80 90 100 110 120 130 140 150 160 170 180 190 200 m/z
0
5
10
15
20
25
30
35
40
45
50
55
60
65
70
75
80
85
90
95
100
Rela
tive
Ab
und
an
ce
132.11
106.07 130.18
120.93 91.14 80.12 104.05

67
9.1.2 Mobile phase gradients
Table 8 HPLC gradient table used on the Waters X Bridge C18 column (3 µm particles, 200 Å pore
diameters) Solvent A: 0,1 M Formiate buffer pH 3, Solvent B: Methanol
No Time (min) % Solvent A % Solvent B Pressure
(µl/min)
0 0 90 10 400
1 3 90 10 400
2 7 30 70 400
3 10 30 70 10
4 11 90 10 10
5 13 90 10 10
9.1.3 MCX solide phase extraction method
Pre-treatment 500 µl Urine sample +(IS)
500 µl 120mM HCl(120mM pH<2)
(Spiking IS/ WS)
Centrifugation 2500 rpm for 5 min
SPE: Conditioning 500 µl MeOH
500 µl HCl(120mM, pH<2)
Sample loading 500 µl Urine sample +
500 µl HCl(120mM pH<2) (+IS/)
Wash 1 1 ml 0,5 M HCl
Wash 2 250 µl CH3OH
Elute 250 µl of 5 % NH4OH in CH3OH
Figure 35 MCX extraction procedure This solid phase extraction method was
performed using a Oasis® MCX extraction plate 30 mg, 96-well.

68
9.2 Method validation
9.2.1 Trueness and precision
Table 9 Trueness and precision calculated at each concentration level over the 3 days of validation
Compound Target concentration
(ng/ml)
Precision:
Repeatability/
Intermediate precision (RSD, %)
Trueness (%)
nicotine
10 8.8/11.8 95.80%
5000 9.1/12.9 95.60%
8500 13.0/12.9 97.90%
cotinine
10 10.9/12.2 99.10%
5000 9.9/11.6 94.20%
8500 10.1/12.0 100.10%
trans-oh-cot
10 13.4/15.0 100.80%
5000 10.6/10.9 93.20%
8500 8.8/9.4 100.50%
anatabine
10 12.1/12.6 103.50%
250 12.6/12.6 96.60%
400 7.8/10.4 109.50%
anabasine
10 7.1/10.9 96.10%
250 13.6/14.3 98.10%
400 10.2/10.0 103.40%
nornicotine
10 8.9/11.8 99.50%
250 11.4/13.5 103.50%
400 8.4/9.3 90.00%
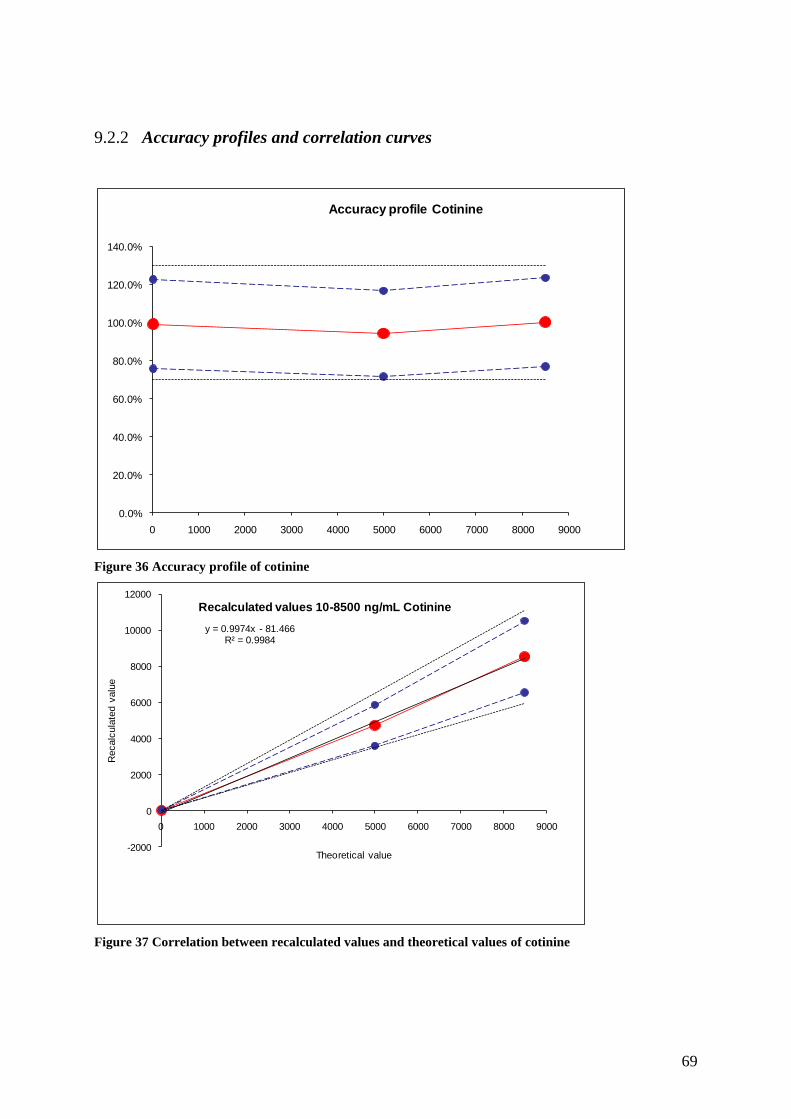
69
9.2.2 Accuracy profiles and correlation curves
Figure 36 Accuracy profile of cotinine
Figure 37 Correlation between recalculated values and theoretical values of cotinine
0.0%
20.0%
40.0%
60.0%
80.0%
100.0%
120.0%
140.0%
0 1000 2000 3000 4000 5000 6000 7000 8000 9000
Accuracy profile Cotinine
y = 0.9974x - 81.466R² = 0.9984
-2000
0
2000
4000
6000
8000
10000
12000
0 1000 2000 3000 4000 5000 6000 7000 8000 9000
Recalc
ula
ted
valu
e
Theoretical value
Recalculated values 10-8500 ng/mL Cotinine

70
Figure 38 Accuracy profile of trans-OH-cotinine
Figure 39 Correlation between recalculated values and theoretical values of trans-OH-cotinine
Appendix
0.0%
20.0%
40.0%
60.0%
80.0%
100.0%
120.0%
140.0%
0 1000 2000 3000 4000 5000 6000 7000 8000 9000
Accuracy profile Trans-OH-cotinine
y = 1.0003x - 98.889R² = 0.9976
-2000
0
2000
4000
6000
8000
10000
12000
0 1000 2000 3000 4000 5000 6000 7000 8000 9000
Recalc
ula
ted
valu
es
Theoretical values
Recalculated values 10-8500 ng/mL of Trans-OH-cotinine

71
Figure 40 Accuracy profile of anatabine
Figure 41 Correlation between recalculated values and theoretical values of anatabine
0.0%
20.0%
40.0%
60.0%
80.0%
100.0%
120.0%
140.0%
0 50 100 150 200 250 300 350 400 450
Accuracy profile Anatabine
y = 1.0841x - 8.5674R² = 0.9927
0
100
200
300
400
500
600
0 50 100 150 200 250 300 350 400 450
Recalc
ula
ted
valu
e
Theoretical value
Recalculated values 10-400 ng/mL Anatabine

72
Figure 42 Accuracy profile of anabasine
Figure 43 Correlation between recalculated values and theoretical values of anabasine
0.0%
20.0%
40.0%
60.0%
80.0%
100.0%
120.0%
140.0%
0 50 100 150 200 250 300 350 400 450
Accuracy profile anabasine
y = 1.0305x - 3.9316R² = 0.9987
0
100
200
300
400
500
600
0 100 200 300 400 500
Recalc
ula
ted v
alu
es
Theoretical values
Recalculated values 10-400 ng/ mL of Anabasine

73
Figure 44 Accuracy profile of nornicotine
Figure 45 Correlation between recalculated values and theoretical values of nornicotine
0.0%
20.0%
40.0%
60.0%
80.0%
100.0%
120.0%
140.0%
0 50 100 150 200 250 300 350 400 450
Accuracy profile Nornicotine
y = 0.9109x + 9.1958R² = 0.9889
0
100
200
300
400
500
600
0 50 100 150 200 250 300 350 400 450
Recalc
ula
ted
vaule
Theoretical value
Recalculated values 10-400 ng/mL, Nornicotine

74
9.2.3 Chromatograms
Figure 46 Validation chromatogram, LOQ 10/10 ng /ml

75
Figure 47 Validation chromatogram, ULOQ 10000/500 ng/ml
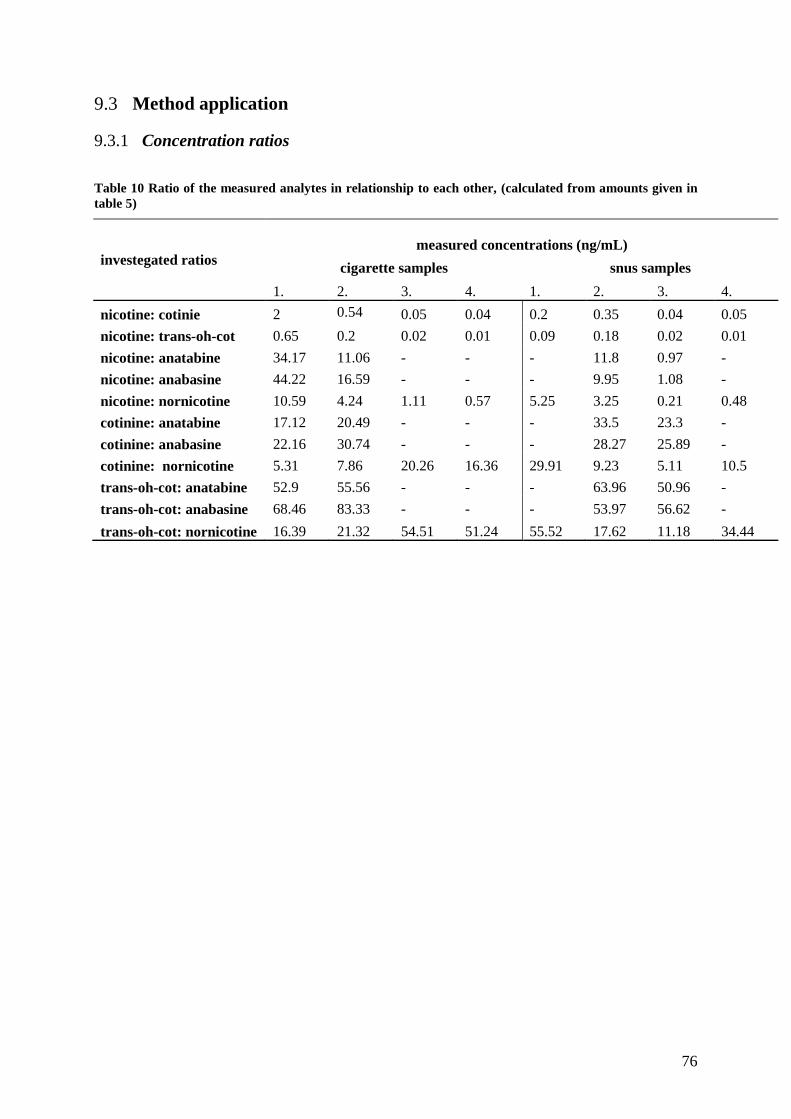
76
9.3 Method application
9.3.1 Concentration ratios
Table 10 Ratio of the measured analytes in relationship to each other, (calculated from amounts given in
table 5)
investegated ratios
measured concentrations (ng/mL)
cigarette samples snus samples
1. 2. 3. 4. 1. 2. 3. 4.
nicotine: cotinie 2 0.54 0.05 0.04 0.2 0.35 0.04 0.05
nicotine: trans-oh-cot 0.65 0.2 0.02 0.01 0.09 0.18 0.02 0.01
nicotine: anatabine 34.17 11.06 - - - 11.8 0.97 -
nicotine: anabasine 44.22 16.59 - - - 9.95 1.08 -
nicotine: nornicotine 10.59 4.24 1.11 0.57 5.25 3.25 0.21 0.48
cotinine: anatabine 17.12 20.49 - - - 33.5 23.3 -
cotinine: anabasine 22.16 30.74 - - - 28.27 25.89 -
cotinine: nornicotine 5.31 7.86 20.26 16.36 29.91 9.23 5.11 10.5
trans-oh-cot: anatabine 52.9 55.56 - - - 63.96 50.96 -
trans-oh-cot: anabasine 68.46 83.33 - - - 53.97 56.62 -
trans-oh-cot: nornicotine 16.39 21.32 54.51 51.24 55.52 17.62 11.18 34.44
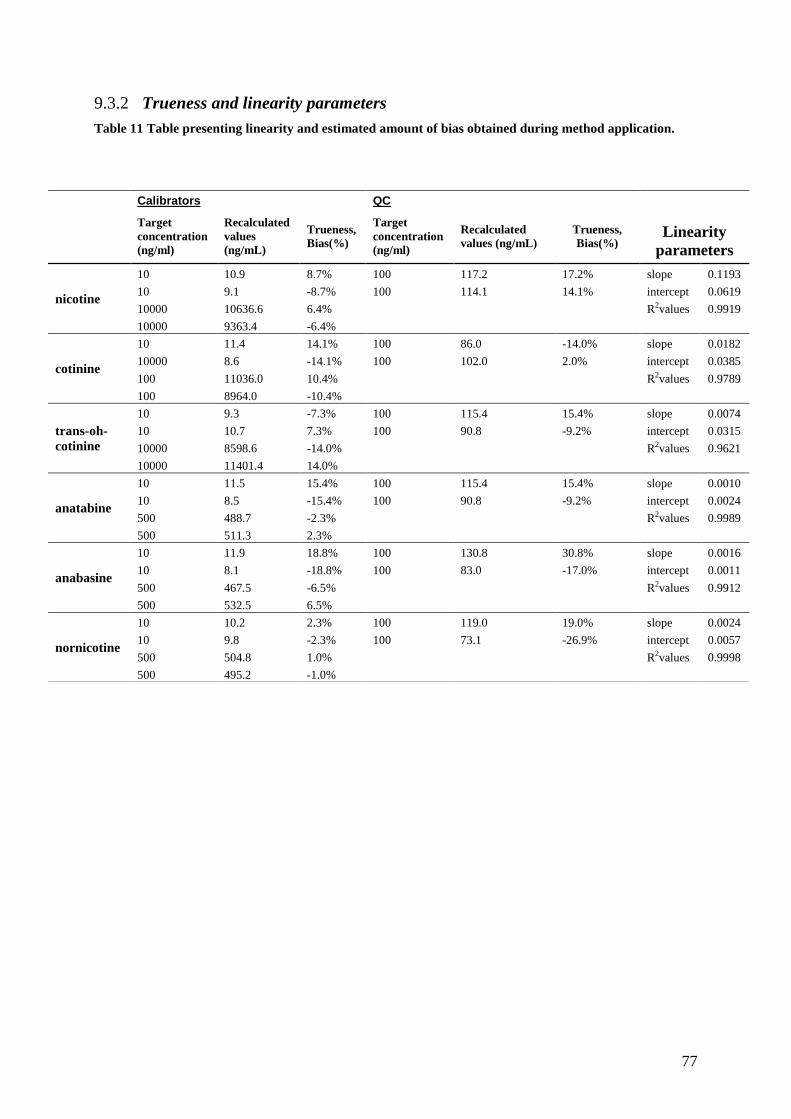
77
9.3.2 Trueness and linearity parameters
Table 11 Table presenting linearity and estimated amount of bias obtained during method application.
Calibrators QC
Linearity
parameters
Target
concentration
(ng/ml)
Recalculated
values
(ng/mL)
Trueness,
Bias(%)
Target
concentration
(ng/ml)
Recalculated
values (ng/mL)
Trueness,
Bias(%)
nicotine
10 10.9 8.7% 100 117.2 17.2% slope 0.1193
10 9.1 -8.7% 100 114.1 14.1% intercept 0.0619
10000 10636.6 6.4% R2values 0.9919
10000 9363.4 -6.4%
cotinine
10 11.4 14.1% 100 86.0 -14.0% slope 0.0182
10000 8.6 -14.1% 100 102.0 2.0% intercept 0.0385
100 11036.0 10.4% R2values 0.9789
100 8964.0 -10.4%
trans-oh-
cotinine
10 9.3 -7.3% 100 115.4 15.4% slope 0.0074
10 10.7 7.3% 100 90.8 -9.2% intercept 0.0315
10000 8598.6 -14.0% R2values 0.9621
10000 11401.4 14.0%
anatabine
10 11.5 15.4% 100 115.4 15.4% slope 0.0010
10 8.5 -15.4% 100 90.8 -9.2% intercept 0.0024
500 488.7 -2.3% R2values 0.9989
500 511.3 2.3%
anabasine
10 11.9 18.8% 100 130.8 30.8% slope 0.0016
10 8.1 -18.8% 100 83.0 -17.0% intercept 0.0011
500 467.5 -6.5% R2values 0.9912
500 532.5 6.5%
nornicotine
10 10.2 2.3% 100 119.0 19.0% slope 0.0024
10 9.8 -2.3% 100 73.1 -26.9% intercept 0.0057
500 504.8 1.0% R2values 0.9998
500 495.2 -1.0%

78
9.3.3 Chromatograms
Figure 48 Chromatogram of urine sample of smoker, 1 h after consummation of 1 cigarette

79
Figure 49 Chromatogram of urine sample from snuser, 1 h after consummation of one snus

80