development of alternative methods for estimating dry deposition velocity in cmaq
TRANSCRIPT

Development of Alternative Methods
For EstimatingDry Deposition Velocity
In CMAQ

Kiran AlapatyUniversity of North Carolina at Chapel Hill
Dev NiyogiNorth Carolina State University
Sarav ArunachalamAndrew HollandKimberly HanisakUniversity of North Carolina at Chapel Hill
Marvin Wesely (Posthumous)Argonne National Laboratory

Dry Deposition Velocity estimation
INTRODUCTION
1 cbad RRRV
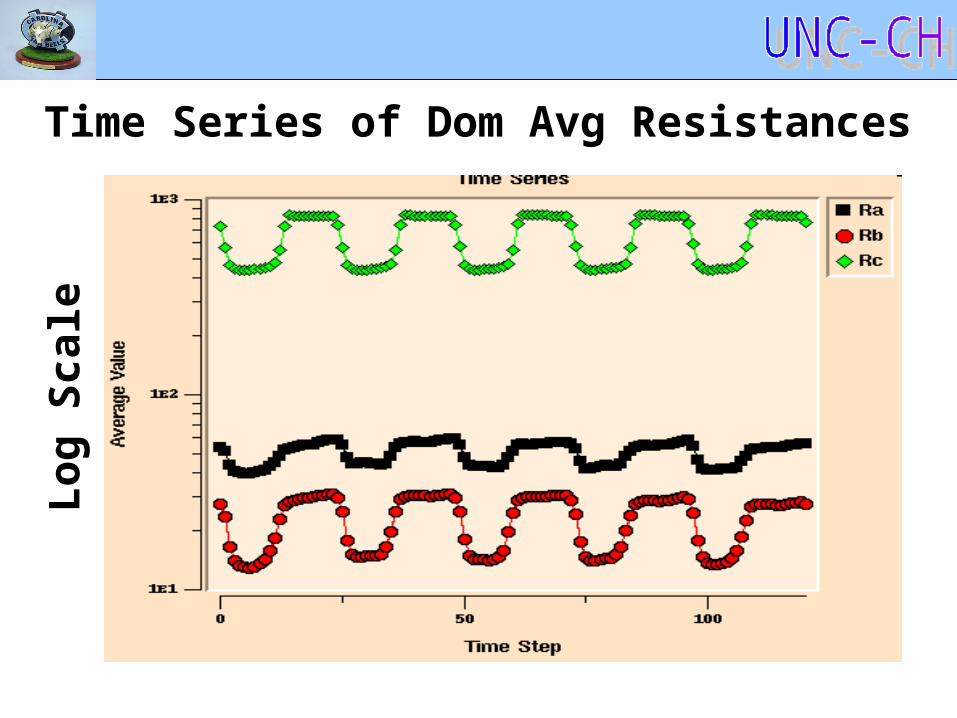
Time Series of Dom Avg ResistancesL
og
Sca
le
• Rc sum of several resistance for theSoil-vegetation Continuum.
• One of them is the Stomatal
Resistancefor a gas (Rsg)
• Rsg is proportional to Rsw
• Rsw Plays an important role in Land
surface Modeling.
Relation of Rc to Stomatal Resistance
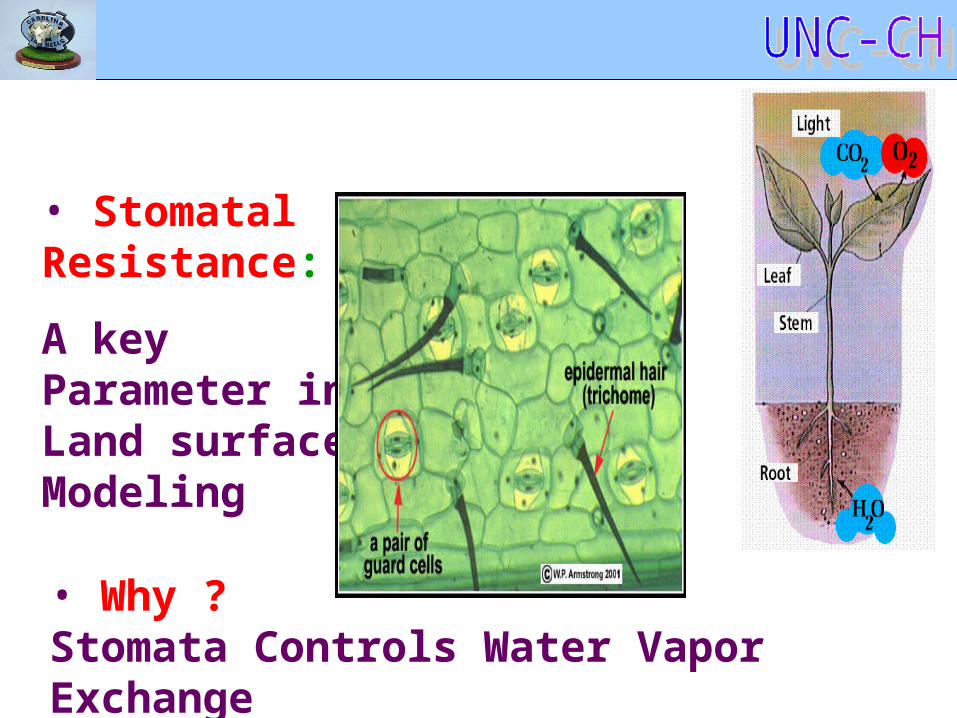
• Stomatal Resistance:
A key Parameter in Land surface Modeling
• Why ? Stomata Controls Water Vapor Exchange

Stoma (pore) through which CO2 enters for use in Photosynthesis; releases O2 & H2O Depending on the
applications, Rs is modeled using a variety of forcings.
For environmental Applications:
- Wesely scheme
- Jarvis scheme
- Ball–Berry scheme

• JARVIS method is used in many LSMs(traditional in Met Models)
• WESELY method is used many AQMs
• Micro-Met and GCMs use Photosynthesis/CO2 assimilation

)40(
400
1.0
2001
2
ccswis TTGRR
])[][]2[][( 4321 RHFTFWFRFLAI
RR is
Sn
Ss bCHAm
CR
Stomatal Resistance Formulations
WESELY
JARVIS
Ball-Berry (GEM)

• JARVIS & WESELY methods Based on Minimum Stom. Resist.
• Ball – Berry method Based on Photosynthesis approach
(e.g., Farquhar, Collatz, Niyogi et al. ,
Wu et al.)

WESELY

JARVIS

GEM

OBJECTIVES
Introduce and evaluate a Photosynthesis-based Vegetation Model for estimating stomatal resistance in MM5 and deposition velocity in CMAQ
Intercompare results from Jarvis-, Wesely-, GEM (photosynthesis) – type methods
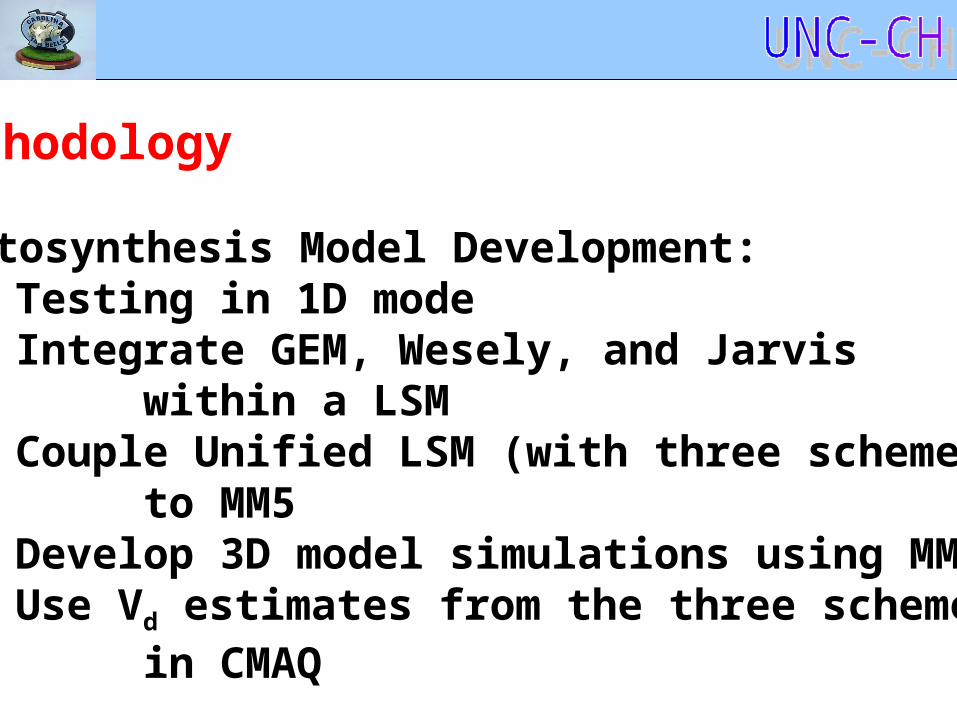
Methodology
Photosynthesis Model Development:• Testing in 1D mode• Integrate GEM, Wesely, and Jarvis within a LSM• Couple Unified LSM (with three schemes) to MM5• Develop 3D model simulations using MM5 • Use Vd estimates from the three schemes in CMAQ

GEM development results1-D Model Results
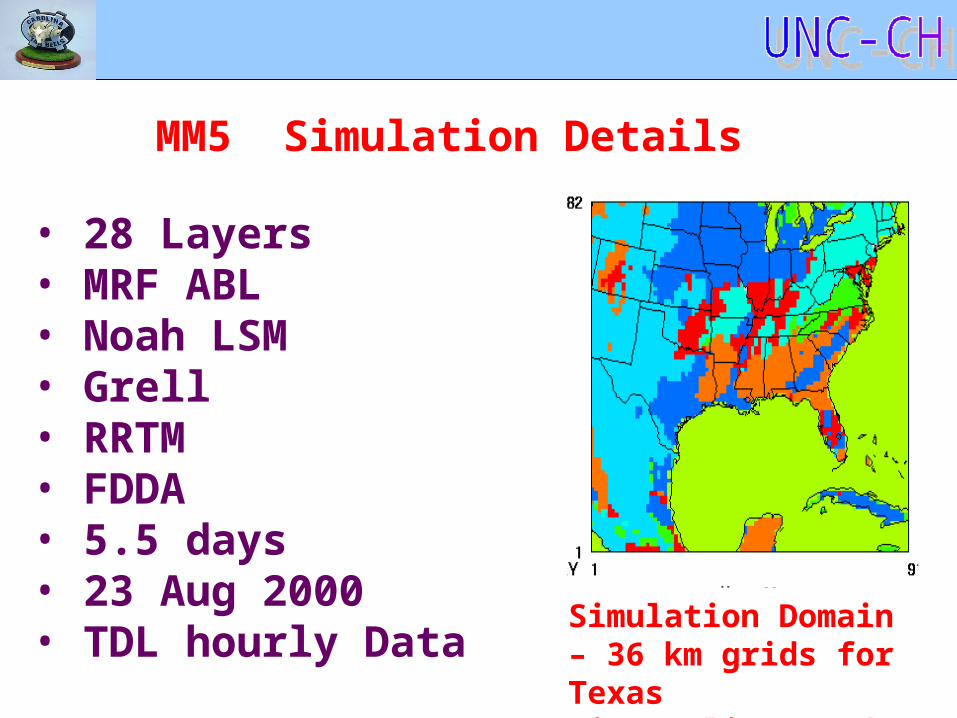
MM5 Simulation Details
Simulation Domain – 36 km grids for TexasAir Quality Study
• 28 Layers• MRF ABL• Noah LSM• Grell • RRTM • FDDA• 5.5 days• 23 Aug 2000 • TDL hourly Data

• Discussion of MM5 / Unified Noah
(with three Rs schemes) model Results
– Model performance statistics with surface observations
– Model diagnostics for the 3 schemes (surface parameters – energy fluxes, temperature, and estimated Rs values,….)
Will Present:

600
650
700
750
800
850
900
0 24 48 72 96 120
Nu
mb
er
of
Ob
se
rva
tio
ns
Simulation Time (h)
Surface Observations used in STATS

290
295
300
305
0 24 48 72 96 120
OBS WES JAR GEM
Tem
pe
ra
ture (
K)
Simulation Time (h)
Time Series for Temp1.5

-2
-1.5
-1
-0.5
0
0.5
1
1.5
2
0 24 48 72 96 120
WES JAR GEM
Te
mp
era
ture B
ias
(K
)
Simulation Time (h)
Temperature Bias (Model – Obs)

2
2.5
3
3.5
4
0 24 48 72 96 120
WES JAR GEM
R.M
.S. E
rro
r fo
r T
em
peratu
re (
K)
Simulation Time (h)

-3.5
-3
-2.5
-2
-1.5
-1
-0.5
0
0.5
0 24 48 72 96 120
WES JAR GEM
Mix
ing
Rati
o B
ias (
g k
g-1)
Simulation Time (h)
Mod. Lowest Vs Obs. Surface Level Qv

1
1.5
2
2.5
3
3.5
4
4.5
5
0 24 48 72 96 120
WES JAR GEM
R.M
.S. E
rro
r
for M
ixin
g R
ati
o (
g k
g-1)
Simulation Time (h)

Diagnostic & Other Parameters

0
500
1000
1500
2000
2500
0 24 48 72 96 120
WES JAR GEM
Dep
th o
f th
e A
BL
(m
AG
L)
Simulation Time (h)
Land Domain Avg. ABL Depths (m)
0
0.0005
0.001
0.0015
0.002
0.0025
0.003
0.0035
0.004
0 24 48 72 96 120
WES JAR GEM
To
tal P
recip
ita
tio
n R
ate
(cm
h-1)
Simulation Time (h)
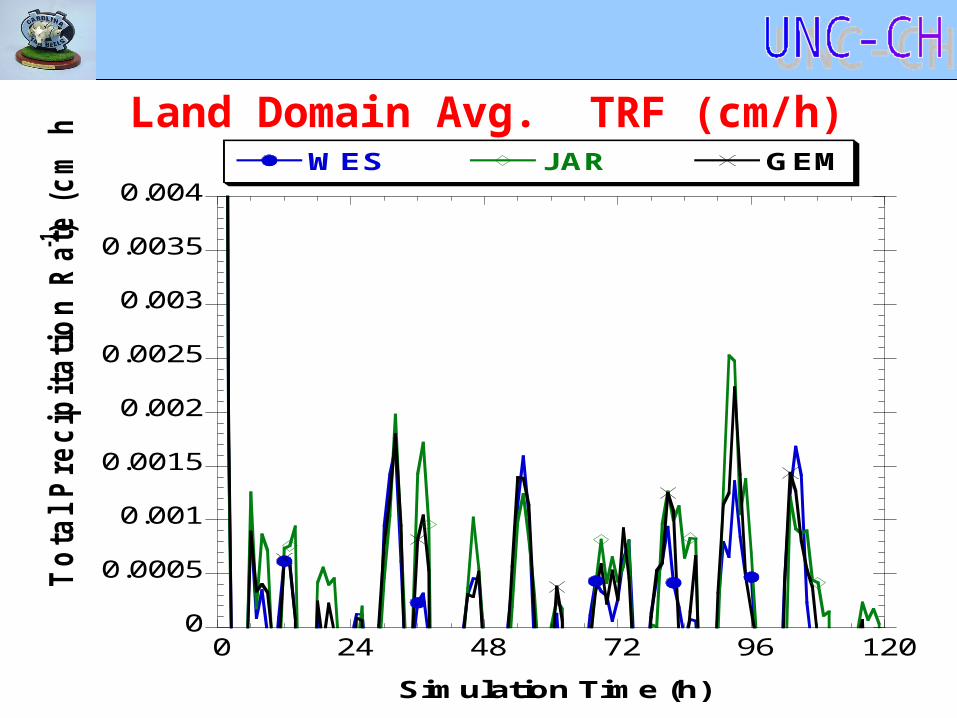
Land Domain Avg. TRF (cm/h)

0
0.5
1
1.5
2
0 24 48 72 96 120
WES JAR GEM
Can
op
y C
on
du
cta
nce (
cm
s-1)
Simulation Time (h)
0
50
100
150
200
250
300
350
400
0 24 48 72 96 120
WES JAR GEM
Late
nt
Hea
t F
lux (
W m
-2)
Simulation Time (h)
Canopy Conductance
Sfc. Latent Heat Flux

0
100
200
300
400
0 24 48 72 96 120
WES JAR GEM
Sen
sib
le H
eat
Flu
x (
W m
-2)
Simulation Time (h)
0
50
100
150
200
250
300
350
400
0 24 48 72 96 120
WES JAR GEM
Late
nt
Hea
t F
lux (
W m
-2)
Simulation Time (h)
Sfc. Latent Heat Flux
Sfc. Sensible Heat Flux

0
0.5
1
1.5
2
2.5
3
3.5
4
0 24 48 72 96 120
WES JAR GEM
Can
op
y C
on
du
cta
nc
e (
cm
s-1)
Simulation Time (h)
(LU=2)
Agriculture Land (26%)

0
0.5
1
1.5
2
0 24 48 72 96 120
WES JAR GEM
Ca
no
py
Co
nd
uc
tan
ce (
cm
s-1)
Simulation Time (h)
(LU=3)
RANGE Land (34%)

Land Use Patterns
0
0.5
1
1.5
2
0 24 48 72 96 120
WES JAR GEM
Can
op
y C
on
du
cta
nce (
cm
s-1)
Simulation Time (h)
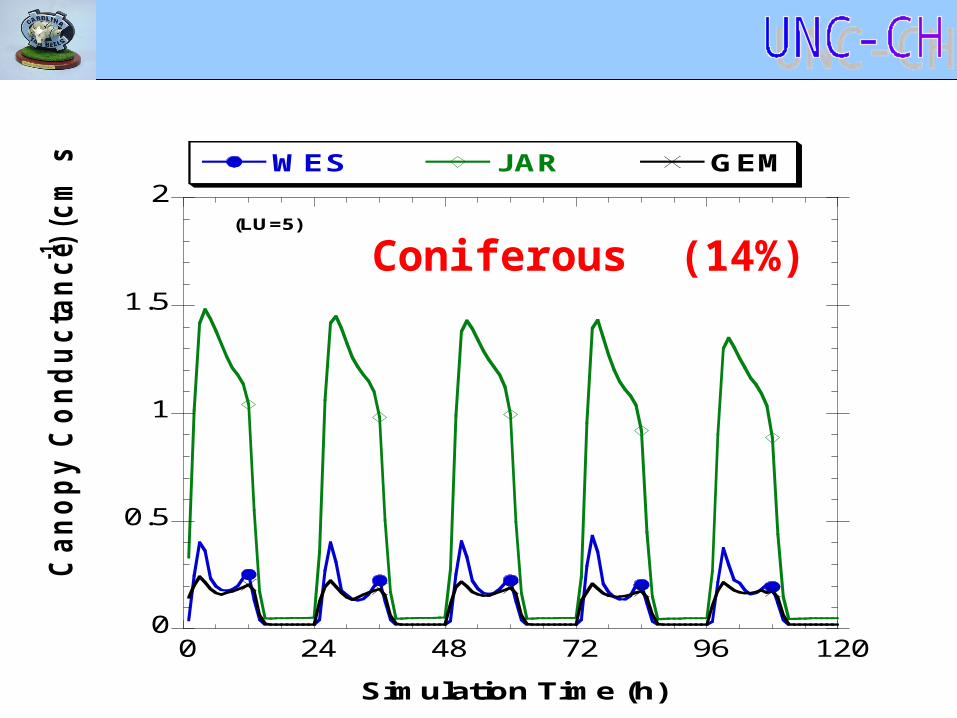
(LU=5)
Coniferous (14%)

0
0.2
0.4
0.6
0.8
1
0 24 48 72 96 120
WES JAR GEM
Can
op
y C
on
du
cta
nce (
cm
s-1)
Simulation Time (h)
(LU=1)
URBAN Land (0.13%)
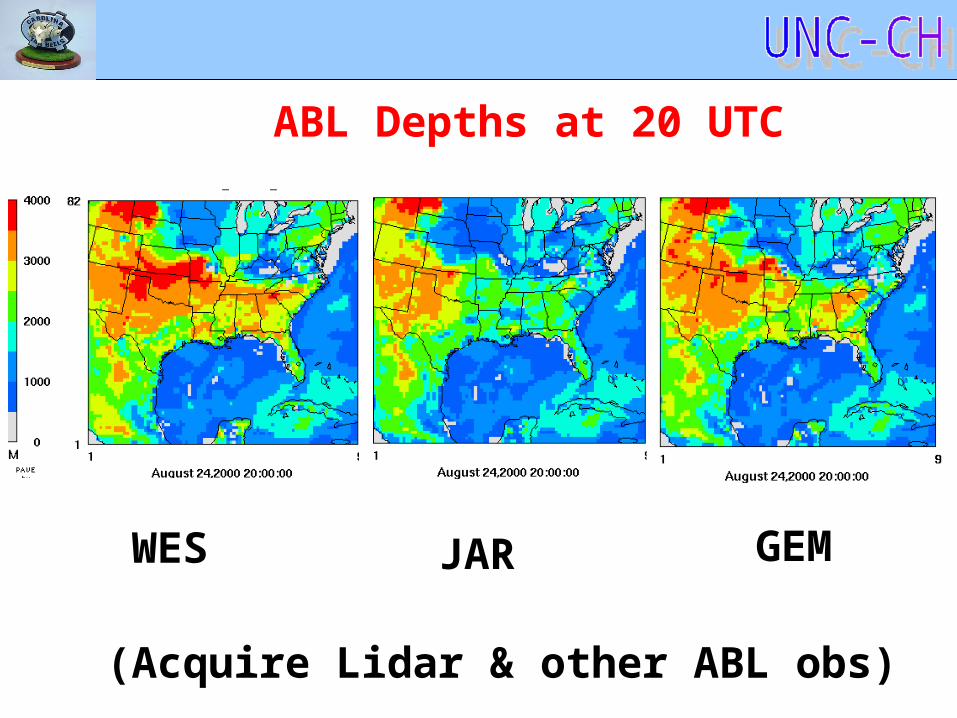
ABL Depths at 20 UTC
WES JAR GEM
(Acquire Lidar & other ABL obs)
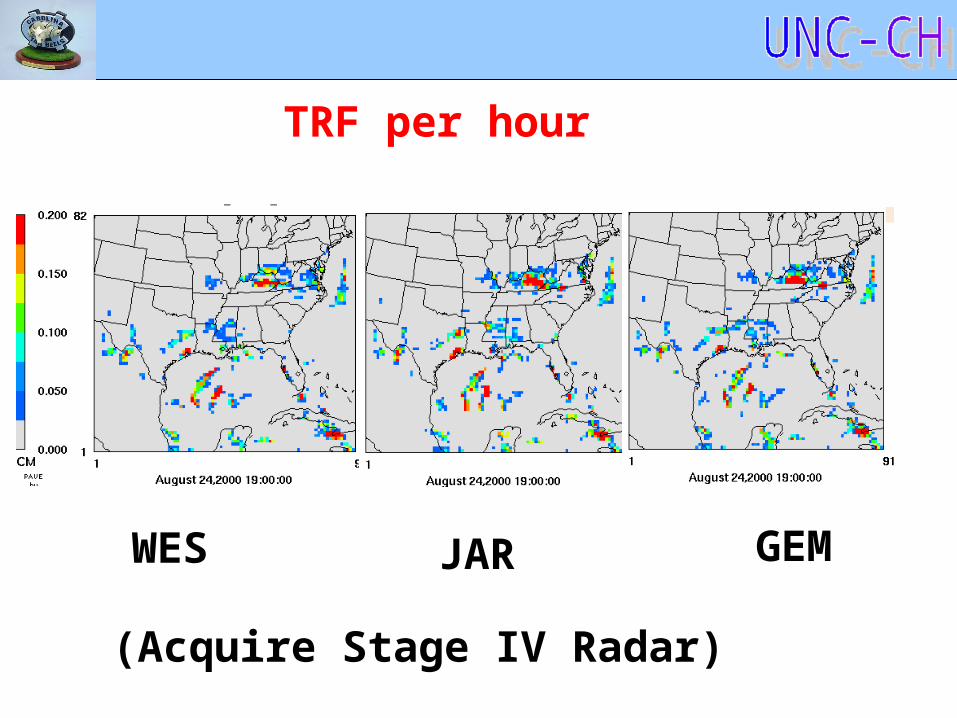
TRF per hour
WES JAR GEM
(Acquire Stage IV Radar)

Cloud Fraction
WES JAR GEM
(Acquire GOES)

MCIP was modified to generate Dep Vel fieldsusing M3-DryDepfor CMAQ
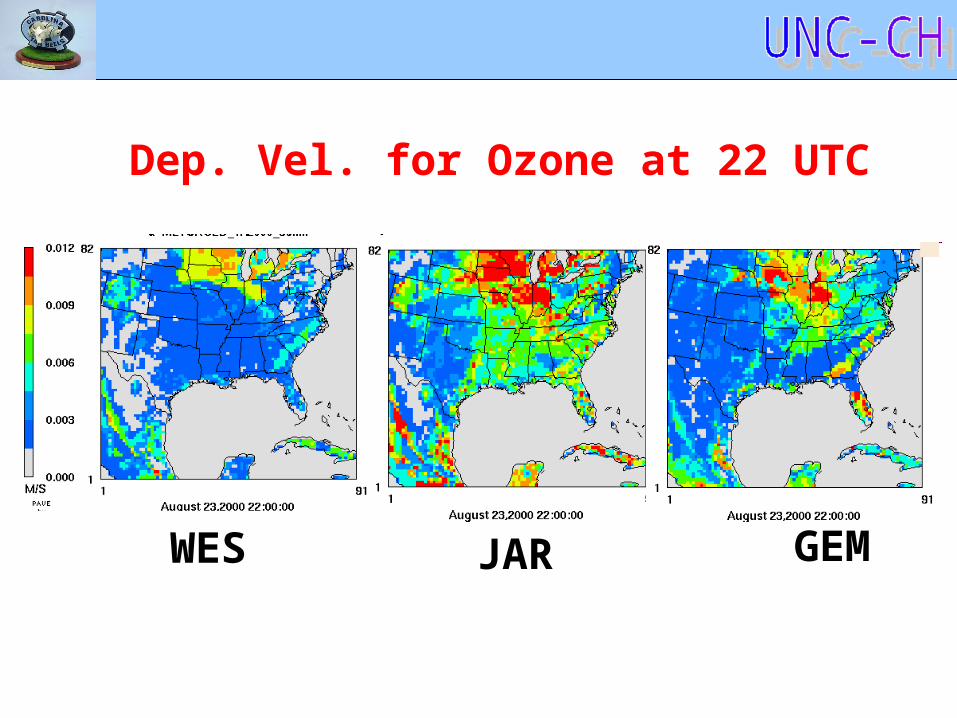
WES JAR GEM
Dep. Vel. for Ozone at 22 UTC

WES JAR GEM
Dep. Vel. for NO2 at 22 UTC

Domain Averaged Vd for O3

We are still doing analysis of MET fields
Once completed, we willperform CMAQ simulationsby keeping all MET fields identical except Dep Vel

• These Schemes are also being tested in WRF model
• WRF-CMAQ driver is alsoUnder construction