development of a strength prediction model for “green
TRANSCRIPT

www.ccsenet.org/jsd Journal of Sustainable Development Vol. 3, No. 3; September 2010
ISSN 1913-9063 E-ISSN 1913-9071 140
Development of a Strength Prediction Model for “Green” Compressed Stabilised Earthbricks
Chee-Ming Chan Research Centre for Soft Soils (RECESS), Faculty of Civil and Environmental Engineering
Universiti Tun Hussein Onn Malaysia, 86400 Parit Raja, Batu Pahat, Johor, Malaysia E-mail: [email protected]
Liang-Pin Low
Research Centre for Soft Soils (RECESS), Faculty of Civil and Environmental Engineering Universiti Tun Hussein Onn Malaysia, 86400 Parit Raja, Batu Pahat, Johor, Malaysia
E-mail: [email protected] Abstract Traditional fired clay bricks are widely used as a fundamental building material in most countries. Availability, low costs and low-skilled labour are main factors that have made the bricks a popular choice. However with rising awareness to reduce carbon footprint and promote sustainable development, earth-making has taken a different path to minimize the environmental impact. Compressed stabilised earthbrick is an example of the alternative building material. Various efforts have been directed to develop these bricks, including the use of different binding agents, raw materials and technology. In conjunction with these progresses, and considering that strength is the primary concern in brick-making, it was conceived that a strength prediction model ought to be established to assist in the bricks’ production, especially in the mix design stage. In collaboration with a local property developer, the Research Centre for Soft Soils (RECESS) has embarked on an industrial research project to develop “green” sustainable compressed stabilised earthbricks in situ for a large scale mixed development site. As part of the joint research effort, a series of trial specimens were prepared at different mix ratios using soil samples retrieved from the site. The specimens were next examined with the conventional compressive strength test, coupled with the novel non-destructive S-wave velocity measurement. The test results were then analysed and cross-correlated to establish a strength prediction model for the bricks produced. The charts relating the relevant parameters serve not only as a quick guide to the expected strength, but also provide insights to the behaviour of compressed stabilised material under loading. Keywords: Clay bricks, Unfired, Stabilisation, Strength prediction, Sustainability 1. Introduction Bricks remain a primary building material, and the most popular conventional bricks are arguably the fired clay bricks: cheap and easily available, produced with low technology manufacturing processes. These inherent features of the fired clay bricks make them especially useful in developing nations and low-budget development. In spite of the economic advantages, the production of fired bricks has perhaps remained either unchecked or ignored. Firstly, the firing process can hardly be categorised as being environmental-friendly or sustainable. It is a highly polluting activity, with rarely filtered emissions of soot and smoke. The sourcing of raw materials for both the burning and brick-making itself can be disruptive and damaging to the environment, encompassing heavy machinery work like rock blasting, soil quarrying, transportation, tree-harvesting and others. In Malaysia, for instance, the fire wood is usually made up of oil palm trunks, fronds and various wood scraps destined for disposal. This, at least, does lighten the environmental impact in a way, though perhaps not very significantly. Compressing soils to form bricks have been an exercise that gained momentum only in the past 50 years or so (A. Mesbah et al., 2004), probably spurned by the increased awareness for environmental well-being and sustainability issues. Nevertheless such masonry blocks are generally brittle and lack tensile strength, qualities not unexpected in particulate materials like soils. Moreover they are especially susceptible to moisture attack, where rapid deterioration would ensue almost immediately upon contact with excessive water. As a result, while they are cheap, these earthbricks are very much limited to indoor applications or in protected environment, or when extreme lack of resources (e.g. remote and poor regions) call for such rudimentary building materials. There is another range of bricks which are unfired but reinforced with binder addition, such as cement blocks. Although they come without the firing process’s negative impact on the environment, the production costs are relatively higher due to the raw materials used (e.g. sand and cement). The unfired earthbricks, on the other hand, are relatively cheaper, as lateritic soils are used as the base material with the addition of suitable binders. These bricks are suitable for low or non- load-bearing applications, while having additional environmental benefits, like using sustainable raw materials, presenting no biohazard, as well as having reduced embodied energy and thermal mass (M. Lawrence et al., 2008).

www.ccsenet.org/jsd Journal of Sustainable Development Vol. 3, No. 3; September 2010
Published by Canadian Center of Science and Education 141
In the research effort for soft soil stabilisation at the Research Centre for Soft Soils (RECESS) here in Malaysia, the stabilisation method was discovered to be potentially viable for making unfired bricks which suit the economical and social needs of housing projects with financial constraints. The initial idea conceived for making the compressed stabilised earthbricks, termed ComSTAB, from in situ soils has found support from a major housing developer in the country, the TH Properties S/B. In line with the company’s aspiration to champion ‘green’ construction technology and methods, and to meet the local community’s needs for job opportunities as well as affordable dwellings, TH Properties S/B and RECESS have teamed up to extend the Centre’s growing expertise on soil stabilisation to the brick-making industry. It was no ordinary brick-making exercise, for the COMStab uses in situ soils as the primary raw materials with the addition of suitable binding agents, such as cement. Local plants will be set up to produce the bricks without extensive machinery setup or procurement. A light mechanical press (e.g. Cinva-Ram type) or a simple hydraulic system (e.g. Brepak press) requires minimal skill and labour for carrying out the mix-place-compress processes (H. Houban and H. Guillaud, 1994). Production can be increased by simply using a motorised mechanical press, which usually comes ready with a drum mixer and conveyor belt for transferring the soil mixture to the press mould. The site is located in a hilly area, where remodelling of the topography was necessary via cut-and-fill exercise. The excess excavated soils would have been transported out in mass for disposal or other applications, incurring costs and causing pollution along the way. Besides, by putting the excavated soils into reuse in the brick-making process, the cost of raw material import or purchase was eliminated, and more importantly, it automatically put a ‘green’ tag on the final product. In a nutshell, the joint effort between an academic-research entity and an industrial player in developing this unfired brick marks not just the beginning of a community-oriented partnership, but also the establishment of a mutual convergence point for both institutions with very different pursuits, for all intents and purposes. The project also marks the extension of soil mechanics and geotechnical engineering knowledge, technology and know-how into the field of construction materials, for shared benefits and potential leaps in engineering innovation, particularly in the area of building materials. This paper puts forth a strength prediction model for the unfired bricks, combining non-destructive test procedures developed for soils with conventional mechanical strength test methods. The model is based on the compressive strength, a primary component of load-bearing brick elements, in relation to other relevant parameters, like density, binder content and stiffness moduli. The model can be potentially used as a quick guide for other soil types with similar characteristics in the design mix of the bricks. 2. Materials and methodology 2.1 Soils The base soils used in this study were sourced from a residual soil deposit, which consisted primarily of silty to sandy soils (Figures 1 and 2). Three soil samples were collected, namely Parcel K, Borrow Pit and Parcel D. The colours ranged between pale yellowish to orangey. Physical properties of the soils are given in Table 1. All soils were dry and had water contents well that of the plastic limits. Ordinary river sand was used as a secondary material added to the base soils in the preparation of a couple of test specimens, in an effort to explore the potential good of such mixtures. Note that the sand grains fell within the range of medium to fine particle size. Referring to the study by B.V. Venkatarama Reddy and A. Gupta (2008), the compressive strength of soil-cement block masonry was marginally affected by the change of sand grading from coarse to fine. Hence focus was not placed on this aspect in the present investigation. Standard compaction tests (BS1377:1990) were carried out on the soil samples to identify the maximum dry density, ρdMAX, and corresponding optimum water content, wopt (Figure 3). Sample Borrow Pit had the lowest wopt but highest ρdMAX, followed by sample Parcel K and Parcel D respectively in terms of ρdMAX. Note that the Parcel D had the wopt closest to that of its natural water content, suggesting that the soil sample could have been the one which was naturally most compact. It would be examined in the test programme if the natural condition or advantage of a base soil had any significant impact on its compacted stabilised version. 2.2 Stabilising agent Ordinary Portland cement was used as the stabilising agent, with the main purpose of binding the soil particles and forming a stronger, stiffer soil matrix. Cement is not uncommon in the field of soil stabilisation, especially for soft soils with limited shear strength and high compressibility (e.g. C-M Chan, 2008, M-H Ho and C-M Chan, 2009). The amount of cement added to the soils was intentionally kept minimal (i.e. no more than 10 % by dry weight of the base soil) to avoid overdose of stabilising agent, which results in wastage and higher cost of production for the potential building material. Moreover, it has been shown in previous studies with soil stabilisation that small quantities of cement can effectively enhance the performance of originally weak soils (e.g. T.W. Feng, 2002, C.C. Hird and C-M Chan, 2005). Thus the study was conducted along the same path with economising resources and achieving sustainability as the two main targets.
www.ccsenet.org/jsd Journal of Sustainable Development Vol. 3, No. 3; September 2010
ISSN 1913-9063 E-ISSN 1913-9071 142
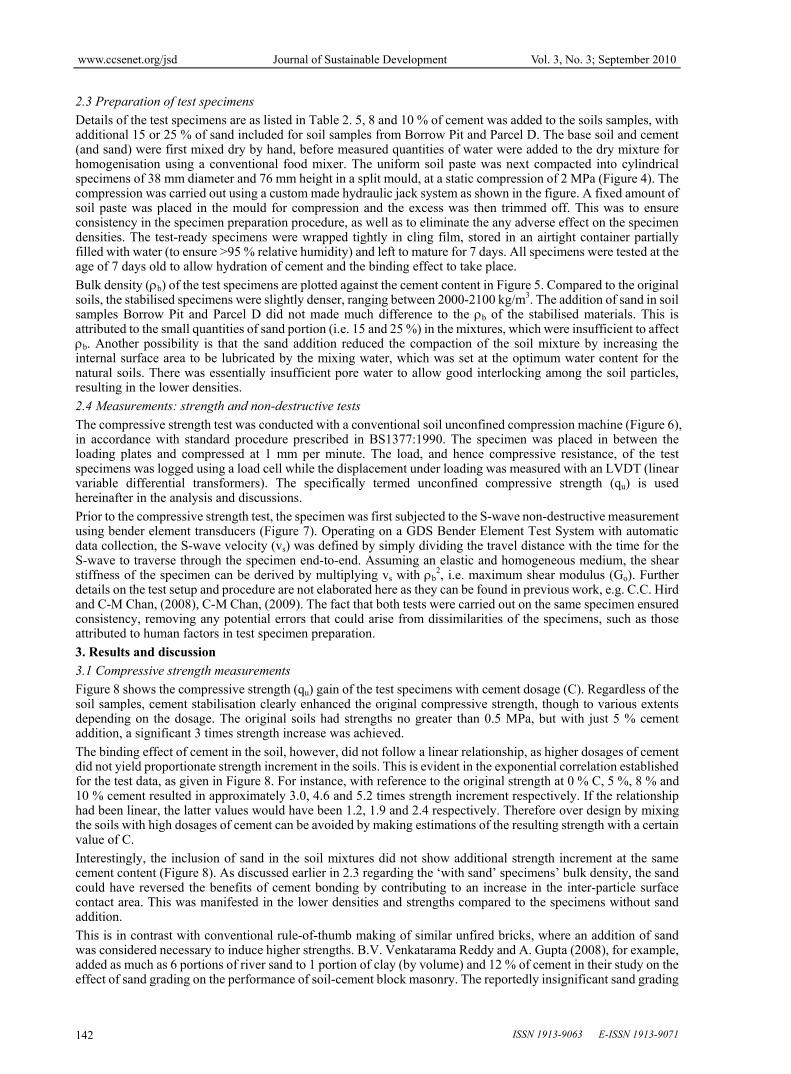
2.3 Preparation of test specimens Details of the test specimens are as listed in Table 2. 5, 8 and 10 % of cement was added to the soils samples, with additional 15 or 25 % of sand included for soil samples from Borrow Pit and Parcel D. The base soil and cement (and sand) were first mixed dry by hand, before measured quantities of water were added to the dry mixture for homogenisation using a conventional food mixer. The uniform soil paste was next compacted into cylindrical specimens of 38 mm diameter and 76 mm height in a split mould, at a static compression of 2 MPa (Figure 4). The compression was carried out using a custom made hydraulic jack system as shown in the figure. A fixed amount of soil paste was placed in the mould for compression and the excess was then trimmed off. This was to ensure consistency in the specimen preparation procedure, as well as to eliminate the any adverse effect on the specimen densities. The test-ready specimens were wrapped tightly in cling film, stored in an airtight container partially filled with water (to ensure >95 % relative humidity) and left to mature for 7 days. All specimens were tested at the age of 7 days old to allow hydration of cement and the binding effect to take place. Bulk density (ρb) of the test specimens are plotted against the cement content in Figure 5. Compared to the original soils, the stabilised specimens were slightly denser, ranging between 2000-2100 kg/m3. The addition of sand in soil samples Borrow Pit and Parcel D did not made much difference to the ρb of the stabilised materials. This is attributed to the small quantities of sand portion (i.e. 15 and 25 %) in the mixtures, which were insufficient to affect ρb. Another possibility is that the sand addition reduced the compaction of the soil mixture by increasing the internal surface area to be lubricated by the mixing water, which was set at the optimum water content for the natural soils. There was essentially insufficient pore water to allow good interlocking among the soil particles, resulting in the lower densities. 2.4 Measurements: strength and non-destructive tests The compressive strength test was conducted with a conventional soil unconfined compression machine (Figure 6), in accordance with standard procedure prescribed in BS1377:1990. The specimen was placed in between the loading plates and compressed at 1 mm per minute. The load, and hence compressive resistance, of the test specimens was logged using a load cell while the displacement under loading was measured with an LVDT (linear variable differential transformers). The specifically termed unconfined compressive strength (qu) is used hereinafter in the analysis and discussions. Prior to the compressive strength test, the specimen was first subjected to the S-wave non-destructive measurement using bender element transducers (Figure 7). Operating on a GDS Bender Element Test System with automatic data collection, the S-wave velocity (vs) was defined by simply dividing the travel distance with the time for the S-wave to traverse through the specimen end-to-end. Assuming an elastic and homogeneous medium, the shear stiffness of the specimen can be derived by multiplying vs with ρb
2, i.e. maximum shear modulus (Go). Further details on the test setup and procedure are not elaborated here as they can be found in previous work, e.g. C.C. Hird and C-M Chan, (2008), C-M Chan, (2009). The fact that both tests were carried out on the same specimen ensured consistency, removing any potential errors that could arise from dissimilarities of the specimens, such as those attributed to human factors in test specimen preparation. 3. Results and discussion 3.1 Compressive strength measurements Figure 8 shows the compressive strength (qu) gain of the test specimens with cement dosage (C). Regardless of the soil samples, cement stabilisation clearly enhanced the original compressive strength, though to various extents depending on the dosage. The original soils had strengths no greater than 0.5 MPa, but with just 5 % cement addition, a significant 3 times strength increase was achieved. The binding effect of cement in the soil, however, did not follow a linear relationship, as higher dosages of cement did not yield proportionate strength increment in the soils. This is evident in the exponential correlation established for the test data, as given in Figure 8. For instance, with reference to the original strength at 0 % C, 5 %, 8 % and 10 % cement resulted in approximately 3.0, 4.6 and 5.2 times strength increment respectively. If the relationship had been linear, the latter values would have been 1.2, 1.9 and 2.4 respectively. Therefore over design by mixing the soils with high dosages of cement can be avoided by making estimations of the resulting strength with a certain value of C. Interestingly, the inclusion of sand in the soil mixtures did not show additional strength increment at the same cement content (Figure 8). As discussed earlier in 2.3 regarding the ‘with sand’ specimens’ bulk density, the sand could have reversed the benefits of cement bonding by contributing to an increase in the inter-particle surface contact area. This was manifested in the lower densities and strengths compared to the specimens without sand addition. This is in contrast with conventional rule-of-thumb making of similar unfired bricks, where an addition of sand was considered necessary to induce higher strengths. B.V. Venkatarama Reddy and A. Gupta (2008), for example, added as much as 6 portions of river sand to 1 portion of clay (by volume) and 12 % of cement in their study on the effect of sand grading on the performance of soil-cement block masonry. The reportedly insignificant sand grading

www.ccsenet.org/jsd Journal of Sustainable Development Vol. 3, No. 3; September 2010
Published by Canadian Center of Science and Education 143
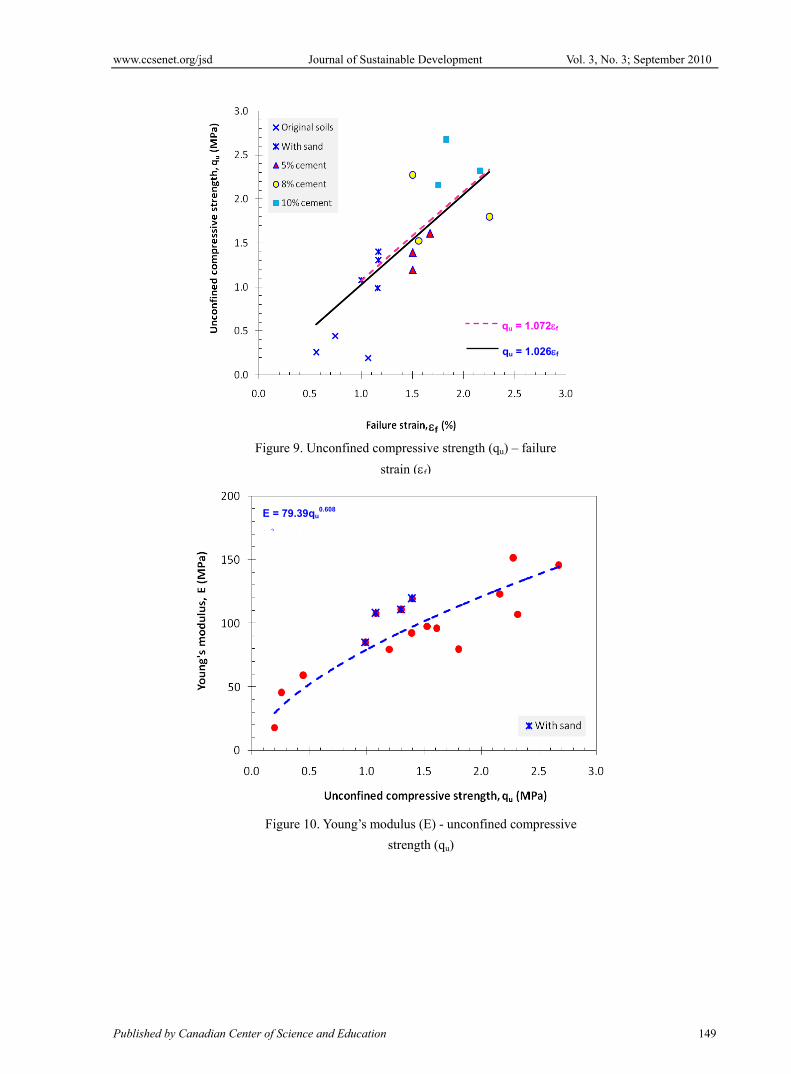
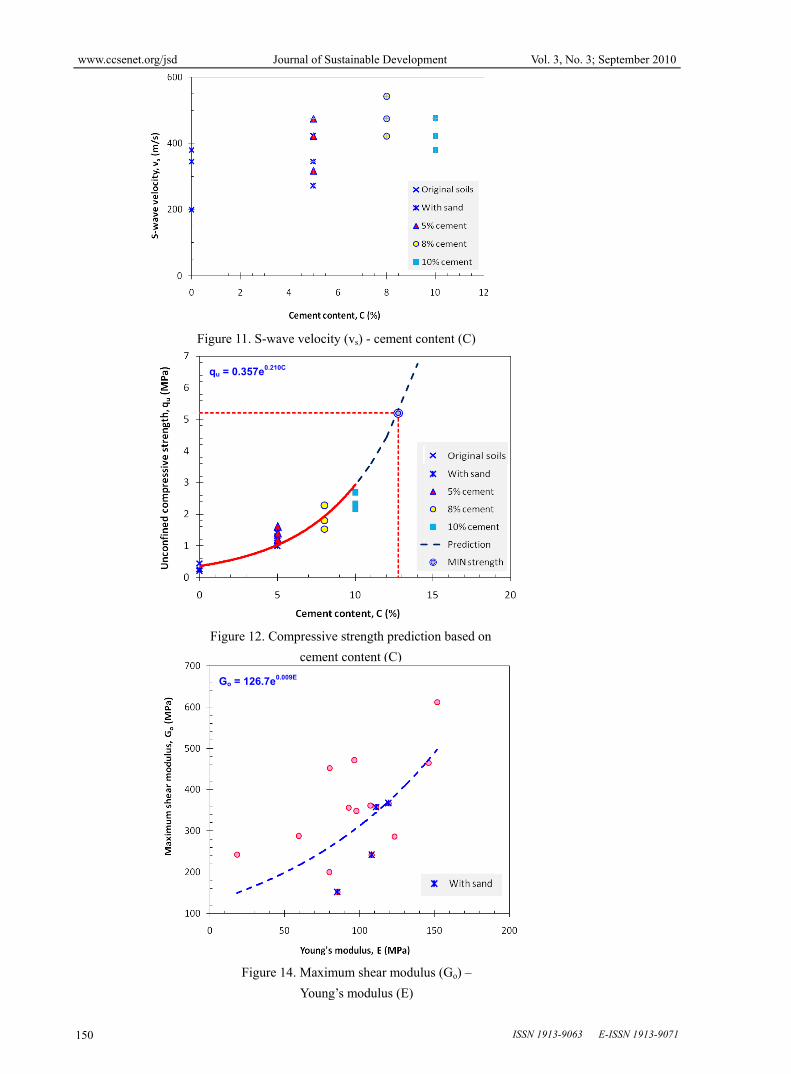
effect apart, the highest compressive strength measured was 4.84 MPa (initial tangent modulus = 4087 MPa, strain at peak stress = 0.0046). Using the strength-cement correlation established for this study, 12 % cement would have produced a brick of 4.44 MPa, not very far off the experimental value obtained by the above mentioned authors. This suggests the almost redundant benefit of sand addition in making unfired earth bricks. The corresponding failure strain (εf) for the qu measured are shown in Figure 9. Two regression lines are plotted, where the dashed line omitted the original soil data. Difference between the two lines and correlations are negligible, as opposed to initial concern that the cement stabilisation effect might have changed the original soil strength characteristics. Referring to the same figure, vertical deformation recorded at peak strength of the test specimens is linearly dependent on the specimen’s resistance against compression. Higher cement content did not only produced harder and stronger specimens, as shown in the greater resistance against compression (Figure 9), it also prolonged the occurrence of rupture failure once the peak strength was exceeded. The Young’s modulus (E) was derived from the individual stress-strain plots and plotted against qu in Figure 10. The ‘with sand’ specimens were included as the effect of sand addition was marginal and would not distort the regression line fit, as discussed earlier. The moduli of the stabilised specimens ranged approximately between 80-150 MPa, markedly below values reported in similar studies, like the corresponding initial tangent modulus for the B.V. Venkatarama Reddy and A. Gupta (2008) study quoted earlier. This could be attributed to the way E is defined. As the initial rise of the stress-strain plot is well known to be steep and linear for hard, stiff materials, derivation of a modulus from this portion of the plot would undoubtedly yield a high value. On the other hand, taking the modulus from the origin to the peak strength of the plot, as adopted in this study, would result in E values of much lower magnitude. This is due to the curvature of the stress-strain plot approaching peak or failure strength, not uncommon in materials such as those examined in this study. 3.2 Non-destructive test Figure 11 illustrates the gain in stiffness due to cementation with measurements of the transverse wave propagation velocity through the test specimen, known as the S-wave velocity (vs). As explained earlier, the non-destructive test gives an estimate of the maximum shear modulus (Go) by taking into account several assumptions. Similar to the trend of compressive strength enhancement (Figure 8), increased cement content resulted in beneficial effect for the shear stiffness of the compressed stabilised soil specimens. Soils from the Borrow Pit gave the highest vs in any case of cement addition, except for those with sand inclusion. Similar drop in vs was also observed in the Parcel D specimens with sand addition. Apparently the addition of sand caused deterioration of the stiffness, much like the lower strengths reported in the compressive strength tests. This could be directly related to the lower densities of the specimens (Figure 5). Since the shear stiffness is a function of the bulk density, the vs reduction is barely unexpected. On a microscopic scale, the less dense specimens would have had a damping effect on the traversing waves, an energy-absorbing phenomenon which would have consequently slowed down the wave arrival on the receiving bender element. This was confirmed by the clearly reduced amplitude of the received signals recorded during the tests as compared to those of the stabilised specimens without any sand added. Nevertheless it ought to be noted that the smaller amplitudes can also be attributed to the poor contact between the bender element and the test specimen. While the test is essentially a non-destructive one, the bender elements had to be pushed into both ends of the specimen to establish good transducer-specimen contact prior to the measurement. Without a firm grip, the vibrating energy of the transmitter could not be fully transformed to the transient motion of the specimen interior (particles moving perpendicular to the wave propagation direction), hence resulting in smaller vibratory amplitudes as captured on the amplitude-time plots. 3.3 Strength prediction model An extrapolation of the strength-cement content plot allows prediction of qu at higher cement content (Figure 12). As marked in the figure, the minimum compressive strength for ordinary bricks stipulated by the Malaysian Standard (MS76: 1972) in Clause 12.1, is 5.2 MPa. To achieve that strength, an addition of 13 % of cement was necessary for all the soils retrieved from the site in this study. Nevertheless low strength units can also be used to erect thick walls of limited height, with the inherent benefit of lower thermal conductivity for hot weather (J.L.R. Araiza et al., 2009). Figure 13 relates the strength (qu) and non-destructive measurement data, vs. The scatter is admittedly appreciable (with the correlation coefficient, R2, not exceeding 50 %), and this is attributed to experimental errors which were unfortunately inevitable under the test circumstances. A typical source of error is the poor contact between the bender elements and the test specimens. Such less than satisfactory test conditions compromised the reading as the poor received signal might have been difficult to interpret. Details on the S-wave arrival time interpretation and related matters can be found in C-M Chan (2009) and will therefore not be elaborated here. In spite of the scatter, it remains apparent that there is a correlation between qu and vs for the compressed stabilised soil specimens. With more data points it is not impossible to refine the model and increase the reliability and correlation coefficient. This chart makes a useful guide for estimation of the compressive strength of the modified

www.ccsenet.org/jsd Journal of Sustainable Development Vol. 3, No. 3; September 2010
ISSN 1913-9063 E-ISSN 1913-9071 144
soils, and quick prediction of the strength for a given mix can be made simply by preparing a single test specimen and repeatedly examine the changing vs with time. The corresponding qu can then be referred to in the chart by projecting a vertical line intersecting the vs. A separate correlation chart between the stiffnesses, Go and E, are presented in Figure 14. Again, this chart can serve as a prediction model for a particular mix of the soils. The Go is obtained in similar way described for vs, and then E can be estimated from the chart. It is perhaps of interest to mention here that the stiffnesses of soils in the very small strain (elastic shear deformation, hence Go) and large strain (plastic deformation, hence E) regions have long been perceived and studied in the field of soil mechanics. Kept within its elastic region, the stiffness is far greater than that of its counterpart in the large strain region. Note the vast difference (almost 130 times) between the Go and E in Figure 14. 4. Conclusions and recommendations Following are the main conclusions drawn from this study and some recommendations for future reference: The addition of sand is detrimental to the performance of the compressed stabilized earth bricks, resulting in
lower density, strength as well as stiffness. Cement is an effective binding agent for the compressed earth bricks, without necessarily incurring more
costs as the amount required to attain the minimum strength requirement (MS76: 1972) is not more than 15 % by dry weight of the soil. The specimens reached peak strengths progressively later with increased cement content, where the
corresponding failure strains increased linearly with strength. A relatively good strength prediction model can be derived from a compilation of the strength and S-wave
velocity measurements, on condition a reliable number of data are made available. This would be conducted on a case-by-case basis, where a correlation chart can be developed for each site for subsequent time- and cost- savings, especially in terms of test specimen preparation and repetitive measurement procedures. Acknowledgement Appreciation is due to the management, staff and researchers of the Research Centre for Soft Soils (RECESS), UTHM. TH Properties S/B, who provided the soil samples, is duly acknowledged as the industrial partner of RECESS in this research project. References Adam, E.A. and Agib, A.R.A. (2001). Compressed stabilized earth block manufactured in Sudan. Paris: United Nations Educational, Scientific and Cultural Organisation (UNESCO). Araiza, J.L.R., Manzano-Ramírez, A., Vorobiev, Y. and de Jesús Pérez Bueno, J. Unifired bricks made of clay-gypsum: mechanical and thermal properties. Proceedings of the 11th. International Conference on Non-conventional Materials and Technologies (NOCMAT2009), Bath, UK. British Standards Institution (BSI). (1990). BS1377: British Standard Methods of Test for Soils for Civil Engineering Purposes. Chan, C-M. (2008). Compressibility study of cement-stabilised clay using the electrical resistivity method. Proceedings of the International Geotechnical Conference on Development of Urban Areas and Geotechnical Engineering, St. Petersburg, Russia. Chan, C-M. (2009). Shear wave velocity measurement in stabilised soil specimens: Arrival time determination. Proceedings of the International Symposium on Deep Mixing and Admixture Stabilisation (OKINAWA 2009), Okinawa, Japan. Feng, T.W. (2002). Effects of small cement content on consolidation behaviour of a Lacustrine clay. ASTM Geotechnical Testing Journal, Vol. 25, No. 1, pp. 53-60. Hird, C.C. and Chan, C.M. (2005). Correlation of shear wave velocity with unconfined compressive strength of cement-stabilised clay. Proceedings of the International Conference on Deep Mixing Best Practice and Recent Advances (Deep Mixing ’05), Stockholm, Sweden. Hird, C.C. and Chan, C-M. (2008). 1-D compression tests on stabilized clays incorporating shear wave velocity measurements. ASTM Geotechnical Testing Journal, Vol. 31, No. 2, pp. 166-174. Ho, M-H. and Chan, C-M. (2009). Chemical effects of cement-stabilised soils on the surrounding soils. 3rd. International Geotechnical Symposium on Geotechnical Engineering for Disaster Prevention and Reduction (IGS2009), Harbin, China. Houben, H. And Guillaud, H. (1994). Earth construction: a comprehensive guide. London: Intermediate Technology Pub. Lawrence, M., Heath, A. And Walker, P. (2008). Modern innovations with unfired clay masonry. Proceedings of the 8th. International Seminar on Structural Masonry (ISSM08), Istanbul, Turkey.

www.ccsenet.org/jsd Journal of Sustainable Development Vol. 3, No. 3; September 2010
Published by Canadian Center of Science and Education 145
Malaysian Standard (MS). (1972). MS76: Specifications for bricks and blocks of fired bricks, clay or shale. Mesbah, A., Morel, J.C., Walker, P. and Ghavami, Kh. (2004). Development of a direct tensile test for compressed earth blocks reinforced with natural fibres, ASCE Journal of Civil Engineering Materials, 16-1, 95-98. Ventakarama Reddy, B.V. and Gupta, A. (2008). Influence of sand grading on the characteristics of mortars and soil-cement block masonry, Journal of Construction and Building Materials, 22, 1614-1623.
Table 1. Properties of the soil.
Soil Sample
Moisture Content, w (%)
Liquid Limit,
LL (%)
Specific Gravity,
Gs
Plastic Limit, PL (%)
Plasticity Index, PI (%)
Maximum Dry Density,
ρd MAX (kg/m³)
Optimum Moisture Content, wOPT (%)
Parcel K 23.1 39.0 2.61 25.6 13.4 1697 18.6
Borrow Pit
16.4 31.9 2.61 25.5 10.4 1797 13.3
Parcel D 24.0 46.9 2.63 30.8 16.1 1630 22.5
Table 2. Summary of test specimens.
Specimen Cement
Content, C (%)
Sand Content, S
(%) qu (MPa) vs (m/s)
Parcel K
Control_K 0 0 0.26 200 K5C 5 0 1.20 317 K8C 8 0 1.53 422 K10C 10 0 2.16 380
Borrow Pit
Control_B 0 0 0.20 346 B5C 5 0 1.61 475 B8C 8 0 2.28 543 B10C 10 0 2.67 475 B5C15S 5 15 1.40 422 B5C25S 5 25 0.99 271
Parcel D
Control_D 0 0 0.45 380 D5C 5 0 1.39 422 D8C 8 0 1.80 475 D10C 10 0 2.32 422 D5C15S 5 15 1.30 422 D5C25S 5 25 1.08 346

www.ccsenet.org/jsd Journal of Sustainable Development Vol. 3, No. 3; September 2010
ISSN 1913-9063 E-ISSN 1913-9071 146
Figure 1. Soil samples from locations (a) Parcel K, (b) Borrow Pit and (c) Parcel D
(a) (b) (c)
Figure 2. Particle size distribution of the soil samples

www.ccsenet.org/jsd Journal of Sustainable Development Vol. 3, No. 3; September 2010
Published by Canadian Center of Science and Education 147
Figure 3. Compaction curves of natural soils

www.ccsenet.org/jsd Journal of Sustainable Development Vol. 3, No. 3; September 2010
ISSN 1913-9063 E-ISSN 1913-9071 148
Figure 6. Unconfined compressive strength test setup
Figure 4. Specimen moulding setup- compression jack and
Split
Hydrauli
Load 76
Test
Loadin
Figure 5. Bulk density (ρb) - cement content (C)
Figure 7. Non-destructive S-wave measurement setup
Figure 8. Unconfined compressive strength (qu) - cement content (C)
qu =
www.ccsenet.org/jsd Journal of Sustainable Development Vol. 3, No. 3; September 2010
Published by Canadian Center of Science and Education 149
Figure 10. Young’s modulus (E) - unconfined compressive strength (qu)
E = 79.39qu0.608
( 2 )
Figure 9. Unconfined compressive strength (qu) – failure strain (εf)
qu = 1.072εf
qu = 1.026εf
εf
www.ccsenet.org/jsd Journal of Sustainable Development Vol. 3, No. 3; September 2010
ISSN 1913-9063 E-ISSN 1913-9071 150
Figure 12. Compressive strength prediction based on cement content (C)
qu = 0.357e0.210C
Figure 14. Maximum shear modulus (Go) – Young’s modulus (E)
Go = 126.7e0.009E
Figure 11. S-wave velocity (vs) - cement content (C)