development of a strategic plan for commercial vehicle ... · the texas a&m university system...
TRANSCRIPT

Technical Report Documentation Page
I. Report No. 2. Government Accession No.
FHWA/TX-99/1767-1
4. Title and Subtitle
DEVELOPMENT OF A STRATEGIC PLAN FOR COMMERCIAL VEHICLE OPERATIONS IN TEXAS
7. Author(s)
Dan Middleton, Jeannette Montufar, and Debbie Jasek 9. Performing Organization Name and Address
Texas Transportation Institute The Texas A&M University System College Station, Texas 77843-3135 12. Sponsoring Agency Name and Address
Texas Department of Transportation Research and Technology Transfer Office P.O. Box 5080 Austin, Texas 78763-5080
15. Supplementary Notes
Project Director Sue Bryant Traffic Operations Div.
(512)416-3175
3. Recipient's Catalog No.
5. Report Date
September 1998 6. Performing Organization Code
8. Performing Organization Report No.
Report 1767-1 10. Work Unit No. (TRAIS)
I I. Contract or Grant No.
Project No. 0-1767 13. Type of Report and Period Covered
Research: September 1997-August 1998 14. Sponsoring Agency Code
Research performed in cooperation with the Texas Department of Transportation and the U. S. Department of Transportation, Federal Highway Administration. Research Project Title: Development of a Texas Strategic Plan for Commercial Vehicle Operations 16. Abstract
This report concludes a one-year project conducted for the Texas Department of Transportation (TxDOT) to develop a statewide strategic plan for commercial vehicle operations (CVO). The report is divided into seven chapters which address the tasks that were defined at the outset of the project. The first chapter provides background information regarding the need for the strategic plan and its foundation. The second chapter presents the summary of a comprehensive literature review concerning strategic planning for CVO and other related topics. Chapter 3 describes the trucking activity in Texas in terms of fleet characteristics, the distribution of trucking activity, and commodity movements. Chapter 4 provides an overview of truck size and weight (TS& W) regulations and safety regulations, as well as current enforcement practices in the state. The next chapter presents an overview of current practices by government agencies and by motor carriers regarding administrative procedures in the state. Chapter 6 describes current advances in information and transportation technology. The proposed strategic plan for Texas is presented in Chapter 7. This plan includes the mission statement, long- and short-term goals and objectives, and the specific milestones, responsibilities, and funding opportunities for Texas.
17. KeyWords
Strategic Planning, Commercial Vehicle Operations, Truck Enforcement, Intelligent Transportation Systems, Commodity Flows
18. Distribution Statement
No restrictions. This document is available to the public through NTIS: National Technical Information Service 5285 Port Royal Road Springfield, Virginia 22161
19. Security Classif.(ofthis report)
Unclassified 20. Security Classif.( ofthis page)
Unclassified 21. No. of Pages 22. Price
144 Form DOT F 1700.7 (8-72) Reproduction of completed page authorized


DEVELOPMENT OF A STRATEGIC PLAN FOR COMMERCIAL VEHICLE OPERATIONS IN TEXAS
by
Dan Middleton, P .E. Program Manager
Texas Transportation Institute
Jeannette Montufar, P.E. Research Associate
Texas Transportation Institute
and
Debbie Jasek Assistant Research Specialist Texas Transportation Institute
Report 1767-1 Research Project Number 0-1767
Research Project Title: Development of a Texas Strategic Plan for Commercial Vehicle Operations
Sponsored by Texas Department of Transportation
In Cooperation with U.S. Department of Transportation Federal Highway Administration
September 1998
TEXAS TRANSPORTATION INSTITUTE The Texas A&M University System College Station, Texas 77843-3135


DISCLAIMER
Data for this study were collected from literature published by various entities. Some of the data were published using English units. Data utilized in this report from these documents remain in original reported form and metric conversion units are provided as needed.
The contents of this report reflect the views of the authors, who are responsible for the opinions, findings, and conclusions presented herein. This project was conducted for the Texas Department of Transportation. The contents do not necessarily reflect the official views or policies of the Federal Highway Administration or the Texas Department of Transportation. This report does not constitute a standard, specification, or regulation.
v

ACKNOWLEDGMENTS
The authors wish to acknowledge the Federal Highway Administration and the Texas Department of Transportation (TxDOT) for financial and other support throughout the project. TxDOT staff were particularly instrumental in providing information and technical assistance for this project, especially, Ms. Susan Bryant, Project Director, and Mr. Carlos Lopez, Program Coordinator, of the Traffic Operations Division. The authors also want to acknowledge the valuable contribution of the following individuals who participated as members of the project advisory team, or provided assistance during the conduct of the research:
Project Advisory Team Mr. Jerry Bobo, Houston/Galveston Area Council Mr. Monty Chamberlain, Motor Carrier Division, TxDOT Mr. Kenneth Copeland, National Highway Traffic Safety Administration Mr. David Dodson, Office of Motor Carriers, FHWA Mr. Les Findeisen, Texas Motor Transportation Association Mr. Lawrence Fite, Texas Department of Public Safety (retired) Mr. Al Kosik, Traffic Operations Division, TxDOT Mr. Patrick Long, Texas Tank Truck Carriers Association Mr. William Reichert, Traffic Operations Division, TxDOT Mr. David Valdez, Traffic Operations Division, TxDOT Ms. Claudia Woods, Vehicle Titles and Registration Division, TxDOT
Government, Industry, and Educational Institutions Major Lester Mills, Department of Public Safety Officer Roscoe Mason, Department of Public Safety, Region VI Mr. Tom Newbern, Traffic Operations Division, TxDOT
Mr. Donald J. Schneider, Schneider National, Inc.
Prof. Alan Clayton, University of Manitoba Transport Information Group Mr. Luis Escobar, University of Manitoba Transport Information Group Prof. Tom Maze, Center for Transportation Research and Education, Iowa State University
VI
TABLE OF CONTENTS
Page
LIST OF FIGURES . . . . . . . . . . . . . . . . . . . . . . . . . . . . . . . . . . . . . . . . . . . . . . . . . . . . . . Xl
LIST OF TABLES . . . . . . . . . . . . . . . . . . . . . . . . . . . . . . . . . . . . . . . . . . . . . . . . . . . . . . XlI
LIST OF ACRONYMS ..... . . . . . . . . . . . . . . . . . . . . . . . . . . . . . . . . . . . . . . . . . . . . . X111
SUMMARy ............................................................ xv
1.0 INTRODUCTION. . . . . . . . . . . . . . . . . . . . . . . . . . . . . . . . . . . . . . . . . . . . . . . . . 1 1.1 PURPOSE................................................... 1 1.2 BACKGROUND.............................................. 1 1.3 OBJECTIVES................................................ 2 1.4 FOUNDATION FOR THE PLAN ................................ 3 1.5 ORGANIZATION OF THE REPORT. . . . . . . . . . . . . . . . . . . . . . . . . . . . . 3
2.0 LITERATUREREVIEW........................................... 5 2.1 GENERAL DESCRIPTION OF THE SEARCH ..................... 5 2.2 THE NATIONAL ITS-CVO PROGRAM .......................... 5
2.2.1 Commercial Vehicle Information Systems and Networks (CVISN) ................................. 8
2.2.2 The National Mainstreaming Program. . . . . . . . . . . . . . . . . . . . . . 8 2.2.3 Business Plans for CVO in Other States .................... 9 2.2.4 Strategic Plans for CVO in Other States .................... 14
2.3 TRUCK ENFORCEMENT . . . . . . . . . . . . . . . . . . . . . . . . . . . . . . . . . . . . . . 18 2.3.1 Enforcement of Weight and Dimension Regulations .......... 18 2.3.2 Enforcement of Safety Regulations . . . . . . . . . . . . . . . . . . . . . . . . 19 2.3.3 Indicators of Non-Compliance Rates. . . . . . . . . . . . . . . . . . . . . . . 19 2.3.4 Desirable Characteristics of Enforcement Programs. . . . . . . . . .. 21
2.4 TRUCKING ACTIVITY AND COMMODITY MOVEMENTS IN TEXAS ................................................... 22 2.4.1 The Texas Truck Fleet . . . . . . . . . . . . . . . . . . . . . . . . . . . . . . . . .. 22 2.4.2 Commodity Movements ................................ 23
2.5 ADMINISTRATIVE PROCEDURES IN TEXAS. . . . . . . . . . . . . . . . . . . . 24 2.5.1 Truck Registration. . . . . . . . . . . . . . . . . . . . . . . . . . . . . . . . . . . . . 24 2.5.2 Oversize and Overweight Permitting. . . . . . . . . . . . . . . . . . . . . . . 24
2.6 SUMMARY COMMENTS. . . . . . . . . . . . . . . . . . . . . . . . . . . . . . . . . . . . . . 24
3.0 TRUCKING ACTIVITY IN TEXAS .................................. 27 3.1 INTRODUCTION............................................. 27 3.2 TRUCK FLEET CHARACTERISTICS. . . . . . . . . . . . . . . . . . . . . . . . . . .. 27
3.2.1 Fleet Size and Truck Configurations. . . . . . . . . . . . . . . . . . . . . . . 28
VlI

TABLE OF CONTENTS (Continued)
3.2.2 Trailer Body Types ................................... . 3.2.3 Truck Weights ....................................... .
3.3 DISTRIBUTION OF TRUCKING ACTIVITy ..................... . 3.3.1 Truck Flows ......................................... . 3.3.2 Base and Range of Operation ............................ . 3.3.3 Vehicle-Miles Traveled (VMT) by the Fleet ................ .
3.4 COMMODITY MOVEMENTS ................................. . 3.4.1 Commodity Movements by Mode ........................ . 3.4.2 Distance Shipped by Truck ............................. . 3.4.3 Tonnage Movements by Truck by Commodity .............. . 3.4.4 Intrastate and Interstate Commodity Movement ............. . 3.4.5 Commodity Movements Originating in Texas .............. . 3.4.6 Commodity Movements Destined for Texas ................ .
3.5 TEXAS-RELATED CARRIER OPERATIONS .................... . 3.5.1 Fleet, Equipment, and Operations ........................ . 3.5.2 Application of Advanced Technologies .................... . 3.5.3 ITS-CVO in Texas .................................... . 3.5.4 Privacy of Data and Information ......................... . 3.5.5 General Comments .................................... .
4.0 TRUCK REGULATION AND ENFORCEMENT PRACTICES
Page
30 31 33 33 35 36 37 37 37 39 40 47 48 51 52 53 53 55 56
IN TEXAS....................................................... 57 4.1 INTRODUCTION............................................. 57 4.2 TEXAS ROAD NETWORK . . . . . . . . . . . . . . . . . . . . . . . . . . . . . . . . . . . . . 57 4.3 TRUCK SIZE AND WEIGHT REGULATIONS. . . . . . . . . . . . . . . . . . . . . 57 4.4 SAFETY REGULATIONS. . . . . . . . . . . . . . . . . . . . . . . . . . . . . . . . . . . . . . 59 4.5 ENFORCEMENT PRACTICES IN TEXAS ........................ 61
4.5.1 Personnel Allocation. . . . . . . . . . . . . . . . . . . . . . . . . . . . . . . . . . . 61 4.5.2 Designated Weighing Areas in Texas ...................... 63 4.5.3 Enforcement of Truck Size, Weight, and Safety Regulations. . . . 64 4.5.4 Municipal Enforcement. . . . . . . . . . . . . . . . . . . . . . . . . . . . . . . .. 65
5.0 ADMINISTRATIVE PROCEDURES IN TEXAS. . . . . . . . . . . . . . . . . . . . . . . . 67 5.1 VEHICLE REGISTRATION.................................... 67
5.1.1 Intrastate Vehicle Registration. . . . . . . . . . . . . . . . . . . . . . . . . . . . 67 5.1.2 Interstate Vehicle Registration. . . . . . . . . . . . . . . . . . . . . . . . . . . . 68
V111
TABLE OF CONTENTS (Continued)
5.2 MOTOR CARRIER REGISTRATION 5.2.1 Intrastate Motor Carrier Registration ........................ . 5.2.2 Interstate Motor Carrier Registration ........................ .
5.3 INTERNATIONAL FUEL TAX AGREEMENT .................... . 5.4 OVERSIZE/OVERWEIGHT PERMITTING ....................... .
6.0 ADVANCES IN INFORMATION AND TRANSPORTATION
Page
69 69 72 71 72
TECHNOLOGY .................................................. 75 6.1 THE NATIONAL ITS-CVO PROGRAM .......................... 75 6.2 ELECTRONIC CLEARANCE . . . . . . . . . . . . . . . . . . . . . . . . . . . . . . . . . .. 76
6.2.1 Advantage 1-75 Operational Test. . . . . . . . . . . . . . . . . . . . . . . . .. 76 6.2.2 Heavy Vehicle Electronic Licence Plate (HELP) Program . . . . .. 77 6.2.3 The ITS-CVO Green Light Operational Test ................ 78 6.2.4 Electronic Clearance for International Borders ......... . . . . .. 79 6.2.5 The International Border Electronic Clearance
Program (IBEX) . . . . . . . . . . . . . . . . . . . . . . . . . . . . . . . . . . . . . .. 79 6.2.6 Port-of-Entry Advanced Sorting System (PASS) ............. 79 6.2.7 Other Electronic Clearance Projects ....................... 79
6.3 SAFETY AND ENFORCEMENT ................................ 80 6.3.1 Safety and Fitness Electronic Records (SAFER) System ....... 81 6.3.2 The Automated Safety Assessment Program (ASAP) . . . . . . . . .. 81 6.3.3 Dynamic Truck Speed Warning for Long
Downgrades Operational Test. . . . . . . . . . . . . . . . . . . . . . . . . . . . 81 6.3.4 Out-of-Service Verification Operational Tests (200 Sites) ...... 82 6.3.5 Roadside MCSAP Computer System ...................... 82 6.3.6 Colorado MAYDAY System. . . . . . . . . . . . . . . . . . . . . . . . . . . .. 82 6.3.7 Operation Respond. . . . . . . . . . . . . . . . . . . . . . . . . . . . . . . . . . . . . 83 6.3.8 Other Safety and Enforcement Projects. . . . . . . . . . . . . . . . . . . . . 83
6.4 COMMERCIAL VEHICLE ADMINISTRATIVE PROCESSES ........ 83 6.4.1 Electronic One-Stop Shopping Operational Tests . . . . . . . . . . . . . 84 6.4.2 Automated Mileage and State Crossing Operational
Test (AMASCOT) ..................................... 84 6.4.3 Electronic Permitting Issuance System for
Oversize/Overweight Vehicles ........................... 84 6.5 FREIGHT MOBILITY ......................................... 85
7.0 PROPOSED TEXAS CVO STATEWIDE PLAN ........................ 87 7.1 MISSION AND VISION STATEMENTS.......................... 87
IX

TABLE OF CONTENTS (Continued)
Page
7.2 GOALS AND OBJECTIVES.................................... 87 7.3 LIST OF PROJECTS FOR THE IMPLEMENTATION
OF THE PROPOSED PLAN .................................... 92 7.4 SAFETY AND ECONOMIC IMPLICATIONS OF
STREAMLINING MOTOR CARRIER OPERATIONS ............... 106 7.4.1 Safety and Enforcement. . . . . . . . . . . . . . . . . . . . . . . . . . . . . . . .. 106 7.4.2 Commercial Vehicle Administrative Processes. . . . . . . . . . . . . .. 108 7.4.3 Freight Mobility. . . . . . . . . . . . . . . . . . . . . . . . . . . . . . . . . . . . . .. 109 7.4.4 Electronic Clearance ................................... 109 7.4.5 Observations for Texas ................................. 110
8.0 REFERENCES ................................................... 113
9.0 APPENDIX ...................................................... 121
x

LIST OF FIGURES
Figure Page
3-1. Texas Truck Fleet by Major Body Type ................................ 31 3-2. Commercial Vehicle Flows in Texas. . . . . . . . . . . . . . . . . . . . . . . . . . . . . . . . . . . 34 3-3. 1994 Vehicle-Miles of Travel by Truck Type. . . . . . . . . . . . . . . . . . . . . . . . . . . . 38 3-4. National Transportation Analysis Regions Used. . . . . . . . . . . . . . . . . . . . . . . . . . 42 3-5. Origin-Destination Commodity Movements by Truck by NTAR of Origin . . . . . 45 3-6. Interstate Tonnage Movements by Major Destination
by Truck by NTAR of Origin ........................................ 49 3-7. Interstate Tonnage Movements by Major Origin by Truck by NTAR of Origin . 50 3-8. Types of Operations Considered in the Motor Carrier Survey ............... 51 4-1. Texas Department of Public Safety Regional Boundaries. . . . . . . . . . . . . . . . . . . 62
Xl

LIST OF TABLES
Table Page
2-1. Minnesota Business Plan Costs. . . . . . . . . . . . . . . . . . . . . . . . . . . . . . . . . . . . . . 12 3-1. 1992 Total Truck Fleet in Texas ...................................... 28 3-2. Texas Truck Registrations Between 1994 and 1997 ....................... 30 3-3. 1992 Average Gross Vehicle Weight (GVW) for
nus Column D Trucks in Texas ..................................... 32 3-4. Average Empty and Gross Weights of Combination and
Apportioned Power Units Registered in Texas from 1988 to 1994 . . . . . . . . . . . . 32 3-5. 1992 Base of Operation for nus Column D Trucks in Texas. . . . . . . . . . . . . . . 35 3-6. 1992 Range of Operation for TIUS Column D Trucks in Texas. . . . . . . . . . . . .. 35 3-7. 1994 Tractor-semitrailer VMT in Texas [millions] . . . . . . . . . . . . . . . . . . . . . . . . 37 3-8. Tonnage by Mode Originating in Texas ................................ 39 3-9. Major Commodity Movements by Truck ............................... 40 3-10. Total Freight Movement by Private and For-Hire Truck within Texas. . . . . . . .. 44 3-11. Major Commodities Moved by Private Truck within Texas . . . . . . . . . . . . . . . . . 47 3-12. Major Commodities Moved by For-Hire Truck within Texas. . . . . . . . . . . . . . . . 47 4-1. TS&W Regulations in Texas. . . . . . . . . . . . . . . . . . . . . . . . . . . . . . . . . . . . . . . . . 58 4-2. Texas Motor Carrier Safety Regulations. . . . . . . . . . . . . . . . . . . . . . . . . . . . . . .. 60 4-3. DPS Personnel Allocation. . . . . . . . . . . . . . . . . . . . . . . . . . . . . . . . . . . . . . . . . . . 63 4-4. Designated Weighing Areas in Texas by Region ......................... 64 5-1. Fees for Household Goods Carriers. . . . . . . . . . . . . . . . . . . . . . . . . . . . . . . . . . . . 70 5-2. Oversize/Overweight Permits for 1995 to 1997 .......................... 74 7-1. Goals and Objectives ofthe Proposed CVO Strategic Plan. . . . . . . . . . . . . . . . . . 89 7-2. List of Projects for the Proposed CVO Strategic Plan. . . . . . . . . . . . . . . . . . . . . . 93 7-3. Qualitative Assessment of Each Proposed Project ........................ 111
xu

LIST OF ACRONYMS
AADTT Average Annual Daily Truck Traffic ACV Automatic Credential Verification AMASCOT Automated Mileage and State Crossing Operational Test ASAP Automated Safety Assessment Program A VC Automatic Vehicle Classification A VI Automatic Vehicle Identification A VL Automatic Vehicle Location
BFB BTS
CFR CFS COVE CPO CVIBOS CVIEW CVISN CVO CVSA
DOT DPS DSRC
FHVUT FHWA FMCSR
GIS GPS GVW GVWR
HCAS HELP
IBEX IFTA IRP
Bridge Formula B Bureau of Transportation Statistics
Code of Federal Regulations Commodity Flow Survey Commercial Vehicle Central Permit Office Commercial Vehicle/International Border Operations System Commercial Vehicle Information Exchange Window Commercial Vehicle Information Systems and Networks Commercial Vehicle Operations Commercial Vehicle Safety Alliance
Department of Transportation Department of Public Safety Dedicated Short Range Communication
Federal Heavy Vehicle Use Tax Federal Highway Administration Federal Motor Carrier Safety Regulations
Geographic Information System Global Positioning System Gross Vehicle Weight Gross V ehicle Weight Rating
Highway Cost Allocation Study Heavy Vehicle Electronic License Plate
International Border Electronic Clearance Program International Fuel Tax Agreement International Registration Plan
X111

IS ISTEA ITS IVHS
LCV LPR LTL
MACS MAPS MCD MCSAP MPO MVE
NAFTA NATAP NHS NN NTAR
OMC OOS OS/OW
PASS PBIS
R&D
SAFER STAA
TIUS TL TRIBEX TS&W
VMT VTR
WIM
Interstate System Intermodal Surface Transportation Efficiency Act Intelligent Transportation System Intelligent Vehicle-Highway Systems
Longer Combination Vehicles License Plate Reader Less-than-Truck Load
Mainline Automated Clearance System Multi-jurisdictional Automated Preclearance System Motor Carrier Division Motor Carrier Safety Assistance Program Metropolitan Planning Officers Motor Vehicle Enforcement
North American Free Trade Agreement North American Trade Automation Prototype National Highway System National Network National Transportation Analysis Region
Office of Motor Carriers Out-of-Service Oversize/Overweight
Port-of-Entry Advanced Sorting System Pen-based Information System
Research and Development
Safety and Fitness Electronic Records Surface Transportation Assistance Act
Truck Inventory and Use Survey Truck Load Texas Regional International Border Electronic Crossing Truck Size and Weight
Vehicle-Miles Traveled Motor Vehicle Titles and Registration
Weigh-in-Motion
XIV

SUMMARY
The U.S. Department of Transportation is deploying several nationwide Intelligent Transportation Systems (ITS) initiatives that may impact commercial vehicle operations (CVO) in the U.S. These initiatives are evolving primarily because: (1) federal, state, and local governments are increasingly being required to do more with limited resources; (2) technology is available to improve safety and efficiency of motor carrier operations; and (3) the motor carrier industry is receptive to improvements that do not compromise safety or efficiency.
This report presents a strategic plan for commercial vehicle operations in Texas, which was developed by the Texas Transportation Institute (TTl) for the Texas Department of Transportation (TxDOT). To develop this plan, it was necessary for the research team to understand: the trucking activity; commodity movements; truck size, weight, and safety regulations; and administrative processes in the state. It was also important to investigate current advances in information and transportation technology, and potential applications in Texas. Several tasks were involved with the development of this plan including: a comprehensive literature review; an extensive analysis of commodity movements and trucking activity in the state; a CVO stakeholder survey; development of goals, objectives, and projects for the CVO plan; and a cursory evaluation ofthe safety and economic implications of the proposed ways to streamline motor carrier activities and administrative procedures in Texas. The following sections discuss highlights from each of these areas as they pertained to the development of the plan.
The Types and Quantity of Trucking in the State
The researchers investigated the current trucking activity in Texas in terms of: (1) characteristics of the truck fleet; (2) truck weights; (3) truck flows; and (4) area of operation of the Texas fleet. Compared to other states, Texas has the third highest truck population after California and Illinois. The Texas truck fleet represents just over 5 percent ofthe national fleet (California represents 10 percent and Illinois represents 7 percent). Nearly 60 percent of Texasregistered trucks are single unit trucks, approximately 33 percent are tractor-semitrailers, 7 percent are truck and trailer combinations, and less than 1 percent are tractor-double trailers.
Locations where TxDOT traffic classification count data indicate the ( estimated) Average Annual Daily Truck Traffic (AADTT) is relatively high (1997) are as follows:
(1) IH-35 between Dallas and Austin (south of Waco) -10,165 trucks per day; (2) IH-45 between Dallas and Houston (south ofSH 21) - 6,933 trucks per day; (3) IH-lO between San Antonio and Houston (East ofSH 71) - 8,107 trucks per day; (4) IH-10 east of Houston (east ofSH 146) - 9,900 trucks per day; (5) IH-20 between EI Paso and Dallas (east of US 84) - 5,612 trucks per day; (6) IH-20 east of Dallas (west ofSH 19) -7,120 trucks per day; and (7) IH-30 east of Dallas (west ofSH 19) - 6,253 trucks per day.
xv

Most trucking activity generated by the state stays within Texas. More than threequarters of the trucks registered in the state drive less than 25 percent of their mileage outside of Texas. One of every 40 trucks drives from 75 to 100 percent of its mileage outside the state. More than 80 percent of all truck trips are within 321 km (200 mi) of their base location or off the road. Only 1 of 14 trucks operates in the 321 to 805 km (200 to 500 mi) range, and 1 of 17 trucks makes trips that are greater than 805 km (500 mi). This indicates that the vast majority of Texas-based trucking is intrastate in nature, and the total trucking activity is mainly local.
Commodity Movements by Truck
Of all the tonnage that originates in Texas, trucking handles just over one-half, and almost 30 percent of all ton-miles of freight movement take place by truck. Of the total reported tonnage that originates in Texas and is moved by truck, private trucking accounts for almost 60 percent and for-hire trucking accounts for the remaining 40 percent. Six commodities account for 80 percent of the reported truck-transported tonnage originating in Texas. These commodities are: nonmetallic minerals, petroleum and coal products, food or kindred products, chemicals or allied products, farm products, and lumber or wood products excluding furniture. Local shipping distances -less than 80 km (50 mi)-account for 70 percent of all tons moved by truck, and short haul shipping distances -less than 402 km (250 mi)-account for nearly 90 percent. Two types of analyses were conducted to investigate commodity movements: (1) an analysis for intrastate activity; and (2) an analysis for interstate activity.
Regarding intrastate activity, it was found that 75 to 85 percent of the intrastate tonnage moved in Texas moves intra-regionally (meaning that it stays within the region of origin). Of the tonnage that moves intrastate and moves inter-regionally (or between regions), two-thirds is attracted by the Dallas-Fort Worth-Abilene region, and the Houston-Beaumont region. The same two regions generate just over two-thirds of the intrastate tonnage. The analysis also found that at a regional level, private trucking dominates commodity movements in Texas, accounting for almost 70 percent of the activity. Private trucks transport mainly petroleum and coal products; nonmetallic minerals; clay, concrete, glass, or stone products; chemicals or allied products; farm products; food or kindred products; and lumber or wood products, excluding furniture. For-hire trucking transports the same commodities with the exception of petroleum and coal products.
There are two types of interstate commodity movements: commodity movements which originate in Texas and are destined for other states; and commodity movements which originate in other states and are destined for Texas. The major destinations for truck-transported tonnage that originates in Texas are: Louisiana, Arkansas, New Mexico, Oklahoma, California, and Kansas. Together, these states attract just over one-half of all the truck-transported interstate tonnage originating in Texas. The major origins for the tonnage destined for Texas are: Oklahoma, Louisiana, Arkansas, Tennessee, California, Kansas, and Mississippi. Together, these states generate three-quarters of all the truck-transported interstate tonnage destined for Texas.
XVI

Enforcement Practices of Truck Size, Weight, and Safety Regulations
The Department of Public Safety (DPS) is responsible for the enforcement of weight, dimension, and safety regulations of motor carriers in Texas. A total of321 troopers patrol and enforce these regulations on the 329,298 km (204,660 mi) of rural highways in the state. The DPS conducts approximately 85,000 inspections-all levels combined-each year statewide. There are 245 designated weighing areas in Texas. This includes 40 permanent (in-ground) scale sites which are also suitable for Level I inspections, 98 other locations suitable for Level I inspections, and 107 additional weigh strips. DPS License and Weight troopers conduct Commercial Vehicle Safety Alliance (CVSA) inspections daily as a part of their routine patrol duties or at permanent scale facilities. Due to safety reasons, the DPS requires that two troopers be present when Level I inspections are conducted. Drivers and vehicles that are found to be in violation of the regulations in such a manner as to pose a serious safety condition to the general public are placed out-of-service using the North American uniform out-of-service (OOS) criteria developed by CVSA. The driver or the vehicle is prevented from operating further on the highways of Texas until the OOS condition is corrected.
Administrative Procedures in the State
The research addressed four types of administrative procedures:
(1 ) Vehicle registration; (2) Motor carrier registration; (3) International Fuel Tax Agreement (IFTA); and (4) Oversize/overweight (OS/OW) permitting.
All motor vehicle registration and titling activities in Texas are the responsibility of the Texas Department of Transportation Vehicle Titles and Registration Division (TxDOTNTR). The central office is located in Austin, and there are 17 regional offices around the state. The regional offices support the state's 254 county Tax Assessor-Collectors, who serve as statutory agents of the Department. Most counties in Texas are now connected to a centralized system called Registration and Title System (RTS). This is a point-of-sale system linking county tax offices to the Department's mainframe. With RTS, the Department can: (1) update registration records within 48 hours; (2) provide current information to law enforcement officers about vehicle registration; and (3) provide information to contract users of motor vehicle data. Motor carriers involved in intrastate operations are required to register their vehicles at the local County Tax Assessor-Collector's office. Motor carriers involved in interstate operations may either: register their vehicles under the International Registration Plan (IRP); register in a base jurisdiction that has regular interstate reciprocity with Texas; or purchase a trip permit.
Regarding motor carrier registration, Transportation Code Chapter 643 provides that a motor carrier may not operate a commercial motor vehicle or a tow truck, or transport household goods on a for-hire basis, without first registering their operations with the TxDOT Motor
XVll

Carrier Division. The Motor Carrier Division's offices are located in Austin, and all motor carrier registration is accomplished through these offices. Motor carriers operating on an exclusively intrastate basis, or operating interstate and not registered under the single state registration program, are required to register their operations and file proof of financial responsibility with TxDOT. Any interstate for-hire motor carrier authorized to transport passengers or property that has its principal place of business in Texas, or selects Texas as its registration state, must file with the Department an application to register for all states of travel before beginning operations in Texas.
The Texas Comptroller of Public Accounts is responsible for International Fuel Tax Agreement (IFTA) permits. IFTA is a reciprocity agreement that allows motor carriers licensed in one member jurisdiction to satisfy their fuel tax obligations to all other member jurisdictions through that jurisdiction. Any carrier based in a member jurisdiction, operating qualified motor vehicles in two or more member jurisdictions is required to license under 1FT A.
Oversize/Overweight (OS/OW) permits and temporary trip permits are issued by the TxDOT Motor Carrier Division (MCD) for movements of indivisible loads. These permits must be obtained prior to moving those loads in the state. OS/OW permits issued in the state of Texas include:
(1) Permits for loads exceeding 36,248 kg (80,000 lbs) gross vehicle weight (GVW), 9,062 kg (20,000 lbs) per single axle, 15,405 kg (34,000 lbs) per tandem axle, or 295 kg per 25.4 mm (650 lbs per in) of tire width; and
(2) Permits issued for combination vehicles exceeding 19.8 m (65 ft) in length, 2.6 m (8.5 ft) in width, or 4.3 m (14 ft) in height.
An applicant may request an OS/OW permit either over the telephone, by facsimile, or through an Internet application. The routing method is manual, using a District Permit Map. In the case of requests made by fax or through the Internet, approved permits are sent by fax to the applicant.
Advances in Information and Transportation Technology
The National ITS-CVO program is an amalgamation of various initiatives representing the efforts of individual states, groups of states, the Federal Government, the trucking industry, and other associations. The primary goals of the ITS-CVO program are:
(1 ) To enhance safety; (2) To enhance productivity through the use of better fleet management tools; (3) To reduce costs for the motor carrier industry; (4) To reduce environmental and energy impacts; (5) To improve tax administration and credentials; and (6) To improve regulatory compliance.
XV111

The National ITS-CVO program is organized to develop and deploy capabilities in six user service areas: electronic clearance (domestic and international); automated roadside safety inspections; on-board safety monitoring; administrative processes; fleet and freight administration; and hazardous materials incident response. Electronic clearance allows commercial vehicles to travel with minimum or no stopping through ports of entry or weigh stations. Automated roadside safety inspections provide automated information to inspectors to assist them with the inspection process. On-board safety monitoring provides the capability for sensing the safety status of the vehicle, driver, or cargo while traveling at mainline speeds. Administrative processes consists of: (1) electronic purchase of credentials, which allows carriers to automatically apply for permits or for registration, and (2) automated mileage, fuel reporting and auditing, which allows carriers to automatically record total trip miles and fuel purchases for purposes of mileage and fuel tax reports. Fleet and freight administration provides drivers and dispatchers with real-time information about the location and routing of a vehicle. Hazardous materials incident response provides a description of any hazardous materials involved in incidents and defines appropriate countermeasures. Examples of ongoing and completed operational tests in each of these areas are included in the report.
Proposed Texas evo Statewide Plan
The final component of this research project was to develop a Texas CVO statewide plan that provides a clear and concise mission statement, long-and short-term goals and objectives, and an action plan with specific project milestones and funding levels. The plan was derived from previous and currently ongoing programs, national initiatives, and information gathered during the conduct of the research. The strategic plan is intended to be proactive, recognizing national mandates and funding opportunities by focusing on ITS technologies that will improve the safety, efficiency, and productivity of commercial vehicle operations in Texas. The proposed plan contains four goals and 10 objectives, as well as a list of 12 projects that will help achieve those goals and objectives.
XIX


1.0 INTRODUCTION
This chapter provides the purpose, objectives, and foundation for this report, as well as background infonnation that supports the need for the development of a strategic plan for commercial vehicle operations (CVO) in Texas.
1.1 PURPOSE
The proposed strategic plan presents an integrated road map to the state's commercial vehicle operations program with a clear mission statement, goals and objectives, a listing of potential projects, milestones, responsibilities, and funding levels. This plan will serve as a guide for Texas to improve the efficiency, safety, and productivity of commercial vehicle operations on Texas highways.
1.2 BACKGROUND
Several national initiatives impacting commercial vehicle operations (CVO) throughout the United States are being deployed by various offices of the Federal Highway Administration Office of Motor Carriers (FHWAIOMC) and other entities within the U.S. Department of Transportation. These initiatives are evolving primarily because: (1) federal, state, and local governments are increasingly being required to do more with limited resources; (2) technology is available to improve safety and efficiency of motor carrier operations; and (3) the motor carrier industry is receptive to improvements that enhance safety and efficiency.
One of the items included in the Intennodal Surface Transportation Efficiency Act (ISTEA) of 1991 was the Intelligent Transportation Systems (ITS) program. This program was designed to improve mobility and transportation productivity, enhance safety, and decrease the environmental impact of travel through the application of advanced technologies. Currently, there are many states participating in the testing and deployment of initiatives applied to commercial vehicle operations under the ITS program (ITS-CVO). Programs such as the Commercial Vehicle Infonnation Systems and Networks (CVISN), the North American Trade Automation Prototype (NATAP), and CVO Mainstreaming illustrate some of the most relevant components of the National ITS-CVO program.
Full deployment ofITS-CVO involves multiple jurisdictions, and institutional issues are a challenging problem currently facing commercial vehicle operations. In an effort to address this problem, the Federal Highway Administration funded state and regional studies of institutional barriers to ITS-CVO implementation. One of the institutional issues studies was the COVE (Commercial Vehicle) study (8), conducted to investigate institutional barriers for seven states in the southwestern region of the country (Arizona, Arkansas, Colorado, Louisiana, New Mexico, Oklahoma, and Texas).
1

The COVE study recommended the following for Texas: (1) guidance ofCVO programs and policies; (2) simplification of CVO rules and regulations; (3) provision of electronic services; and (4) evaluation and implementation of appropriate technology for CVO.
With the completion of the COVE study and the testing and deployment of initiatives under the National ITS-CVO program, the development of a statewide strategic plan was viewed as critical in optimizing the use ofITS-CVO initiatives. For the development of this strategic plan, it was important to consider that several characteristics set Texas apart from other states that are also in the process of developing strategic plans:
• The size of the state and the distribution of trucking-dispersed over vast areas of land-are factors to consider to effectively use limited enforcement resources.
• The volume of trucks at the 22 border crossings in Texas represents approximately onehalf of all trucks crossing the entire U.S.-Mexico border on a daily basis. In addition, Texas has the highest truck volume crossing point along the entire U.S.-Mexico border at Laredo.
• Texas does not utilize ports of entry (POEs) at its state borders, choosing rather to conduct enforcement primarily with roving patrols, supplemented with a few fixed sites. This mode of operation is intended to utilize scarce resources to minimize noncompliance. This also results in relatively few locations suitable for Commercial Vehicle Safety Alliance (CVSA) Level I inspections.
• Other agencies in addition to DPS are also trained and authorized to conduct commercial vehicle enforcement of size and weight laws.
Using the COVE study and current practices as starting points, this Texas CVO plan recognizes and leverages national mandates and opportunities in addition to international activities bearing on freight movement on Texas highways. It also considers advances in information and transportation technology; streamlining of motor carrier regulatory and administrative procedures and improved safety; and productivity of motor carrier activities in the state.
1.3 OBJECTIVES
The objectives ofthis project for the development of a state CVO strategic plan are:
• To identify advances in information and transportation technology which may be applied to commercial vehicle operations in Texas.
• To seek involvement and input from key CVO stakeholders in the state of Texas regarding current issues and concerns about commercial vehicle operations in the state.
2

• To identify ways to streamline motor carrier regulatory and administrative activities. This is done either by making use of advanced technologies or by modifying current practices of the participating agencies.
1.4 FOUNDATION FOR THE PLAN
To provide the foundation for this plan, it was jointly decided between the Texas Transportation Institute (TTl) and the Texas Department of Transportation (TxDOT) that the following questions be examined regarding commercial vehicle operations:
• What types and quantity of trucking operate in the state, and how do they relate to regulatory activities? Considerations of interest are truck volumes, fleet mixes, truck usage, and vehicle characteristics.
• What are the truck size and weight (TS& W) and safety regulations that govern trucking in Texas, and what are the current enforcement practices?
• What are the current administrative procedures in Texas? Considerations of interest are domestic registrations, International Registration Plan (IRP), International Fuel Tax Agreement (IFTA), and oversize/overweight (OS/OW) permitting.
• What are the current efforts in the U.S. regarding strategic planning for commercial vehicle operations, particularly the national CVO initiatives involving advances in information and transportation technology?
Because commercial vehicle operations is a broad topic and due to time constraints applied to this project, the research for the development of this plan focuses primarily on the vehicle component of commercial vehicle operations and not on issues related to the driver and the roadway.
1.5 ORGANIZATION OF THE REPORT
Chapter 2 presents the summary of a comprehensive literature search concerning strategic planning for Commercial Vehicle Operations (CVO). The issues of main interest are: (1) the national CVO initiatives involving advances in information and transportation technology; (2) truck enforcement; (3) trucking activity in Texas; and (4) motor carrier administrative procedures in Texas.
Chapter 3 describes the trucking activity in Texas in terms of: (1) fleet characteristics-fleet size and truck configurations, and truck body types; (2) the distribution of trucking activity-truck flows, range of operation, and vehicle-miles traveled; and (3) commodity movements-intrastate and interstate. The information presented in this chapter is based on: (1)
3

the most recent Truck Inventory and Use Survey (TIUS) by the Bureau of Census, published in 1994; (2) the "Analysis of the Truck Inventory and Use Survey from the Truck Size and Weight Perspective" by the U.S. DOT Federal Highway Administration; (3) Texas DOT truck registration information; (4) the U.S. DOT Highway Cost Allocation Study (HCAS); (5) the most recent Commodity Flow Survey (CFS), published in 1996; and (6) a motor carrier survey of companies that operate in Texas.
Chapter 4 provides an overview of the Texas road network, the truck size and weight (TS& W) regulations and safety regulations that govern regular operations, and current enforcement practices in the state.
Chapter 5 presents an overview of current practices by government agencies and by motor carriers regarding administrative procedures in Texas. More specifically, the chapter discusses: (1) vehicle registration; (2) motor carrier registration; (3) International Fuel Tax Agreement (IFTA); and (4) oversize/overweight (OS/OW) permitting.
Chapter 6 describes current advances in information and transportation technology, and potential applications in Texas. This is based on a comprehensive literature search concerning the national ITS-CVO program, national CVO initiatives involving advances in information and transportation technology, the types and quantity of trucking activity in the state, and on views provided by the motor carrier industry and other stakeholders.
Chapter 7 presents the proposed strategic plan with the mission and vision statements, long- and short-term goals and objectives, and the general action plan with specific milestones, responsibilities, and funding levels for Texas. The chapter also provides a cursory evaluation of safety and economic implications of the proposed ways to streamline motor carrier regulatory activities and administrative processes. The chapter is a product of the information and evaluations presented in previous chapters. It identifies additional research needs of TxDOT related to the CVO strategic plan and general priorities of research topics.
4

2.0 LITERATURE REVIEW
This chapter presents a summary of the comprehensive literature search concerning strategic planning for Commercial Vehicle Operations (CVO). The issues of interest were: the national CVO initiatives involving advances in information and transportation technology; truck enforcement; trucking activity in Texas; and motor carrier administrative procedures in Texas.
2.1 GENERAL DESCRIPTION OF THE SEARCH
The literature search included the following databases and catalogs: NOTIS-the local library database at Texas A&M University; Wilson's Periodical Database; FirstSearch Database, which provides access to WorldCat-the OCLC Online Union Catalog, Article First, Contents First, and GPO-U.S. government publications; National Technical Information System (NTIS); Periodical Abstracts Database; and Transportation Research Information Service (TRIS).
The literature search also included an extensive search on the Internet. The sites that were visited and where searches were conducted include: (1) The Bureau of Transportation Statistics National Transportation Library; (2) Transportation Research Board Publications; (3) FHWA Office of Motor Carriers; (4) The Great Lake Center for Truck and Transit Research at the University of Michigan; (5) The Center for Transportation Research and Education at Iowa State University; (6) The Institute of Transportation Studies at the University of California; (7) ITS Online; (8) The Commercial Vehicle Operations Program; and (9) ITS America. The key words and key word combinations used to conduct the search were:
1. CVO initiatives 17. ITS and commercial vehicle 2. commercial vehicle initiatives 18. commercial vehicle regulations 3. CVISN 19. borderless CVO operations 4. NATAP 20. trucking and technology 5. CVO mainstreaming 21. advanced commercial 6. federal truck initiatives transportation systems 7. commercial vehicle strategies 22. advanced transportation systems 8. commercial vehicle safety for commercial vehicles 9. CVO stakeholder initiatives 23. truck inspection automation 10. commercial vehicle economics 24. ITS and trucking 11. motor carrier initiatives 25. truck enforcement 12. size and weight regulations 26. compliance 13. safety enforcement 27. truck weight 14. compliance rates 28. trucking compliance 15. trucking Texas 29. truck safety regulation 16. CVO nationwide
5

The following sections summarize key findings reported in the literature pertaining to: the National ITS-CVO program; truck enforcement; trucking activity in Texas; and motor carrier administrative procedures in Texas.
2.2 THE NATIONAL ITS-CVO PROGRAM
The literature defines Intelligent Vehicle-Highway Systems (lVHS), now called Intelligent Transportation Systems (ITS), as "the use of modem communications, computer and control technologies and systems to improve mobility and transportation productivity, enhance safety, maximize utility of transportation facilities, save energy, and protect the environment." (1). The goals of ITS in the United States are: to improve safety; to reduce congestion; to increase the quantity and quality of mobility; to reduce environmental impacts; to improve energy efficiency; to improve economic productivity; and to create a viable U.S. ITS industry (2).
Commercial Vehicle Operations (CVO) are associated with the movement of goods and passengers using commercial vehicles (mainly trucks and buses), and the necessary activities to regulate these operations. CVO include activities related to commercial vehicle credentials and tax administration, freight and fleet management, safety assurance, roadside operations, and vehicle operations (3).
ITS-CVO systems apply a variety of ITS technologies to improve the safety and efficiency of commercial vehicle operations (2). ITS technologies such as weigh-in-motion (WIM), automatic vehicle identification (A VI), automatic vehicle classification (A VC), automatic vehicle location (AVL), on-board computers (OBC), and smart transponders are currently being applied to CVO to streamline administrative procedures and improve the productivity and safety of trucking (4).
The national ITS-CVO program is part of the ITS architecture. This architecture is made up of a logical and a physical architecture. The logical architecture defines eight major processes and associated information flows. The physical architecture allocates the processes ofthe logical architecture to four physical classes (5).
The logical architecture is comprised of: managing traffic; managing commercial vehicles; providing vehicle monitoring and control; managing transit; managing emergency services; providing driver and traveler services; providing electronic payment services; and planning system deployment and implementation. The physical architecture is made up of: transportation management centers; roadside equipment; vehicles; and travelers (5).
The national ITS-CVO program is an amalgamation of various initiatives representing the efforts of individual states, groups of states, the federal government, the trucking industry, and other associations (4). Three literature references give slightly different versions ofthe main goals and objectives of the ITS-CVO program as follows:
6

• to enhance safety, to enhance productivity through the use of better fleet management tools, and to reduce costs for the motor carrier industry (2);
• to improve highway safety, to improve level of service, to reduce environmental and energy impacts, to increase productivity, and to enhance mobility (6); and
• to improve shipping efficiency, to improve commercial vehicle safety, to increase freight mobility, to improve tax administration and credentials, and to improve regulatory compliance (7).
The ITS-CVO program is organized to develop and deploy capabilities in six user service areas: (1) automated roadside safety inspections; (2) administrative processes; (3) electronic clearance (domestic and international); (4) on-board safety monitoring; (5) hazardous materials incident response; and (6) fleet and freight administration (4, 8). These are discussed in detail in Chapter 6.
Full deployment of the ITS-CVO program involves multiple jurisdictions, and according to the literature, institutional issues are the most challenging problem currently facing commercial vehicle operations (9). In an effort to address this problem, the Federal Highway Administration funded state and regional studies of institutional barriers to ITS-CVO implementation. It was found that throughout the U.S. there is a myriad of institutional issues that impede multi state cooperation for the development and deployment ofITS-CVO initiatives (10). Institutional issues range from lack of communication and cooperation among state agencies to business practices and regulations that do not accommodate the new technologies that support ITS-CVO (10).
One of the institutional issues studies is the COVE (Commercial Vehicle) study, conducted to investigate institutional barriers of seven states (Arizona, Arkansas, Colorado, Louisiana, New Mexico, Oklahoma, and Texas). The goals of the study were to: promote CVO regulatory efficiency; improve trucking industry productivity; and enhance safety. It was determined that for the state of Texas to achieve these objectives, a number of institutional barriers specific to Texas must be addressed (8):
• Organizational Complexity: Additional communication and cooperation is needed between state agencies in Texas involved in CVO.
• Regulatory Complexity: Several Texas agencies have developed data sharing agreements, but this information is not automated or accessible after office hours. There is an interest in developing a non-redundant, shared, statewide, regional, or national database.
7

• Lack of a Customer Service Orientation: Stronger relationships need to be established between some agencies involved in CVO regulatory activities and the motor carrier industry. Efforts should be made to educate the motor carrier industry on the benefits that new technologies and concepts offer.
• Inadequate Understanding and Appreciation of CVO and ITS: Early operational tests concerning ITS technology left some agencies concerned about the accuracy and appropriateness of new technology.
• Resource Constraints: Texas does not operate ports of entry, and weigh stations are not permanently staffed and open. Random inspections are the primary enforcement method used by the state. A limited state budget and carriers that do not want to pay additional fees limit the available funding for proposed projects.
Other states also produced reports concerning institutional issues and ways in which those issues could be addressed in order to facilitate full-scale ITS-CVO implementation.
In addition to the institutional issues and barriers studies, as part of the national ITS-CVO program, the Department of Transportation, through the ITS-CVO Mainstreaming Program, organizes and manages the deployment of intelligent transportation systems for commercial vehicle operations (11).
2.2.1 Commercial Vehicle Information Systems and Networks (CVISN)
CVISN is part of the National ITS-CVO program. The purpose ofCVISN is to make shipper operations safer and more efficient through safety assurance, electronic clearance, electronic carrier application, and national clearinghouse information exchange (12). More specifically, CVISN will make possible the electronic interchange of data among public agencies, motor carriers, and third-party service providers (4).
CVISN is a way for existing information systems to electronically exchange information through the use of standards and the u.S. commercially available communications infrastructure (13). The CVISN program will be implemented in five stages: (1) development of the management plan and technical framework for subsequent phases; (2) prototyping of the technology-prototype tests in Maryland and Virginia began in 1996; (3) piloting the approach in some states before national deployment-a model deployment began in late 1996 in California, Colorado, Connecticut, Kentucky, Michigan, Minnesota, Oregon, and Washington; (4) deployment of technology from pilot states to an equal number of partner states; and (5) widespread deployment to all interested states-this is expected to be completed by the year 2005 (3).
8

2.2.2 The National Mainstreaming Program
The purpose of the National Mainstreaming Program is to organize and manage the deployment ofITS for CVO. More specifically, the main objectives are to: incorporate ITSCVO into state and metropolitan transportation planning activities; coordinate activities among agencies and states; and educate key decision makers and the public and private sectors about the ITS-CVO program (14).
The National Mainstreaming Program includes activities such as: providing support for state and regional groups from the private and public sector; developing state and regional business plans for commercial vehicle operations: conducting economic analyses that provide support for deployment; appointing ITS-CVO champions in each region to work on ITS-CVO deployment; and educating the general public about ITS-CVO activities (15). Through these activities, the national ITS-CVO program is developing policies, plans, and projects at the state, regional, and national level. It should be noted that the state of Texas is not currently part of the National Mainstreaming Program in which there are more than 34 states currently participating.
CVISN focuses on exchanging CVO information electronically, while mainstreaming creates state and regional business plans for the implementation of CVISN. The following sections discuss CVISN and the National Mainstreaming Program.
2.2.3 Business Plans for evo in Other States
One ofthe components of the ITS-CVO Mainstreaming Program is the development of state business plans for commercial vehicle operations. The purpose of an ITS-CVO business plan is to describe the vision and goals of a state, as well as to define particular projects, responsibilities, milestones, and funding opportunities for the state (16). This section presents highlights from the business plans developed by Minnesota and Kentucky as part of the National Mainstreaming Program.
2.2.3.1 Minnesota (17, 18, 19)
Minnesota is one of eight pilot states demonstrating the feasibility of implementing the CVISN architecture to support CVOs. The overall objective of CVISN is "to streamline motor carrier administrative and enforcement activities to benefit the public sector and motor carriers".
Minnesota's CVISN Pilot Objectives
The following objectives are consistent with the CVISN Model Deployment Memorandum of Agreement (MOA) objectives identified by FHW A:
• Improve customer service by reducing redundancy and paperwork for carriers and CVO agenCIes.
9

• Collect safety inspection data electronically from the roadside and upload to SAFETYNET.
• Provide electronic application and credentials issuance capabilities to carriers and service bureaus regarding 1RP, 1FT A, operating authority, intrastate vehicle registration, hazardous material permitting, and oversize/overweight permitting.
• Develop an interface between state systems and 1RP, 1FT A, and hazardous materials clearinghouses.
• Provide electronic clearance at a limited number of fixed and mobile sites.
• Use dedicated short-range communications (DSRC) and license plate readers (LPRs) at roadside inspection facilities to electronically identify vehicles and carriers for verification of safety information.
• Provide access to certain safety and credential information for insurance providers, shippers, and others.
Organizational Structure
Minnesota's CVO program is managed by several committees which are responsible for overseeing the planning for and deployment of CV1SN. These are listed below.
• CV1SN Steering Committee - senior management from each Minnesota CVO agency - votes on critical CVO issues - serves as the CV1SN Configuration Control Board
• CV1SN Working Group - operational managers from each Minnesota cva agency - technical direction of CVO activities - serves as Technical Control Board for CV1SN program
• CV1SN Project Management Team
• CV1SN System Architect
• CV1SN Technical Support
10

Project Planning Process
Planning procedures to support the CVISN deployment initiative are noted below.
• Adherence to state ITS-CVO business plan-key issues about this business plan are:
Minnesota's Guidestar CVO Business Plan (needs assessment) was developed by Cambridge Systematics and Ziifle Consulting, for the Minnesota DOT, April 1995, this plan was developed under the auspices of Minnesota DOT's Guidestar Program-responsible for applying ITS to Minnesota's surface transportation system, a separate project section in the Minnesota DOT was responsible for the Business Plan for ITS/CVO applications, the plan involved a three-month public participation process which included interviews with more than 50 individuals (agency officials, carrier managers, Minnesota-based shippers) and four focus groups and workshops with government officials and carrier representatives involved in CVO in Minnesota and neighbouring states. The plan is based on the needs assessment defined through this process, the plan did not attempt to quantify benefits of the proposed actions, commercial vehicle operations issues and problems were classed as: (1) deskside; (2) roadside; and (3) communication.
• Development of an overall CVISN project plan
• Development of detailed CVISN work plans which identify specific activities and assign responsibilities to individuals
• Development of systems development guidelines
• Establishment of CVISN configuration management practices
Plan Schedule and Cost
Minnesota's business plan is scheduled to be implemented over a five-year period. The following are specific time frames identified in Minnesota's strategic plan:
• October 1996-May 1997-Phase 1 (Planning)
• June 1997-November 1997-Phase 2 (Electronic application submittal, uploading of inspection data from laptops, some roadside electronic screening development, safety information, and roadside electronic screening)
11

• December 1997-May 1998-Phase 3 (Electronic processing and issuance of credentials, use of CVIEW for safety information, and roadside electronic screening)
• June 1998-November 1998-Phase 4 (Develop capability to accept electronic payment, use CVIEW for safety information, and roadside manual queries)
• December 1998-May 1999-Phase 5 (On-line OS/OW vehicle routing, accept electronic payment, safety information, and roadside electronic screening)
• June 1999-November 1999-Phase 6
• December 1999-May 2000-Phase 7 (Electronic payment for motor vehicles)
Table 2-1 shows the cost of implementing this plan. Available information did not indicate the source of funding for these elements. The plan was developed by the Minnesota CVISN project management team in conjunction with the state's CVISN Working Group and CVISN Steering Committee.
Table 2-1. Minnesota Business Plan Costs
Plan Element Cost ($)
Program management 935,760 System engineering 300,000 Carrier systems 2,500 State system (credentials) 1,656,400 Safety information exchange 176,300 Roadside electronic screening 1,989,522 Evaluation 3,200
TOTAL COST 5,063,682
2.2.3.2 Kentucky (20)
Kentucky is one of the CVISN Model Deployment states, and lead state in the main streaming initiative. With the development of the state's ITS-CVO Business Plan, Kentucky is now working towards the enforcement of motor carrier safety and regulatory laws in a way which maximizes public safety while enhancing motor carrier efficiency.
12

The Goals of the Business Plan
Kentucky's vision for ITS-CVO is composed of a series of elements as noted below:
• Improve and streamline commercial vehicle operations: This is intended to make tax and other CVO application processes quicker and easier for both the applicant and the administrator.
• Continue Kentucky as a national leader in ITS-CVa: This focuses on improving Kentucky's image as a technologically advanced and customer-driven state. By being a leader in ITS-CVO, the state can also improve industry awareness of highway safety issues and motor carrier safety and economic regulations.
• Integrate and coordinate ITS operations and Empower Kentucky: The main goal of this objective is to prepare a statewide plan that shows how ITS-CVO will support Kentucky's ITS vision, and outlines the most promising areas of future undertaking.
• Conduct paperless cva operations with timely, current, accurate, and verifiable electronic information while maintaining security and privacy: The development of a paperless application environment will help ensure a systematic and uniform direction for CVO application processes. Administrators will also be able to process the volume of carriers moving through the state in a more efficient manner.
• Enhance cva productivity, safety, and efficiency by eliminating unsafe and illegal operations and providing incentives for improved performance: This objective is intended to reduce the rate and severity of crashes involving commercial vehicles in Kentucky, while decreasing the time and cost of compliance for safe carriers.
• Create a cva system that is self-sufficient, uses multiple vendors, and is user friendly: By using externally based technologies for which at least two fully developed and compatible versions exist, and are not owned and controlled by the same legal or public entity, Kentucky will be able to maintain a uniform system direction.
Kentucky Projects for the Plan
There are several projects that Kentucky proposes to undertake or continue to support in order to achieve the objectives of the business plan. Some ofthese projects are the following:
• Advantage CVO (1-75) - sponsored by FHW A Office of Motor Carriers, participating states, motor carriers,
and general public - total cost to date $13.5 million
13

• (Empower) Motor Vehicle Enforcement (MVE) Process Improvement - sponsored by Empower Kentucky-$I.03 million - total expected cost is $1.03 million over three years along with yearly personnel costs - scheduled to train 22 officers and have them on the job by July 1, 1998
• Registration, Taxation, and Permitting Improvements - sponsored by FHW A/OMC CVISN Model Deployment-$269,000; and by Empower
Kentucky and the Kentucky Transportation Cabinet-$685,000 and $456,000 - total cost of the project is $1.4 million over three years - initial installation of the system is scheduled by January, 1998
• Electronic Screening - sponsored by FHW A/OMC CVISN Model Deployment-$63 0,000; and by the
Kentucky Transportation Cabinet-$313,000 - total cost of the project is $943,000 over five years including all weigh stations - implementation of new systems at one station is scheduled for January 1998,
including satellite site. Implementation at all sites is scheduled for June 2002
• Institutional Issues Working Group - sponsored by FHWAIOMC-$600,000 and the state of Kentucky-$50,000 - there are 14 southeast and Midwest states involved - total cost of the project is $1.2 million - Scheduled for completion by January, 1999
• Safety Information System - sponsored by FHW AIOMC CVISN Model Deployment-$60,000; Empower
Kentucky-$1.04 million; and MCSAP-$100,000 - total cost of the project is $1.2 million over three years - all 18 weigh stations are scheduled to be networked by January 1999
• Kentucky Statewide ITS Plan - sponsored by the Kentucky Transportation Cabinet, Division ofPlanning-$200,000 - other agencies and clients involved include MPOs and commercial carriers - total cost of the project is $400,000 - scheduled for completion by July, 1999
Kentucky's business plan provides the goals for long-term ITS-CVO initiatives, the framework to link current and future projects together, and the forum within which future decisions will be made.
14

2.2.4 Strategic Plans for CVO in Other States
Strategic plans for commercial vehicle operations in the states of Washington and California were obtained. This section presents a summary of the most relevant issues addressed in those plans.
2.2.4.1 Washington (21)
Commercial vehicle operations in Washington are impeded by: (1) vehicle weight, safety and OS/OW permit inspection delays; (2) inspection station overload closures; and (3) inadequate information exchange processes.
Origin of Plan
The Washington DOT, Washington Department of Licensing, and Washington Patrol jointly endorsed development ofa statewide CVO Strategic Plan. In addition, Washington was selected as one of eight states for pilot deployment of CVISN (as was Minnesota).
Together, the CVO Strategic Plan and CVISN model deployment program will provide a "road map to migrate from paper-based documents to electronic transactions, change manual roadside enforcement procedures to enforcement activity based on informed decisions using electronic information, and establish the communications networks to share critical information."
The CVO Strategic Plan focuses on five primary elements of the CVISN pilot deployment program: (1) safety assurance; (2) electronic clearance/screening; (3) electronic carrier applications; (4) electronic payments and fund transfers; and (5) commercial vehicle information exchange and national clearinghouse interfaces.
Estimated CVO Program Costs
The total capital budget for the plan is $23.5 million ($13.5 million from the state and $10.0 million from the federal government). The federal funds are as follows:
• $1.0 million FHW A grants-CVISN Pilot and Mainstreaming Program
• $6.4 million FHW A CVO Deployment Matching Funds
• $100,000 FHWA MCSAP Motor Carrier Safety Grants (R&D)
• $1.5 million Federal Border Crossing Earmark
• $1.0 million FHW A NATAP Border Crossing Corridor Funds
15

The remainder is state funds ($2.0 million from old funds and $11.5 million from new funds). The money will be allocated in the following areas:
• port of entry technology systems-$2.5 million
• major interior weigh scales-$11.0 million
• electronic plug-in weigh stations-$1.9 million
• rover vans-intelligent systems-$0.7 million
• safety and enforcement communication infrastructure-$0.5 million
• electronic credential systems-$1.9 million - IRP -IFTA - carrier electronic payments - state-national clearinghouse electronic remittance and transmittals - OS/OW permits - commercial vehicle information exchange window (CVIEW) system
• international border electronic clearance systems-$2.5 million
• contingency-$2.4 million
Estimated CVO Program Benefits
CVO program benefits (for a 1 O-year period) were estimated in three benefit categories: (1) costs avoided ($28.7 million); (2) cost savings ($13.5 million); and (3) anticipated revenue increases ($6.9 million). Subtracting incremental operating and maintenance costs of $18.3 million, the estimated net total benefit was $30 million. The largest single benefit was "estimated reduced motor carrier weight inspection delays-labour costs," accounting for onequarter of all benefits. Coupled to "estimated reduced safety inspection delays for safe motor carriers," these two benefits accounted for one-third of all benefits.
2.2.4.2 California (22)
With the implementation of the North America Free Trade Agreement (NAFTA), the California Department of Transportation developed a strategic plan for border crossing activities along the Southern California Priority Corridor. The proposed Commercial VehiclelInternational Border Operations System (CVIBOS) Deployment Plan will support users (e.g., motor carriers, drivers, government CVO regulatory/enforcement agencies) in the following user service areas: (1) trip planning; (2) electronic credentials; (3) electronic clearance;
16

(4) electronic funds transfer; (5) electronic data interchange; (6) traffic monitoring; (7) traveler alerts/information; (8) traffic management; (9) traffic control; (10) trip re-planning; (11) emergency alerts; and (12) trip log for commercial vehicles using the corridor.
Origin and Objectives of the Plan
According to the California Department of Transportation, due to NAFT A, there will be an extensive movement of commercial vehicles between Canada, Mexico, and the U.S., specifically through San Diego and Southern California. The ability of commercial vehicles to operate throughout the U.S. will require extensive upgrades to the U.S. commercial vehicle traffic management and information systems. One example is automatic vehicle identification, classification, location, and monitoring systems, which are necessary to support the limited law enforcement resources. For Southern California to remain competitive and realize full economic benefits ofNAFTA and CVISN, a comprehensive Southern California Priority Corridor ITS Strategic Deployment Plan had to be developed and implemented. The FHW A Early Deployment Planning Process was used to develop an ITS Strategic Plan based on the expected increase in commercial vehicle operations along the Southern California Priority Corridor. The objectives of the plan are as follows:
• Determine significant problems and issues related to goods movement and border crossing activity in Southern California.
• Develop a vision for solutions to the problems and issues related to goods movement and border crossing.
• Identify and recommend areas where the application of advanced technologies can be used to improve goods movement and border crossings.
• Identify and recommend transportation technology solutions for incorporation into the Southern California Priority Corridor ITS Strategic Deployment Plan and other plans of the state of California.
Funding and Implementation
A number of funding sources are available to support CVIBOS deployment:
• Federal Funding Sources: there are several funding opportunities from the federal government included in the following programs which are part ofthe National Economic Crossroads Transportation Efficiency Act (NEXTEA):
- Intermodal Transportation R&D Program ($10 million in 1998, $15 million in 1999, $20 million in 2000, $30 million in 2002, and $35 million in 2003)
17

- Strategic Planning for Research and Technology Program ($56 million to 2000 and $84 million to 2003)
- FHWA Research and Technology Program ($96 million per year to 2000 and $130 million per year to 2003)
- Intelligent Transportation Systems (ITS) Program ($100 million per year)
In addition, California has also been selected as a CVISN pilot state for deployment of CVISN technologies. FHW A provides $500,000 for projects involving ITS.
• State Funding Sources: The state has been supportive of ITS deployment, and has provided 10 percent local match for all of San Diego's Early Start Projects. There are several state funding programs including:
- Traffic Systems Management Program ($1 million per year) - Flexible Congestion Relief (FCR) Program ($1 million per year)
• Regional Funding Sources: Three funding sources at the regional and local level for this strategic plan are:
- TransNET and Sales Taxes - AB2766 (APCD)-regional vehicle registration fees ($6 million per year) - Regional Transportation Impact Fees
• Private Funding Sources: Private investment will play an important role in ITS deployment, specially in the traveler information and cva program areas.
2.3 TRUCK ENFORCEMENT
Weight and dimension regulations, as well as safety regulations, playa very important role in commercial vehicle operations in all jurisdictions. This section discusses enforcement practices, as well as enforcement levels of those regulations.
2.3.1 Enforcement of Weight and Dimension Regulations
This section addresses the issue of enforcement of weight and dimension regulations. The literature identifies several possible ways (all with different efficiency levels) to achieve weight and dimension control: (1) enforcement at permanent inspection stations; (2) enforcement by means of patrolling; and (3) enforcement by using WIM technologies.
"Enforcement is a critical element of any plan for controlling vehicle weights. Without effective enforcement, including the certainty of penalties and sanctions sufficient to deter violation, weight limit laws become meaningless"(23). It is the responsibility of the individual
18

states to effectively enforce all state and federal laws that pertain to the weights and dimensions of vehicles that operate within their borders (24).
In the case of the state of Texas, officers from the Department of Public Safety are responsible for enforcing the weight, dimension, and safety regulations pertaining to motor carriers. This is done through a roadside (or on-the-highway) vehicle inspection and enforcement program which consists of random checks of commercial vehicles. The vehicles are selected by officers while on patrol or through concentrated inspection activities. These activities are conducted at specially constructed motor vehicle checkpoints throughout the state. The patrol officers are stationed at approximately 100 locations statewide (25).
2.3.1.1 Permanent Scale Sites for Weight and Dimension Control
Permanent scales can weigh trucks at a high rate. However, the rate of citations issued at these scales decreases as the number of trucks weighed increases (26).
Permanent .scales used for port-of-entry operation have been found to be effective in states that have major rivers as boundaries. However, although these scales may be attractive and useful for the control of interstate operations, they have no effect on intrastate routes (26). The effectiveness of permanent stations for enforcement purposes has decreased during the years due to the increasing use of citizens band (CB) radios, which allow truck drivers to warn one another when a permanent weigh station is open (23, 24). In addition, it has been found that the number of overweight trucks in the traffic stream on the weigh station route decreases very rapidly when weigh stations are open (27).
The two major reasons why permanent scales are able to detect only a portion of overloaded vehicles are: (l) truck drivers can bypass the scales by taking alternate routes; and (2) truck drivers can adjust their hours of operation based on the times when the scales will be closed (28).
2.3.1.2 Patrols for Weight and Dimension Control
Weight and dimension enforcement with the use of portable scales results in high citation rates, mainly because experienced patrol officers can detect the potentially overloaded trucks to be weighed (26, 29). A study conducted in Alberta, Canada, found that during the first six months offiscal year 1988, 17 percent of the trucks weighed by patrols were overweight versus approximately 1 percent of those weighed at permanent scales (29). This could be mainly because" a highly randomized pattern of enforcement by road segment and time period provides for greater deterrence than a regularized enforcement pattern" (27).
19

2.3.1.3 Weigh-in-Motionfor Weight and Dimension Control
The use of weigh-in-motion (WIM) scales as an aid for weight enforcement has increased since 1984. By 1992, there were 24 states using WIM scales for enforcement purposes (30). "Although WIM scales have not yet been accepted by courts as the sole basis for determining violations of weight limit laws, these scales are used quite effectively to screen trucks on busy highways so that only those trucks that appear to be operating above the legal or statutory weight limits are removed from traffic to be weighed on static or portable scales" (23).
Making use of WIM for enforcement screening may result in a very small number of trucks that are found to be in compliance when weighed. However, state enforcement agencies cannot enforce weight laws or write citations based on dynamic forces (30).
2.3.2 Enforcement of Safety Regulations
The two main safety enforcement approaches in the U.S. are: (1) roadside inspections; and (2) on-site compliance reviews (31). The enforcement of weights is also in itself safety enforcement because vehicles are required to operate at a certain maximum weight to achieve acceptable levels of stability and control (31).
The Commercial Vehicle Safety Alliance (CVSA) developed the North American Uniform Out-of-Service (OOS) criteria for use in roadside inspections (32). Roadside inspections are usually conducted as part of the vehicle weight and dimension enforcement process. The trucks are, for the most part, selected at random for these types of inspections since it is believed that random selection for enforcement results in higher violation detection rates (33). Some trucks may also be selected based on the carrier's profile (31).
2.3.3 Indicators of Non-Compliance Rates
The only way to measure the level of compliance in a jurisdiction or on a particular segment of road is to survey the particular link or jurisdiction in question (34).
2.3.3.1 Weight and Dimension Regulations
In 1989, the Federal Highway Administration (FHW A) conducted a study where truck weight data were compiled from the annual state certifications. The study found that despite increasing efforts to enhance truck weight enforcement, truck overloading remained approximately constant between 1984 and 1987 (23). As part of that same study, FHWA reviewed WIM data collected by six states between 1984 and 1986. It was concluded that about 10 to 20 percent of all combination vehicles were operating illegally overweight without a permit (23). In a similar study in 1988, information from several states was used to determine the estimated range of expected overweight operations in the absence of enforcement. One state reported an overweight rate between 13 percent and 59 percent on the Interstate System. Data
20

from another state indicated a 35 percent to 57 percent overweight rate on the Interstate System at times when weigh stations were not in operation (27).
A study conducted in the state of Washington in 1992 found that 81 percent of citations from overweight permit violations occurred at permanent scales. The commodities with the largest number of permit violations were machinery and lumber or wood products (35). The study also found that double trailer combinations showed the largest violation rates, followed by single trailer and straight trucks.
A study conducted in Texas in 1981 found that 61.1 percent of overweight and overdimension violations occurred on U.S. and state highways, and 27.7 percent on Interstate highways. In addition, it was found that dump trucks were the most frequent violators of weight limits, whereas flatbeds were the most frequent violators of size limitations. In addition, on a commodity basis, grain, sand, gravel, and log transporters were the carriers with the highest violation rates in the state (36). Interstate carriers accounted for about 10 percent of all violations, and intrastate carriers accounted for about 80 percent (36).
The combination of the low probability of apprehension and the low fines imposed if apprehended has given rise to an economic incentive for overweight trucking (23). In the case of Texas, for example, it was reported in 1987 that license and weight officers from the Department of Public Safety check vehicles, on average, once every 12,500 miles (37).
2.3.3.2 Safety Regulations
"If inspected, the average commercial motor vehicle on today's highways stands about a one in three chance of failing an inspection and being placed out-of-service" (32). The predominant factor for which trucks are placed out-of-service is brake misadjustment (31, 39). It has been found that brake problems account for 43 percent of the total ODS violations (32).
The increase in the number of roadside inspections has contributed to a decrease in the number of defects. A study conducted in New York reports that there was a 40 percent decrease in the number of defects between 1986 and 1992 (32). Similarly, a study conducted in Manitoba shows that the proportion of heavy trucks passing inspections in that Canadian province more than doubled between 1992 and 1996 (38).
2.3.4 Desirable Characteristics of Enforcement Programs
The effectiveness of a truck weighing program is measured in part by the number of trucks weighed compared to the total truck population. There is also a need for the acquisition of data on truck routes and volumes, number of interstate versus intrastate movements, types of cargo, and distances traveled (26).
21

F or enforcement purposes, the rules and regulations should be easy to understand by enforcement officers and by motor carriers (23). The reason is that laws and regulations that are difficult to understand or to follow, due to their complexity or to the numerous exceptions to their applications, give rise to reduced levels of enforcement (23).
The literature recommends that each state should evaluate its truck weight enforcement program in mutual cooperation within and among the agencies involved. There is also a need to determine the most effective enforcement procedures taking into consideration existing regulations and available resources (26). In addition, in order to improve compliance with trucking regulations, an enforcement agency should do the following: (1) increase the cost of being detected in non-compliance with the regulations; (2) increase the perceived probability of being detected in such a violation; and (3) assist motor carriers in complying with the regulations (23, 27, 34).
In the area of safety enforcement, one study recommends that the number of roadside inspections must be increased but without increasing inspection costs. This could be done through increased efficiency in one of three ways: (1) reducing inspection time by means of automated inspection systems; (2) increasing the OOS rate using automated preclearance; and (3) reducing inspection time by adopting a first-fault inspection methodology, where a vehicle is automatically placed OOS after the first OOS defect is detected (32). Another study indicates that one possible method for improving truck safety would be to apply advanced information technology that makes the decision-making process easier, particularly for roadside inspections (31, 45).
The main weakness of a roadside inspection program is the delays it imposes on motor carriers. Studies have found that a typical roadside inspection delays the vehicle by 31.5 minutes (39).
2.4 TRUCKING ACTIVITY AND COMMODITY MOVEMENTS IN TEXAS
This section presents a brief description of the trucking activity and commodity movements in Texas. It is particularly important to understand the make-up of the truck fleet, commodity handlings, base and range of operations, and truck volumes.
2.4.1 The Texas Truck Fleet
Based on figures from the Truck Inventory and Use Survey (TIUS), in 1992 there were 214,408 trucks registered in Texas. This figure excludes the following: pickups; minivans; sport utility trucks; station wagons; trucks or truck tractors with four tires; and trucks pulling one-axle trailers or one-axle utility trailers (40). Single unit trucks accounted for about 60 percent of the Texas truck fleet, truck and trailer combinations accounted for 7 percent, tractor-semitrailer combinations accounted for about one-third, and tractor-double trailer combinations accounted for less than 1 percent (41).
22

From vehicle classification data available at six classification locations on IH-35 in Texas in 1996, the following was found regarding fleet mix (41):
• Straight trucks (effectively all two- and three-axle) account for about 30 percent of the observed fleet-from a low of approximately 15 percent in Laredo to a high of more than 40 percent on the south side of F ort Worth.
• Five-axle tractor-semitrailers dominate the fleet mix, accounting for approximately 60 percent of the observed fleet-from a high of approximately three-quarters at Laredo to a low of approximately 47 percent on the south side of Fort Worth.
• Double trailer combinations account for approximately 2 to 5 percent of the observed fleet at all classification locations.
• Three and four-axle tractor-semitrailers and truck plus trailer combinations account for between 6 and 8 percent of the observed fleet.
Typical trip lengths for the Texas-based truck fleet are as follows: almost 60 percent of the trucking occurs within 50 miles from home; approximately 20 percent of the trucking occurs between 50 and 100 miles from home; 7 percent is between 100 and 200 miles from home; 8 percent is within 200 and 500 miles from home; and trips that are longer than 500 miles account for 7 percent (42). This illustrates the point that most trucking occurs within the state.
Based on vehicle classification data estimated by TxDOT, the highest truck volumes occur on Interstate Highways along the following links: (1) Dallas to San Antonio on IH-35 (south of Waco) - 10,165 trucks per day; (2) east of Houston on IH-lO (east ofSH 146) - 9,900 trucks per day; (3) Dallas to Houston onIH-45 (south ofSH 21) - 6,933 trucks per day; (4) east of Dallas on IH-20 (west ofSH 19) -7,120 trucks per day; (5) east of Dallas on IH-30 (west of SH 19) - 6,253 trucks per day; (6) at Texas/Oklahoma border on IH-35 - 5,612 trucks per day; and (7) west of Dallas on IH-20 (east of US 84) - 5,612 trucks per day (41).
There are other U.S. federal highways that also show relatively high truck volumes ranging from 1,800 to approximately 2,000 trucks per day. Some of these include: u.S. 77 from Houston to Brownsville; U.S. 59 from Houston to Long-Marshall; U.S. 281 from Three Rivers to McAllen; and u.S. 84 from Lubbock to I-20 (41).
2.4.2 Commodity Movements
According to the TIUS, the principal commodities that are moved by Texas trucks include building materials, processed foods, farm products, mixed cargoes, and petroleum. Truck usage by those commodity groups combined accounts for 52 percent of total movements by Texas-registered trucks (42).
23

Trucking handles approximately one-half of the Texas originating tonnage-mainly in private versus for-hire trucks. Almost 20 percent of the tonnage is handled by pipeline, 15 percent is handled by rail, and the remaining 15 percent is handled by other modes of transportation (43).
Short-haul shipping distances (less than 250 mi) account for approximately 95 percent of all tons moved by private trucks, and 85 percent of all tons moved by for-hire trucks. Longhaul shipping distances (250 mi and more) account for approximately 4 percent of all tons moved by private trucks, and 15 percent of those moved by for-hire trucks. The quantity of tonnage moved by rail long-haul shipping distances is more than the quantity moved by truck (41 percent by rail; 10 percent by truck-private and for-hire combined) (43).
2.5 ADMINISTRATIVE PROCEDURES IN TEXAS
This section presents findings from the literature review regarding current practices pertaining to truck registrations and size and weight permitting in Texas.
2.5.1 Truck Registration
The titling and licensing of vehicles in Texas is done through TxDOT Motor Vehicle Titles and Registration Division (VTR). The Registration Auditing Section of TxDOT is now the International Registration Plan Branch, or the IRP Branch of TxDOT. This branch issues apportioned license plates and cab cards (8). There are two vehicle registration processes. One process applies to interstate vehicle registrations, and the other applies to intrastate vehicle registrations.
An intrastate motor carrier in Texas can register vehicles under regular registration either in person at the local county tax assessor-collector office or through regular mail. Interstate carriers that travel through Texas can register their vehicles in one of three ways: under the IRP program; in a base jurisdiction that has regular interstate reciprocity with Texas; or purchase permits (8).
2.5.2 Oversize and Overweight Permitting
Oversize and overweight permits, as well as temporary trip permits, are issued by the TxDOT Motor Carrier Division. Any permit must be obtained prior to the movement of the load. There are four principal types of oversize/overweight permits issued by the permit office: (1) overweight permits, which are issued for loads exceeding an 80,000-pound gross vehicle weight, or axle weights of more than 20,000 pounds on single axles or 34,000 pounds on tandem axles. These permits also apply to loads exceeding the 650 pounds per inch allowable tire weight: (2) overlength permits, which are issued to semitrailers exceeding 59 feet and combination vehicles exceeding 65 feet; (3) overwidth permits for operations at more than 8.5 feet; and (4) overheight permits for operations at heights above 14 feet. Oversize and overweight
24

permits can be obtained over the telephone or by fax. All phone calls related to permit transactions are recorded on audiotape and stored as an official record of the transaction (8).
2.6 SUMMARY COMMENTS
There has been a large amount of money spent in the U.S. on research and testing of new technologies applied to commercial vehicle operations. The work done by the different states and regions has provided and continues to provide important information about ways to apply a variety oflTS technologies to improve the productivity and safety of trucking and at the same time streamline administrative procedures. This information is also useful for strategic planning, particularly for the development of a strategic plan for commercial vehicle operations in the state of Texas. The following observations, comments, and recommendations emerge based on the literature search:
• Texas should consider implementing the recommendations presented by the COVE study concerning overcoming the institutional barriers for commercial vehicle operations. The COVE study recommended: the guiding of CVO programs and policies; the simplification ofCVO rules and regulations; the provision of electronic services; and the evaluation and implementation of appropriate technology.
• The Federal Highway Administration developed a model business plan which includes the following: (1) description of the state-this discusses the current cva program, economic and political characteristics, and issues and opportunities; (2) strategic overview-mission statement, guiding principles, and goals and objectives of the ITSCVO program; (3) program summary-this involves the description and ranking of specific projects in the areas of safety assurance, credentials administration, electronic screening, and carrier operations; and (4) organization and management approach-includes the roles and responsibilities of stakeholders, schedule and milestones, and funding requirements and sources.
• The Texas strategic plan is being designed for the public sector and the private sector, particularly, the trucking industry. The public sector's main focus is the administration and enforcement of trucking regulations, and many of these regulatory programs are in a state of change. The administration and enforcement of these regulations is complex because of the different agencies that are in charge of administering the regulations. In addition, there is minimal or no communication among these agencies regarding carrier or other types of information that could easily be shared by those agencies. Many collect data without being aware that other agencies already have the information which could be electronically interchanged.
• Each carrier is unique in terms of territory served, commodities hauled, and services provided. Therefore, incentives to paying a fee to bypass weigh scales vary. For example, a private carrier that makes frequent long distance trips using company-
25

employed drivers may be very interested in weigh scale bypassing and therefore, will be willing to pay a fee to achieve this. A company using owner operators may not be highly interested in bypassing, since time may be lost in other activities not directly related to the movement. A carrier that moves heavy equipment using trip permits may be very interested in bypassing, since there is a considerable amount oftime lost in stopping and producing trip permit documents at the scale.
• The trucking industry is comprised of different types of operations (interstate versus intrastate), equipment, and fleet sizes. For this reason, different carriers have different needs which should be addressed in the strategic plan. In addition, the development of the strategic plan should define the ITS-CVO initiatives to be deployed. As stated in reference (4), "it should layout the projects, objectives, roles, responsibilities, milestones, and funding, and estimate the costs and benefits of these activities for the state, motor carriers, and the public."
• It is important to recommend a system of electronic technology that can be applied to existing infrastructure.
• There is a need for aggressive interstate cooperation to ensure interoperability and coordination of functions, operations, and maintenance of ITS-CVO systems among states. In the case of Texas, this effort will require the participation of neighboring states like Oklahoma, New Mexico, Arizona, Arkansas, Colorado, and Louisiana.
• The state of Texas should make available to stakeholders: sufficient information about the benefits of applying ITS to CVO; careful design guidelines for a system that is dependable, fast, and ensures data security; and education about the system's operation in the form of field tests.
26

3.0 TRUCKING ACTIVITY IN TEXAS
3.1 INTRODUCTION
This chapter identifies the trucking activity in Texas in terms of: fleet characteristicsfleet size and truck configurations, and truck body types; the distribution of trucking activity-truck flows, range of operation, and vehicle-miles traveled; and commodity movements- intrastate and interstate. The information presented in this chapter is based on: (1) the most recent Truck Inventory and Use Survey (TIUS) by the Bureau of Census, published in 1994; (2) the "Analysis of the Truck Inventory and Use Survey from the Truck Size and Weight Perspective" by the U.S. DOT Federal Highway Administration; (3) TxDOT truck registration information; (4) the U.S. DOT Highway Cost Allocation Study (HCAS); (5) the most recent Commodity Flow Survey (CFS), published in 1996; and (6) a motor carrier survey of companies that operate in Texas.
The TIUS provides data about the physical and operational characteristics of the truck population in the United States. The survey is based on a sample of commercial and private trucks registered or licensed in each state during 1992. The sample size is about 150,000 trucks which represent a universe of approximately 60 million trucks (42). For purposes of this chapter, the definition of a truck excludes pickups, panels, vans, utilities, and station wagons, as identified in "Column D" and "Column E" ofthe state reports.
The CFS provides data about the movement of goods by mode of transportation in the United States. It is based on a sample of200,000 establishments which represent a universe of approximately 800,000 businesses (43). The survey covers establishments in mining, manufacturing and wholesale trade, and selected retail and service industries. Establishments classified as farms, forestry, fisheries, oil and gas extraction, governments, construction, transportation, households, foreign establishments, and most establishments in retail and services are not included in the survey coverage (43).
3.2 TRUCK FLEET CHARACTERISTICS
This section presents truck fleet information for trucks that are registered in Texas and operate within the state or outside the state. The sources of information are the Truck Inventory and Use Survey (TIUS) and the Texas DOT Vehicle Titles and Registration Division (VTR). The information is presented separately for each source.
27

3.2.1 Fleet Size and Truck Configurations
3.2.1.1 Truck Inventory and Use Survey
Table 3-1 details the nus makeup of the truck fleet registered in Texas, and compares it to the national fleet. According to TIUS, Texas has the third highest truck population in the United States after California and Illinois. The Texas truck fleet represents just over 5 percent of the national fleet (California represents 10 percent and Illinois represents 7 percent). Nearly 60 percent of Texas-registered trucks are single unit trucks, approximately one-third are tractorsemitrailer combinations, 7 percent are truck and trailer combinations, and less than one percent are tractor-double trailers. These figures compare to the nationwide figures of: (1) single unit trucks-just over two-thirds of the population; (2) tractor-semitrailer combinations-approximately one-quarter; (3) truck and trailer combinations-approximately 5 percent; and (4) tractor-double trailer combinations-approximately 1 percent (40).
Table 3-1. 1992 Total Truck Fleet in Texas
Truck Type Texas U.S.
Single Unit 125,896 2,776,004
Truck + Trailer 14,156 181,881
Tractor + Semitrailer 73,391 1,061,255
Tractor + Double Trailer 965 52,031
TOTAL 214,408 4,071,171 .. ..
Note: Excludes pIckups, illIllivans, utIlity sports, statIOn wagons, trucks or truck-tractors with 4 tires, and trucks pulling I-axle trailer or I-axle utility trailer. Source: Us. DOT Comprehensive TS& W Study Report No.2, 1996
Ofthe single unit trucks in Texas, more than eight of every 10 have two axles; just over 15 percent have three axles; and approximately 1 percent have four axles. Between 1987 and 1992 there was a 20 percent decrease in the number of single unit trucks. The number of twoaxle trucks decreased by 20 percent; three-axle trucks decreased by approximately one-quarter; and the number of four-axle single unit trucks showed a four-fold increase (40). The nationwide number of single unit trucks remained steady during that same period of time.
Approximately 60 percent of truck and trailer combinations in Texas involve a two-axle truck pulling a two-axle trailer. Almost 40 percent are five-axle combinations, with two or three axles on the truck, and three or two axles on the trailer. Almost 3 percent of truck and trailer combinations involve a three or four-axle truck pulling a three or two-axle trailer. The overall number of truck and trailer combinations decreased by 30 percent between 1987 and 1992 in Texas, while the nationwide total increased by 15 percent over the same period of time.
28

Tractor-semitrailers are the most common combination trucks registered in the state of Texas. They are comprised of either two-, three-, or four-axle power units coupled to semitrailers with one axle to three axles. Tractor-semitrailers with five or more axles account for 80 percent of the tractor-semitrailer fleet. These include two-axle tractors pulling three-axle trailers; and three- or four-axle tractors pulling two- or three-axle trailers. The most popular configuration of this group is the five-axle tractor-semitrailer (3-S2), which accounts for almost three-quarters ofthe total tractor-semitrailer fleet in Texas. Combinations involving four axles or less account for 20 percent of the tractor-semitrailer population in Texas. The most common configuration ofthis group is the four-axle tractor-semitrailer (2-S2), which accounts for almost 15 percent of the total semitrailer fleet in Texas. The number of tractor-semitrailer combinations in Texas increased by almost 5 percent between 1987 and 1992, while the nationwide total increased by 12 percent (41).
Tractor-double trailer combinations comprise a relatively small proportion ofthe Texas truck fleet. Three-quarters of Texas doubles consist of five axles and the remaining one-quarter are other types of combinations. The number of doubles in Texas increased by just over 20 percent between 1987 and 1992. The nationwide figure increased by 60 percent (41).
3.2.1.2 Vehicle Titles and Registration Division
The Vehicle Titles and Registration Division (VTR) keeps historical truck registration information that does not provide details on the breakdown of truck registrations by truck configuration or truck type. This study is concerned with three pieces of information from VTR from 1994 to 1997:
• Power units: These are subdivided into two categories: (l) combination power units, which are those used in intrastate operations; and (2) apportioned power units, which are those used in interstate operations.
• Single unit trucks: Since 1995, VTR has divided single unit trucks into trucks with gross vehicle weight ratings (GVWR) that are less than 10,000 pounds and trucks with GVWR greater than 10,000 pounds (This study is concerned with single unit trucks that are greater than 10,000 pounds.). Prior to 1995, there was only one category called "trucks" which included all types of trucks (pickups, utilities, and others).
• Token trailers: These are trailers that can be operated in combination with a truck-tractor or a tractor-semitrailer combination. Token trailers can not be used in a truck and trailer combination due to special registration conditions.
Table 3-2 illustrates truck registrations for the period between 1994 and 1997. The total number of single unit trucks registered in 1997 was 116,567. There were 59,518 combination power units registered in Texas in 1997 and 95,461 apportioned power units for the same year. In addition to truck-tractors, the apportioned power unit category also includes straight trucks
29

used for interstate operations and buses (the majority of the units in this category are trucktractors). Between 1994 and 1997, combination power units accounted for between one-third and 40 percent of all power unit registrations, and apportioned power units accounted for the remaining two-thirds to 60 percent. The number of combination power units and apportioned power units has remained approximately constant over the four-year period.
Table 3-2. Texas Truck Registrations Between 1994 and 1997
Year Trucks Token Combination Apportioned > 10,000 lb. Trailers Power Units Power Units*
1994 N/A 126,686 58,086 99,639
1995 111,361 118,605 59,227 109,328
1996 107,072 111,918 51,893 100,303
1997 116,567 120,555 59,518 95,461
TOTAL 335,000 477,764 228,724 404,731 Note: These statIstIcs are based on RegIstratiOn Class Code counts III Master FIle Report. * This includes truck-tractors, straight trucks, and buses-the majority are truck-tractors. Source: TxDOT Vehicle Titles and Registration Division
3.2.2 Trailer Body Types
Information regarding trailer body types is only available from the Truck Inventory and Use Survey. The body type category in TIUS refers to the type of body that is either permanently attached to the tractor (or truck in the case of truck and trailer combinations) or most frequently used with a truck tractor as a tractor-semitrailer combination (42).
Figure 3-1 illustrates the body type distribution of Texas trucks for 1987 and 1992. In 1992, five body types accounted for almost 80 percent of the fleet: (1) platforms accounted for almost one-third; (2) vans accounted for over one-quarter; (3) dump trucks accounted for almost 10 percent; (4) tank bodies-liquids or gases-accounted for 6 percent; and (5) grain bodies accounted for 5 percent. Almost 60 percent of all Texas registered trucks had either a van or a platform body type.
The number of vans and platforms decreased by almost 30 percent between 1987 and 1992, while the number of specialized commodity vehicles (dump, grain, tanks, pole or logging, livestock, and oilfield) decreased by 4 percent. It is important to observe that the van and platform decrease may be largely affected by the dominance of single unit trucks in the Texas fleet. As previously mentioned, the number of single unit trucks decreased by 20 percent between 1987 and 1992.
30

120000
100000
80000
60000
40000
20000
0 c: OJ ;> E
0- c: '" C E 'e "t:l ':; "t:l
<£ ::l '" ~"'" 0 " .S[ <!)
"'" :; 1;J ~
~ c: ~ c:: Of) OJ
"'" ... ""' § 0
""' Note: Excludes pickups, mini-vans, utility sports, and station wagons
Source: Texas nus Report, 1994
... Of) c: 0
<!) '6iJ "0 Of)
Q.. 0 ....l
Cl1987
.1992
"'" u .8 '" <!)
> ::i
"t:l '0
== <5
Figure 3-1. Texas Truck Fleet by Major Body Type
... <!)
6
Dump trucks remained steady at approximately 23,800 from 1987 to 1992. The number of oilfield trucks, as well as the number of trucks used in the logging industry, increased by almost 15 percent during the same period of time.
3.2.3 Truck Weights
3.2.3.1 Truck Inventory and Use Survey
Table 3-3 shows the average gross vehicle weight (empty weight plus cargo weight) of trucks that are registered in Texas. According to nus, more than two-thirds of truck movements in Texas occur at an average gross vehicle weight (GVW) of less than 40,000 pounds, which generally require no more than three axles. Just over 80 percent of the movements occur at average GVW levels less than 60,000 pounds, which generally require no more than four axles. Almost 100 percent of the movements take place at average GVW levels less than 80,000 pounds, which generally require no more than five axles. Less than 1 percent of truck movements occur at weight levels requiring more than five axles. This implies that most trucks operate most of the time at weight levels below the maximum gross vehicle weight limit available to them.
3.2.3.2 Vehicle Titles and Registration Division
Information is available regarding the registered average empty weight and the registered average gross weight of combination and apportioned power units from 1988 to 1994. Table 3-4 shows this information for the seven-year period. The registered average empty weight for both
31

combination and apportioned power units remained steady at approximately 15,500 pounds between 1988 and 1994. At a maximum allowable GVW of80,000 pounds in Texas, this could result in payloads of up to 50,000 pounds. However, the range would typically fall between 35,000 and 45,000 pounds, depending on the commodity being moved and the body type of the trailer.
Table 3-3. 1992 Average Gross Vehicle Weight (GVW) for TIUS Column D Trucks in Texas
Average GVW [pounds] Texas Fleet
40,000 or less 181,900
40,001 - 60,000 32,500
60,001 - 80,000 48,800
80,001 - 100,000 1,200
100,001 - 130,000 300
130,001 or more (Z)
Total Columns D Trucks 264,500 ..
Note: excludes pIckups, mInIVanS, utIlIty sports, and statIOn wagons (Z) Data withheld because estimate did not meet Bureau of Census publication standards Source: Texas TIUS Report, 1994
Table 3-4. Average Empty and Gross Weights of Combination and Apportioned Power Units Registered in Texas from 1988 to 1994
Registered Average Registered Average Year Empty Weight [lbs] Gross Weight [lbs]
Combination Apportioned Combination Apportioned
1988 14,863 N/A 59,163 N/A
1989 15,047 15,008 60,177 68,052
1990 15,147 15,184 60,842 65,878
1991 15,324 15,485 61,630 64,265
1992 N/A N/A N/A N/A
1993 15,616 15,683 63,380 60,427
1994 15,656 15,696 63,666 59,821 ...
Source: TxDOT Vehicle Titles and RegistratIOn DIVISIOn
32

The figures pertaining to the registered average GVW illustrate that, most of the time, these trucks operate at weight levels below the maximum gross vehicle weight limit. For the most part, interstate trucks register higher GVWs than trucks that operate intrastate. However, in 1993 and 1994, the registered average GVWs of combination power units were higher than the registered average GVWs of apportioned power units. The registered average gross weight for combination power units had a steady increase of approximately 1.4 percent per year between 1988 and 1994, whereas apportioned power units averaged gross weights that decreased approximately 3 percent per year during the same period of time.
3.3 DISTRIBUTION OF TRUCKING ACTIVITY
This section details the trucking activity in Texas, in terms of number of trucks, range of operation, and vehicle-miles of travel. In order to better understand the implications of trucking in a region, consideration should be given to the quantities of vehicles that move on a highway, the area of operation of those vehicles, and the amount of travel in terms of the number of vehicle-miles traveled. The information presented in this section was obtained from three sources: (1) the Texas DOT Transportation Planning and Programming Division; (2) the Truck Inventory and Use Survey (TIUS); and (3) the U.S. DOT Highway Cost Allocation Study.
3.3.1 Truck Flows
Figure 3-2 shows total truck flows on all National Highway System (NHS) highways in Texas. The figure is based on state data provided to the research team by TxDOT's Transportation Planning and Programming Division. The following observations are drawn from the map:
• Locations where TxDOT traffic classification count data indicate the (estimated) Average Annual Daily Truck Traffic (AADTT) is relatively high (1997) are as follows:
IH-35 between Dallas and Austin (south of Waco) -10,165 trucks per day; IH-45 between Dallas and Houston (south of SH 21) - 6,933 trucks per day; IH-10 between San Antonio and Houston (East ofSH 71) - 8,107 trucks per day; IH-lO east of Houston (east ofSH 146) - 9,900 trucks per day; IH-20 between El Paso and Dallas (east of US 84) - 5,612 trucks per day; IH-20 east of Dallas (west ofSH 19) -7,120 trucks per day; and IH-30 east of Dallas (west ofSH 19) - 6,253 trucks per day.
• Truck flows between Dallas and San Antonio on Interstate Highway 35 are similar to those on Interstate Highway 80 east of Des Moines, Iowa, and those on Interstate Highway 70 between Kansas City and St. Louis, Missouri.
• Many non-Interstate highways have low truck volumes, ranging from near zero to approximately 600 to 800 trucks per day.
33

AADTT -30000 15000 7500 o 80 160 240
UMTIO, ...
Figure 3-2. Commercial Vehicle Flows in Texas
34

• While most of the non-Interstate highways have low truck volumes, some of these highways have relatively high truck volumes. Some examples include the following:
U.S. 287 between Amarillo and Fort Worth; U.S. 281 and U.S. 77 between Interstate Highway 37 and the U.S.-Mexico border; U.S. 59 between Houston and Victoria.
3.3.2 Base and Range of Operation
The nus provides insights regarding the base and range of operation of trucks by state of registration. Table 3-5 shows the percentage of mileage driven outside of Texas by TIUS Column D trucks. Column D trucks exclude pickups, panels, vans, utilities, and station wagons. Table'3-6 shows the range of operation of nus Columns D trucks registered in the state of Texas.
Table 3-5. 1992 Base of Operation for TIUS Column D Trucks in Texas
Miles Driven Trucks Outside Texas [%]
Less than 25 204,600
25 to 49 7,200
50 to 74 7,400
75 to 100 6,600
No home base* 5,200
Not reported 33,500
Total Column D 264,500
* Home base refers to the location where the vehicle is usually parked when it is not on the road. Source: Texas TIUS Report, 1994
Table 3-6. 1992 Range of Operation for TIUS Column D Trucks in Texas
Typical Trip Length Trucks From Home Base [miles]
Local < 50 miles home 138,700
50 to 100 miles home 43,500
100 to 200 miles home 16,700
200 to 500 miles home 19,100
> 500 miles home 15,500
Offthe road * 24,500
Not reported 6,400
Total Column D 264,500 .. * Off the road refers to mInImal use ofpubhc roads,
which is usually associated with construction and farming activities. Source: Texas TIUS Report, 1994
The above tables indicate that the vast majority of Texas-based trucking is intrastate in nature, and the total trucking activity is mainly local. From Table 3-5, more than three-quarters of the trucks registered in the state drive less than 25 percent oftheir mileage outside of Texas. Only one of every 40 trucks drives from 75 to 100 percent of its mileage outside the state. From
35

Table 3-6, most trucking occurs within 200 miles of home. More than 80 percent of all truck trips are within this distance of home or off the road. Approximately one of 14 trucks operates in the 200- to 500-mile range, and approximately one of 17 trucks makes trips that are greater than 500 miles.
3.3.3 Vehicle-Miles Traveled (VMT) by the Fleet
Vehicle-miles oftravel provide an indication about the level of traffic activity in a region. The U.S. DOT Highway Cost Allocation Study (HCAS) estimated the number of vehicle-miles traveled by vehicle type, by state in the United States. This section deals only with truck vehicle-miles traveled as estimated by the HCAS.
In 1994, Texas was second only to California in truck VMT. Total truck VMT in Texas was 14,471 million vehicle-miles, which accounted for approximately 8.5 percent of the nation's total VMT. Figure 3-3 illustrates truck VMT for Texas in relation to the rest ofthe country by truck type. The Federal Highway Administration has estimated that by the year 2000, Texas will still account for 8.5 percent of the nation's truck VMT but with a total increasing to 16,880 million vehicle-miles, a 17 percent increase from 1994.
Single unit trucks account for approximately 40 percent of the total truck VMT in Texas. Two-axle trucks are responsible for most ofthose vehicle-miles, accounting for 38 percent ofthe total truck VMT in Texas. The nationwide total VMT by single unit trucks is 71,239 million vehicle-miles, and Texas accounts for 8.5 percent of that total or 6,072 million vehicle-miles. By the year 2000, the VMT by single unit trucks in Texas is estimated to be 7,083 million. This will represent 8.5 percent of the nation's total VMT by this truck type.
Truck and trailer combinations account for approximately 2 percent of the total truck VMT in Texas. Five-axle truck and trailer combinations report the highest number of vehiclemiles, accounting for almost two-thirds of the truck and trailer activity in the state. The nationwide total VMT for truck and trailer combinations is 3,119 million vehicle-miles, and Texas accounts for almost 9 percent of that total. By the year 2000, the VMT by truck and trailer combinations in Texas is estimated to be 319 million. This will represent 8.8 percent of the nation's total VMT by this truck type.
Texas reports the highest tractor-semitrailer VMT in the country with 7,898 vehiclemiles. Tractor-semitrailer vehicle-miles represent 55 percent ofthe total truck VMT in Texas. Table 3-7 shows the VMT distribution by configuration for tractor-semitrailers in Texas. Fiveaxle tractor-semitrailers (3-S2s and 3-S2 splits) account for almost 90 percent of the tractorsemitrailer miles; four-axle tractor-semitrailers account for 6 percent; six-axle tractor-semitrailers account for approximately 4 percent; and three- and seven-axle tractor-semitrailers account for almost 2 percent.
36

Table 3-7. 1994 Tractor-semitrailer VMT in Texas [millions]
2-S1 2-S2 3-S2 3-S2 split 3-S3 4-S3 Total
123 470 6,660 296 324 25 7,898
Note: 2-S 1 =3-axle tractor-semItraIler; 2-S2=4-axle tractor-semItraIler; 3-S2=5-axle tractor-semItraIler; 3-S2 split=5-axle tractor-semitrailer with a spread tandem; 3-S3=6-axle tractor-semitrailer; and 4-S3=7-axle tractorsemitrailer. Source: US. DOT Highway Cost Allocation Study, 1997
The nationwide total VMT by tractor-semitrailer combinations is 89,618 million vehiclemiles, and Texas accounts for almost 9 percent of that total. By the year 2000, the VMT by tractor-semitrailers in Texas is estimated to be 9,213 million. This will represent almost 9 percent of the nation's total VMT by this truck type.
As illustrated in Figure 3-3, Texas accounts for a relatively small component ofVMT by tractor-double trailer combinations nationwide. This truck type accounts for approximately 1 percent of the total truck VMT in Texas. It has been estimated that by the year 2000, tractordouble trailer combinations will account for almost 2 percent ofthe total truck VMT in the state.
3.4 COMMODITY MOVEMENTS
This section presents commodity movement information for the state of Texas. The principal source of information is the latest Commodity Flow Survey (CFS) by the Bureau of the Census, published in 1996. Because this is a strategic plan for commercial vehicle operations, the analysis of the CFS database concentrates on trucking rather than on other modes.
3.4.1 Commodity Movements by Mode
The mode of transportation used for tonnage originating in Texas is shown in Table 3-8. Trucking handles just over one-half of the originating tonnage; pipeline handles approximately 20 percent; rail handles 15 percent; intermodal operations handle approximately 5 percent; and other modes handle nearly 10 percent of the originating tonnage.
One-third of all ton-miles of movement originating in Texas occur by rail; almost 30 percent take place by truck; 15 percent occur intermodally, and nearly 20 percent of ton-miles of movement take place by other modes.
3.4.2 Distance Shipped by Truck
Local shipping distances (less than 50 mi) account for seven of 10 of all tons moved by truck (73 percent for the tonnage moved by private trucks, and 67 percent for the tonnage moved by for-hire trucks). In addition, short-haul shipping distances (less than 250 mi) account for nearly nine of 1 0 of all tons moved by truck (95 percent for the tonnage moved by private trucks, and approximately 85 percent for the tonnage moved by for-hire trucks) (41).
37
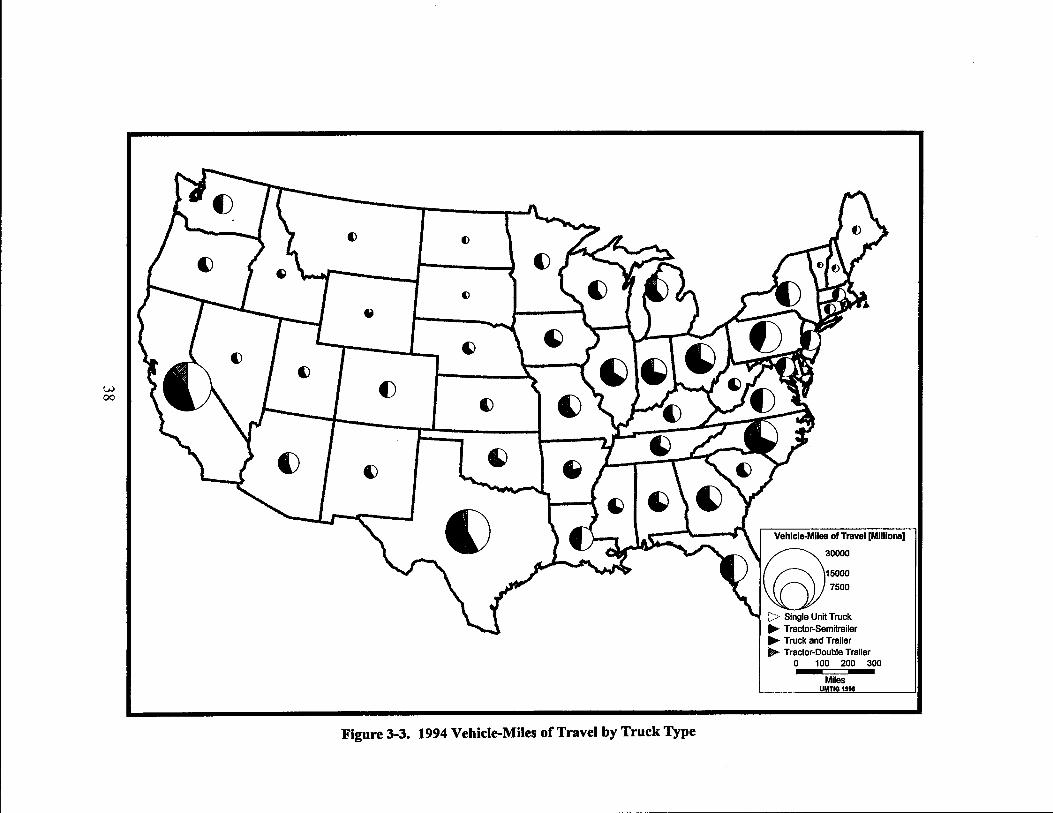
v..> 00
()
f)
Figure 3-3. 1994 Vehicle-Miles of Travel by Truck Type
Vehlcle-Mlles ofTravel [Millions]

Table 3-8. Tonnage by Mode Originating in Texas
Mode of Transportation Tons Ton-miles [thousands] [millions]
All modes 882,021 201,496
SINGLE MODES
Parcel, u.s. Postal Service, or courier 942 553
Private truck 234,023 17,708
For-hire truck 220,128 39,769
Air 3 5
Rail 130,663 67,150
Inland water 36,396 10,834
Great Lakes - -
Deep sea water - -Pipeline 168,049 (S)
MULTIPLE MODES
Private truck and for-hire truck 1,292 278
Truck and air (S) 191
Truck and rail 1,542 996
Truck and water 8,830 2,534
Truck and pipeline (S) (S)
Rail and water - -
Inland water and Great Lakes (S) (S)
Inland water and deep sea 26,515 26,066
OTHER MODES
Other and unknown modes 46,951 5,964 ..
(S) Data do not meet publIcatIOn standards due to hIgh samplmg VarIabIlIty or other reasons Source: CFS Texas Report, 1996
3.4.3 Tonnage Movements by Truck by Commodity
A total of 454 million tons originating in the state of Texas are moved by truck either intrastate or interstate. Private trucks move just over one-half ofthis tonnage (234 million tons),
39
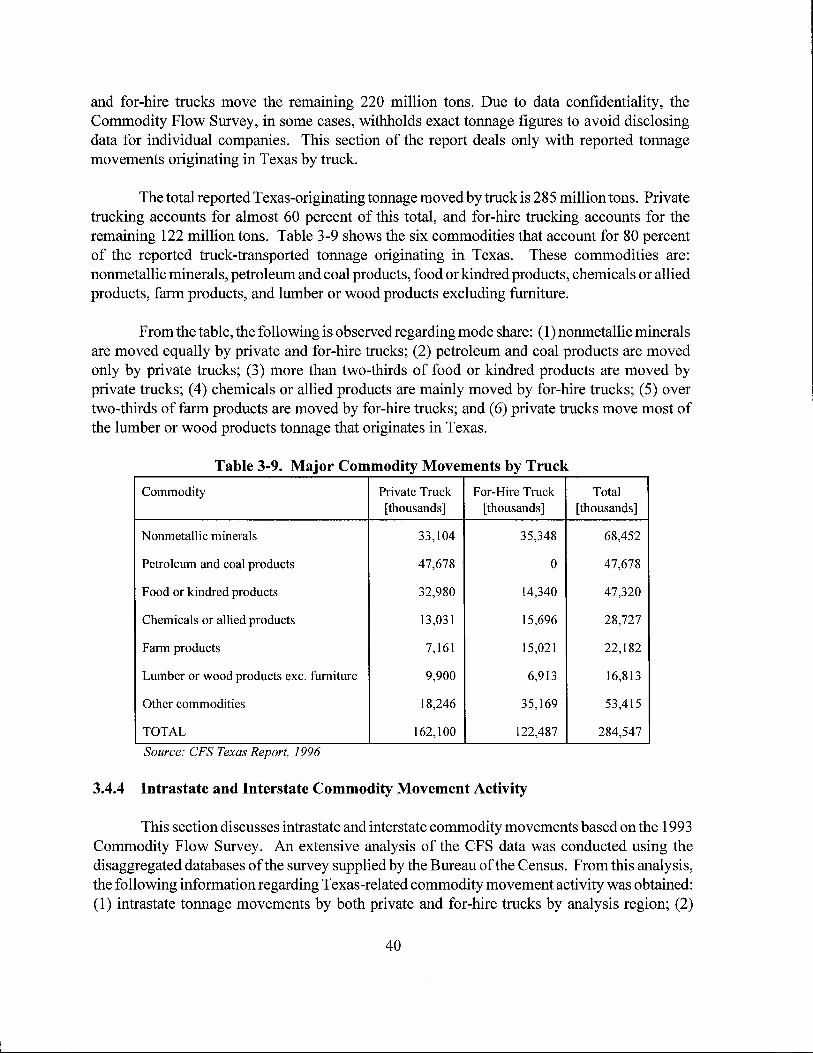
and for-hire trucks move the remaining 220 million tons. Due to data confidentiality, the Commodity Flow Survey, in some cases, withholds exact tonnage figures to avoid disclosing data for individual companies. This section of the report deals only with reported tonnage movements originating in Texas by truck.
The total reported Texas-originating tonnage moved by truck is 285 million tons. Private trucking accounts for almost 60 percent of this total, and for-hire trucking accounts for the remaining 122 million tons. Table 3-9 shows the six commodities that account for 80 percent of the reported truck-transported tonnage originating in Texas. These commodities are: nonmetallic minerals, petroleum and coal products, food or kindred products, chemicals or allied products, farm products, and lumber or wood products excluding furniture.
From the table, the following is observed regarding mode share: (1) nonmetallic minerals are moved equally by private and for-hire trucks; (2) petroleum and coal products are moved only by private trucks; (3) more than two-thirds of food or kindred products are moved by private trucks; (4) chemicals or allied products are mainly moved by for-hire trucks; (5) over two-thirds of farm products are moved by for-hire trucks; and (6) private trucks move most of the lumber or wood products tonnage that originates in Texas.
Table 3-9. Major Commodity Movements by Truck
Commodity Private Truck For-Hire Truck Total [thousands] [thousands] [thousands]
Nonmetallic minerals 33,104 35,348 68,452
Petroleum and coal products 47,678 0 47,678
Food or kindred products 32,980 14,340 47,320
Chemicals or allied products 13,031 15,696 28,727
Farm products 7,161 15,021 22,182
Lumber or wood products exc. furniture 9,900 6,913 16,813
Other commodities 18,246 35,169 53,415
TOTAL 162,100 122,487 284,547
Source: CFS Texas Report, 1996
3.4.4 Intrastate and Interstate Commodity Movement Activity
This section discusses intrastate and interstate commodity movements based on the 1993 Commodity Flow Survey. An extensive analysis of the CFS data was conducted using the disaggregated databases of the survey supplied by the Bureau ofthe Census. From this analysis, the following information regarding Texas-related commodity movement activity was obtained: (1) intrastate tonnage movements by both private and for-hire trucks by analysis region; (2)
40

intrastate commodity movements by both private and for-hire trucks, by analysis region; (3) interstate tonnage movements by origin-destination by both private and for-hire trucks for tonnage originating in Texas; and (4) interstate tonnage movements by origin-destination by both private and for-hire trucks for tonnage destined for Texas.
3.4.4.1 Methodology for the Analysis
The interstate and intrastate commodity movement analysis was conducted based on National Transportation Analysis Regions (NTARs). These regions have been defined by the Department of Transportation to collect and publish information on the interregional movement of products. U.S. DOT aggregated the 183 U.S. Business Economic Areas into 89 NTARs for data collection and data publishing purposes. An extensive discussion of the issues and methodology followed for defining NTARs can be obtained from the Bureau of Transportation Statistics (BTS).
Because NTARs are a function of population and economic activity, some regions extend beyond state boundaries. This may cause problems when conducting analyses at the NTAR level. In the case of Texas, there are six NTARs that are entirely located within Texas and one NTAR (NTAR 137) which extends beyond the state boundary to include some portions of Oklahoma. For analysis purposes, NT AR 137 was considered to be only part of Oklahoma since it is very likely that Oklahoma City together with Lawton, Oklahoma, generate and attract the vast majority of the tonnage to and from that NT AR. The seven NT ARs, including NT AR 137, are shown below. Figure 3-4 illustrates the NTARs used in the analysis.
• NTAR 122 Houston-Beaumont • NTAR 123 Austin-Waco-San Angelo • NTAR 125 Dallas-Fort Worth-Abilene • NTAR 129 San Antonio • NTAR 131 Brownsville-Corpus Christi • NTAR 133 EI Paso-Lubbock-Odessa • NTAR 137 Amarillo, TX-Oklahoma City-Lawton, OK
For the analysis of intrastate activity, origin-destination movements from NTAR to NTAR by commodity by mode (private versus for-hire truck) were determined. For the analysis of interstate activity, a special approach was taken. Because interstate movements account for only 10 percent of all the truck -transported tonnage that originates in Texas, and because origindestination tonnage movements by mode by commodity are only provided at the NTAR level, the analysis involved the following:
• For all the truck-transported tonnage originating in Texas, the destination states for that tonnage were determined from the Texas CFS state report. Similarly, for all the trucktransported tonnage destined for Texas, the origin states for that tonnage were also determined.
41

. I
NTAR 122--Houston-Beaumont NTAR 123--Austin-Waco-SanAngelo NTAR 125--Dallas-Fort Worth- Abilene NTAR 129--SanAntonio NTAR 131--Brownsville-Corpus Christi NTAR 133--El Paso-Lubbock- Odessa
~t_ "~.""'~."'::';;";-t_-L"'.~
:,,~~':J J ,
.. " ' .
...... , 129<""
A.: '\..,,--~
Figure 3-4. National Transportation Analysis Regions Used
• The annual tonnage values obtained were used to calculate the number of 25-ton trucks per day that move between Texas and the destination states, for tonnage originating in Texas; and between origin states and Texas, for tonnage destined for Texas, The 25-ton measure was selected because it represents a typical maximum semitrailer truck load, based on 80,000 pounds gross vehicle weight.
• After the number of 25-ton trucks per day for each destination and each origin was determined, it was possible to select the major destinations and major origins for the interstate movements. A major destination state was defined as a state which attracted at least 200 25-ton trucks per day of the truck-transported tonnage originating in Texas. A major origin state was defined as a state that generated at least 200 25-ton trucks per day oftonnage destined for Texas. The 200 25-ton trucks per day were chosen as the cutoff point to avoid small numbers problems when conducting the origin-destination analysis at the NT AR level.
42

• The NTARs corresponding to each of the major origin and destination states were then extracted from the database for the analysis. For tonnage originating in Texas, there were seven major destination states which involved 14 NTARs. This resulted in a 6 by 14 origin-destination matrix (6 originNTARs in Texas and 14 destinationNTARs). For tonnage destined for Texas, there were seven major origin states which involved 18 NT ARs. This resulted in an 18 by 6 origin-destination matrix (18 origins and 6 destinations in Texas).
The following sections discuss the results from the analysis of the 1993 Commodity Flow Survey data for both intrastate and interstate commodity movements by truck.
3.4.4.2 Intrastate Commodity Movements by Truck
Of all the tonnage that originates in Texas, almost 85 percent moves intrastate and approximately 15 percent moves interstate. More importantly, of all truck-transported tonnage that originates in Texas, 90 percent moves intrastate and 10 percent moves interstate. Table 3-10 shows the reported quantity of truck-transported freight movements by NT AR origin-destination pairs within Texas. The table shows the total quantity of freight movement by private truck and for-hire truck mode share within and between pairs ofNTARs.
Of all the reported tonnage that moves intrastate in Texas, two-thirds are attracted by NTARs 125 and 122 which are the Dallas-Fort Worth-Abilene region, and the HoustonBeaumont region. In addition, the same two regions generate just over two-thirds of the intrastate tonnage. The following observations are drawn from Table 3-10 and Figure 3-5 regarding freight movement activity for each origin region.
• For the tonnage that originates in the Houston-Beaumont region (NTAR 122), 85 percent stays within that region and moves within the region mainly by private truck. The major destinations for tonnage that leaves NTAR 122 are: (1) the Dallas-Fort Worth-Abilene region with approximately 7 percent of the originating tonnage-two-thirds of which moves by private truck and the remaining one-third moves by for-hire truck; and (2) the San Antonio region with 5 percent ofthe originating tonnage-two-thirds of which moves by for-hire truck, and the remaining one-third moves by private truck.
• For the tonnage that originates in the Austin-Waco-San Angelo region (NTAR 123), almost three-quarters stays within that region and the movement of this tonnage within the region is made equally by private and for-hire truck. The major destinations for tonnage that leaves NTAR 123 are: (1) the Houston-Beaumont region with almost 15 percent of the originating tonnage-two-thirds of which moves by private truck and the remaining one third moves by for-hire truck; and (2) the Dallas-Fort Worth-Abilene region with 12 percent of the originating tonnage-moved equally by private and for-hire truck.
43

Table 3-10. Total Freight Movement by Private and For-Hire Truck within Texas [in millions of tons-private truck mode share shown in parentheses]
Origin Destination NT AR NTAR
122 123 125 129 131 133
122 73.3 (66%)* 1.6 (64%) 5.6 (65%) 3.9 (34%) 0.6 (38%)* 0.7 (33%)
123 3.6 (67%) 20.3 (49%) 3.3 (51%) 0.5* (87%) 0.1 (50%) 0.3 (40%)
125 7.2 (46%) 4.7 (39%) 111.2 (66%) 2.0 (42%) 0.6 (39%) 1.4 (44%)
129 3.5 (50%) 1.9 (85%) 1.0 (67%) 23.2 (67%) 1.9 (54%) 0.2 (61%)
131 0.4 (54%) 0.1 (76%) 0.1 (36%) 0.4 (50%)* 14.0 (67%) <0.1 (most)
133 0.7 (43%) 0.5 (60%) 1.5 (49%) 0.4 (30%) 0.1 (32%) 22.8 (68%)
Total 88.7 29.1 122.7 29.9 17.3 25.4
NTAR 122-Houston-Beaumont; NTAR 123-Austm-Waco-SanAngelo; NTAR 125-Dallas-Fort Worth-AbIlene; NTAR 129-San Antonio; NTAR 131-Brownsville-Corpus Christi; NTAR 133-El Paso-Lubbock-Odessa * these figures were determined from the total sum of individual commodities for the particular 0-D pair-not from the "all commodities category-OO in CFS" Source: 1993 Commodity Flow Survey data analysis
• For the tonnage that originates in the Dallas-Fort Worth-Abilene region (NTAR 125), almost 90 percent stays within that region, and moves within the region mainly by private truck. The major destinations for tonnage that leaves NTAR 125 are: (1) the HoustonBeaumont region with 6 percent of the originating tonnage-54 percent of which moves by for-hire truck, and the remaining 46 percent moves by private truck; and (2) the AustinWaco-San Angelo region with nearly 4 percent of the originating tonnage-nearly 60 percent moves by for-hire truck, and 40 percent moves by private truck.
• For the tonnage that originates in the San Antonio region (NTAR 129), nearly threequarters stays within that region, and moves within the region mostly by private truck. The major destinations for tonnage that leaves NTAR 129 are: (1) the Houston-Beaumont region with 11 percent of the originating tonnage-moved equally by private and for-hire truck; and (2) the Austin-Waco-San Angelo region, and the Brownsville-Corpus Christi region with 6 percent of the originating tonnage each. Eighty-five percent of the tonnage moved to Austin-Waco-San Angelo travels by private truck and 15 percent by for-hire truck. Private truck accounts for only 54 percent for the tonnage that moves to Brownsville-Corpus Christi.
• F or the tonnage that originates in the Brownsville-Corpus Christi region (NTAR 131), more than 90 percent stays within that region, and moves within the region mainly by private truck. There is no major destination for tonnage that leaves NTAR 131. All movements are approximately equally distributed to the other analysis regions.
44

NTAR 122 NTAR 123 86% is intraregional 73% is intraregional
NTAR 125 88% is intraregional
NTAR 129 73% is intraregional
NTAR 131 NTAR 133 93% is intra regional 88% is intraregional
2500 1250 For-Hire
2500 1250 o 100 200 300
Figure 3-5. Origin-Destination Commodity Movements by Truck by NTAR of Origin
45

• F or the tonnage that originates in the El Paso-Lubbock-Odessa region (NT AR 133), almost 90 percent stays within that region, and moves within the region mainly by private truck. The maj or destination for tonnage that leaves NT AR 133 is the Dallas-Fort Worth-Abilene region with 6 percent of the originating tonnage-moved equally by private and for-hire truck.
For both private and for-hire truck, a few commodities account for most of the activity between major origin-destination pairs. Tables 3-11 and 3-12 show the commodities accounting for more than 80 percent of the total intraregional (same origin-destination NTAR) movement and 80 percent of the total inter-regional (NTAR to NT AR within Texas) movement by private truck and by for-hire truck, respectively. Intraregional movements by private truck total 16,990 25-ton trucks per day. Inter-regional movements total 1,750 25-ton trucks per day.
Petroleum and coal products together with nonmetallic minerals dominate the intraregional private trucking activity, accounting for one-half of all local private trucking within Texas. The inter-regional movements are dominated by food or kindred products which account for 41 percent of private trucking between regions in Texas. Major commodities that are moved both inter-regionally and intraregionally by private truck are food or kindred products; and clay, concrete, glass, or stone products.
Intraregional movements by for-hire truck total 6,190 25-ton trucks per day and interregional movements total 1,617 25-ton trucks per day. From Table 3-12, five commodities account for 80 percent of the intra-regional for-hire trucking activity in Texas. Nonmetallic minerals, being the commodity that dominates this activity, accounts for just over 40 percent of for-hire trucking at the local level. Inter-regional for-hire truck movements are dominated by clay, concrete, glass, or stone products. These commodities account for almost one-quarter of the inter-regional for-hire trucking activity in Texas.
In general, at a regional level, private trucking dominates commodity movements in Texas, accounting for almost 70 percent of the activity. Private trucks transport mainly petroleum and coal products; nonmetallic minerals; clay, concrete, glass, or stone products; chemicals or allied products; farm products; food or kindred products; and lumber or wood products, excluding furniture. For-hire trucking transports the same commodities with the exception of petroleum and coal products.
For both private and for-hire trucking, approximately 85 percent of the activity is local, and the remaining 15 percent involves trips to major attracting centers like Houston, Dallas-Fort Worth, and San Antonio.
46

Table 3-11. Major Commodities Moved by Private Truck within Texas (Number of 25-ton Trucks per Day)
Intraregional Movements (16,990) Inter-regional Movements (1,750)
Petroleum or coal products 4,840 (28%) Food or kindred products 713 (41%)
Nonmetallic minerals 3,635 (21%) Clay, concrete, glass, or stone products 313(18%)
Clay, concrete, glass, or stone 2,536 (15%) Chemicals or allied products 150 (9%) products
Food or kindred products 2,476 (15%) Lumber or wood products, excluding 98 (6%) furniture
Farm products 88 (5%)
Source: 1993 Commodity Flow Survey data analysIs
Table 3-12. Major Commodities Moved by For-Hire Truck within Texas (Number of25-ton Trucks per Day)
Intraregional Movements (6,190) Inter-regional Movements (1,617)
Nonmetallic minerals 2,690 (43%) Clay, concrete, glass, or stone products 388 (24%)
Clay, concrete, glass, or stone 808 (13%) Food or kindred products 267 (17%) products
Chemicals or allied products 769 (12%) Chemicals or allied products 212 (13%)
Farm products 504 (8%) Lumber or wood products, excluding 204 (13%) furniture
Lumber or wood products, 480 (8%) Primary metal products 125 (8%) excluding furniture
Nonmetallic minerals 97 (6%)
Source: 1993 Commodity Flow Survey data analysis
3.4.4.3 Interstate Commodity Movements by Truck
Interstate commodity movements are of two types: (1) those which originate in Texas and are destined for other states; and (2) those which originate in other states and are destined for Texas. This section discusses each ofthose types of movements individually.
3.4.5 Commodity Movements Originating in Texas
Approximately 15 percent of all the tonnage that originates in Texas moves interstate. Furthermore, of all the truck -transported tonnage that originates in Texas, only 10 percent leaves
47

the state. The major destinations for this truck-transported tonnage are: Louisiana, Arkansas, New Mexico, Oklahoma, California, and Kansas. Together, these states attract just over one-half of all the truck-related interstate tonnage originating in Texas. Figure 3-6 illustrates tonnage movements by major destination (major destinations are states that attract at least 200 25-ton trucks per day). The figure also illustrates the mode share (private versus for-hire truck) by originating NT AR.
Figure 3-6 shows that except for the state of Arkansas, the major destinations for trucktransported tonnage originating in Texas are 1-10 corridor states and 1-35 corridor states. The state that attracts most ofthe tonnage is Louisiana (12 percent of the Texas-originating interstate tonnage). This state attracts approximately 600 25-ton trucks per day. Arkansas attracts approximately 570 25-ton trucks per day, New Mexico attracts approximately 500 25-ton trucks per day, Oklahoma attracts 480 25-ton trucks per day, California attracts just over 300 25-ton trucks per day, and Kansas attracts 200 25-ton trucks per day.
The three major origins for the interstate tonnage are: (1) NTAR 125-Dallas-Fort WorthAbilene, accounting for just over 50 percent of the originating tonnage (71 percent by for-hire truck and 29 percent by private truck); (2) NT AR 122-Houston-Beaumont, accounting for nearly one-quarter of the originating tonnage (three-quarters by for-hire truck and one-quarter by private truck); and (3) NTAR 133-El Paso-Lubbock-Odessa, accounting for almost 20 percent ofthe originating tonnage (45 percent by for-hire truck and 55 percent by private truck). The origin NT AR with the lowest interstate tonnage movement is NT AR 131-Brownsville-Corpus Christi, accounting for almost 1 percent of the originating tonnage (mainly by private truck).
3.4.6 Commodity Movements Destined for Texas
Of all the truck -transported tonnage that is destined for places in Texas, only 10 percent originates in states other than Texas. The major origins for this tonnage are: Oklahoma, Louisiana, Arkansas, Tennessee, California, Kansas, and Mississippi. These states generate at least 200 25-ton trucks per day whose destination is the state of Texas. Together, these states generate three-quarters of all the truck-transported interstate tonnage destined for Texas. Figure 3-7 illustrates tonnage movements by major origin, as well as mode share (private versus for-hire truck) by NTAR of destination.
The figure illustrates that the maj or origins for truck-transported tonnage destined for Texas are states located north and east of Texas. The state that generates most of the tonnage is Oklahoma (one-quarter of all the Texas-bound interstate tonnage). This state generates approximately 1,260 25-ton trucks per day. Louisiana generates approximately 820 25-ton trucks per day, Arkansas generates 500 25-ton trucks per day, Tennessee generates 325 25-ton trucks per day, California generates almost 300 25-ton trucks per day, Kansas generates nearly 275 25-ton trucks per day, and Mississippi generates approximately 230 25-ton trucks per day. In general, the amount of interstate tonnage coming into Texas is approximately the same as the amount of interstate tonnage leaving Texas.
48
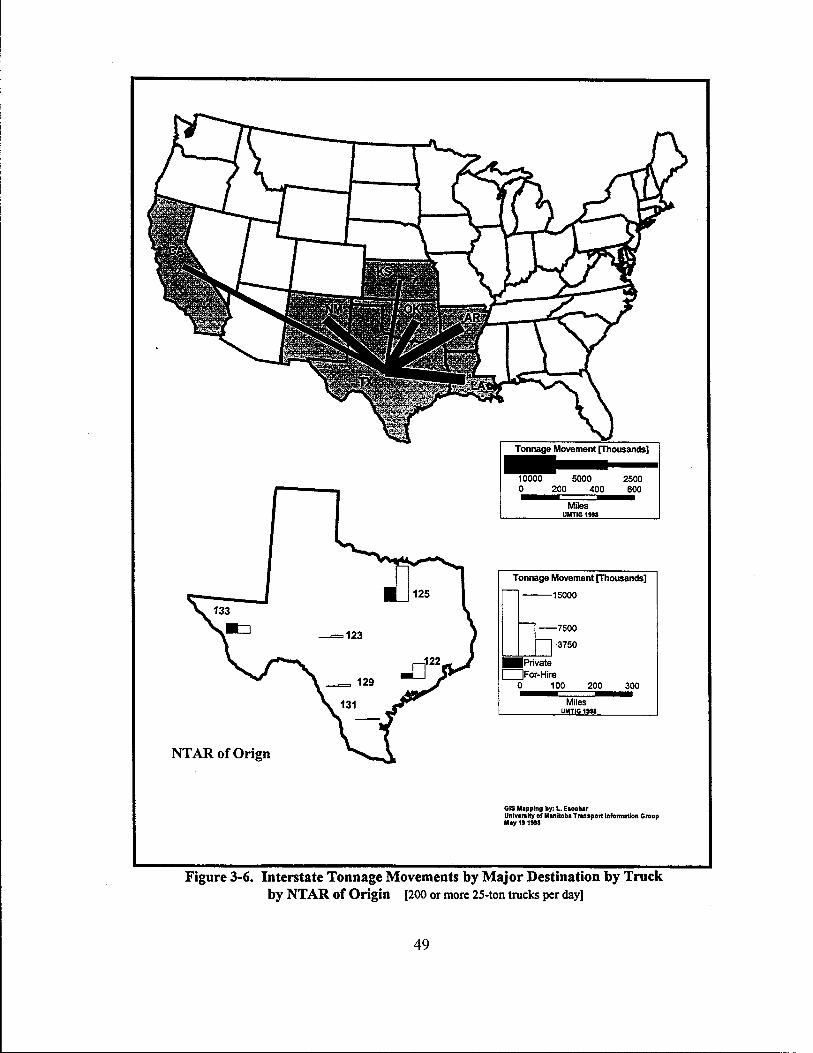
--=123
NTAR of Orign
5000 2500 o 200 400 600
Miles
Tonnage Movement [Thousands]
[]i':: ·3750
.Private C]For-Hire
o 100 200 300
Miles UMTIG1",
GIS Mapping by: L. EacoN' University of Manitoba Transport Information Group .ayltl",
Figure 3-6. Interstate Tonnage Movements by Major Destination by Truck by NTAR of Origin [200 or more 25-ton trucks per day]
49

~ 123
NT AR of Destination
Tonnage Movement [Thousands] -10000 5000 2500 0 200 400 600
Miles UMTIG Ina
Tonnage Movement [Thousands]
[Ji'--7500
·3750
.Private DFor-Hire
0 100 200
Miles UMTIG Ina
GIS Mapping by: L. _bar Univll'lity of Manitoba Transport Information Group Jun11t11
300
Figure 3-7. Interstate Tonnage Movements by Major Origin by Truck by NTAR of Destination [200 or more 25-ton trucks per day]
50

The three major NTAR destinations for Texas-bound interstate tonnage are: (1) NTAR 125-Dallas-Fort Worth-Abilene, accounting for almost 60 percent of the tonnage destined for Texas (60 percent by for-hire truck and 40 percent by private truck); (2) NTAR 122-HoustonBeaumont, accounting for one-quarter ofthe tonnage (80 percent by for-hire truck and 20 percent by private truck); and (3) NTAR 133-El Paso-Lubbock-Odessa, accounting for almost 10 percent of the Texas-bound tonnage (60 percent by for-hire truck and 40 percent by private truck). The destination NTAR with the lowest interstate tonnage movement is NTAR 131-Brownsville-Corpus Christi, accounting for 1 percent of the tonnage destined for Texas (mainly by for-hire truck).
3.5 TEXAS-RELATED CARRIER OPERATIONS
A carrier survey was conducted as part of this study to investigate: (1) motor carrier operations in Texas; (2) motor carrier perception of technology as applied to commercial vehicle operations; (3) the importance of advanced technology in Texas; (4) ways in which carrier operations could be improved by the Texas Department of Transportation, making use of intelligent transportation systems (ITS) or other methods available to the Department; and (5) motor carrier concerns regarding economic implications of using ITS for their operations in Texas. Other issues discussed included commodity movements, methods of operation, fleet characteristics, and other information regarding trucking in Texas. A list of the issues discussed during the interviews is included in the Appendix.
A total of 10 carriers were surveyed during the period between October 1997 and January 1998. Six of the carriers were Texas-based; one was based in Wisconsin; one in Arkansas; one in Kansas; and one was based in Manitoba, Canada. All of those carriers either operate to and from, within, or through Texas. Six of the carriers were for-hire carriers, and the other four were private carriers. Figure 3-8 shows the different types and sizes of operation considered for the conduct of the survey. This section discusses the findings from the interviews regarding each of the following issues: (1) fleet, equipment, and operations; (2) application of advanced technologies; (3) ITS-CVO in Texas; (4) technology and productivity; (5) privacy of data and information; and (6) transparent borders. The discussion is presented for both private carriers and for-hire carriers.
Figure 3-8. Types of Operations Considered in the Motor Carrier Survey
51

For purposes of this section, a private carrier is a carrier who transports its own goods and supplies as an incidental component of its business. A for-hire carrier is a carrier who transports freight for others (5). A medium size company is a company that operates with between 300 and 1,000 tractors and 500 to 5,000 trailers. A large size company is a company that operates with more than 1,000 tractors and more than 5,000 trailers.
3.5.1 Fleet, Equipment, and Operations
In terms of fleet size, the 10 carriers operate a combined fleet of approximately 35,800 tractors and 92,900 trailers, for an average trailer-to-tractor ratio of approximately 2.6. The private companies surveyed account for only 1 percent of the tractors and 1 percent of the trailers. Of the for-hire companies surveyed, truck load (TL) carriers account for 53 percent of the tractors and approximately two-thirds of the trailers. Approximately 85 percent of the combined fleet trailers are vans. Flatbeds account for just over 6 percent, and liquid tankers account for approximately 1 percent. Other body types, including hopper bottom, dry bulk, low boy, and drop deck trailers, account for 7 percent of the trailer fleet. Just over 40 percent of the trailers are 53 feet in length, approximately one-quarter are 48 feet, nearly one-third are 28 feet, and the remaining 6 percent are other lengths. The use of 5 7 -foot trailers by these carriers is very limited. There are no more than 300 57-foot trailers in the fleet ofthe 10 carriers combined. For the Canadian company, all new semitrailers acquired in the past year are 53 feet in length. This trend toward the use of 53-foot trailers is particularly true for most of the truck load carriers. Most of the tractors, particularly for the for-hire carriers, are equipped with electronic engines and on-board diagnostics.
Of the total combined fleet, approximately 15 percent of the tractors and the trailers operate either to, from, within, or through the state of Texas. This results in approximately 5,400 tractors and 13,200 trailers, for an average trailer-to-tractor ratio of2.4. In the case of private carriers, almost 95 percent of the operation is done on ajust-in-time delivery basis. Medium size for-hire carriers, irrespective of being TL or LTL, operate mainly on a next day or second day or more delivery basis. Large for-hire TL and L TL carriers conduct approximately 40 to 50 percent of their operations on a just-in-time delivery basis, depending on shipper requirements. The average return trip for private carriers ranges between 150 and 1,200 miles, whereas the average return trip for for-hire carriers ranges between approximately 500 and 1,000 miles, with some trips that are over 1,000 miles.
Eight of the 10 companies conduct operations in Texas at an average GVW of 80,000 pounds. One of the companies operates under permit at 84,000 pounds, and the other company-with a private small local operation-operates at an average GVW less than 80,000 pounds. The average payloads for private companies are between 30,000 pounds and 51,000 pounds. The average payloads for for-hire companies are between 43,000 pounds and 55,000 pounds. In some cases, the high payloads are achieved due to the quality of the equipment used by the company (aluminum equipment that results in a total tare weight of approximately 24,000 pounds). In other cases, high payloads are achieved through the purchase of a permit that allows
52

trucks to operate on Texas state highways at 84,000 GVW. The main commodities hauled by the 10 surveyed carriers are liquid products-mainly milk and tequila, produce, chemical products, general dry products, and mixed freight (in the case of L TL carriers).
3.5.2 Application of Advanced Technologies
The majority of carriers surveyed, private and for-hire, are aware that advanced technologies are available for commercial vehicle operations. This is particularly true for large for-hire carriers, who know about the latest advances in technology, specifically applied to fleet management. However, even though carriers are, for the most part, well informed about advanced technologies and areas of potential application, there is little interest in applying these technologies for purposes other than for fleet management.
Eight of the 10 carriers are currently using advanced technologies for either fleet management or enhanced communication with drivers. Of the private carriers: one uses a satellite system for equipment tracking, load monitoring, and enhanced communication; another uses cellular telephones; and the s,malllocal operation carrier uses pagers for communication with drivers. Of the for-hire carriers: four make use of satellite systems (three ofthese also make use of on-board computers), and one makes use of cellular telephones.
Other types of technology currently being used by these carriers include electronic toll tags for operations on turnpikes, computer software packages for scheduling and routing, and barcoding systems for electronic clearance at the U.S.-Canada border. In addition, two ofthe large TL carriers are currently considering the possibility of acquiring electronic logging capabilities.
Two of the carriers (one medium size TL carrier and one medium size private carrier) do not use any advanced technologies for their operations. The reasons for this are: (1) there is a high implementation cost; (2) the type of operation-the companies operate on fixed-route schedules; (3) changes in technology take place very fast, and it is difficult and expensive to keep up to date; and (4) it is difficult for the companies to prove that this type of technology will increase productivity.
3.5.3 ITS-CVO in Texas
Several ITS applications to commercial vehicle operations in Texas were discussed during the interviews. Motor carriers provided their views regarding the importance and need for the use of technology in Texas for purposes of: (1) electronic clearance and enforcement; (2) fleet management; and (3) administrative procedures, specifically, one-stop shopping.
3.5.3.1 Electronic Clearance and Enforcement
Six ofthe 10 companies (three private and three for-hire) consider that there is not much potential for the application of ITS for electronic clearance or other enforcement purposes in
53

Texas. The main reason for this is that company trucks that operate in the state spend little time being weighed or inspected. Two of the carriers are of the opinion that enforcement practices in Texas are not as strict as those in the surrounding states. Therefore, they cannot justify the purchase of technology for this purpose. Other reasons provided by the motor carriers are: (l) there are no permanent weigh scales in the state; (2) the range of operation of some trucks is relatively short, therefore, "the investment in transponders is not worth it"; (3) there is a perceived high capital cost associated with advanced technologies; (4) some companies operate on fixed-route schedules; (5) there is an invasion of driver and company privacy; and (6) the company runs a small operation.
Two of the companies (one medium size private and one large for-hire) think that there could be a potential for the application of advanced technologies. These companies would be willing to invest in technology, mainly because their operations are time-sensitive. With this investment, there would be an increase in productivity. The last two companies did not express a position regarding the application ofITS for electronic clearance purposes in Texas.
The president of the largest trucking company surveyed thinks that Texas should consider what other states are doing regarding electronic clearance. He believes it would be difficult to justify doing something for intrastate operations only, so the state should also consider interstate operations. He also thinks that use of transponders for electronic clearance should be accompanied by recommended standards.
This company president also highly recommended international electronic clearance along the Mexico border because of its success along the Canadian border. He thinks that by applying technology at the Mexico border, the u.s. will help improve the border clearance problem and will also improve the standard of living of the Mexican people.
Regarding enforcement, this company president thinks that Texas should spend its resources on vehicles not in compliance rather than on known safe carriers. He thinks that it is better for enforcement personnel to check a few vehicles rather than every vehicle, and it is not beneficial to catch the occasional error of carriers mostly in compliance. In addition, for improving enforcement and safety, Texas should make simple choices and avoid spending money on unnecessary actions. In his opinion, the goal of the Texas DOT should be to provide people with a higher standard of living.
3.5.3.2 Fleet Management
All carriers support the idea of applying ITS for fleet management purposes. These carriers are of the opinion that by being at the cutting edge of technology, the companies increase their productivity through better trailer utilization, more efficient loading of trailers, fuel savings, less personnel needed for dispatching, better compliance with the size and weight regulations, and driver time savings. This results in better transportation rates. According to one of the large for-
54

hire carriers, almost 100 percent of the company's operations deliver on time due to the use of technology for fleet management purposes.
The president of the largest trucking company surveyed believes that technology is a tool for productivity increases, and his company is committed to the use of technology. Because any technological changes or other types of changes result in changes in productivity, he thinks that research should be done about the issue of how much productivity will be affected by the application ofITS to commercial vehicle operations. "Researchers should really do research in an intellectually honest way"-looking at facts objectively. In his opinion, some researchers conduct research with a preset idea in mind, which leads to a bias as to what the findings will be.
Regarding the costs and benefits of technological advances, he pointed out that because the trucking industry is made up of hundreds of carriers of all sizes (carriers with five trucks, carriers with thousands oftrucks, etc.), the challenge of keeping different databases up-to-date is very costly.
3.5.3.3 Administrative Procedures-One-Stop Shopping
Six of the 10 motor carriers (four for-hire and two private) are supportive of the idea of having a one-stop shop for administrative purposes in Texas. In their opinion, the data and other information required for registration, permitting, purchase of credentials, and other transactions, should be electronically connected to one system that can be accessed by all agencies involved. Carriers that operate only locally are indifferent about the idea of the one-stop shop. Two of the carriers think that having a one-stop shop for administrative purposes in Texas serves little benefit to the company because the majority of the fleet is not registered in Texas.
3.5.4 Privacy of Data and Information
The privacy of data and information collected by advanced technologies is a very sensitive issue. The five carriers expressing concern think that all data should be kept confidential between the carrier and the state regulatory agency. One of the carriers is of the opinion that with ITS, state agencies should have access to no more information than they currently have. The company is opposed to: (1) having a third-party control the information collected; (2) using ITS for tax administration purposes; and (3) using ITS for automatic logging.
The president of the largest trucking company surveyed noted that inadequate attention to privacy issues will destroy the willingness of motor carriers to use the technology. The government should ensure privacy, especially for logistics effectiveness and for increasing productivity. Also, companies that use transponders will be at a disadvantage because enforcement agencies will know more about them. He suggested that ideally, the government should set a standard to encourage everybody to use transponders. This would help achieve a level playing field.
55

3.5.5 General Comments
The following are general comments expressed by the different trucking companies regarding the issues of enforcement in Texas, technology in general, and transparent borders:
• One of the medium size for-hire carriers would like to see more uniformity in the application of the regulations such as during Commercial Vehicle Safety Alliance (CVSA) inspections in the state. According to this company, there are differences in the way enforcement officers from the Department of Public Safety (DPS) apply or interpret regulations.
• One of the medium size private carriers thinks that there should be mutual agreement and constant communication between TxDOT, DPS, and local enforcement agencies. Several cities have enforcement officers that enforce traffic laws and also enforce truck size and weight and safety regulations. The problem is that most ofthese local officers do not fully understand the regulations and how to apply them. Therefore, if a plan is going to be implemented at the state level, local inspectors should be removed from the task of enforcing truck size and weight and safety regulations. They should only be responsible for enforcing general traffic laws.
• The largest trucking company surveyed thinks that full adoption of advanced technologies for other than fleet management purposes will not be successful unless a large group of carriers adopts these technologies. If there is a nationwide change regarding the use of advanced technologies for enforcement purposes, the company would support it. However, if only a few states decide to use these technologies, the company's participation would be questionable.
• Regarding the issue of what needs to be done to achieve seamless borders, many carriers indicated that Texas needs to do things in cooperation with other states as a region and not on its own. Furthermore, it will be beneficial for Texas to support increasing the level of compliance at a national level because increasing compliance nationwide will result in an increase in Texas.
56

4.0 TRUCK REGULATION AND ENFORCEMENT PRACTICES IN TEXAS
4.1 INTRODUCTION
This chapter provides an overview of the Texas road network, the truck size and weight (TS& W) regulations and safety regulations that govern regular operations, and current enforcement practices in the state.
TS& W regulations affect what trucks look like and how they are operated. They define the dimensional envelope into which trucks must fit and the maximum weight they are to observe. They also significantly influence the volumes of trucking activity, vehicle loading, and in tum, safety performance. Some factors that, jointly with TS&W regulations, affect truck characteristics include: (1) special permitting policies and practices; (2) freight and logistical considerations (commodity, shipment size, packaging, origin-destination patterns, delivery time requirements); (3) infrastructure considerations (terminals, route options between origindestination pairs); (4) enforcement of regulations; and (5) intermodal requirements.
4.2 TEXAS ROAD NETWORK
Texas has an extensive road network consisting of Interstate System (IS) highways, National Network (NN) highways, National Highway System (NHS) highways, and other state roads. National Network highways are a specially designated set of highways on which the TS& W provisions of the Surface Transportation Assistance Act (ST AA) of 1982 apply (102-inch maximum vehicle width, 48-foot minimum semitrailer length, and 28-foot minimum trailer length in double trailer combinations). This system includes all IS highways and designated federal-aid primary highways (41). National Highway System highways are a specially designated set of highways approved by Congress in 1995. This set of highways includes all IS highways and some NN highways (47). As distinct from NN highways, not all NHS highways are truck routes.
There are currently 3,233 miles of IS highways in Texas (2,197 miles are rural IS highways). There are also 12,107 miles of U.S. highways (10,126 miles are rural), 16,208 miles of state highways (12,480 miles are rural), and 4,511 miles of IS frontage roads, which are considered separate roadways (2,890 miles are rural) (48). In addition, there are 40,822 miles of Farm-to-Market roads (37,921 miles are rural) and 139,046 miles of county roads (48). This results in a total mileage of204,660 miles of highway on which the Department of Public Safety (DPS) enforces TS&W and safety regulations in Texas.
57

4.3 TRUCK SIZE AND WEIGHT REGULATIONS
Table 4-1 presents selected aspects of the TS& W provisions governing trucking operations on highways in the state of Texas. The provisions shown in Table 4-1 are based on the Texas Transportation Code of regulations. These provisions represent the regulatory limits within which trucks can operate legally either by registering the vehicle, or by obtaining necessary readily available oversize/overweight permits.
Table 4-1. TS&W Regulations in Texas
Item Interstate National System Networ
k
Width 8.5 8.5
Height 14 14
Max Length (ft)
Single Unit Truck 45 45
Semitrailer 59 59
Trailer NR NR
Double Trailers 2 x 28.5 2 x 28.5
Truck and Trailer 65 65
Tractor-semitrailer NR NR
Tractor-double NR NR Trailer
Source: Texas Transportation Code, 1996 NR = Not Regulated
Other Item Interstate System
8.5 Tire Wt. (lbs/in)
14 Steering 650
Other 650
45
59 Axle Wt. (lbs)
NR Steering 20,000
2x28.5 Single 20,000
65 Tandem 34,000
NR Tridemr, BFB
NR
GVW (lbs) 80,000
Bridge Formula yes B
/\ The maximum weight on a tridem group is governed by Bridge Formula B (BFB)
National Other Network
650 650
650 650
20,000 20,000
20,000 20,000
34,000 34,000
BFB BFB
84,000* 84,000*
modified modified
* A 5 percent GVW tolerance policy annual permit is readily available for any vehicle which is otherwise registered for 80,000 pounds GVW and is capable of operating at the higher GVW authorized by the permit. Within the specially permitted GVW limit of 84,000 pounds, a 10 percent tolerance on individual axle weights (i.e., 34,000 pounds on a tandem * 1.10 = 37,400 pounds) is also allowed. This tolerance permit creates a modified Bridge Fonnula B (BFB).
The total width of a vehicle operating in Texas is limited to 8.5 feet, and the height is restricted to 14 feet. Texas limits the length of a semitrailer to 59 feet on all highways. The state does not regulate kingpin settings as is done in other states such as California and Minnesota.
58

There are no restrictions for the overall length of a tractor-semitrailer combination. In the case of a tractor-double trailer combination, there are no restrictions regarding the overall length, but the trailers used in the combination are limited to 28.5 feet each. There are no Intermodal Surface Transportation Efficiency Act (ISTEA) freeze provisions applicable to Texas. This is because longer combination vehicles (LCVs) are not allowed to operate in the state.
Texas applies Bridge Formula B to operations on Interstate (IS) highways and requires compliance with the formula from both the inner and outer bridge perspectives, which means that a truck must be legal on all consecutive axle groups. The formula is capped at a GVW of 80,000 pounds on those highways. However, the state provides an "Annual Overweight Tolerance Permit" (1547 permit, previously called 2060 permit) which allows operation at a 5 percent tolerance on GVW and a 10 percent tolerance on axle weights on state and county roads (49). The permit allows a truck to operate at a GVW of up to 84,000 pounds, and at single and tandem axle loads of22,000 pounds and 37,400 pounds, respectively. This permit is readily available for any vehicle which is otherwise registered for a GVW of 80,000 pounds and is capable of operating at the higher GVW authorized by the permit. The state amended the law in the 74th Legislative Session to increase fees for this type of permit. The new fee per power unit is a base fee of $75 plus a fee that depends on the number of counties listed on the permit application: (1) for one to 20 counties, the fee is $125; (2) for 21 to 40 counties, it is $345; (3) for 41 to 60 counties, the fee is $565; (4) for 61 to 80 counties, the fee is $785; (5) for 81 to 100 counties, the fee is $1,005; and (6) for 101 to 254 counties, the fee is $2,000 (49). This tolerance permit overrides the provisions of Bridge Formula B, creating a modified version of Bridge Formula B for operations on non-IS highways. Principal users of this permit are gravel haulers, grain haulers, oilfield haulers, and cattle haulers.
4.4 SAFETY REGULATIONS
The Motor Carrier Safety Act of 1984 required the Secretary of Transportation to establish a procedure to determine the safety fitness of all motor carriers operating in interstate or foreign commerce (50). In Texas, the Department of Public Safety administers and enforces the Federal Motor Carrier Safety Regulations (FMCSR), Title 49, Code of Federal Regulations (CFR), Parts 382, 385, 386, 390-393, and 395-397, and the Federal Hazardous Materials Regulation, Title 49, CFR, Chapter 1, Subpart G of Part 107, and Parts 171-173, 177, 178, and 180. DPS also administers and enforces the requirements of Part 383 (Commercial Drivers License Standards) under the provisions of Chapter 522 of the Texas Transportation Code as enacted by the Texas Legislature. All motor carriers operating in interstate or foreign commerce in Texas must comply with those regulations. Table 4-2 presents selected aspects ofthe FMCSR for the state (50, 51).
The Department of Public Safety enforces the provisions of the Federal Motor Carrier Safety and Hazardous Materials Regulations through on-the-roadside driver/vehicle inspections. These inspections consist of a uniform inspection process developed by the Commercial Vehicle Safety Alliance (CVSA) which is an association of federal, state, and industry representatives,
59

Table 4-2. Texas Motor Carrier Safety Regulations
Part Name of Regulation No.
382 Controlled Substances and Alcohol Use and Testing
383 Commercial Driver's License Standards: Requirements and Penalties
385 Safety Fitness Procedures
391 Qualifications of Drivers
392 Driving of Commercial Vehicles
393 Parts and Accessories Necessary for Safe Operation
395 Hours of Service of Drivers
396 Inspection, Repair, and Maintenance
Special Notes
All drivers required to have a commercial driver's license (CDL) are subject to this regulation when operating in the U.S. Companies are required to randomly test 25 percent of the average number of drivers per year for alcohol, and 50 percent for controlled substances. This is to be done during or immediately after a driver has performed a safety sensitive function.
Drivers must have a CDL in order to operate a commercial motor vehicle. Drivers must pass a knowledge and skills test administered by the state.
A motor carrier receives a safety rating when a safety specialist conducts an on-site review of the carrier's compliance with the federal safety regulations.
Motor carriers must ensure that all drivers of commercial motor vehicles meet the minimum qualifications specified in this part of the regulations. In addition, all drivers of commercial vehicles must pass the DOT physical every two years.
All motor carriers and employees must comply with the requirements specified in this part regarding the following: (1) fatigue or illness; (2) drugs and alcohol; (3) equipment inspection; (4) load securement; (5) railroad crossings; (6) hazardous conditions; (7) seat belts; (8) stopped vehicles; (9) use of lighted lamps and reflectors; (10) license revocation; (11) fueling precautions; and (12) prohibited practices.
All carriers must operate safely by complying with the requirements and specifications pertaining to: (1) lighting devices; (2) brakes; (3) windshield conditions; (4) fuel systems; (5) coupling devices and towing methods; (6) miscellaneous parts and accessories; (7) emergency equipment; (8) cargo securement; and (9) frames, cab and body components, wheels, steering, and suspension systems. These are also the mechanical items which are used as the out-of-service criteria during a Commercial Vehicle Safety Alliance (CVSA) inspection.
A motor carrier cannot allow or require any driver to drive: (1) more than 10 hours following 8 consecutive hours off duty; (2) after being on duty 15 hours; (3) after being on duty more than 60 hours in any 7 consecutive days; or (4) after being on duty more than 70 hours in any 8 consecutive days. For intrastate operations, a driver cannot drive: (1) more than 12 hours following 8 consecutive hours off duty; (2) after being on duty 15 hours; or (3) after being on duty more than 70 hours in any 7 consecutive days.
Every carrier must systematically inspect, repair, and maintain all commercial motor vehicles under its control. This includes a periodic inspection at least every 12 months, a pre-trip inspection, and a post-trip inspection report.
Source: Federal Motor Carner Safety RegulatIOns Handbook, August 1997
60

and includes the following levels: (1) Level I is a complete inspection of the vehicle and driver to include inspecting the items underneath the vehicle; (2) Level II is a complete inspection of the vehicle and driver that does not include inspecting the items underneath the vehicle; (3) Level III is the inspection ofthe driver only; (4) Level IV is an inspection of specific item( s) on the vehicle or driver; and (5) Level V is an inspection of the vehicle at the motor carrier's terminal (52).
The Department of Public Safety's License and Weight troopers conduct CVSA inspections daily during their routine patrol duties or at permanent scale facilities. The Department requires two troopers to conduct Level I inspections because of safety reasons. Drivers and vehicles found to be in violation of the regulations in such a manner as to pose a serious safety condition to the general public are placed out-of-service using the North American Uniform out-of-service (OOS) Criteria developed by CVSA. The driver or the vehicle is prevented from operating further on the highways of Texas until the OOS condition is rectified.
4.5 ENFORCEMENT PRACTICES IN TEXAS
This section describes aspects of the current enforcement practices in Texas concerning: personnel allocation for enforcement; designated weighing areas in the state; enforcement of truck size and weight (TS& W) and safety regulations; and municipal enforcement.
4.5.1 Personnel Allocation
The Department of Public Safety (DPS) is responsible for the enforcement of weight, dimension, and safety regulations of motor carriers in Texas. The state is divided into six regions for enforcement purposes as shown by Figure 4-1. These regions are: Region I-Garland; Region II-Houston; Region III-Corpus Christi; Region IV-Midland; Region V -Lubbock; and Region VI-Waco. Table 4-3 shows the allocation of personnel by region during FY 1998 (52). Troopers either patrol the highways or they perform Compliance Reviews (CR). Compliance Reviews involve troopers visiting a carrier's headquarters to check driver and vehicle maintenance records and possibly conduct Level V inspections (vehicle only). Of the total CRs performed, a number of them result in enforcement cases where violations are found, and citations are issued to the carrier.
The region with the largest number of troopers is Corpus Christi. This region accounts for one-quarter of the personnel allocated to the enforcement of TS& Wand safety regulations on Texas highways. At the present time, only the troopers in this region are equipped with laptop computers as an aid for enforcement. The computers are used to check information on truck drivers or vehicles, however, these computers do not provide the capability of obtaining information regarding out -of-service records for carriers. The computers use a software package called State Information Database System (SIDS), which captures all the information considered important by both D PS and the Federal Highway Administration regarding commercial vehicles.
61

I I;
~""". ~ '~.
Figure 4-1. Texas Department of Public Safety Regional Boundaries Source: Texas DPS
This software is also capable of automatically generating citations for vehicles that are not operating in compliance with the regulations.
Troopers in the Midland region will soon acquire the same type of equipment, followed by troopers in the Waco region who will obtain this equipment by approximately February 1999 (53). It is not known when troopers in the other regions will be acquiring laptop computers for assistance in enforcement.
From Table 4-3, there is a total of 321 troopers to patrol and enforce the TS&W and safety regulations on the 204,660 miles of rural highways in Texas. This means that on average, there is one trooper for every 635 miles of rural road in the state. Furthermore, there is one trooper for every 45 million vehicle-miles traveled by truck in the state (14,471 million vehiclemiles by truck in 1994 and 321 troopers). Comparatively, in California and New Mexico, there
62

Table 4-3. DPS Personnel Allocation
Region Highway Enforcement Compliance Reviews
CR Enforcement Troopers Supervisors Troopers Performed Cases
I Garland 37 6 12 117 77
II Houston 39 6 12 186 115
III Corpus Christi 72 10 7 45 24
IV Midland 51 8 6 88 60
V Lubbock 33 5 5 80 55
VI Waco 41 6 6 97 71
Totals 273 41 48 613 402 ...
Source: Texas DPS L,cense and WeIght DlVlSlOn
is one trooper for every 21 and 12 million vehicle-miles traveled by truck, respectively (815 officers in California and 154 officers in New Mexico) (54, 55). These figures are based on the 1994 truck VMT estimate for Texas, California, and New Mexico (56). Similar to Texas and New Mexico, the total number of officers for California includes the 231 officers responsible for terminal inspections (Compliance Reviews). These rate calculations imply that troopers in Texas are responsible for more than twice as many vehicle-miles traveled by truck as troopers in California and almost four times as many truck vehicle-miles as troopers in New Mexico.
These observations show that there is limited personnel for enforcement of TS& W and safety regulations in Texas. For example, in Region VI, District C, which includes Burleson, Brazos, Madison, Robertson, Leon, Houston, Freestone, Navarro, Ellis, Henderson, Anderson, and Cherokee counties, there are only three troopers responsible for enforcement in four of those counties. One of those troopers is mainly responsible for compliance reviews. The low ratio of enforcement personnel to highway miles or to truck vehicle-miles traveled is one of the primary reasons the Department of Public Safety chooses to operate on a roving basis. This mode of operation is intended to utilize scarce resources to minimize non-compliance.
4.5.2 Designated Weighing Areas in Texas
The enforcement ofTS&W and safety regulations in Texas is done through a roadside vehicle inspection and enforcement program which consists of random checks of commercial vehicles. The vehicles are selected by officers while on patrol or through concentrated
63

inspection activities. These activities are conducted at specially constructed motor vehicle checkpoints (or designated weighing areas) throughout the state (57). There are 245 designated weighing areas in Texas. This includes 40 permanent (inground) scale sites which are also suitable for Level I inspections, 98 other locations suitable for Level I inspections, and 107 additional weigh strips. Table 4-4 illustrates the designated weighing areas in Texas by region.
From Table 4-4, the Corpus Christi region has the highest number of designated weighing areas in the state, followed by the Waco region, the Houston region, the Midland region, the Garland region, and the Lubbock region. In terms of the number of sites suitable for Level I inspections, the region with the majority of these sites is Corpus Christi (Region III), followed by Region IV, Region V, Region I, Region II, and Region VI.
Table 4-4. Designated Weighing Areas in Texas by Region
Region Permanent Other Locations for (inground) Scales* Level I Inspections
I Garland 7 14
II Houston 5 14
III Corpus Christi 15 16
IV Midland 6 21
V Lubbock 3 19
VI Waco 4 14
TOTAL 40 98 * All pennanent scales are also sUItable for Level I mspectIOns Source: Texas DPS License and Weight Division, March 1998
Other Weigh Strips
17
23
19
13
4
31
107
4.5.3 Enforcement of Truck Size, Weight, and Safety Regulations
Total Sites
38
42
50
40
26
49
245
As mentioned, DPS enforces TS& Wand safety regulations mainly through the roving patrol method of enforcement. A few designated weighing areas are being used an average of 40 hours per week whereas many others are open less time. These weighing areas are operated on a random basis to reduce scale avoidance by truck drivers who warn one another when a weigh station is open using citizens band (CB) radios. In some cases, DPS also conducts task force operations at selected sites for periods of approximately 48 or 72 hours.
Regarding enforcement of safety regulations, CVSA Level I inspections are usually conducted at designated weighing areas when there is more than one officer at the site. These inspections are also conducted during roving operations when troopers are traveling together. The DPS conducts approximately 85,000 inspections (all levels combined) each year statewide. This is equivalent to approximately 235 inspections per day.
64

Regarding enforcement ofTS&W regulations, enforcement practice in Texas includes allowing a 5 percent tolerance when weighing loaded vehicles. In cases where the gross vehicle weight of a truck exceeds the maximum allowable vehicle weight for that particular combination plus the 5 percent tolerance, the operator of the vehicle is required to unload a part of the load to comply with the regulations. If the axle loads are not in compliance with the regulations, the operator is required to rearrange the vehicle's cargo, if possible, or unload part of the load to bring the vehicle's axle weights within the maximum allowable axle load for that vehicle (58). These unloading requirements do not apply to: (1) motor vehicles loaded with timber, pulp wood, or agricultural products in their natural state being transported from the place of production to the place of sale or first processing; and (2) motor vehicles loaded with livestock with a destination within the state (58). Some examples of this enforcement practice are as follows:
• If an enforcement officer weighs a five-axle tractor-semitrailer unit operating on the Interstate System at a GVW of 84,000 pounds (80,000 pounds + 5 percent tolerance), a citation is issued but the driver is not required to unload part of the load. A citation for 4,000 pounds overweight costs approximately $100 to $150.
• A five-axle tractor-semitrailer unit operating on a state highway with an "Annual Overweight Tolerance Permit" is allowed a maximum GVW of88,200 pounds (80,000 pounds + 5 percent overweight permit + 5 percent tolerance) before the driver is required to unload part of the overweight load. In this case, the driver also receives a citation in the amount corresponding to the 4,200 pounds of overweight but is not required to unload the additional weight. Note that this weight is higher than the maximum allowed by Bridge Formula B on a six-axle tractor semitrailer combination (3-S3).
According to some enforcement officers, the introduction of the Annual Overweight Tolerance Permit contributed to a reduction of overweight trucking in Texas. In 1997 there were approximately 12,000 ofthese permits issued for operations in the state (59).
For enforcement oftruck movements that take place under special permit other than the Annual Overweight Tolerance Permit, DPS troopers have to communicate with dispatch or with TxDOT's Motor Carrier Division to inquire about the permit for a particular truck. This information is not yet available electronically in the field. Even the troopers that are equipped with laptop computers have to go through this process to verify permits.
4.5.4 Municipal Enforcement
The Department of Public Safety provides training to municipal police officers for them to enforce TS& Wand safety regulations. Police officers are eligible to be trained by DPS provided that they belong to any of the following: a municipality with a population of 100,000 or more; a municipality with a population of25,000 or more which is located in a county with
65

a population of2.4 million or more; and municipalities which are located in counties bordering Mexico. Currently, police officers from 18 cities have received training from DPS (52).
To be eligible for certification, police officers trained to enforce the regulations must meet the following standards: successfully complete the North American Standard Roadside Inspection course; participate in an on-the-job training program following each course with a certified officer and perform a minimum of 30 Level I inspections; and successfully complete an annual certification examination. Officers that intend to enforce hazardous materials regulations, in addition to the above items, must also successfully complete a basic hazardous materials coUrse (52).
A public or private entity desiring to train police officers in the enforcement of the Federal Motor Carrier Safety regulations may also do so following approval from DPS based on the proposed course material, schedule, examination, cost, and instructors and their qualifications.
66

5.0 ADMINISTRATIVE PROCEDURES IN TEXAS
This chapter provides an overview of current practices by government agencies and by motor carriers regarding administrative procedures in Texas. More specifically, the chapter discusses: (1) vehicle registration; (2) motor carrier registration; (3) International Fuel Tax Agreement (IFTA); and (4) oversize/overweight (OS/OW) permitting.
5.1 VEHICLE REGISTRATION
All motor vehicle registration and titling activities in Texas are the responsibility ofthe Texas Department of Transportation Vehicle Titles and Registration Division (TxDOTNTR). The central office is located in Austin, and there are 17 regional offices around the state. The central office is mainly responsible for administering the laws for registration and titles. The regional offices support the state's 254 county tax assessor-collectors, who serve as statutory agents of the department. The tax assessor-collectors issue motor vehicle registrations, process title applications, and collect and report applicable fees (60).
Most counties are now connected to a centralized system called Registration and Title System (RTS). This is a point-of-sale system linking county tax offices to the Department's mainframe. With RTS, the Department can: (1) update registration records within 48 hours; (2) provide current information to law enforcement officers about vehicle registration; and (3) provide information to contract users of motor vehicle data (60). The following sections describe the processes for intrastate and interstate vehicle registration in Texas.
5.1.1 Intrastate Vehicle Registration
Motor carriers that are involved in intrastate operations are required to register their vehicles at the local County tax assessor-collector's office. The registration fee for all commercial vehicles is based on a flat fee plus an amount determined on the registered gross weight and the vehicle type. Different vehicles include: (l) straight trucks; (2) trailers or semitrailers; (3) truck-tractors or commercial vehicle combinations; and (4) token trailers. As an example, the registration fee for a truck-tractor not registered in combination is $25 plus an amount determined based on the registered gross vehicle weight and tire equipment (these rates are shown in the Texas Transportation Code, Chapter 502). If the registered gross vehicle weight is 60,000 pounds, and the vehicle is equipped with pneumatic tires, the registration fee is $25 + 0.99*60,0001100 = $619 plus additional fees (diesel fees, local fees, and reflectorization fees). If the vehicle is not equipped with pneumatic tires, the registration fee is $817. However, if this truck-tractor is registered as a vehicle to be used in combination with a semitrailer that has a gross weight of more than 6,000 pounds, the registration fee is $40 + 0.90*60,000/100 = $580 plus additional fees (61).
67

New applicants are required to provide vehicle title information, proof of liability insurance, proof of payment of the Federal Heavy Vehicle Use Tax (FHVUT) if the vehicle's GVW 55,000 pounds or more, and vehicle information including size and weight. Renewal notices are sent out to motor carriers who are currently registered in Texas under regular registration (8). When the necessary paperwork is completed for a new registration, the motor carrier pays the corresponding fees and the county tax assessor-collector issues new tags and a registration receipt to the motor carrier. This process can also be conducted through certified mail in the event that the motor carrier can not appear in person to pay the fees and pick up the tags and registration (8).
5.1.2 Interstate Vehicle Registration
Motor carriers that are involved in interstate operations either to, from, or through Texas, may either: register their vehicles under the International Registration Plan (IRP); register in a base jurisdiction that has regular interstate reciprocity with Texas; or purchase temporary vehicle registration (60).
The IRP is a program for licensing commercial vehicles involved in interstate operations among member jurisdictions. Under this plan, an interstate carrier whose jurisdiction is a member of IRP files an application for apportioned registration with its base state or province. On the application, the carrier indicates the number of vehicles in the fleet used for interstate operations, and the number of miles traveled by each vehicle in each state. In the case of new operations, round trip estimates are used by the base state or province. The base jurisdiction collects the license registration fee and distributes it to the other jurisdictions based on the percentage of miles traveled in each jurisdiction (62). Currently there are 49 states plus the Canadian provinces of Alberta, British Columbia, and Saskatchewan that are member jurisdictions of the IRP. Texas was one of the first states that joined the IRP on September 13, 1973, together with Kentucky, Tennessee, Missouri, Minnesota, Oregon, Nebraska, Utah, and Colorado. The last addition to this plan was the District of Columbia, in November 1996 (60).
Texas grants full reciprocity for interstate operations to motor carriers based under regular registration in Manitoba, Ontario, and Quebec. Motor carriers based in the 49 states and the three Canadian provinces that are members ofIRP are required to be apportionally registered with Texas prior to entering the state to receive full reciprocity (63).
In the case of interstate motor carriers that are traveling through Texas and are not IRP members in their base state or province, a 72- or 144-hour trip permit is required prior to entering the state. These permits may be purchased at a Texas county tax assessor-collector' s office, from the Texas DOT Motor Carrier Division (MCD), from VTR regional offices, or through an independent permit company (8,63). The 72-hour permit costs $25, and the 144-hour permit costs $50.
68

5.2 MOTOR CARRIER REGISTRATION
Transportation Code, Chapter 643, provides that a motor carrier may not operate a commercial motor vehicle or a tow truck, or transport household goods on a for-hire basis, without first registering their operations with the Texas Department of Transportation, Motor Carrier Division. A commercial motor vehicle includes: (l) any motor vehicle or combination of vehicles with a gross weight, registered weight, or gross weight rating in excess of 26,000 pounds, which is designed or used for the transportation of cargo in furtherance of any commercial enterprise; (2) all tow trucks (a tow truck is a motor vehicle including a wrecker equipped with a mechanical device used to tow, winch, or otherwise move another vehicle) regardless of the gross weight rating of the tow truck; (3) any vehicle, including buses, designed to transport more than 15 passengers, including the driver; (4) any vehicle used in the transportation of hazardous materials in a quantity requiring placarding under the regulations issued under the federal Hazardous Materials Transportation Act (Title 49, United States Code, App. §§1801-1813); and (5) a commercial motor vehicle, as defined by 49 C.F.R. §390.5, that is owned or controlled by a person or entity that is domiciled in or a citizen of a country other than the United States.
For motor carrier registration purposes, a "commercial motor vehicle" DOES NOT include: (1) a farm vehicle, as defined by 43 TAC, Section 18.2, with a gross weight, registered weight, and gross weight rating of less than 48,000 pounds; (2) cotton vehicles registered in accordance with Transportation Code, §502.277; (3) a vehicle registered with the Texas Railroad Commission pursuant to Texas Natural Resources Code, § 113.131 and § 116.072; (4) a vehicle transporting liquor under a private carrier permit issued in accordance with the Texas Alcoholic Beverage Code, Chapter 42; (5) a motor vehicle used to transport passengers operated by an entity whose primary function is not the transportation of passengers, such as a vehicle operated by a hotel, day-care center, public or private school, nursing home, governmental entity, or similar organization; and (6) a motor vehicle operating exclusively in interstate or international commerce and registered under the Single State Registration System.
The Motor Carrier Division's offices are located in Austin, and all motor carrier registration is accomplished through these offices. The following sections describe the processes for intrastate and interstate motor carrier registration in Texas.
5.2.1 Intrastate Motor Carrier Registration
Motor carriers operating the vehicles described above on an exclusively intrastate basis, or operating interstate and not registered under the single state registration program, are required to register their operations and file proof of financial responsibility with TxDOT. Carriers (other than household goods carriers) may register for a seven-day period, annually, or biennially. Annual registration fees for carriers and tow truck operators are: $100 one-time filing fee; $100 vehicle liability insurance filing fee (a one-time fee unless insurance is canceled); and $10 per vehicle annually. Fees for household goods carriers are as shown in Table 5-1.
69

Table 5-1. Fees for Household Goods Carriers Type A (carriers operating Type B (carriers at least one vehicle over exclusively operating 26,000 pounds) vehicles 26,000 pounds or
less)
Application Fee $100 $100
Vehicle Fee $10/vehicle per yr. N/A Insurance $100 for auto liability $100 for proof of financial Filing insurance filing responsibility for cargo loss Fee or damage filing
$100 for cargo insurance filing
With the exception of insurance filing fees, all fees are paid by the carrier upon application. Insurance filing fees may be paid by the carrier or the insurance company. Applications take approximately two weeks to process. Applications may be submitted by mail or facsimile, and operating credentials are returned by mail.
All carriers are required to maintain commercial automobile liability insurance. Carriers (including Type A household goods carriers) whose primary business is transportation for compensation or hire, and who operate between two or more incorporated cities, towns, or villages, are required to maintain workers compensation or accidental insurance coverage (proof of this coverage is not filed with TxDOT). Both types of household goods carriers are required to maintain cargo insurance. The department also has specific consumer protection rules for household goods carriers.
Annual or biennial renewal notices (depending upon the type of registration selected) are sent to motor carriers (including Type A household goods carriers). Carrier registration for Type B household goods remains in effect until canceled and does not receive renewal notices.
5.2.2 Interstate Motor Carrier Registration
The state of Texas, through the Texas Department of Transportation, participates in the single state registration system established by Section 4005 of Title IV of the Intermodal Surface Transportation Efficiency Act of 1991 (49 U.S.C. Section 11506) and Texas Transportation Code, Chapter 645. A for-hire carrier exempt from economic regulation by the Federal Highway Administration (FHW A) under the FHW A Act shall register in accordance with Transportation Code, Chapter 643, and 43 Texas Administrative Code, Section 18.13.
70

Any interstate for-hire motor carrier authorized to transport passengers or property that has its principal place of business in Texas, or selects Texas as its registration state under 49 C.F.R. Section 367.3, shall file with the department an application to register for all states of travel before beginning operations in Texas. An interstate for-hire motor carrier authorized by the FHW A to transport passengers or property that must register in a state other than Texas must fully comply with 49 U.S.C. Section 14504 before operating in Texas. If an applicant's principal place of business is located in a jurisdiction that is not a participating state, the applicant shall apply for registration in the state in which the applicant will operate the largest number of motor vehicles during the next registration year. If the interstate carrier will operate the same largest number of vehicles in more than one state, the applicant or registrant shall choose which participating state will be its registration state.
All applications must be accompanied by the appropriate fees, which are determined by reciprocity agreements with other states. Fees can be calculated using the information listed on the back of the single state registration application. The application must also be accompanied by the following: (1) a copy of the applicant's full interstate authority; (2) a copy of Form BOC-3, designating an applicant's legal agent(s) for service of process for each state of travel; (3) a statement as to whether the applicant will be transporting hazardous commodities in interstate or foreign commerce; and (4) proof of insurance, in the levels and forms specified by 49 C.F.R. Section 387, showing the applicant's business address.
5.3 INTERNATIONAL FUEL TAX AGREEMENT
The Texas Comptroller of Public Accounts is responsible for International Fuel Tax Agreement (IFTA) permits. 1FT A is a reciprocity agreement that allows motor carriers licensed in one member jurisdiction to satisfy their fuel tax obligations to all other members through that jurisdiction (8). Any carrier based in a member jurisdiction, operating qualified motor vehicles in two or more member jurisdictions, is required to license under 1FT A. In lieu of motor fuel tax licensing under the 1FT A agreement, persons may elect to satisfy motor fuel use tax obligations by obtaining a trip permit in each jurisdiction in which they wish to travel (65).
The 1FT A comprises the following types of vehicles or combinations used for interstate operations: (1) two-axle trucks with a GVW or registered GVW of over 26,000 pounds; (2) three- or more-axle trucks regardless of weight; and (3) combination vehicles with GVW s greater than 26,000 pounds.
Effective September 1997, there were 58 IFTA member jurisdictions including 48 states and 10 Canadian provinces. Each licensed member is required to maintain a complete record of all fuel purchased, received, and used during operations. This includes the date of each receipt of fuel, the address of the place from which fuel was purchased or received, the amount and type of fuel, the vehicle or -equipment into which the fuel was placed, and the number of miles
71

traveled in each jurisdiction (65, 67). Audits under IFTA are conducted by the motor carrier's base jurisdiction on behalf of the other members (8).
A motor carrier based in Texas and operating in other IFTA member jurisdictions may file an IFTA license application in Texas. A carrier previously licensed in another IFTA member jurisdiction must be in good standing with that jurisdiction in order to receive Texas credentials (66). Under IFTA, a motor carrier is required to file quarterly fuel tax reports with the base jurisdiction. These reports must be submitted by the last day of the month immediately following the close of the quarter for which the report is being filed as follows: (1) for the quarter from January to March, the report is due on April 30; (2) for the quarter from April to June, the report is due on July 31; (3) for the quarter from July to September, the report is due on October 31; and (4) for the quarter from October to December, the report is due on January 31 (66). When filing a report, the motor carrier pays a lump sum of fuel tax to the base jurisdiction, based on total miles reported and total fuel purchased.
5.4 OVERSIZE/OVERWEIGHT PERMITTING
Oversize/Overweight (OS/OW) permits and temporary trip permits are issued by the TxDOT Motor Carrier Division for movements of indivisible loads. These permits must be obtained prior to moving those loads in the state. OS/OW permits issued in the state of Texas include: (1) permits for loads exceeding 80,000 pounds gross vehicle weight (GVW), 20,000 pounds per single axle, 34,000 pounds per tandem axle, or 650 pounds per inch oftire width; and (2) permits issued for combination vehicles exceeding 65 feet in length, 8.5 feet in width, or 14 feet in height.
An applicant may request an OS/OW permit either over the telephone, by facsimile, or through an Internet application. When a permit is requested by telephone, the caller may have a proposed route in mind which would be granted by the MCD ifthere are no restrictions (height, width, weight, bridge, or other) along that route. The MCD does not currently utilize an automated routing package. The routing method is manual, using a District Permit Map. In the case of requests that are made by fax or through the Internet, approved permits are sent by fax to the applicant. Permits can be purchased with cash, cashier's check, VISA, Master Card, or debit account (59).
When filing for an OS/OW permit via telephone, the applicant must complete Part 1 of the "SelfIssue" form (Form 1700) and call the Motor Carrier Division at 1-800-299-1700. A permit officer enters the required information into a computer in the same order as it is listed in Form 1700. The route is discussed with the applicant and verified using the District Permit Map. Once the route is verified, it is entered into the computer and the applicant fills out the remainder of the form. The computer generates the permit and the permit officer provides the applicant with the permit number, time of issuance, and permit officer's name. The information required by the permit officer at the time when the permit is requested is the following: customer account number; method of payment; current truck and trailer information (year, make, model, VIN
72
number, license number, and state); complete load description; loaded dimensions including width, height, overall length, GVW, and overhang; routing; and permit movement date (68).
Permit fees vary by permit type and duration of permit. Motor carriers hauling oversize loads are charged a base fee of$30 per trip. The permit fee for portable buildings is $7.50 and for mobile homes is $20.00 (69). Thirty-day permits for hauling heavy equipment have a base fee of$60. A base fee of$90 is charged for similar permits that are valid for up to 60 days, and $120 for permits valid for 90 days. In addition, a highway maintenance fee is charged on every load with a GVW that exceeds 80,000 pounds. A new type of permit is the "Annual Envelope" vehicle permit for weights of up to 120,000 pounds and dimensions 12 feet wide, 14 feet high, and 110 feet long. The fee for this permit is $2,000 (70). All permits, with the exception of portable building and mobile home permits, require a surety bond in the amount of$10,000 or the carrier must have an active Motor Carrier Registration (70). For weights that exceed 200,000 pounds, the applicant must also pay a vehicle supervision fee for an amount set by TxDOT. This amount is used to cover costs related to: (1) bridge structural analysis; (2) the monitoring of the trip process; and (3) moving traffic control devices (69).
The Department allows mobile cranes and some oilfield equipment to operate based on mileage and wheel and axle load rules by using hubometers. For the first quarter of their operation, the owner estimates the number of miles expected to operate. At the end of the payment period, there is an adjustment and an estimate of the next quarter. The MCD does not have the authority to audit a company to investigate the accuracy of the quarterly reports (59).
The state also provides an "Annual Overweight Tolerance Permit" which allows operation at a 5 percent tolerance on GVW and a 10 percent tolerance on axle weights on state roads and selected county roads. The permit allows a truck to operate at a GVW of up to 84,000 pounds, and at single and tandem axle loads of22,000 pounds and 37,400 pounds, respectively. Motor carriers applying for this permit are charged a base fee of $75 per power unit and an administrative fee assessed by the Department plus a fee that depends on the number of counties listed on the permit application (49). Table 5-2 illustrates the number ofOS/OW permits issued by the state between fiscal year 1995 and 1997. The table also shows the number of annual overweight tolerance permits, which are also part of the OS/OW permits (70).
There were 483,284 OS/OW permits issued in fiscal year 1997. Two percent of those were tolerance permits and it is estimated that about 95 percent were single trip permits. There was a decrease in the number of tolerance permits from fiscal year 1995 to 1996, mainly attributed to the new fee structure introduced by the 74th Legislature.
73

Table 5-2. Oversize/Overweight Permits for 1995 to 1997
Fiscal Year Oversize/Overweight Annual Overweight Permits Tolerance Permits
1995 420,516 13,597
1996 456,701 12,242
1997 483,284 11,944 Note: The OS/OW penmts mclude the annual overweIght tolerance permIts Source: TxDOT Motor Carrier Division
74

6.0 ADVANCES IN INFORMATION AND TRANSPORTATION TECHNOLOGY
This chapter presents a description of current advances in information and transportation technology. The chapter is based on a comprehensive literature search concerning the National ITS-CVO program and national CVO initiatives involving advances in information and transportation technology.
6.1 THE NATIONAL ITS-eVO PROGRAM
As mentioned in Chapter 2, Intelligent Transportation Systems (ITS) are "the use of modem communications, computer, and control technologies and systems to improve mobility and transportation productivity, enhance safety, maximize utility of transportation facilities, save energy, and protect the environment" (1).
The National ITS-CVO program is part of the National ITS program which was included in the Intermodal Surface Transportation Efficiency Act (ISTEA) of 1991. The National ITSCVO program is an amalgamation of various initiatives representing the efforts of individual states, groups of states, the federal government, the trucking industry, and other associations (4). The main goals and objectives of the ITS-CVO program are to: enhance safety; enhance productivity through the use of better fleet management tools; reduce costs for the motor carrier industry, reduce environmental and energy impacts; improve tax administration and credentials; and improve regulatory compliance (2, 6, 7).
The National ITS-CVO program is organized to develop and deploy capabilities in six user service areas: electronic clearance (domestic and international); roadside safety inspections; on-board safety monitoring; administrative processes; fleet and freight administration; and hazardous materials incident response (4, 8).
Electronic clearance is the most important CVO user service priority. It allows commercial vehicles to travel with minimum or no stopping through ports of entry or weigh stations. Automated roadside safety inspections provide automated information to inspectors to assist them with the inspection process. On-board safety monitoring provides the capability for sensing the safety status of the vehicle, driver, or cargo while traveling at mainline speeds. Administrative processes consist of: (1) electronic purchase of credentials, which allows carriers to automatically apply for permits or for registration; and (2) automated mileage and fuel reporting and auditing, which allows carriers to automatically record total trip miles and fuel purchases for purposes of mileage and fuel tax reports. Fleet and freight administration provides drivers and dispatchers with real-time information about the location and routing of a vehicle. Hazardous materials incident response provides a description of any hazardous materials involved in incidents and defines appropriate countermeasures (4, 8).
75

Each user service area is discussed in the following sections. For purposes of this chapter, three of those user services (automated roadside safety inspections, on-board safety monitoring, and hazardous materials incident response), were grouped under the category called safety and enforcement.
6.2 ELECTRONIC CLEARANCE
Electronic clearance services facilitate domestic and international border clearance and minimize stops and delays at weigh stations and ports of entry. By using these services, trucks are able to have their safety status, credentials, and weights checked at mainline speeds (4). The following are some examples ofITS-CVO projects in the area of electronic clearance that are either in the testing process or that have already been completed in various states in the U.S.
6.2.1 Advantage 1-75 Operational Test
Advantage 1-75 is a public and private partnership which extends from Florida to Ontario, Canada, through Georgia, Tennessee, Kentucky, Ohio, and Michigan. The goal of the partnership is to reduce congestion, increase efficiency, and improve the safety of motorists that travel on 1-75 in the U. S. and Highway 401 in Canada (71).
The purpose of the Advantage 1-75 proj ect is to facilitate motor carrier operations by allowing transponder-equipped and properly documented trucks to travel any segment along the entire length of 1-75 at mainline speeds with minimal stopping at weigh/inspection stations (7, 11, 71). Electronic clearance decisions at downstream stations are based on truck size and weight information taken upstream and on computerized checking of operating credentials in each participating state (7, 11). Vehicles approaching a weigh station, equipped with the programs Mainline Automated Clearance System (MACS) are identified and weighed using automatic vehicle identification (A VI) and weigh-in-motion (WIM) technology. The computer at the station verifies the credentials of the vehicle and signals the vehicle to either proceed or enter the station (4, 72).
An operational case study focusing on the technical and non-technical ITS institutional issues that were encountered during the Advantage 1-75 project was conducted. Findings obtained from the experiences of participants in the Advantage 1-75 project include (73):
• Public and private partnerships in projects require understanding, commitment, and communications. These components must be present to build trust in the partnership.
• Upper management must buy into the project, in the case of Advantage 1-75 the governors signed an agreement to participate.
• Flexibility on the part of all participants is required to complete a complex project.
76

• Demonstrable benefits are critical for participants joining the project, and participation is critical to project success.
• Contracts should be clear and, if possible, utilize a cost plus fixed fee approach. Both sides should thoroughly understand the contract prior to contract signing and a contract problem resolution method should be used to head off problems early.
• Involve the private sector, both individual motor carriers and industry associations, early and have their representatives play an active role. Implement measures to insure that all partners get the same information and that it is timely information.
• Be aware of regulatory and legal concerns and issues.
• Develop a clear statement of the project's concepts, goals, and objectives and use this information to get commitments for funds and participation.
The approximate total cost of the project was $17.5 million, and was expected to be completed by October 1997 (11).
6.2.2 Heavy Vehicle Electronic License Plate (HELP) Program
This program began in 1983 as part of an effort by the states of Oregon and Arizona to automate the process of weighing trucks and checking credentials at ports of entry. The program then extended to become a multi-state, multi-national project that included all states on 1-5 and some on IH-I0. The IH-5 states were Washington, Oregon, and California, and the 1-10 states were California, Nevada, Arizona, New Mexico, and Texas. The objective ofthe project was to design and test an integrated heavy vehicle monitoring system which used A VI, automatic vehicle classifiers (A VC), and WIM to collect data from vehicles. The data were then transferred to various agencies for purposes of enforcement, planning and management. HELP's ultimate goal was to have a system in which a legal truck could drive through the entire network without having to make multiple stops at weigh stations or ports of entry, thereby, increasing productivity (4, 11, 74).
In the late 1980s, the program began a large-scale technology test along the Crescent Corridor, formed by the arc ofI-5 and 1-10 from British Columbia, Canada, to Texas. A total of 32 sites were equipped with the necessary technology, and linked to a regional computer. About 2,000 trucks were equipped with transponders and monitored in 1992 and 1993 to demonstrate various levels of automated clearance (4). The total cost of the project through the Crescent demonstration was estimated at $22 million (4).
A team of experts was then hired to evaluate the Crescent demonstration of the HELP program on the West Coast. Some members of the team were assigned to evaluate the trucking industry's perspective of this demonstration. These members visited more than 54 trucking
77

companies to obtain information about how carriers viewed the demonstration potential, in terms ofthe impact of technology on productivity. From the interviews, the following was concluded (75):
• It was not clear that ITS offers motor carriers improved productivity. The only improvement identified by the team was the fact that there is a potential for a truck to travel faster from origin to destination, through bypassing or through traffic information.
• The data needs of road agencies and of motor carriers were very different (e.g., road agencies needed data on a large number oftrucks at a specific point on the highway, but carriers needed various types of information on certain vehicles at specific times).
• In order for ITS to provide data that assist with fleet management, it has to use a realtime format and extensive geographic coverage.
• Many operations did not require fleet management technologies, since many trucks were used in short hauls and regular route situations.
• There may be more potential for ITS in the area of commercial vehicle administrative procedures than in the area of fleet management.
• The biggest thing road-agency ITS can do for the industry is to minimize the obstacles associated with the commercial vehicle administrative process.
Apart from the trucking industry perspective, the Crescent demonstration was able to show that the technology and procedures used were practical and effective at screening trucks. As of April 1996, a total of seven weigh stations in California and one in New Mexico have been restructured to operate the HELP system, now called PrePass. Nine other sites are being redesigned in California, four other sites in New Mexico, and five new sites in Arizona (4).
6.2.3 The ITS-CVO Green Light Operational Test
This Oregon DOT project will electronically verify safety and weight information of drivers, vehicles, and carriers from fixed and mobile roadside sites at highway speeds. This will provide mainline automated clearance at 16 sites, and automated screening at 35 enforcement sites (4). The project will be compatible with the Advantage 1-75 and HELP Inc. electronic clearance efforts, which will assist with the national deployment of an electronic information network (11).
The Green Light program is being administered by TransCore of Harrisburg, Pennsylvania. It is expected that a total of 35,000 trucks will be equipped with transponders (these will be leased for $45 per year per unit) by the end of the five-year duration of the project
78

(76). The total estimated cost of the project is $25.5 million, and it is expected to be competed by April 2000 (11).
6.2.4 Electronic Clearance for International Borders
This is a demonstration project of commercial vehicle electronic clearance at international borders, including proper identification of Mexican and Canadian motor carriers by using innovative ITS technology. The goal of the project is the development of a system design and standards for international border crossings. This project encompasses initiatives at border crossings in Detroit, Michigan, and Buffalo; Otay Mesa, California; Nogales, Arizona; and Santa Teresa, New Mexico (11, 77). A key element of these initiatives is the integration of the North American Trade Automation Prototype (NATAP), which is an initiative of the U.S. Treasury Department. The duration of the project was from September 1994 to September 1997, and the total approximate cost was $19 million (11).
6.2.5 The International Border Electronic Clearance Program (IBEX)
This project will demonstrate a border clearance system to accelerate commercial vehicle traffic through the Otay Mesa, California, port of entry. The objective of the project is to make use of advanced technologies such as A VI, A VC, automatic credential verification (ACV), vehicle cargo monitoring, and safety and environmental monitoring, to allow selected vehicles to pass the international border inspection points without stopping, or with expedited inspections. The technologies used with this system will be compatible with those used by HELP Inc. and Advantage 1-75. The system will also be fully compatible with NATAP. IBEX will deploy integrated systems to provide user services in the areas of electronic clearance and administrative processes, automated roadside safety inspection, on-board safety monitoring, and commercial fleet management (78). It should be noted that Texas is participating in a similar parallel effort for border cities of Laredo and EI Paso in an initiative called TRIBEX (Texas Regional International Border Electronic Crossing).
6.2.6 Port-of-Entry Advanced Sorting System (PASS)
This project was conducted at the Ashland port of entry by the Oregon DOT and the motor carrier industry, from June 1992 to December 1996. The project investigated A VI, WIM, and A VC technologies to identify, weigh, classifY, and direct selected commercial vehicles prior to arriving at weigh stations and ports of entry (11). Trucks that were operating legally were directed, by the use of an in-vehicle device, to bypass the port and the static scale weighing process. This resulted in time savings for the carrier and port personnel. The estimated total cost of the project was $572,000.
79

6.2.7 Other Electronic Clearance Projects
Idaho, Oregon, and Utah are working on a clearance project on the 1-84 corridor from Portland to Salt Lake City. The purpose of the project is the clearance oflonger combination vehicles (LCV s). Part ofthe project is the installation of A VI transponders on 2,000 trucks. The information regarding truck movements along the corridor will be used to develop exposure data for LCVs as part of an on-going safety study. The estimated cost of the project is $208,000 (4).
Idaho, Oregon, and Washington are working on a Multi-Jurisdictional Automated Preclearance System (MAPS), which will streamline interstate and international trucking operations by automating all weigh stations and ports of entry. This project is an extension of the Idaho-Oregon-Utah clearance project on 1-84 (79).
6.3 SAFETY AND ENFORCEMENT
This section addresses three user services, namely roadside safety inspections, on-board safety monitoring, and hazardous materials incident response. Safety and enforcement services facilitate roadside inspections of vehicles and drivers. These systems also monitor the safety status of the vehicle, driver, and cargo (4). The common goal of these services is to increase the efficiency of safety and weight inspection programs, while reducing the time spent by commercial vehicles at inspection sites and increasing highway safety (4, 7).
There is a large number of CVO initiatives that, through the use of new technologies, address the issue of improved driver and vehicle compliance with safety regulations. Some of the ITS-related systems that directly address these CVO issues are (2):
• Driver/Vehicle Real-Time Safety Monitoring: This is a system that continuously monitors and electronically records information about the driver (e.g., hours of service, medical information, and commercial license information), and about the vehicle (e.g., mechanical conditions). Portions of this system are already at the deployment stage.
• Hazardous Material Information Systems: With these technologies, incident management response will be more efficient, since there will be timely, accurate information on cargo contents and location due to the tracking capabilities of the technology.
• Site-Specific Highway Warning Systems for Trucks: This technology is applied to provide truck drivers with warning systems that present information specific to the vehicle in relation to the geometric and topographic features of a highway. The state of Colorado is an example where this technology is already being applied.
• Automated Mayday Capabilities: These technologies allow truck drivers to communicate with dispatchers or police in emergency situations.
80

The following are some examples of ITS-CVO projects in the area of safety and enforcement that are either in the testing process or that have already been completed in various states in the U.S.
6.3.1 Safety and Fitness Electronic Records (SAFER) System
This is a data exchange system designed to facilitate the exchange of electronic data pertaining to carriers, vehicles, and driver safety and credential information between users and source systems. The SAFER system was the result of a congressional requirement that the FHW A make prior carrier safety data available in an electronic format at roadside inspection sites so that carriers which had been inspected and found to be safe would be selected for fewer additional inspections. This would enable roadside inspectors to target high-risk and out-ofservice carriers (13, 80).
As part of the SAFER deployment strategy, an operational testing period has been planned to evaluate the performance, cost, and utility of the SAFER Data Mailbox (SDM) system, which is an electronic post office that re-routes relevant incoming information to the appropriate destination (80). The Eastern States evo Coalition has been selected to assist in the testing and evaluation process.
The operational testing period will take place in two phases. Phase 1 will establish the software and hardware requirements of each state for communicating with SAFER. During this phase, inspection data will be sent from the roadside to the correct SAFETYNET mailbox within the SDM system (80). During phase 2, inspection reports will be sent and stored in the SAFER system by means of the SDM. SAFER will also make use ofthis information to create a vehicle and/or driver snapshot depending on the type of inspection performed (80, 81).
The SAFER system is being administered by the Johns Hopkins University's Applied Physics Laboratory in Baltimore, Maryland. The estimated total cost of the project is $5.8 million (11).
6.3.2 The Automated Safety Assessment Program (ASAP)
This project will obtain data from motor carriers which will enable the Office of Motor Carriers (OMC) to detect safety performance of trucking companies without having to visit their place of business. The program will allow motor carriers to electronically show information to the OMC regarding their compliance with the federal safety regulations by inputting the required information into a computer and electronically sending it to the OMC for validation and analysis. The expected completion date of the project is October 1998, and the total estimated cost is $1.5 million (11).
81
6.3.3 Dynamic Truck Speed Warning for Long Downgrades Operational Test
This project, which is taking place in Colorado, provides for the installation of a WIM station to determine the weight of each truck passing the site. The station does not consider trucks with gross vehicle weights (GVW) under 30,000 pounds. In addition to the WIM stations, loops were installed to determine vehicle speeds (11). Using the information from the WIM stations and from the loops, commercial vehicle drivers are informed of the safe descent speed on long downgrades by means of variable message signs. This project ran from 1993 to 1997 and the total cost was approximately $243,000 (11).
6.3.4 Out-of-Service Verification Operational Tests
There are two operational tests currently underway to provide automatic, real-time outof-service (OOS) verification at the roadside. The first test is being conducted in Minnesota and Wisconsin. In this project, video identification equipment is used, and a database was created using key OOS data on specific vehicles. Further downstream identification of vehicles determines whether or not a vehicle is in violation of an OOS order (11).
The second project is taking place in Idaho at the East Boise port of entry. This project makes use of video image processing systems, passive radio frequency stickers and readers, a pen-based information system (PBIS), automatic vehicle identification tags and readers, and a local intelligence computer. In addition, the project will make use of an inspection site alarm system that is activated when an OOS vehicle attempts to leave the site (11, 82). The projects were expected to be completed in 1997. The total combined estimated cost of the two tests is $1.2 million (11).
6.3.5 Roadside MCSAP Computer System (200 Sites)
This is a congressionally mandated project that is intended to provide electronic access to carrier safety data and driver license status from at least 200 Motor Carrier Safety Assistance Program (MCSAP) inspection sites across 32 states. The system will make use of information systems technology to better target inspections, improve driver license checks, and provide for electronic recording and uploading of inspection data by means of pen-based computers. The total estimated cost of the project is $3.6 million, and was expected to be completed by 1997 (11).
6.3.6 Colorado MAYDAY System
This project evaluated the use of a global positioning system (GPS) and cellular phones for two-way communications to provide emergency and non-emergency assistance to travelers in north central Colorado. It was a testthatoperated from October 1994 to December 1997 (11).
82

The main objective of this project was to assess the impact of an infrastructure-based GPS and response network on emergency response activities, time, and public safety. The test was also intended to identify the structure, responsibility, and service levels required to make this system viable and for general public use. The operational test involved approximately 2,000 vehicles equipped with TIDGET, a low cost location device with ports for cellular phone communication that was mounted in the vehicle. The TIDGET sensor used GPS signals that were relayed to a control center. From this center, the location of the vehicle could be determined. Special characteristics associated with the vehicle (e.g., ifthe vehicle was moving dangerous goods) had to be registered with the control office prior to departure (11).
6.3.7 Operation Respond
This project involved many U.S. states and some Canadian provinces. Operation Respond operated from April 1997 to June 1997. The proj ect was designed to link 911 operators with participating carriers during the initial response to hazardous materials accidents. This system enabled North American emergency responders to have real-time access to hazardous materials information on the scene. Access to this information provided for more accurate assessment of situations to determine appropriate and immediate remedial action (11).
6.3.8 Other Safety and Enforcement Projects
The state of Cali fomi a is currently working on the On-Board Driver MonitoringlFitnessfor-Duty Testing project. The project will evaluate the ability of a lane tracking device to monitor a driver's fitness-for-duty. Once a 'baseline' driver performance is established, any deviation from that baseline is reported to the driver. If the deviation continues, the motor carrier is advised and the driver pulls off the road for a five-minute test. The results of the test will determine if the driver is able to continue or is required to sleep (11).
New Mexico is working on the Black Box Development project. This project will check the feasibility of placing a vehicle incident recorder on commercial vehicles for accident reconstruction. The project will determine which vehicle functions should be monitored and will demonstrate how these functions could be used in accident reconstruction (11).
The states of Ohio, West Virginia, Colorado, Connecticut, Indiana, Oregon, Wisconsin, Nevada, and Maryland are working on the Development, Evaluation, and Application of Brake Testing Devices project. This project will evaluate and test new technologies that can be used for testing brakes of commercial vehicles during roadside inspections. The findings and information obtained from these states will form the basis of an objective evaluation of all the technologies. Some ofthe technologies that will be examined include roller dynamometers, flatplate testers, infrared detectors, torsional devices, and decelerometers (11).
83

6.4 COMMERCIAL VEHICLE ADMINISTRATIVE PROCESSES
Services in this area facilitate the electronic purchase of credentials and the reporting of mileage and fuel. By using these services, carriers have access to electronic application for permits or registration, or automated tax reporting and auditing (83). The following are some examples ofITS-CVO projects in the area of commercial vehicle administrative processes that are either in the testing process or that have already been completed in the u.S.
6.4.1 Electronic One-Stop Shopping Operational Tests
These projects are comprised of 14 states, namely California, Arizona, New Mexico, Iowa, Minnesota, Nebraska, Wisconsin, Kansas, Missouri, Illinois, South Dakota, Colorado, Arkansas, and Texas. The main objective of the projects is to test different methods of accomplishing one-stop, multi-state electronic purchase of credentials from locations that include motor carrier facilities, permitting services, truck stops, and state agencies. By testing these methods, the government is able to evaluate the increase in state and motor carrier productivity from automating and integrating common motor carrier administrative functions (4, 11). The total cost of the tests was approximately $7.9 million, and they were completed around September 1997.
6.4.2 Automated Mileage and State Crossing Operational Test (AMASCOT)
This project was completed in December 1995. The project tested and evaluated the effectiveness of using Global Positioning System (GPS) and on-board computers to record the miles driven within a state for fuel tax allocation purposes. The states that participated in this project were Iowa, Minnesota and Wisconsin (4, 11). The project focused on improving the collection and reporting of data to 1FT A and IRP base jurisdictions (4).
6.4.3 Electronic Permitting Issuance System for Oversize/Overweight Vehicles
This project dealt with oversize/overweight (OS/OW) permitting in New York. The purpose of the project was to increase the safety of commercial vehicle movements and increase the efficiency of the associated regulatory activities (84).
Automating the permitting system meant linking information from several sources (e.g., bridge, road, and construction databases) and maintaining an electronic database of issued permits. The researchers involved in this project made extensive use of geographic information systems (GIS) for data management and user interaction. They also incorporated route verification with the permits, using GIS to link the separate databases (84). The major elements developed were: (1) the underlying database structure to store information on applications and permits issued; (2) a means for encoding the rules associated with various restrictions on permits issued; (3) an effective user interface; and (4) the incorporation of GIS to facilitate "point-and-
84

click" route selection at the transmission end and automated route verification at the New York Department of Transportation offices.
The system was designed to replace a largely paper-based, manual permitting system that was tedious and repetitive in nature. The proposed automated system was suggested for permitting of OS/OW vehicles, but eventually could be expanded to all permitting and registration processes.
6.5 FREIGHT MOBILITY
Services in this area facilitate real-time communication between drivers, dispatchers, intermodal service providers, and highway traffic managers to enhance commercial vehicle productivity by avoiding congested areas (83). Freight mobility systems include onboard computers, routing and dispatching systems, communications technologies, and automatic vehicle location systems (4).
The Commercial Vehicle Fleet Management and Information Systems projects will help address commercial as well as public fleet management needs through the use of technology. The conduct of the projects will involve case studies and in-depth interviews with fleet managers, dispatchers, and drivers. A second phase to this series of projects will continue to study advanced technology applications for commercial fleet operations and will also address intermodal issues and evo driver acceptance issues (11).
The 1-95 Northeast Corridor--Fleet Forward project, which involves the states of New York, New Jersey, Pennsylvania, Delaware, Maryland, and Virginia, plans to provide participating commercial vehicle operators and dispatchers with various types of information to improve their efficiency and productivity. Some of this information includes congestion areas, locations of incidents, weather reporting, and routing. The information is used to help meet the demands of shippers and receivers for fast, timely, and reliable delivery of goods. As the project progresses, the private sector will be more involved, and the operation will become more customized to a carrier's needs (11).
85


7.0 PROPOSED TEXAS CVO STATEWIDE PLAN
The purpose of this project was to develop a strategic plan that will serve as a guide for Texas and TxDOT for improving the efficiency, safety, and productivity of commercial vehicle operations on Texas highways. This chapter presents the proposed Texas evo statewide plan which includes the mission and vision statements, goals and objectives, and a list of specific project milestones, responsibilities, and funding levels for Texas.
Five inputs were used to develop the plan: (l) a comprehensive literature review concerning ITS-eVO, truck enforcement, truck activity in Texas, motor carrier administrative procedures, and strategic planning for evo; (2) an extensive analysis of trucking activity in Texas; (3) a survey of major motor carriers with extensive and diverse transport activities in the state; (4) a survey of experts involved in motor carrier policy and program activities in different government agencies in Texas; and (5) a series of meetings of the TTl research team and the project advisory committee.
7.1 MISSION AND VISION STATEMENTS
The mission and vision statements were proposed by the research team during a meeting with members of the advisory committee. The statements were then evaluated, examined, and analyzed by the advisory committee members for clarity, conciseness, and content, and proposed changes were made. The following are the resulting mission and vision statements.
Texas CVO Mission Statement
To ensure a safe, legal, efficient, and technologically advanced movement of goods by streamlining motor carrier administrative and enforcement activities in the state.
Texas CVO Vision Statement
The safe, legal, and efficient operation of commercial vehicles within the state.
7.2 GOALS AND OBJECTIVES
U sing the same approach as for the mission and vision statements, the research team proposed the goals and objectives of the strategic plan. The advisory committee then evaluated, examined, and analyzed these goals and objectives for clarity, conciseness, and content. The goals and objectives of the strategic plan for commercial vehicle operations in Texas are as follows:
87

GOALl
GOAL 2
GOAL 3
GOAL 4
Enhance Highway Safety in the State
Objective:
Objective:
Increase motor carrier compliance with size, weight, and safety regulations.
Reduce the frequency and severity of crashes involving commercial vehicles on Texas highways.
Enhance CVO Administrative and Regulatory Efficiency
Objective:
Objective:
Objective:
Conduct paperless CVO with current, accurate, timely, and verifiable electronic information.
Implement a one-stop shop for registration, operating authority, fuel taxation, and permitting.
Enhance information sharing of non-proprietary data.
Improve Motor Carrier Productivity
Objective: Reduce delays during size, weight, and safety inspections.
Objective: Reduce the impact oftraffic congestion on CVO.
Minimize Institutional and Technological Barriers to Enhance Economic Growth
Objective:
Objective:
Objective:
Simplify CVO rules and regulations.
Evaluate and implement technology to streamline motor carrier operations.
Promote increased communication among the partners involved in commercial vehicle operations.
Table 7-1 shows these goals and objectives, and the tasks that will help to achieve them. This table was also developed in consultation with the advisory committee.
88

Table 7-1. Goals and Objectives of the Proposed CVO Strategic Plan
GOALS OBJECTIVES TASKS TO ACHIEVE THE OBJECTIVES c:
1. ENHANCE HIGHWAY SAFETY IN THE STATE
1 Increase motor carrier • Develop and implement a system for DPS to compliance with size, weight, and identify all motor carriers operating in the safety regulations state.
• Develop and implement a system to target motor carriers with unsatisfactory safety ratings as well as motor carriers with no safety rating.
• Utilize the current network ofWIM and AVe devices for improved enforcement of weight and safety regulations.
• Provide incentives to motor carriers for improved performance.
2 Reduce the frequency and severity • Promote a uniform and coordinated statewide of crashes involving commercial incident management system for the vehicles on Texas highways transportation of hazardous materials.
• Educate the driving population to share the road with commercial vehicles. This also includes truck drivers.
• Use multi-media methods to provide timely information about traffic conditions, incidents, weather, and road conditions.
• Develop and make available a system in which motor carriers involved in crashes are automatically linked to emergency response.
89

Table 7-1. Goals and Objectives of the Proposed CVO Strategic Plan (Continued)
GOALS OBJECTIVES TASKS TO ACHIEVE THE OBJECTIVES
2. ENHANCE CVO ADMINISTRATIVE AND REGULATORY EFFICIENCY
1 Conduct paperless cva with current, • Increase the use of portable computers in the field to accurate, timely, and verifiable assist with the conduct of roadside safety electronic information inspections.
• Use enhanced technologies and infonnation systems to exchange data electronically with regulatory agencies and industry.
• Continuously update and enhance the database containing the safety records of the motor carriers.
• Implement a system to ensure compliance with the state's fuel tax reporting, credential requirements, and oversize/overweight operations.
2 Implement a one-stop shop for • Use enhanced technologies and infonnation systems registration, operating authority, fuel to exchange data electronically with customers. taxation, and permitting
• Continuously update and enhance the database containing commercial vehicle registration infonnation.
• Implement a geographical infonnation system (GIS) for route optimization during pennitting.
• Develop and implement a system to electronically transmit IRP and 1FT A data to and from other jurisdictions.
3 Enhance information sharing of non- • Use enhanced technologies and infonnation systems proprietary data to exchange data electronically with regulatory
agencies and industry.
• Promote increased communication among the partners involved in commercial vehicle operations.
• Use data exchange methods among systems that will maximize data integrity and minimize unauthorized access.
90

Table 7-1. Goals and Objectives ofthe Proposed CVO Strategic Plan (Continued)
GOAL OBJECTIVES TASKS TO ACHIEVE THE OBJECTIVES
3. IMPROVE MOTOR CARRIER PRODUCTIVITY
1 Reduce delays during size, weight, • Automate roadside safety inspections. and safety inspections
• Maintain a well-trained inspection force.
• Upgrade designated weighing areas to ensure safe Levell inspections.
2 Reduce the impact of traffic • Use multi-media methods to provide timely congestion on eva information about traffic conditions, incidents,
weather, and road conditions.
• Deploy electronic clearance of commercial vehicles at the Texas-Mexico border.
91

Table 7-1. Goals and Objectives of the Proposed CVO Strategic Plan (Continued)
GOAL OBJECTIVES TASKS TO ACHIEVE THE OBJECTIVES
4; MINIMIZE INSTITUTIONAL AND TECHNOLOGICAL BARRIERS TO ENHANCE ECONOMIC GROWTH
1 SimplifY eva rules and regulations • Coordinate with other states to standardIze some of the basic motor carrier regulations.
• Institute a continuous review process to update and streamline rules and regulations.
• Ensure consistency and reduce redundancy of roadside inspections.
2 Evaluate and implement technology to • Use technologies which are fully developed, streamline motor carrier operations considering technologies currently being used by
the industry and other jurisdictions.
• Promote advanced technologies for fleet management and improved operations.
• Conduct objective evaluations of the impact of advanced technologies on CVO.
• Train users for operation of new technology.
3 Promote increased communication • Educate all stakeholders on ITS-CVO initiatives among the partners involved in and expected impacts on the state's economy. commercial vehicle operations
7.3 LIST OF PROJECTS FOR IMPLEMENTATION OF THE PROPOSED PLAN
This section presents a list of projects for implementation, which address the four goals and 10 objectives of the proposed evo strategic plan for Texas. Funding sources and levels of funding vary depending on the project. However, in order for Texas to maximize the amount of federal funds received, particularly for the projects presented in this section, it is recommended that the state become part of the U.S. National Mainstreaming Program. This first requires the submission of a Business Plan, which will place Texas in a position to receive federal funding for evo. The funding noted below for projects is contingent upon meeting federal requirements and will be made available in a multi-year program for the various states and within the phasing planned by U.S. DOT.
Table 7-2 presents general information about the projects in the proposed evo strategic plan for Texas. It is important to understand that because this is a plan for approximately a 10-year period, the estimated costs, funding sources, and time frames are subject to change.
92

Table 7-2. List of Projects for the Proposed CVO Strategic Plan
Project Estimated Estimated Total Participating Agencies Start Date Cost ($Million]
1. Statewide Information FY 1999 1.3 DPS,FHWA Database System (SIDS) Deployment
2. Motor carrier FY 2000 0.2 DPS, TxDOT identification system
3. Automation of roadside FY 2000 25.0 DPS,FHWA, safety inspections TxDOT
4. Upgrading of designated FY 1999 2.0 per site DPS, TxDOT weighing areas
5. Use ofWIM and AVC FY 1999 0.5 per 10 DPS, TxDOT devices for enforcement years
6. Statewide incident FY 2001 8.0 DPS, TxDOT management system
7. Implementation of a one- FY 1999 2.0 Comptroller, DPS, stop shop TxDOT
8. Technology user training FY 2000 0.1 per year DPS, TxDOT program
9. Implementation of FY 2001 5.8 DPS, TxDOT information systems
10. Share-the-road campaign FY 1999 0.5 Motor carriers, TxDOT
11. Creation of a special task FY 1999 0.008 per year DPS, TxDOT force
12. Electronic clearance at the FY 2002 1.0 DPS, TxDOT, U.S. Texas-Mexico border Customs, U.S.
Immigration
93

PROJECT 1. Statewide Information Database System (SIDS) Deployment
Description of the Project: This project involves purchasing additional laptop computers and installing SIDS software for enforcement in all regions (other types of software and databases will be installed in these computers as part of other projects). At the present time, only troopers in the Corpus Christi region are equipped with laptop computers as an aid for enforcement. Troopers in the Midland and Waco regions will be next in acquiring the same type of equipment with the remainder of the regions within one year.
This is the first step toward automation of the inspection process in the state. Immediately following inspection of a commercial vehicle, troopers will enter the information about that particular vehicle directly into the laptop computer, rather than on a conventional paper report form. Currently, a supervisor must check trooper forms as submitted; this can be expedited with computers and communication links throughout the state. These computers will also be used for electronic data exchange between troopers and other agencies involved in commercial vehicle operations. In the future, these laptops will also be used by enforcement officers in the field to electronically access safety records of individual motor carriers, as well as credentials and permits.
Efficiency Gains: By providing laptop computers to troopers in all regions, the automation of roadside safety inspections may become easier to achieve. Also, troopers may be able to conduct paperless CVO with current, accurate, timely, and verifiable electronic information.
Estimated Project Start Date: The initial phase of the project started in 1997 (laptop computers for the Corpus Christi region). The next two regions should have computers by November 1998 and the remainder of the districts by the end ofFY 1999.
Participating Agencies: Department of Public Safety, Federal Highway Administration.
Estimated Total Cost: Computer: $3,500, printer $230, power inverter $300. Total cost to equip 321 troopers is $1.3 million (Iowa uses Telxon hand-held computers at $7,000 each.)
Potential Funding Source: A total of $65 million is available in TEA-21 for Information Systems and analysis. This money is earmarked for improvements to information systems containing carrier, vehicle and driver safety records, the developments of new databases and the analysis of motor carrier information and program effectiveness. A portion of these funds will be in the form of grants. There is also $579 million in MCSAP money in TEA-21. This project may be eligible as a complementary activity. TEA-21 has also allocated $184 million for ITS CVO. One priority area is to increase the efficiency of regulatory inspection processes to reduce administrative burdens by advancing technology to facilitate inspections and generally increase the effectiveness of enforcement activities.
94

Goals and Objectives Addressed: 2-1,3-1
PROJECT 2. Motor Carrier Identification System
Description of the Project: This project involves developing and implementing a system for DPS to identify all Texas-based motor carriers that operate in the state. Currently there are many unknown motor carriers operating in the state. This results in an undesirable advantage for motor carriers that are not known by DPS since they are not subject to facility audits, carrier ratings, and compliance reviews. Once such a system is in place, and the vast majority of motor carriers operating in the state are identified, it is recommended that a system be implemented to identify motor carriers with unsatisfactory safety ratings, as well as motor carriers with no safety rating at all.
Efficiency Gains: Having a motor carrier identification system in place may help achieve the goal of increasing motor carrier compliance with size, weight, and safety regulations. Knowledge about the carriers that operate in the state and their base of operation will allow DPS to more effectively enforce motor carrier regulations. This will create a more uniform operating environment across all motor carriers operating in the state.
Estimated Project Start Date: FY 2000
Participating Agencies: Department of Public Safety, Texas Department of Transportation.
Estimated Total Cost: Approximately $200,000
Potential Funding Source: A total of $65 million is available in TEA-21 for Information Systems and analysis. This money is earmarked for improvements to information systems containing carrier, vehicle and driver safety records, the developments of new databases and the analysis of motor carrier information and program effectiveness. A portion of these funds will be in the form of grants.
Goals and Objectives Addressed: 1-1
95

PROJECT 3. Automation of Roadside Safety Inspections
Description of the Project: This project will automate roadside safety inspections by providing enforcement personnel with real-time access to vehicle, driver, and motor carrier facility records. This includes information about previous roadside safety inspections and out-of-service defects, motor carrier credentials, permits, and safety ratings. The system will function using wireless communication and will enhance or replace the current radio system being used by DPS. The biggest cost will be the communication upgrade.
Efficiency Gains: Automating the roadside safety inspection process may help improve motor carrier productivity and reduce institutional and technological barriers that hinder economic growth. This is because enforcement officers will inspect vehicles that are more likely to have low safety ratings based on past performance and reduce the number of redundant inspections. Also, with a real-time automated system, inspectors will also be able to enter the results of inspections directly into the laptop computers rather than filling out a conventional paper report form. Then, following the supervisor's error-check of the form, the results can be sent to the network inspection database, reducing the time currently required for updating the roadside inspection database. (Purchase of laptop computers has been addressed elsewhere.)
Estimated Project Start Date: FY 2000
Participating Agencies: Department of Public Safety, Federal Highway Administration, and Texas Department of Transportation.
Estimated Total Cost: Based on Iowa's estimated $10 million for their system which uses 99 repeaters (one per county), it is estimated that a similar system for Texas would cost approximately $25 million.
Potential Funding Source: There is $579 million in MCSAP money in TEA-21. Uniform roadside driver and vehicle safety inspections are eligible. In addition, TEA-21 has allocated $184 million for ITS CVO. One of the priority areas is to increase the efficiency of regulatory inspection processes to reduce administrative burdens by advancing technology to facilitate inspections and generally increase the effectiveness of enforcement activities. Federal share out of this section is 50 percent with a total federal share not to exceed 80 percent.
Goals and Objectives Addressed: 1-1,2-1,3-1,4-1,4-2
96

PROJECT 4. Upgrading of Designated Weighing Areas
Description of the Project: This project will upgrade designated weighing areas to ensure safe Level I inspections. Currently there are 245 designated weighing areas in the state including permanent (in-ground) scales, weigh strips, and other weighing areas. Almost one-half of these designated weighing areas (44 percent) are not suitable for Level I inspections.
The upgrade will consist of infrastructure improvements at each weighing area and the installation of weigh-in-motion (WIM) devices in advance of the scale for both directions of traffic. In addition, the WIM sites should be designed to send real-time data, either by telephone or by wireless communication, to a central DPS location for truck weight monitoring purposes. This will help DPS determine which weighing areas to open for enforcement. For example,
incoming data from two WIM systems may indicate that in one case 99 percent of the trucks are within the maximum allowable weight limits and in the other case only 85 percent are legal. This would suggest where enforcement personnel are needed the most.
Efficiency Gains: Upgrading of designated weighing areas may result in direct benefits to enforcement agencies and to motor carriers. The level of safety of officers conducting Level I inspections would increase, and more inspections could be conducted each year. Also, the WIM devices may help DPS to better allocate the limited resources for weight, dimension, and safety enforcement.
Estimated Project Start Date: FY 1999
Participating Agencies: Department of Public Safety, Texas Department of Transportation.
Estimated Total Cost: Cost of improvements similar to the Divine site on 1-35 is $2 million per site.
Potential Funding Source: TEA-21 has allocated $184 million for ITS CVO. One of the priority areas is to increase the efficiency of regulatory inspection processes. Some of the funds available are for development of ITS infrastructure. Federal share out of this section is 50 percent with a total federal share not to exceed 80 percent.
MCSAP has been provided with $579 million over the next six years to assist in enforcing roadside driver and vehicle inspections. This may fit as a complementary activity.
Goals and Objectives Addressed: 1-1,2-1,3-1
97

PROJECT 5. Use ofWIM and AVC Devices for Enforcement
Description of the Project: This project will utilize the existing network of WIM and AVC systems for improved enforcement of weight and safety regulations by making use of telephone lines or wireless communication technology to link these data collection sites with a central DPS location (or dispatch office). The data collected by TxDOT will be shared with DPS to achieve this objective. This project would supplement another project to upgrade the designated weighing areas. Compatibility of equipment between the two projects is essential.
Efficiency Gains: Use of this network for enforcement purposes may help DPS officers to target "hot spots" of commercial vehicle activity. Because there is extensive trucking activity in the state and limited enforcement personnel (one trooper per 45 million truck vehicle-miles traveled), it may be beneficial to use AVC and WIM devices as an aid in enforcement, especially in sparsely populated areas.
Estimated Project Start Date: FY 1999
Participating Agencies: Department of Public Safety, Texas Department of Transportation.
Estimated Total Cost: Modems plus phone line costs for nine remaining WIM sites and 100 A VC sites are $60,000 for the first year, and $40,000 per year thereafter.
Potential Funding Source: TEA-21 has allocated $184 million for ITS CVO. One of the priority areas is to increase the efficiency of regulatory inspection processes. Some of the funds available are for development of ITS infrastructure. Federal share out of this section is 50 percent with a total federal share not to exceed 80 percent.
MCSAP has been provided with $579 million over the next 6 years to assist in enforcing roadside driver and vehicle inspections. This may fit as a complementary activity.
Goals and Objectives Addressed: 1-1,4-1,4-2
98

PROJECT 6. Statewide Incident Management System
Description of the Project: This project will use global positioning systems (GPS) in a unifonn and coordinated manner to provide real-time infonnation about incidents involving hazardous materials. This project will also involve the development of a system in which motor carriers involved in crashes are automatically linked to emergency response. In cases where hazardous materials are involved in the crash, the incident management system enables emergency responders to have real-time access to hazardous material infonnation on the scene.
Efficiency Gains: Developing and implementing a statewide incident management system may help enhance highway safety in the state by providing immediate emergency response when needed. This may help reduce the severity of accidents involving hazardous materials, particularly in rural areas. This system would also allow for more accurate situation assessments to detennine appropriate and immediate remedial action in emergency situations.
Estimated Project Start Date: FY 2001
Participating Agencies: Department of Public Safety, Texas Department of Transportation.
Estimated Total Cost: $8 million (based on Colorado's system)
Potential Funding Source: TEA-21 designated $603 million for research, training, standards, and operational tests. One of the areas designated as a high priority area for funding is incident management. Development of the system may meet the criteria for this funding.
Rural ITS has received $482 million. One of the areas that is considered a priority area in rural transportation is safety (includes commercial vehicle safety). Each state may receive no more than $35 million.
An additional $1.5 million per year is eannarked for hazardous materials monitoring systems. An incident management system geared toward monitoring hazardous materials shipments may be eligible for some of these funds.
Goals and Objectives Addressed: 1-2, 4-2
99

PROJECT 7. Implementation of a One-stop Shop
Description of the Project: This project will develop a plan to implement either a single physical location or point of contact where motor carriers will obtain all permits and credentials needed to operate in the state. Part of this project includes developing and implementing a centralized system to electronically exchange data with regulatory agencies and industry. The data contained in this system will be continuously updated and enhanced. The technology used in the development of the system will be compatible with that used by the industry and other jurisdictions. The data exchange methods used will be designed to maximize data integrity and minimize unauthorized access.
Another component of this project involves implementing advanced technologies to electronically transmit International Registration Plan (IRP) and International Fuel Tax Agreement (IFTA) data to and from other jurisdictions.
Efficiency Gains: A one-stop shop may potentially increase carrier productivity and reduce the cost of regulatory compliance by allowing carriers to purchase all necessary credentials (vehicle registration, operating authority, and others) for their legal operation. Furthermore, a one-stop shop may result in administrative savings from personnel reduction, shared automation systems, and centralized data collection, manipulation, and storage. With a centralized data collection and storage system it may also be possible to identifY those carriers operating without the required credentials.
Estimated Project Start Date: FY 1999
Participating Agencies: Comptroller of Public Accounts, Department of Public Safety, Texas Department of Transportation.
Estimated Total Cost: $2 million for physical one-stop location (purely an estimate because many cost items are unknown).
Potential Funding Source: TEA-21 has allocated $184 million for ITS-CVO. One of the priority areas is to advance electronic processing of registration, driver licensing information, and fuel tax information. Federal share out ofthis section is 50 percent with a total federal share not to exceed 80 percent.
Goals and Objectives Addressed: 2-1,2-2,2-3,4-2,4-3
100

PROJECT 8. Technology User Training Program
Description of the Project: This project involves developing and implementing a training program for users of the new technology introduced by the different agencies involved in commercial vehicle operations. Because there will be a process of improvement by the implementation of new technology for streamlined motor carrier operation in the state, there is also a need for versatile staff (users) that can readily operate this new technology. The training program will involve training on how to use the following: (1) SIDS software during enforcement; (2) the motor carrier targeting system; (3) the databases and software developed for the automation of roadside safety inspections; (4) weigh-in-motion data received at the central DPS office for personnel dispatch; (5) the statewide incident management system; and (6) all data exchange practices and functions of a one-stop shop.
Efficiency Gains: By having a team oftrained users, there may be considerable time savings, as well as decreased administrative and operations costs for state agencies. This is because trained users will be able to take full advantage of the new systems, maximizing the benefits that can be obtained from such systems. This may also translate into direct benefits to the motor carrier industry.
Estimated Project Start Date: FY 2000 .
Participating Agencies: Department of Public Safety, Texas Department of Transportation.
Estimated Total Cost: $100,000
Potential Funding Source: MCSAP has been provided with $579 million over the next six years to assist in enforcing roadside driver and vehicle inspections. This may fit as a complementary activity. In addition, ITS Deployment has received $679 million. A portion of this is for training and technical assistance to state and local government personnel on new technologies.
Goals and Objectives Addressed: 1-1, 1-2,2-1,2-2,2-3,3-1,4-2
101

PROJECT 9. Implementation of Information Systems
Description of the Project: This project investigates and develops a plan to use multi-media methods to provide timely information about traffic conditions, incidents, and other travelrelated issues. These systems are already being used in metropolitan areas in the state but have not been implemented in rural areas. Information systems could be implemented on the roadside in the form of variable message signs, or at truck stops and rest areas. Real-time information provided by these systems could include traffic conditions, roadway congestion, detours, locations of accidents, weather and road conditions, optimal routes, and lane restrictions.
Efficiency Gains: Providing timely information to motor carriers about traffic conditions, incidents, and other travel-related issues may result in considerable time savings to the industry. This would help improve motor carrier productivity by reducing the impact of traffic congestion
and other travel-related factors on commercial vehicle operations. The implementation of information systems may also result in improved road safety, particularly from weather and road condition information.
Estimated Project Start Date: FY 2001
Participating Agencies: Department of Public Safety, Texas Department of Transportation.
Estimated Total Cost: Each overhead changeable message sign costs approximately $120,000. Assuming there is an average of eight for each of the following large urban areas in Texas: Houston, San Antonio, Dallas, Ft. Worth, EI Paso, and Austin: 8 X 6 X $120,000 = $5.8 million. Costs exclude truck stop kiosks.
Potential Funding Source: Rural ITS has received $482 million in TEA-21. One ofthe areas that is considered a priority area in rural transportation is safety (includes commercial vehicle safety). Each state may receive no more than $35 million.
A total of $65 million is available in TEA-21 for Information Systems and analysis. This money is earmarked for improvements to information systems containing carrier, vehicle and driver safety records, the developments of new databases and the analysis of motor carrier information and program effectiveness. A portion of these funds will be in the form of grants.
Goals and Objectives Addressed: 1-2,3-2,4-3
102

PROJECT 10. Share-the-Road Campaign
Description of the Project: This project would develop and launch a campaign to educate the automobile driving population on how to share the road with large commercial vehicles. Similarly, the campaign could also be addressed at truck drivers that share the road with other truck traffic and with automobile drivers. This campaign will inform drivers about operating capabilities of trucks (for example, stopping distances, blind spots, and turning requirements) and other important issues that are present when heavy vehicles and automobiles share the road (for example, driving behavior of automobile drivers). The campaign may include television and radio broadcasts, printed brochures, and roadside billboards.
Efficiency Gains: The launching of a campaign of this type may help improve highway safety in the state by reducing the frequency and severity of crashes involving commercial vehicles.
Estimated Project Start Date: FY 1999
Participating Agencies: Texas Department of Transportation, motor carrier industry.
Estimated Total Cost: Approximately $500,000, depending on the intensity of the campaign.
Potential Funding Source: TEA-21 has designated $72 million per year for years 1998-2003 for Highway Safety Research and Development programs. Part of these funds are specifically allocated for public education on sharing the road safely with commercial motor vehicles.
Goals and Objectives Addressed: 1-2
103

PROJECT 11. Creation of a Special Task Force
Description of the Project: This project will create a special task force to address institutional issues that affect motor carriers and agencies involved with commercial vehicle operations. This task force will: (1) coordinate with other states to standardize some of the basic motor carrier regulations such as maximum width, length, height, gross vehicle weight, and others; (2) institute a continuous review process to update and streamline rules and regulations, removing those which are obsolete and no longer have applicability to commercial vehicle operations; and (3) coordinate with research or other institutions to conduct objective evaluations of the impact of advanced technologies on commercial vehicle operations.
Efficiency Gains: The creation of a special task force may help enhance economic growth by minimizing institutional barriers within the state and between Texas and other jurisdictions.
Estimated Project Start Date: FY 1999
Participating Agencies: Department of Public Safety, Texas Department of Transportation.
Estimated Total Cost: Quarterly meetings, two persons from Texas travel to adjoining states at $1,000 per trip per person results in $8,000 per year.
Funding Source: TEA 21 provides $32 million for a new state highway safety data improvement incentive program to improve the timeliness, accuracy, completeness, uniformity, and accessibility of highway safety data. This funding specifically addresses a data coordinating committee. Any data sharing portion of this project may qualify.
Goals and Objectives Addressed: 4-1, 4-3
104

PROJECT 12. Electronic Clearance at the Texas-Mexico Border
Description of the Project: This project will deploy electronic clearance at the Texas-Mexico border. Texas is currently participating in the Texas Regional International Border Electronic Crossing (TRIBEX) project. This project is a public-private partnership created for the purpose of demonstrating commercial vehicle intelligent transportation systems technology at international bridges using dedicated short-range communications and other onboard systems, electronic cargo seals, and weigh-in-motion. This project will also support the North American Trade Automation Prototype (NA TAP).
Efficiency Gains: Implementing electronic clearance at the Texas-Mexico border may help improve motor carrier productivity by reducing the impact of traffic congestion on commercial vehicles. The delay per truck crossing the border may be reduced, hence resulting in lower vehicle operating costs. Electronic clearance may also decrease administrative and operating costs for state agencies involved in border crossing operations.
Estimated Project Start Date: FY 2002
Participating Agencies: Department of Public Safety, Texas Department of Transportation, U.S. Customs, and U.S. Immigration.
Estimated Total Cost: Utilize existing WIM systems in Laredo and EI Paso, add $100,000 to supplement current functionality to include carrier database; $80,000 per transponder reader to be installed at 10 international bridges; buy 1,000 transponders to install in trucks (no cost to them) at $1,000,000.
Funding Source: Of the $579 million in MCSAP money in TEA-21,S percent is set aside for commercial vehicle safety activities at the border. This project may be eligible as a border activity. Another $700 million was earmarked for the new National Corridor Planning and Border Infrastructure Program. This program specifically states that operational improvements including improvements relating to electronic data interchange and the use of telecommunications to expedite cross border vehicle and cargo movements are eligible for funds.
Goals and Objectives Addressed: 2-1, 3-2,4-2
105
7.4 SAFETY AND ECONOMIC IMPLICATIONS OF STREAMLINING MOTOR CARRIER OPERATIONS
This section provides a cursory evaluation of the safety and economic implications of the proposed ways to streamline motor carrier regulatory activities and administrative procedures in Texas. This is a qualitative evaluation based on previous research and common knowledge regarding commercial vehicle operations. The conduct of a comprehensive quantitative analysis would require a large expenditure and is beyond the scope of this project.
Several studies have presented information regarding the general benefits to the public and private sectors of streamlining motor carrier operations by using advanced technologies. However, these studies lack a comprehensive benefit/cost analysis or budgetary impact analysis of the implementation, maintenance, and operation of those technologies in different jurisdictions (85). Generally speaking, when it comes to streamlining commercial vehicle operations, it has been found that there is a high level of variation in costs and cost savings among jurisdictions (85). For that reason, Texas needs to carefully evaluate investment decisions in the context of its own regulatory and enforcement framework before implementing any of the recommended projects in this plan. The following is a discussion of the potential safety and economic impacts of each of the areas which encompass the proposed projects ofthis strategic plan for commercial vehicle operations in Texas.
7.4.1 Safety and Enforcement
Safety and enforcement services facilitate roadside inspections of vehicles and drivers. These systems also monitor the safety status ofthe vehicle, driver, and cargo (4). The common goal of these services is to increase the efficiency of safety and weight inspection programs, while reducing the time spent by commercial vehicles at inspection sites and increasing highway safety (4, 7). Of the 12 proposed projects in the strategic plan, seven fall under this area of commercial vehicle operations: (1) SIDS deployment; (2) motor carrier targeting system; (3) automation of roadside safety inspections; (4) upgrading of designated weighing areas; (5) use ofWIM and AVC devices for enforcement; (6) statewide incident management system; and (7) share-the-road campaign.
The main cost factors under the safety and enforcement area are: (1) the type of equipment to be used; and (2) the way in which the equipment is to be configured. The costs are divided into capital and annual operating costs. Capital costs refer to equipment acquisition and installation. These costs include ITS equipment, other types of basic equipment, software, installation, and technical support. Annual operating costs include communications costs, additional staffing requirements, operating supplies, maintenance (including system calibrations), and equipment replacement (85).
106

The public sector costs for the automation of roadside safety inspections include: (1) investments in equipment for vehicle inspections and database access; (2) costs associated with accessing and processing driver and carrier safety records; and (3) costs for the development of software to be used in the new system and the training of enforcement officers on how to use this system (8). For the private sector, there are no apparent costs in the short run. However, in the longer term, motor carriers may be required to equip their vehicles with in-vehicle diagnostic systems to facilitate inspections (8).
Principal benefits obtained in the area of safety and enforcement are: (1) reduced number and severity of incidents through early problem detection; (2) increased capacity to inspect vehicles; (3) reduction in the time spent entering information after vehicles are inspected; (4) increased revenue from safety violations since inspectors are able to target non-compliant carriers and increase the number of citations issued; (5) improved carrier productivity through time savings during roadside inspections; and (6) possible decreases in insurance coverage costs for motor carriers (8, 85).
Recent research indicates that the application of advanced technologies in the area of safety and enforcement enhances safety by providing better information for truck safety inspections. A recent study in the Midwest found inspectors using ITS technologies were able to remove 50 percent more unsafe drivers and vehicles than inspectors using conventional methods. Also, a broad-based information network used for truck inspections in Oregon has allowed state inspectors to increase the number of truck inspections by 428 percent while increasing staffing by only 23 percent over a nine-year period (86). The American Trucking Associations (ATA) Foundation also estimates that by automating vehicle inspections, the time required to conduct a Level I inspection is reduced by 10 minutes. Furthermore, using advanced technologies for driver hours of service recording and verification results in savings of approximately $640 per power unit per year. These savings apply only to motor carriers that pay drivers based on time worked (83).
Cost savings from safety inspections are a function of the number of inspections by level, the average time spent conducting each inspection, staffing requirements for the state, and the wage rate. Therefore, these cost savings vary widely between states. Assuming that Level III inspections take 15 minutes per vehicle, Level II takes 25 minutes, and Level I requires 45 minutes per vehicle, annual state benefits from automated roadside inspections range between $130,000 in Delaware to $5.4 million in California. Median annual savings range from approximately $700,000 to $1 million in Colorado and New Jersey. These are the results obtained from a study of budgetary implications oflTS-CVO for state agencies in eight states ofthe u.S. (85). Based on the average number of truck vehicle-miles traveled in Colorado and New Jersey, the annual savings can be converted into savings per million truck vehicle-miles traveled (VMT) using the VMT figures from the Highway Cost Allocation Study (45). The average savings for the two states are approximately $280 per million truck VMT. Applying this figure and concept to Texas, average cost savings from automated roadside inspections could result in approximately $4.1 million per year ($280 per million VMT times 14,471 million truck VMT in the state).
107

The COVE study estimated that, on average, automated roadside safety inspections result in a benefit/cost ratio of 5.43:1 for state agencies (8).
Regarding an incident management system, the main costs would result from the creation of a database and a way to effectively track each load (especially in the case of hazardous materials). The benefits are reflected in improved motor carrier efficiency in administering an incident response program. However, not all size carriers would benefit from this in terms of productivity increases. The benefit/cost ratios estimated by the ATA Foundation range from 0.4:1 to 4.1:1. The greatest benefits would be gained by medium (11 to 99 units) and large (more than 99 units) carriers (83).
7.4.2 Commercial Vehicle Administrative Processes
Services in this area facilitate the electronic purchase of credentials and the reporting of mileage and fuel. By using these services, carriers have access to electronic applications for permits or registration, or automated tax reporting and auditing (83). Of the 12 proposed projects in the strategic plan, two fall under this area of commercial vehicle operations: (1) implementation of one-stop shopping; and (2) technology user training program.
The total cost of developing and implementing electronic credentialing systems consists of start-up costs (development and capital costs) and annual costs (operating and maintenance costs). Development costs vary depending on the type of system selected by the state (i.e., the elements included in the system), the complexity of each system, and the amount of contractor labor hired for the development stage (85). Capital costs are a function of the type of hardware selected to operate the system. Operating costs are a function of communication costs and maintenance and support services.
Principal public sector costs for the implementation of one-stop shopping are: (1) the cost of developing a multi-agency and/or multi-state CVO database; (2) the cost of developing and integrating information systems that work across agencies; (3) the cost of training users on the new system; and (4) the cost of investing in buildings (in the case of implementing a physical one-stop shop) and equipment. The motor carrier industry is not likely to incur any significant costs in the implementation of one-stop shopping (8).
There is a wide range of potential administrative benefits of streamlined motor carrier operations. Examples of these benefits are: (1) improved data consistency-by automating commercial vehicle administrative processes, agencies involved with CVO can improve the consistency and quality of the data used during transactions; (2) simplified taxation and improved tax compliance and auditing-automation would facilitate tax assessment and billing to motor carriers through a centralized data collection facility; (3) time savings for the motor carrier industry-individual motor carriers would no longer have to fill out paperwork for multiple agencies since all the information would go to a centralized system; and (4) reduced manual data entry through automation and information sharing-this reduces the need for manual
108

data entry and time spent processing applications (83, 85). Total annual cost savings attributed to improved administrative processes by using advanced technologies vary greatly among jurisdictions. For example, in the case of Delaware, total annual cost savings are approximately $200,000, whereas in California, annual cost savings are approximately $4.3 million. Estimated median annual savings in other jurisdictions (Connecticut, Kentucky, Minnesota, and New Jersey) range from between $600,000 to $800,000 (85). Based on the average number of truck vehicle-miles traveled in those states, this represents savings of approximately $245 per million truck VMT. Applying this value to Texas, average cost savings from improved administrative processes could result in approximately $3.4 million per year ($245/million VMT times 14,471 million truck VMT in the state). Overall, the largest cost savings are a result of labor savings for processing applications and for compliance auditing.
The ATA Foundation estimates that the cost benefits of automated administrative processes for the motor carrier industry are a function ofthe size ofthe carrier. The benefit/cost ratio for small carriers (1 to 1 0 units) is 1: 1. For medium carriers (11 to 99 units) the ratio is 4.2:1, and for large carriers (more than 99 units) the ratio is 19.8:1 (83).
7.4.3 Freight Mobility
Services in this area facilitate real-time communication between drivers, dispatchers, intermodal service providers, and highway traffic managers to enhance commercial vehicle productivity by avoiding congested areas (83). The principal components of freight mobility systems are onboard computers, routing and dispatching systems, communications technologies, and automatic vehicle location systems (4). Of the 12 proposed projects in the strategic plan, one falls under this area of commercial vehicle operations-the project on implementation of information systems.
Several studies have found that the motor carrier industry will receive most of the benefits ofITS-CVO through cost savings, increases in productivity and efficiency, and eased compliance with regulatory agencies (85). The costs associated with freight mobility are defined as motor carrier investments in advanced computer and communication technologies. Total cost varies widely depending on the level of sophistication required by the carrier (83). Benefits in this area are many. Motor carriers indicate that using advanced technologies for freight mobility increases their productivity by reducing out-of-route miles and fuel consumption, increasing fleet utilization, increasing dispatcher efficiency, and increasing daily pickups and deliveries. Fuel savings reported by some motor carriers range from $1,100 to $3,800 per power unit per year. Benefit/cost ratios of investing in advanced technologies for freight mobility range from 1.5: 1 to 5.0:1 (83).
7.4.4 Electronic Clearance
Electronic clearance services facilitate domestic and international border clearance and minimize stops and delays at weigh stations and ports of entry. By using these services, trucks
109

are able to have their safety status, credentials, and weights checked at mainline speeds (4). Of the 12 proposed projects in the strategic plan, at least two fall under this area of commercial vehicle operations: (1) electronic clearance at the Texas-Mexico border; and (2) use ofWIM and AVe devices for enforcement.
Previous research indicates that implementation of electronic clearance results in significant time savings and improved customer service for carriers, as well as decreased administrative and operations costs for state agencies. The major cost factors in the area of electronic clearance are installation costs and costs associated with training, additional staff, maintenance, and technical support. The benefits for the public sector translate into improved administrative efficiency, increased compliance, infrastructure savings, improved highway planning data, decreased congestion, and free flow of goods. The private sector benefits are reduced cost and time delays, reduced paperwork, and level playing field (8). The eOVE study estimated that electronic clearance systems result in a benefit/cost ratio for motor carriers of 10.55:1 and for government agencies of7.17:1 (8).
7.4.5 Observations for Texas
With the knowledge gained from the literature regarding safety and economic implications of ways to streamline motor carrier operations, the research team developed a qualitative evaluation matrix. Table 7-3 contains each of the proposed projects in the strategic plan and the possible safety and economic impacts of those projects on commercial vehicle operations in Texas.
As mentioned, there is a high level of variation among jurisdictions in costs and cost savings associated with the streamlining of motor carrier operations. The conduct of a comprehensive quantitative analysis requires a large capital investment and is beyond the scope of this project. For that reason, Texas needs to evaluate investment decisions in the context of its own regulatory and enforcement framework before implementing any of the recommended projects in this plan.
From the analysis, four of the proposed projects in the strategic plan can be expected to have a positive safety impact on both the public and private sectors involved in commercial vehicle operations in the state. These projects could playa role in enhancing highway safety in the state by increasing motor carrier compliance with size, weight, and safety regulations, and by helping reduce the frequency and severity of crashes involving commercial vehicles. The safety impact is not known for the remaining eight proposed projects. Regarding the economic impact of the proposed projects, it can be expected that 10 of the projects will have a positive impact on the public sector and six on the private sector involved in commercial vehicle operations in Texas. This could result from enhanced evo administrative and regulatory efficiency, improved motor carrier productivity, and reduced institutional and technological barriers that currently inhibit economic growth. The public sector economic impact of two of the proposed projects, and private sector impact of six of the projects is not known.
110

A study by the National Governors Association provides several general comments about safety and economic benefits of using electronic methods to streamline motor carrier operations. The first is that the participation of the motor carrier industry is very important to maximize the benefits obtained from the application of advanced technologies. Second, when designing and deploying new systems, states should use that opportunity to change or modify their regulatory processes to increase economic benefits from the new system. The third consideration is that interstate cooperation on the deployment of advanced technologies for evo maximizes motor carrier participation rates and reduces per-state investments. The fourth has to do with incentives, such as discounts on motor carrier fees for carriers that use electronic credentialing, which will encourage more rapid participation in the state programs by the motor carrier industry (87).
111

Table 7-3. Qualitative Assessment of Each Proposed Project
Project
1. SIDS deployment
2. Motor carrier targeting system
3. Automation of roadside safety inspections
4. Upgrading of designated weighing areas
5. Use ofWIM and AVC devices for enforcement
6. Statewide incident management system
7. Implementation of one-stop shopping
8. Technology user training program
9. Implementation of information systems
10. Share-the-road campaign
11. Creation of special task force
12. Electronic clearance at the T exas-Mexico border
./ PublIc sector * Private sector
Safety Impact Economic Impact
Positive Negative Not Positive Negative Not known known
./ * ./*
./ * ./ *
* ./ ./*
./ * ./ *
./* ./ *
./* ./*
./* ./*
./* ./ *
* ./ ./*
./* ./*
./* ./*
./* ./*
112

8.0 REFERENCES
1. Tsai, Joe, A VION--Automatic Vehicle Identification, Proceedings International Road Federation Conference and Exposition, Vol. 5,pp. C27-C35. Calgary,Alberta. July 3-7, 1994.
2. Strategic Plan for Intelligent Vehicle-Highway Systems in the United States, u.s. Department of Transportation/ITS America, Washington, D.C., May 1992.
3. Commercial Vehicle Information Systems Network (CVISN) Statement of Direction, U.S. Department of Transportation/The Johns Hopkins University Applied Physics Laboratory, Washington, D.C., November 1995.
4. Grenzeback, Lance, Colman, Carol, and Kaliski, John, Systems Planningfor Automated Commercial Vehicle Licensing and Permitting Systems: ITS/CVO Program Requirements, Report Number FHWA-RD-96-126, Cambridge Systematics, Inc., Cambridge, Massachusetts. July 1997.
5. Simmons, Lee, The National ITS Architecture: A Framework for ITS Infrastructure, Public Roads, pp. 15-17, September/October 1997.
6. National ITS Program Plan, U.S. Department of Transportation/ITS America, First Edition, pp. 186-187, Washington, D.C., March 1995.
7. Abbasi, M. F., "Intelligent Transportation Systems Initiatives for Commercial Vehicle Safety Enhancement in the U.S.," Global Deployment of Advanced Transportation Telematics/ITS: A New Era of Mobility and Safety, 29th International Symposium on Automotive Technology and Automation, pp. 317-325. Florence, Italy, June 1996.
8. Booz-Allen & Hamilton Inc., et aI., "COVE Study Final Report and Implementation Plan, Overcoming CVO Institutional Barriers: Recommended Action," Texas Report, July 1994.
9. Science Applications International Corporation, IVHS Institutional Issues and Case Studies: Analysis and Lessons Learned, Federal Highway Administration, Washington, D.C., 1994.
10. Maze, Tom, et aI., "Interstate Cooperation for Implementing ITS in Commercial Vehicle Operations: Institutional Opportunities and Barriers," Iowa State University Center for Transportation Research and Education, Ames, Iowa, March 1996.
113

11. U. S. Department of Transportation, Intelligent Transportation Systems (ITS)Projects Book, Federal Highway Administration Report No. FHWA-JPO-97-007, Washington, D.C., January 1997.
12. CVISN Meant to Improve Information Sharing and Safety, Venture Newsletter, ITS Washington, University of Washing toni Washington State Department of Transportation, Seattle, Washington, July 1997.
13. U.S. Department of Transportation, Federal Highway Administration, ITS/CVa Technologies Model Deployment: What is CVISN?, Fact Sheet, December 1996.
14. The ITS/CVa Mainstreaming Program, U.S. Department of Transportation, Federal Highway Administration FHWA-JPO-97-012, Washington, D.C., 1996.
15. ITS/CVa Mainstreaming Fact Sheet, http://www.avalon-ais.comlitscvo/mainfct.htm.
16. U.S. Department of Transportation, Federal Highway Administration, ITS/CVa Business Plans, ITS/CVO Mainstreaming News, Washington, D.C., spring 1997.
17. Cambridge Systematics, Inc. and Ziifle Consulting, Inc. "Minnesota Guidestar CVO Business Plan Needs Assessment," Minnesota Department of Transportation, Cambridge, Massachusetts, April 1995.
18. Minnesota Department of Transportation and Minnesota Department of Public Safety, "Minnesota CVISN Project Plan," Minnesota Guidestar, June 1997.
19. Sannes, Scott, and Erickson, Cathy, "Minnesota Commercial Vehicle Operations Process Reengineering: Fixing the Process Before Automation," Intelligent Transportation: Realizing the Benefits, Proceedings of the ITS America 1996 Annual Meeting, Vol. 2, pp. 772-776, ITS America, Houston, Texas, April 1996.
20. Kentucky Department of Transportation, "Kentucky ITS/CVO Business Plan," October 1997.
21. JHK and Associates DBA, "Washington State Commercial Vehicle Operations Strategic Plan," Washington Department of Transportation, Seattle, Washington, June 1997.
22. Parsons Brinckerhoff Farradyne Inc. and JHK and Associates, "Southern California Priority Corridor ITS Strategic Deployment Plan: Commercial Vehicle/Border Crossing Element--preliminary draft," Southern California Intelligent Transportation System Priority Corridor Steering Committee, July 1997.
114

23. Committee for the Truck Weight Study, "Truck Weight Limits: Issues and Options," Transportation Research Board Record 225, pp. 135-144, Washington, D.C., 1990.
24. National Cooperative Highway Research Program Synthesis 68: "Motor Vehicle Size and Weight Regulations, Enforcement, and Permit Operations," Transportation Research Board, National Research Council, Washington, D.C., April 1980.
25. Texas Transportation Institute, "Preliminary Implementation Review of the Motor Carrier Safety Assistance Program for Texas," Department of Public Safety, Austin, Texas, November 1985.
26. National Cooperative Highway Research Program Synthesis 82: Criteriafor Evaluation of Truck Weight Enforcement Programs, Transportation Research Board, National Research Council, Washington, D.C., November 1982.
27. Grenzeback, L.R., Stowers J.R., and Boghani A.B., National Cooperative Highway Research Program Synthesis 303: Feasibility of a National Heavy- Vehicle Monitoring System, Transportation Research Board, National Research Council, Washington, D.C., December 1988.
28. Comptroller General of the United States, "Excessive Truck Weight: An Expensive Burden We Can No Longer Support," Washington, D.C., 1979.
29. Thygesen C.E., Khalil S.M., Bedi, LS., and Keown, L.L., "Alberta's Weight Enforcement Program and Its Impact on Pavement Costs," Proceedings of the Second International Symposium on Heavy Vehicle Weights and Dimensions, Vol. 2, Kelowna, British Columbia, June 8 to 22, 1989.
30. United States Department of Transportation Federal Highway Administration, "Overweight Vehicles-Penalties and Permits: An Inventory of State Practices for Fiscal Year 1992," Report No. FHWA-MC-94-014,U.S. Department of Transportation, Federal Highway Administration, March 1994.
31. Fekpe, Edward S.K., Truck Safety Regulations and Enforcement, Proceedings of the International Large Truck Safety Symposium, pp. 317-325, The University of Tennessee Transportation Center, Knoxville, Tennessee, October 1997.
32. Weppner, Matthew and Alexander, Paul, "Automated Roadside Inspection Feasibility Study for Commercial Motor Vehicles," Intelligent Transportation: Realizing the Benefits, Proceedings of the ITSAmerica 1996 Annual Meeting, Vol. 2, pp. 777-781, ITS America, Houston, Texas, April 1996.
115

33. Fekpe E., Clayton A., and AlfaA., "Aspects of Performance of Truck Weight Stations," Canadian Journal of Civil Engineering, Vol. 20, No.3, pp. 380-385, 1993.
34. IBI Group, "Behavioural and Economic Factors Which Affect Compliance with Trucking Regulations," The Transportation Technology and Energy Branch, Ontario Ministry of Transportation and Communications, Report No. TRE-83-01, July 1983.
35. Jessup, Eric, and Casavant, Kenneth, "Evaluation of Violation and Capture of Overweight Trucks: A Case Study," Washington State Department of Transportation Report No. WA-RD 353.4, July 1996.
36. Walton, Michael, and Yu, Chien-Pei, "Truck Size and Weight Enforcement: A Case Study," Transportation Research Record 920, Transportation Research Board, National Academy of Sciences, Washington, D.C., 1983.
37. Euritt, M.A. Economic Factorsfor Developing Fine Structuresfor Overweight Vehicles in Texas. Transportation Research Record 1116, Transportation Research Board, National Research Council, Washington, D.C., 1987.
38. Montufar, Jeannette, and Clayton, Alan, "Heavy Truck Accidents and the National Safety Code in Manitoba," Department of Civil Engineering University of Manitoba/Transport Canada, July 1997.
39. Moses, Leon, and Savage, Ian, "A Cost-Benefit Analysis of US Motor Carrier Safety Programmes," Journal o/Transport Economics and Policy, Vol. 31, No.1, pp. 51-67, January 1997.
40. Clayton, Alan et aI., "Analysis of the Truck Inventory and Use Survey from the Truck Size and Weight Perspective for Trucks with Five Axles or More" (Report No.2), U.S. DOT Comprehensive Truck Size and Weight Study, February 1996.
41. Montufar, Jeannette, "Trucking and Size and Weight Regulations in the Mid-Continent Corridor," Master of Science Thesis, Department of Civil and Geological Engineering, University of Manitoba, November 1996.
42. Truck Inventory and Use Survey, Texas State Report, 1992 Census of Transportation, May 1994.
43. 1993 Commodity Flow Survey Texas State Report, 1992 Census of Transportation, Communications, and Utilities, July 1996.
116

44. Hancock, Michael, Maze, T.H., and Waggoner, Kathleen, Multi-State Applications of Intelligent Transportation Systems for Commercial Vehicle Operation. Transportation Quarterly Vol. 50, No.1, pp. 125-130, Eno Transportation Foundation, Inc., Lansdowne, Virginia, Winter 1996.
45. Middleton, D.R., Rowe, J., Chlubiski, V., Lalk, T., Jasek, D., and Koppa, R, "Assess the Feasibility of a Standardized Electronic Diagnostic Device for Maintenance and Inspection of Commercial Motor Vehicles," U. S. Department of Transportation Federal Highway Administration, Washington, D.C., April 1995.
46. American Society of Civil Engineers, Accommodation of Trucks on the Highway: Safety in Design, New York, May 1988.
47. Slater, Rodney, The National Highway System: A Commitment to America's Future, Public Roads, pp. 3-6, U.S. Department of Transportation Federal Highway Administration, Washngton, D.C., Spring 1996.
48. Ms. Kim Hajek, Director of data management, Texas Department of Transportation Planning and Programming Division, May 7, 1998.
49. Texas Transportation Code Section 623.011, "Permit for Excess Axle or Gross Weight,''Texas Administrative Code, Austin, Texas, 1996.
50. Texas Department of Public Safety, "How to Achieve a Satisfactory Safety Rating," Texas Department of Public Safety, Austin, Texas, March 1996.
51. 1.1. Keller and Associates, Inc., "Federal Motor Carrier Safety Regulations Handbook," U.S. Department of Transportation Federal Highway Administration, Washington, D.C., August 1997.
52. Major Lester Mills, Hazardous Material Coordinator, Texas Department of Public Safety License and Weight Division, Austin, Texas, March and April 1998.
53. Personal interview with officer Roscoe Mason, Department of Public Safety Region 6 in Bryan, Texas, Friday, March 13, 1998.
54. Telephone interview with Captain Manuel Padilla, California Highway Patrol, Commercial Vehicle Enforcement Division, April 8, 1998.
55. Telephone interview with Captain Ernesto Pinon, New Mexico Department of Taxation and Revenue, Motor Transport Division Enforcement Bureau, April 8, 1998.
117

56. Battelle Memorial Institute, "Highway Cost Allocation Study," U.S. Department of Transportation Federal Highway Administration, Washington, D.C., 1997.
57. Texas Transportation Institute, "Preliminary Implementation Review of the Motor Carrier Safety Assistance Program for Texas," Department of Public Safety, Austin, Texas, November 1985.
58. Texas Transportation Code Section 621.401, "Enforcement," Texas Administrative Code, Austin, Texas, 1996.
59. Personal interview with Mr. Monty Chamberlain, Texas Department of Transportation Motor Carrier Division, Central Permit Office, December 1997.
60. Personal interview with Ms. Claudia Woods, Chief of Registration, Vehicle Titles, and Registration Division, January 30, 1998.
61. Texas Transportation Code Section 502 Subchapter D, "Registration Procedures and Fees," Texas Administrative Code, Austin, Texas, 1996.
62. Texas Department of Transportation Vehicle Titles and Registration Division, "1998 Apportioned Registration Instruction Manual Under the International Registration Plan," Austin, Texas, January 1998.
63. Texas Department of Transportation Vehicle Titles and Registration Division, "Summary of Reciprocity Agreements Between Texas and Other Jurisdictions," Austin, Texas, Revised April 1997.
64. Texas Department of Transportation, Transportation News, Vol. 22, No.5, Texas Department of Transportation, Austin, Texas, January 1997.
65. Provincial Treasury, Prince Edward Island, "International Fuel Tax Agreement," http://www.cbsc.org/pei/bis/5178.html, October 1997.
66. Sharp, John, "International Fuel Tax Agreement," Texas Comptroller of Public Accounts, http://www.window.state.tx.us/taxinfo/taxpages/ifta.html.
67. Personal interview with Mr. Kirk Davenport, Texas Comptroller of Public Accounts, Austin, Texas, January 1998.
68. Texas Department of Transportation Vehicle Titles and Registration Division, "General Information Covering Commercial Vehicle Operation in Texas," Austin, Texas, Revised January 1996.
118

69. Texas Transportation Code Section 623, "Permits for Oversize or Overweight Vehicles," Texas Administrative Code, Austin, Texas, 1996.
70. Personal interview with Mr. Monty Chamberlain, Central Permit Office, Texas Department of Transportation, Motor Carrier Division, Austin, Texas, April 20, 1998.
71. Crabtree, Joe, Advantage 1-75 Prepares to Cut Ribbon on Electronic Clearance, Public Roads, pp. 16-21, U. S. Department of Transportation, Federal Highway Administration, Washington, D.C., 1995.
72. Pigman, Jerry, IVHS Applications to Commercial Vehicle Safety. Transportation Congress Vol. 1, pp. 268-274. American Society of Civil Engineers, New York, 1995.
73. . Science Applications International Cooperation, Final Report IVHS Institutional Issues and Case Studies, Advantage 1-75 Case Study, Volpe National Transportation Systems Center, U.S. Department of Transportation, Federal Highway Administration, Washington, D.C., 1994.
74. Hill, Christopher, Heavy Vehicle Electronic License Plate (HELP) Program Final Report, Castle Rock Consultants/U.S. DOT Federal Highway Administration, Washington D.C., September 1993.
75. Heald, Kenneth, and Nix, Fred, IVHS and Motor Carrier Productivity. Paper presented at the Transportation Research Board Committee A1B04. Washington, D.C., January 1994.
76. King, Roger. Oregon Gives TransCore 'Green Light' to Bypass, Transport Topics, pp. 35, American Trucking Association, Washington, D. C., September 22, 1997.
77. Brown, Candace, Gau Betty, and Horn Richard, ITS/CVO Cross-Border Strategic Plan, Volpe National Transportation Systems Center, Cambridge, Massachusetts, July 1996.
78. U.S. Department of Transportation, Federal Highway Administration, International Border Electronic Clearance (IBEX) Project Overview, ITS Operational Test Program, February 1996.
79. ITS America Commercial Vehicle Operations (CVO) Technical Committee. Northwest States Form MAPS Program for Preclearance, ITS America CVO Update, p. 2, Fall 1996.
80. U.S. Department of Transportation Federal Highway Administration, Office of Motor Carriers, SAFER Report, Vol. 1, No.1, Washington, D.C., Winter 1996.
119

81. Safety and Fitness Electronic Records System (SAFER), http://www.safersys.org/.
82. Allemeier, Randall, Out-ol-Service Vehicle Field Operational Test at the East Boise, Idaho Port of Entry, Idaho National Engineering Laboratory, Idaho Falls, Idaho. http://www.inel.gov/capabilities/transportation/oos.html.
83. The ATA Foundation, Assessment of Intelligent Transportation Systems/Commercial Vehicle Operations (ITS/CVO) User Services Qualitative Benefit/Cost Analysis, Federal Highway Administration Report No. FHWA-MC-96-028, Washington, D.C., August 1996.
84. Nozick, Linda, and Turnquist, Mark, "An Electronic Permitting Issuance System for Oversize/Overweight Vehicles," presented at the Transportation Reseach Board meeting, Washington, D.C., January 1998.
85. Apogee Research, Inc., Budgetary Implications ofITS/CVO for State Agencies, National Governors Association/Federal Highway Administration, Washington, D.C., February 1998.
86. Intelligent Transportation Systems Real World Benefits, Appogee/Hagler Bailly, Report Number FHW A-JPO-98-0 1 0, prepared for FHW A Intelligent Transportation Systems Joint Program Office, FHWA, Department of Transportation, Washington, D.C., January 1998.
87. Rubel, Thorn, State Fiscal Implications of Intelligent Transportation Systems/Commercial Vehicle Operations Deployment, National Governors Association, Washington, D.C., 1998.
120

9.0 APPENDIX MOTOR CARRIER SURVEY QUESTIONNAIRE


Motor Carrier Survey Questionnaire
General Company Issues Discussed
• Type of operation (TL vs L TL)
• Just-in-time component of operation
• Coverage area (where to where)
• Number of trips per day
• Average distance covered per trip
• Major commodities hauled
• What percentage of the trips require special permits?
• Fleet characteristics (number of tractors and trailers, body types, semitrailer lengths)
• Company characteristics (number of drivers by type--company drivers vs. owner operators)
ITs-cva Discussion Topics
• General knowledge about ITS applied to CV 0
• Importance of technology to company's operations?
• What advanced technologies is the company currently using? - transponders, onboard computers, global positioning systems, automatic toll cards, others
• Are advanced technologies being used for fleet management purposes? - used to find the location of a vehicle, or how a driver has loaded the truck (generally where a truck is not weighed before a trip).
• How attractive is the use of advanced technologies for one-stop shopping and why? -vehicle registration, permitting, mileage information report for fuel tax purposes - all at the same location.
• How much time do you usually spend at weigh scales in Texas either being weighed or inspected?
123

• What is the cost associated with having to stop at scales?
• How important would it be for the company to make use of transponders for scale bypass? (economically and in terms of just-in-time deliveries)
• Do you see any benefits in using transponders?
• In the case of Texas, do you see any benefits in the application of ITS to evo for purposes of preclearance?
• When and if these technologies are introduced, would the company be willing to pay a flat rate to equip the vehicles with transponders? - for preclearance purposes
• Do you think that ITS leads to productivity gains or cost savings? - how?
• If other states decide to apply ITS to their evo they may require transponders. Do you think that this will become a problem for your company? (Since a lot of those trucks will be able to bypass the scales and the only trucks that will be weighed and inspected will be, for the most part, those without transponders.)
• In general, what do you think are the benefits of applying ITS to evo?
• What type of information would you like to obtain from using ITS for your operations? Location of vehicles, axle weights, gross vehicle weight, mileage data (for IRP and IFTA), etc.
• Do you have any concerns regarding the privacy of data collected by transponders?
Much of the work related to ITS-eVO is being done to achieve the idea of seamless borders, however, there are many issues that have to be overcome before seamless borders can be achieved.
• What do you think needs to be done to achieve seamless borders?
• What do you think TxDOT should do to help you improve your operations?
• What do you think TxDOT should do to help improve the safety and productivity of carriers that operate in the state of Texas?
124