development of a standards-based traceability system for
TRANSCRIPT

Graduate Theses and Dissertations Iowa State University Capstones, Theses and Dissertations
2019
Development of a standards-based traceability system for the Development of a standards-based traceability system for the
U.S. grain and feed supply chain U.S. grain and feed supply chain
Richa Sharma Iowa State University
Follow this and additional works at: https://lib.dr.iastate.edu/etd
Part of the Agriculture Commons, Bioresource and Agricultural Engineering Commons, and the Food
Science Commons
Recommended Citation Recommended Citation Sharma, Richa, "Development of a standards-based traceability system for the U.S. grain and feed supply chain" (2019). Graduate Theses and Dissertations. 17780. https://lib.dr.iastate.edu/etd/17780
This Dissertation is brought to you for free and open access by the Iowa State University Capstones, Theses and Dissertations at Iowa State University Digital Repository. It has been accepted for inclusion in Graduate Theses and Dissertations by an authorized administrator of Iowa State University Digital Repository. For more information, please contact [email protected].

Development of a standards-based traceability system for the U.S. grain and feed supply
chain
by
Richa Sharma
A dissertation submitted to the graduate faculty
in partial fulfillment of the requirements for the degree of
DOCTOR OF PHILOSOPHY
Major: Agricultural and Biosystems Engineering
Program of Study Committee:
Charles R. Hurburgh, Major Professor
Gretchen A. Mosher
Dirk E. Maier
Mack C. Shelley
Bobby J. Martens
The student author, whose presentation of the scholarship herein was approved by the program
of study committee, is solely responsible for the content of this dissertation. The Graduate
College will ensure this dissertation is globally accessible and will not permit alterations after a
degree is conferred.
Iowa State University
Ames, Iowa
2019
Copyright © Richa Sharma, 2019. All rights reserved.

ii
DEDICATION
I dedicate my dissertation work to my family and friends. A special mention to my parents
for their blessings and words of encouragement that helped me achieve my goals. My father
Ramesh and my mother Pushpa taught me the skills to create a balance in life and always strive
for the best. Also, my sister Tanya never left my side and have been a constant source of my
strength.
I also dedicate this dissertation to my husband and his family who have supported me
throughout the process. I will always appreciate their patience and their constant effort of being
in touch even after being thousands of miles away from me, especially my mother-in-law
Neelam Sharma. A special mention to my husband, Eeshan who has motivated me throughout
my doctoral degree and provided me with love and care. I am truly blessed to have a family like
this, and my dissertation is dedicated to them.

iii
TABLE OF CONTENTS
ACKNOWLEDGMENTS ...............................................................................................................v
ABSTRACT ................................................................................................................................... vi
CHAPTER 1. GENERAL INTRODUCTION ................................................................................1 1.1 Problem statement ............................................................................................................... 2 1.2 Objectives ............................................................................................................................ 3
1.3 Dissertation outline .............................................................................................................. 3 1.4 Practical implications .......................................................................................................... 4 1.5 References ........................................................................................................................... 4
CHAPTER 2. A LITERATURE REVIEW: BULK PRODUCT TRACEABILITY-
CHALLENGES AND OPPORTUNITIES ....................................................................................10 2.1 Abstract .............................................................................................................................. 10 2.2 Challenges to bulk product traceability ............................................................................. 11
2.3 Defining traceability for bulk products ............................................................................. 14 2.4 Drivers for bulk product traceability ................................................................................. 15
2.5 Characteristics of bulk product traceability ....................................................................... 16 2.6 Barriers to bulk product traceability .................................................................................. 18 2.7 State of the art and descriptive measures for bulk product traceability system................. 19
2.8 Advances in bulk product traceability ............................................................................... 24 2.9 Future of bulk product traceability .................................................................................... 31
2.10 References ....................................................................................................................... 33
CHAPTER 3. DEVELOPING METHODS, GUIDELINES, BEST PRACTICES AND
TERMINOLOGY SUPPORTING MULTIPLE TRACEABILITY OBJECTIVES IN THE
GRAIN SUPPLY CHAIN .............................................................................................................36
3.1 Abstract .............................................................................................................................. 36 3.2 Introduction ....................................................................................................................... 37 3.3 Bulk grain supply chain ..................................................................................................... 40
3.4 Traceability objectives ....................................................................................................... 43 3.5 Methodology ...................................................................................................................... 45 3.6 Results ............................................................................................................................... 46
3.7 Conclusions ....................................................................................................................... 59
3.8 References ......................................................................................................................... 61
CHAPTER 4. MODELING A TRACEABILITY SYSTEM FOR THE SOYBEAN SUPPLY
CHAIN USING CRITICAL TRACEABILITY EVENTS AND KEY DATA ELEMENTS IN
ARGOUML ...................................................................................................................................66 4.1 Abstract .............................................................................................................................. 66 4.2 Introduction ....................................................................................................................... 67
4.3 Critical traceability events and key data elements ............................................................. 70 4.4 Methodology ...................................................................................................................... 75 4.5 Results ............................................................................................................................... 78

iv
4.6 Conclusions ....................................................................................................................... 83 4.7 References ......................................................................................................................... 84
CHAPTER 5. VULNERABILITY ANALYSIS USING EVIDENCE-BASED TRACEABILITY
IN THE GRAIN SUPPLY CHAIN ...............................................................................................86 5.1 Abstract .............................................................................................................................. 86 5.2 Introduction ....................................................................................................................... 87 5.3 Evidence-based traceability system ................................................................................... 89
5.4 Methodology ...................................................................................................................... 95 5.5 Results ............................................................................................................................... 97 5.6 Conclusions ..................................................................................................................... 110 5.8 References ....................................................................................................................... 111
CHAPTER 6. GENERAL CONCLUSIONS ...............................................................................115 6.1 Future Research ............................................................................................................... 117
APPENDIX A. BEST PRACTICES GUIDANCE TEMPLATES .............................................118
APPENDIX B. CODES FOR CTE-KDE MODEL AND OTHER ANALYSIS ........................131

v
ACKNOWLEDGMENTS
I would like to thank my major professor Dr. Charles R. Hurburgh for his valuable
guidance, advice, patience and encouragement throughout my doctoral program. His incredible
experience inspired me to think out of the box in facets of both personal and professional life. I
am equally thankful to my committee members, Dr. Gretchen A. Mosher, Dr. Dirk E. Maier,
Dr. Mack C. Shelley, Dr. Shweta Chopra and Dr. Bobby J. Martens for their constructive
feedback, support and contribution towards my success in my doctoral program of study.
In addition, I would also like to thank my friends and colleagues at the Grain Quality
Laboratory for making my time at Iowa State University a wonderful experience.
A special thanks to Evan K. Wallace, Frank H. Riddick and Simon P. Frechette from
National Institute of Standards and Testing (NIST) for the project and providing required
resources.

vi
ABSTRACT
Traceability in the U.S. grain and feed supply chain is complicated by comingling and re-
division of grain lots across the supply chain. Present traceability practices support the regulatory
“one step forward, one step backward” approach, but fails to identify the multiple interactions
among farmer, elevator, processor, end-user and consumer. Several regulatory agencies in the
United States and worldwide have set rules and requirements for implementation of traceability
in the food supply chain.
This dissertation used a template-method approach to develop guidance templates for
facilitating traceability objectives throughout the grain supply chain. Also, a glossary of
terminology related to traceability in the grain supply chain was developed to create standardized
understanding among grain traceability participants. Next a system design modeling approach
was used to simplify multiple networks in a grain supply chain example which identifies critical
traceability events and key data elements for achieving one or more traceability objectives. The
model uses ArgoUML, which is a web-based unified modeling software that models
informational elements (or attributes) in a way that can be easily converted to software programs.
Finally, vulnerability of the traceability system was evaluated determining how and when the
traceability of a grain supply chain system gets affected. A vulnerability analysis model
identifies, quantifies, and prioritizes various factors responsible for reducing the efficacy of a
system. Vulnerability analysis measures system attributes (data) related to: (i) frequency of
occurrence; (ii) degree of impact of occurrence; and (iii) likelihood of detection. The
vulnerability method can be used as a standard method for evaluating how and when traceability
would fail and such an analysis would highlight processes that may compromise traceability in a
bulk grain supply chain.

1
CHAPTER 1. GENERAL INTRODUCTION
Traceability systems are an essential tool to track inputs and outputs throughout the
manufacturing chain (Dickinson & Bailey, 2003). Traceability has gained importance over the
past few years because of increase in food safety issues and consumer awareness. The United
States Public Health Security and Bioterrorism Preparedness and Response Act of 2002 requires
all food and feed companies to self-register with the Food and Drug Administration (FDA) and
document information necessary for traceability (FDA, 2002). Documentation of traceability
information may become a difficult task for complex supply chains such as the bulk grain supply
chain. A traceability system is needed to strategically record information and events. Bulk grain
supply chain includes farmer, grain elevator, processor, feed mill, other end consumers, each
participant follow various operations or events that may be critical to traceability. There is a need
of standard terminology and guidance to facilitate ease of application of a traceability system in
the bulk grain supply chain.
Traceability aids in minimizing errors across the supply chain, and in preventing faults
from being carried through to the last customer. Traceability is multi-dimensional, with several
objectives:
(i) address food safety and quality issues,
(ii) document chain of custody,
(iii) meet regulatory compliance,
(iv) record sustainability,
(v) ensure fair trade practices,
(vi) meet customer demand,
(vii) strengthens supply chain linkages.

2
Previous studies in the past have focused on physical identification, record keeping,
auditing, process optimization, and use of information (Henson & Reardon, 2005; Storoy,
Thakur, & Olsen, 2013; Sundstrom, Williams, van Deynze, & Bradford, 2002). Traceability is
supported by government regulations and international standards, many of which are individual
country or market sector specific. To varying degrees grain supply chain participants, follow
standards and regulations like; HACCP, ISO 22000, Food Safety Modernization Act,
Bioterrorism Act of 2002, EU Standard (183/2005), and a variety of private standards or schema.
Collectively these efforts partially support the traceability objectives.
The ISO 22000:2005 standard specifically addresses the framework for establishing a
traceability system for food business operators, which includes- (i) identifying method for lot
identification; (ii) locating ingredient usage; and (iii) maintaining delivery records (Bosona &
Gebresenbet, 2013; Dabbene, Gay, & Tortia, 2014). Additionally, some of the sections in the
ISO 22000:2018 address traceability components under section 7.5.3 which requires any
food/feed establishment to effectively document production activities, and section 8.5 provides
guidelines on Hazard analysis and section 8.4 on emergency preparedness or risk management,
which are subsets of an implementable traceability system. Additionally, section 8.3 of the ISO
22000:2018 standard provides requirements on developing a traceability system. Though the ISO
22000:2018 addresses some of the traceability objectives in various sections, it fails to develop a
concrete stepwise methodological traceability framework. There is a need to develop harmonized
methods and guidelines for application of traceability in the grain supply chain for adoption of a
stepwise methodology achieving traceability objectives.
1.1 Problem statement
Performing standardized operations in the bulk grain supply chain is a complex task.
Prior literature suggests requirements for developing food traceability systems but there is lack

3
of available research on standard methods on addressing exact traceability needs. Moreover, for
bulk supply chain participants, application of food traceability systems becomes a complex task
because of multiple terminology. It is essential to develop a standard traceability methodology
for facilitating ease of understanding among bulk supply chain participants. One of the most
important needs is to develop a standard method for implementation of traceability and
identifying which traceability objectives were achieved. Another important need are to create a
traceability model identifying events which are critical and the data elements necessary for
achieving these traceability objectives. Also, determining vulnerability of an implemented
traceability system will create a more robust traceability system. The needs mentioned above
form the objectives of this study.
1.2 Objectives
The primary objective of this research was to develop a standards-based traceability
system for the United States feed and grain supply chain. A standards-based traceability system
was achieved under three sub-objectives, as shared in the next section.
1.3 Dissertation outline
This dissertation consists of four articles focused on developing a traceability system for
bulk grain supply chain participants. The research study fulfills the following objectives:
(i) Develop methods, guidelines, best practices, and terminology supporting multiple
traceability objectives in the grain supply chain (Chapter 3).
(ii) Model a traceability system for the soybean supply chain using critical traceability events
and key data elements in ArgoUML (Chapter 4).
(iii) Undertake a vulnerability analysis using evidence-based traceability in the grain supply
chain (Chapter 5).

4
1.4 Practical implications
The results of this dissertation include (i) guidance templates specific to each grain
supply chain participant carrying information needed for achieving traceability objectives; (ii) a
critical traceability event and key data element (CTE-KDE) model illustrating requirements for
both internal and external traceability across the grain supply chain; and (iii) vulnerability
analysis of the critical traceability events and key data elements model determining
mathematically how and when traceability is compromised. The CTE-KDE model developed in
this research provides information on events that are critical for traceability and lists the
mandatory data elements that are necessary for achieving traceability. Also, this model is
convertible to extensible markup language (XML) which serves as an interface for conversion to
a software program. The output from this model can be used by software developers to identify
which data elements are necessary to be included in an effective traceability system. Again, this
model can be applied for various other bulk products. The vulnerability analysis of an evidence-
based CTE-KDE traceability framework accounts for complex interactions among supply chain
participants critical activities. The need for standard measures of evaluating traceability systems
is clear. Such analysis must restrict CTE to be measurable events and key data elements to
measurable system attributes. The output from the vulnerability analysis creates a ranking for
various CTEs for identifying the most vulnerable CTE. Such an analysis pre-alerts the
practitioner to devise corrective and preventive actions for highly vulnerable CTEs in advance.
1.5 References
Alex Marvin, W., Schmidt, L. D., Benjaafar, S., Tiffany, D. G., & Daoutidis, P. (2012).
Economic Optimization of a Lignocellulosic Biomass-to-Ethanol Supply Chain. Chemical
Engineering Science. https://doi.org/10.1016/j.ces.2011.05.055
Arora, P. K., & Bhatia, R. (2018). Agent-Based Regression Test Case Generation using Class
Diagram, Use cases and Activity Diagram. Procedia Computer Science.
https://doi.org/10.1016/j.procs.2017.12.096

5
Bosona, T., & Gebresenbet, G. (2013). Food traceability as an integral part of logistics
management in food and agricultural supply chain. Food Control.
https://doi.org/10.1016/j.foodcont.2013.02.004
Complak, W., Wojciechowski, A., Mishra, A., & Mishra, D. (2011). Use cases and object
modelling using ArgoUML. Lecture Notes in Computer Science (Including Subseries
Lecture Notes in Artificial Intelligence and Lecture Notes in Bioinformatics).
https://doi.org/10.1007/978-3-642-25126-9_35
Cua, K. O., McKone, K. E., & Schroeder, R. G. (2001). Relationships between implementation
of TQM, JIT, and TPM and manufacturing performance. Journal of Operations
Management. https://doi.org/10.1016/S0272-6963(01)00066-3
Dabbene, F., Gay, P., & Tortia, C. (2014). Traceability issues in food supply chain management:
A review. Biosystems Engineering. https://doi.org/10.1016/j.biosystemseng.2013.09.006
Davison, J., & Bertheau, Y. (2008). The theory and practice of European traceability regulations
for GM food and feed. Cereal Foods World. https://doi.org/10.1094/CFW-53-4-0186
Diallo, T. M. L., Henry, S., & Ouzrout, Y. (2016). Effective Use of Food Traceability in Product
Recall. In Advances in Food Traceability Techniques and Technologies: Improving Quality
Throughout the Food Chain. https://doi.org/10.1016/B978-0-08-100310-7.00014-4
Dickinson, D. L., & Bailey, D. (2003). Willingness to pay for information: Experimental
evidence on product traceability from the U.S.A., Canada, the U.K., and Japan. Journal of
Agricultural and Applied Economics.
Eaton, D.L.and Groopman, J. D. (1994). The Toxicologyof Aflatoxins. Academic Press, New
York.
Economic Research Service. (2018). USDA ERS - Food Security in the U.S.
Farley, Amanda J. Feaster,Dennis Schapmire, Tara J D’Ambrosio, Josoph Bruce, LeAnn EC.
Shawn Oak, S. and B. K. S. (2009). The Challenges of Implementing Evidence Based
Practice: Ethical Considerations in Practice, Education, Policy, and Research. Social Work
& Society.
Food and Drug Administration - FDA. (2002). Public Health Security and Bioterrorism
Preparedness and Response Act of 2002. Public Law.
Fritz, M., & Schiefer, G. (2009). Tracking, tracing, and business process interests in food
commodities: A multi-level decision complexity. International Journal of Production
Economics. https://doi.org/10.1016/j.ijpe.2008.10.015
Golan, E., Krissoff, B., Kuchler, F., Calvin, L., Nelson, K., & Price, G. (2004). Traceability in
the U . S . Food Supply : Economic Theory and Industry Studies Library Cataloging
Record. Economic Theory.

6
Gong, Y. Y., Turner, P. C., Hall, A. J., & Wild, C. P. (2008). Aflatoxin exposure and impaired
child growth in West Africa: An unexplored international public health burden. In
Mycotoxins: Detection Methods, Management, Public Health and Agricultural Trade.
Gwirtz, J. A., & Garcia-Casal, M. N. (2014). Processing maize flour and corn meal food
products. Annals of the New York Academy of Sciences. https://doi.org/10.1111/nyas.12299
Henson, S., & Reardon, T. (2005). Private agri-food standards: Implications for food policy and
the agri-food system. Food Policy. https://doi.org/10.1016/j.foodpol.2005.05.002
Herrman, T., & Thomasson, J. A. (2011). Grain traceability and its role in food safety. Cereal
Foods World. https://doi.org/10.1094/CFW-56-4-0157
Hobbs, J. E. (2004). Information asymmetry and the role of traceability systems. Agribusiness.
https://doi.org/10.1002/agr.20020
Hu Jong, I. (2007). Development of gap and traceability system for greening the food chain in
Taiwan. Extension Bulletin - Food & Fertilizer Technology Center.
ISO 22000. (2007). In ISO 22000. https://doi.org/10.18356/070e6e4b-en
Jones, P. C., Kegler, G., Lowe, T. J., & Traub, R. D. (2003). Managing the seed-corn supply
chain at Syngenta. Interfaces.
Kärkkäinen, M., Holmström, J., Främling, K., & Artto, K. (2003). Intelligent products - A step
towards a more effective project delivery chain. Computers in Industry.
https://doi.org/10.1016/S0166-3615(02)00116-1
Karlsen, K. M., Dreyer, B., Olsen, P., & Elvevoll, E. O. (2012). Granularity and its role in
implementation of seafood traceability. Journal of Food Engineering.
https://doi.org/10.1016/j.jfoodeng.2012.03.025
Karlsen, K. M., Dreyer, B., Olsen, P., & Elvevoll, E. O. (2013). Literature review: Does a
common theoretical framework to implement food traceability exist? Food Control.
https://doi.org/10.1016/j.foodcont.2012.12.011
Kelepouris, T., Pramatari, K., & Doukidis, G. (2007). RFID-enabled traceability in the food
supply chain. Industrial Management and Data Systems.
https://doi.org/10.1108/02635570710723804
Khlangwiset, P., & Wu, F. (2010). Costs and efficacy of public health interventions to reduce
aflatoxin-induced human disease. Food Additives and Contaminants - Part A Chemistry,
Analysis, Control, Exposure and Risk Assessment.
https://doi.org/10.1080/19440041003677475
Laux, C. M., & Hurburgh, C. R. (2010). Using quality management systems for food traceability.
Journal of Industrial Technology.

7
Letelier, P. (2002). A Framework for Requirements Traceability in UML-Based Projects.
Proceedings of 1st International Workshop on Traceability in Emerging Forms of Software
Engineering.
Lewis, L. C., Bruck, D. J., Prasifka, J. R., & Raun, E. S. (2009). Nosema pyrausta: Its biology,
history, and potential role in a landscape of transgenic insecticidal crops. Biological
Control. https://doi.org/10.1016/j.biocontrol.2008.10.009
Lin, W., Price, G. K., & Allen, E. W. (2003). StarLink: Impacts on the U.S. corn market and
world trade. Agribusiness. https://doi.org/10.1002/agr.10075
Liu, W., Cheng, W., & Zhang, J. (2013). Study on the traceability system establishment of
safety-objective-oriented food logistics supply chain. Advance Journal of Food Science and
Technology. https://doi.org/10.19026/ajfst.5.3297
Liu, Y., & Wu, F. (2010). Global burden of Aflatoxin-induced hepatocellular carcinoma: A risk
assessment. Environmental Health Perspectives. https://doi.org/10.1289/ehp.0901388
Manzouri, M., Nizam Ab Rahman, M., Saibani, N., & Rosmawati Che Mohd Zain, C. (2013).
Lean supply chain practices in the Halal food. International Journal of Lean Six Sigma.
https://doi.org/10.1108/IJLSS-10-2012-0011
McKean, J. D. (2001). The importance of traceability for public health and consumer protection.
OIE Revue Scientifique et Technique. https://doi.org/10.20506/rst.20.2.1280
Medina, A., Akbar, A., Baazeem, A., Rodriguez, A., & Magan, N. (2017). Climate change, food
security and mycotoxins: Do we know enough? Fungal Biology Reviews.
https://doi.org/10.1016/j.fbr.2017.04.002
Mitchell, N. J., Bowers, E., Hurburgh, C., & Wu, F. (2016). Potential economic losses to the US
corn industry from aflatoxin contamination. Food Additives and Contaminants - Part A
Chemistry, Analysis, Control, Exposure and Risk Assessment.
https://doi.org/10.1080/19440049.2016.1138545
Monjardino de Souza Monteiro, D., & Caswell, J. A. (2011). The Economics of Implementing
Traceability in Beef Supply Chains: Trends in Major Producing and Trading Countries.
SSRN Electronic Journal. https://doi.org/10.2139/ssrn.560067
Mora, C., & Menozzi, D. (2008). Benefits of traceability in food markets: Consumers’
perception and action. Food Economics - Acta Agriculturae Scandinavica, Section C.
https://doi.org/10.1080/16507540903034907
Placinta, C. M., D’Mello, J. P. F., & MacDonald, A. M. C. (1999). A review of worldwide
contamination of cereal grains and animal feed with Fusarium mycotoxins. Animal Feed
Science and Technology. https://doi.org/10.1016/S0377-8401(98)00278-8
Rani, S., & Rana, M. (2018). Design of software testing model based on UML class and activity
diagram. International Journal of Engineering and Advanced Technology.

8
Russell, L., Cox, D. F., Larsen, G., Bodwell, K., & Nelson, C. E. (1991). Incidence of molds and
mycotoxins in commercial animal feed mills in seven midwestern states, 1988-1989.
Journal of Animal Science. https://doi.org/10.2527/1991.6915
Sahin, E., Zied Babaï, M., Dallery, Y., & Vaillant, R. (2007). Ensuring supply chain safety
through time temperature integrators. The International Journal of Logistics Management.
https://doi.org/10.1108/09574090710748199
Schmale, D. G. I., & Munkvold, G. P. (2018). Health, Mycotoxins in Crops: A Threat to Human
and Domestic Animal. In The American Phytopathological Society.
Storoy, J., Thakur, M., & Olsen, P. (2013). The TraceFood Framework - Principles and
guidelines for implementing traceability in food value chains. Journal of Food Engineering.
https://doi.org/10.1016/j.jfoodeng.2012.09.018
Sundstrom, F. J., Williams, J., van Deynze, A., & Bradford, K. J. (2002). Identity Preservation of
Agricultural Commodities. In Identity Preservation of Agricultural Commodities.
https://doi.org/10.3733/ucanr.8077
Thakur, M., & Donnelly, K. A. M. (2010). Modeling traceability information in soybean value
chains. Journal of Food Engineering. https://doi.org/10.1016/j.jfoodeng.2010.02.004
Thompson, M., Sylvia, G., & Morrissey, M. T. (2005). Seafood traceability in the United States:
Current trends, system design, and potential applications. Comprehensive Reviews in Food
Science and Food Safety. https://doi.org/10.1111/j.1541-4337.2005.tb00067.x
U.S. FDA. (2017). Party Animal Recalls Dog Food Due To Potential Presence of Pentobarbital.
United States Department of Agriculture Economic Research Service. (2018). USDA ERS -
Background.
USDA. (2013). Grain inspection handbook. Book II, Chapter 4: Corn. In Grain Inspection
Handbook.
USHHS. (2017). Recalls & Alerts.
Van Der Fels-Klerx, H. J., Liu, C., & Battilani, P. (2016). Modelling climate change impacts on
mycotoxin contamination. World Mycotoxin Journal.
https://doi.org/10.3920/WMJ2016.2066
Williams, J. H., Phillips, T. D., Jolly, P. E., Stiles, J. K., Jolly, C. M., & Aggarwal, D. (2004).
Human aflatoxicosis in developing countries: A review of toxicology, exposure, potential
health consequences, and interventions. American Journal of Clinical Nutrition.
Wu, F., Bhatnagar, D., Bui-Klimke, T., Carbone, I., Hellmich, R., Munkvold, G., … Takle, E.
(2010). Climate change impacts on mycotoxin risks in US maize. World Mycotoxin Journal.
https://doi.org/10.3920/WMJ2010.1246

9
Zain, M. E. (2011). Impact of mycotoxins on humans and animals. Journal of Saudi Chemical
Society. https://doi.org/10.1016/j.jscs.2010.06.006
Zhang, J., & Bhatt, T. (2014). A Guidance Document on the Best Practices in Food Traceability.
Comprehensive Reviews in Food Science and Food Safety. https://doi.org/10.1111/1541-
4337.12103

10
CHAPTER 2. A LITERATURE REVIEW: BULK PRODUCT TRACEABILITY-
CHALLENGES AND OPPORTUNITIES
Richa Sharma1; Charles Hurburgh2; Shweta Chopra3; Maitri Thakur4
1Graduate research assistant, Iowa State University; 2Professor, Iowa State University; 3Assistant
Professor, Ohio University; 4Senior Research Scientist, SINTEF
Modified from a manuscript under review in Springer Press
2.1 Abstract
Grains are the second most consumed commodities worldwide, after fruits & vegetables.
In the United States alone, -grain usage has increased by approximately 35% in the last decade.
Forward tracing and backward tracking of bulk grain is becoming of prime importance because
of – food safety regulation, and consumer sensitivity. Traceability aids in minimizing errors
across the supply chain, and in preventing faults from being carried through to the last customer.
Traceability is multi-dimensional, with several objectives:
(i) address food safety and quality issues,
(ii) document chain of custody,
(iii) meet regulatory compliance,
(iv) record sustainability,
(v) protect brand integrity,
(vi) ensure fair trade practices,
(vii) meet customer demand,
(viii) strengthens supply chain linkages.
Previous studies in the past have focused on physical identification, record keeping,
auditing, process optimization, and use of information. Traceability is supported by government
regulations and International standards, many of which are individual country or market sector

11
specific. To varying degrees grain supply chain participants, follow standards and regulations
like; HACCP, ISO 22000, Food Safety Modernization Act, Bioterrorism Act of 2002, EU
Standard (183/2005), and a variety of private standards or schema. Collectively these efforts
partially support the traceability objectives. For example, AACCI has published a comprehensive
guidance to the application of the individual firm-based ISO 22000 Standard in the grain
processing and handling industries.
The analysis of studies, standards and regulations presented in this review demonstrates
the need for a full system traceability framework. Such a system must have measurable attributes
relating to depth, breadth, and precision. This paper briefly describes these attributes in relation
to the grain supply chain and presents potential numeric methodology to evaluate traceability
systems.
This paper also highlights roles and delegation of responsibilities sequentially across the
grain supply chain network. This paper is the background for the design of a full system, internal
and external, traceability system with suggested standards and supporting protocols.
KEYWORDS: traceability, food safety, bulk grains
2.2 Challenges to bulk product traceability
Bulk grains and their processed commodities are major contributors to the US economy.
Export of primary bulk grains- corn, sorghum, barley, and soybean contributed $33 billion in
gross domestic product (GDP) in the year 2016. The efficient management of bulk grain supply
chain is of prime importance because of increasing National and International food safety
regulations. The pressure point for bulk grains and commodities is undifferentiated identification
that complicate traceability. The bulk grain supply chain requires cohesiveness among various
participants: farmer, third party logistic unit, elevator, storage/handling unit, processor, and
distributor. Bulk grains serve as building blocks in various finished and unfinished food

12
products, and major feed ingredient to livestock. Table 1 illustrates the production and usage of
corn, wheat, and soybeans in the United States (1).
Table 1. Production and usage of corn, wheat, and soybeans in the United States for the year (1),
source: USDA, Economic research service- Feed Grains Yearbook (2016/17)
Grain Statistics (1)
(for the year
2016/17)
Corn Wheat Soybean
Production (in metric
tons, MT)
386 MT 223 MT 110.5 MT
Usage as feed/residue
(as % of grain
produced)
69% 20% 70%
Usage as food,
alcohol, and
industrial use
31% 80% 30%
The statistics in table 1 clearly indicates high consumption of corn and soybean as feed,
whereas, wheat is highly consumed by the food industry.
Traceability in the bulk supply chain has been used to improve the good practices in grain
processing, and distribution (10). There are need and drivers for traceability systems in bulk
supply chains. Traceability is understood to be both safety procedure and an integrated concept
for sustainability, technology, and cost optimization. Traceability has evolved from document
management to physical description of custody and events through a supply chain. This creates
challenges for the bulk materials. Traceability is a multi-dimensional activity, and when applied
in a process it enables fulfilment of the following objectives (13):

13
Figure 1. Potential traceability objectives (13)
Product recalls increase attention to traceability. Recently, a major flour miller recalled
wheat flour due to the presence of peanut residues (2). This miller is a supplier to small bakeries,
as well as to major snack food manufacturers. Peanut residue tests had to be conducted through
all products that could have used the affected flour. Producers of donuts and other bakery goods
recalled 710,000 cases of product in the first week of June 2016, after two children suffered
allergic reactions (2). The peanut traces were traced to cross contamination in transportation. The
wheat flour had been delivered through improperly cleaned railcars that previously had carried
peanut meal. The recall took over two months, because of incomplete information from
customers receiving the affected wheat flour. Effective traceability bridges the gaps of
information, ensures good documentation practices, tracks and traces each physical item, to the
best granularity possible, and records changes occurred during any operation. These activities are
more difficult when the inputs (wheat) or the outputs (flour) have not maintained lot identity.
TRACEABILITY
OBJECTIVES
Respond to
security threats Address food
safety & quality
issues
Document chain
of custody
Document
production
activities record
Meet customer
demands
Assess Risk Meet regulatory
compliance Promptness for
addressing new
issues
Address
sustainability,
carbon foot
printing
Brand
Protection

14
2.3 Defining traceability for bulk products
ISO 9000 defines traceability as the “ability to trace the history, application or location of
that which is under consideration.” ISO 9000 specifies that traceability may refer to the origin of
the materials and parts, the processing history, distribution of an entity and location of the entity
after delivery (8). This definition does not specify a standard measurement for “that which is
under consideration”. Examples of traceability events could be: a lot of corn or a truckload of
corn, a standard location size (field, farm, or county), a list of processes that must be identified
(pesticide applications or animal welfare, and blending), where the information is recorded
(paper or electronic record, box, container or product itself), or a bookkeeping technology (pen
and paper or computer) (16). ISO 9000 does not specify the extent of traceability for bulk
products (i.e. the depth or scope, quality management standards, or validation methods).
ISO22000:2007 is most recent standard defining principles and basic requirements for the food
and feed safety systems. This Standard provides requirements to design a safe and traceable
system and can be implemented by any supply chain participant or user. If chain information is
to be maintained, continuous connection between source and recipient is necessary. The more
that participants are connected the greater the transparency and information transference through
the supply chain. The ISO 22000 Standard, however, does not necessitate a traceability system
nor does it define extent of information transfer from one stakeholder to another.
The American Association of Cereal Chemistry International (AACCI) has created a
guidance tool for application of ISO 22000 to grain and grain processing industries (31). ISO
22005 Standard is the standard for traceability in the feed and food chain. It specifies basic
requirements for design and implementation of traceability system in the feed/food chain. ISO
22005 allows feed/food organizations to achieve traceability by identifying specific objective (s)
beneficial for the organization.

15
2.4 Drivers for bulk product traceability
There have been several studies of traceability and its importance in the food supply chain.
The focus has been the cold chain of perishable food products. In this section, the drivers for less
tangible traceability systems for bulk agricultural products are identified in more detail.
Traceability is a progressive connection across supply chain. For bulk materials, there is a
clear lack of structural information connection among participants: farmer, distributor, ingredient
supplier, and processor. Food safety incidents have led to increased understanding of traceability.
For example, the BSE crisis and advances in genetic modification improved traceability in the
meat supply chain (18). The European Union especially prioritizes traceability by requiring
labelling of consumer concerns and preferences, among them genetic modifications. In USA,
bulk traceability is primarily focused on tracking cattle to finished products for BSE control, on
tracking food shipments to reduce the risk of tampering, and on detailing country of origin,
animal welfare and genetic composition (18). In most cases, the traceability developments
involve properties that cannot be physically measured easily.
Private-sector food firms are developing, implementing and maintaining substantial
traceability systems designed to (i) improve supply management, (ii) facilitate trace back for
food safety and quality, and (iii) differentiate foods with subtle or undetectable quality attributes
(19). These are primarily farmer driven systems.
Traceability through internal production steps is crucial to maintenance of the chain (23).
This is particularly challenging when both inputs and products are bulk commodities.
Traceability for bulk supply chain can be designed for: (i) internal production steps, like; mixing,
blending, and storage; or (ii) external activities, like; third party carrier unit maintenance, and
dispatch activities.

16
The Food Safety Modernization Act (FSMA) (30) addresses the safety of both human and
animal food. FSMA is a reform to the Food Drug and Cosmetics Act that targets quick response
to food safety risks and preventive mechanisms. Traceability is a stated component of FSMA
with rules yet to be created. FSMA address both from feed and food safety. Of the 201 food
safety incidents reported from 2007 to 2012 to Food and Drug Administration (FDA) in the
Reportable Food Registry, 18 were categorized as feed safety incidents (30).
In the National Center for Food Protection and Defense (NCFPD) economically motivated
incident database (accessed November 14, 2013) 5% of 302 grain and grain-based incidents were
economically motivated (5). The European Parliament Congressional Research Service report
showed that grain and grain products are one of the top ten products at risk of food fraud in the
European Union (5).
2.5 Characteristics of bulk product traceability
2.5.1 Transportation of bulk products
The grain logistics chain begins with the movement from farm to on and off- farm
storage where grain is accumulated, then movement from storage to domestic use or export
markets. Grain elevators accumulate and store grain for bulk shipment. Typically, trucks initially
move grain from farm to these elevators. Trucks, trains, and barges are modes of transportation
for bulk grain commodities from elevators depending on the shipping distance. Grain movements
are essentially progressive combinations to larger shipment sizes with little recording of source
lots in any combination. Over the 1978-2004 period, trucked grain increased by 157%, barged
grain increased by 31%, and railed grain increased by 16% (8) in the mid-western states. The
travel distances are also increasing. For example, in North Dakota the average trip distance for
wheat and barley was 12 miles in the 1980s. By 2000, distances hauled had increased to 32 miles
for wheat and 44 miles for barley (9). Larger quantities of grains transported over greater

17
distances makes traceability increasingly complex. There are three primary supply chains for
bulk grains: (i) bulk export, (ii) bulk processing in domestic markets, and (iii) export of
containerized specialty grain products and containerized refrigerated meat products in which
grain was used as feed (8, 10). The mode of transportation and required infrastructure is based on
the specific supply chain.
2.5.2 Handling of bulk products
Handling and storage of bulk grain requires infrastructure and management. Grain
storage success depends on outside temperature and weather conditions and is best managed in
larger lots with monitoring instrumentation. Multiple stakeholders handle grain at different
points in supply chain, each with a business role and responsibility. Often lots varying in quality
and origin are deliberately blended to achieve economic gain against the purchasing
specifications. As the grain moves away from farm to the external supply chain participant, it
follows external traceability between units whereas when the movement of grain occurs within a
unit, internal traceability is required. Traceability targets the handling operations at each supply
chain participant level. Figure 2 is an illustration of handling as grain moves from farms to grain
processing units.
Figure 2. Illustration of grain handling at different stages of processing, distribution

18
Bulk commodities are also ingredient/feed/food/raw materials in variety of products. As
feed, 56 lbs (1bu) of corn creates 5.0-8.0 lbs of beef/14.0-15.6 lbs of pork/18.6-21.6 lbs of
chicken. In ethanol production process 1bu of corn creates about 2.8 Gal of ethanol and 17 lbs of
proteinous animal feed (Distillers Dried Grain with Solubles (DDGS)) (28).
While not food/feed safety factors, genetically engineered crops have increased the need
for traceability. About 92% of US corn and 94% of US soya beans are genetically engineered
(GE) (29). Approximately 75% of processed foods, contains GE crops. In a 2012 incident,
National Grain and Feed Association reported that US corn growers lost $1-3 billion due to
rejections in certain global markets that did not want GE at that time (30).
Lack of traceability for bulk commodities likely contributed to the inability of US
exporters to meet genetically engineered specifications. Traceability in this case would be the
early identification and segregation of genetically engineered crops.
2.6 Barriers to bulk product traceability
Bulk commodities like corn, wheat, soybean and their first processing intermediates are the
highest volume commodities in the United States, and also are the hardest to trace. Other
commodities like milk, fresh fruits and vegetables, and processed foods can implement more
precise traceability because of their shorter shelf life, direct consumption pattern and segmented
distribution systems. Traceability is normally based on countable items. Grain commodities have
constant comingling of batches for transportation and storage. The major challenge for
commodity traceability is establishing a harmonious link across supply chain participants (farm,
grain elevators, grain processors, feed processing units, and animal feeders) when there is no
perceived economic value for information sharing, and where there is a fear of competitive
market loss. Traceability systems in bulk products rarely extend beyond one interface step

19
forward or backward, and even then, the identification of which specific inputs are contained in
specific outputs is unclear. Typically, the gross profit (margins) for supply chain participants are
less than 5% of product value, sometimes as low as 1% of product value. Any activity that
changes quality, transportation patterns, and information management handling activities without
generating additional revenue will have major negative impacts on the supply chain participants.
2.7 State of the art and descriptive measures for bulk product traceability system
Commodity traceability systems are based on data management and information transfer
which means recording of events with little physical validation. Traceability systems have three
attributes- breadth, depth, and precision (6). The attributes are defined as follows (10):
(i) Breadth: Breadth refers to the number of informational items collected at each forward or
backward step. Breadth is the amount of information the entire traceability system records at
some point for the elements of interest.
(ii) Depth: Depth refers to the number of chain steps that can be connected in traceability.
(iii) Precision: Precision refers to the accuracy and validity with which a specific attribute or
physical item can be traced. A traceability system is said to be precise if the information is
available and is carried through all steps in the system.
The possible depth of any traceability system depends on the elements of interest. Example
elements of interest are- locational information, history, specification, process operation record,
storage and handling records, or specific standards implemented at each supply chain participant
level. Elements of interest vary with the objective of the system. A good system lists all elements
involving physical movement. For example: If a grain processing unit (GPU) models a
traceability system for two forward steps (involving two forward supply chain participants) and
two backward steps (involving two backward supply chain participants), then the GPU can have

20
multiple parameters at each level, in with four depth levels. In this case GPU requires
information parameters from two backward participants, example- farm, elevator, and provides
information to two forward participants, example- a third party logistic unit and distributor.
Elements of interest (parameters) could be records of grain handling, grain transformation
(mixing/cooking/processing/drying), grain movement, grain specifications (ash content, mold
test, type of grain, origin of grain), sanitary standards followed, facility location, or production
history. The entire pool of parameters constitutes the breadth parameter.
Suppose GPU defined locational information, grain specifications (only mold test results),
record of sanitary standards, and farm/elevator history as its elements of interest for the four
depth parameters. The system will be precise for grain specification only if the mold test results
are verified through prescribed standard methods and accredited laboratories. The entire system
is precise if all four elements of interest are carried through the system. Precision depends on the
verification i.e. accurate data available versus retention i.e. any data available for any element of
interest. Verification is an activity or activities conducted proving that a process is effective. For
example: Sanitary standard records can be verified by internal or external auditing thus use of
recent audited records will make the system more precise versus the old retained audit reports.
Farm location, or any locational verification can be done by using Global Positioning System
(GPS). Any authenticated proof of presence confirms precision in the system. The grain
industries typically are weak in validation and verification. In the grain supply chain, verification
would aid in keeping data accurate and control cost.
2.7.1 Significant work done on traceability
Significant work has been done with finished goods, involving unique identification,
geolocation, and coding. GS1 (Global Standards) is one example of an identification system (21).
It is an identification generation system that creates uniquely coded but mathematically related

21
identities (12). GS1 creates a GTIN (Global Trade Item Number) for each trade items, and a
SSCC (Serial Shipping Container Code) to prepare units for combination with other trade item
codes. These codes are managed by a GS 1- operated online database program customized for
specific operations. For example, figure 3 illustrates the coding mechanism linking a GTIN with
SSCC. Note that bulk commodities do not have indivisible starting points for trade items.
Figure 3. Generating SSCC with GTIN (37),
source: http://www.gs1.org/docs/tl/T_L_Keys_Implementation_Guideline.pdf
Geographic Information System (GIS) based traceability models have been proposed for
farm level traceability (11, 12). These systems generate unique identities based on location and
time coordinates. Because FSMA clearly identifies the farmer as the supplier of bulk grains, even
if the grains pass through one or more handlers, interest in these concepts will increase. Latitude
and longitude coordinates will uniquely identify any farm or location information (11).
GTIN: Unique identification of trade items at initial stage of packaging.
The numbers carry the information of
GS1 Company Prefix, asset Type and Check Digit
GTIN: Unique identification of trade items at packaging. The numbers
carry the information of GS1
Company Prefix, Asset Type and Check Digit
SSCC Unique identifier for shipment of a logistics unit. The numbers carry the information of Extension Digit,
GS1 Company Prefix, Serial Reference and Check Digit,
which remains the same for the life of the logistic unit to which it is assigned
1
1
2 2
3 3

22
In a downward flowing process, to locate an exact point of interest in a storage structure,
altitude degrees can also be added. The Latitude-Longitude-Altitude information can locate
position in any bin/silo on any site. GIS concepts represent an area of possible study for bulk
traceability applications.
2.7.2 Entity relationship modelling
Traceability systems have been based on entity-relationship modeling (ERM) (18). ERM is
structured mapping of physical entities (like bulk grain material). The map includes
relationship/connections among physical entities in a process. The ERM model links data
elements (like grain lot identification number, physio-chemical properties or, process details)
with the physical entities in the process. The ERM approach then links the physical entities with
stakeholders in order to create organized databases (20). ERM models help to visualize
operations quickly. An ERM model example is shown below in figure 4 for a grain elevator
facility (32).

23
Figure 4. Entity-Relationship Diagram for internal traceability at a grain elevator (32)
In ERM modeling the primary key (PK) is an attribute or combination of attributes that
uniquely identify any entry to the database. Primary key when inserted from one entity to
another then it becomes a foreign key (external parameter, FK) and is used to link two entries.
Comingling of two primary entities is represented by a foreign key that creates easy
identification of which two primary keys were used to develop the foreign key. Relationships
between two entities are defined by different types of arrows. These arrows can be one to one,
many to one, or mandatory one to mandatory other. In the above case, there were 52
relationships among grain lot activities and associated quality characteristics (32), in figure 4.
In ERM, a supertype entity represents two or more original entities when they are viewed
as one by other entities (32).
An example subtype
An example supertype
Foreign key: Bin no.
Primary key:
Activity date

24
As shown above in figure 4, supertype entity are the common data elements like
bin_activity and the subtype entity are a special case of an entity created when attributes or
relationships apply to only some instances of an original entity (32).
Subtype entity are specific data elements like scale_ticket. A subtype entity and subtype
entities are associated with various data elements. The supertype stores common data elements to
all combined entities whereas the subtype stores specific data information attributed to the sub-
divided portion of the original entity. The same entity can function at first as a supertype
(combination), then can generate subtypes (shipments removed). The ERM model in this case
identifies bin activity (movement type) as the original entity which has three subtypes, for
internal, incoming, and outgoing grain (32). The key limitation of traceability in bulk supply
chains is the mathematical process by which the attributes of subtypes and supertypes are
determined when the splits and combinations are not clearly delineated.
2.8 Advances in bulk product traceability
Traceability requires better simulation and error estimation along with effective
sequencing across unit operations. Technological advancements like RFID (Radio frequency
identification) and various types of barcoding are useful but are more applicable to lot identified
products such as in a grocery supply chain. RFID tags encode information to the tag memories
for later reference. Automating inventory through such technologies reduces errors and labor
(21) to some extent. Attempts to embed information technologies in bulk materials have been
largely unsuccessful.
In a bulk supply chain, traceability can be improved through interfacing such
programming advancements and generating RFID tags or ID to a lot with linkage to the farm
level, so that lot origin can be preserved (21).

25
The limitation, however, is that discretely identified units rarely move together without
mixing or splitting. Sainsbury Supermarket Company (packaged retail items like breakfast
cereal) determined that RFID promises tangible return on investment to almost all the
stakeholders in their retail supply chain. They identified savings in depot inventory control, store
receiving, and stock/code check. Also, supplier involvement increased operational synergy and
benefit (20). But these were not bulk products with splits and mingles.
In food production systems new measures are being tested to optimize traceability (12,
20). These measures are listed below:
(i) Downward dispersion- Number of finished products containing any part of given raw
material batches. For example, all the farmers that could have contributed grain to a particular
sub division (load) from a bin.
(ii) Upward dispersion- Number of raw material batches which are used in the entire process
over a period of time. For example, amount of grain moved from a bin to a processing unit.
(iii) Batch dispersion- Is the sum of all raw material downward dispersion and all finished
products upward dispersion. For example, the sum of the grain moved from bin to processing
unit and the finished product from the processing unit.
The major challenge in evaluating downward dispersion is the identification of the number
of raw material batches in the finished product. Without some form of mathematical simulation,
batch dispersion becomes all batches contains all inputs.
Traceability has been quantified through several measures of success. A traceability index
was created that quantifies a lot size of grain in an elevator.
Traceability index as the ratio of suspect (potential) volume (referred to as suspected
contaminated grain) to the volume of known contaminant being tracked (35). The traceability

26
index primarily tracks the potential contaminant as a measure of quantity. But traceability can be
affected by a few parameters (35). Table 2 illustrates an example, where various parameters are
discussed that can affect traceability of the supply chain system. The example is then used to
evaluate two types of traceability indices (TI) i.e. horizontal and vertical traceability index.
Horizontal TI evaluates internal traceability of a supply chain participant considering the effect
of depth, and precision parameters at only one supply chain participant level. Vertical TI
evaluates external traceability across all supply chain participants (in this example, from farm to
elevator) considering the effect of depth, and precision parameters across all levels.
Grain supply chain from farm to elevator level is described using elements of interest
relative to the breadth, depth, and precision parameters.
Table 2. Breadth, depth, precision parameters for farm and elevator levels
Breadth parameters
(All information)
Denoted by a
Depth parameters
(From farm to
elevator)
Precision
(Accurately
recorded- Y
No accuracy- N)
Supply
chain
participant
Information related to grain
type (𝑎1)
Y Y Farm
Information related to grain
specifications-
• seed type (𝑎2 )
• physio-chemical
properties of grain (𝑎3)
• Unique Identification of
outgoing grain (𝑎4)
• Information of grain
customer(𝑎5)
Y
Y
N
Y
Y
Y
N
Y
Farm
Information related to grain
history(𝑎6)
N N Farm/
Elevator

27
Table 2. (continued)
(i) Horizontal TI =
𝐼𝑛𝑓𝑜𝑟𝑚𝑎𝑡𝑖𝑜𝑛 𝑟𝑒𝑞𝑢𝑖𝑟𝑒𝑑 (𝑛𝑢𝑚𝑏𝑒𝑟 𝑜𝑓 𝑝𝑎𝑟𝑎𝑚𝑒𝑡𝑒𝑟𝑠)
𝐼𝑛𝑓𝑜𝑟𝑚𝑎𝑡𝑖𝑜𝑛 𝑎𝑐𝑡𝑢𝑎𝑙𝑙𝑦 𝑎𝑣𝑎𝑖𝑙𝑎𝑏𝑙𝑒 𝑤𝑖𝑡ℎ𝑖𝑛 𝑎 𝑠𝑢𝑝𝑝𝑙𝑦 𝑐ℎ𝑎𝑖𝑛 𝑝𝑎𝑟𝑡𝑖𝑐𝑖𝑝𝑎𝑛𝑡 (𝑛𝑢𝑚𝑏𝑒𝑟 𝑜𝑓 𝑝𝑎𝑟𝑎𝑚𝑒𝑡𝑒𝑟𝑠)
Equation. [1]
Calculating at Farm level:
Information required: All the breadth parameters at farm level i.e. (𝑎1), (𝑎2 ), (𝑎3 ), (𝑎4 ),
(𝑎5 ), (𝑎6 ), and (𝑎7 )
Information actually available: The depth and precision parameters that were precisely
recorded and transferred through which are (𝑎1), (𝑎2 ), (𝑎3 ), and (𝑎7 ) in this example.
This implies Horizontal TI for farm = 7 𝑝𝑎𝑟𝑎𝑚𝑒𝑡𝑒𝑟𝑠
4 𝑝𝑎𝑟𝑎𝑚𝑒𝑡𝑒𝑟𝑠 = 1.75 based on information types
counted.
Breadth parameters
(All information)
Denoted by a
Depth parameters
(From farm to
elevator)
Precision
(Accurately
recorded- Y
No accuracy- N)
Supply
chain
participant
Information related to grain
history(𝑎6)
N N Farm/
Elevator
Process operation
• Mixing at elevator level
( 𝑎8)
• Unique Identification of
incoming bulk
material(𝑎9)
• Unique identification of
bin (𝑎10)
Y
Y
N
Y
Y
N
Elevator
• Standards followed
• Sanitary standards (𝑎11)
• Quality management
(𝑎12)standards
Y
Y
N
Y
Elevator

28
This assumes that: (𝑎1), (𝑎2 ), (𝑎3 ), (𝑎4 )………, (𝑎𝑛 ) are of equal weighting.
(ii) Vertical TI= 𝐼𝑛𝑓𝑜𝑟𝑚𝑎𝑡𝑖𝑜𝑛 𝑟𝑒𝑞𝑢𝑖𝑟𝑒𝑑
𝐼𝑛𝑓𝑜𝑟𝑚𝑎𝑡𝑖𝑜𝑛 𝑎𝑐𝑡𝑢𝑎𝑙𝑙𝑦 𝑡𝑟𝑎𝑛𝑠𝑓𝑒𝑟𝑟𝑒𝑑 𝑎𝑐𝑟𝑜𝑠𝑠 𝑠𝑢𝑝𝑝𝑙𝑦 𝑐ℎ𝑎𝑖𝑛 𝑝𝑎𝑟𝑡𝑖𝑐𝑖𝑝𝑎𝑛𝑡𝑠
Equation. [2]
Calculation across farm to elevator
Information required: All the depth parameters i.e. (𝑎1), (𝑎2 ), (𝑎3 ), (𝑎4 ), (𝑎5), (𝑎6 ),
(𝑎7 ), (𝑎8), (𝑎9 ), (𝑎10 ), (𝑎11), and (𝑎12 )
Information actually transferred: The depth parameters that were precisely recorded (or
validated) and transferred are (𝑎1), (𝑎2 ), (𝑎3 ), (𝑎5), (𝑎7 ), (𝑎8 ), (𝑎9 ), and (𝑎12) in this example.
This implies, Vertical TI= 12 𝑝𝑎𝑟𝑎𝑚𝑒𝑡𝑒𝑟𝑠
8 𝑝𝑎𝑟𝑎𝑚𝑒𝑡𝑒𝑟𝑠 = 1.5 based on information counts and the same
assumption that (𝑎1), (𝑎2 ), (𝑎3 ), (𝑎4 ),………, (𝑎𝑛 ) are of equal weighting.
If horizontal TI or vertical TI = 1, this implies 100% of the validated information are
transferred.
Percent traceability can be calculated as the inverse of traceability index. For example, a
TI = 1.75 =57% of information transferred, for equation 1 and 2.
2.8.1 Review of advances in food value chain traceability
Institute of Food Technologists (IFT) studied a raw tomato supply chain that included 14
mock trace backs at various stages, chain of custody being the objective of the study. IFT defined
Key Data Elements (KDE) and Critical Tracking Events (CTE) (34). The key objective for this
study was to explore technological advances that could enhance speed, effectiveness, and
accuracy of product tracing (34). This study identified factors limiting traceability and identified
supply chain actor responsible for discrepancies in an operation.
Good Traceability Practices (GTP) guidelines using the TraceFood Framework were
proposed for seafood, mineral water, honey, and chicken value chains (33).

29
The TraceFood Framework is based on the following components: unique identification,
documentation of splitting/joining trade units, electronic language interchange, and guidelines
for implementation. The Bulk grain supply chain could use similar guidelines based on unique
identification (for location, splitting/joining of entity, and process), and software interfaces.
The previous studies have identified the value of general standards for whole groups of
industries, augmented by sector-specific standards by industry. For example, the TraceFood
Framework recorded each data element, with description and specifications for seafood, honey,
and mineral water chains (33). Figure 5 is an illustration of the sector specific standards for the
seafood-value chain (33).
Figure 5. Sector-specific standard for recording traceability in seafood value chain (33),
source: (Storoy et al., 2013)

30
Figure 5. (continued)
For a chain of custody traceability, the standard must completely describe all terminology
and methods of determination. Shall and should identify mandatory versus useful information.
The pilot study (33) identified factors responsible for disrupting information flow across supply
chain participants, which were: organizational mismanagement, misinterpretation of elements of
interest, and poor decision making.
Researchers in Norway developed a methodology for analyzing material flow, information
flow, and information loss in the food supply chain (35). Information loss is one of the major
reasons for ineffective traceability. The study identified the cause of poor information flow by
implementing the process mapping. The Process mapping method information questions were
grouped into forms (35). Each form is related to a specific duration or transformation of the
entity in the supply chain (35).

31
These forms covered operations or activities in the supply chain: (i) reception of ingredient,
(ii) pre-production storage, and (iii) shipping/collection. For this study the supply chain was
categorized in nine forms. There was poor information flow across the farm (chain operations).
The process mapping method uncovered missing, or implicit data related to a particular entity.
The process mapping method identified each CTE (farm) with associated KDE’s. The study
concluded that seafood supply chain participants ranged from fairly bad to quite poor in data
communication (35).
2.9 Future of bulk product traceability
Traceability in the bulk supply chain offers opportunities, and challenges in practical
application. Most studies have involved traceability for lot-identified perishable and ready to
eat/cook food products. Traceability has normally been evaluated in terms of investment costs
only. Especially in the bulk supply chain, stakeholders do not perceive the benefits of any
traceability systems.
This chapter has defined emerging drivers for expanded traceability bulk supply chain.
Costs versus benefits of traceability can be assessed through general and operating studies (4).
Quantitative techno-economic models can be developed for sector-specific traceability standards.
Standard protocols would define roles and responsibilities among the supply chain stakeholders.
For example, verification of sustainability is a growing objective of traceability. It has three
aspects: (i) social, (ii) economic and (iii) environmental (3). Sustainable traceability systems
require properly certified, labelled, backend (farm/source information) and forward information
of the finished goods reaching consumers, beyond simply locational identification.
Few studies connect sustainability with profitability. Researchers at University of Almeria,
Spain modelled family farm operations to test compatibility of sustainability with profitability
using multivariate statistical models (3). Sustainability was not contradictory to increased profits.

32
About 60% of profits were dependent on socio-economic variables, whereas 40% of profits
related to environmental-innovation variables (3). Better numerical methods would allow full
supply chain modelling in the same manner for the bulk grain supply chain.
Effective data management is necessary to link supply chain participants. Data
management involves three aspects: (i) data recording- recording of data for all probable (or
defined) CTE with associated KDE’s, (ii) data sending- sending the required information to the
next supply chain participant, (iii) data receiving and assimilating- storing the received data
securely and assimilating it for the processes in the supply chain.
Figure 6. Illustration on aspects of data management
Traceability improves supply chain systems, and may contribute towards optimizing
overall operations, manufacturing/processing, record keeping, throughout the bulk grain/grain
product supply chain. Some of the key takeaways for action in bulk grain supply chain
traceability are modeling of scoring systems to measure success, algorithms to link events,
verification techniques, and communication protocols for sharing information.
Transfer defined EOI in relation to
depth parameters
Storing and assesing data received for
possible risk
Keep record of all
elements of interest (EOI)

33
The future of traceability will revolutionize the ways of using information into more
meaningful data through use of advanced interfaces for communication.
2.10 References
(1) A. Minchenkov and L. Honig, “USDA Forecasts Record-High Corn and Soybean Production
in 2016”, News Release, USDA/ NATIONAL AGRICULTURAL STATISTICS SERVICE,
2016.
(2) D. Flynn, "FDA challenge: Finding how peanut residue got into the flour," Food Safety
News, 2016.
(3) L. Munoz, "Is Sustainability Compatible with Profitability? An Empirical Analysis on Family
Farming Activity," Sustainabiliy, vol. 8, no. 9, 2016.
(4) M. Memon, Y. Lee and S. Mari, "Analysis of Traceability Optimization and Shareholder’s
Profit for Efficient Supply Chain Operation under Product Recall Crisis," Mathematical
Problems in Engineering, vol. 2015, no. Article ID 896239, 2015.
(5) J. Zhang and T. Bhatt, "A Guidance Document on the Best Practices in Food Traceability,"
Comprehensive reviews in food science and food safety, vol. 13, no. 5, p. 1074–1103, 2014.
(6) M. Preziosi, "Main drivers to traceability systems in the food supply chain," in Proceedings
of the XXVI National Congress of Commodity Sciences, 2014.
(7) R. Johnson, "Food Fraud and Economically Motivated Adulteration of Food and Food
Ingredients," Congressional Research Service, 2014.
(8) Technical document and Quoram Corporation, A Comparison of the Canadian US and grain
supply chains, Grain monitoring program: Supplemental study, 2014.
(9) U.S. Department of Agriculture, "Grain Transportation report, " Transportation and
Marketing Programs/Transportation Services Branch, 2014.
(10) L. Comba, G. Belforte, F. Dabbene and P. Gay, "Methods for traceability in food production
processes involving bulk products," Biosystems Engineering, vol. 116, no. 1, pp. 51-63, 2013.
(11) H. G. Gemesi, "Food Traceability Information Modeling and Data Exchange and GIS Based
Farm Traceability Model Design," Graduate Theses and Dissertation: Iowa State University,
vol. Paper 11597, 2010.
(12) M. Khabbazi, N. Ismail, Y. Ismail, N. Ismail and S. Mousavi, "Modeling of Traceability
Information System for Material Flow Control Data," Australian Journal of Basic and Applied
Sciences, vol. 4, no. 2, pp. 208-216, 2010.

34
(13) M. Thakur and C.R. Hurburgh, "Framework for implementing traceability system in the
bulk grain supply chain, Journal of Food Engineering, vol. 95, no. 4, pp. 617–626, 2009.
(14) G. Bennet, "Identity preservation & traceability: the state of the art - from a grain
perspective (status of agricultural quality," Retrospective Theses and Dissertations: Iowa State
University, vol. Paper 15880, 2008.
(15) O. Kehagia, P. Chrysochou, G. Chryssochoidis, A. Krystallis and M. Linardakis, "European
Consumers’ Perceptions, Definitions and Expectations of Traceability and the Importance of
Labels, and the Differences in These Perceptions by Product Type," Journal of the European
society for Rural Sociology, vol. 47, no. 4, 2007.
(16) B. Massimo, B. Maurizio and M. Roberto, "FMECA approach to product traceability in the
food industry," Food control, vol. 17, no. 2, pp. 137-145, 2006.
(17) D. Folinas,I. Manikos, and B. Manos, "Traceability data management for food chains,"
British Food Journal, vol. 108, no. 8, pp. 622-633, 2006.
(18) G. Smith, J. Tatum, K. Belk, J. Scanga, T. Grandin and J. Sofos, "Traceability from a US
perspective," Meat Science, vol. 71, no. 2005, p. 174–193, 2005.
(19) E. Golan, B. Krissoff, F. Kuchler, L. Calvin, K. Nelson and G. Price, "Traceability in the
US food supply: Economic theory and industry analysis," Economic Research Service, U. S.
Department of Agriculture, Agricultural Economic, vol. AER Report No. 830, 2004.
(20) J. Hobbs, " Information asymmetry and the role of traceability systems," Agribusiness , vol.
20, no. 4, pp. 397-415, 2004.
(21) K. Mikko, "Increasing efficiency in the supply chain for short shelf life goods using RFID
tagging," International Journal of Retail & Distribution Management, vol. 31, no. 10, pp. 529-
536, 2003.
(22) M. Jansen-Vullers, C. V. Dorp and A. Beulens, "Managing traceability information in
manufacture," International Journal of Information Management, vol. 23, p. 395–413, 2003.
(23) G. Nortje, "Animal identification – the best way forward –animal ID is part of a traceability
system," Food Safety Summit and National Meat Association Annual Convention, Washington,
DC/Las Vegas, NV, 2002.
(24) T. Becker, "Consumer perception of fresh meat quality: a framework for analysis," British
Food Journal, vol. 102, no. 3, pp. 158-176, 2000.

35
(25) P. Leat, P. Marr and C. Ritchie, "Quality assurance and traceability ‐ the Scottish agri‐food
industry’s quest for competitve advantage," Supply Chain Management: An International
Journal, vol. 3, no. 3, pp. 115-117, 1998.
(26) B. Wall, "Quality Management at Golden Wonder," Industrial management and Data
Systems , vol. 94, no. 7, pp. 24-28, 1994.
(27) Brochure on website 24 Mantra:
http://www.sresta.com/wpcontent/uploads/2016/01/Brochure-for-Web_2014-09-30.pdf
(28) Website for Iowa corn: https://www.iowacorn.org/resources/faqs/
(29) Website for GE crops: http://www.centerforfoodsafety.org/issues/311/ge-foods/about-ge-
foods#
(30) Website for feed safety incidents report: https://www.ngfa.org/newsletter/fda-publishes-
annual-feed-safety-incidents-report/
(30) Guidance tool for ISO 22000 by American Association of Cereal Chemistry
International (AACCI): http://www.aaccnet.org/publications/store/Pages/ISO22000.aspx
(31) M. Thakur, B. Martens, and C.R. Hurburgh, “Data modeling to facilitate internal
traceability at a grain elevator,” Computers and Electronics in Agriculture, Vol. 75, No. 2, pp.
327-336, 2011
(32) J. Storoya, M. Thakur, and P. Olsen, “The TraceFood Framework – Principles and
guidelines for implementing traceability in food value chains,” Journal of Food Engineering,
Vol. 115, No. 1, pp. 41-48, 2013
(33) T. Bhatt, C. Hickey, and J. McEntire, “Pilot Projects for Improving Product Tracing along
the Food Supply System,” Journal of Food Science, Vol. 78, No. s2, 2013
(34) P. Olsen, and M. Aschan, “Reference method for analyzing material flow, information flow
and information loss in food supply chains,” Trends in Food Science & Technology, Vol. 21, No.
6, pp. 313-320, 2010
(35) Laux, Chad M. and Hurburgh, Charles R. Jr., "Using Quality Management Systems for
Food Traceability" (2012). Agricultural and Biosystems Engineering Publications. 434.
(36) Guideline document GS1:
http://www.gs1.org/docs/tl/T_L_Keys_Implementation_Guideline.pdf

36
CHAPTER 3. DEVELOPING METHODS, GUIDELINES, BEST PRACTICES AND
TERMINOLOGY SUPPORTING MULTIPLE TRACEABILITY OBJECTIVES IN THE
GRAIN SUPPLY CHAIN
Richa Sharma1; Charles Hurburgh2; Gretchen Mosher3
1Graduate Research Assistant, Iowa State University; 2Professor, Iowa State University; 3Associate
Professor, Iowa State University
Modified from a manuscript to be submitted to Cereal Chemistry Journal
3.1 Abstract
Given the complexity of bulk handling systems, management of bulk commodities such as
grain(s) becomes a challenge. Several regulatory agencies in the United States and worldwide
have set rules and guidelines to improve supply chain management operations. Grain traceability
is one of the important components of the rulemaking involved in managing the grain supply
chain. The minimum traceability requirement is to document the record of “one step up, one step
down.” In practice, the approach of system traceability has proven to be successful in
maintaining the bulk grain supply chain. This paper presents system traceability as a
collaborative effort of various supply chain participants in keeping records of both material and
information flow, across and within the supply chain system.
Grain traceability is a multifaceted activity that aims to streamline supply chain operations,
from farm to fork. Traceability is a function involving a number of supply chain participants, the
nature of their business(s), and various traceability objectives such as the following: (i) Addressing
food safety and quality issues, (ii) documenting the chain of custody, (iii) documenting production
activities, (iv) meeting customer demands, (v) risk management, (vi) meeting regulatory
compliance, and (vii) promptness towards addressing new issues.
Implementing traceability in a supply chain system requires efforts in documenting the
necessary data of various supply chain processes or events. This paper defines traceability

37
objectives, lists what data is necessary to achieve respective traceability objectives and develops
standard templates to record informational elements or data that will help in achieving the defined
traceability objectives.
Various food regulations and standards such as ISO 22000:2018 and ISO 220005:2007
provides an architecture for implementing traceability in food and feed establishments, but it fails
to develop a concrete stepwise methodological traceability framework. The research objective was
to create standard methods and guidelines for application of traceability in the grain supply chain,
using prior literature discussed in various food standards.
KEYWORDS: Traceability objectives, standardization, traceability method, template
3.2 Introduction
Standard methods and guidelines serve as a medium to adequately communicate the flow of
activities in an internal system as well as in an external system, such as the supply chain network.
The intent of the paper was to develop a harmonized methodology for the interoperability of
traceability among supply chain participants. To be effective in today’s competitive global and
domestic market, U.S. grain producers and handlers are implementing standard handling methods,
production guidelines, and specialized documentation systems as part of their traceability systems
(Herrman & Thomasson, 2011). Consumer sensitivity towards food safety and quality issues has
led to an increased interest in grain traceability. Traceability and its guidelines are defined under
various national and international food safety standards. ISO 22000:2018 defines traceability as
the “ability to follow the history, application, movement, and location of an object through
specified stages of production, processing, and distribution (ISO standard 22000:2018).”
In the U.S., the term traceability gained importance under the Bioterrorism Act of 2002,
which requires every supply chain participant of the food and feed industry to document records
and register with the Food and Drug Administration (FDA) for traceability purposes (Thakur &

38
Donnelly, 2010). The final rules in the Food Safety Modernization Act (FSMA) refers to the
application of traceability, to effectively trace and track fresh produce and high-risk foods. FSMA
requires the FDA to develop science-based systems that support traceability. FSMA final rule for
Preventive Controls for Human food recommends developing a traceability system incorporating
robust document recording systems (Food and Drug Administration, 2016). Moreover, another
FSMA system, Foreign Supplier Verification Program (FSVP) is designed to protect domestic
consumers from imported products. Under the FSVP, any U.S. business that is involved with any
foreign business unit is required to meet the FDA’s prescribed levels of food safety and quality.
For example, the foreign business unit should have the ability to assess the potential risks, based
on both hazard analysis and its history of previous records. Such a verification system builds
product integrity among consumers, which is one of the several potential traceability objectives.
The International Organization of Standards (ISO) is a non-governmental standard setting
body which supports to public health and safety across the globe. Across the family of ISO
standards, ISO 22000:2018 and ISO 22005:2007 list requirements for designing and implementing
a traceable system in the food and feed supply chain. This paper takes references from the
traceability requirements listed in the ISO standards to develop requirements, methods, and
guidelines for practicing traceability in bulk product supply chains. Given below is a table showing
the overlap of traceability considerations in the above-mentioned ISO standards.

39
Table 1. Comparison of ISO22000:2018 and ISO22000:20051
Requirements of a
Traceability System
ISO 22000:2018 ISO 22005:2007
IDENTIFY Identify applicable
statutory, regulatory, and
customer requirements
Identify traceability objectives
such as documentation, food
safety and quality, chain of
custody, production practices,
sustainability
INTERACT Establish a relation of lots
procured from various
supply chain participants
Ensure coordination among
supply chain participants
TRACE BACKWARD
and TRACK FORWARD
Keep a chain of custody
Develop protocols for
reworking of the product
under consideration
Trace the movement of lots
(feed, food, ingredients,
additives, and packaging)
Tracking protocol for each stage
of production and processing
DOCUMENT Documentation of key
parameters as evidence
Information about all suppliers
(can be linked to a domestic
supplier verification program)
VERIFY Should be able to verify
and the test effectiveness of
traceability system
Not enough discussion on
verification of traceability
system
Traceability is much more than an identification tool. Its application fulfills several
objectives such as (i) meeting customer demands, (ii) proactive risk assessment, (iii) promptness
in addressing security threats, (iv) documenting chain of custody and activity records, (v)
addressing sustainability, (vi) product integrity and brand protection, and (vii) meeting regulatory
compliance. Traceability objectives are important for developing a structured traceability system.
The research objective was to create standard methods, guidelines and best practices
supporting traceability objectives to develop an objective-centered system for the bulk grain
supply chain. Developing a standard methodology allows for considering the dependence of
1 Modified from (“ISO 22000:2018” and "ISO 22005:2007")

40
successive events. Information on guidelines and best practices prepare each supply chain
participant for future events. Section 3 of this research elaborates more on traceability objectives
and its application in the bulk grain supply chain.
3.3 Bulk grain supply chain
A supply chain is coordination among several supply chain participants, each adding value
in some form to the final product. While supply chains for specific commodities vary, the flow of
commodities is usually similar (Jones, Kegler, Lowe, & Traub, 2003). In grain supply chains, the
basic participants involved are seed company, farmer, grain elevator, grain processor and end-
user (e.g., feed mill). The bulk grain supply chain processes food, feed grains, such as corn,
soybean, barley, sorghum and energy to produce a variety of products. Each supply chain
participant has specific roles and responsibilities. The processes performed through a supply
chain are interdependent and fundamental in understanding the role of other supply chain
participant(s). According to the USDA’s feed grain yearbook table 2013, a total of 322 million
metric tons of feed grain was consumed in the U.S. (USDA, 2013). These suppliers and
processors use corn, barley, sorghum, oats as ingredients in different capacities for dry/wet
milling, taco shell processing, masa processing, and hominy stock processing (Gwirtz & Garcia-
Casal, 2014). For example, corn is the most common ingredient. It can be used in manufacturing
a hand soap, as cereal and as car fuel (ethanol).
3.3.1 Seed company to farmer linkage
The first linkage in the corn supply chain is between the seed company owner and the
farmer. Farmers buy seeds, as per their requirements, from the seed company, providing which is
the company owner’s primary task. For example, if a farmer asks for non-GM or organic seeds,
the seed company owner should be able to cater to such needs. The farmer then sows the seed
and harvests it. The seed company should responsibly sell authentic seeds to the farmer. The

41
farmer performs various operations such as fungicide/pesticide treatment to protect the crop,
irrigation, harvesting, and post-harvest storage. The farmer sells the harvested corn to both grain
elevators and processors.
3.3.2 Farmer to grain elevator linkage
The grain elevator procures corn from several farmers and then sells them to corn
processors. The elevator stores the bulk grain from the various farmer locations in bins or silos or
even under tarps, leading to a commingling of the grain. Bulk grain loses its specific
geographical identity once it is in the elevator. Corn received at the elevator is first collected at
an inspection point, and then sampled for measurement of moisture content, test weight,
sometimes mycotoxins and other quality factors relevant to the processor buyer. After sampling
and inspection, it is transferred through conveyors to the bins. The new lot of incoming corn is
blended along with the already existing lots in the bins. The blending makes identification,
tracing and tracking of any bulk commodity a challenge.
3.3.3 Farmer to grain processor linkage
The linkage between farmer and grain processor is similar to that with the grain elevator.
The farmer is a seller of corn and the grain processor is the buyer. The corn processor samples
and evaluates the corn for quality of the corn as valued for its use.
3.3.4 Grain elevator to grain processor linkage
The elevator facility sells the blended corn to the corn processors such as dry milling
plants, ethanol producers, wet milling plants and corn-consumable manufacturers. The elevator
sells the corn against the processors’ requirements which may or may not be based on the same
characteristics as tested by the elevator.

42
3.3.5 Grain processor to end- consumer linkage
The corn processor then sells products to livestock feeders, corn product retailers and
wholesalers. The corn processors sell products such as finished feed, ethanol, DDGS, hominy,
corn chips, tortilla, and masa to a variety of end-consumers. They perform a lot of intermediary
operations to develop a final product.
Figure 1 illustrates the various supply chain participants involved in the grain supply chain
and the activities performed at each stage. In a corn supply chain, the grain elevator procures
grain (raw corn) from multiple farmers, leading to the commingling and loss of some quality
attributes. Roles, responsibilities and interactions among supply chain participant(s) is presented
from section 3.1 to 3.5 of this paper to better understand traceability requirements in the corn
supply chain.
Figure 1. Corn supply chain with dry milling- ethanol plant as the grain processor (modified
from Gwirtz & Garcia-Casal, 2014)

43
3.4 Traceability objectives
Traceability objectives are defined as measurable, stakeholder-specific targets that enable
the implementation of traceability activities across the supply chain. The definition and
classifications of traceability activities are broad because of the complexity of several different
traceability objectives (Golan et al., 2004). Many research articles address traceability objectives
as potential market advantages such as (i) improving food quality and safety, (ii) enhancing
coordination across the supply chain, (iii) enabling better information and inventory flow, (iv)
documenting information about the origin of the product (Hobbs, 2004; McKean, 2001;
Monjardino de Souza Monteiro & Caswell, 2011).
Traceability objectives are broadly classified into two groups, as illustrated below in Table
2. Group 1 includes items related to the physical item under transaction, in other words, the
physical item which is transferred through the supply chain linkages. For example, blended corn
is the physical item under transaction for the elevator and grain processor linkage. Group 2
includes items related to the characteristics of the physical item under transaction. For example,
documentation of the movement of physical items account for some characteristics. Categorizing
traceability objectives in Group 1 and Group 2 helps to identify the impact of achieving
traceability on both the physical product and data elements or characteristics.

44
Table 2. Description of traceability objectives2
Traceability
Objective Description
Group 1:
Related to
physical
item
Group 2:
Related to
characteristics
Food defense Protection and insulation from threats.
Is related to the physical item,
generally, for imported products.
Yes No
Documentation Keep record of each event and
product transformation in the supply
chain.
No Yes
Production
practices
Keep track of all the internal
production practices including
transformation and commingling.
Yes Yes
Chain of
custody
Document and locate where and with
whom, at all times, is the physical
product in the supply chain.
Yes No
Meet consumer
demands
Set processes as specified by
customer. E.g. Customer wants
grinded corn to size 500 microns, set
the grinders to achieve desired results.
No Yes
Brand
protection
Eliminates consumer negatives and
builds trust in the product.
No Yes
Risk
management
Manages associated risks, both
associated with the product and its
characteristics. E.g. Aflatoxin in milk-
“physical product- dairy cow feed”;
Characteristic-“Carryover of aflatoxin
levels from feed to milk.”
Yes No
Address food
safety & quality
issues
Analysis and protection of hazard.
E.g. Presence of foreign material in
corn (physical product).
Yes No
Sustainability Estimation of carbon emissions,
social, and political sustainability.
Yes Yes
The traceability objectives are discussed in more detail specific to the corn supply chain
in section 5. Organic products may be an exception related to characteristics but cannot be
measured only the location of physical item is measurable in terms of locational coordinates.
2 Analysis of this study, categorizing traceability objectives

45
3.5 Methodology
Implementation of a traceability system is dependent upon traceability objectives. The
primary objectives of supply chain stakeholders in using the traceability systems are (i)
facilitating tracking and tracing, (ii) improving supplier-client interactions, and (iii) protecting
brand integrity (Fritz & Schiefer, 2009). The bulk commodity supply chain as showed in Figure
1 includes processed products to the extent that they too are bulk commodities. The process flow
chart is a way that makes easier to identify new and old process lots. Also, Process flow
diagrams helps understand the involvement of various stakeholders and processes in any supply
chain. For the purpose of this paper, in-depth analyses were conducted for each supplier–client
linkage in the corn supply chain. Traceability objectives that are specific to each stakeholder
determines the traceability need from their perspective.
The method used to develop a traceability system is based on determining traceability
objectives, and suggestions on the best practices supporting these objectives for each supply
chain participant or stakeholder. Developing an effective traceability system requires defining
common terminologies, traceability objectives, implementable guidelines, and information trail.
This paper addresses the methods and best practices used to achieve traceability objectives in the
corn supply chain. Traceability systems have the potential to prove that a facility is complying
with regulatory requirements, by providing documented traceable data (Fritz & Schiefer, 2009;
Sahin, Zied Babaï, Dallery, & Vaillant, 2007). Process flow charts, and prior literature on corn
supply chains were studied to set a common tone related to traceability in the grain supply chain.
The methodology in this paper suggest the best practices and methods that are important for
achieving multiple stakeholder-specific traceability objectives.

46
3.6 Results
3.6.1 Common terminology
The grain supply chain involves a variety of processes and supply chain participants. The
participants may be domestic or international in origin. Common definitions and terminologies
related to traceability in the bulk grain supply chain are necessary to success. A glossary is
proposed using prior literature and some standards (such as the ISO 22000:2018 and the EU
standards). The glossary shared in Table 4 uses references as illustrated in Table 3. The glossary
is applicable for various types of bulk products, grains and their commodity processes products.
Table 3. References used for developing various terminology related to grain traceability
TERMINOLOGY REFERENCE
Internal Traceability (Davison & Bertheau, 2008)
External Traceability (Davison & Bertheau, 2008; Thompson, Sylvia, &
Morrissey, 2005)
Traceability Objectives (Henson & Reardon, 2005; Kärkkäinen, Holmström,
Främling, & Artto, 2003)
Chain of custody (Zhang & Bhatt, 2014)
Key data elements (McKean, 2001; Zhang & Bhatt, 2014)
Critical traceability events (Zhang & Bhatt, 2014)
Corn supply chain (Marvin, et al., 2012; Gwirtz & Garcia-Casal, 2014;
Jones et al., 2003)
Supply chain participants or
stakeholders or traceability
partners
(Davison & Bertheau, 2008; Zhang & Bhatt, 2014)
Transformation (Zhang & Bhatt, 2014)
Holding (Gwirtz & Garcia-Casal, 2014)
Handling (Gwirtz & Garcia-Casal, 2014)
Movement (“ISO 22000,” 2007)
Unique Identifier (Thompson et al., 2005)
Lot (“ISO 22000,” 2007)
Lot Number (Thompson et al., 2005; Zhang & Bhatt, 2014)
Bin

47
Table 3. (continued)
TERMINOLOGY REFERENCE
Commingling (Zhang & Bhatt, 2014)
Blended Products (Gwirtz & Garcia-Casal, 2014)
Tracing (Thakur & Donnelly, 2010; Zhang & Bhatt, 2014)
Tracking (Thompson et al., 2005; Zhang & Bhatt, 2014)
First In First Out (FIFO) (Thompson et al., 2005; Zhang & Bhatt, 2014)
Traceable unit (Karlsen, et al.,2013; Kelepouris, et al.,2007;
Storoy et al., 2013)
Broadly the IFT glossary, GS 1 standard, EU standard (GM traceability and labeling), ISO
22000:2018, public health security and bioterrorism preparedness act cover a generic
terminology. The attempt here is to take reference from the definitions in these standards and
develop definitions and terminologies specific to the corn supply chain.
Table 4. Glossary of terminology3
Definitions
Internal
Traceability
Ability to trace and track the transformations through all stages of processing.
External
Traceability
Ability to track and trace product and its key data elements as it moves through
the supply chain.
Relational
Traceability
Tracking forward or tracing backward among one to one, one to many and
many to one relationship among grain supply chain participants.
Traceability
Objectives
Identified, measurable supply chain specific goals, responsible for enabling
traceability across the supply chain.
3 Modified from Table 3

48
Table 4. (continued)
Definitions
Chain of
Custody
The ability to identify the pathway of the traceable unit, through all transition
points or nodes in the grain supply chain. For example, information about the
location, ownership, and any alteration of traceable unit.
Critical
Traceability
Events (CTE)
Specific transition points or nodes in the supply chain, where capturing
data is critical to enable traceability according to the objectives in place. The
critical traceability event includes both the physical product and the
characteristics associated with it. Following are the types of CTE(s) in the
supply chain:
-Movement: The flow of physical product from one supply chain participant
to another forms a movement CTE. In the grain supply chain “movement” is
classified into the following categories:
▪ Bin to Bin movement: When the physical product under consideration
is moved from one bin to another for storage without transformation.
▪ Pit to Bin movement: When the physical product under consideration,
corn, is moved from a consolidation point to the assigned bin.
▪ Process movement: When the physical product under consideration
moves from one internal process to another, creating a product, is
referred to as a process movement.
-Holding: The event of storing a physical product for a new time that can
affect the product’s properties. For example, storing corn in silos at grain
elevator is a holding CTE because corn can become moldy or wet, if not
properly aerated.
-Handling: The process(s) involved in handling the physical product across
the supply chain. For example, keeping silos clean and fumigated to prevent
pests is one of the processes involved in successful handling.

49
Table 4. (continued)
Definitions
-Transformation: Any alteration made to the physical state or form of a
traceable unit. Each type of transformation creates a unique traceable unit or
lot, therefore, should be uniquely identified. In the grain supply chain
transformation can be of three types:
▪ Type 1: A transformation that alters the identity of the traceable lot.
Blending (commingling)-splitting-grouping-repacking is a type 1
transformation.
▪ Type 2: A transformation that alters the physical appearance and
functionality of the traceable lot. Grinding grain is an example of type 2
transformation; here, the use of equipment is needed to transform the
physical appearance.
▪ Type 3: A transformation that alters the physical appearance of the
traceable lot by adding several ingredients for a complete
transformation in physio-chemical properties of the traceable lot.
Kneading (addition of water, salt, sugar, oil to the grain flour) is an
example of type 3 transformation; here, the created new traceable lot is
the dough, which is unique and different in properties, as compared to
the previous traceable lot—grain flour.
Successful
Handling
The processes involved in preventing unhygienic practices is referred to as
successful handling. Data capture to achieve food safety objective at handling
CTE is an example of successful handling.
Key Data
Elements
(KDE)
The information items (data) related to a critical traceability event such as
location, ownership, alteration, production practices, and duration. For
example, farm location coordinates is a KDE for the movement CTE.

50
Table 4. (continued)
Definitions
Traceable
Lot/Batch
Physical product that is uniquely identified. In case of a grain supply chain, “a
traceable lot” is equivalent to “a lot of some bushels of bulk grain” and,
therefore, called a traceable lot.
▪ New traceable lot, 𝑻𝟏, 𝑻𝟐 ….𝑻𝒏−𝟏 (NTL): Refers to the lot which
becomes traceable once the previous traceable lot no longer exists in
the internal processing operations. The old traceable lot may not exist
because of transformation to the physical item during internal
processing.
▪ Old traceable lot, 𝑻𝒐 (OTL): The original traceable lot, which is
under consideration for traceability.
Traceable lot, 𝑇𝑛 (final dispatch): The lot which is the final product of
processing operations and is ready to be dispatched to the end
consumer but is still traceable.
▪ Working traceable lot (WTL): Refers to the lot which directly being
used under some operations. For example, raw corn is WTL for the
cleaning operation to create an NTL of clean corn.
Supply Chain
Participants,
Stakeholders,
Traceability
Partners
The actors or stakeholders performing various tasks, including ownership of
one or many traceable units, are the supply chain participants (SCP).
Logistic Unit Transportation units, for example, wagons, containers, trucks, railcars, and
ships.
Consolidation
Points
The common open or enclosed premises where product from various supply
chain participants is stored.
Unique
Identifier
A marker to differentiate traceable lot, storage bins and logistic units uniquely.
Lot A bulk collection of grain.
Lot Number A unique identification code assigned to a grain lot.
Bin A storage structure used to store grain or any bulk commodity.
Event Any activity occurring in the grain supply chain at any supply chain
participant. Example, storage and grinding are events.
Commingling The process of blending or mixing same raw material. For example, corn
procured from various farm facilities and elevators is commingled at
consolidation points. Commingled corn is group of several traceable lots.
First In First
Out (FIFO)
Last In First
Out (LIFO)
The traceable lot or unit which comes first in a facility or bin will be the one to
leave first.
The traceable lot or unit which comes last in a facility or bin will be the one to
leave first.
Bulk Load Out The event of preparing the grain for dispatch.

51
Table 4. (continued)
Definitions
Vulnerability The probability of failure of the traceability system after fulfilling traceability
requirements.
Traceability
Requirements
Conditions required to maintain traceability across the grain supply chain
according to specific traceability objectives.
Tracing The ability to be able to detect the history of origin and attributes of the
physical product.
Tracking The ability to follow the path of the physical product through the supply chain
Mixed Feed The feed containing necessary drug and vitamin dosage, as prescribed by the
veterinarian.
Batching and
Mixing
The event of mixing all feed ingredients and dividing them into batches for
ease of distribution.
Scaled Batch The batch of feed, which is weighed on a scale system, to determine the
amount of feed contained per batch.
Foreign
Material (FM)
Any undesired material such as dirt, dust, debris, metal, glass, rug particles in
raw corn or processed corn is referred to as FM.
Cleaned Mixed
Feed
The mixed feed which is cleaned or aspirated and is free from any kind of FM.
3.6.2 Methods and guidelines supporting traceability objectives for supply chain
participants
One of the challenges related to the bulk grain supply chain is to determine specific
methods to implement traceability across the grain supply chain participants. Since each supply
chain participant performs various processes, it becomes necessary to keep track of all events for
the purpose of ensuring traceability. As a traceability participant, the grain elevator performs the
events as listed below in Table 5. Traceability objective for the grain elevator is categorized with
reference to the grain elevator’s event. Each event performed should fulfill the traceability needs,
using the suggested method and guidance templates. In a traceability system, each supply chain
participant should identify their traceability objectives. Given below in Figure 2 is an illustration
of internal operations at the farmer stage.

52
Figure 2. Internal operations at the farmer stage of the corn supply chain
In Table 5, traceability objectives are discussed for achieving traceability. Traceability at
the farmer stage is achieved when conditions for all the identified traceability objectives are met.
The conditions for achieving traceability objectives for the farmer are shared under “METHOD”
title in Table 5.
Table 5. Description of traceability objectives for each event at farmer stage
EVENT 1: Reception of seed from seed company (Guidance template enclosed)
TRACEABILITY OBJECTIVE: Food defense
Group 1 Group 2 METHOD
• Seed • Protect against non-
GM seed
Accredited copy of proof that
the seed is non-GM
EVENT 2: Irrigation, pesticide treatment, harvesting
TRACEABILITY OBJECTIVE: Production practices
Group 1 Group 2 METHOD
Field Controlled treatment on field Regulated pesticide
treatment to prevent residues,
water testing report for
irrigation
(if using nearby water source
or in-house) 4
4 Group 1 refers to the physical product involved and group 2 refers to the characteristics related to the physical
product discussed in Group 1
FARMER Planting
Logistic unit
Storage Harvesting Pesticide
treatment Irrigation

53
Table 5. (continued)
EVENT 3: On-farm storage and handling
TRACEABILITY OBJECTIVE: Safety and quality
Group 1 Group 2 METHOD
Harvested corn Prevent cross contamination
from infected farm in close
vicinity
Record storage details
Given below in Figure 3 is an illustration of internal operations at the elevator stage.
Figure 3. Internal operations at the elevator stage of the corn supply chain
In Table 6, traceability objectives are discussed for achieving traceability. Traceability at
the elevator stage is achieved when conditions for all the identified traceability objectives are
met. The conditions for achieving traceability objectives for the elevator are shared under
“METHOD” title in Table 6.
Receiving
Blending/Commingling
ELEVATOR
Storage bins
Consoli
dation
point Distributor leg
(Handling
Equipment)
Logistic unit
Drying
Garner scale
Storage bins Load out system
Corn
remixing
Sorting
Cleaning

54
Table 6. Description of traceability objectives for each event at elevator stage
EVENT 1: Reception of corn from various farm locations (Guidance template
enclosed)
TRACEABILITY OBJECTIVE: Chain of custody and documentation
Group 1 Group 2 METHOD
• Raw corn • Location of farm
Record locational details
EVENT 2: Commingling at consolidation point (Holding)
TRACEABILITY OBJECTIVE: Production practices and documentation
Group 1 Group 2 METHOD
• Commingled corn
• Identity
preservation
Consolidation point (CP)
event template
EVENT 3: Handling of corn in storage bins
TRACEABILITY OBJECTIVE: Safety and quality and documentation
Group 1 Group 2 METHOD
• Commingled corn • Handling
equipment (HE)
from DB to
storage bins
Handling equipment
template
EVENT 4: Handling corn as per customer specifications
TRACEABILITY OBJECTIVE: Meet consumer demands
Group 1 Group 2 METHOD
• Commingled corn
• Drying
specifications
(Dry as per
specified MC%)
• Cleaning and
sorting
• Identity
preservation
Sorting required:
Moisture content %
Test weight
Clean for:
Foreign material
Damaged material
Identity preservation:
Bin identification
FIFO practice

55
Given below in Figure 4 is an illustration of internal operations at the corn processor stage.
Figure 4. Internal operations at the dry milling corn processor stage of the corn supply chain
In Table 7, traceability objectives are discussed for achieving traceability. Traceability at
the corn processor stage is achieved when conditions for all the identified traceability objectives
are met. The conditions for achieving traceability objectives for the corn processor are shared
under “METHOD” title in Tables 7.
Table 7. Description of traceability objectives for each event at processor stage
EVENT 1: Reception of corn from various farm locations and grain elevator (Guidance
template enclosed for all events)
TRACEABILITY OBJECTIVE: Chain of custody and documentation
Group 1 Group 2 METHOD
Raw corn • Location of farm(s)
• Location of
elevator(s)
Record locational details
Storage and distributor leg
Receiv
ing Cleanin
g
Separator
Grindin
g
Ingredi
ent
Mixing
Aspirator
Slurring
Liquefaction
Saccharificati
on
Fermentation Distillation
Whole
Stillage
Ethanol
Centrifug
ation Evapora
tor
Drying
Condensed
distillers
soluble
DDGS
CORN
PROCESS
OR: DRY
MILLING
CP

56
Table 7. (continued)
EVENT 2: Commingling at consolidation point (Holding)
TRACEABILITY OBJECTIVE: Production practices and documentation
Group 1 Group 2 METHOD
Corn
Identity preservation Consolidation point (CP)
event template
EVENT 3: Internal processing operations
TRACEABILITY OBJECTIVE: Production practices, safety and quality and
sustainability
Group 1 Group 2 METHOD
Commingled corn • Processing equipment
characteristics
(emissions)
• Transformation type
Internal processing template
EVENT 4: Dispatch
TRACEABILITY OBJECTIVE: Meet consumer demands
Group 1 Group 2 METHOD
• Finished product
• Label finished
traceable lots/units
• List of customers
Create unique identification
for finished product

57
Given below in Figure 5 is an illustration of internal operations at the corn processor stage.
Batch and mixing system for
capacities
Receivin
g other
ingredien
ts and
medicati
on
Micro bin
system for
feed 2
Mixed feed
cleaning
Pellet screening
Pelleting
Pellet
distribution
Distribution
leg
Distribution
leg
Storage
Storag
e
Mixed feed
cleaning
Receiving DDGS
from processor Receiving Corn
from elevator
Receiving Corn
from farmer Mixing
Sizing and
grinding
Receiving other
ingredients and
medication
Batch and mixing system for
capacities
Micro bin
system for
feed 1
Load out
CP FEED
MILL
Pellet screening
Pelleting
Pellet
distribution
Figure 5. Internal operations at the feed mill stage of the corn supply chain

58
In Table 8, traceability objectives are discussed for achieving traceability. Traceability at
the feed mill stage is achieved when conditions for all the identified traceability objectives are
met. The conditions for achieving traceability objectives for the feed mill are shared under
“METHOD” title in Tables 8.
Table 8. Description of traceability objectives for each event at feed mill stage
EVENT 1: Reception of corn, DDGS, other ingredients, prescribed drug (medication)
from various farm locations, grain elevator, and grain processor
(Guidance template enclosed for all events)
TRACEABILITY OBJECTIVE: Chain of custody and documentation
Group 1 Group 2 METHOD
• Raw corn
• Commingled corm
from elevator
• DDGS
• Other ingredients
(salt, sugar, water, oil,
bran, medication*)
*Specific to animal for which
the feed is produced
• Location of farm(s)
• Location of
elevator(s)
• Location of processor
• Location of suppliers
Record locational details
EVENT 2: Commingling at consolidation point (Holding)
TRACEABILITY OBJECTIVE: Production practices and documentation
Group 1 Group 2 METHOD
• Raw corn +
commingled corn
Specify owners of final
commingled lot
consolidation point (CP)
event template
EVENT 3: Internal processing operations
TRACEABILITY OBJECTIVE: Production practices, safety and quality and
sustainability
Group 1 Group 2 METHOD
Final commingled corn • Processing equipment
characteristics
(emissions)
Transformation type
Internal processing template
for feed mill

59
Table 8. (continued)
3.6.3 Best practices supporting traceability objectives
A best practice is a standardized procedure for practicing various tasks or events that has
consensus acceptance in its industry. In Section 3.6.2, the method described requires a standard
guidance template for implementation to provide a stepwise methodology. In Appendix A are
guidance template for ensuring best traceability practices for various grain supply chain
participants. The template can be customized as per operations, processes, and type of grain.
The best practices guidance templates examples for various bulk grain supply chain participants
are shared in Appendix A.
3.7 Conclusions
Understanding the applicable traceability objectives is essential in creating a traceability
system. The success in meeting traceability objectives is dependent on the events and
interactions among the participants in the supply chain. In this paper, we present a corn supply
chain system with farmer, elevator, dry milling ethanol plant and feed mill as traceability
participants. Guidance templates for each traceability participants were created which highlights
what and how the data is captured for achieving the listed traceability objectives. The guidance
template format developed in this article will help grain industries apply a standard, stepwise
methodology for managing data essential for meeting traceability needs. The guidance templates
created as part of this research presents the best practices for various complexities in a grain
EVENT 4: Dispatch
TRACEABILITY OBJECTIVE: Meet consumer demands
Group 1 Group 2 METHOD
• Finished
product
• Label finished
traceable lots/units
• List of customers
Create unique identification for
finished product

60
supply chain system, such as commingling and product transformation, along with summarizing
internal processing operations. This document serves as a model for grain supply chain
participants.
Prior research work and various standards have documented data elements necessary for
tracing and tracking the physical products in a food supply chain. The template presented in this
research article outlines an organized methodology for collecting data, which is critical to
traceability. This research attempts at creating a harmonization among various national and
international traceability standards, and it provides a data collection procedure for grain supply
chain participants. The first step is developing a common nomenclature or terminology related to
traceability in the grain supply chain. As there are several definitions available, each standard
defines traceability and the related terminology in their own way. The use of common
terminology will communicate a standard understanding of traceability practices across supply
chain participants. The result of this study was to define most used terms such as consolidation
point, blending, handling, storage, traceable lot among others for grain supply chain participants.
The guidance template captures process-related data as a part traceability requirement for
corn supply chain participants. In addition, this research highlights that bulk grain supply chain
participants, such as farmers, grain elevators, grain processors, and feed mills can become
traceability practitioners, through the implementation of the suggested guidance methods.
The guidance template includes information for each event at supply chain participant, for
example, guidance template for elevator is a three-page long document carrying information
about four major events. The elevator guidance template is required to capture information
relating to reception event, commingling event, handling event and handling grain as per
customer needs. Assigning roles and responsibilities for each supply chain participant creates an

61
ease of identifying the source of an undetected issue. For example, guidance documents for the
event of “reception of corn from various locations,” documents the identity of the corn and to
some extent addresses the issue of identity preservation. One of the major challenges is the
availability of an example where informational item are listed, across the supply chain
participants. All the data collected should be directed at fulfilling one, or several traceability
objectives, thereby, contributing towards achieving traceability in any supply chain system.
3.8 References
Alex Marvin, W., Schmidt, L. D., Benjaafar, S., Tiffany, D. G., & Daoutidis, P. (2012).
Economic Optimization of a Lignocellulosic Biomass-to-Ethanol Supply Chain. Chemical
Engineering Science. https://doi.org/10.1016/j.ces.2011.05.055
Arora, P. K., & Bhatia, R. (2018). Agent-Based Regression Test Case Generation using Class
Diagram, Use cases and Activity Diagram. Procedia Computer Science.
https://doi.org/10.1016/j.procs.2017.12.096
Bosona, T., & Gebresenbet, G. (2013). Food traceability as an integral part of logistics
management in food and agricultural supply chain. Food Control.
https://doi.org/10.1016/j.foodcont.2013.02.004
Complak, W., Wojciechowski, A., Mishra, A., & Mishra, D. (2011). Use cases and object
modelling using ArgoUML. Lecture Notes in Computer Science (Including Subseries
Lecture Notes in Artificial Intelligence and Lecture Notes in Bioinformatics).
https://doi.org/10.1007/978-3-642-25126-9_35
Cua, K. O., McKone, K. E., & Schroeder, R. G. (2001). Relationships between implementation
of TQM, JIT, and TPM and manufacturing performance. Journal of Operations
Management. https://doi.org/10.1016/S0272-6963(01)00066-3
Dabbene, F., Gay, P., & Tortia, C. (2014). Traceability issues in food supply chain management:
A review. Biosystems Engineering. https://doi.org/10.1016/j.biosystemseng.2013.09.006
Davison, J., & Bertheau, Y. (2008). The theory and practice of European traceability regulations
for GM food and feed. Cereal Foods World. https://doi.org/10.1094/CFW-53-4-0186
Diallo, T. M. L., Henry, S., & Ouzrout, Y. (2016). Effective Use of Food Traceability in Product
Recall. In Advances in Food Traceability Techniques and Technologies: Improving Quality
Throughout the Food Chain. https://doi.org/10.1016/B978-0-08-100310-7.00014-4
Dickinson, D. L., & Bailey, D. (2003). Willingness to pay for information: Experimental
evidence on product traceability from the U.S.A., Canada, the U.K., and Japan. Journal of
Agricultural and Applied Economics.

62
Eaton, D.L.and Groopman, J. D. (1994). The Toxicologyof Aflatoxins. Academic Press, New
York.
Economic Research Service. (2018). USDA ERS - Food Security in the U.S.
Farley, Amanda J. Feaster,Dennis Schapmire, Tara J D’Ambrosio, Josoph Bruce, LeAnn EC.
Shawn Oak, S. and B. K. S. (2009). The Challenges of Implementing Evidence Based
Practice: Ethical Considerations in Practice, Education, Policy, and Research. Social Work
& Society.
Food and Drug Administration - FDA. (2002). Public Health Security and Bioterrorism
Preparedness and Response Act of 2002. Public Law.
Fritz, M., & Schiefer, G. (2009). Tracking, tracing, and business process interests in food
commodities: A multi-level decision complexity. International Journal of Production
Economics. https://doi.org/10.1016/j.ijpe.2008.10.015
Golan, E., Krissoff, B., Kuchler, F., Calvin, L., Nelson, K., & Price, G. (2004). Traceability in
the U . S . Food Supply : Economic Theory and Industry Studies Library Cataloging
Record. Economic Theory.
Gong, Y. Y., Turner, P. C., Hall, A. J., & Wild, C. P. (2008). Aflatoxin exposure and impaired
child growth in West Africa: An unexplored international public health burden. In
Mycotoxins: Detection Methods, Management, Public Health and Agricultural Trade.
Gwirtz, J. A., & Garcia-Casal, M. N. (2014). Processing maize flour and corn meal food
products. Annals of the New York Academy of Sciences. https://doi.org/10.1111/nyas.12299
Henson, S., & Reardon, T. (2005). Private agri-food standards: Implications for food policy and
the agri-food system. Food Policy. https://doi.org/10.1016/j.foodpol.2005.05.002
Herrman, T., & Thomasson, J. A. (2011). Grain traceability and its role in food safety. Cereal
Foods World. https://doi.org/10.1094/CFW-56-4-0157
Hobbs, J. E. (2004). Information asymmetry and the role of traceability systems. Agribusiness.
https://doi.org/10.1002/agr.20020
Hu Jong, I. (2007). Development of gap and traceability system for greening the food chain in
Taiwan. Extension Bulletin - Food & Fertilizer Technology Center.
ISO 22000. (2007). In ISO 22000. https://doi.org/10.18356/070e6e4b-en
Jones, P. C., Kegler, G., Lowe, T. J., & Traub, R. D. (2003). Managing the seed-corn supply
chain at Syngenta. Interfaces.
Kärkkäinen, M., Holmström, J., Främling, K., & Artto, K. (2003). Intelligent products - A step
towards a more effective project delivery chain. Computers in Industry.
https://doi.org/10.1016/S0166-3615(02)00116-1

63
Karlsen, K. M., Dreyer, B., Olsen, P., & Elvevoll, E. O. (2012). Granularity and its role in
implementation of seafood traceability. Journal of Food Engineering.
https://doi.org/10.1016/j.jfoodeng.2012.03.025
Karlsen, K. M., Dreyer, B., Olsen, P., & Elvevoll, E. O. (2013). Literature review: Does a
common theoretical framework to implement food traceability exist? Food Control.
https://doi.org/10.1016/j.foodcont.2012.12.011
Kelepouris, T., Pramatari, K., & Doukidis, G. (2007). RFID-enabled traceability in the food
supply chain. Industrial Management and Data Systems.
https://doi.org/10.1108/02635570710723804
Khlangwiset, P., & Wu, F. (2010). Costs and efficacy of public health interventions to reduce
aflatoxin-induced human disease. Food Additives and Contaminants - Part A Chemistry,
Analysis, Control, Exposure and Risk Assessment.
https://doi.org/10.1080/19440041003677475
Laux, C. M., & Hurburgh, C. R. (2010). Using quality management systems for food traceability.
Journal of Industrial Technology.
Letelier, P. (2002). A Framework for Requirements Traceability in UML-Based Projects.
Proceedings of 1st International Workshop on Traceability in Emerging Forms of Software
Engineering.
Lewis, L. C., Bruck, D. J., Prasifka, J. R., & Raun, E. S. (2009). Nosema pyrausta: Its biology,
history, and potential role in a landscape of transgenic insecticidal crops. Biological
Control. https://doi.org/10.1016/j.biocontrol.2008.10.009
Lin, W., Price, G. K., & Allen, E. W. (2003). StarLink: Impacts on the U.S. corn market and
world trade. Agribusiness. https://doi.org/10.1002/agr.10075
Liu, W., Cheng, W., & Zhang, J. (2013). Study on the traceability system establishment of
safety-objective-oriented food logistics supply chain. Advance Journal of Food Science and
Technology. https://doi.org/10.19026/ajfst.5.3297
Liu, Y., & Wu, F. (2010). Global burden of Aflatoxin-induced hepatocellular carcinoma: A risk
assessment. Environmental Health Perspectives. https://doi.org/10.1289/ehp.0901388
Manzouri, M., Nizam Ab Rahman, M., Saibani, N., & Rosmawati Che Mohd Zain, C. (2013).
Lean supply chain practices in the Halal food. International Journal of Lean Six Sigma.
https://doi.org/10.1108/IJLSS-10-2012-0011
McKean, J. D. (2001). The importance of traceability for public health and consumer protection.
OIE Revue Scientifique et Technique. https://doi.org/10.20506/rst.20.2.1280
Medina, A., Akbar, A., Baazeem, A., Rodriguez, A., & Magan, N. (2017). Climate change, food
security and mycotoxins: Do we know enough? Fungal Biology Reviews.
https://doi.org/10.1016/j.fbr.2017.04.002

64
Mitchell, N. J., Bowers, E., Hurburgh, C., & Wu, F. (2016). Potential economic losses to the US
corn industry from aflatoxin contamination. Food Additives and Contaminants - Part A
Chemistry, Analysis, Control, Exposure and Risk Assessment.
https://doi.org/10.1080/19440049.2016.1138545
Monjardino de Souza Monteiro, D., & Caswell, J. A. (2011). The Economics of Implementing
Traceability in Beef Supply Chains: Trends in Major Producing and Trading Countries.
SSRN Electronic Journal. https://doi.org/10.2139/ssrn.560067
Mora, C., & Menozzi, D. (2008). Benefits of traceability in food markets: Consumers’
perception and action. Food Economics - Acta Agriculturae Scandinavica, Section C.
https://doi.org/10.1080/16507540903034907
Placinta, C. M., D’Mello, J. P. F., & MacDonald, A. M. C. (1999). A review of worldwide
contamination of cereal grains and animal feed with Fusarium mycotoxins. Animal Feed
Science and Technology. https://doi.org/10.1016/S0377-8401(98)00278-8
Rani, S., & Rana, M. (2018). Design of software testing model based on UML class and activity
diagram. International Journal of Engineering and Advanced Technology.
Russell, L., Cox, D. F., Larsen, G., Bodwell, K., & Nelson, C. E. (1991). Incidence of molds and
mycotoxins in commercial animal feed mills in seven midwestern states, 1988-1989.
Journal of Animal Science. https://doi.org/10.2527/1991.6915
Sahin, E., Zied Babaï, M., Dallery, Y., & Vaillant, R. (2007). Ensuring supply chain safety
through time temperature integrators. The International Journal of Logistics Management.
https://doi.org/10.1108/09574090710748199
Schmale, D. G. I., & Munkvold, G. P. (2018). Health, Mycotoxins in Crops: A Threat to Human
and Domestic Animal. In The American Phytopathological Society.
Storoy, J., Thakur, M., & Olsen, P. (2013). The TraceFood Framework - Principles and
guidelines for implementing traceability in food value chains. Journal of Food Engineering.
https://doi.org/10.1016/j.jfoodeng.2012.09.018
Sundstrom, F. J., Williams, J., van Deynze, A., & Bradford, K. J. (2002). Identity Preservation of
Agricultural Commodities. In Identity Preservation of Agricultural Commodities.
https://doi.org/10.3733/ucanr.8077
Thakur, M., & Donnelly, K. A. M. (2010). Modeling traceability information in soybean value
chains. Journal of Food Engineering. https://doi.org/10.1016/j.jfoodeng.2010.02.004
Thompson, M., Sylvia, G., & Morrissey, M. T. (2005). Seafood traceability in the United States:
Current trends, system design, and potential applications. Comprehensive Reviews in Food
Science and Food Safety. https://doi.org/10.1111/j.1541-4337.2005.tb00067.x
U.S. FDA. (2017). Party Animal Recalls Dog Food Due To Potential Presence of Pentobarbital.

65
United States Department of Agriculture Economic Research Service. (2018). USDA ERS -
Background.
USDA. (2013). Grain inspection handbook. Book II, Chapter 4: Corn. In Grain Inspection
Handbook.
USHHS. (2017). Recalls & Alerts.
Van Der Fels-Klerx, H. J., Liu, C., & Battilani, P. (2016). Modelling climate change impacts on
mycotoxin contamination. World Mycotoxin Journal.
https://doi.org/10.3920/WMJ2016.2066
Williams, J. H., Phillips, T. D., Jolly, P. E., Stiles, J. K., Jolly, C. M., & Aggarwal, D. (2004).
Human aflatoxicosis in developing countries: A review of toxicology, exposure, potential
health consequences, and interventions. American Journal of Clinical Nutrition.
Wu, F., Bhatnagar, D., Bui-Klimke, T., Carbone, I., Hellmich, R., Munkvold, G., … Takle, E.
(2010). Climate change impacts on mycotoxin risks in US maize. World Mycotoxin Journal.
https://doi.org/10.3920/WMJ2010.1246
Zain, M. E. (2011). Impact of mycotoxins on humans and animals. Journal of Saudi Chemical
Society. https://doi.org/10.1016/j.jscs.2010.06.006
Zhang, J., & Bhatt, T. (2014). A Guidance Document on the Best Practices in Food Traceability.
Comprehensive Reviews in Food Science and Food Safety. https://doi.org/10.1111/1541-
4337.12103

66
CHAPTER 4. MODELING A TRACEABILITY SYSTEM FOR THE SOYBEAN
SUPPLY CHAIN USING CRITICAL TRACEABILITY EVENTS AND KEY DATA
ELEMENTS IN ARGOUML
Richa Sharma1; Charles Hurburgh2; Gretchen Mosher3
1Ph.D. Candidate, Iowa State University; 2Professor, Iowa State University; 3Associate Professor, Iowa
State University
Modified from manuscript to be submitted to Comprehensive Reviews in Food Science and Food
Safety Journal
4.1 Abstract
Developing a traceability system for the soybean supply chain includes consideration of
various events or transition points through the supply chain. Many different soybean varieties are
stored, handled, transformed, and moved within and across the soybean supply chain, which
makes it difficult to record attributes for various events. In this paper, a system modeling design
approach is used to implement traceability through identifying critical traceability event (CTE)
and listing key data elements (KDE) for each CTE in the soybean supply chain. There are vast
amounts of data related to various events in the supply chain, may it be critical or not. The
system model design attempts to streamline events that are critical or important for achieving
traceability and categorizes various events into four broad categories as Movement CTE,
Transformation CTE, processing CTE and Holding & Handling CTE. The critical traceability
events are then assigned data elements that are essential for achieving many traceability
objectives, as discussed in Chapter 3. The system modeling design is a visual platform for
developing an architecture for data-based models. The software used to develop this CTE-KDE
model is ArgoUML. The developed model shows the nature of different interactions among
supply chain participants and assigns a specific owner to listed key data elements. The model
will help bulk grain supply chain participants to visualize events that are critical and generate a

67
list of key data elements required for achieving one or many traceability objectives. The model is
transferrable to many software languages such as XML, which makes this model easily
convertible to a software program.
KEYWORDS: Supply chain traceability; key data elements; critical traceability events;
traceability system
4.2 Introduction
A typical bulk grain supply chain is made of sequential events between successive
supply chain participants, farmers, elevators, logistic units, processors, end-users and consumers.
An event refers to an individual internal processing operation or transactions in the supply chain.
For example, in a soybean supply chain, movement of raw soybeans from an elevator to a
soybean processor is an event. The soybean supply chain is multi-functional. It procures
soybeans from multiple suppliers and distributes various products such as soymilk, soybean oil,
soybean meal, and soybean flour to many other food and feed supply chain systems. For
example, soybean flour and soybean oil are used in the bakery supply chain, isolate soy protein is
used as an ingredient in the sports nutrition industry, and soybean meal is used by the feed
industry. Figure 1 illustrates the multi-functional nature of soybean.
Typically supply chain is external and internal. The external supply chain connects
suppliers to clients in a supply chain. The internal supply chain considers the internal processing
operations within an individual client or supplier (Thakur & Donnelly, 2010).
Traceability is becoming important for the following reasons: (i) consumer awareness;
and (ii) complex nature of interactions among various food and feed supply chains. Traceability
in the bulk grain supply chain system typically requires effort in the following three major event
areas:

68
(i) Stakeholder to Stakeholder (S2S) interaction: Represents the complex interaction among
supply chain participants. S2S interactions are one-to-one, many-to-one, and one-to-many. The
S2S interaction is similar to an external supply chain system. For example, a grain elevator may
have more than one supplier i.e. three or more farmers or other elevators as suppliers making it a
many-to-one interaction,
(ii) Event to Stakeholder (E2S) interaction: Each stakeholder performs a function or
operation, which is called an event. The event(s) related to a stakeholder becomes a E2S
interaction. For example, a farmer (S) performs events such as sowing, irrigation, and harvesting,
(iii) Data to Event (D2E) interaction: Every event is associated with some information or data
and the presence of data with each event represents a D2E interaction. For example, an event of
processing raw corn to flour carries information about the type of equipment used (e.g., Roller or
Ball mill), quantity of raw grain used, quantity of flour produced, data and time of occurrence of
event, and person responsible for this event.
However, the most challenging area in addressing traceability is the ability of bulk grain
stakeholders to collect and maintain data related to each event, which is a D2E interaction.
Understanding of S2S, E2S and D2E interaction helps to better map out the importance of
various events in the supply chain and determines event which are critical and who holds
ownership related to events and collection of key data. The critical traceability event-key data
element (CTE-KDE) approach focusses on supply chain interactions and substantiates on
importance of collecting key data. Critical traceability events would relate event(s) to a
stakeholder or a supply chain participant (E2S) to establish responsibility of ownership of events
and consequently list data elements to an event (D2E interaction) necessary for achieving
traceability objectives. The process of E2S and D2S is circular in both external and internal

69
supply chain system. The external supply chain system is the S2S interaction as described
previously in section 4.2 (i).
The CTE-KDE approach is gaining traction and is based on data ownership, events, and
information protection (Aung & Chang, 2014). The CTE-KDE framework recognizes the
importance of collecting data elements and provides a standardized method on how to collect
data related to each event. The CTE-KDE approach focuses on occurrence of events, more than
on the product itself, to achieve traceability objectives such as food safety, data control, chain of
custody, and regulatory compliance. The CTEs rely on commitment from stakeholders to collect,
store, and control data related to each CTE and to make it retrievable in case of recall.
Section 4.3 elaborates on critical traceability events and related key data elements in a
traceability system. This research develops a CTE-KDE-based system to identify, trace and track
critical events in a soybean supply chain using ArgoUML which is a software used to develop
model-driven designs (Complak, Wojciechowski, Mishra, & Mishra, 2011).
A model-design is a visual method to describe various events, interactions and data. The
basic principle of using ArgoUML is to create a model using unified modeling language to
represent events occurring in a process. Unified modeling language is a tool which represents
data and knowledge in text to a standard graphical notation (Arora & Bhatia, 2018). and to assign
specific key data elements that accompany each CTE. Class diagrams are a function of the UML.
Class diagram allows definition of events for the user or the supply chain participant and attaches
a list to a respective class (Letelier, 2002). The model developed in this research utilizes the class
diagrams to represent critical traceability events and key data elements. The user can visually
interpret missing data elements that may compromise the traceability objectives, chain of
custody, consumer demands, documentation, regulatory needs and risk management.

70
Figure 1. Schematic of the soybean supply chain
4.3 Critical traceability events and key data elements
Grain traceability in the soybean supply chain supports safe and reliable flow of
ingredients and data, respectively, among the farmer, elevator, soybean processor, soybean
consumer, and feed mill. Traceability is implemented in the food supply chain through the
following: (i) identifying events or processes; (ii) recording necessary data that is associated with
identified events; and (iii) focusing on stakeholder’s traceability objectives (Aung & Chang,
2014; Bertolini, Bevilacqua, & Massini, 2006; Bhatt et al., 2013; Bosona & Gebresenbet, 2013).
The CTE-KDE approach is becoming popular because it is fast and effective (Mejia et al., 2010).
The security and inclusiveness of the CTE-KDE approach is controversial because it allows each
stakeholder to pre-determine important events in their internal system along with data protection
because the internal information is proprietary (Aung & Chang, 2014). The CTE-KDE model

71
enables inclusivity for supply chain stakeholders through identifying data elements within
exclusive stakeholder packages that can be connected. The details of the CTE-KDE traceability
system are discussed below.
4.3.1 Critical traceability events
CTE are specific transition points or nodes in the supply chain where the data captured are
critical or necessary to enable traceability. The CTE have some specific characteristics that gets
associated in form of data elements. For example, An event of cleaning raw soybean becomes
critical traceability event because if cleaning event is not done properly would compromise the
food safety and quality traceability objective. The characteristic or data element that would help
in ensuring the food safety and quality traceability objective are documenting calibration of the
cleaning equipment, recording history of previous lots handles in the cleaning equipment,
weighing the amount of raw soybean cleaned and reporting the amount of foreign material
collected. Any CTE requires a complete and specific list of operations and equipment. The types
of CTEs in the soybean supply chain are described below as:
Movement: The flow of physical product from one soybean stakeholder to another forms a
movement CTE is always a CTE for all traceability objectives. For example, a movement CTE is
when soybean moves from the farmer to the elevator or not limited from the elevator to the
processor. This would also include internal product movements. “Movement CTE” is classified
into the categories described below.
(i) Bin to Bin movement: When soybean is physically moved from one bin to another for
storage and handling purposes. The bin to bin movement may be at the same facility or at
different facilities.
(ii) Pit to Bin movement: When soybean is physically moved from a receiving to assigned
bin(s) for storage and/or further handling.

72
(iii) Process movement: When soybean is carried between internal processes at the processor
end, producing one or many finished product(s). Key here is defining processes and processing
steps.
(iv) Receiving movement: Reception of grain or any other ingredient.
(v) Dispatch Movement: Dispatch of grain or any other ingredients).
Holding: The event of storing soybean for a time that can affect soybean’s physio-chemical
properties. For example, storing soybean in silos at a grain elevator is a holding CTE because it
is stored beyond where soybean could become moldy or wet if not properly aerated, or is too
wet.
Handling: The process(s) involved in handling of raw soybean and soybean products in the
supply chain. For example, keeping silos clean and fumigating to prevent pests are the processes
involved in successful handling.
Transformation: Any alteration made to the identity or physical state or form of a traceable
unit. Each type of transformation creates a unique traceable unit or lot, and therefore, should be
uniquely identified. In the soybean supply chain, transformation can be of three types, which are
described below:
(i) Type 1 or TType(1): The transformation that alters the identity of the traceable lot.
Blending (Commingling)–splitting–grouping–repacking is a type 1 transformation.
(ii) Type 2 or TType(2): A transformation that alters the physical appearance and properties
of the traceable lot. Soybean hulls, soy meal, soy chip, soybean flakes and ground soybeans grain
are examples of type 2 transformations. A new traceable lot of the transformed product is
generated from a type 2 transformation. The new traceable lot is comprised of soybean hulls, soy
chip, soy meal and defatted flakes.

73
(iii) Type 3 or TType(3): A transformation that alters the physical appearance and physio-
chemical characteristics of the traceable lot either through addition of ingredients or through
series of processes, such as extraction and drying. A new traceable lot of the transformed product
is generated from a type 3 transformation. Solvent extraction is a critical event for achieving type
3 transformation, such as soybean oil, and in this case the new traceable lot is soybean oil.
Processing: A series of events and equipment (if required) that are involved in a transformation
CTE is referred to as a processing CTE. For example, to transform type 2-soy meal, a series of
events involved could be as follows: cleaning; cracking, dehulling, conditioning, flaking, solvent
extraction, and grinding. The equipment that is involved include the following: screen, aspirator,
conveyor, cracking roller, rotary steamer, cylindrical roller, evaporator and grinder.
4.3.1.2 Key data elements
Data are associated with critical traceability events. They capture information
regarding the owner, location, and attributes related to the CTE. The information collected in key
data elements should support tracing and tracking of related critical traceability events. Previous
literature on the CTE-KDE framework suggests that for successful traceability, some required
key data elements are owner information, date, time, location of event, lot number, batch number
and unit of measure (Herrman & Thomasson, 2011; McKean, 2001; Olsen & Borit, 2018;
Thompson, Sylvia, & Morrissey, 2005; Zhang & Bhatt, 2014). The collection of data elements is
objective specific, for example, chain of custody as objective the key data elements are location
of event, lot number (lot#) and batch number (batch#). CTEs are always identified with specific
KDEs. The fulfillment of the listed KDEs under each CTE are required for traceability. Table 1
shows a possible list of required CTE-KDE for the farmer and grain elevator. The complete
CTE-KDE framework is shown in section 4 with all mandatory key data elements, assuming
chain of custody is a traceability objective.

74
Table 1. List of key data elements for the critical traceability events for the farmer and elevator. Mandatory key data elements (mKDE)
Stakeholder name: Farmer
CTE KDE
Movement
+Receiving movement
+Dispatch movement
+Nametype: Name- Soybean seed Agate; Type:
GM
+Amount: 50; Unit of measure: lbs./bag; Total
bags received: 40
+Location coordinates: 41.66 degrees north,
−91.22 degrees west
+Amount dispatched
+Name of client
Transformation
+TType(2)- Harvesting
+Name: Water source type: Point source (in-
house well)
+Amount: Harvested Yield- 4856; Unit of
measure: Bushels
Handling and Holding
+Storage
Grain type: SoybeanAgate
Number of storage type: 5
Type of storage: 3 concrete silos; 1 warehouse; 1
wagon
Storage location coordinates:
Storage sanitation log: Yes maintained
Movement
+Receiving movement
+Traceable lot (Ingredient01): Soybean Agate
+Amount: 2000; Unit of measure: Tons
+Receiving location coordinates (RLC): 41.66-
degree North, −91.22 degrees west
+Receiving location date: 08/02/2019
+Bin ID#
+Dispatch movement +Amount from above Bin ID #
+Total Amount dispatched
+Name of client
Handling and Holding
+Storage
+Traceable lot: Bin ID#
+Amount in bin
+Name of ingredient: Soybean Agate
+Incoming RLC
+Sampling SOP#
+Mycotoxin test records

75
4.4 Methodology
It is difficult to realize the conceptual data-based models as web application tools. The
most common approach is to develop a model-driven design. Such model-driven designs visually
place various events, interactions, constraints and data in a process model which serves as an
architecture to be developed into a software application. Unified Modeling language (UML) is a
well-known tool that can support model-driven design for generation of web applications
(Knapp, Koch, Moser, & Zhang, 2003). In this paper UML-based methodology (ArgoUML) was
used to design a CTE-KDE based traceability model in the soybean supply chain. The UML-
based modeling provides both structural and behavioral designs (Knapp, Koch, & Zhang, 2005).
Structural design represents the dynamics of processes and supply chain interactions, whereas,
behavioral design incorporates data elements related to every event in the supply chain system.
ArgoUML captures model requirements in the form of class diagram, use case and
activity diagrams (Complak, Wojciechowski, Mishra, & Mishra, 2011). Class diagrams
illustrates workflow of various activities and interactions among participants. In this paper,
ArgoUML (v0.34) is used to develop the CTE-KDE traceability model. ArgoUML is tool to
generate codes for programming languages (Rani & Rana, 2018). The ArgoUML uses a code
generator approach for publishing in the Extensive markup language (XML) framework (Koch &
Kraus, 2003). The primary focus of XML framework is to share data or model elements through
a software platform, thereby developing a structured user-friendly program. The XML code for
the model generated are shared in Appendix B. A CTE-KDE traceability model requires
structural design for defining CTEs for each stakeholder; and behavioral design for listing KDEs
and relating each KDE to its respective CTE. Class diagram is a function in the UML-based
methodology or ArgoUML to represent both critical traceability event and key data element.

76
Identification of CTE and KDE helps a grain industry participant to easily locate critical
events and data elements required for achieving traceability objectives. The soybean supply
chain is an example to represent critical traceability events and list associated key data elements.
The types of CTEs as categorized in section 2 are used to describe events in the CTE-
KDE model generated using ArgoUML software. The CTE-KDE framework uses some
modeling elements as described below.
(i) Package: An element that comprises of many classes. Package are of two types- (i)main
package and (ii) subordinate package. Main packages are supply chain participants, farmer,
elevator, processor. Subordinate package carries data elements or information related to main
package or supply chain participants. For example, the elevator package comprises activities or
events such as receiving, storage, and dispatch. The traceability model has the following two
types of packages: (a) stakeholder(s) package or main package, which is represented by various
soybean supply chain stakeholders; and (b) stakeholder(s) lists package or subordinate package,
which contains a list of mandatory data information or mKDE.
(ii) Class: A class is represented by events in the supply chain system. The class is divided
into three sections. The top section is for identifying the name of the event, the middle section is
for listing attributes for the specific event, and the bottom section specifies the type of CTE.
(iii) Interface: The interface feature is an extension plugin for listing the type of data that are
important to document for a specific critical traceability event. The interface element generates a
list of the required data to ensure traceability. The command “realizes” means the interface will
generate the associated list for the event. For example, the interface “IListBins” in the
“Processor” package that is associated with the storage event will generate “Storage Bin List”

77
from the “ProcessorLists” package. The interface element applies a function, which requires the
executable file to document the interface-realized list of required data.
Table 2. Abbreviations used in the ArgoUML model
Model abbreviations and
terminology
Definitions
FarmerLists Package that contains list of clients and suppliers for the
farmer.
Logisticidentifier Carrier unit that carries the grain or product under
movement.
String Allows the model to enter a combination of text and
numeric information.
Integer Allows the model to enter numeric information.
Interface Model element responsible for linking an activity or event
with all key data elements (KDE).
Working conditions Includes temperature, pressure, ingredients required for a
processing operation.
Tempconditions Temperature required to be maintained during the
processing operation.
BinID# Storage bin identification number.
<<realize>><<document>> Model command to initiate and document all available
KDE with the activity interface.
<<create>> Model command representing the activity of one package
is the joining link with the activity of another package.
IPop1 First internal processing operation, in the soybean supply
chain IPop1 is cleaning operation of received soybean.
WTL Working traceable lot, the lot under processing. The
working traceable lot for the cleaning processing
operation is the received soybean.
NTL New traceable lot, the new lot achieved after the relevant
processing operation. The new traceable lot for the
cracking operation is cracked soybean lot.
FP Finished product
UCI Unique client identifier, the license plate number of the
carrier used by client.
RLC Receiving location coordinates, the locational coordinates
of the location receiving the raw material(s).
RLD Receiving location date, the date on which the raw
material(s) are received.

78
Table 2. (continued)
Model abbreviations and
terminology
Definitions
SP Soybean processor
EL Elevator
FM Feed Mill
FMop Feed mill processing operations. For example, sizing,
grinding, mixing, batching, pelleting.
4.5 Results
The ArgoUML traceability model comprises the following eight packages: farmer,
elevator, processor, feed mill, farmer lists, elevator lists, processor lists, and feed mill lists. Each
package contains a class element, an interface element, and interactions. Given below in Figure 2
shows the generic flow of the model. Supply chain participants as packages are linked to each
other and each individual package is also linked to lists package, carrying information or data
elements for individual supply chain participant. The ArgoUML tool allows entry of data such
as: (a) String, (b) Date, and (c) Integer. Text can be entered by selecting the “string” command.
The date and time are entered using the “date” command and locational coordinates are added
using the “integer” command.

79
Figure 2. Schematic of the CTE-KDE generic model framework in the bulk grain supply chain
4.5.1 Modeling traceability system for the soybean supply chain using the CTE-KDE
traceability system
Figure 3 given below illustrates the CTE-KDE traceability system. The model consists of
main packages and subordinate packages. The main packages are farmer, elevator, processor,
and feed mill. Every main package has a subordinate package that provides a description of key
data elements. “Farmer lists package” is a subordinate package to “farmer package” and it
contains a list of key data elements that should be captured and documented to achieve
traceability. The main package is linked to the subordinate package using an interface through
classes. The processor package consists of the following 10 classes: (a) receiving; (b) storage;

80
(c) Internal processing operation (IPop) IPop 1; (d) IPop 2; (e) IPop 3; (f) IPop 4; (g) IPop 5; (h)
IPop 6; (i) storage- finished product; and (j) dispatch. Classes represents the name, owner, and
type of critical traceability event. An IPop 1 class is a cleaning activity, where Drum magnet
DFRT equipment is used to clean received soybean. An IPop 1 class is a cleaning activity, where
Drum magnet DFRT equipment is used to clean received soybean. Some other attributes
described for the IPop 1 cleaning activity are as follows:
(i) Owner of the activity: Processor
(ii) Capacity of equipment to clean in one batch
(iii) Batch number: 12_789
(iv) Amount of foreign material: 3 bushels
(v) Type of critical traceability event: Processing and Transformation type 2
(vi) Working traceable lot (WTL): received soybean from client list
(vii) New traceable lot (NTL): Cleaned soybean which is routed to activity IPop2
Similarly, the model illustrates all critical traceability events for each class or activity in
the package and interfaces with key data elements.
Some other properties of the ArgoUML model are shared in Figure 6. The model can
generate individual databases for each class. For example, the IPop1 (Internal processing
operation 1) class shared in Figure 5 has a database bank which carries all the information related
to the respective internal processing operation such as batch number, name of event, amount of
soybean. A user can upload supporting documentation using the dialog box shared in Figure 6.

81
Figure 3. Traceability model (critical traceability event and key data element) for the soybean supply chain using ArgoUML

82
The ArgoUML tool records all information regarding the associations or dependencies of
the class and creates an automated checklist for each class, as shown below in Figure 5, 6 and 7
for the class IPop1 of package processor.
Figure 4. Illustrates the Processor package of the ArgoUML traceability model for the soybean
supply chain
Figure 5. Processor Class in the processor package of the ArgoUML CTE-KDE model

83
Figure 6. Properties dialog box for the Internal Processing operation class in the processor
package of the ArgoUML CTE-KDE model
4.6 Conclusions
Data management is a complex task for tracing and tracking various activities and
physical product in a grain supply chain setting. Grain lots are commingled at the elevator,
processor, and feed mill stages and data related to identity of the lots is often not recorded.
Managing and recording key data elements are essential for achieving traceability objectives
along the grain supply chain. The primary objective of this paper is to model large amounts of
data associated with critical traceability events in a standard graphical notation. The ArgoUML
model graphically represents the key data elements required for achieving traceability across the
soybean supply chain and establishes ownership of information to respective supply chain
participants. For bulk grain supply chain participants such a model will help in identifying all
key data elements for events that are critical in achieving traceability. This research categorizes
various critical traceability events providing a structured and standard approach for grain
industry participants to identify their respective events as critical.
Implementing an effective traceability system depends on various critical traceability
events or activities and data elements in a grain supply chain. Events or activities in a grain

84
supply chain are transition points and are classified as critical because capturing data at this
transition point is critical to enable traceability. All critical traceability event(s) information
should be recorded with a specific supply chain stakeholder and should be easily retrievable at
the time of recall. The key data element list provided as part of the model will enable users to
understand the gap in information collected. The KDEs are mandatory to ensure traceability
objectives.
Another important consideration in developing a traceability system is to determine the
owner of all the retrievable information. In the grain supply chain, data such as the process
parameters, cooking temperature, and recipe logs are proprietary, and therefore, the right to share
process information lies with the proprietary owner. However, for traceability, the traceability
system recommends proprietary owners to have the necessary documentation to authenticate
their participation in traceability efforts and to locate the origin of problem.
Application of the CTE-KDE traceability model in the grain supply chain is the next step.
The implementation is easy and will help to establish critical traceability events and necessary
key data elements. Real-time application of the model for individual supply chain stakeholders
and for the entire supply chain would provide insight into limitations of this model.
4.7 References
Aung, M. M., & Chang, Y. S. (2014). Traceability in a food supply chain: Safety and quality
perspectives. Food Control. https://doi.org/10.1016/j.foodcont.2013.11.007
Bertolini, M., Bevilacqua, M., & Massini, R. (2006). FMECA approach to product traceability in
the food industry. Food Control. https://doi.org/10.1016/j.foodcont.2004.09.013
Bhatt, T., Buckley, G., McEntire, J. C., Lothian, P., Sterling, B., & Hickey, C. (2013). Making
Traceability Work across the Entire Food Supply Chain. Journal of Food Science.
https://doi.org/10.1111/1750-3841.12278
Bosona, T., & Gebresenbet, G. (2013). Food traceability as an integral part of logistics
management in food and agricultural supply chain. Food Control.
https://doi.org/10.1016/j.foodcont.2013.02.004

85
Complak, W., Wojciechowski, A., Mishra, A., & Mishra, D. (2011). Use cases and object
modelling using ArgoUML. Lecture Notes in Computer Science (Including Subseries
Lecture Notes in Artificial Intelligence and Lecture Notes in Bioinformatics).
https://doi.org/10.1007/978-3-642-25126-9_35
Herrman, T., & Thomasson, J. A. (2011). Grain traceability and its role in food safety. Cereal
Foods World. https://doi.org/10.1094/CFW-56-4-0157
Knapp, A., Koch, N., Moser, F., & Zhang, G. (2003). ArgoUWE : A CASE Tool for Web
Applications. 1st International Workshop Engineering Methods to Support Information
Systems Evolution (EMSISE’03).
Knapp, A., Koch, N., & Zhang, G. (2005). Modelling the behaviour of Web applications with
ArgoUWE. Lecture Notes in Computer Science.
Koch, N., & Kraus, A. (2003). Towards a common metamodel for the development of web
applications. Lecture Notes in Computer Science (Including Subseries Lecture Notes in
Artificial Intelligence and Lecture Notes in Bioinformatics).
McKean, J. D. (2001). The importance of traceability for public health and consumer protection.
OIE Revue Scientifique et Technique. https://doi.org/10.20506/rst.20.2.1280
Mejia, C., McEntire, J., Keener, K., Muth, M. K., Nganje, W., Stinson, T., & Jensen, H. (2010).
Traceability (Product Tracing) in Food Systems: An IFT Report Submitted to the FDA,
Volume 2: Cost Considerations and Implications. Comprehensive Reviews in Food Science
and Food Safety. https://doi.org/10.1111/j.1541-4337.2009.00098.x
Olsen, P., & Borit, M. (2018). The components of a food traceability system. Trends in Food
Science and Technology. https://doi.org/10.1016/j.tifs.2018.05.004
Thompson, M., Sylvia, G., & Morrissey, M. T. (2005). Seafood traceability in the United States:
Current trends, system design, and potential applications. Comprehensive Reviews in Food
Science and Food Safety. https://doi.org/10.1111/j.1541-4337.2005.tb00067.x
Zhang, J., & Bhatt, T. (2014). A Guidance Document on the Best Practices in Food Traceability.
Comprehensive Reviews in Food Science and Food Safety. https://doi.org/10.1111/1541-
4337.12103

86
CHAPTER 5. VULNERABILITY ANALYSIS USING EVIDENCE-BASED
TRACEABILITY IN THE GRAIN SUPPLY CHAIN
Richa Sharma1; Charles Hurburgh2; Gretchen Mosher3
1Ph.D. Candidate, Iowa State University; 2Professor, Iowa State University; 3Associate Professor, Iowa
State University
Modified from a manuscript to be submitted to Comprehensive Reviews in Food Science and
Food Safety Journal
5.1 Abstract
This paper analyses the approach of identifying critical traceability events (CTE) and
corresponding key data elements (KDE). The CTE-KDE approach is an evidence-based process
that identifies, and documents activities performed by each supply chain participant. It then
assigns a set of information items to each critical event as KDE. For example, storage of grain is
identified as a CTE performed under grain elevator, and the necessary KDE includes the location
of storage bins and supplier details. The CTE-KDE approach requires verifiable data, and ability
to assess graduated levels of success based on data. This paper proposes the use of vulnerability
analysis to predict levels of success in each CTE-KDE situation. A vulnerability analysis model
identifies, quantifies, and prioritizes various factors responsible for reducing the efficacy of a
system. Vulnerability analysis measures system attributes (data) related to: (i) frequency of
occurrence; (ii) degree of impact of occurrence; and (iii) likelihood of detection. This paper
applies vulnerability analysis as a standard method for identifying when and how a traceability
system will fail.
Vulnerability analysis of an evidence-based CTE-KDE framework accounts for complex
interactions among supply chain participants’ critical activities. The need for standard measures

87
of evaluating traceability systems is clear. Such analysis must restrict CTE to be measurable
events and key data elements to be measurable system attributes.
Keywords: vulnerability, critical traceability events, evidence-based method, key data
elements.
5.2 Introduction
The grain supply chain is a complex network of various supply chain participants: farmer,
grain elevator, grain processor, distributor, and end-consumer. Each participant performs several
activities supporting their underlying objectives. Some traceability objectives include: (i)
documenting chain of custody; (ii) protecting brand integrity; (iii) meeting customer demands;
(iv) ensuring fair global trade; (v) recording sustainability of processes across the supply chain.
Traceability is necessary to ensure food safety, food security and connect consumers and market
operators (W. Liu, Cheng, & Zhang, 2013). Additionally, a traceability system is necessary to be
developed for ensuring the safety and wholesomeness of food using information related to the
product under consideration (Mora & Menozzi, 2008). There is growing interest in traceability in
the grain supply chain to meet business transparency needs and consumer expectations.
Application of an effective traceability system requires precision in data collection and
identification of which unit to trace or track. The precision of traceability systems has not been
studied in detail. There is a lack of framework and terminology for application in various supply
chains (Karlsen, Dreyer, Olsen, & Elvevoll, 2012). Essentially, a traceability system should be
able to both qualitatively and quantitatively address the gaps in the supply chain system. An
effective system should comply with verifiable compliance programs, locate sources of the
issues, demonstrate areas where corrective actions are necessary and identify mandatory data
elements (Hu Jong, 2007). Traceability should be able to determine the source of non-

88
compliance and perform a targeted recall if product safety is in question (Manzouri, Nizam Ab
Rahman, Saibani, & Rosmawati Che Mohd Zain, 2013).
A traceability program is recommended to record information related to critical processes.
For example, sampling and testing of mycotoxin records are critical where the traceability
objective is food safety and quality, therefore maintaining proof of information related to
sampling and mycotoxins becomes an important part of the traceability program.
Events critical in achieving traceability for given objectives are called critical traceability
events (CTEs). Internal processing operations performed by supply chain participants normally
always as CTEs. Another important consideration is associating traceability data with CTEs.
Traceability data associated with a processing operation, step, activity or event (used
interchangeably) may be minimum, containing information about date of manufacture, expiry
data and batch number or more targeted information such as serialized item code (Diallo, Henry,
& Ouzrout, 2016). Traceability data selected for each CTE is referred to as key data element
(KDE). The selected data elements should allow identification of all possible aspects or attributes
of a product such as, batch number, sanitation log, operator information, product label and
specifications related to the product if chain of custody and safety are traceability objectives
(Storoy et al., 2013).
Traceability requirements are stated in both national and international standards but fails
to provide a structured framework to determine success of traceability when applied to a supply
chain system (Bosona & Gebresenbet, 2013). The objective of this paper was to develop a
structured approach to determine when and how a traceability system may fail or be vulnerable.
The first step is to develop an evidence-based traceability system and rank the criticality of a
processing step or CTE based on relevant recall data and literature where food safety and quality

89
is the traceability objective. The second step is to determine the frequency of occurrence of a
CTE, and the ability to detect its related key data elements. Then, the vulnerability of the
traceability system is calculated suggesting when and how the traceability system may fail.
5.3 Evidence-based traceability system
The main function of a traceability system is to deliver documented information through
all stages of a supply chain (W. Liu, 2013). Information that can be validated either through
scientific literature or real-time observation is referred to as evidence. The evidence-based
traceability system will identify CTEs and record associated key data elements. One of the
reasons for developing an evidence-based model is availability of practical theories and views,
which carry vast amount of information (Farley, Amanda J. Feaster, Dennis Schapmire, Tara J.
D., Ambrosio, Josoph Bruce, LeAnn E.C., & Shawn Oak, 2009).
The CTE-KDE approach breaks down the supply chain system into activities or events,
termed as CTEs to detect all potential failure events, and their effect on the supply chain
traceability. Documenting data elements for every critical event is an evidence-based method to
reduce the risk of failure of events. An evidence-based traceability system identifies specific
CTEs as potentially responsible for failure of a traceability system.
Evidence-based traceability in complex supply chain systems has become important
because of consumer’s expectation to know more about the products and to be able to recall
products easily. Evidence-based systems simplify decision-making with a structured approach.
In the United States, about 70–80% of grain is consumed as animal food (United States
Department of Agriculture Economic Research Service, 2018). According to the U.S. Food and
Drug Administration (FDA), 46 animal food recalls were reported in 2017 alone (FDA, 2017).
Grains and grain products, excluding the bakery sector, share the fourth position in increasing
number of recalls since 2004 (Economic Research Service, 2018). Three-year (2019–2017) U.S.

90
recall data related to grain and grain products was analyzed. The recall data analysis gives
evidence for why a recall occurred. The reasons of recall (ROR) were directly related to events
in the respective supply chain(s). Based on this understanding, the ROR segregated the number
of recall cases. Also, CTEs were identified for each ROR through listing the potential processes
where negligence has caused the recall to occur, for example, presence of Salmonella may have
occurred due to negligence in sanitary conditions during handling (rodent excreta may contain
Salmonella). In this article, the evidence-based traceability system assigns a criticality number to
CTEs based on two types of evidence:
5.3.1 Food and Drug Administration’s recall data
Recalls typically occur due to failure in execution of recommended guidelines in the
supply chain events. Evidence-based traceability system identifies CTEs as events responsible
for occurrence of recalls. Analysis of FDA’s recall data in the grain products sector determined
the most common reasons for occurrence of recalls. Table 1a presents the analysis of the generic
recall data. There were a total 108 grain product recall cases (2019–2017) (Economic Research
Service, 2018). Some of the observed ROR were- presence of Salmonella, E. coli, Listeria
monocytogenes; presence of foreign material; drug carryover; and cross contamination.
In Table 1a, number of cases of recall is segregated by cause of occurrence, CTE(s), and
criticality level for each CTE. The maximum number of recall cases, 54, was associated with
CTE- processing, storage and handling. Therefore, the criticality level for processing, storage,
and handling CTE was set at 5; refer Table 1a and Table 1b for the criticality level assignment
scale. In an evidence-based traceability system, events associated with the maximum number of
recalls are considered highly important as a higher number denotes non-compliance with one or
many traceability objectives, such as: (a) safety and quality; (b) chain of custody; (iii)
documentation; (iv) sustainability; (v) production practices.

91
The underlying reason for unsuccessful handling of any recall is because of lack of
evidence of key data elements, and improper implementation of process guidelines for the event
in question. Table 1a shows the ranking of criticality number for various reasons for recall.
Another important consideration for assigning criticality number is the number of cases reported
with the supply chain participant. Therefore, criticality number is determined using generic
reasons of recall data and frequency of recall with the supply chain participant. For establishing a
generic criticality number for a supply chain participant which has no history or zero cases of
recall use the generic recall data study scale as in Table 1a. Supply chain participant with data
related to recalls should set 5 as criticality number for the reason which has highest number of
reported recall cases. For example, if a grain processor had a total of 100 recalls, in which 20
were because of cross contamination, 5 because of Salmonella presence and 75 because of
foreign material (FM) then criticality number for reason of recall relating to presence of foreign
material is set at 5. The criticality number for reason of recall relating to cross contamination is
set at 4 and for Salmonella presence is set at 3.
Table 1a. Criticality number assignment based on generic recall data study
Reason for recall
Cases of
recall
Identified critical
traceability events
Criticality
number
(𝑪𝒏)
Salmonella; E. Coli; Listeria
Monocytogenes
54 Processing (temperature kill
step); Storage and handling
5
Drug carryover (cases of low level
in thiamine; presence of
pentobarbital)
39
Processing (mixing and
sequencing); Cleaning and
handling
4
Cross contamination (cases of
unidentified soy and peanuts;
Monensin- fatal in horse feed;
presence of Urea and non-protein
nitrogen)
9 Storage and handling;
Movement 3

92
Table 1a. (continued)
5.3.2 Prior Literature related to grain and grain products in the United States
Furthermore, Prior research work reflected that there are two reasons important to be
considered when developing a traceability system, which are discussed in Table 1b. The other
reasons relate to presence of mycotoxins and blending or commingling. Prior research reflects
the severity of mycotoxins and blending economically, socially and physically. Economic
severity refers to proof of economic losses due to occurrence of mycotoxins and blending. Social
severity refers to documented importance of consideration of other reasons in various laws or
regulations. Physical severity refers to the occurrence of fatalities because of occurrence of either
mycotoxins, blending or both.
Reason for recall
Cases of
recall
Identified critical
traceability events
Criticality
number
(𝑪𝒏)
Foreign Material (presence of
rubber, metal, plastic) 4
Storage and handling;
Movement 3
Mislabeling (cases of undeclared
allergens like soy and wheat) 2
Storage and handling;
Movement 2

93
Table 1b. Criticality number determination based on prior literature
Other
reasons
Reason for critical
event consideration
Identified
critical
traceability
event
Criticality
number
(𝑪𝒏)
References
Mycotoxins
(Aflatoxin;
fumonisin;
deoxynivenol)
Estimated to incur
losses ranging from
$418 million to $1.66
billion from corn,
wheat, and peanuts
produced in the US.
With an additional cost
of mitigation $472
million.
Receiving,
Blending,
Dispatch
5
(Eaton, D.L. and
Groopman, 1994;
Mitchell, Bowers,
Hurburgh, and Wu,
2016; Placinta,
D’Mello, and
MacDonald, 1999;
Russell, Cox, Larsen,
Bodwell, and Nelson,
1991; Schmale and
Munkvold, 2018;
USDA, 2013)
Climate change and
high humid
temperatures lead to
growth of mycotoxins
such as A.
flavus and A.
parasiticus infection
requires a minimum
moisture of 7%,
temperature between
24 and 35 °C and
drought conditions.
(Medina, Akbar,
Baazeem, Rodriguez,
and Magan, 2017; Van
Der Fels-Klerx, Liu,
and Battilani, 2016;
Williams et al., 2004;
Wu et al., 2010; Zain,
2011)
18 reports of food and
feed recalls from 2004
to 2013.
FDA 2014
Reported adverse
effects of mycotoxins
on both human and
animal life (more than
75 dogs died in 2005,
100 experienced
severe liver problems).
(Gong, Turner, Hall,
and Wild, 2008;
Khlangwiset and Wu,
2010; Lewis, Bruck,
Prasifka, and Raun,
2009; Y. Liu and Wu,
2010; Schmale and
Munkvold, 2018)

94
Table 1b. (continued)
Other
reasons
Reason for critical
event consideration
Identified
critical
traceability
event
Criticality
number
(𝑪𝒏)
References
Commingling
All wheat shall be
stored by class and
grade according to the
Official Grain
Standards of the
United States.
Receiving,
Blending,
Processing,
Dispatch
5
19 CFR Part 19
(19.31)- Customs
warehouses, container
stations and control of
merchandise therein
Traceability is
compromised because
of undetected
commingling of
shellfish.
3-203.11 Food and
Drug Administration
Food Code, 2017
The Food Safety
Modernization Act
(FSMA) states that
facilities handling raw
commodities like
grains and oilseeds on
a commingled basis
are subject to the
existing Bioterrorism
Act 2002 requirement
to maintain records to
identify the immediate
previous source and
immediate subsequent
recipient of the
commodities.
National Grain and
Feed Association
(NGFA), 2015
Identity preservation
requires efforts in
standardization,
auditing throughout
the supply chain
system.
(Sundstrom, Williams,
van Deynze, and
Bradford, 2002)
Lack of standards
regarding
commingling led to
increase in genetically
modified corn to about
124 million Bushels
(Laux and Hurburgh,
2010; Lin, Price, and
Allen, 2003)

95
5.4 Methodology
The evidence-based traceability system is evaluated using vulnerability analysis for
effectiveness and ability to meet traceability requirements or objectives. Vulnerability analysis
evaluates the affinity of a traceability system for failure. The CTE-KDE traceability approach
utilizes key data elements as a measure of its performance. The main components relating
qualitative knowledge or key data elements to quantitative evaluation are criticality, frequency,
and detection difficulty number. The vulnerability analysis uses an evidence-based traceability
system to calculate a vulnerability index number, which: (i) estimates when a traceability system
can fail and (ii) identifies the root-cause of failure by identifying the highly vulnerable CTE. The
vulnerability index calculation utilizes three main components: (i) criticality number (𝐶𝑛); (ii)
frequency number (𝐹𝑛) and (iii) detection difficulty number (𝐷𝑛). The vulnerability index
number , (𝑉𝑛) was calculated using equation 1, 𝑉𝑛 = 𝐶𝑛 × 𝐹𝑛 × 𝐷𝑛. The overall vulnerability
of supply chain is determined using mean value of all the identified critical traceability events.
The criticality, frequency, and detection difficulty numbers were assigned using a 5-point scale.
The method to rank criticality, frequency, and detection difficulty on a 5-point scale is given in
Tables 1a, 1b, 2, 3 respectively.
5.4.1 Criticality number (𝑪𝒏)
𝐶𝑛 is determined using the evidence-based analysis. The criticality number rank
assignment method is illustrated in Table 1a and Table 1b.
5.4.2 Frequency number (𝑭𝒏)
𝑭𝒏 is evaluated using the frequency of the occurrence of a CTE. It is determined using the
number of suppliers, clients, and lots and batches in a supply chain system. Frequency number is
set as 5 for the receiving activity where ingredients from more than 5 suppliers is received
because it gets more complicated to maintain and record data from more than 5 suppliers at a

96
time as compared to 2 suppliers. In Table 2, frequency number for various activities such as
receiving, dispatch, storage is assigned using the number of suppliers, clients and lots which is
the criteria as showed in Table 2.
Table 2. Criteria or assignment scale for determining frequency number for CTEs: 1 = low
frequency; 3 = moderate frequency; 5 = high frequency of occurrence
Activity or
Event
Criteria Frequency of occurrence Frequency
number (𝑭𝒏)
Receiving,
harvesting,
irrigation
Number of Suppliers
<2 1
3 to 5 3
>5 5
Dispatch and
storage finished
product
Number of Clients
<2 1
2 to 5 3
≥5 5
Storage Σ(#suppliers+#clients) Based on number of suppliers and clients
Σ(#suppliers+#clients)<4 1
4<Σ(#suppliers+#clients)<10 3
Σ(#suppliers+#clients)≥10 5
Internal
processing
operations and
feed mill
operations
(#Lots: #Batches) Based on ratio of lots to batches
1 lot by 1 batch 1
>2 lots by 1 batch 3
>2 batches having >2 lots per
batch
5
5.4.3 Detection difficulty number (𝑫𝒏)
𝑫𝒏 relates to the presence of evidence in form of key data elements associated with a CTE.
Key data elements (KDE) are of two types: (i) mandatory key data elements (mKDE or y), which
lists all data elements necessary to be maintained for a 100% traceable system, for the objective
used or a least vulnerable traceable system; (ii) available data elements (aDE or p), which lists
information that is actually available with the supply chain participant. Detection difficulty is
determined using the difference of mandatory KDE and available data elements. 𝑫𝒏 is

97
determined using how far the aDE is with respect to mKDE. The detection difficulty number is
ranked using the number of mKDE and aDE, as illustrated in Table 3. For example; if for a grain
processor as supply chain participant and chain of custody as traceability objective the
mandatory key data elements (y) for the receiving event are 5 but a total of 3 key data elements
are actually available (p) with the grain processor then the detection difficulty number is
assigned as 3 because 3 falls under the range of (5-4)≤p≤(5-2).
Table 3. Assignment scale for determining detection difficulty number for CTEs: 1 = less
likelihood of difficulty in detection; 3 = moderate difficulty in detecting; 5 = high difficulty to
detect any CTE for traceability
Mandatory Key data elements
(mKDE)
Available KDE
(aDE or p)
Detection
difficulty number
(𝑫𝒏)
y, if y is <10, but ≥ 5
y-2<p≤y 1
y-4≤p≤y-2 3
p<y-4 5
y, if y is ≥10
y-3<p≤y 1
y-6≤p≤y-3 3
P<y-6 5
y, if y is < 5
p>y/2 1
p≤y/2 5
5.5 Results
5.5.1 Vulnerability analysis for the supply chain
Determination of the vulnerability of an evidence-based traceability system depends on
the criticality number, frequency of occurrence, and difficulty in detecting the identified critical
traceability event. The vulnerability of a supply chain is evaluated through a vulnerability index
number (𝑉𝑛 ). 𝑉𝑛 is representative of the affinity of the traceability system to failure and identifies

98
the potential CTE(s) requiring corrective action or improvement for preventing failure of the
traceability system. Calculation of vulnerability index for each CTE is the multiplication of
criticality, frequency, and detection difficulty numbers determined using Tables 1a, 1b, 2, 3. The
vulnerability index number was calculated as followed:
𝑽𝒏 = 𝑪𝒏 × 𝑭𝒏 × 𝑫𝒏 Equation. [1]
where, 𝑉𝑛 = Vulnerability index number
𝐶𝑛= Criticality number
𝐹𝑛 = Frequency number
𝐷𝑛 = Detection number
n = Number of critical traceability events
The overall vulnerability of the traceability system is determined by using the formula in
equation 2. The overall vulnerability index number is the mean of calculated vulnerability index
numbers for each critical traceability event, as shown in Table 9.
∑ 𝑽𝒏𝟐𝟔𝒏=𝟏 /n Equation. [2]
n = Number of critical traceability events in the supply chain.
An example of soybean supply chain follows in section 4.2 to illustrate application of
vulnerability analysis in a supply chain setting.
5.5.2 Vulnerability analysis in the soybean supply chain
The soybean supply chain includes the farmer, elevator, processor and feed mill. The
process flow chart of the soybean supply chain is showed in Figure 1. The soybean supply chain
example comprises of various internal processing operating at both processor and feed mill. The
traceability objectives for the soybean supply chain are chain of custody and food safety, quality.

99
Relevant key data elements providing information regarding location, owner, identity, safety and
quality of the product under consideration were listed for each event.
Figure 1. Schematic of the soybean supply chain
Evaluating vulnerability index number involves assigning criticality, frequency, and the
detection difficulty number to each critical traceability event in the supply chain. The criticality,
frequency and detection difficulty number for the soybean supply chain example is shared as
follows:
(i) Criticality number for the soybean supply chain
It was assumed that there was no prior history of recall cases with each of the supply
chain participants, therefore, the criticality number was assigned using this assumption discussed
in section 3. The criticality number for all CTEs in the soybean supply chain is shared below in
Table 4. Criticality number for critical traceability events such as receiving, storage, dispatch and
all internal processing operations is set at 5 implying highly critical because chain of custody and
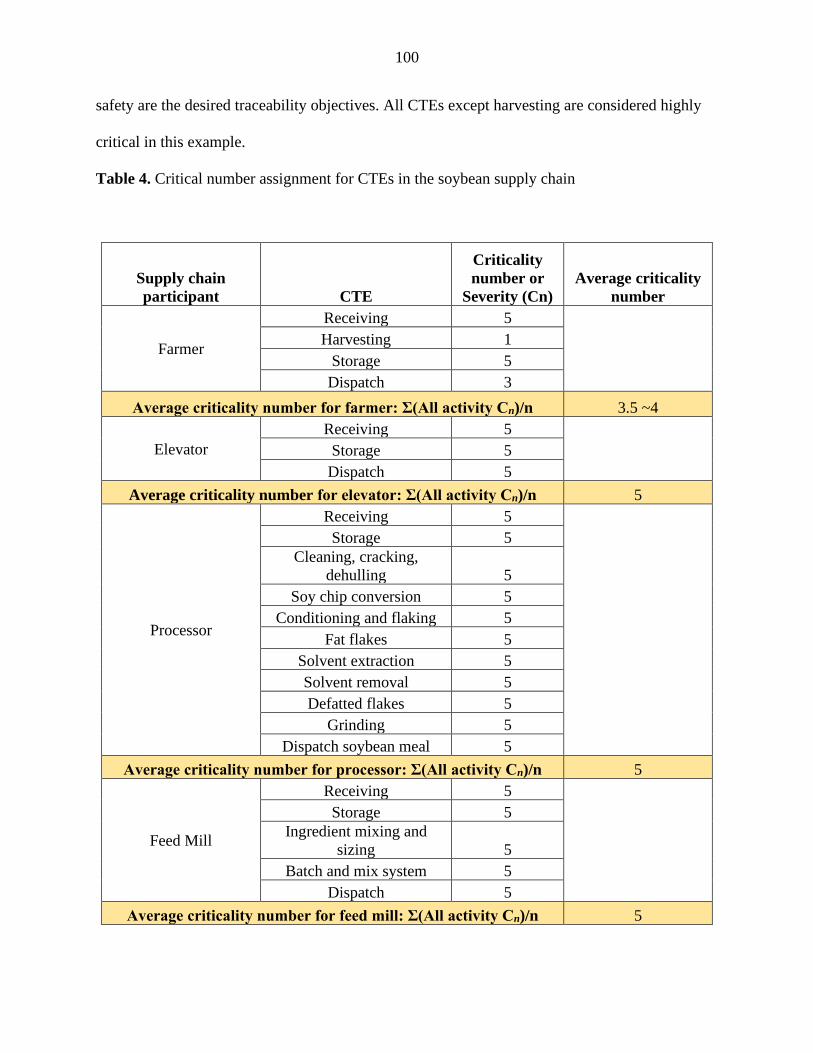
100
safety are the desired traceability objectives. All CTEs except harvesting are considered highly
critical in this example.
Table 4. Critical number assignment for CTEs in the soybean supply chain
Supply chain
participant CTE
Criticality
number or
Severity (Cn)
Average criticality
number
Farmer
Receiving 5
Harvesting 1
Storage 5
Dispatch 3
Average criticality number for farmer: Σ(All activity Cn)/n 3.5 ~4
Elevator
Receiving 5
Storage 5
Dispatch 5
Average criticality number for elevator: Σ(All activity Cn)/n 5
Processor
Receiving 5
Storage 5
Cleaning, cracking,
dehulling 5
Soy chip conversion 5
Conditioning and flaking 5
Fat flakes 5
Solvent extraction 5
Solvent removal 5
Defatted flakes 5
Grinding 5
Dispatch soybean meal 5
Average criticality number for processor: Σ(All activity Cn)/n 5
Feed Mill
Receiving 5
Storage 5
Ingredient mixing and
sizing 5
Batch and mix system 5
Dispatch 5
Average criticality number for feed mill: Σ(All activity Cn)/n 5

101
(ii) Frequency number for the soybean supply chain
The assumptions for assigning frequency number is shared below in Table 5 for the
soybean supply chain example.
Table 5. Frequency number assignment for CTEs in the soybean supply chain
Supply
chain
participan
t CTE
Frequenc
y number
(Fn)
Assumptions Average
Fn
Farmer
Receiving 1 1 supplier
Harvesting 1 1 supplier
Storage 1 1 supplier+1 client
Dispatch 1 1 client
Average frequency of occurrence for farmer: Σ(All activity Fn)/n 1
Elevator
Receiving 3 3 suppliers Storage 3 3 suppliers+4 clients
Dispatch 3 4 clients
Average frequency of occurrence for elevator: Σ(All activity Fn)/n 3
Processor
Receiving 5 6 suppliers
Storage 5 6 suppliers+5 clients
Cleaning, cracking, dehulling 1
1 lot 1 batch; same
recipe for all 5
clients
Soy chip conversion 1
Conditioning and flaking 1
Fat flakes 1
Solvent extraction 1
Solvent removal 1
Defatted flakes 1
Grinding 1
Dispatch soybean meal 5 5 clients
Average frequency of occurrence for processor: Σ(All activity Fn)/n 2.09≈ 2
Feed Mill
Receiving 3 3 suppliers
Storage 3 3 suppliers+4 clients
Ingredient mixing and sizing 1 1 lot 1 batch; same
recipe for all 4
clients Batch and mix system 1
Dispatch 3 4 clients
Average frequency of occurrence for feed mill: Σ(All activity Fn)/n 2.2≈ 2

102
(iii) Detection difficulty number for the soybean supply chain
The detection difficulty number for the soybean supply chain is determined using
assumptions for the soybean supply chain example shown in Table 6 below.
Table 6. Detection difficulty number assignment for CTEs in the soybean supply chain
Exceptions: Assign 5 even if all KDE are available but data related to mycotoxin test records are
not available or present with the supply chain participant
Assign 5 even if all KDE are available but sampling SOP’s are absent
Assign 5 even if all KDE are available but UCI is absent
Assign 5 even if all KDE are available but equipment calibration (if needed) is absent
Assign 5 even if all KDE are available but Bin identification number (BinID#) or label absent
Supply Chain
Participant CTE
Mandatory Key
data elements
Available
data elements
Detection
difficulty
number
(𝑫𝒏)
Farmer
Receiving
List of suppliers;
location; amount
of seed; type of
seed; locational
coordinates (RLC)
List of
suppliers;
amount of
seed; type of
seed
3
Harvesting
Amount of
harvest; date of
harvest
Amount of
harvest 5
Storage
Grain type;
amount of grain
stored; number of
on-farm storage;
RLC; sanitation
log
Grain type;
amount of
grain stored
3
Dispatch
List of clients;
location; Amount
dispatched
List of clients;
location;
Amount
dispatched
1
Average detection difficulty number 3

103
Table 6. (continued)
Supply Chain
Participant CTE
Mandatory Key
data elements
Available
data elements
Detection
difficulty
number
(𝑫𝒏)
Elevator
Receiving
List of suppliers;
traceable lot;
supplier name;
supplier location;
RLC; date;
amount
List of
suppliers;
traceable lot;
supplier
name;
supplier
location;
RLC; amount
1
Storage
Ingredient or raw
material
information;
BinID#; RLC;
mycotoxin test
records; amount
per bin
Ingredient or
raw material
information;
BinID#;
mycotoxin
test records;
amount per
bin
5
Dispatch
List of clients;
location; Carrier
identification
(UCI)
List of clients;
location; UCI 1
Average detection difficulty number 1
Processor Receiving
List of suppliers;
traceable lot;
supplier name;
supplier location;
RLC; date;
amount
List of
suppliers 5

104
Table 6. (continued)
Supply Chain
Participant CTE
Mandatory Key
data elements
Available data
elements
Detection
difficulty
number
(𝑫𝒏)
Processor
Storage
Ingredient or raw
material
information;
traceable lot;
BinID#; RLC;
mycotoxin test
records; amount
per bin;
samplingSOP#;
claims
BinID#;
amount per bin 5
Cleaning,
cracking,
dehulling
Process name;
equipment use;
working lot
details; new lot
generated;
capacity;
ingredient use (if
any)
Process name;
equipment use;
capacity
3
Soy chip
conversion
Process name;
equipment use;
working lot
details; new lot
generated;
capacity;
ingredient use (if
any)
Process name;
equipment use;
capacity
3

105
Table 6. (continued)
Supply Chain
Participant CTE
Mandatory Key
data elements
Available
data
elements
Detection
difficulty
number
(𝑫𝒏)
Processor
Conditioning and
flaking
Process name;
equipment use;
working lot
details; new lot
generated;
capacity;
ingredient use (if
any)
Process
name;
equipment
use; capacity
3
Fat flakes
Process name;
equipment use;
working lot
details; new lot
generated;
capacity;
ingredient use (if
any)
Process
name;
equipment
use; capacity
3
Solvent extraction
Process name;
equipment use;
working lot
details; new lot
generated;
capacity;
ingredient use (if
any)
Process
name;
equipment
use; capacity
3
Solvent removal
Process name;
equipment use;
working lot
details; new lot
generated;
capacity;
ingredient use
Process
name;
equipment
use; capacity
3

106
Table 6. (continued)
Supply Chain
Participant CTE
Mandatory Key
data elements
Available
data elements
Detection
difficulty
number (𝑫𝒏)
Processor
Defatted flakes
Process name;
equipment use;
working lot
details; new lot
generated;
capacity;
ingredient use (if
any)
Process name;
equipment
use; capacity
3
Grinding
Process name;
equipment use;
working lot
details; new lot
generated;capacity;
ingredient use (if
any)
Process name;
equipment
use; capacity
3
Dispatch
soybean meal
List of clients;
location; UCI
List of clients;
location 1
Average detection difficulty number 5
Feed Mill Receiving
List of suppliers;
traceable lot;
supplier name;
supplier location;
RLC; RLD; amount
List of
suppliers;
traceable lot;
supplier
name;
supplier
location;
RLC; RLD;
amount
1

107
Table 6. (continued)
Supply Chain
Participant CTE
Mandatory Key
data elements
Available data
elements
Detection
difficulty
number (𝑫𝒏)
Feed Mill
Storage
Ingredient or raw
material
information;
traceable lot;
BinID#; RLC;
mycotoxin test
records; amount per
bin; samplingSOP#
Traceable lot;
BinID#;
samplingSOP#
5
Ingredient
mixing and
sizing
Process name;
equipment use;
equipment
calibration log;
working lot details;
new lot generated;
capacity; other
ingredient use log
Process name;
equipment use;
capacity; other
ingredient use
log
5
Batch and mix
system
Process name;
equipment use;
equipment
calibration log;
working lot details;
new lot generated;
capacity; other
ingredient use log
Process name;
equipment use;
capacity; other
ingredient use
log
3
Dispatch
List of clients;
location; UCI
List of clients;
location 5
Average detection difficulty number 5

108
The vulnerability for the soybean supply chain is evaluated using criticality, frequency
and detection difficulty number as generated in Table 4, 5 and 6. The vulnerability index number
for all CTEs in the soybean supply chain example is calculated. Table 7 illustrates the
vulnerability index calculation.
Table 7. Determining vulnerability index for each CTE in the soybean supply chain example
Supply
chain
participant
CTE (𝑪𝒏) (𝑭𝒏) (𝑫𝒏) (𝑽𝒏)
=((𝑪𝒏) × (𝑭𝒏) × (𝑫𝒏))
Comments
Farmer Receiving 5 1 3 15 Least
vulnerable
Harvesting 1 1 5 5 Least
vulnerable
Storage 5 1 3 15 Least
vulnerable
Dispatch 3 1 1 3 Least
vulnerable
Elevator Receiving 5 3 1 15 Least
vulnerable
Storage 5 3 5 75 Highly
vulnerable
Dispatch 5 3 1 15 Least
vulnerable
Processor Receiving 5 5 5 125 Highly
vulnerable
Storage 5 5 5 125 Highly
vulnerable
Cleaning,
cracking,
dehulling
5 1 3 15 Least
vulnerable
Soy chip
conversion
5 1 3 15 Least
vulnerable
Conditioning
and flaking
5 1 3 15 Least
vulnerable
Fat flakes 5 1 3 15 Least
vulnerable
Solvent
extraction

109
Table 7. (continued)
Supply
chain
participant
CTE (𝑪𝒏) (𝑭𝒏) (𝑫𝒏) (𝑽𝒏)
=((𝑪𝒏) × (𝑭𝒏) × (𝑫𝒏))
Comments
Solvent
removal
5 1 3 15 Least
vulnerable
Defatted
flakes
5 1 3 15 Least
vulnerable
Grinding
Dispatch 5 5 1 25 Moderately
vulnerable
Feed Mill Receiving 5 3 1 15 Least
vulnerable
Storage 5 3 5 75 Highly
vulnerable
Ingredient
mixing
5 1 3 15 Least
vulnerable
Batch and
mix system
5 1 3 15 Least
vulnerable
Dispatch 5 3 5 75 Highly
vulnerable
Overall vulnerability of traceability in the soybean
supply chain system = ∑ 𝑽𝒏𝟐𝟔𝒏=𝟏 /n
33.47 Moderately
vulnerable
The example identifies CTEs for each supply chain participant, assigns criticality,
frequency, and detection difficulty numbers to calculate the vulnerability for each CTE and
determines the overall vulnerability of the supply chain system using mean (average of all CTEs)
in the entire soybean chain. The overall vulnerability was 33.47 implying the affinity of the
traceability system to failure is moderate. For the soybean supply chain example, the
combination of criticality, frequency, and detection difficulty numbers creates 165 possibilities
of 𝑉𝑛 with repetitions. From 165 potential combinations 22 unique values for 𝑉𝑛 are determined.
The maximum value of 𝑉𝑛 is 125, and the minimum is 1.

110
Higher 𝑉𝑛 implies that the CTE is more susceptible to failure implying tracing, tracking
and safety conditions are compromised since chain of custody and safety are the traceability
objectives for this example. Based on the series of 165 combinations and 22 unique values for
vulnerability index, a vulnerability scale is generated specific to the soybean supply chain
example to determine highly vulnerable, moderately vulnerable, and low vulnerable CTEs, as
shown in Table 8.
Table 8. Vulnerability index assignment criteria
Vulnerability index criteria (𝑽𝒏)
60≤𝑉𝑛≤125 Highly vulnerable
25≤𝑉𝑛≤59 Moderately vulnerable
𝑉𝑛<24 Least vulnerable
5.6 Conclusions
The vulnerability analysis of an evidence-based traceability system enables the
identification of CTEs in the soybean supply chain. The identification of CTEs, frequency of
occurrence of a CTE and detection difficulty of key data elements allow the user or supply chain
participant to propose improvements based on the vulnerability index number. The vulnerability
index scale provides a range between which traceability of soybean supply chain system may be
highly, moderately, or least vulnerable to failure. The range assigned is a combination of three
components: criticality, frequency, and detection. Therefore, the failure of the traceability system
may occur due to unavailability of certain key data elements of high criticality as described in the
analysis. The proposed method can be used as a procedure to identify and rank the highly

111
vulnerable CTEs, compromising traceability objectives (discussed in introduction section). The
overall vulnerability was 33.47 implying the affinity of the traceability system to failure is
moderate. The traceability system which is moderately vulnerable check for presence for
presence of highly vulnerable CTEs. The highly vulnerable CTEs are highlighted in Table 7 and
it is advised to check for mandatory key data elements to reduce highly vulnerable CTEs to least
vulnerable. The most vulnerable CTEs highlighted are to be improved to lower the chances of
failure of traceability.
The results show the application of the methodology proposed to a specific example of a
soybean supply chain, comprising farmer, elevator, processor and ends at the feed mill. The
outline of operations is illustrated within each supply chain participant and a ranking scale is
generated to calculate the overall vulnerability to traceability in a soybean supply chain system.
This methodology can be used to efficiently analyze the affinity of a supply chain towards
traceability and propose corrective actions for high scoring CTEs for improvement.
5.8 References
Arvanitoyannis, I. S., & Varzakas, T. H. (2007). Application of failure mode and effect analysis
(FMEA), cause and effect analysis and Pareto diagram in conjunction with HACCP to a
potato chips manufacturing plant. International Journal of Food Science and Technology.
https://doi.org/10.1111/j.1365-2621.2006.01361.x
Bosona, T., & Gebresenbet, G. (2013). Food traceability as an integral part of logistics
management in food and agricultural supply chain. Food Control.
https://doi.org/10.1016/j.foodcont.2013.02.004
Diallo, T. M. L., Henry, S., & Ouzrout, Y. (2016). Effective Use of Food Traceability in Product
Recall. In Advances in Food Traceability Techniques and Technologies: Improving Quality
Throughout the Food Chain. https://doi.org/10.1016/B978-0-08-100310-7.00014-4
Eaton, D.L.and Groopman, J. D. (1994). The Toxicologyof Aflatoxins. Academic Press, New
York.
Economic Research Service. (2018). USDA ERS - Food Security in the U.S.

112
Farley, Amanda J. Feaster,Dennis Schapmire, Tara J D’Ambrosio, Josoph Bruce, LeAnn EC.
Shawn Oak, S. and B. K. S. (2009). The Challenges of Implementing Evidence Based
Practice: Ethical Considerations in Practice, Education, Policy, and Research. Social Work
& Society.
Gong, Y. Y., Turner, P. C., Hall, A. J., & Wild, C. P. (2008). Aflatoxin exposure and impaired
child growth in West Africa: An unexplored international public health burden. In
Mycotoxins: Detection Methods, Management, Public Health and Agricultural Trade.
Hu Jong, I. (2007). Development of gap and traceability system for greening the food chain in
Taiwan. Extension Bulletin - Food & Fertilizer Technology Center.
Karlsen, K. M., Dreyer, B., Olsen, P., & Elvevoll, E. O. (2012). Granularity and its role in
implementation of seafood traceability. Journal of Food Engineering.
https://doi.org/10.1016/j.jfoodeng.2012.03.025
Khlangwiset, P., & Wu, F. (2010). Costs and efficacy of public health interventions to reduce
aflatoxin-induced human disease. Food Additives and Contaminants - Part A Chemistry,
Analysis, Control, Exposure and Risk Assessment.
https://doi.org/10.1080/19440041003677475
Laux, C. M., & Hurburgh, C. R. (2010). Using quality management systems for food traceability.
Journal of Industrial Technology.
Lewis, L. C., Bruck, D. J., Prasifka, J. R., & Raun, E. S. (2009). Nosema pyrausta: Its biology,
history, and potential role in a landscape of transgenic insecticidal crops. Biological
Control. https://doi.org/10.1016/j.biocontrol.2008.10.009
Lin, W., Price, G. K., & Allen, E. W. (2003). StarLink: Impacts on the U.S. corn market and
world trade. Agribusiness. https://doi.org/10.1002/agr.10075
Lipol, L. S., & Haq, J. (2011). Risk analysis method : FMEA / FMECA in the organizations.
International Journal of Basic & Applied Sciences.
Liu, W., Cheng, W., & Zhang, J. (2013). Study on the traceability system establishment of
safety-objective-oriented food logistics supply chain. Advance Journal of Food Science and
Technology. https://doi.org/10.19026/ajfst.5.3297
Liu, Y., & Wu, F. (2010). Global burden of Aflatoxin-induced hepatocellular carcinoma: A risk
assessment. Environmental Health Perspectives. https://doi.org/10.1289/ehp.0901388
Manzouri, M., Nizam Ab Rahman, M., Saibani, N., & Rosmawati Che Mohd Zain, C. (2013).
Lean supply chain practices in the Halal food. International Journal of Lean Six Sigma.
https://doi.org/10.1108/IJLSS-10-2012-0011
Medina, A., Akbar, A., Baazeem, A., Rodriguez, A., & Magan, N. (2017). Climate change, food
security and mycotoxins: Do we know enough? Fungal Biology Reviews.
https://doi.org/10.1016/j.fbr.2017.04.002

113
Mitchell, N. J., Bowers, E., Hurburgh, C., & Wu, F. (2016). Potential economic losses to the US
corn industry from aflatoxin contamination. Food Additives and Contaminants - Part A
Chemistry, Analysis, Control, Exposure and Risk Assessment.
https://doi.org/10.1080/19440049.2016.1138545
Mora, C., & Menozzi, D. (2008). Benefits of traceability in food markets: Consumers’
perception and action. Food Economics - Acta Agriculturae Scandinavica, Section C.
https://doi.org/10.1080/16507540903034907
Placinta, C. M., D’Mello, J. P. F., & MacDonald, A. M. C. (1999). A review of worldwide
contamination of cereal grains and animal feed with Fusarium mycotoxins. Animal Feed
Science and Technology. https://doi.org/10.1016/S0377-8401(98)00278-8
Russell, L., Cox, D. F., Larsen, G., Bodwell, K., & Nelson, C. E. (1991). Incidence of molds and
mycotoxins in commercial animal feed mills in seven midwestern states, 1988-1989.
Journal of Animal Science. https://doi.org/10.2527/1991.6915
Schmale, D. G. I., & Munkvold, G. P. (2018). Health, Mycotoxins in Crops: A Threat to Human
and Domestic Animal. In The American Phytopathological Society.
Storoy, J., Thakur, M., & Olsen, P. (2013). The TraceFood Framework - Principles and
guidelines for implementing traceability in food value chains. Journal of Food Engineering.
https://doi.org/10.1016/j.jfoodeng.2012.09.018
Sundstrom, F. J., Williams, J., van Deynze, A., & Bradford, K. J. (2002). Identity Preservation of
Agricultural Commodities. In Identity Preservation of Agricultural Commodities.
https://doi.org/10.3733/ucanr.8077
U.S. FDA. (2017). Party Animal Recalls Dog Food Due To Potential Presence of Pentobarbital.
United States Department of Agriculture Economic Research Service. (2018). USDA ERS -
Background.
USDA. (2013). Grain inspection handbook. Book II, Chapter 4: Corn. In Grain Inspection
Handbook.
USHHS. (2017). Recalls & Alerts.
Van Der Fels-Klerx, H. J., Liu, C., & Battilani, P. (2016). Modelling climate change impacts on
mycotoxin contamination. World Mycotoxin Journal.
https://doi.org/10.3920/WMJ2016.2066
Williams, J. H., Phillips, T. D., Jolly, P. E., Stiles, J. K., Jolly, C. M., & Aggarwal, D. (2004).
Human aflatoxicosis in developing countries: A review of toxicology, exposure, potential
health consequences, and interventions. American Journal of Clinical Nutrition.

114
Wu, F., Bhatnagar, D., Bui-Klimke, T., Carbone, I., Hellmich, R., Munkvold, G., … Takle, E.
(2010). Climate change impacts on mycotoxin risks in US maize. World Mycotoxin Journal.
https://doi.org/10.3920/WMJ2010.1246
Zain, M. E. (2011). Impact of mycotoxins on humans and animals. Journal of Saudi Chemical
Society. https://doi.org/10.1016/j.jscs.2010.06.006

115
CHAPTER 6. GENERAL CONCLUSIONS
This research has provided a broad and comprehensive approach for implementing
traceability in bulk product supply chains. Several regulations, standards and researchers have
proposed various terminology and requirements for implementing bulk product traceability,
however, there is lack of a thorough standardized guidance templates and terminology for grain
and feed supply chain traceability participants. Traceability is a cohesive effort of supply chain
participants and standardization will adequately organize flow of physical product and
information to achieve several objectives as discussed in chapter 1. The effort is to develop a
standardized go-to method for bulk product supply chain participants for implementing
traceability requirements. To achieve a standards-based traceability system for the United States
grain and feed supply chain, this research addresses three components- (i) development of a
unique and standardized guidance template and terminology database; (ii) creation of a model
depicting traceability events and data elements; (iii) assessment of vulnerability of the
traceability events and data elements model.
The literature review in chapter 2 identifies challenges, current state of the art,
requirements, definitions, and knowledge available on grain traceability. In chapter 3 the
traceability challenges and opportunities are thoroughly analyzed for creating a standard
guidance template for each grain supply chain participant, which includes- farmer, grain
elevator, processor, feed mill and end consumer. Furthermore, chapter 2 discusses traceability
objectives and define them for each supply chain participants. This understanding of defining
traceability objectives provides a strategic framework for the grain supply chain for achieving
traceability, however, this research also addresses the importance of interrelated operations in the
supply chain and presents informational elements needed for supplier verification.

116
The second part of this research focuses on modeling the supplier-client interactions and
identifying critical traceability events. Once the critical traceability events (CTE) are identified
the model illustrates the key data elements (KDE), which are mandatory for achieving
traceability, the model uses soybean supply chain as an example. The CTE-KDE model
technique develops a traceability system for implementing in the bulk product industry. Data
management is critical for traceability and therefore such a model provides a framework
emphasizing on key data elements that are necessary to record for a critical traceability event
critical. Such a system may serve as an architecture for developing grain traceability software
programs. The model uses Unified Modeling Language-based web engineering application,
which provides codes for conversion to software programs.
The third part of this research focusses on an evidence-based vulnerability technique for
assessing how and when a traceability system may fail. The vulnerability of a traceability system
is determined using failure modes effects analysis. The analysis proposes to develop a ranking
system based on prior evidence from literature and food recall database. The range for the three
components: criticality, frequency and detection is assigned and the product of these determine
the vulnerability index number. The identification of CTEs, frequency of occurrence of a CTE
and detection difficulty of key data elements allow the user or supply chain participant to
propose improvements.
Therefore, we standardized and numerically determined best traceability practices for
processes in the grain supply chain. A standard methodology like this addresses the potential
occurrence of hazards under various critical traceability events such as movement, blending,
internal processing operations, transformation, handling and storage.

117
6.1 Future Research
In the future, the standard templates, the CTE-KDE model and the vulnerability analysis
developed in this study should be tested by the bulk product industry. In addition, there is need to
determine efficacy of the vulnerability of a traceability system through a real-time mock recall
study. The findings of a recall study will establish effectively the evidence-based traceability
system was able to identify highly vulnerable CTEs.
The research is customizable and has scope in application to other bulk products such as
fresh produce, grains and milk with considerations of sector-specific attributes. For example, the
information of suppliers and then bin identification for the incoming grain lots at the grain
elevator is essential components of traceability for both grains such as soybean and the milk
industry. Such research also, provides requirements for measuring traceability numerically.

118
APPENDIX A. BEST PRACTICES GUIDANCE TEMPLATES
BEST PRACTICE GUIDANCE DOCUMENT SUPPORTING TRACEABILITY
OBJECTIVE FOR “FARMER” TITLE: Best practice for the Farmer’s process for enabling
traceability
DATE:
FOR: Farmer DOCUMENT#: 1 IMPLEMENTED BY: SUPERVISOR:
Page 1 of 1 REVISION#: APPROVED BY:
Document History DOCUMENT SECTION TITLE: SECTIO
N#:
TRACEABILITY OBJECTIVE:
Event 1: Reception of seed from seed
company
A Food defense
Event 2: Irrigation, Pesticide treatment,
harvesting
B Safety against pesticide residues,
production practice
Event 3: On-farm storage- Handling C Safety (prevent cross
contamination)
Section A:
Name and number of event: #1_Reception of seed from Seed Company
Traceable unit (Physical item): Seed Name and location of seed company:
ABC corp.
Seed type, circle your answer: GM NON-GM
If NON-GM selected. Do you have accreditation from supplier? Yes No
Acres and location of farm: Planting date: Harvesting date:
Section B:
Name and number of event: #2_Insect and pest treatment information (On-field),
irrigation
(i) Name of fertilizer used (include name of company):
(ii) Frequency of usage:
(iii) Dose of usage:
(iv) Type of water-source used for irrigation, circle your answer Point source
Non-Point source
(v) Is water tested for lead or arsenic? Circle the answer Yes No
Section C:
Name and number of event: #3_On-farm storage
Amount of harvested grain for storage:
Traceable unit: Harvested corn
Storage type:
Quantity of stored grain:
History of any other grain stored:
Name of the client(s) for delivery:

119
BEST PRACTICE GUIDANCE DOCUMENT SUPPORTING TRACEABILITY
OBJECTIVE FOR “ELEVATOR” TITLE: Best practice for the elevator’s process for enabling
traceability
DATE:
FOR: Elevator DOCUMENT#: 2 IMPLEMENTED BY: SUPERVISOR:
Page 1 of 3 REVISION#: APPROVED BY: Document History
DOCUMENT SECTION TITLE: SECTIO
N#:
TRACEABILITY OBJECTIVE:
Event 1: Reception of corn from various farm
locations
A Chain of custody
Event 2: Commingling at consolidation point B Production
practice/documentation
Event 3: Handling of corn in storage bins C Safety and quality
Event 4: Handling corn as per customer
specifications
D Meeting customer demands
Section A:
Name and number of event: #1_ Reception of corn from various farm locations
Traceable lot (Physical item): Corn
Supplier information: Example list Name of Supplier Ticket number Location of
supplier
Amount of grain Mode of delivery
Farmer 1 A scale ticket
number issued
to farmer for the
amount of grain
received
Full address Subtract weight of
truck at entry (𝑊𝑖
) from weight of
truck after
unloading (𝑊𝑒)
Truck/License plate#
Farmer 2 Full address 𝑊𝑖 − 𝑊𝑒 Truck/License plate#
Farmer 3 Full address 𝑊𝑖 − 𝑊𝑒 Truck/License plate#

120
BEST PRACTICE GUIDANCE DOCUMENT SUPPORTING TRACEABILITY
OBJECTIVE FOR “ELEVATOR” TITLE: Best practice for the elevator’s process for enabling
traceability
DATE:
FOR: Elevator DOCUMENT#:
2.1
IMPLEMENTED BY: SUPERVISOR:
Page 2 of 3 REVISION#: APPROVED BY:
Travel history: Mode of delivery Grain in
transit (hours
or days)
Date/Time grain
received
Owner of grain Sanitation
confirmation
(Yes/No)
Truck/License
plate#
“y” hours (date_time)
(01/09/2019_15:30)
Truck or logistic
unit in transit
Contact the logistic
unit for record of
previous loads
carried
Section B:
Name and number of event: #2_ Commingling at consolidation point (CP)
Traceable lot (Physical item): Commingled corn Commingling history: Site of consolidation point
(CP)
CP sequence/day Owner Type of transfer
Near Bin 1 or share
coordinates
*Truck 1 (LP#), *Truck
2 (LP#), Truck 3 (LP#)
Elevator Manual or bucket elevator
or pneumatic
*Truck 1 means the first truck which delivers corn, *Truck 2 is the second truck which delivers corn
Section C:
Name and number of event: #1_ Handling corn in storage bins
Traceable lot (Physical item): Commingled corn
Record of movement of traceable lot: From consolidation point to storage bins and to
distribution system
Handling Best Practice:
Total grain at CP
(Bushels)
Grain lifted to Bin
1
(**BIN ID)
Grain lifted to Bin
2
(**BIN ID)
Grain lifted to Bin
3
(**BIN ID)
500 100 350 50
**BIN ID: Bin identification number carries information about the bin, use the following
matrix to uniquely identify your bins.

121
BEST PRACTICE GUIDANCE DOCUMENT SUPPORTING TRACEABILITY
OBJECTIVE FOR “ELEVATOR” TITLE: Best practice for the elevator’s process for enabling
traceability
DATE:
FOR: Elevator DOCUMENT#:
2.2
IMPLEMENTED BY: SUPERVISOR:
Page 3 of 3 REVISION#: APPROVED BY:
Total capacity of bin Type of grain Process Check digit
AA =5000
BB =10000
CC =15000
DD =20000
Raw Corn = 001
Dried corn =0012
Soybean =002
Remixing: Yes =111,
No =110
Clean corn: Yes =222,
No =220
A unique digit between
0 and 9 which is not
repeated once used for
designating a bin (0
being the first in
process, 9 being last in
process)
Example: An elevator has four bins on one location, for uniquely identifying each bin the
Identification number will be generated using the above table. For a 5000 Bushel bin, in
which excess corn or high moisture corn is remixed can be identified as “AA0011110”
Section D:
Name and number of event: #4_ Handling corn as per customer requirements
Traceable lot (Physical item): Commingled corn
Process operations: Cleaning-Sorting-Drying-Dispatch Drying Transaction Cleaning Sorting Transaction Amount
Initial MC 24 % From Bin 1
(ID) to Bin
2 (ID),
record for
each MC
difference
Foreign
Matter
amount
In pounds U.S.
grade no.
1
From Bin 1
(ID) to Bin
3 (ID)
In pounds
or bushels
Final MC 15% Sell FM Scrap
industries
($/pound)
earned
U.S.
grade no.
2
Record for
each
In pounds
or bushels
Energy
used
(BTU)
15,447 U.S.
grade no.
3
Record for
each
In pounds
or bushels
Dispatch best practice: Record the following information Bin ID # Truck LP Client location Amount
AA0011110 Dispatch truck X bushels

122
BEST PRACTICE GUIDANCE DOCUMENT SUPPORTING TRACEABILITY
OBJECTIVE FOR “PROCESSOR” TITLE: Best practice for the dry mill processor’s process for
enabling traceability
DATE:
FOR: Processor DOCUMENT#: 3 IMPLEMENTED BY: SUPERVISOR:
Page 1 of 4 REVISION#: APPROVED BY:
Document History DOCUMENT SECTION TITLE: SECTIO
N#:
TRACEABILITY OBJECTIVE:
Event 1: Reception of corn from various farm
locations and grain elevator
A Chain of custody
Event 2: Commingling at consolidation point B Production
practice/documentation
Event 3: Internal processing operations C Production practices, safety and
quality
Event 4: Dispatch D Meeting customer demands
Section A:
Name and number of event: #1_ Reception of corn from various farm locations and grain
elevator
Traceable lot (Physical item): Corn
Supplier information: Example list Name of Supplier Ticket number Location of
supplier
Amount of grain Mode of delivery
Farmer 1 A scale ticket
number issued
to farmer for the
amount of grain
received
Full address Subtract weight of
truck at entry (𝑊𝑖
) from weight of
truck after
unloading (𝑊𝑒)
Truck/License plate#
Farmer 2 Full address 𝑊𝑖 − 𝑊𝑒 Truck/License plate#
Elevator 1 Full address 𝑊𝑖 − 𝑊𝑒 Truck/License plate#
Travel history: Mode of delivery Grain in
transit (hours
or days)
Date/Time grain
received
Owner of grain Sanitation
confirmation
(Yes/No)
Truck/License
plate#
“y” hours (date_time)
(01/09/2019_15:30)
Truck or logistic
unit in transit
Contact the logistic
unit for record of
previous loads
carried

123
BEST PRACTICE GUIDANCE DOCUMENT SUPPORTING TRACEABILITY
OBJECTIVE FOR “PROCESSOR” TITLE: Best practice for processor’s process for enabling traceability DATE:
FOR: Processor DOCUMENT#:
3.1
IMPLEMENTED BY: SUPERVISOR:
Page 2 of 4 REVISION#: APPROVED BY:
Section B:
Name and number of event: #2_ Commingling at consolidation point
Traceable lot (Physical item): Commingled corn Commingling history: Site of consolidation
point (CP)
CP sequence/day MC % Owner Type of transfer
Locational
coordinates
*Truck 1 (LP#),
*Truck 2 (LP#),
Truck 3 (LP#)
24% Processor Manual or bucket
elevator or
pneumatic
*Truck 1 means the first truck which delivers corn, *Truck 2 is the second truck which
delivers corn
Record of movement of traceable lot: From consolidation point to storage bins and to
distribution system
Handling Best Practice:
Total grain at CP
(Bushels)
Grain lifted to Bin 1
(**BIN ID)
Grain lifted to Bin 2
(**BIN ID)
Grain lifted to Bin 3
(**BIN ID)
500 100 350 50
**BIN ID: Bin identification number carries information about the bin, use the following
matrix to uniquely identify your bins.
Total capacity of bin Type of grain Process Check digit
AA =5000
BB =10000
CC =15000
DD =20000
Raw Corn = 001
Dried corn =0012
Soybean =002
Remixing: Yes =111,
No =110
Clean corn: Yes =222,
No =220
A unique digit between
0 and 9 which is not
repeated once used for
designating a bin (0
being the first in
process, 9 being last in
process)
Example: An elevator has four bins on one location, for uniquely identifying each bin the
Identification number will be generated using the above table. For a 5000 Bushel bin,
which is the first bin in the process and use to store cleaned corn is identified as
“AA0012220”

124
TITLE: Best practice for the processor’s process for enabling
traceability
DATE:
FOR: Processor DOCUMENT#:
3.2
IMPLEMENTED BY: SUPERVISOR:
Page 3 of 4 REVISION#: APPROVED BY:
Section C:
Name and number of event: #3_ internal processing operations
Traceable lot (Physical item): Commingled corn
Internal processing operations: Grinding—Ingredient mixing—Fermentation—
Distillation—Centrifugation—Evaporation—Drying—Final product dispatch
Grinding:
Particle
size
Equipment
log (Yes/No)
Equipment
efficiency
parameters
Frequency of
cleaning
equipment
Owner Handler Supervisor
signature
In micron Yes MC%
Screen
length
Energy used
Processor Name of
person
handling
grinder
Ingredient mixing:
Ingredient name Supplier Addition criteria Owner Handler Supervisor
signature
Water Amount/batch Processor Name of
person
handling
grinder
𝛼 − Amylase Amount/batch;
At pH(5-6) and
temperature
(180-195℉) add
(Log sheet
record)
Processor
Glucoamylase Cool to 95℉ Processor
Yeast Fermentation
40-60 hours
Processor

125
TITLE: Best practice for the elevator’s process for enabling
traceability
DATE:
FOR: Processor DOCUMENT#:
3.3
IMPLEMENTED BY: SUPERVISOR:
Page 4 of 4 REVISION#: APPROVED BY:
Transformation history:
Transformation
type
Process Traceable
lot (old)
Traceable
lot (new)
Equipment
log
(Yes/No)
Traceable
lot
(final
dispatch)
By
product
Type 2 Grinding Raw corn Ground
corn
Y
Type 3 Slurrying Ground
corn
Ground
corn in
process
Y
Liquefying
Ground
corn in
process
Ground
corn in
process
Y
Saccharifying
Ground
corn in
process
Ground
corn in
process
Y
Fermentation
Ground
corn in
process
Ground
corn in
process
Y Carbon
dioxide
Distillation
Ground
corn in
process
Whole
stillage
Y Ethanol
Centrifugation Whole
stillage
Thin
stillage
Evaporator Thin
stillage
Condensed
distillers
soluble
water
Mixing Condensed
distillers
soluble
In process
Drying In process Dried
grain with
soluble
Dried
grain
with
soluble
(DDGS)

126
TITLE: Best practice for the elevator’s process for enabling
traceability
DATE:
FOR: Processor DOCUMENT#:
3.4
IMPLEMENTED BY: SUPERVISOR:
Page 4 of 4 REVISION#: APPROVED BY:
Section D:
Name and number of event: #4_ Dispatch
Traceable lot (Physical item): Two from this process (Ethanol; DDGS)
Dispatch best practice: Record the following information
Bin ID # Traceable lot Client location Truck LP# Amount
dispatched
ID# of bin in
which stored
Ethanol Address of
client
Subtract weight
of truck at exit
(𝑊𝑒)from weight
of truck at entry
(𝑊)
𝑊𝑒 - 𝑊𝑖
ID# of bin in
which stored
DDGS Feed mill Subtract weight
of truck at exit
(𝑊𝑒)from weight
of truck at entry
(𝑊)
𝑊𝑒 - 𝑊𝑖

127
BEST PRACTICE GUIDANCE DOCUMENT SUPPORTING TRACEABILITY
OBJECTIVE FOR “FEED MILL” TITLE: Best practice for the feed mill’s process for enabling
traceability
DATE:
FOR: Feed
mill
DOCUMENT#: 4 IMPLEMENTED BY: SUPERVISOR:
Page 1 of 4 REVISION#: APPROVED BY:
Document History DOCUMENT SECTION TITLE: SECTIO
N#:
TRACEABILITY OBJECTIVE:
Event 1: Reception of corn, DDGS, other
ingredients, prescribed drug (medication)
from various farm locations, grain elevator,
and grain processor
A Chain of custody
Event 2: Commingling at consolidation point B Production
practice/documentation
Event 3: Internal processing operations C Production practices, safety and
quality
Event 4: Dispatch D Meeting customer demands
Multi-species feed mill, preparing feed for swine, sheep, and horse.
Section A:
Name and number of event: #1_ Reception of corn, DDGS, other ingredients, prescribed
drug (medication) from various farm locations, grain elevator, and grain processor
Traceable lot (Physical item): Shared in table below
Supplier information: Example list
Name of Supplier
(Owner)
Ticket number Location of
supplier
Amount of grain Mode of delivery
Farmer 1
A scale ticket
number issued
to farmer for
the amount of
grain received
Full address Subtract weight
of truck at entry
(𝑊𝑖 ) from weight
of truck after
unloading (𝑊𝑒)
Truck/License plate#
Farmer 2 Full address 𝑊𝑖 − 𝑊𝑒 Truck/License plate#
Elevator 1 Full address 𝑊𝑖 − 𝑊𝑒 Truck/License plate#
Drug supplier Full address 𝑊𝑖 − 𝑊𝑒 Truck/License plate#
Soybean meal
processor
Full address 𝑊𝑖 − 𝑊𝑒 Truck/License plate#
Vegetable oil Full address 𝑊𝑖 − 𝑊𝑒 Truck/License plate#
Soy hulls Full address 𝑊𝑖 − 𝑊𝑒 Truck/License plate#
Vitamin premixes Full address 𝑊𝑖 − 𝑊𝑒 Truck/License plate#
Salt Full address 𝑊𝑖 − 𝑊𝑒 Truck/License plate#
DDGS Full address 𝑊𝑖 − 𝑊𝑒 Truck/License plate#
Corn gluten meal Full address 𝑊𝑖 − 𝑊𝑒 Truck/License plate#

128
TITLE: Best practice for the feed mill’s process for enabling
traceability
DATE:
FOR: Feed
mill
DOCUMENT#:
4.1
IMPLEMENTED BY: SUPERVISOR:
Page 2 of 4 REVISION#: APPROVED BY:
Section B:
Name and number of event: #2_ Commingling at or consolidation point only for raw corn
Traceable lot (Physical item): Shared in table below Commingling history: Type of
feed
Ingredients
(Traceable lot)
Site of
consolidation
point (CP)
CP sequence/day Owner Type of transfer
Sheep feed
Corn Locational
coordinates
*Truck 1 (LP#),
*Truck 2 (LP#),
Truck 3 (LP#)
Feed mill Manual or
bucket elevator
or pneumatic
Soybean meal Locational
coordinates
LP# Feed mill
DDGS Locational
coordinates
LP# Feed mill
Soy hulls Locational
coordinates
LP# Feed mill
Vegetable oil Locational
coordinates
LP# Feed mill
Drug premix 1 Locational
coordinates
LP# Feed mill
Vitamin premix
1
Locational
coordinates
LP# Feed mill
Salt Locational
coordinates
LP# Feed mill Pneumatic
blower delivery
system
Horse feed Premix 2 Locational
coordinates
LP# Feed mill
Vitamin premix
2
Locational
coordinates
LP# Feed mill
Swine feed Premix 3 Locational
coordinates
LP# Feed mill
Vitamin premix
3
Locational
coordinates
LP# Feed mill
Other ingredients such as soybean meal, DDGS are used from a common location only premixes for each
feed differ, therefore, they should be stored at a different location from one another. Inter-mixing
premixes is a potential hazard as Horse premix (Premix 2) contains copper which is life-threatening for
sheep.
*Truck 1 means the first truck which delivers corn, *Truck 2 is the second truck which
delivers corn
LP# stands for license plate number

129
TITLE: Best practice for the feed mill’s process for enabling
traceability
DATE:
FOR: Feed
mill
DOCUMENT#:
4.2
IMPLEMENTED BY: SUPERVISOR:
Page 3 of 4 REVISION#: APPROVED BY:
Section C:
Name and number of event: #3_ internal processing operations
Internal processing operations: sizing and grinding—Ingredient mixing—batching and
mixing—micro-bin mixing—feed cleaning—Pellet screening—Pelleting—Final product
dispatch (loadout)
Sizing and grinding: Particle
size
Equipment
log
(Yes/No)
MC
(%)
Efficiency Frequency
of cleaning
equipment
Owner Handler Supervisor
signature
In micron Yes 16% MC %
Screen
length
Energy
consumed
Feed mill Name of
person
handling
grinder
Transformation history: Transformation
type
Process Traceable
lot (old)
Traceable
lot (new)
Equipment
log (Yes/No)
Traceable
lot
(final
dispatch)
By
product
Type 2 Sizing and
grinding
Raw corn Ground
corn
Sieve size
Aspiration Attached to the sizing and
grinding system
Air speed Dust
Type 2 Batching
and mixing
Ingredient
mix for
sheep feed
Scaled
batch (5
scales for
each feed)
Scale
calibration
Batching
and mixing
Ingredient
mix for
horse feed
Scaled
batch (5
scales for
each feed)
Scale
calibration
Batching
and mixing
Ingredient
mix for
swine feed
Scaled
batch (5
scales for
each feed)
Scale
calibration
Micro
ingredient
mixing
(separate
for feeds)
Drug and
vitamin
premix
Mixed Feed Scale
configuration
Pressure
buildup
record
Cleaning
Mixed feed
Cleaned
mixed feed
Dust/FM
Scale venting is critical as increase in pressure as low as 0.5 in wg can
disturb weightage. Check and record timely configuration of micro
ingredient bin system.

130
TITLE: Best practice for the feed mill’s process for enabling
traceability
DATE:
FOR: Feed
mill
DOCUMENT#:
4.3
IMPLEMENTED BY: SUPERVISOR:
Page 4 of 4 REVISION#: APPROVED BY:
Transformation history: Transformation
type
Process Traceable
lot (old)
Traceable
lot (new)
Equipment
log (Yes/No)
Traceable
lot
(final
dispatch)
By
product
Type 3 Pellet
screening
Mixed feed
Mixed feed
(without
lumps and
grain
kernels)
Maintained
temperature
data
Lumpy
feed or
kernels
Pelleting
Mixed feed
(without
lumps and
grain
kernels)
Pellets
Pellet
produced per
batch
Temperature
records for
pelleting
Pellets
Cooling of pellets and then distribution (Cooling temperature record)
Section D:
Name and number of event: #_ Dispatch or loadout
Traceable lot (Physical item): Horse feed; Sheep feed; Swine feed pellets
Dispatch best practice: Record the following information Bin ID # Traceable lot Client location Truck LP# Amount dispatched
ID# of bin in
which stored
Horse feed pellets Address of client Subtract weight of
truck at exit
(𝑊𝑒)from weight of
truck at entry (𝑊𝑖)
𝑊𝑒 - 𝑊𝑖
ID# of bin in
which stored
Sheep feed Feed mill Subtract weight of
truck at exit
(𝑊𝑒)from weight of
truck at entry (𝑊𝑖)
𝑊𝑒 - 𝑊𝑖
For bagging system label bags as swine feed, horse feed, or sheep feed.

131
APPENDIX B. CODES FOR CTE-KDE MODEL AND OTHER ANALYSIS
Given Below are the extensible markup language (XML) codes for each critical event
under each supply chain participant that can be used as a language for developing software
programs for the model. The codes are in Java language which can be used to convert the UML
model into a software interface.
XML coding for farmer package which has receiving, storage, harvesting, irrigation,
dispatch as critical traceability events are shown below. Each operation or event carries some
attributes and for events such as storage and receiving a detailed information on attributes or data
elements are shared under IListClients and IListSuppliers.
Coding for the farmer package, CTE- Receiving:
package Farmer;
import java.util.Vector;
import String;
import Integer;
public class Receiving {
public String Nametype;
public Integer Amount;
public Date Receivingdate;
protected locationcoordinates;
public Vector myHarvesting;
public Vector myIListSuppliers;
public void ReceivingMovement( a) {
}
}

132
Coding for the farmer package, CTE- Storage:
package Farmer;
import java.util.Vector;
public class Storage {
public SoybeanAgate Graintype;
public 4856 Amount;
public 5 Numberofstoragetype;
public 43.44-87.34 Storagelocationcoordinates;
public Yes Storagesanitationlog;
public Vector myDispatch;
private void Holding() {
}
public void Handling() {
}
}
Coding for the farmer package, CTE- Dispatch:
package Farmer;
import java.util.Vector;
import String;
import Integer;
public class Dispatch {
public Integer Amount;
public String Clientnametype;
public Vector myReceiving;
public Vector myReceiving;
public Vector myIListClients;
public void DispatchMovement( a) {
}
public Dispatch( FR) {
}

133
}
Coding for the farmer package, CTE- Harvesting:
package Farmer;
import java.util.Vector;
import String;
import Integer;
public class Harvesting {
public String Name;
public Integer Amount;
public Date Date;
public Vector myStorage;
public void TTtype( 2) {
}
}
Coding for the farmer package, CTE- Irrigation and treatment:
package Farmer;
import String;
public class Irrigation and treatment extends Harvesting {
public String Watersourcetype;
public String WaterSourcetest;
public String Treatment;
public void Handling() {
}
}
Coding for the farmer lists package illustrating attributes, such as client list:
package Farmer;
import Elevator.string;
public interface IListClients {

134
public List<FarmerClientList> fetchList(string search);
}
Coding for the farmer lists package illustrating attributes, such as supplier list:
package Farmer;
import Elevator.string;
public interface IListSuppliers {
public List<Farmersuppliers> fetchList(string search);
}
XML coding for elevator package which has receiving, storage, dispatch as critical
traceability events are shown below. Each operation or event carries some attributes and for
events such as storage and receiving a detailed information on attributes or data elements are
shared under IListClients and IListSuppliers.
Coding for the elevator package, CTE- Receiving:
package Elevator;
import Farmer.SoybeanAgate;
import java.util.Vector;
import Farmer.Dispatch;
import Integer;
public class Receiving extends Dispatch, Dispatch {
public SoybeanAgate Traceablelot;
public Integer Amount;
public Vector myDispatch;
public Vector myIListSuppliers;
public Vector myStorage;
public Vector myIListSuppliers;
public Vector myIListSuppliers;
private void ReceivingMovement( b) {
}
public Receiving( EL) {
}

135
}
Coding for the elevator package, CTE- Storage:
package Elevator;
import java.util.Vector;
import Integer;
public class Storage {
public BinID# TraceableLot;
public Integer Amount;
public Vector myIListBins;
public Vector myDispatch;
public Vector myIListBins;
public void TType( 1) {
}
public void Holding() {
}
public void Handling() {
}
}
Coding for the elevator package, CTE- Dispatch:
package Elevator;
import ElevatorLists.EL098345;
import java.util.Vector;
import ElevatorLists.EL234093;
public class Dispatch {
public 749 AmountfromBin;
public EL098345 FromBinID#;
public 987 AmountfromBin;
public EL234093 FromBinID#;
public Clientname1 ForClient;
public Vector myIClientList;

136
public Vector myIClientList;
public Vector myReceivingCommingling;
public Vector myReceiving;
public void DispatchMovement( b) {
}
public Dispatch( EL) {
}
}
Coding for the elevator lists package, package illustrating attributes, such as supplier list:
package Elevator;
import java.util.Vector;
public interface IListSuppliers {
public Vector myReceiving;
public List<Elevatorsuppliers> fetchList(string search);
}
Coding for the elevator lists package, package illustrating attributes, such as client list:
package Elevator;
import java.util.Vector;
public interface IClientList {
public Vector myDispatch;
public List<ClientList> fetchList(string search);
}
Coding for the elevator lists package, package illustrating attributes, such as identification bin
list:
package Elevator;
import java.util.Vector;
import List<StorageBinList>;
public interface IListBins {

137
public Vector myStorage;
public List<StorageBinList> fetchList(string search);
}
Coding for the processor package, CTE- ReceivingCommingling:
package Processor;
import java.util.Vector;
import Integer;
public class ReceivingCommingling {
public IngredientSupplierList TraceableLot;
public Integer Amount;
public Vector myIListSuppliers;
public Vector myStorage;
public Vector myIListSuppliers;
public void ReceivingMovement( c) {
}
public ReceivingCommingling( SP) {
}
}
Coding for the processor package, CTE- Storage:
package Processor;
import java.util.Vector;
import String;
import Integer;
public class Storage {
public String TraceableLot;
public Integer Amount;
public Vector myIListBins;
public Vector myIPop1;
public Vector myIListBins;
public void TType( 1) {
}

138
public void Holding() {
}
public void Handling() {
}
}
Coding for the processor package, CTE- Internal processing operation 1:
package Processor;
import ProcessorLists.3;
public class IPop1 {
public Cleaning Name;
public DrumMagnetDFRT-DestonerMTSC Equipment;
public Soybean WTL;
public CleanSoybean NTL;
public 16000 Capacity;
public 3 AmountFM;
public void Processing() {
}
public void TType( 2) {
}
}
Coding for the processor package, CTE- Internal processing operation 2:
package Processor;
public class IPop2 {
public Cracking Name;
public CrushingMillOLCB Equipment;
public CleanSoybean WTL;
public SoybeanCracks NTL;

139
public 73 Capacity;
public void Processing() {
}
public void TType( 2) {
}
}
Coding for the processor package, CTE- Internal processing operation 3:
package Processor;
public class IPop3 {
public Dehulling Name;
public HullSeparator-Aspirator Equipment;
public SoybeanCracks WTL;
public Dehulledbeanmeal NTL;
public void Processing() {
}
public void TType( 2) {
}
}
Coding for the processor package, CTE- Internal processing operation 4:
package Processor;
public class IPop4 {
public Flaking Name;
public FlakingMillDOZC Equipment;
private Dehulledbeanmeal WTL;
public Soybeanflakes NTL;
public Logmaintained Tempconditions;
public void Processing() {
}

140
public void TType( 2) {
}
}
Coding for the processor package, CTE- Internal processing operation 5:
package Processor;
import ProcessorLists.n-hexane;
import Solventextraction;
public class Ipop5 {
public Solventextraction Name;
public Extractor Equipment;
public Soybeanflakes WTL;
public DeffatedFlakes NTL;
public n-hexane Solvent;
public Logmaintained Workingconditions;
private Soybeanoil Soybeanoil;
public void Processing() {
}
public void TType( 2) {
}
}
Coding for the processor package, CTE- Internal processing operation 6:
package Processor;
import java.util.Vector;
import String;
public class IPop6 {
public Grinding Name;
public String Equipment;
public DefattedFlakes WTL;

141
public SoybeanMeal FP-NTL;
public Vector myStorage- Finished Product;
public void Processing() {
}
public void TType( 2) {
}
}
Coding for the processor package, CTE- Storage of finished product:
package Processor;
import java.util.Vector;
import String;
import Integer;
public class Storage- Finished Product {
public String Traceablelot;
public String BinID#;
public Integer Locationcoordinates;
public String Binsanitationlog;
public String Binpreviouslot;
public Vector myDispatch;
public Vector myDispatch;
public Vector myIBinFPList;
public void HoldingHandling() {
}
}
Coding for the processor package, CTE- Dispatch:
package Processor;
import java.util.Vector;
import String;
import Integer;
public class Dispatch {
public Integer AmountfromBin;
public String FromBinID#;

142
public Integer Totaldispatchamount;
public Integer ClientLocation;
public Vector myStorage- Finished Product;
public Vector myIClientList;
public Vector myIClientList;
public Vector myReceiving;
public void DispatchMovement( b) {
}
public Dispatch( SP) {
}
}
Coding for the processor lists package, package illustrating attributes, such as supplier list:
Coding for the processor lists package, package illustrating attributes, such as client list:
package Processor;
import Elevator.List<ClientList>;
import java.util.Vector;
import Elevator.string;
public interface IClientList {
public Vector myDispatch;
public List<ClientList> fetchList(string search);
}
Coding for the processor lists package, package illustrating attributes, such as identification bin
list for finished product storage:
package Processor;
import Elevator.string;
public interface IBinFPList {
public List<StorageBinFPList> fetchList(string search);
}

143
Coding for the processor lists package, package illustrating attributes, such as supplier list:
package Processor;
import java.util.Vector;
import Elevator.string;
public interface IListSuppliers {
public Vector myReceivingCommingling;
public Vector myProcessor Ingredient Suppliers;
public Vector myProcessor Ingredient Suppliers;
public List<Processoringredientsuppliers> fetchList(string search);
}
Coding for the processor lists package, package illustrating attributes, such as identification bin
list for storage of raw ingredients:
package Processor;
import java.util.Vector;
import Elevator.string;
import List<StorageBinList>;
public interface IListBins {
public Vector myStorage;
public List<StorageBinList> fetchList(string search);
}
Coding for the feed mill package, CTE- Receiving:
package Feed MIll;
import java.util.Vector;
import Processor.IngredientSupplierList;
import Integer;
public class Receiving {
public IngredientSupplierList TraceableLot;
public Integer Amount;
public Vector myIListSuppliers;
public Vector myStorage;

144
public Vector myIListSuppliers;
public void ReceivingMovement( e) {
}
public Receiving( FM) {
}
}
Coding for the feed mill package, CTE- Storage:
package Feed MIll;
import java.util.Vector;
import String;
import Integer;
public class Storage {
public String TraceableLot;
public Integer Amount;
public Vector my;
public Vector myIListBins;
public Vector myFMop1;
public Vector myIListBins;
public void TType( 1) {
}
public void Holding() {
}
public void Handling() {
}
}
Coding for the feed mill package, CTE- Storage finished product:
package Feed MIll;
import java.util.Vector;
import String;
import Integer;
public class Storage- Finished Product {
public String TraceableLot;
public Integer BinID#;

145
public Integer Locationcoordinates;
public String Binsanitationlog;
public String Binpreviouslot;
public Vector myDispatch;
public Vector myDispatch;
}
Coding for the feed mill package, CTE- Feed mill processing operation 1:
package Feed MIll;
import Farmer.SoybeanAgate;
import java.util.Vector;
public class FMop1 {
public Sizing-Grinding-Aspiration Name;
public HammerMill Equipment;
public SoybeanAgate Workingtraceablelot;
public GroundSoybean Newtraceablelot;
public Vector myFMop2;
public void Processing() {
}
public void TType( 2) {
}
}
Coding for the feed mill package, CTE- Feed mill processing operation 2:
package Feed MIll;
import java.util.Vector;
public class FMop2 {
private Batching-Mixing Name;
public ScaleMixer Equipment;
public GroundSoybean-SoybeanMeal WTL;

146
public Feed NTL;
public Vegetableoil+Salt+hulls Additives;
public Vector myStorage- Finished Product;
public void Processing() {
}
public void TType( 3) {
}
}
Coding for the feed mill package, CTE- Feed mill processing operation 3:
package Feed MIll;
public class FMop3 {
public Micro-ingredientmixing Name;
public Microingredientsystem Equipment;
public Feed WTL;
public MixedFeed NTL;
public DrugVitaminPremix Additives;
public void Processing() {
}
public void TType( 3) {
}
}
Coding for the feed mill package, CTE- Feed mill processing operation 4:
package Feed MIll;
import java.util.Vector;
public class FMop4 {
public CleaningPelleting Name;
public PeleltMill Equipment;

147
public MixedFeed WTL;
public MFPellets NTL;
public LogMaintained TempConditions;
public Vector myStorage- Finished Product;
public void Processing() {
}
public void TType( 3*) {
}
}
Coding for the feed mill lists package, package illustrating attributes, such as identification bin
list for storage of raw ingredients:
package Feed MIll;
import java.util.Vector;
import Elevator.string;
public interface IListBins {
public Vector myStorage;
public Lisy<StorageBinList> fetchList(string search);
}
Coding for the feed mill lists package, package illustrating attributes, such as client list:
package Feed MIll;
import Elevator.List<ClientList>;
import java.util.Vector;
import Elevator.string;
public interface IClientList {
public Vector myDispatch;
public List<ClientList> fetchList(string search);
}

148
Coding for the feed mill lists package, package illustrating attributes, such as supplier list:
package Feed MIll;
import java.util.Vector;
import Elevator.string;
public interface IListSuppliers {
public Vector myReceiving;
public List<FeedMillIngredientsupplier> fetchList(string search);
}