development of a spatially resolved optical technique for
TRANSCRIPT

NIST Technical Note 2052
Development of a Spatially Resolved Optical Technique for Measuring Heat
Flux and Thermal Footprint of Firebrand Piles
Yasin M. Abul-Huda
This publication is available free of charge from: https://doi.org/10.6028/NIST.TN.2052

NIST Technical Note 2052
Development of a Spatially Resolved Optical Technique for Measuring Heat
Flux and Thermal Footprint of Firebrand Piles
Yasin M. Abul-Huda
Fire Research Division Engineering Laboratory
This publication is available free of charge from: https://doi.org/10.6028/NIST.TN.2052
July 2019
U.S. Department of Commerce Wilbur L. Ross, Jr., Secretary
National Institute of Standards and Technology
Walter Copan, Undersecretary of Commerce for Standards and Technology, and Director

Certain commercial entities, equipment, or materials may be identified in this
document in order to describe an experimental procedure or concept adequately. Such identification is not intended to imply recommendation or endorsement by the National Institute of Standards and Technology, nor is it intended to imply that the entities, materials, or equipment are necessarily the best available for the purpose.
National Institute of Standards and Technology Technical Note 2052 Natl. Inst. Stand. Technol. Tech. Note 2052, 28 pages (July 2019)
CODEN: NTNOEF
This publication is available free of charge from: https://doi.org/10.6028/NIST.TN.2052

i
This publication is available free of charge from: https://doi.org/10.6028/N
IST.TN.2052
Abstract
Firebrand showers have been identified as a primary mechanism of fire spread and cause of destruction in wildland-urban interface fires. The heat transfer processes that follow deposition of firebrands and lead to ignition have received little attention until recently. While conventional methods of measuring temperature and heat flux provide bulk-averaged information regarding deposited firebrand piles, they fall short of elucidating essential information such as surface contact areas and heat feed-back mechanisms, that are necessary for understanding ignition propensity and developing high-fidelity physics-based models. This work describes the development and implementation of a spatially resolved optical technique for quantifying heat flux and thermal footprint of firebrand piles using laser induced phosphorescence of YAG:Dy. The technique involves coating the surface of a UV-transparent substrate with YAG:Dy phosphors to yield surface temperature. Heat flux is inferred through simultaneously measuring the top and bottom substrate surface temperatures after they are coated with a staggered grating pattern. An intensity ratio over two separate spectral regions of emission is used to calibrate the optical measurement system and infer temperature from 300 K - 1100 K over a 7 cm diameter interrogation area. The uncertainty in temperature and heat flux are discussed in detail. The spatial resolution of the temperature and heat flux measurements are 0.5 mm and 4 mm, respectively. Key words
firebrand; heat flux; thermal footprint; surface contact area, thermographic phosphors; thermometry
ii
This publication is available free of charge from: https://doi.org/10.6028/N
IST.TN.2052
Table of Contents Introduction ..................................................................................................................... 1
Thermographic Phosphors ............................................................................................. 2
2.1. Laser Induced Phosphorescence .................................................................................. 2
2.2. Characteristics of YAG:Dy ......................................................................................... 3
Preparation of Phosphor Coatings ................................................................................. 4
Description of Experimental Setups .............................................................................. 5
4.1. Heat Flux and Thermal Footprint Measurements ......................................................... 5
4.2. Description of Calibration Setup ................................................................................. 6
Image Post-Processing Procedure .................................................................................. 7
Characterization of YAG:Dy .......................................................................................... 9
6.1. Calibration Results .................................................................................................... 10
6.2. Temperature Uncertainty Analysis ............................................................................ 12
Heat Flux Model and Uncertainty Analysis ................................................................ 14
Conclusions..................................................................................................................... 19
Acknowledgments .......................................................................................................... 20
References ....................................................................................................................... 20

iii
This publication is available free of charge from: https://doi.org/10.6028/N
IST.TN.2052
List of Figures Figure 1. Simplified illustration of laser induced phosphorescence process ............................ 3 Figure 2. Cross-sectional schematic of two phosphor-coated substrates consisting of fused quartz glass. (Left) A uniform coating on the top surface is used for thermal footprint measurements. (Right) A staggered grating pattern on the top and bottom surfaces is used for heat flux measurements............................................................................................................. 4 Figure 3. Rendering of fireband pile heat flux and thermal footprint measurement setup. ...... 5 Figure 4. Schematic of image-doubler and collection optics setup. ......................................... 6 Figure 5. Rendering of setup for calibration of YAG:Dy laser-induced phosphorescence with temperature. .............................................................................................................................. 7 Figure 6. Illustration of image post-processing procedure used to obtain dewarping and registration functions. ............................................................................................................... 8 Figure 7. Emission spectra of YAG:Dy (Y2.85Dy0.15Al5O12) at various temperatures. ........... 10 Figure 8. Calibration curve relating F and G level signal intensity ratio (R) with temperature. The error bars correspond to the combined and expanded (k=2) uncertainty of the measurement technique. .......................................................................................................... 11 Figure 9. Signal ratio - temperature sensitivity of the spectral ratio technique. ..................... 11 Figure 10. Examples of averaged batch images obtained at 297 K, 568 K, and 1073 K (left to right). The square regions indicate the locations used to generate statistics. The bottom images are the corresponding signal intensity ratio population distributions. ........................ 12 Figure 11. Standard deviations of signal ratio and temperature over the calibrated temperature range.................................................................................................................... 13 Figure 12. Cross sectional schematic of heat transfer processes through the substrate control volume sourced from a hypothetical spatially heterogenous pile of firebrands. The staggered grating pattern of YAG:Dy phosphor coating is indicated by the orange lines on the surfaces.................................................................................................................................................. 14 Figure 13. Standard deviation of inferred incident heat flux for three variations in order of magnitude of incident heat flux (black = 1 kW/m2, red = 10 kW/m2, and black = 100 kW/m2 ) and two substrate thicknesses (diamond = 1.6 mm and circles = 3.2 mm). The information is given as a function of top surface temperature T1. ......................... 18 Figure 14. Steady state response time to a step change of heat flux imposed on the surface of fused quartz. ............................................................................................................................ 19

1
This publication is available free of charge from: https://doi.org/10.6028/N
IST.TN.2052
Introduction Wildland-urban interface (WUI) fires are the cause of catastrophic disasters by
claiming the lives of civilians, devastating communities, and destroying properties. Both the frequency and severity of these fires is increasing at an alarming rate, costing the government billions of dollars in suppression and remediation efforts [1]. The urgency to develop solutions is imperative since trends in climate change, vegetation/land management, and WUI population, predict more frequent and severe events. It is believed that a majority of fire spread and destruction in wildland urban interface fires is caused by firebrand attacks [2] [3] [4], in addition to direct flame impingement or radiation. After firebrands are lofted into the air, they can travel hundreds of meters before depositing onto fuel beds consisting of vegetation or building materials; forming spot fires that outpace suppression efforts deployed toward the primary fire line.
Heat flux from firebrands is a major contributor to and indicator of ignition. Accurate knowledge of heat flux along with oxygen concentration, chemical properties, and thermophysical properties of a material, are necessary to accurately predict ignition propensity. Quantifying the heat transfer processes that follow deposition and lead to ignition has received little attention until recently [5] [6]. Parametric studies are a cumbersome approach to determining ignition propensity of various building materials over a range of conditions (wind speed, humidity, geometry, etc.). Moreover, parametric studies do not aid in developing new materials and agents that can inhibit ignition and fire spread. The proper approach is to carry out a well-controlled and fundamental study of the governing heat transfer processes to elucidate the information necessary to develop fire-resistant materials and high-fidelity models of ignition over a wide range of conditions. Heat flux is an important property to monitor in a wide range of engineering applications. It is typically inferred through the energy equation with knowledge of the material temperature and properties. There are two primary methods used for measuring heat flux; each with varying limitations due to practical or theoretical considerations [7] [8] [9]. The first relies on measurement of the spatial gradient of temperature, which is subsequently related to heat flux through the thermal resistance of the material. The second method treats the sensing element as a lumped capacitor, whereby heat flux is inferred with an energy balance and measurement of the temporal gradient of temperature. Inference of heat flux by measurement of temporal or spatial gradients serves as the underlying principle for numerous commonly used gauges (Gardon circular foil, Schmidt-Boelter, thermopiles, thin film, radiometers, etc.) and optic-based devices (photon detection-based techniques or infrared radiation). The following work describes and documents the development of an optical technique aimed to characterize the thermal footprint and heat transfer processes of firebrand pile exposure by combining both methods (spatial and temporal) to reduce measurement uncertainty [10]. Traditional methods of measuring heat flux can be useful in quantifying the bulk behavior from firebrand piles. However, they lack the ability to capture spatially non-uniform flux. This is especially important when we consider more complex surface geometries such as crevices and corners. Elucidating the spatial distribution of heat flux is necessary to understand the processes that lead to ignition especially when fluid mechanic considerations are made, such as the presence of stagnation or recirculation regions. Moreover, conventional methods of measuring heat flux and temperature are intrusive and fall short of providing

2
This publication is available free of charge from: https://doi.org/10.6028/N
IST.TN.2052
information about surface contact area and heat feed feedback mechanisms within the pile, which are necessary for developing accurate models. This work describes the development and implementation of a spatially resolved optical technique for quantifying heat flux and thermal footprint of firebrand piles using laser induced phosphorescence of YAG:Dy. The technique involves coating the surface of a UV-transparent substrate with YAG:Dy phosphors to yield surface temperature. The advantage and significance of the proposed technique is that it provides spatially resolved measurements of the firebrand contact temperature and heat flux. The lack of this information is hindering the development of high-fidelity models that can capture and ultimately predict ignition propensity of common exterior building materials [11] [12]. Smoldering combustion of firebrands is heterogenous in nature and the ash layer that forms on the surface acts as insulation and results in irregular contact areas [13]. In addition, the ash layers are intermittently blown off by convective forces, yielding temporally and spatially varying heat flux. Smoldering combustion and ignition are dynamic processes that form hot regions along the surface of each firebrand and within a pile. In order to capture these dynamic processes, a method of measuring temperature continuously along the surface contacting the firebrands is required. One of the aims of this technique is to capture the heat feedback mechanisms within a pile where heat can re-ignite or transition combustion from smoldering to flaming.
Thermographic Phosphors Thermographic phosphors are crystalline inorganic materials that are doped with rare earth elements. In the case of YAG:Dy, small amounts of dysprosium (Dy3+) are substituted into the dodecahedral sites of the host yttrium aluminum garnet (Y3Al5O12 or ‘YAG’) lattice. The presence of the dopant serves to change and introduce new energy levels to the host material. Thermographic phosphors exhibit properties of luminescence and commonly come in the form of nanometer or micrometer sized particles. Their use for remote surface and gas thermometry has become an established technique [14]. They are inert and chemically stable, making them useful for thermometry in jet engines, internal combustion engines, cryogenic environments, stationary and non-stationary surfaces, and much more [15] [16].
2.1. Laser Induced Phosphorescence Laser induced phosphorescence of thermographic phosphors is a spectroscopic technique that relies on a resonant electronic transition of the phosphor material between neighboring states [17]. The underlying principle can be described through the simplified multi-step process illustrated in Figure 1. Electromagnetic radiation commonly in the form UV light, is absorbed by the electrons of the phosphor material, thereby exciting them from the ground state to a higher electronic state. The electrons then undergo non-radiative processes in the forms of rotational and vibrational energy transfer (RET and VET), redistributing the population of excited electrons among neighboring levels. This is then followed by spontaneous radiative decay in the form of phosphorescence. The spontaneously emitted light, being the method of energy transfer that is exploited in thermometry, is collected with a detector. It is also important to note that the RET and VET processes

3
This publication is available free of charge from: https://doi.org/10.6028/N
IST.TN.2052
spectrally shift the emission wavelength away from the excitation wavelength (towards the visible), and it is necessary to isolate these wavelengths.
Figure 1. Simplified illustration of laser induced phosphorescence process
In reality, the phosphor material has numerous energy levels, and the rate of transfer between them is a statistical function of temperature. Furthermore, the excited electrons may also relax to the ground state completely through non-radiative collisional processes. It is the temperature that determines the probability or rate of each of these events that compete with one another. Therefore, varying temperature changes the emission spectrum intensity as well as the decay lifetime by varying the population of energy levels. Correlation of temperature with either of these observable features serves as the basis for thermometry measurements. In this work, the thermometry technique is developed by correlating temperature with the intensity ratio of two regions of the emission spectrum. Using a ratio of intensities rather than a single absolute intensity avoids errors associated with spatial and temporal variations in the excitation source and phosphor coating thickness. 2.2. Characteristics of YAG:Dy
A large number of candidate thermographic phosphors exists, and the optimal choice for the present study was determined to be YAG:Dy. The evaluation consisted of comparing properties of several candidates, such as temperature measurement range, temperature sensitivity, survivability/degradation, and absorption and emission wavelengths. YAG:Dy has been shown to have excellent temperature sensitivity using an emission ratio method over a wide temperature range. It absorbs radiation well in the UV region of the electromagnetic spectrum which can be accessed with the third harmonic output of a pulsed Nd:YAG laser. Several strong peak wavelengths of the emission spectra are present between 450 nm and 500 nm. This is sufficiently distant from any considerable black-body radiation emission over the temperature measurement range of interest (300 K -1100 K). Furthermore, the work of Ref. [18] has shown how the phosphorescent properties of YAG:Dy is resistant to cyclic heating. This translates to a consistent and reliable emission-temperature relationship from the time of calibration and throughout a series of experiments. YAG:Dy

4
This publication is available free of charge from: https://doi.org/10.6028/N
IST.TN.2052
exhibits strong phosphorescence signals over a wide range of temperatures allowing measurements with high signal to noise ratios. In this study a relatively large amount of dopant was used (5 mol %) since the work of Ref. [19] has shown that larger emission signals can be achieved. However, this is not the general case for most other combinations of host and dopant materials where peak emission intensities are typically achieved with 1 % - 2 % dopant concentration.
Preparation of Phosphor Coatings The phosphor-binder mixture used in this study was prepared in a batch by mixing
YAG:Dy and HPC binder (hydroxypropyl cellulose) in equal parts by mass. HPC binder is water-based and completely outgasses at approximately 425 K [20]. Less than 2 % (by mass) of the chemical composition is magnesium silicate and the remainder is water. HPC is believed to have a negligible influence on the thermal properties of the phosphor-binder mixture since magnesium silicate and YAG have similar thermal properties and after outgassing, less than 2 % (by mass) of the final mixture is composed of magnesium silicate. This is an important consideration for simplifying modeling and validation work. Lastly, HPC is not reactive with most materials and has a long shelf life.
Figure 2. Cross-sectional schematic of two phosphor-coated substrates consisting of fused quartz glass. (Left) A uniform coating on the top surface is used for thermal footprint
measurements. (Right) A staggered grating pattern on the top and bottom surfaces is used for heat flux measurements
In the present study two fused quartz glass (GE 124) substrates that were approximately
1.6 mm thick and 7 cm in diameter were used. Figure 2 is a cross-sectional schematic of the substrates indicating their respective coating patterns. The first was uniformly coated with a 100 micrometer thick layer of phosphors on the top surface using an adjustable micrometer film applicator. This substrate coating was used to directly measure the evolution of the thermal footprint and contact area of the deposited firebrands. The second substrate was coated on the top and bottom surfaces with a 2 mm wide striped grating pattern. The coating on the top and bottom surfaces were staggered so that light transmits through the uncoated areas of the bottom surface through the glass and to the coated areas of the top surface. The coating thickness in this case was 100 micrometers and was an artifact of the coating process

5
This publication is available free of charge from: https://doi.org/10.6028/N
IST.TN.2052
which involved temporarily adhering a 100 micrometer thick template of the striped grating pattern to both surfaces. A blade was then used to fill and smooth the coating into the void areas of the template.
Description of Experimental Setups
4.1. Heat Flux and Thermal Footprint Measurements A simplified rendering of the experimental setup used to measure contact temperature and heat flux of firebrand piles is shown in Figure 3. Ultraviolet excitation was achieved through the third harmonic output of a pulsed Nd:YAG laser with a pulse duration of 10 ns and a repetition rate of 10 Hz. The 355 nm beam was routed and expanded through a UV-AR coated -50 mm focal length concave lens to span the area of the 7 cm diameter coated substrate. The camera and image doubler were located underneath the substrate and were focused to image the phosphor coated plane(s) of the 1.6 mm thick substrate. The top surface of the substrate sat flush with a 50 mm thick ceramic fiber board which thermally insulated the sides from heat loss.
Figure 3. Rendering of fireband pile heat flux and thermal footprint measurement setup.
A CMOS camera with a global shutter was used to detect the phosphorescence signal through a 12-bit sensor with a 4096 x 3000 pixel array. Since the laser pulse exhibited a jitter of approximately 3 μs, the camera was triggered 10 μs before the arrival of the laser pulse and with a 1 ms exposure to ensure that the most significant portion of the exponentially decaying phosphorescence signal was captured. Phosphorescence was collected through a 28 mm focal length f/2.8 lens and a 400 nm longpass filter to reject incident laser light.

6
This publication is available free of charge from: https://doi.org/10.6028/N
IST.TN.2052
Figure 4. Schematic of image-doubler and collection optics setup.
The camera was extended with an in-house built image doubler, which permitted
acquisition of two images simultaneously by effectively splitting the camera sensor array in half. A schematic of the device is shown in Figure 4. Light emitted from the object plane enters the image doubler through two apertures, each fitted with a set of optical filters. The “F” and “G” apertures were fitted with 500 nm (10 nm FWHM) and 458 nm (10 nm FWHM) filters, respectively. This filter combination was chosen to correspond best with the phosphorescence originating from the F and G levels of electronically excited YAG:Dy. Both apertures were fitted with 400 nm longpass filters to eliminate any 355 nm incident laser light. In addition, the F aperture had a 0.70 OD neutral density filter to reduce the collected light intensity and avoid saturating the sensor. 4.2. Description of Calibration Setup
Relating the laser induced phosphorescence intensity of the thermographic phosphors
to temperature was achieved through a calibration process. A high-temperature furnace was used to uniformly heat a coated test sample and understand the spectral emission characteristics within a temperature range of 300 K - 1100 K. The front panel of the furnace was modified to provide optical access through a 10 cm square fused quartz window. The phosphor-binder mixture was coated uniformly over a 1 mm thick, 2.5 cm square stainless steel plate. A small highly conductive plate was chosen to reduce the presence of temperature gradients and achieve a uniform spatial temperature profile. The sample was suspended near the center of the furnace and a K-type thermocouple was fixed to the rear (uncoated) face to monitor temperature. The 355 nm beam was routed through a series of mirrors and was approximately 0.9 cm in dimeter at the location of the sample. A pulse energy of 15 mJ was chosen to avoid any influence of laser pulse energy on spectral behavior and saturation of the detectors. The corresponding fluence was approximately 24 mJ/cm2.

7
This publication is available free of charge from: https://doi.org/10.6028/N
IST.TN.2052
Figure 5. Rendering of setup for calibration of YAG:Dy laser-induced phosphorescence with temperature.
Figure 5 is a simplified rendering of the calibration setup where a spectrometer and CMOS camera were simultaneously used to calibrate the system. Because of the difference in spectral response and gain, the temperature calibration function generated by the spectrometer and camera were different. It would be incorrect to infer temperature from an image acquired by the camera using the temperature calibration function generated with the spectrometer, and vise-versa. Therefore, the information obtained from the spectrometer was only used to gain a qualitative understanding of the spectral response of the system. The information obtained from the camera was used to generate the temperature calibration function to be used for temperature and heat flux measurements of firebrand piles.
An Ocean Optics spectrometer calibrated against a mercury lamp, was used to monitor the emission spectrum response to temperature over the wavelength range of 250 nm - 800 nm. The device was equipped with an 8-bit detector and used a grating with 600 lines/mm. It was extended with a fiber optic with a core diameter of 600 μm. The spectrometer was triggered after the arrival of the laser pulse and with an integration time of 50 ms to avoid collection of the incident laser light, and collect sufficient laser induced phosphorescence signal while avoiding strong interference from black-body radiation. An ensemble average of 100 acquisitions of the phosphorescence spectrum was recorded for each temperature setting.
Image Post-Processing Procedure
The camera settings and filter setup were not changed throughout the image acquisition process, with the exception of exposure length, which was adjusted to remain within the tolerable camera bandwidth. The calibration and experimental images followed a similar procedure of post-processing given by the following steps: 1) dark noise and background light subtraction 2) flat field correction 3) dewarping distortions 4) registering and normalizing 5) low-pass filtering 6) converting to temperature. The procedure is given in functional form by Eqn. 1, where the subscripts F and G denote the apertures. Dark noise is generated in the absence of incident light and is due to thermally induced charged carriers

8
This publication is available free of charge from: https://doi.org/10.6028/N
IST.TN.2052
within the camera sensor. Background light scattering is due to reflections of the incident room light from various surfaces. An average of 100 images (BG) without the incident laser beam was subtracted from the images to perform this operation. Flat field corrections were accomplished by dividing the images with an average image derived from a uniformly illuminated white background (WF). This is done to remove artifacts derived from the optical setup that cause variations in pixel to pixel sensitivity.
Figure 6. Illustration of image post-processing procedure used to obtain dewarping and
registration functions.
Image dewarping (D) and registration (R) functions were applied to each pair of experimental images (corresponding to apertures F and G) after they were obtained through a procedure illustrated in Figure 6. The transformation functions were obtained by imaging a card consisting of a checkered pattern located at the imaging plane. A desk lamp with sufficient UV emission was used to illuminate the surface of the checkered card. An average of 100 images of the pattern was acquired using the same filter setup as in the experiments. MATLAB was used to generate the dewarping transformation functions (DG and DF) by registering the average checker pattern images with a target (undistorted) checker pattern image acquired when viewed straight-on. Distortions in the experimental images were then corrected by applying the acquired transformation functions (DG and DF).
PI = T (F {R [DG �𝐼𝐼𝐺𝐺−𝐵𝐵𝐵𝐵𝐺𝐺𝑊𝑊𝑊𝑊𝐺𝐺
� , DF �𝐼𝐼𝐹𝐹−𝐵𝐵𝐵𝐵𝐹𝐹𝑊𝑊𝑊𝑊𝐹𝐹
�]})
(1)
Next, the images were registered onto one another using a similar procedure. MATLAB was used to compute a registration function (R) for the dewarped checkered patterns, which was subsequently applied to the experimental images. In this case, the transformation consisted of registering one image to the other, after which a pixel-by-pixel ratio of the two images was taken. The alignment of the two images (simultaneously captured on each half of the camera sensor) was found to be critical in the accuracy of the technique. The final image in Figure 6 is an example of two dewarped and registered images. The black

9
This publication is available free of charge from: https://doi.org/10.6028/N
IST.TN.2052
and white regions of the image denote successful registration of the image pair, while the red and blue regions denote poor registration. The poor registration around the periphery is attributed to the different perspectives of imaging the substrate from separate apertures through the 50 mm deep bore of the ceramic fiber board. Image registration was followed by low-pass filtering (F ) through a moving average filter of size 5 x 5 pixels, reducing the spatial resolution to approximately 0.5 mm. Finally, pixel intensity was converted to temperature through the function (T ) derived from the calibration experiments.
Characterization of YAG:Dy Based on the work of Ref. [21] peak firebrand surface temperatures may reach 1000 K. Using this as a guide, the furnace was set to ten discrete temperatures (approximately) evenly spaced between 300 K and 1100 K. The temperature of the phosphor coating varied by less than 1 % over time (monitored with a K-type thermocouple) while 100 images (via image doubler and CMOS camera) and emission spectra (via spectrometer) were acquired at each set temperature. Figure 7 shows the acquired emission spectra of YAG:Dy (Y2.85Dy0.15Al5O12) as a function of temperature. A portion of the image post-processing routine (discussed in the previous section) consisted of normalizing the temporally integrated signal emitted by the G level with the F level. The 458 nm and 500 nm emission peaks correspond to the 4I15/2 6H15/2 and 4F9/2 6H15/2 energy transitions, respectively. The probability of a radiative transition depends on the population distribution and thermal quenching rates, which differ for each peak line. Increasing temperature increases emission originating from the higher energy level 4I15/2 with respect to the lower energy level 4F9/2, in a manner captured well by a Boltzmann distribution. Consequently, the intensity ratio I458 nm/I497 nm can be used for high-sensitivity temperature measurements [22] [23]. Normalization of the integrated luminescence of one emission band with another eliminates several experimental uncertainties, since the detected intensities of different wavelengths are influenced in a similar manner. These uncertainties are derived from variations in shot-to-shot laser power, laser spatial intensity distribution, and inhomogeneity in phosphor coating. Therefore, the temperature dependent time integrated intensity ratios reduces the signal intensity of two spectral bands to a scalar value.
The measured emission spectra for various temperatures are given in Figure 7. The grey bands denote the spectral transmittance of the bandpass filters equipped on the CMOS camera (Figure 4). Emission intensity from the “F” level is observed to decrease with increasing temperature, while the opposite occurs for the “G” level. Qualitatively, the spectral response with temperature was found to be different when compared to the published literature [22] [24]. This is believed to be associated with the relatively large dopant concentration used in this study as compared to others, which may alter the photophysical properties of the phosphors and thereby change the internal energy transfer rates yielding a different emission spectrum. For example, the peak emission intensity originating from the F-level (near 500 nm) is observed to decrease more rapidly with increasing temperature. This peak is commonly used as a reference for the ratio method because it exhibits a nearly constant intensity magnitude with temperature. Nevertheless, this outcome was not an obstacle in implementing the technique and eliminating the aforementioned uncertainties. Furthermore, it has been realized as a trade-off for obtaining larger signal intensities, improving the signal to noise ratio.

10
This publication is available free of charge from: https://doi.org/10.6028/N
IST.TN.2052
Figure 7. Emission spectra of YAG:Dy (Y2.85Dy0.15Al5O12) at various temperatures.
6.1. Calibration Results
The ratio of laser-induced phosphorescence emission centered around 458 nm (10 nm
FWHM) and 500 nm (10 nm FWHM) obtained with the CMOS camera (Figure 5) was used to generate the calibration curve shown in Figure 8. The ratio method produced a monotonically increasing relationship between signal ratio (R) and temperature. The largest sources of uncertainty are attributed to noise and the accuracy of the image registration process and will be discussed in the next section.
Figure 9 shows the sensitivity of the thermometry technique which produce values of dR/dT ≥ 1.6E-3 through the calibrated temperature range. By conservatively assuming that only 90 % of the camera’s dynamic range is used over the entire temperature range, the camera would be capable of resolving dR/dT ≥ 1.3E-3. However, noise will increase this value thereby reducing the temperature resolution to several degrees.

11
This publication is available free of charge from: https://doi.org/10.6028/N
IST.TN.2052
Figure 9. Signal ratio - temperature sensitivity of the spectral ratio technique.
Figure 8. Calibration curve relating F and G level signal intensity ratio (R) with temperature. The error bars correspond to the combined and expanded uncertainty (95 %
coverage factor) of the measurement technique.

12
This publication is available free of charge from: https://doi.org/10.6028/N
IST.TN.2052
6.2. Temperature Uncertainty Analysis Figure 10 is an example of three ten-image averages of the phosphorescence emission
at nominal temperatures of 297 K, 568 K, and 1073 K (left to right) obtained with the CMOS camera in the setup illustrated in Figure 5. It is evident that a distribution of signal ratio R, exists and is attributed to noise associated with the camera as well as the image registration process. Five square 10 x 10 pixel regions (m = 5) were analyzed for each ten-image average batch (n = 10) to provide statistics and quantify uncertainty. Therefore, a total of 50 regions were analyzed for each temperature since 100 images were collected. The pixel intensity ratio distributions were then combined to provide a single distribution for each temperature, from which the standard deviation was computed. The standard deviation of R is then,
𝜎𝜎𝑅𝑅 =
1𝑚𝑚𝑚𝑚 − 1
��(𝑅𝑅𝑖𝑖,𝑗𝑗 − 𝑅𝑅�𝑖𝑖,𝑗𝑗)2𝑛𝑛
1
𝑚𝑚
1
1/2
(2)
Figure 10. Examples of averaged batch images obtained at 297 K, 568 K, and 1073 K (left to right). The square regions indicate the locations used to generate statistics. The bottom images are the corresponding signal intensity ratio population distributions.
where the subscripts i and j correspond to the square region (1 ≤ i ≤ 5) and image batch (1 ≤ j ≤ 10) and the product mn equals 50. 𝑅𝑅� is taken to be the mean value of the nearly assumed distribution. Figure 11 shows the signal ratio standard deviation (𝜎𝜎𝑅𝑅) as a function of temperature. A shape preserving interpolation scheme was used to infer the standard deviations between the discrete measurement points (circle symbols) because of the monotonic behavior of the observed relationship. Finally, the standard deviation in temperature, derived from noise and image registration, can be evaluated by

13
This publication is available free of charge from: https://doi.org/10.6028/N
IST.TN.2052
𝜎𝜎𝑇𝑇 = 𝑑𝑑𝑇𝑇
𝑑𝑑𝑅𝑅𝜎𝜎𝑅𝑅
(3)
Figure 11 shows how temperature standard deviation and signal ratio standard
deviation vary with temperature. The monotonic relationship reveals how the temperature standard deviation values range between 1.8 and 20.1 for 297 K and 1073 K, respectively. The systematic uncertainty (𝜎𝜎𝑇𝑇𝑇𝑇) in using an uncalibrated K-type thermocouple is the greater of +/- 2.2 K or +/- 0.75 % of the reading in degrees Celsius [25]. This is the maximum uncertainty based on a 3σ limit (99.7 % coverage) and is independent of 𝜎𝜎𝑇𝑇. Therefore, they can be combined and expanded to yield the total temperature uncertainty as
𝑢𝑢𝑇𝑇 = �(2𝜎𝜎𝑇𝑇)2 + �23𝜎𝜎𝑇𝑇𝑇𝑇�
2
(4)
Figure 11. Standard deviations of signal ratio and temperature over the calibrated temperature range.
The pre-multiplicative factors are to expand the uncertainty of the measurement technique to a 95 % confidence interval (coverage factor k = 2). The first term in Eqn. 4 is always larger than the second. The total temperature uncertainty is represented by the error bars of Figure 8. The expanded uncertainty increases monotonically from ± 5.8 K to ± 45.6 K between 297 K and 1073 K, respectively.

14
This publication is available free of charge from: https://doi.org/10.6028/N
IST.TN.2052
Heat Flux Model and Uncertainty Analysis
In this section, a model for quantifying heat flux and measurement uncertainty is described. Inference of heat flux uncertainty is done by combining the temperature uncertainty from the previous section with an energy balance that models the heat flux processes through a substrate with losses. Figure 12 is a cross sectional schematic outlining the governing processes. A non-uniform incident heat flux (qincident) is imposed on the top surface of a fused quartz substrate, which accounts for heating of the substrate through, radiation, conduction, and convection. The substrate is thermally insulated from the sides, and heat can only be lost from the top and bottom surfaces. Therefore, radiation and convection are the mechanisms by which heat is transferred from the substrate. The subscripts 1, 2, and ∞ are used to denote the top and bottom surfaces, and ambient conditions, respectively. The variables δ, ∆, T, and U denote the substrate thickness, phosphor coating width, temperature, and wind speed, respectively. Finally, the net heat flux (qnet) represents the heat transferred through the substrate and is evaluated as the difference between the incident flux and the sum of the losses from the substrate. The orange stripes on the substrate surfaces represent the location of YAG:Dy coating.
Figure 12. Cross sectional schematic of heat transfer processes through the substrate control volume sourced from a hypothetical spatially heterogenous pile of firebrands. The staggered grating pattern of YAG:Dy phosphor coating is indicated by the orange
lines on the surfaces.
The governing energy balance is given by
qincident = qnet + qconv,1 + qre-rad,1 + qconv,2 + qre-rad,2 (5)
where qnet = ∆2kquartz �𝑇𝑇1−𝑇𝑇2𝛿𝛿
� (6)
qconv,1 = ∆2ℎ1(𝑇𝑇𝑓𝑓1 − 𝑇𝑇1) (7)

15
This publication is available free of charge from: https://doi.org/10.6028/N
IST.TN.2052
qre-rad,1 = ∆2𝜀𝜀1𝜎𝜎𝑇𝑇14 (8)
qconv,2 = ∆2ℎ2(𝑇𝑇2 − 𝑇𝑇∞) (9)
qre-rad,2 = ∆2𝜀𝜀2𝜎𝜎(𝑇𝑇24 − 𝑇𝑇𝑓𝑓24 ) (10)
The variables h, ε, and σ denote the heat transfer coefficient, emissivity, and Stefan-Boltzmann constant, respectively. The variable ∆ represents the width of two adjacent (top and bottom surface) YAG:Dy phosphor coating strips, illustrated in Figure 12. Therefore, ∆2 represents the area of an individual heat flux sensor. Here we can note that the qre-rad,1 term only includes radiation losses from the surface, and neglects any radiation to the surface (from the ambient air or firebrands) because this is already accounted for in the qincident term. On the other hand, the qre-rad,2 term is a net value that accounts for thermal radiation to and from the surface. The term 𝑇𝑇𝑓𝑓1 denotes the film temperature on the top surface and can be approximated by weighting based on the 1/3 rule [26].
𝑇𝑇𝑓𝑓1 = 23𝑇𝑇𝑒𝑒𝑚𝑚𝑒𝑒𝑒𝑒𝑒𝑒 +
13𝑇𝑇∞ (11)
In a similar fashion, the film temperature at the bottom surface is approximated by
𝑇𝑇𝑓𝑓2 =23𝑇𝑇2 +
13𝑇𝑇∞
(12)
The convective heat transfer coefficients were taken from correlations by Ref. [27]. They were calculated by relating the Nusselt number (Nu) with the heat transfer coefficient as
ℎ =
𝑘𝑘𝑘𝑘𝑢𝑢𝐿𝐿
(13)
where k is the thermal conductivity of air and L is he characteristic length of the substrate, taken to be the diameter. For a horizontal flat plate with forced laminar flow having a Reynolds number (Re) less than 5 x 10⁵ over the top surface
𝑘𝑘𝑢𝑢 = 0.664𝑅𝑅𝑅𝑅1 2� 𝑃𝑃𝑃𝑃1 3� (14)
𝑅𝑅𝑅𝑅 = �
𝑈𝑈∞𝐿𝐿𝜈𝜈�12�
(15)
𝑃𝑃𝑃𝑃 =
𝜈𝜈𝛼𝛼
=𝜇𝜇𝑐𝑐𝑝𝑝𝑘𝑘
(16)

16
This publication is available free of charge from: https://doi.org/10.6028/N
IST.TN.2052
where Pr is the Prandtl number. All fluid (air) properties (k, 𝜈𝜈, 𝜇𝜇, and 𝑐𝑐𝑝𝑝) are evaluated with the film temperature 𝑇𝑇𝑓𝑓1. Next, for a horizontal flat plate with free convection along the bottom surface and 10 x 105 < Ra < 10 x 1011
𝑘𝑘𝑢𝑢 = 0.27𝑅𝑅𝑅𝑅1 4� (17)
𝑅𝑅𝑅𝑅 = 𝐺𝐺𝑃𝑃𝑃𝑃𝑃𝑃 (18)
𝐺𝐺𝑃𝑃 =
𝑔𝑔𝑔𝑔(𝑇𝑇2 − 𝑇𝑇∞)𝐿𝐿3
𝜈𝜈2
(19)
𝑔𝑔 = −
1𝜌𝜌𝜌𝜌∞ − 𝜌𝜌𝑇𝑇∞ − 𝜌𝜌
(20)
where Ra and Gr are the Rayleigh and Grashof numbers and g, ρ, and β denote the acceleration of gravity, air density, and volumetric thermal expansion of air, respectively. In this case, all fluid (air) properties (k, 𝜈𝜈, 𝜇𝜇, 𝑐𝑐𝑝𝑝, and 𝜌𝜌) are evaluated with the film temperature 𝑇𝑇𝑓𝑓2.
While the upstream wind conditions can be well characterized to accurately approximate the heat transfer coefficient over a flat horizontal plate, in the present experiments the presence of the firebrands will complicate the flow field and therefore introduce large errors of uncertainty. The moving air will not be well represented by uniform laminar flow over a flat horizontal plate, rendering the heat transfer coefficient correlation inadequate. The air will interact with the firebrand pile forming recirculation and stagnation regions. The consequences of the spatial non-uniformity and unsteadiness will yield a more complex and unquantifiable heat transfer coefficient. In addition, it is important to consider that convection will either cool or heat the surface, depending on whether the incoming ambient air has mixed with the heated air of the firebrands. The qconv,1 term is only intended to account for convective cooling (heat losses from the substrate surface) since heating is already accounted for in the qincident term. By consideration of this convention, a simplification can be made with the following assumption. For a firebrand pile with sufficiently large mass and heat release rate, the convection term on the top surface can be neglected altogether if local convection only heats the surface. This assumption is believed to hold true as the pile encompasses a larger area of the substrate surface, and convective wind speeds are kept to low values. Under these conditions, cold freestream air will be physically blocked from reaching the substrate surface. Instead the wind will cause larger heat release from the firebrands by supplying greater amounts of oxygen to the smoldering reaction fronts. The larger heat release rate of the firebrands will locally increase air temperatures which will subsequently heat the substrate surface. With this assumption, the governing equation (Eqn. 5) can be written as

17
This publication is available free of charge from: https://doi.org/10.6028/N
IST.TN.2052
qincident = ∆2kquartz �𝑇𝑇1−𝑇𝑇2𝛿𝛿
� + ∆2𝜀𝜀1𝜎𝜎𝑇𝑇14 + 0.27𝑘𝑘∆2
𝐿𝐿�𝑔𝑔𝑔𝑔(𝑇𝑇2−𝑇𝑇∞)𝐿𝐿3
𝜈𝜈2𝜇𝜇𝑐𝑐𝑝𝑝𝑘𝑘�14�
(𝑇𝑇2 − 𝑇𝑇∞) + ∆2𝜀𝜀2𝜎𝜎(𝑇𝑇24 − 𝑇𝑇𝑓𝑓24 )
(21)
The relation given by Eqn. 21 is discretized and evaluated within square regions (∆ x ∆) over the entire substrate area to yield a spatial map of qincident. Therefore, the temperatures 𝑇𝑇1 and 𝑇𝑇2 and all other properties are taken to be average values over areas equal to ∆2.
The uncertainty in incident heat flux will be denoted as 𝜎𝜎𝑞𝑞𝑖𝑖𝑛𝑛𝑐𝑐𝑖𝑖𝑑𝑑𝑒𝑒𝑛𝑛𝑖𝑖, and can be expressed in terms of independent and uncorrelated variables by combining them in quadrature [28]. The propagation of uncertainty is then given by
𝜎𝜎𝑞𝑞𝑖𝑖𝑛𝑛𝑐𝑐𝑖𝑖𝑑𝑑𝑒𝑒𝑛𝑛𝑖𝑖=
⎣⎢⎢⎢⎢⎢⎢⎡ �𝜕𝜕𝑞𝑞𝑖𝑖𝑖𝑖𝑖𝑖
𝜕𝜕𝑇𝑇1𝜎𝜎𝑇𝑇1�
2+ �𝜕𝜕𝑞𝑞𝑖𝑖𝑖𝑖𝑖𝑖
𝜕𝜕𝑇𝑇2𝜎𝜎𝑇𝑇2�
2+ �𝜕𝜕𝑞𝑞𝑖𝑖𝑖𝑖𝑖𝑖
𝜕𝜕𝑇𝑇∞𝜎𝜎𝑇𝑇∞�
2
+ �𝜕𝜕𝑞𝑞𝑖𝑖𝑖𝑖𝑖𝑖𝜕𝜕𝑇𝑇𝑓𝑓2
𝜎𝜎𝑇𝑇𝑓𝑓2�2
+ �𝜕𝜕𝑞𝑞𝑖𝑖𝑖𝑖𝑖𝑖𝜕𝜕𝜀𝜀1
𝜎𝜎𝜀𝜀1�2
+ �𝜕𝜕𝑞𝑞𝑖𝑖𝑖𝑖𝑖𝑖𝜕𝜕𝜀𝜀2
𝜎𝜎𝜀𝜀2�2
+ � 𝜕𝜕𝑞𝑞𝑖𝑖𝑖𝑖𝑖𝑖𝜕𝜕𝑘𝑘𝑞𝑞𝑞𝑞𝑞𝑞𝑞𝑞𝑞𝑞𝑞𝑞
𝜎𝜎𝑘𝑘𝑞𝑞𝑞𝑞𝑞𝑞𝑞𝑞𝑞𝑞𝑞𝑞�2
+ �𝜕𝜕𝑞𝑞𝑖𝑖𝑖𝑖𝑖𝑖𝜕𝜕𝑘𝑘𝑞𝑞𝑖𝑖𝑞𝑞
𝜎𝜎𝑘𝑘𝑞𝑞𝑖𝑖𝑞𝑞�2
+ �𝜕𝜕𝑞𝑞𝑖𝑖𝑖𝑖𝑖𝑖𝜕𝜕𝜕𝜕𝑒𝑒2
𝜎𝜎𝜕𝜕𝑒𝑒2�2
+ �𝜕𝜕𝑞𝑞𝑖𝑖𝑖𝑖𝑖𝑖𝜕𝜕𝐿𝐿
𝜎𝜎𝐿𝐿�2
+ �𝜕𝜕𝑞𝑞𝑖𝑖𝑖𝑖𝑖𝑖𝜕𝜕∆
𝜎𝜎∆�2
+ �𝜕𝜕𝑞𝑞𝑖𝑖𝑖𝑖𝑖𝑖𝜕𝜕𝛿𝛿
𝜎𝜎𝛿𝛿�2
⎦⎥⎥⎥⎥⎥⎥⎤12�
(22)
Since the uncertainty in measuring temperature varies with temperature (see
Figure 11), the inferred heat flux will also depend on the value of the surface temperatures. Therefore, the uncertainty in incident heat flux was evaluated over a range of surface temperatures corresponding to incident heat fluxes on the order of 1, 10, and 100 kW/m2. The partial derivatives in Eqn. 22 are sensitivity coefficients that determine the importance of the respective variable to the overall uncertainty. The uncertainty of each variable is given by σ. The uncertainties 𝜎𝜎𝑇𝑇1 and 𝜎𝜎𝑇𝑇2 were obtained from the analysis of the previous section. The remaining uncertainties were taken to be 10 % of the variable evaluated at their respective temperatures. The air and fused quartz thermal conductivity as well as surface emissivities are all functions of temperature and were expressed using polynomial fits. The polynomials cast as functions of temperature (either surface or film) were then substituted into Eqn. 21. The analysis shows that the largest contributor to the overall uncertainty budget stems from the large dependence of heat flux on surface temperatures 𝑇𝑇1 and 𝑇𝑇2. The temperature measurement uncertainty has a large impact on the inferred incident heat flux because the temperature uncertainty propagates through several channels such as the material properties, heat transfer coefficient correlations, and evaluation of the spatial gradient in the conduction term.

18
This publication is available free of charge from: https://doi.org/10.6028/N
IST.TN.2052
Figure 13. Standard deviation of inferred incident heat flux for three variations in order of magnitude of incident heat flux (black = 1 kW/m2, red = 10 kW/m2, and
black = 100 kW/m2 ) and two substrate thicknesses (diamond = 1.6 mm and circles = 3.2 mm). The information is given as a function of top surface temperature T1.
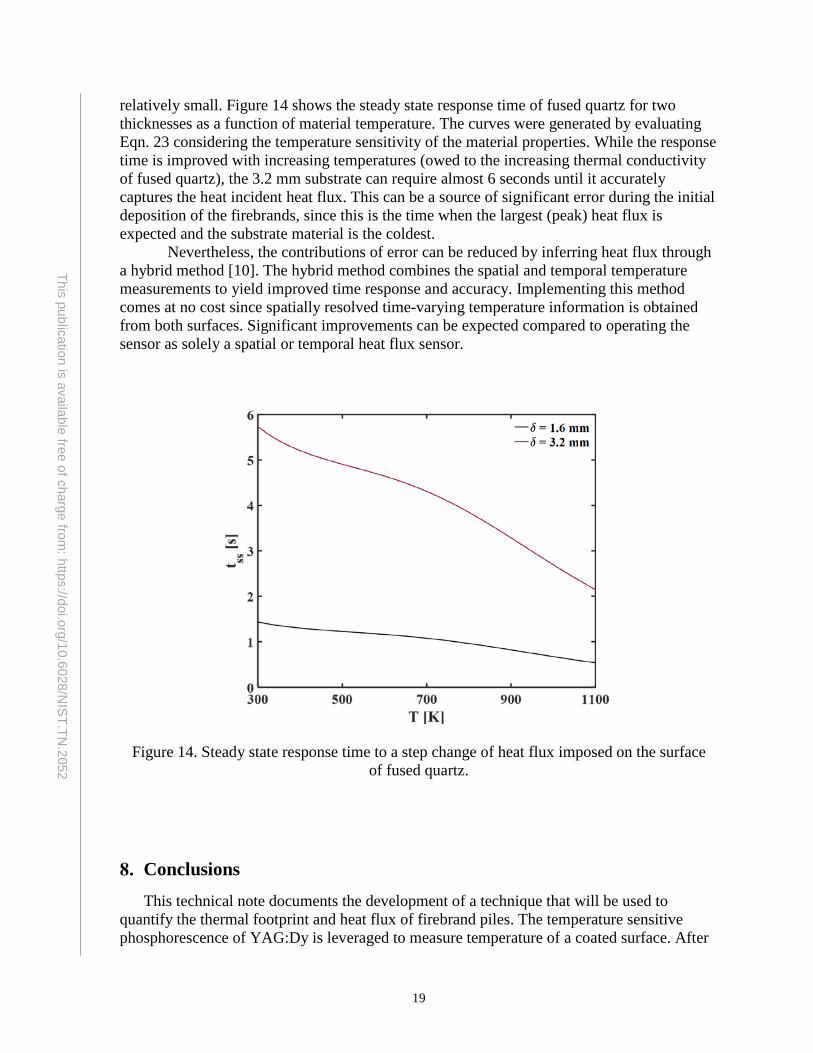
Figure 13 shows the normalized uncertainty in incident heat flux as a function of top surface temperature. The analysis was repeated for substrate thickness of 1.6 mm and 3.2 mm. As expected, the general trend shows how the uncertainty in heat flux increases with the surface temperature. Increasing the incident heat flux by an order of magnitude (varying symbol colors) can reduce the uncertainty by a factor of approximately two. Increasing the substrate thickness (diamond to circle symbols) by a factor of two can further reduce the uncertainty by a factor of approximately two. This results from the larger temperature difference between the surface temperatures. The analysis thus far has shown that increasing the substrate thickness reduces measurement uncertainty under conditions of steady incident heat flux. However, a tradeoff between thinner and thicker substrates exists when considering time-varying heat flux. Thinner substrates will more faithfully resolve unsteadiness in heat flux, and this becomes increasingly true for materials with poor thermal conductivity such as fused silica. The 99 % response time to a step change of heat flux at the substrate surface is given by an empirical relation from Ref. [7]. The steady state response time can be approximated by
𝑡𝑡𝑠𝑠𝑠𝑠 = 0.54𝛿𝛿2
𝛼𝛼
(23)
for a perfectly insulated backside surface which is an acceptable assumption in this case since radiative and free-convective losses on the bottom sides of the substrate can be shown to be
19
This publication is available free of charge from: https://doi.org/10.6028/N
IST.TN.2052
relatively small. Figure 14 shows the steady state response time of fused quartz for two thicknesses as a function of material temperature. The curves were generated by evaluating Eqn. 23 considering the temperature sensitivity of the material properties. While the response time is improved with increasing temperatures (owed to the increasing thermal conductivity of fused quartz), the 3.2 mm substrate can require almost 6 seconds until it accurately captures the heat incident heat flux. This can be a source of significant error during the initial deposition of the firebrands, since this is the time when the largest (peak) heat flux is expected and the substrate material is the coldest. Nevertheless, the contributions of error can be reduced by inferring heat flux through a hybrid method [10]. The hybrid method combines the spatial and temporal temperature measurements to yield improved time response and accuracy. Implementing this method comes at no cost since spatially resolved time-varying temperature information is obtained from both surfaces. Significant improvements can be expected compared to operating the sensor as solely a spatial or temporal heat flux sensor.
Figure 14. Steady state response time to a step change of heat flux imposed on the surface of fused quartz.
Conclusions
This technical note documents the development of a technique that will be used to quantify the thermal footprint and heat flux of firebrand piles. The temperature sensitive phosphorescence of YAG:Dy is leveraged to measure temperature of a coated surface. After

20
This publication is available free of charge from: https://doi.org/10.6028/N
IST.TN.2052
excitation with a 355 nm light source, two images over distinct spectral regions of the phosphorescence emission spectrum are simultaneously acquired. A series of post processing steps are carried out to register the images with one another and yield a two-dimensional temperature map of the phosphor coated surface. The expanded uncertainty in measuring temperature increased monotonically from ± 5.8 K to ± 45.6 K between 297 K and 1073 K, respectively. The main sources of error were associated with the image registration process and noise from the acquired signal. Larger laser energies would significantly improve signal to noise ratio and yield temperatures with greater certainty. The image post-processing reduces the temperature spatial resolution to 0.5 mm. The heat flux resolution is limited by the width of the coated grating patterns, and is therefore approximately 4 mm.
The greatest contributors to the overall uncertainty of incident heat flux were temperature measurement accuracy of both surfaces and the time response of the optical technique. The temperature measurement uncertainty has a large impact on the inferred incident heat flux because it propagates through several channels, such as material property dependence, and estimation of heat transfer coefficient. The response time of the technique can also be a large source of error since inference of heat flux through the spatial gradient in temperature assumes a steady incident heat flux.
Acknowledgments
This work was made possible by the support of several colleagues at NIST. Nicolas Bouvet provided insightful discussions and help acquiring equipment and resources. Stephen Fink and Ed Hnetkovsky fabricated and assembled various experimental components. Cary Presser was kind enough to lend his Nd:YAG laser. Blaza Toman was very helpful in the error analysis portion of the work.
References
[1] R. Gorte, "The rising cost of wildfire protection.," 2013. [2] J. Cohen and R. Stratton, "Home destruction examination grass valley fire," 2008. [3] A. Maranghides, D. McNamara, W. Mell, J. Trook and B. Toman, "A Case Study of a
Community Affected by the Witch and Guejito Fires: Report #2 – Evaluating the Effects of Hazard Mitigation Actions on Structure Ignitions," NIST Technical Note, no. 1796, 2013.
[4] A. Maranghides, D. McNamara, R. Vihnanek, J. Restaino and C. Leland, "A Case Study of a Community Affected by the Waldo Fire – Event Timeline and Defensive Actions," NIST Technical Note, no. 1910, 2015.
[5] S. Caton, R. Hakes, M. Gollner, D. Gorham and A. Zhou, "Review of Pathways for Building Fire Spread in the Wildland Urban Interface Part I: Exposure Conditions," Fire Technology, vol. 53, pp. 429-473, 2017.
[6] R. Hakes, H. Salehzadeh, M. Weston-Dawkes and M. Gollner, "Thermal characterization of firebrand piles," Fire Safety Journal, vol. 104, pp. 34-42, 2018.

21
This publication is available free of charge from: https://doi.org/10.6028/N
IST.TN.2052
[7] T. HighTower, R. Olivares and D. Philippidis, "Thermal Capacitance (Slug) Calorimeter Theory Including Heat Losses and Other Decaying Processes," NASA TM, no. 215364, 2008.
[8] N. Hager, "Thin Foil Heat Meter," The Review of Scientific Instruments, vol. 36, no. 11, pp. 1564-1570, 1965.
[9] T. Diller, "Advanced in Heat Flux Measurements," Advances in Heat Transfer, vol. 23, pp. 279-368, 1993.
[10] D. Hubble and T. Diller, "A Hybrid Method for Measuring Heat Flux," Journal of Heat Transfer, vol. 132, no. 3, 2010.
[11] A. Warey, "Influence of thermal contact on heat transfer from glowing firebrands," Case Studies in Thermal Engineering, vol. 12, pp. 301-311, 2018.
[12] C. Fernandez-Pello, "Wildland fire spot ignition by sparks and firebrands," Fire Safety Journal, vol. 91, pp. 2-10, 2017.
[13] T. Ohlemiller, "Smoldering Combustion," NBSIR, no. 85-3294, 1986. [14] S. Allison and G. Gillies, "Remote thermometry with thermographic phosphors:
Instrumentation and applications," Review of Scientific Instruments, vol. 68, no. 7, pp. 2615-2650, 1997.
[15] M. Alden, A. Omrane, M. Richter and G. Sarner, "Thermographic phosphors for thermometry: A survey of combustion applications," Progress in Energy and Combustion Science, vol. 37, pp. 422-461, 2011.
[16] L. Bradley, "A temperature-sensitive phosphor used to measure surface temperatures in aerodynamics," Review of Scientific Instruments, vol. 24, no. 3, pp. 219-220, 1952.
[17] A. Eckbreth, Laser Diagnostics for Combustion Temperature and Species, UK: Gordon and Breach, 1996.
[18] M. Yu, "Survivability of thermographic phosphors (YAG:Dy) in a combustion environment," Measurement Science and Technology, vol. 21, no. 3, 2010.
[19] X. Niu, J. Xu, Y. Zhang, Y. Chu, B. Yang and C. Zhang, "Photoluminescence properties and concentration quenching of Dy3+ doped YAG," Journal of Ceramic Processing Research, vol. 16, no. 5, pp. 609-613, 2015.
[20] S. Goedeke, "Study of RESBOND® ceramic binders used for high temperature non-contact thermometry," Ceramic Transactions, vol. 163, 2005.
[21] T. Ohlemiller, "Smoldering Combustion Propagation on Solid Wood," Fire Safety Science, vol. 3, pp. 565-574, 1991.
[22] K. Kontis, Y. Syogenji and N. Yoshikawa, "Surface Thermometry by laser-induced fluorescence of Dy3+: YAG," Aeronautical Journal, vol. 106, pp. 456-457, 2002.
[23] A. Hashemi, A. Vetter, G. Jovicic, M. Batentschuk and B. C., "Temperature Measurements using YAG:Dy and YAG:Sm under diode laser excitiation (405 nm)," Measurement Science Technology, vol. 26, 201.
[24] E. Hertle, L. Chepyga, M. Batentschuk and L. Zigan, "Influence of codoping on the luminescence properties of YAG:Dy for high temperature phosphor thermometry," Journal of Luminescence, vol. 182, pp. 200-207, 2017.

22
This publication is available free of charge from: https://doi.org/10.6028/N
IST.TN.2052
[25] R. Park, R. Carroll, B. G., R. Desmari, F. Hall, M. Herzkovitz, E. Mackenzie, R. McGuire, R. Reed, L. Sparks and T. Wang, Manual on the use of thermocouples in temperature measurement, ASTM International, 1993.
[26] E. Sparrow and J. Gregg, "The Variable Fluid Property Problem in Free Convection," Transactions of the ASME, pp. 878-886, 1957.
[27] R. Goldstein, E. Sparrow and D. Jones, "Natural Convection Mass Transfer Adjacent to Horizontal Plates," International Journal of Heat and Mass Transfer, vol. 16, pp. 1025-1035, 1973.
[28] H. Ku, "Notes on the use of propagation of error formulas," Journal of Research of the National Bureau of Standards, vol. 70, no. 4, 1966.