development of a new gis-based storm water … · development of a new gis-based storm water...
TRANSCRIPT
DEVELOPMENT OF A NEW GIS-BASED STORM WATER DATABASE UPDATING SYSTEM: FROM FIELD DATA COLLECTION TO GEODATABASE CREATION
Ming Xie, John M. White, P.E. and Buz Rhees
Environmental Storm Water Management Division, Department of Pubic Works, City of Norfolk, VA 2233 Mckann Avenue, Norfolk, VA, U.S. 23509
Tel: (757) 823-4000; Fax: (757) 441-2402 - [email protected]
ISPRS Commission VII , WG VII/4
KEY WORDS: GIS, Database, GPS, Storm Water, Database Updating ABSTRACT: This paper presents our efforts in the updating of the Storm Water (SW) Database using Global Positioning System (GPS), direct survey and measurements of the Storm Water structures (or called Manhole) in GIS database management. The main task assignments include (1) Designing a data structure, which becomes an effective geodatabase structure to represent the storm water structures and the corresponding pipes; (2) Updating the existing Drainage Inventory Abbreviations, which includes verifying all the existing drainage inventory abbreviations, updating, simplifying, and adding additional abbreviations; (3) Creating Structure picture database, which is linked with structure type to ensure the type is used correctly; (4) Collecting field data by using GPS, which includes the collection of storm water spatial and attribute data respectively. Each Structure’s latitude, longitude and elevation is determined by using GPS; each Structure’s attribute data include Structure type, lid size, invert, pipe count, pipe’s material, shape, size, invert, etc. (5) Implementation using ArcObject Language combining with Visual Basic in ArcGIS 9.1, which includes seven functional modules: entering field data; editing field data; linking GPS data with SW data to calculate pipe elevation; creating structure and pipe layers based on collected data; connecting created new pipes with existing data; data quality control; and updating existing database; (6) Data Quality control, which ensures the created data’s quality by editing field data or the created Structure’s attribute data, adding lost or missing structures, changing pipe flow direction, breaking in pipe segments, connecting two structures, etc. The functions from field data collection, geodatabase creation, to final the database updating are included in the Storm Water Database Updating System (SWDUS), which is a highly practicable and easy operating GIS application system.
1. INTRODUCTION
The City of Norfolk is an urban center of 249.4 km2 located on the eastern seaboard of the United States with a population of 234,000 (2000 census residents). It is developed into a major port, shipbuilding, tourism, and commerce center, and is also the home to the U.S. Navy’s Atlantic Fleet and one of NATO’s headquarters. Norfolk serves as the cultural and business center for the Hampton Roads region of Virginia that has a population exceeding 1.7 million, Hampton Roads boast one of the largest port facilities on the east coast of the United States and is a port of call to many ships from all over the world. Norfolk has maintained a separated storm drainage infrastructure for most of the 20th Century. The separated storm water system ranges from complex urban infrastructure in downtown including flood control walls, gates and a 340 m3 per minute flood control pumping station to more suburban areas with roadside and off road ditch systems. The storm water system has gown as the City expanded and now consists of more than 570 km of pipes, 80 km of ditches and in excess of 27,000 structures. In the early 1970’s the City of Norfolk undertook a major survey and inventory of its existing storm water drainage system. Every pipe, structure and outfall was surveyed and checked. The result of the survey data was drafted on more than 200 maps. The drainage data was also modeled at that time producing hydraulic grades lines for much of the system. This data has been mostly lost with the advent of advanced technology and time. The current GIS layer of the City’s storm
water drainage system is a digitized version of the paper maps from 1970’s. The associated database was converted from a “Word Perfect” file to DBF format. Updates from 1974 have been very sporadic that generally involved digitizing as built drawings. Significant redevelopment and growth throughout the City has made substantive changes and additions to the storm water system. Thus, updating the system is a high priority in the Environmental Storm Water Management Division of Public Works at the City of Norfolk. In 2002 the City decided to bring the 1970’s data up-to-date. It was determined that the most effective means of doing this task was by using sub-centimeter GPS, traditional surveying, and a new geodatabase in ArcGIS. The City formed a partnership between the Environmental Storm Water Management Division and the Survey Division to accomplish this task. However, a particular challenge that was realized early in the process was how to manage the data being collected by two teams so that it could be efficiently incorporated into the geodatabase. This paper reports our efforts in the updating of the Storm Water database using GPS, direct survey and measurements of the Storm Water structures in GIS database management.
2. ANALYSIS OF THE DATABASE UPDATING REQUIREMENTS
2.1 Overview the Data Updating Requirements
115

The International Archives of the Photogrammetry, Remote Sensing and Spatial Information Sciences. Vol. XXXVII. Part B4. Beijing 2008
116
The International Archives of the Photogrammetry, Remote Sensing and Spatial Information Sciences. Vol. XXXVII. Part B4. Beijing 2008
In order to meet frequent database updating demands for the future, a team that consisted of 20 years veteran storm water engineer and GIS programmer overviewed the whole database updating work flow, predicted the new requirements of the storm water system, analyzed current database management, and recognized which parts need improvement and how to improve them, we consistently agreed the following factors should be considered in the new system
(1) Pipe size, shape, elevation and their connection have to be known to analyze the capacity of our storm water system.
(2) Pipe material, installed year, and their condition have to be known for the maintenance tracking. Since the pipe is underground, we only can measure the two ends of a pipe in the corresponding structures.
(3) Structure size (opening size, depth, shape, etc.), lid material and condition must also be known in order to analyze the capacity and keep good maintenance.
(4) In addition, the data updating system should include all the attributes that we need, and the operation needs to be easy and fast so that the updating work can be performed in a timely manner.
2.2 The Flowchart of Storm Water Database
Figure 1 is a proposed flowchart of SWDUS. This system consists of seven modules:
(1) Entering Field Data; (2) Editing Field Data; (3) Linking GPS Data to Calculate Pipe Elevation; (4) Creating Structure and Pipe Layers; (5) Connecting Existing Data; (6) Editing the New Features to Control the Data Quality; (7) Updating the Existing Database.
Such design mainly considered the following factors: • High automation. From field data collection, data
processing to database updating, a high degree of automation will benefit users to save post-processing time and reduce their labor intension.
• Easy Operation. The system is planned to design for those who have little experiences in ArcGIS software and/or database operation. Thus, each operation will be realized by different styles of menu bar, pull-down menu, submenu, and help function.
• Standardization. In order to be compatible with other database, such as Oracle, ArcGIS software, the data type and format including data entry, processing, operation, etc. will use standard code.
3. DESIGN AND IMPLEMENTATION 3.1 Data Model and Organization
Based on experiences in the organization and discussion with different expert in storm water management, City of Norfolk, data structure and type of different components are designated below. For the structures: The data organization and types of structures in SWDUS are listed in table 1.
Field Name Data Type Length Comments OBJECTID Long int Automatic numberStruNo Text 10 Structure Number StruType Text 4 Structure Type LidType Text 2 Lid’s type LidSize Text 10 Lid’s size RimElev Double Rim Elevation InvElev Double Invert Elevation CntPipe Int Count of the pipesYrInstalled Int The year installed Condition Text 4 Structure conditionSurveyDate Date Survey date Northing Double Y coordinate Easting Double X coordinate … … … …
Table 1. The Data Organization and Types of Structures
For the pipes: The data organization and types of pipes in SWDUS are listed in table 2.
Table 2. The Data Organization and Types of Pipes
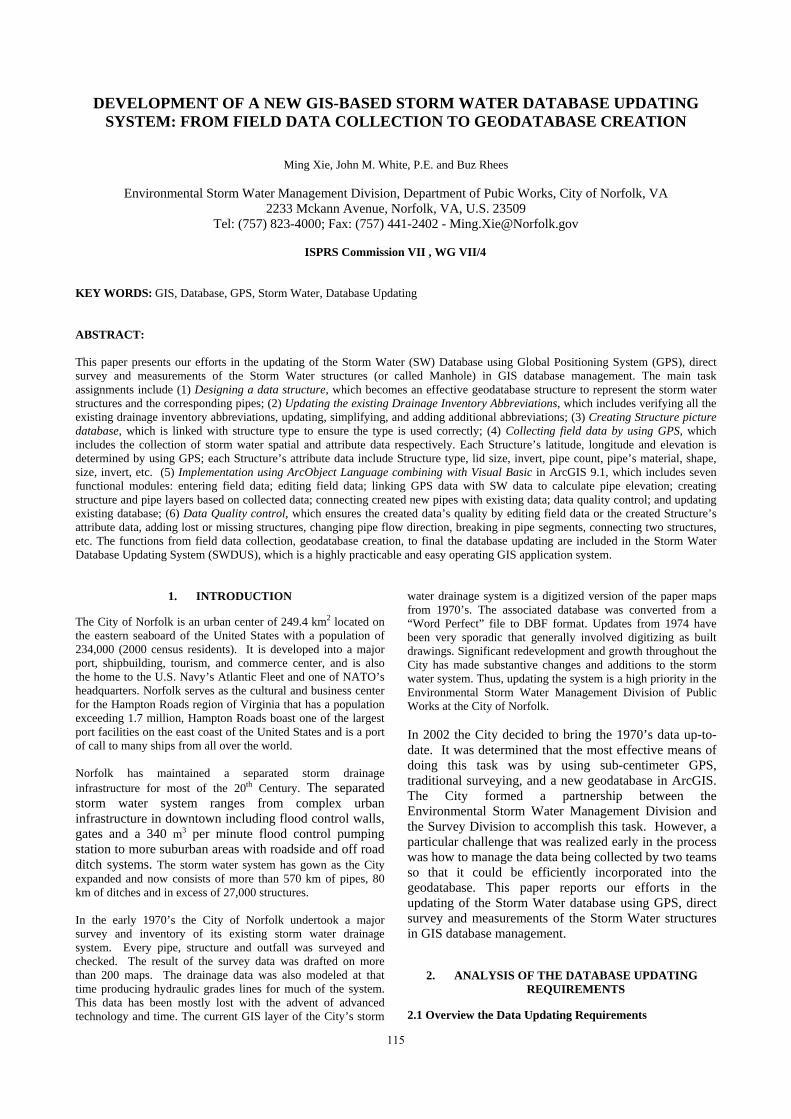
For the SW field data: we developed the type of data organization to represent geometric data and attribute data for describing SW structures and corresponding pipes (see Figure 2). The Structure number is a unique ID linking GPS data with SW field data.
Figure 2. The SW Field Data Organization/Linking with GPS
Data For the linking of the SW field data with GPS data: we developed algorithms to automatically calculate the elevations of the pipes, create structure layer and pipe layer based on the field collected data. In order to ensure the data will be linked and converted automatically, the following data organizeion is designated (see Figure 3).
Field Name Type Length Meaning OBJECTID Long int Automatic number UPNO Text 10 Up-structure number UPElev Double Up-structure elevation DNNO Text 10 Down-structure number DNElev Double Down-structure elevationUP_DNSTRCT Text 21 Up-down Stru. numbersMAT Text 4 Pipe's material code GEOM Text 2 Pipe's shape code … … … …
117

The International Archives of the Photogrammetry, Remote Sensing and Spatial Information Sciences. Vol. XXXVII. Part B4. Beijing 2008
Figure 3. The Data Organization for Creating New Structure/Pipe Layers
Updating the existing Drainage Inventory Abbreviations. The previous Drainage Inventory Abbreviations in City of Norfolk was updated in February, 2002. Because of the complexity and confusion in the existing database, we verified all the existing drainage inventory abbreviations including updating and simplifying the abbreviations (see table 3). In addition to structure type, pipe material, and pipe shape, we made other codes such as structure/pipe condition, Invert bottom type, lid’s type and so on to standardize the data management (see table 4). All the codes will be utilized by the SWDUS; so, simplifying the data was essential since it will be used by users for maintenance and operations activities.
ABRV. Structure Type New ABRV. Description BRBD Bridge drain BRDR Bridge drain
CBDV Catch basin doubleVDOT standard CBVD
Catch basin double VDOT standard
DIDH Drop inlet - Norfolk standard DINS
Drop inlet - Norfolk standard
ENCL Entrance pipe-culvert PECL Pipe entrance-culvert
ENP Entrance pipe PE Pipe entrance
ENPF Entrance pipe – Flared end PEFE
Pipe entrance – Flared end
ENPH Entrance pipe – Head wall PEHW
Pipe entrance – Flared end
… … … …
Table 3. The Updated the Drainage Inventory Abbreviations
ABRV. Invert bottom Type ABRV. Lid TypeSUMP Sump DE DecorativeINVERT Invert ST Standard NONE No sump/no invert GR Grid
UNKNOWN unknown
Table 4. The Additions of the Drainage Inventory Abbreviations Create Structure picture database. In order to ensure the code of structure type is used correctly, we created structure picture database to link the structure type in the field data entry form (see Figure 4) to verify the structure type entry. 3.3 Implementation of System
The SWDUS was originally developed by ArcObject combining with Visual Basic in the desktop ArcGIS 9.1 environment, and was updated to ArcGIS 9.2 in 2007, which includes seven functional modules: (1) Entering Field Data; (2)
Editing Field Data; (3) Linking GPS Data with SW Data to Calculate Pipe Elevation; (4) Creating Structure and Pipe Layers; (5) Connecting Created New Pipes with Existing Data; (6) Data Quality Control; and (7) Updating Existing Database. Entering Field Data: Entering Field Data module is a basic and important phase because it is the first step for updating database. Collecting and recording data in field is the longest phase, which determines if the updating can go smoothly. Its correctness directly affects the whole data quality. Therefore, we use this module to directly enter the field data into the SWDUS to reduce the mid-process for avoiding the possibilities of manmade errors, which greatly increase the work efficiency and ensure the data quality. In addition, we used a lot of down-arrow selections for inputting all kinds of types, materials, shapes, conditions and etc. linking the structure’s picture database with the type to verify the data entry; listing saved structure number to avoid repeat entry. The pipes’ information inputting is controlled by the pipe’s count. The maximum pipe count is 6 (see figure 4).
Figure 4. Storm Water Field Data Entry Form
Editing Field Data: Editing Field Data is a necessary module for correcting errors in field data entry. Correcting the errors detected in the field immediately can save a lot of time and avoid trouble when the data is downloaded. Its interface is shown in figure 5. The filed data also can be edited in the office by using the MS Access. Its interface is shown in figure 6.
Figure 5. The Interface of Editing Data in Field
118
The International Archives of the Photogrammetry, Remote Sensing and Spatial Information Sciences. Vol. XXXVII. Part B4. Beijing 2008
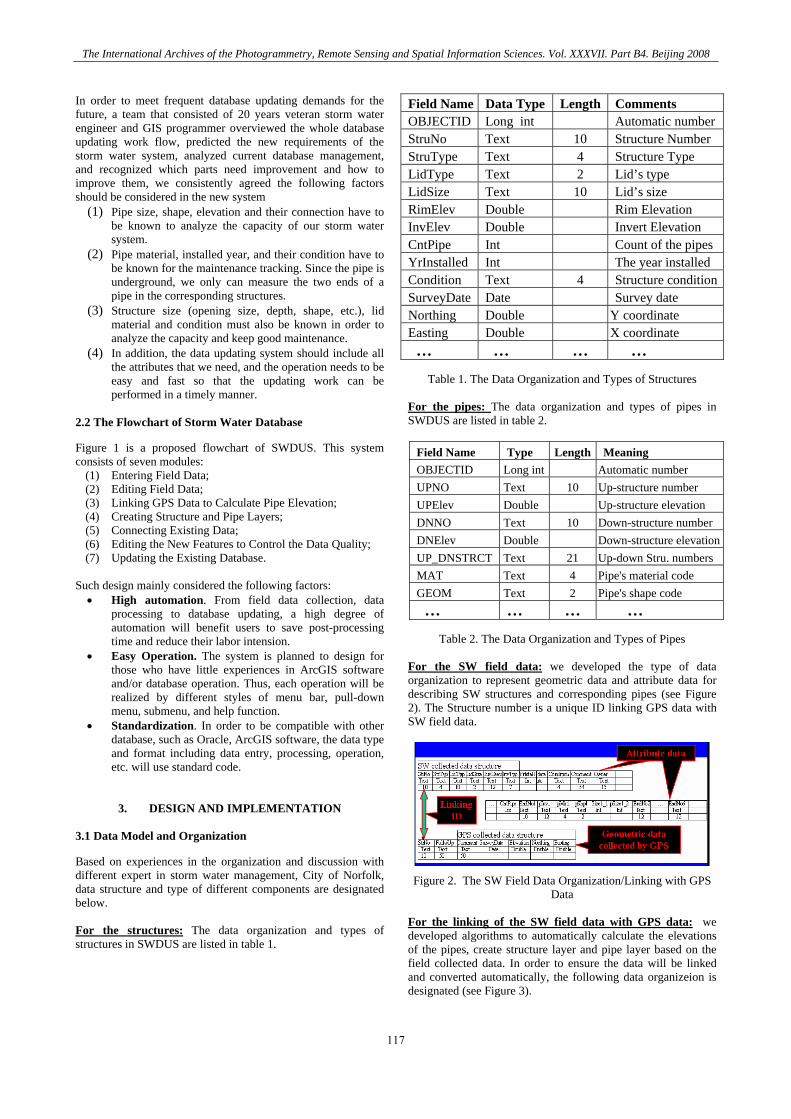
Figure 6. The Interface of Editing Field Data in MS Access
Linking GPS Data/Calculate Elevation: This is a key module f the SWDUS. If the GPS data can not link with Storm water attribute data, the entire process will not function. So keeping both data linked together is very important. In practice, the storm water team measures the storm water attribute data first, and writes down each structure number on the lid of the structure, so that the survey team can use the same structure number. In case of a mistake intransercting or detected, it can be discovered during data linking. Misnumbered structures will show as unlinked members. Correcting the unlinked number based on the SW pipe connection, then link again until fully linked. Therefore, merging all SW field data together and making sure both of SW data and GPS data have same records is very crucial section in the preparation. The link interface is shown in Figure 7.
Figure 7. The Interface of Linking SW Data with GPS Data Creating Structure/Pipe Layers: This module is performed automatically in the SWDUS. It includes some tests and judgment functions to verify if the data is ready to generate structure and pipe layers. If the data is not ready, some help messages will be given, which ensures the correctness of new feature generation. It takes less than a minute to create about thousand records of structure and pipe layers. In the structure type, unfound structures are called out as LOST. After the pipe layer is created, the LOST structure numbers are listed for user to verify (see Figure. 8).
Figure 8. The List of All the LOSTs.
Connecting Existing Data: Connecting Existing Data is a main module in the SWDUS. Our goal is using new collected or edited data to replace the existing data. At our current pace (2 persons collect SW attribute data), updating city wide data will take 5 years, thus, we plan on creating new structure and pipe layers based on the collected data, then connecting the portion of updated data with the existing data to keep the mapping in use. Therefore, how do we effectively connect existing data becomes a key part of the SWDUS. This module was realized by a personal-computer alternate method. First, the system finds a structure that has a LOST designation to create a new pipe, zoom in the area shown in figure 9(a), and display the connecting interface for the selecting feature (see figure 10). The LOST structure could be one in the existing structure, existing pipe, CN data, new structure, new pipe, segment a new pipe or a new point. Then the user will use the “Select” tool bar (see figure 11) to highlight where the LOST is in the screen, which is shown in figure 9(b). Finally, the user can click the “Connect” tool bar (see figure 11), to generate the new pipe, which is shown in figure 9(c).
(a) (b) (c) Figure 9. The Process of Connecting Existing Data.
(a) Zoom in the Area for Selecting LOST; (b) Highlight the Existing Pipe; (c) The Connecting Result
Figure 10. The Interface of Connecting Existing Data
Figure 11. The Tool Bar of SWDUS
Load GPS (Survey) Data
Load Attribute (SW) Data
Save the Combined Data
119
The International Archives of the Photogrammetry, Remote Sensing and Spatial Information Sciences. Vol. XXXVII. Part B4. Beijing 2008
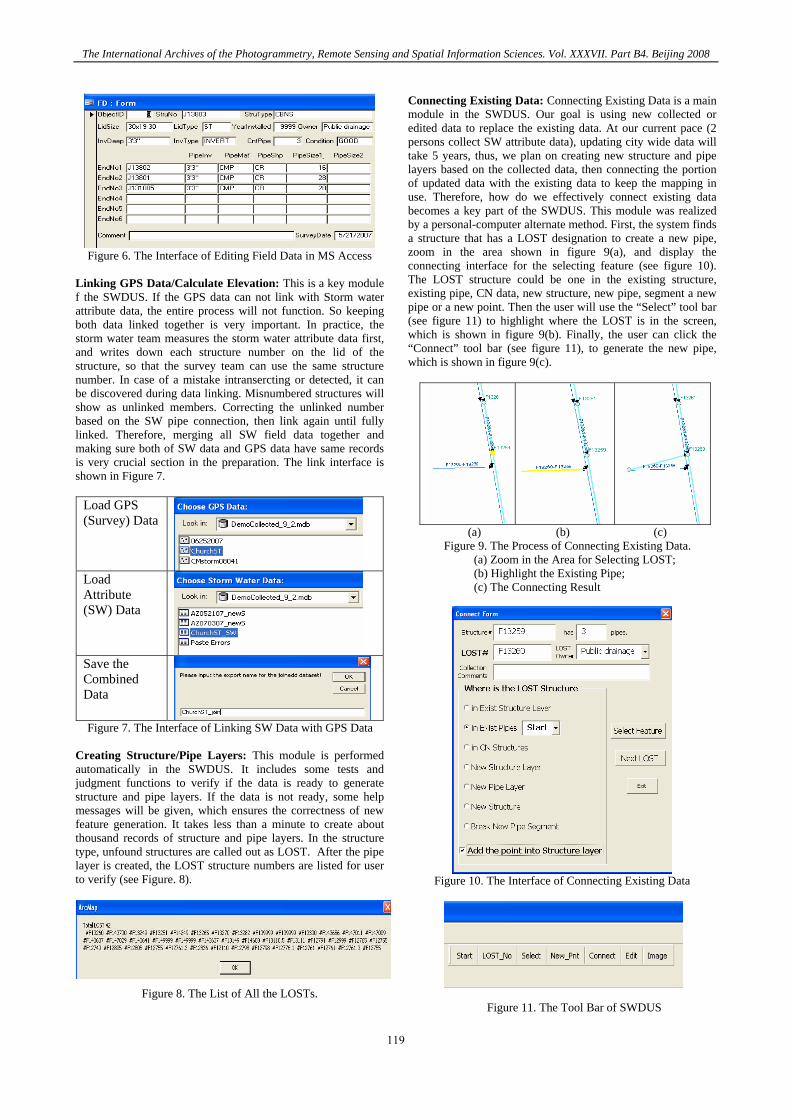
Data Quality Control: This is an assistant module to control the data quality by editing the both of the newly created structure layer and pipe layer. The detail functions are shown in the figure 12.
Figure 12. The Interface of the Editing New Feature Updating Existing Database: The Updating Existing Database is the final module in the SWDUS. The main function is to perform precise and fast replacement of existing data with new data. The methods include (1) dissolve the new pipes; (2) create a 10 m buffer in the dissolved layer shown in figure 13(a); (3) select the existing structures and the existing pipes in the buffer shown in figure 13(b); and (4) delete the selected dataset shown in figure 13(c).
(a) (b)
(c)
Figure 13. The Process of Updating Existing Database.
(a) Create a 10 m Buffer, (b) Selecting the Existing Data in the Buffer, (c) The Result after Deleting the Selected Dataset. 4. FIELD TEST and EVALUATION
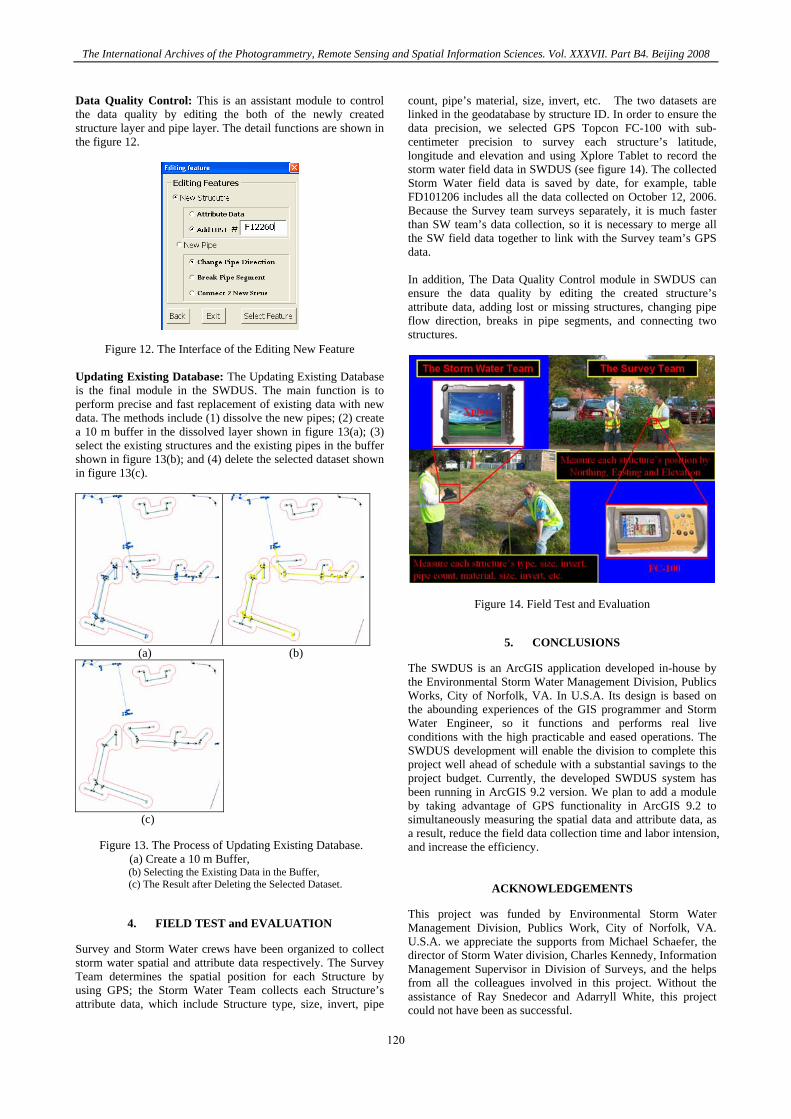
Survey and Storm Water crews have been organized to collect storm water spatial and attribute data respectively. The Survey Team determines the spatial position for each Structure by using GPS; the Storm Water Team collects each Structure’s attribute data, which include Structure type, size, invert, pipe
count, pipe’s material, size, invert, etc. The two datasets are linked in the geodatabase by structure ID. In order to ensure the data precision, we selected GPS Topcon FC-100 with sub-centimeter precision to survey each structure’s latitude, longitude and elevation and using Xplore Tablet to record the storm water field data in SWDUS (see figure 14). The collected Storm Water field data is saved by date, for example, table FD101206 includes all the data collected on October 12, 2006. Because the Survey team surveys separately, it is much faster than SW team’s data collection, so it is necessary to merge all the SW field data together to link with the Survey team’s GPS data. In addition, The Data Quality Control module in SWDUS can ensure the data quality by editing the created structure’s attribute data, adding lost or missing structures, changing pipe flow direction, breaks in pipe segments, and connecting two structures.
Figure 14. Field Test and Evaluation
5. CONCLUSIONS
The SWDUS is an ArcGIS application developed in-house by the Environmental Storm Water Management Division, Publics Works, City of Norfolk, VA. In U.S.A. Its design is based on the abounding experiences of the GIS programmer and Storm Water Engineer, so it functions and performs real live conditions with the high practicable and eased operations. The SWDUS development will enable the division to complete this project well ahead of schedule with a substantial savings to the project budget. Currently, the developed SWDUS system has been running in ArcGIS 9.2 version. We plan to add a module by taking advantage of GPS functionality in ArcGIS 9.2 to simultaneously measuring the spatial data and attribute data, as a result, reduce the field data collection time and labor intension, and increase the efficiency.
ACKNOWLEDGEMENTS
This project was funded by Environmental Storm Water Management Division, Publics Work, City of Norfolk, VA. U.S.A. we appreciate the supports from Michael Schaefer, the director of Storm Water division, Charles Kennedy, Information Management Supervisor in Division of Surveys, and the helps from all the colleagues involved in this project. Without the assistance of Ray Snedecor and Adarryll White, this project could not have been as successful.
120