development of a myoelectric detection circuit platform
TRANSCRIPT

DEVELOPMENT OF A MYOELECTRIC DETECTION CIRCUIT PLATFORM FOR
COMPUTER INTERFACE APPLICATIONS
A Thesis
presented to
the Faculty of California Polytechnic State University,
San Luis Obispo
In Partial Fulfillment
of the Requirements for the Degree
Master of Science in Biomedical Engineering
by
Nickolas Andrew Butler
March 2019

ii
© 2019
Nickolas Andrew Butler
ALL RIGHTS RESERVED

iii
COMMITTEE MEMBERSHIP
TITLE: Development of a Myoelectric Detection
Circuit Platform for Computer Interface
Applications
AUTHOR:
Nickolas Andrew Butler
DATE SUBMITTED:
March 2019
COMMITTEE CHAIR:
Robert Szlavik, Ph.D.
Professor of Biomedical Engineering
COMMITTEE MEMBER: Robert Crockett, Ph.D.
Associate Dean for Innovation Infrastructure
College of Engineering
COMMITTEE MEMBER:
Kristen O’Halloran Cardinal, Ph.D.
Professor of Biomedical Engineering

iv
ABSTRACT
Development of a Myoelectric Detection Circuit Platform for Computer Interface
Applications
Nickolas Andrew Butler
Personal computers and portable electronics continue to rapidly advance and
integrate into our lives as tools that facilitate efficient communication and interaction
with the outside world. Now with a multitude of different devices available, personal
computers are accessible to a wider audience than ever before. To continue to expand and
reach new users, novel user interface technologies have been developed, such as touch
input and gyroscopic motion, in which enhanced control fidelity can be achieved. For
users with limited-to-no use of their hands, or for those who seek additional means to
intuitively use and command a computer, novel sensory systems can be employed that
interpret the natural electric signals produced by the human body as command inputs.
One of these novel sensor systems is the myoelectric detection circuit, which can measure
electromyographic (EMG) signals produced by contracting muscles through specialized
electrodes, and convert the signals into a usable form through an analog circuit. With the
goal of making a general-purpose myoelectric detection circuit platform for computer
interface applications, several electrical circuit designs were iterated using OrCAD
software, manufactured using PCB fabrication techniques, and tested with electrical
measurement equipment and in a computer simulation. The analog circuit design
culminated in a 1.35” x 0.8” manufactured analog myoelectric detection circuit unit that
successfully converts a measured EMG input signal from surface skin electrodes to a

v
clean and usable 0-5 V DC output that seamlessly interfaces with an Arduino Leonardo
microcontroller for further signal processing and logic operations. Multiple input
channels were combined with a microcontroller to create an EMG interface device that
was used to interface with a PC, where simulated mouse cursor movement was controlled
through the voluntary EMG signals provided by a user. Functional testing of the interface
device was performed, which showed a long battery life of 44.6 hours, and effectiveness
in using a PC to type with an on-screen keyboard.

vi
TABLE OF CONTENTS
Page
LIST OF TABLES ............................................................................................................. ix
LIST OF FIGURES ............................................................................................................ x
CHAPTER
1. INTRODUCTION .......................................................................................................... 1
1.1.1 General Introduction to Electrophysiology and Biopotentials ............................... 1
1.1.2 Electromyography .................................................................................................. 3
1.1.3 Muscle Force Production and EMG Signal Intensity Relationship ....................... 4
1.1.4 Types of Electrodes for EMG Signal Capture ....................................................... 7
1.1.5 Impedance Characteristics of Skin......................................................................... 9
1.2.1 Biopotential Amplifiers and the Myoelectric Circuit .......................................... 11
1.2.2 Applications of the Myoelectric Circuit .............................................................. 13
1.2.3 Signal Processing and Machine Learning ............................................................ 14
1.3.1 Analog Circuit Components ................................................................................ 19
1.3.2 The Differential Amplifier ............................................................................... 19
1.3.3 Active Band-Pass Filter ................................................................................... 22
1.3.4 Active Full Wave Rectifier .............................................................................. 23
1.4.1 Introduction to the Arduino Microcontroller and Programming Environment ... 24
1.5.1 Summary and Aim of Thesis ............................................................................... 26
2. SPECIFICATIONS ....................................................................................................... 27
2.1.1 EMG Interface Device Introduction .................................................................... 27

vii
2.1.2 PC Input Specifications.................................................................................... 27
2.1.3 Measurement Electrode Configurations .......................................................... 29
2.1.4 Myoelectric Circuit Analog Unit Specifications.............................................. 30
2.1.5 Microprocessor and PC Interface..................................................................... 31
2.1.6 Summary of EMG Interface Specifications ..................................................... 32
3. DESIGN AND METHODS .......................................................................................... 33
3.1.1 Interface Design Introduction .............................................................................. 33
3.2.1 Myoelectric Circuit Unit Simulation with PSpice ............................................... 33
3.2.2 Differential Amplifier ...................................................................................... 34
3.2.3 Band Pass Filter ............................................................................................... 37
3.2.4 Active Full Wave Rectifier .............................................................................. 40
3.3.1 Myoelectric Circuit Unit Fabrication ................................................................... 42
3.3.2 Breadboard and Protoboard Circuits ................................................................ 42
3.3.3 PCB Circuit Design.......................................................................................... 46
3.3.4 PCB Circuit Assembly ..................................................................................... 49
3.3.5 Solderless Breadboard Circuit ......................................................................... 51
3.4.1 EMG Interface Device Assembly ........................................................................ 52
3.4.2 Power Bridge Circuit ....................................................................................... 52
3.4.3 EMG Measurement Wiring.............................................................................. 52
3.4.4 Device Enclosure and Mounting ...................................................................... 53
3.4.5 EMG Interface Device Summary ..................................................................... 54
3.5.1 Arduino Leonardo Software ................................................................................ 55

viii
3.5.2 Software Review .............................................................................................. 56
3.6.1 Test Methods ........................................................................................................ 58
3.6.2 Device Current Draw Test ............................................................................... 58
3.6.3 Device Efficacy in Human Model Test ........................................................... 59
4. RESULTS ..................................................................................................................... 62
4.1.1 EMG Interface Device Current Draw Results ..................................................... 62
4.1.2 Device Efficacy in Human Model Test Results ................................................... 63
5. DISCUSSION AND CONCLUSIONS ........................................................................ 65
5.1.1 Discussion of Current Draw Test Results ............................................................ 65
5.1.2 Discussion of Device Efficacy Human Model Test Results ................................ 66
5.1.3 Challenges Faced ................................................................................................. 68
5.1.4 Improvements and Future Work .......................................................................... 70
5.1.4 Final Conclusions................................................................................................. 71
BIBLIOGRAPHY ............................................................................................................. 72
APPENDICES .................................................................................................................. 74
A. EMG Interface Device Bill of Materials .................................................................. 74
B. EMG Interface Device Reference Images ................................................................ 75
C. EMG Interface Device Arduino Sketch Code .......................................................... 77

ix
LIST OF TABLES
Table Page
I: Summary of target motion for each EMG signal .......................................................... 29
II: Voltage and resistor values for simulated differential amplifier .................................. 35
III: Voltage, resistor, and capacitor values for simulated band-pass filter ....................... 38
IV: Voltage and resistor values for simulated full wave rectifier ..................................... 41
V: List of components for Myoelectric Circuit Unit ........................................................ 51
VI: Device Efficacy Results .............................................................................................. 64

x
LIST OF FIGURES
Figure Page
1: Intracellular membrane voltage as a function of time for an action potential ................ 2
2: Functional Motor Unit .................................................................................................... 4
3: Force production vs. EMG signal intensity test setup [4]............................................... 5
4: EMG Signal Intensity vs. Force Production [4] ............................................................. 6
5: Surface and Intramuscular EMG Capture Techniques ................................................... 7
6: Types of Surface Electrodes [Danlee Medical Products, 2011] ..................................... 8
7: Bi Transverse Double Differential Electrodes [5] .......................................................... 9
8: Equivalent Non-Linear Circuit Model for Skin ............................................................ 10
9: General Form of the Myoelectric Recording System ................................................... 13
10: The DARPA Hand Using Myoelectric Interface [Mike McGregor, 2009] ................ 14
11: SVDD decision function [10] ..................................................................................... 16
12: EMG Recognition System with NTPF [10] ................................................................ 17
13: EMG processing module with mechanical hand [10] ................................................. 18
14: A configured differential amplifier interface [12] ...................................................... 20
15: A Simulated Differential Amplifier Circuit ................................................................ 21
16: Band Pass Filter Circuit .............................................................................................. 23
17: Active Full Wave Rectifier Circuit ............................................................................. 23
18: The Arduino Leonardo Microcontroller [14].............................................................. 25
19: Example of PC On-Screen Keyboard ......................................................................... 28
20: Targeted movements for EMG signal capture [15] .................................................... 28
21: EMG Channel Target Muscles [16] ............................................................................ 29
22: Myoelectric Circuit Unit ............................................................................................. 31

xi
23: Block Diagram for PC EMG interface Device ........................................................... 32
24: Differential Amplifier ................................................................................................. 34
25: Transient response for Differential Amplifier ............................................................ 35
26: Differential amplifier with common-mode source ..................................................... 36
27: Transient response of common-mode source ............................................................. 37
28: Band-Pass Filter Circuit .............................................................................................. 38
29: Frequency spectrum for band-pass filter in Voltage vs. Log(Frequency) .................. 39
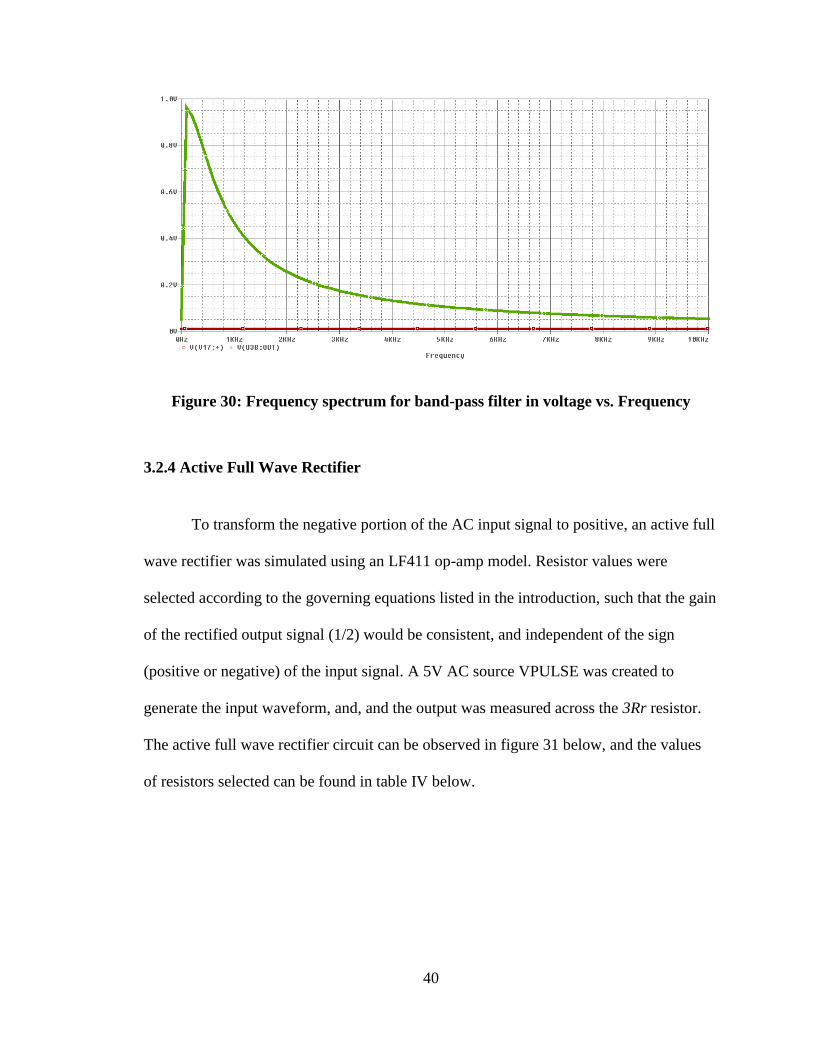
30: Frequency spectrum for band-pass filter in voltage vs. Frequency ............................ 40
31: Active Full Wave Rectifier Circuit ............................................................................. 41
32: Transient response rectified signal ............................................................................. 42
33: Myoelectric Circuit Unit Diagram .............................................................................. 43
34: Myoelectric Circuit Unit Prototype ............................................................................ 44
35: TI LF411 Operational Amplifier [17] ......................................................................... 45
36: EMG test of Breadboard Prototype Circuit ................................................................ 46
37: Myoelectric Circuit Unit Constructed in Express SCH software ............................... 47
38: Myoelectric Circuit Unit PCB Layout ........................................................................ 48
39: TI LM324AN Quad Op-Amp [18] ............................................................................. 49
40: Fully Assembled Myoelectric Circuit Unit PCB ........................................................ 50
41: EMG Measurement Wire Bundle ............................................................................... 53
42: The EMG Interface Device ......................................................................................... 55
43: Electrode placement on forearm ................................................................................. 60
44: Electrode placement on forearm and upper arm ......................................................... 61
45: Results from myoelectric circuit unit current draw test .............................................. 62

xii
46: Results from EMG Interface Device current draw test ............................................... 63

1
Chapter 1
INTRODUCTION
1.1.1 General Introduction to Electrophysiology and Biopotentials
In the broad field of electrophysiology, the detection, measurement, and analysis
of bioelectric potentials, or biopotentials, are the fundamental topic of focus. These
electrical signals are generated from excitable cells found in muscular, nervous, and
glandular tissue, and possess membrane voltage-gated ion channels that control the flow
of K+, Na+, and Cl- ions into and out of the cell [1]. Due to differences in concentration of
these charged ions inside and outside of the cell, a difference in voltage resides across the
membrane. This difference in voltage is known as the resting membrane potential, which
typically resides within a range of -50 mV to -100 mV for mammalian peripheral muscle
excitable cells [1]. When an electrical potential stimulus is applied to the excitable cell,
from either an external source, or from another nearby excitable cell, the voltage-gated
ion channels will open and allow for the flow of ions into and out of the cell. This flow of
ions depolarizes the intracellular membrane potential and creates what’s known as an
action potential as seen in figure 1.

2
Figure 1: Intracellular membrane voltage as a function of time for an action
potential
During depolarization, the intracellular membrane potential generally approaches a
maximum value of +60 mV, which is known as the Nernst Potential. As the action
potential is generated, it also travels along the length of the cell, which can be considered
a conducting electrical impulse. For cells such as neurons, which possess axons up to
several feet in length, the action potential may travel a significant distance as it conducts
[2]. Therefore, to produce meaningful actions at the termination source, action potentials
can travel at speeds up to 270 miles per hour [3]. To help maintain electrical continuity,
and improve conduction velocity, neurons are encased in a specialized fatty membrane
known as a myelin sheath [3]. Immediately after action potential production, the excitable
cell may not generate additional action potentials for a duration known as the refractory
period, which is controlled by membrane channel proteins with gating time constants [1].
The ultimate destination of the conducting impulse is either to the brain through a sensory
neuron, or to skeletal or cardiac muscle through a motor neuron [2]. When both sensory

3
and motor neurons cluster together, they form nerves, which then travel to large skeletal
muscle groups throughout the body.
1.1.2 Electromyography
One of the terminal sites for motor neurons is a skeletal muscle fiber, which
connects via a structure known as a neuromuscular junction [2]. When an action potential
travels down the neuron to the neuromuscular junction, an electrochemical cascade
follows that eventually results in additional voltage-gated ion channels on the muscle
fiber opening, and initiates an action potential within the muscle fiber itself. As the action
potential propagates along the muscle fiber, it initiates a process known as excitation-
contraction coupling, which as the sliding filament theory states, creates a muscle fiber
contraction [2].
In the case of muscle fiber contraction, the motor neuron and muscle fibers
operate as a single unit. This combination of a single motor neuron and all individual
muscle fibers it innervates form a structure known as a motor unit [2]. For a muscle such
as the biceps brachii, a motor unit typically composes 150 individual muscle fibers. The
functional motor unit, beginning at the ventral horn of the spinal cord, traveling through
the neuronal axon, and ending at a muscle fiber, can be seen in figure 2 below.

4
Figure 2: Functional Motor Unit
When a single motor unit is stimulated for contraction, the action potential that
propagates through the muscle fibers has an amplitude of 20-2000 µV, and a discharge
frequency of 6-30 Hz [1]. For peripheral skeletal muscle, the voltage potential from the
motor units can be measured through a process known as electromyography or EMG [1].
To stimulate the muscle to produce a larger contractile force, more individual motor units
are activated simultaneously in a process known as motor unit recruitment [2]. This
subsequent increase in force production through motor unit recruitment in turn produces a
proportional increase in voltage potential at the muscle.
1.1.3 Muscle Force Production and EMG Signal Intensity Relationship
In a study conducted by Liping Qi et al titled, “Spectral properties of
electromyographic and mechanomyographic signals during isometric ramp and step
contractions in biceps brachii”, the relationship between muscle force production and
EMG signal intensity was measured in an effort to characterize motor unit recruitment.
An experiment was conducted involving twenty healthy subjects, in which the biceps

5
brachii of the non-dominant arm was the primary muscle of investigation. Using a
mechanical support fixture, the subject’s arm was oriented in the extended supinated
position, while maintaining an elbow angle of 150°. A force transducer (Omega
Engineering) was connected perpendicular to the length of the arm at the wrist to measure
force production resulting from bicep flexion. To measure the EMG signal generated at
the bicep, 12 mm stainless steel surface electrodes were placed midline of the biceps
brachii and interfaced with a custom-built amplifier circuit connected to a laptop running
Agilent VEE Pro for data collection. The testing setup can be seen in figure 3 below [4].
Figure 3: Force production vs. EMG signal intensity test setup [4]
To first calibrate the measurement equipment, subjects performed a maximum voluntary
contraction of the biceps, which was standardized as the 100% contraction level relative
to baseline. The first test performed involved using a visual feedback system to show
force production, while performing a biceps flex in 20% incrementing contraction levels
for 10 seconds at each increment while EMG signal intensity and force production were

6
measured. Increments were continued until 80% of the maximum contraction level was
reached. The second test was known as the ramp test, in which subjects were instructed to
gradually increase biceps brachii contraction level until 90% of the maximum contraction
level was achieved. After collecting data from the entire sample group, the resulting
relationship between muscle force production and EMG signal intensity for both tests
was evaluated. The resulting plot of EMG signal intensity relative to force production can
be seen in figure 4 below [4].
Figure 4: EMG Signal Intensity vs. Force Production [4]
Evaluating the resulting relationship between the measured EMG signal intensity and the
produced force from contraction of the biceps brachii, it was observed that a relatively
linear relationship existed for both the step and ramp testing conditions. Overall, the
results obtained in the study conducted by Liping Qi et al suggest that when specifically
measuring EMG signal amplitude, an accurate estimate of muscle contraction effort can
be predicted. By capturing an EMG signal at its source, a processed form of this signal
could serve as input to a wide variety of voluntary control systems. In addition to use as a

7
binary input, the amplitude of the signal could also be measured and compared to a
known threshold to generate a dynamic output signal.
1.1.4 Types of Electrodes for EMG Signal Capture
Classically, the method of capturing the EMG signal of a conducting muscle of
moderate volume is through the use of a conducting electrode. The two primary EMG
capture methods are surface EMG (type A), which uses surface electrodes, and
intramuscular EMG, in which needle electrodes are inserted directly into the muscle
fibers (type B). These two methods can be seen in figure 5 below.
Figure 5: Surface and Intramuscular EMG Capture Techniques
Characteristic differences between these two techniques influence the type setting in
which they can be used. For surface EMG, typically mechanical clamping electrodes or
disposable adhesive electrodes are used (figure 6).

8
Figure 6: Types of Surface Electrodes [Danlee Medical Products, 2011]
Disposable adhesive electrodes are composed of some kind of conducting metal, such as
Ag/Ag Chloride, and a conducting adhesive hydrogel. While surface electrodes are non-
invasive and easy to use, they are sensitive to electrical signals over a large area and can
only be used with superficial muscles. This large detection area can create difficulties
when attempting to isolate EMG signals from individual muscles, as signals from other
nearby contracting muscles can be picked up as well. For intramuscular EMG, individual
or deeper muscles can be better distinguished through the use of needle electrodes. While
this technique has much greater detection precision and much lower impedance than
surface EMG, the technique is fairly invasive and can be uncomfortable for the user [2].
In regard to EMG readings from arm muscles, a clear signal is defined as: that which
conveys information about the individually contracting muscle motor units. Clear and
differentiable signals can be read via indwelling needle electrodes; however, they are not
ideal for long-term signal capture, due to their potential for infection. In a study
conducted by Jin Lee et al., contractile motor unit signal optimization was performed by
analyzing several different surface electrode configurations using an advanced volume
conductor model in combination with an intracellular action potential equation to

9
simulate individually contracting motor units under the skin. Seven different spatial
filters (electrode configurations) were evaluated using this model, with the criteria that
the best signal was that which presented the most differentiable motor unit action
potential signal relative to two individual motor units. It was found that the bi-transverse
double differential electrode configuration (figure 7) was able to capture the most
distinguishable individual motor unit signals [5]. This study described how a differential
electrode configuration is important for isolating a usable signal from contracting
muscles.
Figure 7: Bi Transverse Double Differential Electrodes [5]
1.1.5 Impedance Characteristics of Skin
For EMG detection using surface electrodes, it is important to understand the
inherent electrical characteristics of skin. In a study conducted by S.J. Dorgan and R.B.
Reilly titled, “A model for human skin impedance during surface functional
neuromuscular stimulation,” an updated mathematical model of the dynamic electrical

10
characteristics of human skin was created through an experiment involving
neuromuscular stimulation. After completing the experiment, it was found that skin has
linear and non-linear impedance characteristics due to the variability of epithelial
composition. A recreation of the equivalent circuit model can be seen below:
Rs
Rp
Cp
Figure 8: Equivalent Non-Linear Circuit Model for Skin
Referencing the equivalent model above, Rs represents the linear impedance component
due to dermis and subcutaneous layers, while Cp and Rp represent the non-linear RC
component due to the epidermis. The variability for Rp was found to be influenced
primarily by the relative thickness of the epidermal layer [6].
Regarding the actual impedance variability of skin, a study conducted by J. Rosell
et al measured skin impedance while varying signal frequency from 1 Hz to 1 MHz.
Measurements were taken on the leg, forehead, and thorax of ten subjects, where no skin
preparation was conducted (no abrasion to lower skin impedance) other than the
application of a conducting gel. Results showed that for low frequency signals, skin
impedance varied from 10 kΩ to 1MΩ, and for high frequency signals, impedance was
found to be in the hundreds of ohms. Based on the high input impedance of skin at lower
frequencies, it was concluded that the design of biopotential amplifiers incorporate very
high input impedances to reduce the amount of noise picked up from a differential
measurement source [7].

11
1.2.1 Biopotential Amplifiers and the Myoelectric Circuit
When detecting EMG signals either through the surface or intramuscular method,
some form of analog signal processing is required to make the signal readable by
measurement equipment. Typically, this processing is done through an electronic circuit
known as a biopotential amplifier, or in the case specifically for EMG signals, a
myoelectric circuit. For EMG signals measured at the muscle, amplitude typically range
from 0 to 10 mV AC (peak-to-peak) or 0 to 1.5 mV (rms), however when measuring with
surface electrodes, the large skin impedance can lower the signal to 0 to 2 mV AC [8]. In
order to convert this signal to a range that is more easily interfaced with measurement
systems, amplification of the signal is generally performed by an analog amplifier, such
as an inverting or non-inverting amplifier circuit. Another important circuit is the
differential amplifier, which rejects the common mode signal attributed to noise.
Regarding the frequency spectrum of EMG signals, they encompass a usable
spectrum of 0-500 Hz, with the majority of usable signal falling within the 50-150 Hz
range [9]. When measuring EMG within this active spectrum however, a number of
sources of interference effectively degrade the overall quality of the signal.
Electromagnetic radiation sources such as radio transmissions, power outlets, electrical
wires, and fluorescent lights operate with a primary frequency of 60 Hz at amplitudes up
to three times the inherent EMG signal [9]. When measuring with surface electrodes, the
wires and metal contacts effectively act as antennas, picking up these sources of
interference. In addition to interference from outside sources, another source of
interference, known as motion artifacts, are destructive signals generated by motion at the
electrode/skin interface, and through flexing of the electrode cable. Interference signals

12
from this source reside within the 0 to 20 Hz range. To significantly reduce the impact of
these sources of electrical interference and improve the overall quality of the EMG
signal, several different electrical circuits can be implemented. The first circuit
commonly utilized is the differential amplifier, which uses a two-source electrode design,
in combination with a ground reference, and allows for a significant amount of the noise
to be eliminated through a process known as common mode signal rejection.
Another circuit commonly used to remove the unwanted noise from sources
operating at higher frequencies is the active filter circuit. Active filter circuits include:
active low pass, active high pass, and when combined, active band pass filters. The
primary benefit from using active filters is that they not only allow for discrimination of
the allowed frequency, but can implement a signal gain as well. For applications with
small potential EMG signals, this is an advantageous characteristic. High pass and low
pass filters function by only allowing a specific bandwidth to pass through the circuit,
while all other frequencies are filtered out. The desired passing bandwidth can be
specifically set by adjusting the resistive and capacitive values for the circuit. With the
previously mentioned EMG active frequency of 0-500 Hz, and 0-20 Hz interference due
to motion artifacts, it would be permissible to design a band pass filter with a passing
bandwidth of 20-500 Hz. To remove the common interference produced from lights,
power outlets, and other electronics that operate at 60 Hz, another filtering technique
known as band reject filtering can be used. This technique incorporates what is known as
a notch filter to remove specific frequencies with a very narrow bandwidth.
To operate as a controller interface, it is also important to convert the inherent AC
EMG signal to a DC signal. This operation can be performed through the use of an active

13
rectifier circuit. More information on the analog circuit components that perform these
amplification, filtering, and rectifying operations can be found later in section 1.3.1.
When these circuit elements are combined into a single circuit, they form the
principle basis for the myoelectric circuit. A block diagram for the general form of EMG
systems can be seen in figure 9 below.
Differential Amplifier
Operational Amplifier Active FilterMeasurement
Electrodes
Reference
Electrode
RectifierAmplified, Filtered, DC
Output
Figure 9: General Form of the Myoelectric Recording System
1.2.2 Applications of the Myoelectric Circuit
The fundamental purpose of the myoelectric system is to capture EMG signals,
and transform them into a form that can be interfaced with other electronic devices. This
inherent ability to act as a user interface facilitates numerous practical applications in
areas such as prosthetics, robotics, computer interaction, and assist devices. For disabled
individuals, the myoelectric interface method presents a means to increase mobility and
dexterity. Specifically, with prosthetics, a patient who has undergone an amputation of an
arm or a hand can regain a high degree of manual dexterity through the control of robotic
systems via captured EMG signals produced from residual voluntary muscle groups in
the arm. By capturing the signals from these residual muscle groups, specifically the ones
that formerly performed the now lost action, such as closing one’s hand, a highly intuitive
user control system can be developed. As seen with the several current myoelectric
prosthetic hands in the market, such as the DEKA Research “Luke” arm, Touch Bionics’

14
“iLimb”, and the “DARPA Hand”, the use of this control system has proven to be highly
effective. Figure 10 below shows the DARPA hand in use.
Figure 10: The DARPA Hand Using Myoelectric Interface [Mike McGregor, 2009]
1.2.3 Signal Processing and Machine Learning
For applications in which complex coordinated motion is desired, such as power
grasp, wrist flexion/extension, lateral pinch, cylindrical grasp, etc., multiple input
channels are required to interpret these complex signals. Each of these input channels
would typically be isolated to an individual muscle, and in the case of most practical
EMG detection methods, measured through the use of two surface electrodes. To reliably
interpret complex motions measured from several inputs, a microprocessor is commonly
utilized in conjunction with an analog amplifying circuit to create an EMG signal
recognition system. An optimized EMG recognition system should only accept and
process target patterns that reflect the intended motion, and reject those that do not [10].
In a study conducted by Yi-Hung Liu et al titled, “Towards a high-stability EMG

15
recognition system for prosthesis control A one-class classification based non-target
EMG pattern filtering scheme”, the authors highlighted that the variable accuracy and
stability of these EMG recognition systems is a critical issue that often leads to
unintended motion for myoelectric prosthesis users. They identified that other
myoelectric detection systems relied on an EMG recognition method known as a “multi-
class classifier”, which would classify and label inputs performed during a calibration
training phase. This training phase would classify the input pattern into pre-defined
“motions”, such as those listed above. However, there would often be unaccounted
motions that the user intended to perform, such as those with variation in signal
amplitude or combination. In a study conducted by Thilina Lalitharatne et al, the effects
of muscle fatigue due to prolonged prosthetic were found to significantly diminish EMG-
based signal amplitude [11]. In these situations, the resulting motion of the prosthetic
device would either be unintended, or diminished. To allow for a wide variety of motions
to be detected, with flexibility and adaptability in mind, the authors presented an
advanced machine-learning non-target pattern filtering technique (NTPF). This pattern
filtering technique was based on a method known as “one-class classification” or
“novelty detection”, where a limited data-set of EMG target patterns recorded during a
training phase could be utilized to identify patterns that existed outside of an exact
“class”. This method used a machine-learning mathematical technique called “support
vector data description” (SVDD), in which the data-set recorded during training would be
used to generate a mathematical hypersphere with a minimum volume. The boundary of
this hypersphere would be utilized to identify target data. After deriving expressions for
the center point and radius of the hypersphere, an expression for the volume of the

16
hypersphere, and probability that an input would reside in a certain space was
established. By treating the volume expression as in constrained optimization problem,
eventually a decision function for the SVDD was established:
Figure 11: SVDD decision function [10]
Where c is a constant that relates the radius and total volume occupied by the
hypersphere, αi is a component of the data point vector that describes location relative to
the hypersphere boundary, K is the kernel function that describes the dot product data
point vector array, and x is the target EMG pattern. In cases where DSVDD(x) ≤ 0, the
target EMG pattern was accepted as x. When the condition wasn’t true, the pattern was
identified as “non-target” and therefore rejected.
For the purpose of their study, the SVDD data analysis method was limited to a
single EMG input pair. Therefore, they utilized two different hyperspheres to evaluate the
data. The overall structure of the non-target pattern filtering technique and EMG
recognition system can be seen in figure 12 below:

17
Figure 12: EMG Recognition System with NTPF [10]
To evaluate this filtering technique relative to traditional multi-class classifier
techniques, Yi-Hung Liu et al constructed a myoelectric detection circuit that utilized
EMG surface electrodes for signal capture. Real time signal processing was carried out
using a 60 Hz notch filter and a 30-400 Hz band-pass filter. The data was fed to an AD
converter that sampled at 2.5 KHz, and transferred the data to a PC. Next, four
components from each EMG input’s raw data were selected, and compiled into a vector
data array. The two vector data arrays were then combined, and fed into the NTPF
routine, and evaluated using the SVDD decision function. If the pattern was found to be
targeted, it would then be processed by a traditional decision tree known as the EMG
pattern classifier (EMG-PC), which would then generate the appropriate prosthetic
motion. For the purposes of this study, a five-fingered table-top mechanical hand was
utilized to establish credibility of the EMG recognition system. A user would hook up
two electrode pairs to their arm, perform an intended hand motion, and if measured and

18
identified correctly, the mechanical hand would replicate the motion. The set-up can be
seen in figure 13 below:
Figure 13: EMG processing module with mechanical hand [10]
Eight kinds of hand motions were identified, each of which was recorded for the
training routine 10 times. Following training, the user was assigned a randomized motion
routine. Over the course of the test routine, each motion was performed a total of 10
times. After performing the test using the NTPF recognition scheme, the test was
repeated using a traditional multi-class classifier technique, which instructed processed
signals to be passed directly to the EMG pattern classifier. Results showed a significant
difference in the successful classification rates between the two methods. The NTPF
recognition scheme was found to be successful 87% of the time, while the traditional
multi-class classifier technique proved to be successful only 51% of the time.
In summary, this study conducted by Yi-Hung Liu et al proved that with
significant machine learning and processing, relatively high interpretation accuracy rates

19
could be achieved. However, the sampling rate used in this study produced extremely
large data sets that took significant time to process. The authors state that while the
technique was effective in improving EMG signal interpretation reliability, the
processing duration required to produce an output was sufficiently long, such that the
scheme would not currently be practical for prosthetic control. Reducing the time to
process the data was to be their main focus for future work [10].
As outlined with this study, it will be necessary for an EMG detection system to
incorporate user calibration data in addition to standard analog signal processing to
produce usable outputs. Since the motions evaluated in the study by Yi-Hung Liu et al
were somewhat complex and measured through only two electrode pairs, perhaps using
several inputs could be reliably interpreted through simpler motions combined with
additional electrode inputs.
1.3.1 Analog Circuit Components
The following section provides additional background of several circuit elements
commonly found in EMG detection circuits.
1.3.2 The Differential Amplifier
The differential amplifier, also known as a difference amplifier, is arguably one of
the most important analog elements of the myoelectric detection circuit. This element
actively rejects noise from surrounding lights, computers, power lines, and other
electromagnetic sources, which are picked up by the body and electrical leads [9]. It does
so through the use of two input electrodes, used in conjunction with a ground reference.
The circuit is designed in such a way that the component of the signal that is different

20
between the two inputs is amplified and passed through, while the component that is the
common is rejected. In the case of EMG detection, the differential signal is from the
contracting muscle, while the common signal is from noise. Off-the-shelf amplifiers often
come with a rating known as a “common mode rejection ratio”, or “CMRR”, with the
rating given in dB. CMRR is defined in the equation below:
𝐶𝑀𝑅𝑅 = 10𝑙𝑜𝑔10 (|𝐴𝑑
𝐴𝑐|)
2
In this equation, Ad is the gain of the differential component of the amplifier, while Ac is
the gain of the common mode component. As Ac goes to zero, the CMRR goes to infinity
[1]. For myoelectric signal detection, it is typically recommended to use operational
amplifiers that have a CMRR of 90 dB or greater [9]. A diagram of a differential
amplifier, with the connection methods can be seen in the image below:
Figure 14: A configured differential amplifier interface [12]
As the diagram shows, the detecting electrodes connected to the positive and negative
terminals of the differential amplifier are also connected to the target muscle. A third

21
electrically unrelated terminal is connected as the reference, or ground. In the diagram, m
is the muscle signal, while n is the noise. The signal passed into the rest of the circuit is
given by:
(𝑚1 + 𝑛) − (𝑚2 + 𝑛) = 𝑚1 − 𝑚2
A simulated version of a differential amplifier coupled to two voltage following buffer
amplifier circuits can be seen in the picture below.
Figure 15: A Simulated Differential Amplifier Circuit
When used in EMG detection cases, adding a voltage following buffer amplifier can be
helpful in reducing the transfer of high input impedance to the rest of the circuit. Without
this addition, the high input impedance of an electrode would attenuate the active
differential gain, Ad, of the proceeding differential amplifier.

22
1.3.3 Active Band-Pass Filter
Another circuit useful in further eliminating noise from EMG signals is the band-
pass filter. This filter combines both a low-pass, and a high-pass filtering circuit to create
a circuit block that attenuates all outgoing signals except those that fall within a pre-set
frequency spectrum. The high pass filter only attenuates components of the signal that
fall in the low frequency range of 20 Hz and below. When built with an operational
amplifier, the circuit can not only filter, but actively amplify the signal when coupled
with an operational amplifier. To set the active gain and low pass threshold of this circuit,
resistor and capacitor values may be selected, and evaluated according to the function
describing the output voltage with respect to frequency shown below,
𝑉𝑜(𝑗𝜔) = −𝑉𝑖(𝑗𝜔)𝑅𝑓−𝐻𝑃
𝑅𝑖−𝐻𝑃
𝑗𝜔𝑅𝑓−𝐻𝑃𝐶𝑓−𝐻𝑃
1 + 𝑗𝜔𝑅𝑓−𝐻𝑃𝐶𝑓−𝐻𝑃
where the ratio of resistors Rf-HP and Ri-HP set the active circuit gain. With some
manipulation, Cf-HP can be isolated and solved for to determine capacitor value necessary
to set a high pass cut-off frequency limit specified by ω.
To attenuate high frequency noise, the low pass filter can be utilized. As with the
high pass circuit, incorporating an operational amplifier can add additional gain, which is
necessary due to the low incident amplitude of most EMG signals. The output voltage as
a function of the circuit frequency ω can be seen in the equation below,
𝑉𝑜(𝑗𝜔) = −𝑉𝑖(𝑗𝜔)𝑅𝑓−𝐿𝑃
𝑅𝑖−𝐿𝑃
1
1 + 𝑗𝜔𝑅𝑓−𝐿𝑃𝐶𝑓−𝐿𝑃
where the ratio of resistors Rf-LP and Ri-LP set the active circuit gain. As with the high pass
filter, Cf-LP may be found to configure the desired low-pass cutoff frequency. A diagram
of a band-pass filter can be seen in figure 16 below.

23
Figure 16: Band Pass Filter Circuit
1.3.4 Active Full Wave Rectifier
Due to the sinusoidal AC nature of EMG signals, an active full wave rectifier can
be used in an EMG circuit to generate an analog DC signal that can easily be measured
and interpreted by a microprocessor. A diagram of an active full wave rectifier can be
seen in figure 17 below.
Figure 17: Active Full Wave Rectifier Circuit

24
This circuit functions by first acting as a voltage divider when VIN is positive. This is due
to the diode creating an open circuit, where current is only allowed to travel through
resistors 2RRec, RRec, and 3RRec. The function for a positive waveform input signal is given
by the following expression:
𝑉𝑜 = 𝑉𝑖
1𝑅𝑅𝑒𝑐 + 2𝑅𝑅𝑒𝑐
1𝑅𝑅𝑒𝑐 + 2𝑅𝑅𝑒𝑐 + 3𝑅𝑅𝑒𝑐=
1
2𝑉𝑖
Next, when VIN becomes negative, the op-amp becomes active, the diode closes, and the
circuit acts as an inverting amplifier, therefore making VOUT positive. The equation for a
negative waveform input is shown below.
𝑉𝑜 = −𝑉𝑖
1𝑅𝑅𝑒𝑐
2𝑅𝑅𝑒𝑐= −
1
2𝑉𝑖
1.4.1 Introduction to the Arduino Microcontroller and Programming Environment
To create a functional output from a measured EMG signal, a method of
analyzing and processing that signal into a meaningful output is required. This can be
achieved through the use of a microcontroller electronics board, which is a small
computer that can perform a host of tasks, such as processing input and output signals,
performing logic operations and mathematical calculations, and read and write data.
These desired tasks are coded into the microcontroller through software that is written
into the onboard memory. For the purposes of EMG signal analysis, a microcontroller
electronics board can easily interface with multiple discrete analog circuits
simultaneously to process the measured signal for a desired means.
One such microcontroller electronics board platform that has gained significant
popularity amongst hobbyists and inventors is the Arduino Electronics Platform. This

25
platform is open-source, in that the coding and hardware platforms, and numerous coding
guides and examples are provided for free use on the internet. No matter the Arduino
electronics board selected, the hardware and software are easy to understand and use.
An Arduino program is called a “sketch”, and is comprised of code that closely
follows C and C++ programming languages. This allows anyone with a basic familiarity
of these languages to easily create sketches of their own [13].
For projects that interface with a PC, the Arduino Leonardo electronics board is
desirable, as it has built-in USB communication features. These features allow the
microcontroller to easily connect with a PC and act as a virtual keyboard, mouse, or
serial/COM device. The central processing unit for this board is an ATmega32u4
microchip, which allows for communication with 20 digital input/output pins, 12 of
which can act as analog inputs. This board runs at 16 MHz, has a discrete micro USB
connection, power input, reset button, and several LED lights [14]. The layout of this
board can be seen in figure 18 below.
Figure 18: The Arduino Leonardo Microcontroller [14]

26
1.5.1 Summary and Aim of Thesis
In the field of electronic sensors and measurement systems, the myoelectric
detection circuit, which can measure and interpret the voltage potentials generated from
contracting muscles in the body, presents opportunities to interface with the human body
in novel and interesting ways. For individuals with limited or no use of their hands, but
who have a wish to use personal computers, an EMG measurement and interface device
specifically configured, could allow them to do so. In addition to disabled individuals,
this EMG interface device could also provide a novel means for anyone to interact with
and use a computer, and provide more degrees of input than generally available.
The general aim of this thesis project is to do just that; create a specifically
designed EMG measurement device that interfaces with a personal computer, and allows
for voluntary user control. This device would incorporate a general-purpose analog
myoelectric detection circuit that would perform the real-time signal isolation, filtering,
and amplification required for a clean and usable EMG signal. The physical user interface
would utilize surface electrodes that would easily configure to target the specific muscle
groups of interest. Signal processing and recognition techniques, as well as serial I/O
communication with the computer, would be accomplished using an integrated Arduino
Leonardo microcontroller. Overall, the device would be intuitive to use, self-contained,
and provide a means to use a personal computer in ways unlike those of traditional
methods.

27
Chapter 2
SPECIFICATIONS
2.1.1 EMG Interface Device Introduction
The following section details the general requirements and specification of the
EMG interface device. These specifications describe the design elements and rationale
for this device, starting with the selected PC input interface, target user input and muscle
groups, measurement electrode configuration, analog circuit elements, and digital signal
processing and PC I/O. The information presented here will form the foundation from
which the physical manufactured EMG interface device will take shape.
2.1.2 PC Input Specifications
When interfacing with a PC, there are several methods reading input from a user,
such as a keyboard, mouse, or joystick, etc. The Arduino Leonardo microcontroller can
simulate all three of these by loading the desired library file, and connecting through a
USB interface. For the purposes of this EMG interface device, it is desirable to simulate
hardware that maximizes the number of use cases for the user’s input. Most PCs today
provide a wide array of accessibility options, such as an on-screen keyboard where text
can be “typed” out using a PC mouse as shown in figure 19 below.

28
Figure 19: Example of PC On-Screen Keyboard
For this reason, movement of a mouse cursor, with the ability to “left click”, was selected
as the input method to simulate for the EMG interface device.
For an easy-to-understand mouse movement system, it is necessary to have
enough EMG signal channels such that all cursor degrees of freedom can be generated.
To accomplish this, the device user’s forearm was targeted. The wrist motions shown in
figure 20 below would generate an EMG signal at the target activator muscle (figure 21),
and would be captured by one of four input electrode channels.
Figure 20: Targeted movements for EMG signal capture [15]

29
Figure 21: EMG Channel Target Muscles [16]
Table I below summarizes the cursor direction, intended wrist motion, and target
activated muscle group for each EMG measurement channel.
Table I: Summary of target motion for each EMG signal
Channel Cursor Direction Intended Wrist Motion Target Activated Muscle
1 Up Radial Flexion Extensor Carpi Radialis
2 Down Ulnar Flexion Flexor Carpi Ulnaris
3 Left Flexion Flexor Carpi Radialis
4 Right Extension Extensor Carpi Ulnaris
2.1.3 Measurement Electrode Configurations
To accurately isolate and detect EMG signal patterns corresponding to input
directions across a user’s forearm, an array of electrodes will be required. For ease of
installation and general user comfort, disposable adhesive-backed surface electrodes shall
be used as part of the EMG interface device. These electrodes will be placed in adjacent

30
pairs parallel to the length of the target muscle, such that a differential signal can be
measured between both electrodes. As presented in previous sections, this differential
electrode configuration, when coupled with a differential amplifier circuit, allows for the
desired part of the signal (EMG) to be amplified, while the undesired electrical noise is
attenuated. All measured signals shall be referenced to electrical ground of the user,
through the use of a single surface electrode connected to an EMG-inactive region of the
body. While the use of surface electrodes will limit signal detection to superficial muscle
groups, a calibration routine shall be employed that will identify and establish EMG
signal activation thresholds for each target muscle.
2.1.4 Myoelectric Circuit Analog Unit Specifications
For this EMG interface device, each input channel shall be captured and
processed by a discrete myoelectric circuit unit. This unit will read a 1-10 mV 50-150 Hz
AC EMG signal across two surface electrodes placed at the target muscle, amplify the
differential component of the signal, and reject the common-mode through the use of an
instrumentation amplifier with a CMRR of 80 dB or greater. Next, the signal will pass
through an active band-pass filter, where further signal processing will amplify the EMG
signal with a passing bandwidth of 20-500 Hz, and attenuate all other components
attributed to noise. Next, an active full wave rectifier will convert the AC signal to DC
and provide additional circuit gain. Finally, a non-inverting op-amp will provide final
gain tuning to ensure a 0-5V DC signal is transferred to the microprocessor. A block
diagram of the myoelectric circuit unit can be seen in figure 22 below.

31
EMG Signal Captured with
Surface Electrodes
Active Band Pass Filter
Bandwidth 20-500Hz
Active Full Wave Rectifier
AC DC Transform
Non-Inverting Op-Amp
Final Gain Tuning
Differential Amplifier
Removes common mode noise signal
Bandwidth 25-10kHz
0-5V DC Output Microprocessor
Figure 22: Myoelectric Circuit Unit
2.1.5 Microprocessor and PC Interface
For movement of the mouse cursor in all four directions, each of the myoelectric
circuit units will process one EMG channel, and pass this DC signal to a discrete analog
input of an Arduino Leonardo microcontroller. This microcontroller will interpret the
incoming 0-5V DC analog EMG signal, and convert it to a digital Boolean value. This
digital value will first be used to calibrate the input threshold where mouse cursor
movement will begin. Once this value has been established, an EMG signal input greater
than the threshold will trigger mouse cursor movement. This movement command will be
transmitted to the PC via USB serial I/O. Figure 23 below shows a block diagram for the
overall EMG interface device, comprising four discrete input channels.

32
Electrode PairEMG Channel 1
Arduino Leonardo Microcontroller
Interprets DC Analog Signal Converts analog signal to digital Calibrates activation threshold Simulates mouse driver
Serial I/O of cursor via USB
Personal Computer
Mouse cursor moves
in desired direction
Myoelectric Circuit Unit
Amplifies EMG signal Attenuates noise
Rectifies to DC
Electrode PairEMG Channel 2
Myoelectric Circuit Unit
Amplifies EMG signal Attenuates noise
Rectifies to DC
Electrode PairEMG Channel 3
Myoelectric Circuit Unit
Amplifies EMG signal Attenuates noise
Rectifies to DC
Electrode PairEMG Channel 4
Myoelectric Circuit Unit
Amplifies EMG signal Attenuates noise
Rectifies to DC
Figure 23: Block Diagram for PC EMG interface Device
2.1.6 Summary of EMG Interface Specifications
As presented in this chapter, the EMG interface device will employ an electrical
circuit, where EMG signals will be captured at target muscle groups via discrete analog
circuit units. These analog circuit units will connect to a surface electrode pair and
measure AC EMG signals, which will then be filtered, amplified, and rectified to DC
using operation amplifiers, resistors, capacitors, and diodes. Next, an Arduino Leonardo
microcontroller will read the DC EMG signal supplied by the analog circuit unit, and
compare the value to a calibrated threshold. When this value exceeds the threshold, the
microcontroller will command a PC, connected via USB, to move a mouse cursor in the
user’s desired direction.

33
Chapter 3
DESIGN AND METHODS
3.1.1 Interface Design Introduction
Utilizing the general specifications for the EMG interface device, a circuit design
layout was created with general parameters assigned. To confirm the function of circuit
elements and parameters selected, testing was performed in simulated and physical
circuits. The results of these tests ultimately influenced the part selection and
manufacturing of the final interface device.
Upon confirming the various design elements, several fabrication processes were
employed to create a functioning device. Details about the device design and assembly,
components used, and manufacturing processes employed will be presented in this
chapter.
3.2.1 Myoelectric Circuit Unit Simulation with PSpice
A simulation of the myoelectric sub-circuits was created in OrCAD PSpice to
evaluate signal gain through resistor selection, signal filtering, and overall circuit
function. For this test, a LM6132 operation amplifier model was selected due to its large
gain potential and CMRR of 100 dB. Resistor and capacitor values were selected for the
gain and filtering frequency desired using the governing equations listed in chapter 1.

34
3.2.2 Differential Amplifier
A differential amplifier was constructed in OrCAD Spice with a single 10 mV
VSIN 10 Hz AC source connected to an op-amp to simulate an EMG input source. The
second input op-amp terminal was wired to ground. The reason these were set at two
different potentials was to simulate a differential source signal. LM6132 op-amps were
used and connected to +9V DC and -9V DC power supplies. A target gain of 150 was set
by connecting 150K and 1K resistors. A diagram of the simulated differential circuit can
be seen in figure 24, and a summary of the voltage and resistor values can be found in
table II below.
Figure 24: Differential Amplifier

35
Table II: Voltage and resistor values for simulated differential amplifier
Source Value Units
VSIN Amplitude 0.01 V
VSIN Frequency 10 Hz
Op-Amp Supply ±9 V
R111 1k Ω
R112 1k Ω
R211 150k Ω
R212 150k Ω
When running a transient simulation for 1 second, with a time step of 1ms, the
following response was observed showing the input V(V9:+), and output V(R211:2)
voltages. This response can be observed in figure 25 below.
Figure 25: Transient response for Differential Amplifier
When observing the transient response for the differential amplifier, a clear
amplification of the AC portion of the input signal (red) can be seen relative to the output

36
(green). While the output signal was observed to be centered around +0.9 V due to an
inherent characteristic of the LM6132 op-amp model, the relative input and output
amplitudes can be compared to determine the total circuit gain. This op-amp gain, ADiff
can was calculated as shown below.
𝐴𝐷𝑖𝑓𝑓 =(2.5𝑉 − .9𝑉)
0.01 𝑉= 160
To confirm the concept of differential amplification, in which the common signal
shared between both inputs (known as the common-mode signal) is rejected and only the
difference between the two (differential mode signal) is amplified, an additional VSIN
AC input was connected to the second input terminal. This second input had the same
parameters as the first input, and therefore formed a common-mode signal. Figure 26
shows the modified circuit.
Figure 26: Differential amplifier with common-mode source

37
Another transient response plot was generated to demonstrate the effect of the
common-mode source. Figure 27 shows the resulting input vs. output characteristics.
Figure 27: Transient response of common-mode source
In evaluating the transient response, it is observed that when both inputs of the
differential amplifier are the identical, the AC portion of the signal is not amplified. More
specifically, the red input AC voltage V(V9:+) can be seen to have no corresponding
amplification in the green output V(R211:2) voltage. Again, it is important to note that
the cause of the +0.9 V shift of the output signal from 0 V is attributed to the LM6132
op-amp used.
3.2.3 Band Pass Filter
For the purpose of additional filtering, a band-pass filter was simulated using the
LM6132 op-amp model. The selection of the filtering bandwidth was set to 20-500 Hz, as
EMG signal frequencies have been observed to fall within this range. For this circuit, all
other electronic interference, which typically occurs in the range of 1 kHz and greater,
should be filtered out. Again, a 10 mV AC source was selected. The LM6132 op-amps

38
were connected to +9V DC and -9V DC power supplies, and a target gain of 100 was set
by selecting resistor pairs with factor of 10 increases at both the high-pass and low-pass
portions of the circuit. CHP, and CLP were selected by rearranging the governing equations
listed in chapter 1, and solving for their values based on the desired cutoff frequencies.
The resulting band-pass filtering circuit can be observed in figure 28 and the values of
resistors and capacitors selected can be found in table III below.
Figure 28: Band-Pass Filter Circuit
Table III: Voltage, resistor, and capacitor values for simulated band-pass filter
Source Value Units
VAC 0.01 V
CHP 10 x 10-6 F
R1HP 800 Ω
RfHP 8k Ω
R1LP 300 Ω
RfLP 3k Ω
CLP 0.1 x 10⁻⁶ F

39
To observe the resulting frequency spectrum from this circuit design, an AC sweep was
simulated with a frequency range of 1 to 10 kHz, where frequency was plotted on a
logarithmic scale. The resulting plot can be seen in observed in figure 29 below.
Figure 29: Frequency spectrum for band-pass filter in Voltage vs. Log(Frequency)
The resulting waveform of voltage vs. log(frequency) for the input (red) versus the output
(green) was found to follow a normal distribution. The output was observed to show an
amplified signal primarily within the 20-500 Hz range, with all other frequencies being
attenuated. When plotted on a linear scale, the operating band-width can better be
observed (figure 30).
40
Figure 30: Frequency spectrum for band-pass filter in voltage vs. Frequency
3.2.4 Active Full Wave Rectifier
To transform the negative portion of the AC input signal to positive, an active full
wave rectifier was simulated using an LF411 op-amp model. Resistor values were
selected according to the governing equations listed in the introduction, such that the gain
of the rectified output signal (1/2) would be consistent, and independent of the sign
(positive or negative) of the input signal. A 5V AC source VPULSE was created to
generate the input waveform, and, and the output was measured across the 3Rr resistor.
The active full wave rectifier circuit can be observed in figure 31 below, and the values
of resistors selected can be found in table IV below.

41
Figure 31: Active Full Wave Rectifier Circuit
Table IV: Voltage and resistor values for simulated full wave rectifier
Source Value Units
VPULSE 5 V
2Rr 2k Ω
Rr 1k Ω
3Rr 3k Ω
When running a transient simulation for 100 ms, with a time step of 5 ms, the following
response was observed showing the input V(2Rr:1), and output V(3Rr:2) voltages. This
response can be observed in figure 32 below.

42
Figure 32: Transient response rectified signal
Evaluating this transient response, the output signal V(3Rr:2) shown in blue was
observed to follow a DC trending at 2.5 V, when an AC input waveform V(2Rr:1) of 5 V,
shown in green was applied. This confirms intended circuit gain of 0.5 when the input
signal is positive, and -0.5 when the input signal is negative.
3.3.1 Myoelectric Circuit Unit Fabrication
The following section details the iterative design, prototyping, and manufacturing
process of the myoelectric circuit unit.
3.3.2 Breadboard and Protoboard Circuits
After simulating the differential amplifier, band pass filter, and full wave rectifier
circuit elements in PSPICE and confirming the desired output signal characteristics were

43
achieved, a physical circuit was constructed according to the circuit layout shown in
figure 33 below.
Figure 33: Myoelectric Circuit Unit Diagram
Referencing the layout above, a physical circuit was constructed first on a solderless
breadboard, then on a masked and soldered prototyping board. Resistor values were
selected to provide a total maximum circuit signal amplification, AMCU, of 5000. This
selection was made assuming a 1.0 mV input EMG signal, and a desired output of 0-5 V
to operate within the measurement range of the Arduino Leonardo Microcontroller. A
calculation of the total circuit gain can be seen below.

44
𝐴𝑀𝐶𝑈 =𝑉𝑜
𝑉𝑖=
𝑅𝐹−𝐷𝑖𝑓𝑓
𝑅1−𝐷𝑖𝑓𝑓∙
𝑅𝐹−𝐻𝑃
𝑅1−𝐻𝑃∙
𝑅𝐹−𝐿𝑃
𝑅1−𝐿𝑃∙
1𝑅𝑅𝑒𝑐 + 2𝑅𝑅𝑒𝑐
1𝑅𝑅𝑒𝑐 + 2𝑅𝑅𝑒𝑐 + 3𝑅𝑅𝑒𝑐∙
𝑅𝐹−𝑇𝑢𝑛𝑒
𝑅1−𝑇𝑢𝑛𝑒
=10𝑘Ω
1𝑘Ω∙
8𝑘Ω
800Ω∙
3𝑘Ω
300Ω∙
1𝑘Ω + 2𝑘Ω
1𝑘Ω + 2𝑘Ω + 3𝑘Ω∙
10𝑘Ω
1𝑘Ω= 5000
To provide effective signal filtering passband of 20-500 Hz, capacitor values were
selected according to the PSPICE simulations performed. The constructed and soldered
prototyping board circuit can be observed in figure 34 below.
Figure 34: Myoelectric Circuit Unit Prototype

45
To provide the analog signal gain for this circuit, general purpose Texas
Instruments LF411 operational amplifiers were used throughout this circuit. These
amplifiers proved to be ideal for this circuit due to their high input impedance (1012 Ω),
low input offset voltage, low supply current (2 mA), and large gain bandwidth [17]. The
LF411 op-amp and pin layout can be seen in figure 35 below.
Figure 35: TI LF411 Operational Amplifier [17]
Each op-amp was supplied power to both the positive and negative rails through the use
of two 9V batteries. To help eliminate power fluctuations, 10 µF capacitors were
connected to each power rail supply.
The signal gain present in each circuit block was adjustable through the use of 0-
10kΩ potentiometers, and signal output could be toggled on and off with a dual-pole
switch. Input signals were picked up via surface electrodes placed at the target muscle,
and a reference electrode was connected to circuit ground.
To confirm circuit construction, two input electrodes were placed on the biceps
brachii, with one reference electrode placed on the triceps brachii. Next the output of the

46
circuit was connected to an analog multimeter, which was set to DC voltage measure
mode. Upon voluntary contraction of the biceps muscle, a peak output signal was
observed in the 1-5 V DC range, as shown in figure 36 below.
Figure 36: EMG test of Breadboard Prototype Circuit
3.3.3 PCB Circuit Design
After building the breadboard prototype circuit and confirming the circuit
functions as intended, a second version of the myoelectric circuit unit was created with
the goal of reducing circuit complexity, reducing power draw, reducing size, and
improving the circuit assembly and construction. To achieve these goals, a printed circuit
board (PCB) was designed using software Express SCH and Express PCB from the
online company Express PCB. Once the circuit layout was constructed in the Express
SCH software, it was then linked to the Express PCB software, where physical wiring
connections to each circuit element (resistors, capacitors, op-amps, etc.) were made. After
finishing the wiring diagram on a 1.5” x 2.5”, double sided PCB, the linked SCH

47
schematic was used to verify all connections. Finally, the completed PCB layout was
purchased and ordered through the software. The completed schematic built in the
Express SCH interface, and finished PCB can be seen in figures 37 and 38 respectively.
Figure 37: Myoelectric Circuit Unit Constructed in Express SCH software

48
Figure 38: Myoelectric Circuit Unit PCB Layout
To reduce the complexity of the PCB layout, the Texas Instruments LM324A
quadruple operational amplifier was used. Two quad op-amps provide enough input and
output terminals to construct the eight operational amplifiers present in the circuit.
Similar to the LF411, this amplifier has a low supply current of 0.8 mA, good CMRR of
80 dB, and a large gain bandwidth of 100 V/mV [18]. This amplifier can also act in
single and dual power modes (for DC and AC respectively), where the VCC and GND pins
can also function as V+ and V- inputs. A diagram of the LM324A quad operational
amplifier can be seen in figure 39 below.
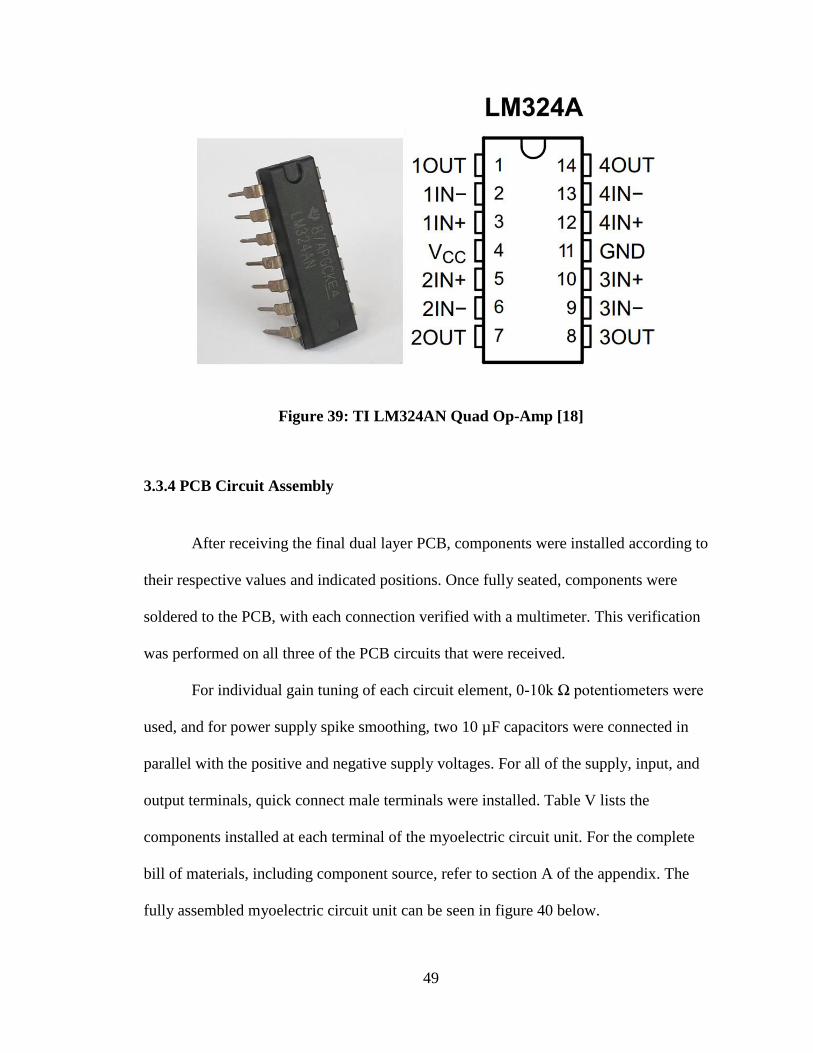
49
Figure 39: TI LM324AN Quad Op-Amp [18]
3.3.4 PCB Circuit Assembly
After receiving the final dual layer PCB, components were installed according to
their respective values and indicated positions. Once fully seated, components were
soldered to the PCB, with each connection verified with a multimeter. This verification
was performed on all three of the PCB circuits that were received.
For individual gain tuning of each circuit element, 0-10k Ω potentiometers were
used, and for power supply spike smoothing, two 10 µF capacitors were connected in
parallel with the positive and negative supply voltages. For all of the supply, input, and
output terminals, quick connect male terminals were installed. Table V lists the
components installed at each terminal of the myoelectric circuit unit. For the complete
bill of materials, including component source, refer to section A of the appendix. The
fully assembled myoelectric circuit unit can be seen in figure 40 below.

50
Figure 40: Fully Assembled Myoelectric Circuit Unit PCB

51
Table V: List of components for Myoelectric Circuit Unit
Name(s) Type Units
R1-LP 330 Ω
R1-HP 820 Ω
RDA1, RDA2, Rec, ROA1 1 kΩ
2Rec 2 kΩ
3Rec 3 kΩ
RDAY1, RDAY2, Rf-HP, Rf-LP, ROA2 0-10 Potentiometer kΩ
C-LP 0.1 µF
C-HP, CS11-, CS12+ 10 µF
C-Rec 470 µF
DRec N1 Zener Diode N/A
U1, U2 TI LM324AN quad op-amp N/A
+9V, -9V, Gnd, J1, J2 Molex 2-Pin Male Connector N/A
3.3.5 Solderless Breadboard Circuit
Once all components were installed and soldered on the three myoelectric circuit
unit PCBs, a fourth myoelectric circuit unit was constructed using a small solderless
breadboard. This circuit was built using the same components as the PCB version, with
additional wiring to bridge component connections. As with the PCB circuits, continuity
was verified for all wiring connections, and capacitor and diode polarity were confirmed
using a multimeter.

52
3.4.1 EMG Interface Device Assembly
This section details the design and assembly of additional circuit components,
EMG measurement wiring, and the EMG interface device enclosure.
3.4.2 Power Bridge Circuit
To provide power to each of the myoelectric circuit units, a bridge circuit was
created on a solderless breadboard. This circuit relays power from both the Arduino
Leonardo’s 5V USB supply terminal (connects to (+) positive input), and a 9V battery
(connects to (-) negative input) to all eight of the myoelectric circuit unit LM324AN op-
amps. Also, the positive power source could be switched to run from a 2nd 9V battery
instead of Arduino power if desired. In addition to power management, this circuit also
supplied the input terminal for the electrode ground, and branched the connection to each
of the four myoelectric circuit units. The layout of this circuit is shown in section 3.4.5
below.
3.4.3 EMG Measurement Wiring
Four dual-connector wires were constructed for each of the myoelectric circuit
units. Each wire bundle was approximately 3’ in length, and had two button connectors
that easily snap onto standard EMG/ECG surface electrodes. Polystyrene heat heat-shrink
was placed over the wires for easier handling, and protection. Finally, metal connector
crimps were attached to the end of each exposed wire, and a dual slot female connection
terminal was installed. A fully assembled EMG measurement wire can be seen in figure
41 below.

53
Figure 41: EMG Measurement Wire Bundle
3.4.4 Device Enclosure and Mounting
Once all four of the myoelectric circuit units were constructed, they were
arranged in a transparent plastic enclosure, measuring 11” x 6.5” x 2”. For permanent
mounting, 1/16” holes were drilled in pairs at the four corners of each PCB, and 40-gauge
wire was routed through the holes in the PCB and the enclosure, and finally twisted to
secure. Both solderless breadboard circuits were mounted to the enclosure through an
adhesive backing.
Next, the Arduino Leonardo microcontroller and 9V battery power sockets were
arranged in the enclosure. Both of these components were installed and mounted by
drilling two 1/8” diameter holes in the enclosure, and fastened with two plastic 4-40
socked head cap screws and #4 hex nuts.

54
For each of the myoelectric circuit units, breakout wiring was soldered to the final
amplifier terminal, ROA2. Dial potentiometers operating at 0-10 kΩ were attached to this
breakout wiring, to provide an easy-to-use interface for final amplifier gain tuning.
Appropriately sized holes were drilled in the front wall of the enclosure, and the
potentiometers were installed through the holes and fastened.
To allow for all wiring to pass through the enclosure, holes were also drilled for
the microcontroller USB cable, four EMG inputs, and grounding electrode. Finally,
access holes were drilled for two mounted power switches.
3.4.5 EMG Interface Device Summary
The EMG interface device, comprised of four Myoelectric Circuit Units, an
Arduino Leonardo microcontroller, battery terminals, a power bridge circuit, and EMG
electrode wiring, was connected and assembled inside of a transparent enclosure. A
detailed diagram of the device can be seen in figure 42 below, with additional pictures
available in section B of the appendix.

55
Figure 42: The EMG Interface Device
3.5.1 Arduino Leonardo Software
To achieve the desired software specifications presented in chapter 2, a sketch
was created in the Arduino software interface. This sketch allowed for an analog signal to
be read and converted to a digital Boolean value. As multiple EMG values were read in, a
calibration routine allowed for the device user to specify the threshold at which mouse
cursor movement would begin. Next, when a measured EMG signal value exceeded the
activation threshold, the software would command the connected PC to move the mouse
cursor in the specified direction via a serial USB connection. Also, mouse cursor speed
could be controlled by the intensity of the generated EMG signal, and a mouse “left
click” was simulated when multiple inputs were activated simultaneously.

56
3.5.2 Software Review
The software sketch that was installed on the Arduino Leonardo microcontroller
as part of the EMG interface device, was comprised of 116 lines of code written in the
Arduino programming language. Debugging was carried out both through the Arduino
interface serial monitor, where inputs could be sent and values displayed, and through
physical testing of the EMG interface device, where generated signals would move a PC
mouse cursor.
The first step in the sketch was to initialize the mouse cursor movement library,
where the appropriate hardware driver would be installed on the microcontroller. Next,
many different variables were declared, such as analog pin numbers for the four EMG
inputs, activation thresholds from which cursor movement would begin, and various logic
flags, cursor movement variables, and EMG scaling factors. After all declarations had
been made, the setup code for the program would commence, where the serial USB
connection would be established, and the mouse movement routine would be activated.
Next came the main loop of the program, where first the EMG threshold
calibration routine would start. This routine would alternate between providing written
instruction via the serial monitor, reading the incident EMG signal, and calculating the
activation threshold at which mouse cursor movement would begin. First the user would
be instructed to flex their muscle corresponding to one cursor movement direction and
hold for several seconds. Next, a looping routine would collect many readings from an
analog input corresponding to the direction specified, and sum the readings into one
integer variable. This variable would then be divided by the number of readings to
calculate the average value. This value would then be multiplied by a scaling factor, and

57
used to define the EMG activation threshold for mouse cursor movement. After
calibrating the activation threshold for one input direction, the routine would then
proceed to instruct, measure, and calculate the threshold for the other three inputs.
Once all calibration steps were complete, the program would then transition to the
mouse cursor movement routine. This routine relied on a series of logic conditions where
the current measured analog EMG input would be compared to the previously established
activation threshold. As soon as one of the logic conditions was found to be true, the
mouse cursor would be instructed to move in the specified direction a set number of
pixels. Next, a software delay routine would be initiated, where the proportional value of
the EMG reading relative to the activation threshold would decrease the delay time
specified. The purpose of this delay routine was to give the user direct control over the
speed of the cursor. This would be achieved through intentional flexing of the target
muscle, which would increase motor unit recruitment and magnitude of the generated
EMG signal.
At the end of the program, a routine was created that allowed for a mouse “left
click” button to be controlled. This was carried out through a dual-conditional logic
statement, which evaluated two of the four measured EMG inputs. When the device user
intentionally flexed two of the measured inputs forcefully, which could be achieved by
forming a fist, the program would register this event and command the mouse to “left
click”. For the complete Arduino sketch code, with comments included, refer to section C
of the appendix.
In summary, a software program was written in the Arduino language that was
loaded onto the Arduino Leonardo microcontroller. Contained in this program was the

58
necessary library files to establish a USB connection with a PC and simulate mouse
hardware drivers. Once this connection had been made, the program allowed for the user
to calibrate the EMG interface device to their specific measurement thresholds. After
establishing these thresholds, the program would monitor four discrete analog inputs,
where EMG signals captured by the myoelectric circuit units would be read in. As soon
as these inputs read above the calibration settings, the program would command the
mouse cursor to move in the user’s desired direction.
3.6.1 Test Methods
The following section details the methods applied to conduct two tests related to
the EMG interface device. The first test conducted involved measurement of the current
draw, in an effort to estimate the available device use time. Finally, the performance and
efficacy of the device was evaluated through a human model test, which involved typing
on an on-screen PC keyboard by moving a cursor with the device.
3.6.2 Device Current Draw Test
For each of the iterations of the myoelectric circuit units (solderless breadboard,
soldered protoboard, and PCB), a current draw test was conducted to evaluate device
battery consumption. Two digital multimeters were used, and set to current measuring
mode in milliamps. Current was measured by connecting a multimeter in series for both
the positive and negative power supplies. Data was recorded when the circuit was in the
“on” state, but idle, as well as the maximum EMG signal amplification state. Total
current was determined by adding the measurements from both connection multimeters.

59
Once the test had been completed on each iteration of the myoelectric circuit unit,
the test was repeated for the entire EMG interface device. This time, current was
measured for the negative 9 V battery power supply, and the positive 5 V supply from the
Arduino microcontroller. The data collected for both of these tests is presented in the
results section of the next chapter.
3.6.3 Device Efficacy in Human Model Test
To evaluate performance of the EMG interface device, a test was created in which
the device user would perform a series of instructions while being timed. The purpose of
this test was to quantify the efficacy of the device, where the accuracy and speed could be
measured and compared to a control.
To perform the test, the device user was instructed to type out the full alphabet
using an on-screen keyboard, by moving the mouse cursor to select the letter, and “left
clicking” on the key to type. While this test was performed, the user’s time to completion
was measured. Also, if the user mistakenly missed or clicked on an un-desired letter, they
were asked to move on to the next letter. This was done to evaluate the device accuracy
and general ease of use.
First, to establish a control, the user was asked to type out the full alphabet three
times using a standard PC mouse. Next, the user was instructed to perform the same test
three times using the EMG interface device with electrodes only connected to the
forearm, and ground reference. The muscles in the forearm that were target were the
flexor carpi ulnaris and radialis, as well as the extensor carpi ulnaris and radialis longus.
An example of the electrode placement used for this test can be seen in figure 43 below.

60
Figure 43: Electrode placement on forearm
Finally, the test was repeated with two pairs of electrodes placed over the flexor
carpi radialis and extensor carpi ulnaris muscles on the forearm (for cursor move left and
right), and two pairs connected to the user’s biceps brachii and triceps brachii muscles
(for cursor move up and down). Different from the previous test, cursor movement up
and down would be controlled by elbow flexion and extension, instead of wrist deviation.
The electrode placement used in this test can be observed in figure 44 below.

61
Figure 44: Electrode placement on forearm and upper arm
To provide more comfort when performing mouse “left click”, a foam stress ball
was held in the user’s hand and squeezed to activate the forearm muscles simultaneously.
Two device users were tested for all three tests. The results of these tests can be seen in
chapter 4.

62
Chapter 4
RESULTS
In this chapter, data collected for two tests is presented; EMG interface device
power draw, and device efficacy in human model test.
4.1.1 EMG Interface Device Current Draw Results
The results of the myoelectric circuit unit current draw test can be observed in
figure 45 below. Data was collected for the three iterations of the circuit; the solderless
breadboard prototype, the soldered protoboard, and the final through-pin (DIP) masked
PCB circuit. Current was measured in milliamps (mA) for each circuit, both in an idle
state and maximum EMG signal amplification resulting from muscle flexion.
Figure 45: Results from myoelectric circuit unit current draw test
0
5
10
15
20
25
30
35
1 2
Cu
rren
t D
raw
(m
A)
Current Draw Idle (1) & Max Muscle Flex (2)
Comparison of Current Draw for Myoelectric
Circuit Units
Breadboard
Protoboard
DIP PCB

63
For the entire EMG interface device (EID), total current draw was measured for both the
idle and max EMG flex states. The results of this test can be seen in figure 46 below.
Figure 46: Results from EMG Interface Device current draw test
4.1.2 Device Efficacy in Human Model Test Results
The results of the device efficacy human model test can be found in table VI
below. Data was collected from two device users, one male of average build and one
female of slender build, both age 32. This table specifies the device user, test type
performed, test number, individual test time, average test time, individual test accuracy,
average test accuracy, and generated keystrokes. Accuracy was determined by evaluating
the entered keystrokes relative to the standard 26 letter alphabet. An incorrect letter entry
or duplicate entry was counted as 1/26 wrong. Average accuracy was calculated from the
results of the 3 tests.
0
5
10
15
20
25
30
35
1
Cu
rren
t D
raw
(m
A)
Current Draw Idle & Max Muscle Flex
Current Draw for
EMG Interface Device
EID Idle
EID Max Flex

64
Table VII: Device Efficacy Results
User Test
Type Test
Time
(min)
Average
(min) Accuracy
Average
(%) Keystrokes
Male
32 y/o
PC Mouse
(Control)
1 0:27
0:24
26/26
100%
Abcdefghijklmnopqrstuvwxyz
2 0:22 26/26 Abcdefghijklmnopqrstuvwxyz
3 0:22 26/26 Abcdefghijklmnopqrstuvwxyz
EID:
Forearm
1 2:41
2:11
26/26
99%
Abcdefghijklmnopqrstuvwxyz
2 2:00 26/26 Abcdefghijklmnopqrstuvwxyz
3 1:54 25/26 Abcdefghijklmnopqrdstuvwxyz
EID:
Forearm +
Upper arm
1 1:45
1:36
24/26
91%
Abcdefghijklmnopqrstuvrqwxyz
2 1:33 23/26 Abcdefghihjklmniopqrstuvewxyz
3 1:31 24/26 Abcdefghuijklmnopqrstuvwcxyz
Female
32 y/o
PC Mouse
(Control)
1 0:26
0:22
26/26
100%
Abcdefghijklmnopqrstuvwxyz
2 0:21 26/26 Abcdefghijklmnopqrstuvwxyz
3 0:19 26/26 Abcdefghijklmnopqrstuvwxyz
EID:
Forearm
1 3:11
2:42
25/26
87%
Abcdefghijklmniopqrstuvwxyz
2 2:09 24/26 Abcdefghijklmnopqerstyuvwxyz
3 2:47 22/26 Qabcdefghijklmnopqrewstucvwxyz
EID:
Forearm +
Upper
Arm
1 2:55
2:19
19/26
82%
Abcdefghuijjklmnoopqqerastyuvwxyz
2 2:14 22/26 Avbbcdefghijklmbnopqrqstuvwxyz
3 1:48 23/26 Aabcdefghijklmnopqrzstuvqwxyz

65
Chapter 5
DISCUSSION AND CONCLUSIONS
5.1.1 Discussion of Current Draw Test Results
Evaluating the results from the current draw test for the myoelectric circuit unit, it
can be observed that a clear power efficiently improvement was gained through each
subsequent design iteration. From the initial breadboard prototype, to the final DIP PCB,
an 88.3% power efficiency improvement was gained for the idle state, and an 82.3%
improvement for max amplification. This substantial current draw improvement is likely
attributed to shorter wiring/trace paths, fewer components, and primarily, the change
from individual LF411 op-amps, to the LM324A quad op-amp.
For the EMG interface device current draw test, results showed a maximum
current draw for the idle state of 11.8 mA, and 15.1 mA for max amplification. This
measurement reflected the total current draw from both the positive Arduino supply, and
the negative supply from a 9V battery. Since the Arduino supply is powered by PC USB,
the limiting factor for device use time would be the 9V battery supply. Assuming a 50%
duty cycle between the idle and max current draw states, 50% of the power drawn from
the negative supply, and a 600 mA-hours life for an Energizer 9V battery, the following
calculation was made to determine the device use time [19].
𝐷𝑒𝑣𝑖𝑐𝑒 𝑈𝑠𝑒 𝑇𝑖𝑚𝑒 = 600 𝑚𝐴𝐻𝑜𝑢𝑟𝑠
(11.8 𝑚𝐴 + 15.1 𝑚𝐴
4 )= 44.6 𝐻𝑜𝑢𝑟𝑠

66
5.1.2 Discussion of Device Efficacy Human Model Test Results
Upon reviewing the results from the device efficacy human model test, it was
observed that the device efficacy relative to the standard PC mouse control was less in
both metrics. For the fastest time to complete electrode configuration, “forearm + upper
arm”, the average time relative to the mouse control was found to be significantly slower,
with over a minute slower for the male user, and nearly two minutes slower for the
female user. The accuracy of alphabet entry was also found to be less relative to the
mouse control, but the “forearm” tests for the male subject were found to be close to
mouse control, with an entry accuracy of 99%.
Comparing the EMG interface device tests performed, it was observed that the
“forearm + upper arm” electrode configuration completed the test significantly faster in
all tests performed, with the male user finishing 35 seconds faster, and the female user
finishing 23 seconds faster on average. For entry accuracy however, the “forearm” test
was observed to be most accurate across all tests performed, with the male user gaining
8% greater entry accuracy, and the female user gaining 5% accuracy on average.
For all tests with the EMG interface device, with one exception, the time to
complete the test continued to drop with each subsequent test performed, with the female
user seeing over a minute decrease in time for the “forearm + upper arm” configuration.
This progressive time drop suggests that the user was learning to use the device more
efficiently, and better identify the specific wrist and arm motions that produced the
desired result. With more practice, perhaps even better completion time could be
achieved.

67
After running each test, comments and feedback was gathered from the user. The
most prominent feedback that was given was that the “forearm + upper arm” electrode
configuration was significantly more comfortable and easier to control, relative to the
“forearm” configuration. It was stated that that “cursor up” and “cursor down” commands
were very difficult to distinguish, and would often move “cursor left” and “cursor right”
as well. Also, these two cursor directions were activated by radial and ulnar deviations
(wrist side to side), which have a very short range of motion, and were found to cause
discomfort in some cases. This feedback was not surprising, as the superficial muscles in
the forearm reside very close to each other, and present a challenge for surface electrodes
to easily distinguish. For some of the “forearm” test cases, electrode placement had to be
redone and the software re-calibrated several times to even achieve usable cursor control.
This was contrasted by the “forearm + upper arm” tests, where electrodes were easily
placed evenly on large independent muscle groups, and cursor control was achieved
about primary flexion and extension fulcrums (wrist and elbow). These results
corroborate the study conducted by Jin Lee et al, which highlighted the importance and
effect of selective electrode placement for EMG signal capture [5]. Other feedback
provided was that the EMG measurement wires frequently got in the way of cursor move
motions, and that ability to move the cursor diagonally, and not purely in X and Y
coordinates was highly desired.
When asked whether the user was aware of the ability to control cursor velocity,
both users agreed that they could, but that this feature was more discernable and useful in
the “forearm + upper arm” tests. It was stated that the smoother cursor movement of this
test allowed the cursor velocity increase to be intentionally activated and held, relative to

68
the “forearm” test, where the cursor frequently moved in undesired directions. This
feedback highlights the study conducted by Liping Qi et al, where the force generated by
the user’s movement directly correlates to EMG signal amplitude and, in this case, is
harnessed for dynamic cursor velocity control [4].
As presented with these results, the EMG interface device efficacy test
highlighted how meaningful mouse cursor control and PC interaction could be achieved
through voluntary EMG signal activation. While these tests were carried out by non-
disabled individuals, the results of this test suggest that the device could be of use to
those who cannot use a standard PC mouse, and remaining voluntary muscle groups are
targeted. For non-disabled individuals, this device did not show any improved
effectiveness over a standard PC mouse. With the ability to place electrodes on any
superficial muscle group in the body however, novel uses may exist, where additional
input degrees are desired.
5.1.3 Challenges Faced
Over the course of this thesis project, several significant challenges were faced.
The first real challenge arose when the myoelectric circuit unit was first being developed.
An early iteration of this circuit, which was designed as part of an electromechanical
prosthetic hand project for the Cal Poly QL+ lab, did not employ a differential amplifier
circuit, or a properly tuned band-pass filter. This led to significant challenges in isolating
a clean and effective EMG signal at the target muscle, due to significant electrical
interference from lights, devices, and other sources. The electromechanical prosthetic
hand that was connected to this circuit, would jitter significantly, and could not perform
desired tasks effectively. Eventually an analog tiered comparator circuit was designed,

69
that would allow the input signal to fluctuate between four thresholds. Once this
threshold has been exceeded, a more stable discrete DC signal would be output. Only
after discovering the real necessity of a high input impedance differential amplifier in
EMG measurement applications, as described in the study by J. Rosell et al, and by
learning to properly manipulate the parameters of the band-pass filter, a cleaner and more
usable EMG signal was isolated [7].
Another challenge faced related to the proper placement of surface electrodes
over the target superficial muscle. As was demonstrated in the device efficacy test results,
inconsistent electrode placement resulted in undesired cursor movement, and
significantly more time to complete the test. This problem was ultimately somewhat
alleviated by later targeting only large, independent muscle groups in the forearm and
upper arm, but originally the inconsistent performance of the EMG interface device led to
an effort to create an Arduino algorithm to improve cursor movement. After learning of
the study conducted by Yi-Hung Liu et al, where an EMG pattern recognition system
using four surface electrodes was developed for mechanical hand movement, a similar
signal recognition system was attempted [10]. During the initial calibration routine, this
software algorithm measured the signal across all four EMG inputs, saved this signal
pattern, and attempted to establish mouse cursor movement through a four-tiered state
machine. Unfortunately, the pattern recognition technique used was found to be
inconsistent in establishing and recognizing EMG patterns. During this time, there also
appeared to be a signal amplification drift what occurred for an unknown reason, which
may have affected the recognition technique. Ultimately this recognition technique was

70
unsuccessful, and was eventually replaced with a discrete input recognition method for
each cursor control direction.
When this thesis project was originally conceived, it was planned to combine and
miniaturize the four myoelectric circuit units into a single PCB using small surface-
mount components. Also, an integrated arm-band was conceptualized, that would possess
four sets of discrete metal EMG electrodes, and allow for easier installation and use of
the interface device. Eventually both of these plans were set aside once the significant
effort of this project was realized.
5.1.4 Improvements and Future Work
As highlighted in the previous section, there were several planned device
elements that would likely present significant improvements to the effectiveness and ease
of use. For future development of this EMG interface device, significant usability
improvements could be gained through an improved method of identifying the user’s
desired cursor movement. This could be achieved through a surface electrode array with
additional inputs, or as previously shown by Yi-Hung Liu et al, a pattern recognition
technique [10]. This would likely be the first area of investigation for future
improvements.
Another likely improvement to the device would be to integrate all of the analog
circuit elements and a microprocessor into one discrete PCB. This would likely further
lower power consumption, reduce interference from other electronic sources, and
miniaturize the device, such that it could be either combined with a custom electrode arm
band, or discretely worn by the user.

71
An additional avenue for improvement would be to investigate techniques of
further leveraging the Arduino platform. Since Arduino is open-source, there exists a
multitude of custom circuits that are relatively inexpensive. One such custom circuit is
the Arduino Wireless SD Shield, which allows for wireless communication with other
electronics [20]. Perhaps an EMG measurement system could be created that removes the
requirement to be physically tethered to the device with wires and would provide
freedom of movement.
5.1.4 Final Conclusions
For user control of a PC mouse cursor, an EMG interface device was designed
and built. The device utilized an array of 1.5” X 2.5” myoelectric circuit units, which
individually convert a measured EMG input signal from surface skin electrodes to a clean
and usable 0-5 V DC output signal. This analog signal was read to an Arduino Leonardo
microcontroller, which would process the signal to digital Boolean value, establish
activation thresholds, and command mouse cursor movement through a USB connection
when the threshold was exceeded. Also, a proportional comparator algorithm was created
that utilized EMG signal amplitude to control cursor velocity. The device was housed in a
clear plastic enclosure, and also included an independent power supply, on/off switches,
tuning dials for each EMG input, and access ports for all electrode wiring. Testing was
performed that showed the device had a long battery life of 44.6 hours, and provided an
effective means to move a PC mouse cursor, and type entries on an on-screen keyboard.

72
BIBLIOGRAPHY
[1] J. Webster, Medical Instrumentation: Application and Design, 3rd ed ed., John
Wiley & Sons, Inc., 1998.
[2] K. Saladin, Anatomy & Physiology: The Unity of Form and Function, 4th ed ed.,
McGraw Hill, 2007.
[3] S. Deutsch and A. Deutsch, "Understanding the Nervous System: An Engineering,"
IEEE Press, pp. chapter 1, pages 5-10, 1993.
[4] Q. Liping, "Spectral properties of electromyographic and mechanomyographic
signals during isometric ramp and step contractions in biceps brachii," Journal of
Electromyography and Kinesiology, pp. 128-135, February 2011.
[5] J. A. A. Lee, "A simulation study for a surface EMG sensor that detects
distinguishable motor unit action potentials," Journal of Neuroscience Methods,
vol. 168, no. 1, pp. 54-63, 2008.
[6] S. J. Dorgan and R. B. Reilly, "A model for human skin impedance during surface
functional neuromuscular stimulation," Rehabilitation Engineering, pp. 341-348,
1999.
[7] J. Rosell and e. al, "Skin impedance from 1 Hz to 1 Mhz," Biomedical Engineering,
p. 649, August 1988.
[8] J. V. Basmajian and C. J. De Luca, Muscles Alive: their functions revealed by
electromyography, 5th ed ed., Baltimore, Maryland: Williams and Wilkins, 1985.
[9] C. J. De Luca, Surface Electromyography: detection and recording, DelSys, Inc.,
2002.
[10] Y.-H. Liu and H.-P. Huang, "Towards a high-stability EMG recognition system for
prosthesis contro:l a one-class classification based non-target EMG pattern filtering
scheme," in IEEE International Conference on Systems, Man, and Cybernetics, San
Antonio, TX, USA, 2009.
[11] T. Lalitharatne, Y. Hayashi, K. Teramoto and K. Kiguchi, "A Study on Effects of
Muscle Fatigue on EMG-Based Control for Human Upper-Limb Power-Assist,"
ICIAfS'12, pp. 124-128, 2012.

73
[12] S. Siriprayoonsak, Real-Time Measurement of Prehensile EMG Signals, San Diego
State University, 2005.
[13] "Getting Started | Foundation > Introduction," 2018. [Online]. Available:
https://www.arduino.cc/en/guide/introduction.
[14] Arduino, "ARDUINO PRODUCTS > Arduino Leonardo," 2018. [Online].
Available: https://www.arduino.cc/en/Main/Arduino_BoardLeonardo.
[15] N. Hamilton, "The Upper Extremity: The Elbow, Forearm, Wrist, and Hand," in
Kinesiology: Scientific Basis of Human Motion, McGraw-Hill Education, 2011.
[16] "The Muscles of the Arm and Hand," 2015. [Online]. Available: https://anatomy-
medicine.com/musculoskeletal-system/87-the-muscles-of-the-arm-and-hand.html.
[17] Texas Instruments Incorporated, "LF411 Precision JFET-input Operational
Amplifier," 2018. [Online]. Available: http://www.ti.com/product/LF411.
[18] Texas Instruments Incorporated, "LM324A Quadruple Operational Amplifier,"
2018. [Online]. Available:
http://www.ti.com/product/LM324A/technicaldocuments.
[19] "Energizer 6LR61 Product Datasheet," 2018. [Online]. Available:
http://data.energizer.com/pdfs/alk-power-9v.pdf.
[20] "Arduino Wireless SD Shield," 2018. [Online]. Available:
https://store.arduino.cc/usa/arduino-wirelss-sd-shield.
[21] C. P. Fermo and e. al, "Development of an adaptive framework for the control of
upper limb myoelectric prosthesis," Engineering in Medicine and Biology Society,
2000.
[22] B. D. Farnsworth and e. al, "Wireless In Vivo EMG Sensor for Inteligent Prosthetic
Control," in Solid-State Sensors, Actuators and Microsystems Conference, 2009.
[23] Y. Wonkeun and K. Jung, "Development of a Compact-size and Wireless Surface
EMG Measurement System," ICCAS-SICE, 2009.

74
APPENDICES
A. EMG Interface Device Bill of Materials
Description Value Total Device
Qty. Source
Resistor 330 Ω 4 https://www.digikey.com/short/j1jqqh
Resistor 820 Ω 4 https://www.digikey.com/short/j1jqqb
Resistor 1 kΩ 16 https://www.digikey.com/short/j1jtw3
Resistor 2 kΩ 4 https://www.digikey.com/short/j1jqqd
Resistor 3 kΩ 4 https://www.digikey.com/short/j1jq8t
Trimmer Potentiometer 0-10 kΩ 16 https://www.digikey.com/short/j1jq8h
Dial Linear Potentiometer 0-10 kΩ 4 https://www.digikey.com/short/j1jqrn
Capacitor 0.1 µF 4 https://www.digikey.com/short/j1jqf9
Capacitor 10 µF 12 https://www.digikey.com/short/j1jq2z
Capacitor 470 µF 4 https://www.digikey.com/short/j1jqzn
N1 Zener Diode N/A 4 https://www.digikey.com/short/j1jq20
TI LM324AN quad op-amp N/A 8 https://www.digikey.com/short/j1jqmt
Molex 2-Pin Male
Connector N/A 29 https://www.digikey.com/short/j1jqmq
Molex 2-Pin Female
Connector N/A 29 https://www.digikey.com/short/j1jqm9
Molex Female Terminal
Crimp N/A 60 https://www.digikey.com/short/j1jqhm
On/Off Toggle Switch 5 Amps 2 https://www.digikey.com/short/j1j87c
Solderless Breadboard 3.2" X 2.0" 2 (or 1) https://www.digikey.com/short/j1jqh0
Myoelectric Custom PCB 1.5" X 2.5" 3 (or 4) https://www.expresspcb.com/
Arduino Leonardo
Microcontroller N/A 1
https://store.arduino.cc/usa/arduino-
leonardo-with-headers
Jumper Wire Assortment Kit 22 AWG 1 https://www.digikey.com/short/j1jqdh
Shielded EMG Jumper
Wires N/A 9 Pack of 3 wires: http://a.co/d/e67cexf
Adhesive Surface Electrodes N/A 9 Pack of 100: http://a.co/d/4TW4U0s
9V Battery Holder N/A 2 https://www.mcmaster.com/7712k62
Plastic Project Box 11" X 7" X
2" 1 https://www.mcmaster.com/4629t53
Plastic Socket Head Screw 4-40 4 https://www.mcmaster.com/95868a256
Plastic Hex Nut 4-40 4 https://www.mcmaster.com/90059a005
Bendable Mounting Wire OD:
0.025" 1 https://www.mcmaster.com/8860k13
Battery 9 Volt 1 http://a.co/d/9Ad2xDd

75
B. EMG Interface Device Reference Images
EMG Interface Device wiring layout

76
EMG Interface Device with labels

77
C. EMG Interface Device Arduino Sketch Code
// EMG Interface Device Thesis Code
// Cal Poly San Luis Obispo
// Nickolas Butler 2018
// Initialize library
#include "Mouse.h"
// Assign pin numbers for 4 EMG inputs
int myoPinUp = 0;
int myoPinDown = 1;
int myoPinLeft = 2;
int myoPinRight = 3;
// Initialize EMG Activation Thresholds
long myoLimitUp = 0;
long myoLimitDown = 0;
long myoLimitLeft = 0;
long myoLimitRight = 0;
// Initialize Variables
int stateVar = 0; // Flag designating code to run in main loop
int printVar = 0; // Flag designating message to display in
main loop
char entryVar = '0'; // Variable for entry selection
int delayTime = 20; // Initial delay time
unsigned int velDelta = 0; // Calculated delay time
int delayClick = 800; // Mouse click debounce in milliseconds
int pixelStep = 5; // Number of pixels on screen cursor moves
per activation
float myoScale = 0.9; // Activation Threshold Offset
float velScale = 1.1; // Multiplication factor for cursor velocity
control (Larger value = faster cursor)
// Initialization Code
void setup()
Serial.begin(9600); // Start USB Serial Connection
delay(3000);
// Start mouse control
Mouse.begin();
// Main Loop
void loop()
if (stateVar == 0)
// EMG Calibration Instructions

78
// Check printVar for text to display
if (printVar == 0)
Serial.println("EMG Interface Device");
Serial.println("Cal Poly San Luis Obispo");
Serial.println("Nickolas Butler 2018");
Serial.println("Signal Calibration Routine");
Serial.println("Flex muscle in direction for Up and hold for 5
seconds.");
Serial.println("When ready, enter 1 and press Enter.");
printVar = 1;
else if (printVar == 2)
Serial.println("Flex muscle in direction for Down and hold for 5
seconds.");
Serial.println("When ready, enter 2 and press Enter.");
printVar = 3;
else if (printVar == 4)
Serial.println("Flex muscle in direction for Left and hold for 5
seconds.");
Serial.println("When ready, enter 3 and press Enter.");
printVar = 5;
else if (printVar == 6)
Serial.println("Flex muscle in direction for Right and hold for 5
seconds.");
Serial.println("When ready, enter 4 and press Enter.");
printVar = 7;
// Calibrade EMG threshold for 4 inputs
// Check entryVar for input to calibrate
if (Serial.available() > 0)
entryVar = Serial.read();
if (entryVar == '1')
delay(1000);
// Averaging Loop
for (int i = 0; i <= 100; i++)
delay(30);
myoLimitUp = myoLimitUp + analogRead(myoPinUp); // Sum 100
EMG Values
myoLimitUp = (myoLimitUp / 100) * myoScale; // Calculate
average and adjust threshold
Serial.println("UP threshold set to:");
Serial.println(myoLimitUp);
printVar = 2; // Set flag to print next calibration message

79
delay(1000);
else if (entryVar == '2')
delay(1000);
// Averaging Loop
for (int i = 0; i <= 100; i++)
delay(30);
myoLimitDown = myoLimitDown + analogRead(myoPinDown); // Sum
100 EMG Values
myoLimitDown = (myoLimitDown / 100) * myoScale; // Calculate
average and adjust threshold
Serial.println("DOWN threshold set to:");
Serial.println(myoLimitDown);
printVar = 4; // Set flag to print next calibration message
delay(1000);
else if (entryVar == '3')
delay(1000);
// Averaging Loop
for (int i = 0; i <= 100; i++)
delay(30);
myoLimitLeft = myoLimitLeft + analogRead(myoPinLeft); // Sum
100 EMG Values
myoLimitLeft = (myoLimitLeft / 100) * myoScale; // Calculate
average and adjust threshold
Serial.println("LEFT threshold set to:");
Serial.println(myoLimitLeft);
printVar = 6; // Set flag to print next calibration message
delay(1000);
else if (entryVar == '4')
delay(1000);
// Averaging Loop
for (int i = 0; i <= 100; i++)
delay(12);
myoLimitRight = myoLimitRight + analogRead(myoPinRight); //
Sum 100 EMG Values
myoLimitRight = (myoLimitRight / 100) * myoScale; // Calculate
average and adjust threshold
Serial.println("RIGHT threshold set to:");
Serial.println(myoLimitRight);
stateVar = 1; // Set flag to exit calibration routine
delay(1000);

80
// Mouse Cursor Move Code
// Don't run until calibration routine is complete (check flags)
if (stateVar == 1 && printVar == 7)
Serial.println("Mouse control START");
if (analogRead(myoPinUp) > myoLimitUp)
Serial.println("UP");
Serial.println(analogRead(myoPinUp)); // Display EMG value
Mouse.move(0, -pixelStep); // Move cursor specified increment
velDelta = (delayTime / ((analogRead(myoPinUp) / myoLimitUp) *
velScale)); // Cursor velocity control: scale movement delay by ratio
of reading over threshold
delay(velDelta);
else if (analogRead(myoPinDown) > myoLimitDown)
Serial.println("Down");
Serial.println(analogRead(myoPinDown)); // Display EMG value
Mouse.move(0, pixelStep); // Move cursor specified increment
velDelta = (delayTime / ((analogRead(myoPinDown) / myoLimitDown)
* velScale)); // Cursor velocity control: scale movement delay by ratio
of reading over threshold
delay(velDelta);
else if (analogRead(myoPinLeft) > myoLimitLeft)
Serial.println("Left");
Serial.println(analogRead(myoPinLeft)); // Display EMG value
Mouse.move(-pixelStep, 0); // Move cursor specified increment
velDelta = (delayTime / ((analogRead(myoPinLeft) / myoLimitLeft)
* velScale)); // Cursor velocity control: scale movement delay by ratio
of reading over threshold
delay(velDelta);
else if (analogRead(myoPinRight) > myoLimitRight)
Serial.println("Right");
Serial.println(analogRead(myoPinRight)); // Display EMG value
Mouse.move(pixelStep, 0); // Move cursor specified increment
velDelta = (delayTime / ((analogRead(myoPinRight) /
myoLimitRight) * velScale)); // Cursor velocity control: scale movement
delay by ratio of reading over threshold
delay(velDelta);
// Activate mouse "left click" when signal exceeds threshold for
left and right inputs. Multiplier is scale factor.
if ((analogRead(myoPinLeft) > (myoLimitLeft*1.4)) &&
(analogRead(myoPinRight) > (myoLimitRight*1.4)))
Serial.println("Left Click");
Mouse.click(MOUSE_LEFT); // Activate mouse left click

81
delay(delayClick); // Button debounce delay (so don't click
multiple times)