development of a mechanically correct fire resistance...
TRANSCRIPT
Department of Civil and Structural Engineering
Development of a Mechanically Correct Fire Resistance
Design Process for Composite Floor systems in Buildings
By Ali Alskeif
A thesis submitted for the degree of Master of Philosophy
August 2015


i
Abstract
In this study, an alternative simplified method of tensile membrane action (TMA) of
thin-flat concrete slabs at ambient temperature was extended to consider composite
slabs in fire. The existing simplified method (Bailey-BRE) of estimating the influence
of tensile membrane action on the slab strength in fire has some shortcomings in its
assumptions and results. The alternative simplified method showed reasonable results,
avoiding inherent flaws in the existing method that cause large differences in the results
when a marginal change in reinforcement ratio is made.
This thesis takes into consideration the presence of a secondary downstand steel beam
which was left unprotected against elevated temperatures. The main objectives of this
study were: 1. to examine the mechanics of tensile membrane action of composite slabs
in the presence of an unprotected secondary beam; 2. to examine the similarity of the
structural behaviour of composite slabs with the results of the alternative method of flat
slabs in terms of the benefits of large deflections; 3. to compare the extended method in
this study against the existing Bailey-BRE simplified method.
The mechanics behind this study was divided into two main parts: 1. small-deflection
analysis; 2. large-deflection analysis. The small-deflection analysis is based on the
yield-line theory, where the slab was heated from the bottom side, affecting the
unprotected secondary steel beam, until the yield-lines formed in what is known as the
“optimum yield-line pattern”. The second part of the study took this yield-line pattern
configuration. With further deflection, tensile membrane action started to mobilize, and
the slab gained further capacity. The method accounts for the internal work dissipation
by the reinforcement and the steel beam as they extend, which contributes to the total
internal work of the slab. The small-deflection analysis was coded in Visual Basic in a
Microsoft Excel spreadsheet, increasing the temperature to obtain the optimum yield-
line pattern. The large-deflection analysis was coded in Matlab in order to conduct a
deflection-controlled loop, increasing the temperature until the failure of the slab, giving
the temperature enhancement for every deflection level through the analysis.
The study allows the stress pattern around the yield-lines to be monitored. It also
monitors the formation of the cracks on the slab, reinforcement fracture in different
phases as the temperature increases and the slab deflects, until the structural failure.
Comparisons against the Bailey-BRE method confirmed that the latter is conservative
when small size reinforcement is used, as previous studies showed.

ii
Page Intentionally Left Blank

iii
Acknowledgements
Firstly, I would like to express my sincere gratitude to my supervisors, Dr
Shan-Shan Huang and Prof Ian Burgess for providing me with the
opportunity to study such an interesting area and for their constant help and
support. I would also like to thank all the technicians in the Heavy
Structures laboratory at the University of Sheffield for their effort and time
they dedicated to me during the tests I conducted in the lab.
I also thank my research group and office colleagues for their support and
the friendly atmosphere during my full-time research period.
Finally, I would like to thank my dear wife for every support she gave me
from the beginning of this research, for her love and patience until this
work was done. I give me sincere thanks to my family for every support
they offered.

iv
Declaration
This thesis is a presentation of my original research work, except where
specific reference has been made to the work of others. Wherever
contributions of others are involved in this thesis, every effort is made to
indicate these contributions clearly.
Ali Alskeif

v
Contents
Abstract .......................................................................................................................................... i
Acknowledgements ...................................................................................................................... iii
Declaration ................................................................................................................................... iv
List of Figures .............................................................................................................................. ix
Glossary of Terms ....................................................................................................................... xii
1 Background of the Study....................................................................................................... 1
1.1 Introduction ................................................................................................................... 1
1.2 Element-based approach and prescriptive fire safety design ........................................ 2
1.3 Performance-based approach ........................................................................................ 4
1.4 World Trade Center collapse, 11 September 2001 ...................................................... 4
1.5 Windsor Tower fire, Madrid 2005 ................................................................................ 8
1.6 Cardington full-scale fire tests ...................................................................................... 9
1.6.1 BRE corner fire test............................................................................................. 10
1.6.2 BRE large compartment fire test ......................................................................... 11
1.6.3 BRE ambient temperature test ............................................................................ 14
2 Yield Line Method .............................................................................................................. 16
2.1 Introduction ................................................................................................................. 16
2.2 Principles of the yield-line method ............................................................................. 16
2.2.1 A brief on plasticity............................................................................................. 16
2.2.2 The concept of yield-lines ................................................................................... 17
2.3 The work method ........................................................................................................ 19
3 Previous Work on Tensile Membrane Action ..................................................................... 21
3.1 Sawczuk & Winnicki, 1965 ........................................................................................ 21
3.2 K. O. Kemp, 1967 ....................................................................................................... 27
3.3 Brian Hayes, 1968 ....................................................................................................... 34
3.3.1 TMA for square slabs .......................................................................................... 34
3.3.2 TMA for rectangular slabs .................................................................................. 42
3.4 The Bailey-BRE method ............................................................................................. 48
3.4.1 Initial method by Bailey & Moore ...................................................................... 48
3.4.2 Tensile membrane action of orthotropic reinforced slabs ................................... 57
3.4.3 Membrane action of composite slab/beam system .............................................. 60
3.5 The necessity of a new alternative simplified method ................................................ 65
4 The Theory and Principles Behind this Study..................................................................... 68
vi
4.1 Assumptions ................................................................................................................ 68
4.2 Methodology ................................................................................................................ 69
4.3 Temperature-based enhancement ................................................................................ 70
4.4 Load-carrying capacity of the slab .............................................................................. 72
4.4.1 Internal work of the slab ...................................................................................... 72
4.4.2 External work of the slab ..................................................................................... 75
5 An Alternative Simplified Method of the Mechanics of TMA ........................................... 76
5.1 Kinematic mechanism ................................................................................................. 76
5.2 Extension and failure of reinforcement bars ................................................................ 79
5.3 The re-examination of the mechanics of TMA ............................................................ 81
5.3.1 Mechanism-b geometrics ..................................................................................... 81
5.3.2 Reinforcement geometrics ................................................................................... 87
5.3.3 Concrete geometrics ............................................................................................ 89
5.3.4 Compression stress block development ............................................................... 91
6 The Mechanics of Tensile Membrane Action in Composite Slabs in Fire ......................... 94
6.1 Rotated yield-line pattern ............................................................................................ 94
6.2 Small-deflection analysis ............................................................................................. 96
6.2.1 Rotated yield-line mechanism ............................................................................. 96
6.2.2 Normal yield-line mechanism............................................................................ 100
6.2.3 Failure of the slab .............................................................................................. 103
6.2.4 Critical temperature ........................................................................................... 103
6.3 Large-deflection analysis - compression stress block method................................... 104
6.3.1 General geometrics ............................................................................................ 105
6.3.2 Geometrics of mechanism-b .............................................................................. 109
6.3.3 Forces equilibrium ............................................................................................. 115
6.3.4 Forces on the slab .............................................................................................. 116
6.3.5 Case (a1) equilibrium ........................................................................................ 117
6.3.6 Case (b1) equilibrium ........................................................................................ 119
6.3.7 Case (b1’) equilibrium ....................................................................................... 120
6.3.8 Case (b1*) equilibrium ...................................................................................... 121
6.3.9 Case (b1’*) equilibrium ..................................................................................... 122
6.3.10 Case (b1**) equilibrium .................................................................................... 123
6.3.11 Case (b1***) equilibrium .................................................................................. 124
6.3.12 The development of the slab deformations against deflection .......................... 125
6.3.13 Crack widths ...................................................................................................... 125
7 Application of the Method ................................................................................................. 126

vii
7.1 Example of composite slab in fire ............................................................................. 126
7.1.2 Small-deflection analysis results ....................................................................... 127
7.1.3 Large-deflection analysis results ....................................................................... 128
7.2 Comparisons against other methods ......................................................................... 131
7.2.1 Comparison against the alternative simplified method ..................................... 132
7.2.2 Comparison against the Bailey-BRE method ................................................... 135
8 Discussion and Conclusions.............................................................................................. 137
8.1 Discussion ................................................................................................................. 137
8.1.1 Small-deflection analysis .................................................................................. 137
8.1.2 Large-deflection analysis .................................................................................. 138
8.1.3 The new aspects of this study compared to Burgess et al. (2014) .................... 139
8.1.4 The key benefits of this study over the Bailey-BRE method ............................ 139
8.2 Study limitations ....................................................................................................... 140
8.2.1 Vertical support of the slab edges ..................................................................... 141
8.2.2 Isotropic reinforcement limitation..................................................................... 142
8.2.3. Thermal deflection ............................................................................................ 143
8.3 Other factors affecting the failure mechanism .......................................................... 143
8.3.1 Bond-slip behaviour .......................................................................................... 143
8.3.2 Reinforcement heating effect ............................................................................ 144
8.3.3 Beam-slab detachment ...................................................................................... 144
8.4 Validation of this study by future research ............................................................... 145
8.5 Final conclusions ...................................................................................................... 146
References ................................................................................................................................. 149
Appendix 1 .............................................................................................................................. A1-1
A1 Publications ................................................................................................................. A1-1
Appendix 2 .............................................................................................................................. A2-1
A2 Code Scripts and Coding Methodology ...................................................................... A2-1
A2.1 Introduction ............................................................................................................. A2-1
A2.2 Coding methodology ............................................................................................... A2-1
A2.2.1 Small-deflection coding .................................................................................. A2-1
A2.2.2 Small-deflection analysis coding flowchart .................................................... A2-4
A2.2.3 Small-deflection analysis code script – Visual Basic ..................................... A2-5
A2.2.4 Large-deflection coding ................................................................................. A2-8
A2.2.5 Large-deflection analysis coding flowchart .................................................. A2-14
A2.2.6 Large-deflection code - Matlab ..................................................................... A2-15
Appendix 3 .............................................................................................................................. A3-1

viii
A3 Pull Out Test of Small-Diameter Reinforcement ........................................................ A3-1
A3.1 The purpose of the test............................................................................................. A3-1
A3.2 Test specimens ......................................................................................................... A3-1
A3.3 Specimens design .................................................................................................... A3-3
A3.3.1 Specimen specifications .................................................................................. A3-3
A3.4 Loading rate ................................................................................................................ A3-7
A3.5 Tests results ............................................................................................................ A3-8
A3.5.1 First specimen – with the split ......................................................................... A3-8
A3.5.2 Second specimen – with the notch................................................................... A3-8

ix
List of Figures
Figure 1: Sprayed, board and solid insulating concrete protection (ASFP 2010) ......................... 3
Figure 2: Dislodged sprayed fire insulation in WTC buildings (Gross & McAllister 2005) ........ 6
Figure 3: Column 79 buckling in WTC-7 (Gann 2008) ................................................................ 7
Figure 4: Columns buckling of the 9th floor, Windsor Tower (Pope 2006) ................................. 8
Figure 5: Composite slab in large deflection after Cardington fire tests (Kirby 1998) .............. 12
Figure 6: Beam buckling in Cardington (Newman et al. 2000) .................................................. 13
Figure 7: Stress distribution of a plastically bending beam; (a) elastic stress distribution; (b & c)
yielding towards the neutral axis; (d) fully plasticized section (i.e. plastic hinge) ..................... 17
Figure 8: Yield line pattern of a rectangular slab ........................................................................ 18
Figure 9: Typical yield-line pattern on a rectangular slab .......................................................... 18
Figure 10: Comparison between upper and lower bound solutions (Szilard 2004) .................... 20
Figure 11: (a) geometry of deformation; (b) stress distribution at failure (Sawczuk & Winnicki
1965) ........................................................................................................................................... 22
Figure 12: Kinematic collapse mode (Sawczuk & Winnicki 1965)........................................... 23
Figure 13: Collapse mode for horizontally unrestrained rectangular plates (Sawczuk & Winnicki
1965) ........................................................................................................................................... 25
Figure 14: Failure mode involving tension cracks (Sawczuk & Winnicki 1965) ....................... 26
Figure 15: Diagonal yield-line pattern of a square slab (Kemp 1967) ........................................ 28
Figure 16: Horizontal forces on the triangular element before the pure membrane action occurs
(Kemp 1967) ............................................................................................................................... 29
Figure 17: Horizontal forces on a triangular element after the formation of pure membrane
action (Kemp 1967) .................................................................................................................... 30
Figure 18: Moment equilibrium of a triangular rigid-element (Kemp 1967) ............................. 32
Figure 19: The effect of membrane action of yield load due to deflections and steel ratio (Kemp
1967) ........................................................................................................................................... 33
Figure 20: Diagonal collapse pattern of a simply supported slab (Hayes 1968a) ....................... 35
Figure 21: TMA in square and rectangular slabs (Hayes 1968a) ................................................ 36
Figure 22: Development of TMA at large deflections (Hayes, 1968) ........................................ 37
Figure 23: Tensile membrane stages (Hayes 1968a) .................................................................. 39
Figure 24: Predicted strength-deflection characteristics allowing for TMA for square slab
(Hayes 1968a) ............................................................................................................................. 41
Figure 25: Stress distribution - no cracks penetrate the slab's upper surface (Hayes 1968a) ..... 43
Figure 26: Stress distribution – cracks penetrate the slab’s upper surface (Hayes 1968a) ......... 47
Figure 27: Division of the floor into slab panels ........................................................................ 50
Figure 28: In-plane stress distribution of elements 1 & 2 (Bailey 2001) .................................... 51
Figure 29: Comparison between Sawczuk's, Hayes' and Bailey's methods with slab’s aspect
ratio of 3.0 (Bailey 2001) ............................................................................................................ 54
Figure 30: Comparison between Sawczuk's, Hayes' and Bailey's methods with slab’s aspect
ratio of 2.0 (Bailey 2001) ............................................................................................................ 55
Figure 31: Comparison between Sawczuk's, Hayes' and Bailey's methods with slab’s aspect
ratio of 1.5 (Bailey 2001) ............................................................................................................ 55
Figure 32: Comparison between Sawczuk's, Hayes' and Bailey's methods with slab’s aspect
ratio of 1.0 (Bailey 2001) ............................................................................................................ 56
Figure 33: Comparison between BRE large-scale test and Bailey's method (Bailey 2001) ....... 57

x
Figure 34: The effect of orthotropy μ on total the load-carrying capacity of rectangular slabs
(Bailey 2003) ............................................................................................................................... 59
Figure 35: Comparison between folding mechanism and membrane action (Bailey 2004) ........ 60
Figure 36: Mobilization of membrane action within slab panels (Bailey 2004) ......................... 61
Figure 37: Mechanism-b which results from the cracking of the optimum yield-line pattern .... 70
Figure 38: Steel reduction factor (BS EN 1993-1-2: 2005) ......................................................... 71
Figure 39: Extension undergone by the downstand beam ........................................................... 73
Figure 40: Small-deflection yield-line pattern (Burgess et al. 2013) .......................................... 77
Figure 41: Probable yield-line mechanisms (Staikova 2014) ...................................................... 78
Figure 42: (a) slab cracking before opening; (b) compression stress block (Mangeon 2013) ..... 80
Figure 43: (a) the extension of the reinforcement bar across the crack; (b) shallow compression
stress block (Mangeon 2013) ....................................................................................................... 80
Figure 44: Reinforcement extension due to crack opening and slab facets rotation (Burgess et al.
2013) ............................................................................................................................................ 81
Figure 45: Compression stress block cases which vary depending on the slab’s deflection ....... 83
Figure 46: Failure mechanism b (Staikova 2014)........................................................................ 84
Figure 47: Movement and rotation of the slab elements (Staikova 2014) ................................... 85
Figure 48: Distances of intact reinforcement bars in the x and y directions ................................ 87
Figure 49: Illustrating the distance of intact reinforcement bars in the x and y directions .......... 89
Figure 50: Cross-section of diagonal yield-line α, illustrating compression stress block ........... 90
Figure 51: Comparison between normal and rotated alignments of yield line patterns .............. 94
Figure 52: Changing yield-line pattern from rotated to normal alignment as temperature
increases ...................................................................................................................................... 95
Figure 53: Rotated alignment yield-line pattern .......................................................................... 96
Figure 54: Normal alignment yield-line pattern ........................................................................ 101
Figure 55: Slab element rotation and movement ....................................................................... 105
Figure 56: Crushing concrete at the corners of the slab at large deflections ............................. 106
Figure 57: Compression block depths z1 and z2 along diagonal yield-line ................................ 107
Figure 58: Distances where reinforcement bars are intact ......................................................... 108
Figure 59: Compression stress block in phase (a) ..................................................................... 110
Figure 60: Case (a1) - compression above all reinforcement bars ............................................ 112
Figure 61: Phase (b) - triangular compression block ................................................................. 113
Figure 62: Case (b1) – triangular compression block above the reinforcement ........................ 114
Figure 63: The forces of elements 1 and 2 of the slab ............................................................... 115
Figure 64: Geometrics of case (a1)............................................................................................ 117
Figure 65: Geometrics of case (b1) ........................................................................................... 119
Figure 66: Distances of intact and fractured reinforcement bars in the x and y directions,
representing Case (b1’) .............................................................................................................. 121
Figure 67: Crack types on the slab ............................................................................................ 125
Figure 68: Slab-beam cross section; beam Section (UKB 406x140x39) .................................. 127
Figure 69: The optimum yield-line pattern of the initial small-deflection analysis .................. 128
Figure 70: (a) Temperature against dimensionless deflection; (b) crack width development
against deflection. Vertical lines represent transmission between two successive cases .......... 129
Figure 71: Internal forces on the slab facets .............................................................................. 131
Figure 72: Comparison between the re-examination of TMA and this study, (a) no temperature
and no beams; (b) with an unprotected beam in fire ................................................................. 133
Figure 73 (a) Normal yield-line alignment; (b) Rotated yield-line alignment .......................... 135

xi
Figure 74: Comparison between the new method (this study) against the Bailey-BRE method.
.................................................................................................................................................. 136
Figure 75: Rotated & normal yield-line alignments ............................................................... A1-3
Figure 76: Rotated yield-line pattern illustrated in 3D ........................................................... A1-3
Figure 77: Compression block phases shown at the edge of the slab as deflection increases. A1-4
Figure 78: Extension undergone by the downstand beam, and reinforcement ....................... A1-5
Figure 79: Force equilibrium on the slab elements ................................................................. A1-5
Figure 80: Horizontal movements seen from the top surface of the slab ................................ A1-6
Figure 81: (a) represents temperature against deflection; (b) represents crack width development
against deflection. The vertical lines (I) to (IV) define phase changes through the process... A1-7
Figure 82: Internal forces on the slab facets ........................................................................... A1-8
Figure 83: (a) Specimen with notch; (b) Specimen with a split in the middle ........................ A3-2
Figure 84: Specimen dimensions ............................................................................................ A3-4
Figure 85: The base of the specimen with the net concrete area around the bolt's head ......... A3-6
Figure 86: Concrete pull-out cone in 45° angle ...................................................................... A3-7
Figure 87: Load vs. displacement for the first specimen, with split ....................................... A3-8
Figure 88: Load vs. displacement of the second specimen showing an abrupt breaking of the
specimen ................................................................................................................................. A3-9
Figure 89: The second specimen after the test failed, showing the broken base .................. A3-10
Figure 90: Rebar-bolt weld detachment that occurred during testing the second specimen . A3-10

xii
Glossary of Terms
All symbols are initially defined within the text as it first appears. A glossary of term was
dedicated to each method in order to retain the original symbols as presented by its author. In
some cases, two methods shared the same glossary of terms when different authors used the
same notations. In certain instances, the same term may be defined by different symbols in order
to keep the original notations as presented by the original authors.
Symbols
Chapter 2
l short span of slab
li projected length of yield-line on corresponding axis of support
M moment of resistance of slab at hinge lines per length unit
n yield-lines intersection point distance from short edge of the slab
p external load acting on slab
δ maximum deflection of slab
θ angle of rotation of slab element about short span
ϕ angle of rotation of slab element about large span
Sawczuk & Winnicki Method
a larger span of slab
A area of slab
b short span of slab
d energy dissipation of slab
Fz reinforcement area per unit width
H reinforcement distance from plate middle plane
li length of hinge line on slab
M bending moment of slab at hinge line
Mαβ bending stress on slab
N axial force at hinge line
Nαβ membrane forces in slab
p transverse loading
Rc concrete compressive strength
W deflection at yield hinge
W0 maximum deflection of central yield-line of slab

xiii
Wmin minimum deflection required for membrane action
β0 parameter defining bending response range in y direction
β1 parameter defining membrane response range in y direction
η parameter defining collapse mode of slab
θ angle of rotation of slab element about its support
καβ curvature rate of middle surface of slab
λαβ extension rate of middle surface of slab
ξ average of neutral layer distance from middle plane
ξ 0 neutral layer distance at stress state at bending collapse
σ0 reinforcement yield stress
Ψ0 parameter defining bending response range in x direction
Ψ1 parameter defining membrane response range in x direction
Kemp's Method
d overall depth of slab
d1 effective depth of slab
dx, dy differential distances on axes x, y respectively
e plastic axial elongation at mid-depth of slab
k1, k3 coefficients related to average compressive stress on concrete at yield
k2 coefficient related to depth of resultant compressive force in concrete at yield
l extension of pure tensile membrane
L span of square slab
M yield bending moment
Mo yield bending moment with zero axial force
N yield axial force at mid-depth of slab
p uniformly distributed load
py yield-line theory collapse load
t reinforcement percentage of slab
To reinforcement yield force per unit width
u concrete cube strength
wo deflection in central region of slab
wo' deflection limit to keep neutral axis depth inside slab section
x, y, z global axes, or denote distances and positions on x,y,z axes respectively
α, β coefficients related to yield criterion in non dimensional form
Δ horizontal movement of slab element
θ rotation of triangular middle surface element about free edge
μ height of neutral axis from mid-depth of slab
μo height of neutral axis from mid-depth of slab at origin

xiv
Hayes & Bailey's Methods
a aspect ratio of slab (L/l)
A, A' parameters in yield criterion
b parameter defining in-plane stress distribution
B, B' parameters in yield criterion
C total compressive membrane force
d1, d2 reinforcement effective depth in x and y directions.
dn concrete compression depth at zero deflection analysis
e Total enhancement factor of slab
e1, e2 enhancements due to both bending action and membrane forces in slab
elements 1 and 2, respectively
e1b, e2b enhancements due to bending action in slab elements 1 and 2, respectively
e1m, e2m enhancements due to membrane forces in slab elements 1 and, 2 respectively
esys enhancement of slab-beam system due to membrane action
E elastic modulus of reinforcement
fu steel ultimate stress
fy steel yield stress
go, go' parameters fixing depth of compressive stress block when membrane forces
are absent
h depth of slab
k parameter defining in-plane stress distribution
K parameter related to steel forces per unit width
k' lever arm/slab thickness for tensile membrane analysis
k1 lever arm/slab thickness for zero deflection analysis
l short span of slab
L larger span of slab
M bending capacity of slab
M0 resistance moment when membrane force is absent
M1m, M2m moments about slab supports due to membrane forces in slab elements 1 and
2, respectively
Mfi moment capacity of steel beam at elevated temperatures
n parameter fixing yield-line pattern
S in-plane shear force at yield-line
To steel forces per unit width
T1, T2 net tensile membrane forces along yield-lines
Tb tensile capacity of steel beam at elevated temperatures
Tbot temperature at slab bottom surface

xv
Ttop temperature at slab top surface
v parameter fixing extent of central membrane
w,W yield-line deflection
wlim vertical deflection limit
wp load-carrying capacity of slab
α, β coefficients related to enhancements due to bending action
αT coefficient of thermal expansion of concrete
γ parameter fixing proportion of reinforcement which does not attain yield
stress
δ parameter fixing maximum reduction in reinforcement stress
μ coefficient of orthotropy
φ , ϕ parameters fixing yield-line pattern
The Alternative Method (Chapters 4 to 8, including the appendices)
A area of steel beam cross-section
A1x compression area in diagonal yield-lines at slab edge
A2x compression area in central yield-lines at slab central region
Ac concrete area around bolts in pull-out specimens
Anc cross section area of concrete notch
As cross section area of reinforcement bar
C concrete compression force in diagonal yield-lines
Cr number of continuous long edges of slab
Cs number of continuous short edges of slab
Cx2 concrete compression force in central yield-line
d distance between two reinforcement bars in any direction
ds diameter of reinforcement bar
e enhancement factor of slab
E external work done by loads on slab
Ea modulus of elasticity of steel for normal temperature design
Ea,θ slope of linear elastic range for steel at elevated temperature
fc concrete characteristic strength
fctm mean axial tensile strength of concrete
fctm(ti) mean axial tensile strength of concrete after ti days
fp,θ proportional limit for steel at elevated temperature
fpx reinforcement yield stress in x direction

xvi
fpy reinforcement yield stress of y direction
fy yield stress of beam at ambient temperature
fy,θ effective yield strength of steel at elevated temperature
ha total depth of beam
he height of concrete frustum around pulled-out bolt
IB internal work dissipated by steel beam
IS internal work of slab
Itot total internal work of slab
K value of double sagging moment of slab
kE,θ reduction factor for slope of linear elastic range at steel temperature
kp,θ reduction factor relative to steel yield stress for proportional limit
ky, ky,θ thermal reduction factor of steel due to current temperature
l short span of slab
L larger span of slab
La lateral surface area of concrete pull-out cone
mp
sagging moment of slab
hogging moment of slab
Mpl moment of resistance of steel beam
n yield-lines intersection point distance from short edge of slab
N yield-lines intersection point distance from larger edge of slab
P load carrying capacity of slab
Pa applied load on slab
Po initial yield-line load capacity
r aspect ratio of slab (L/l)
r1, r2 small and big bases of concrete frustum around pulled-out bolt, respectively
S shear force between slab elements
Sr distance between reinforcement bar in tension and edge of slab
Ss coefficient depends on type of cement
t depth of concrete part of slab
Tb tension force of steel beam
Tcr critical temperature of composite slab
Tx1, Tx2 reinforcement tension forces in x direction across diagonal and central yield-
lines, respectively
Ty1 reinforcement tension force in y direction across diagonal yield-lines
u movement in x direction
v movement in y -direction
Vp pull-out loading rate
x, y, z global axes, or denote distances and positions on x,y,z axes respectively
xc neutral axis depth

xvii
XCA distance in x direction from origin to centroid of concrete compression area
XLim distance covers intact reinforcement in x direction, for x or y bars
XLim,2 distance covers intact reinforcement across central yield-line crack in x
direction
XT distance covers reinforcement bars in compression in x direction
Y1 length of triangular concrete compression block in y direction
YCA distance in y direction from origin to centroid of concrete compression area
YLim distance covers intact reinforcement bar in y direction, for x or y bars
YLim,2 distance covers intact reinforcement across central yield-line crack in y
direction
YT distance that covers reinforcement bars in compression in y direction
z1 compression depth at slab edge
z2 compression depth at central region of slab
α angle of diagonal yield-lines cracks
βcc(ti) coefficient depends on age (ti) of concrete
γ angle between diagonal yield lines and slab support
δ maximum deflection of slab
Δ extension of reinforcement
ΔA displacement in x direction between edges of slab elements 1 and 2
Δ'A displacement in y direction between edges of slabs elements 1 and 2
ΔLim maximum extension of reinforcement in x or y direction
Δx deformation or movement of slab elements in x direction
Δy deformation or movement of slab elements in y direction
εu fracture ductility strain of reinforcement
η angle of rotation between slab elements across cracks
θ angle of rotation of slab about short span
μ reinforcement depth ratio
ξ rotation angle between two slab elements
ϕ angle of rotation of slab about large span

Chapter 1- Background of the Study
1
1 Background of the Study
1.1 Introduction
Over the last couple of decades, attention to structural fire engineering increased and
huge efforts were made to study the behaviour of structures in fire, especially
composite-floor structures. Life safety is the main concern in the event of fire. Thus the
Building Regulations in England and Wales changed from prescriptive requirements to
performance-based approach in 1991, emphasising the safety of occupants so that fire
can be resisted and the building stability is maintained during evacuation (Foster 2006;
Vassart & Zhao 2011). The regulations in Scotland and Northern Ireland followed suite,
allowing the implementation of the performance-based approach for fire safety.
However, fire incidents during the last two decades brought more attention to fire safety
and fire engineering. Fire incidents, like the collapse of the World Trade Center
buildings in 2001, the Windsor Tower fire in Madrid 2005 and the Olympus Hotel
Tower fire in Grozny 2013 are amongst the most famous fire events since 2000.
Evacuation can sometimes be possible and casualties can be avoided or minimized.
However, some other cases can be tragic and result in a huge number of casualties as it
was the case in the WTC towers in 11 September events 2001. Nevertheless, the
evacuation of WTC towers is considered a successful story, thanks to the tower’s ability
to stand long enough before collapse.
Before the 1990s, the main practice that was used in structures in fire conditions
depended on an element-based approach. Such principles were reliable to some extent,
and still they are being used since they showed efficiency in preventing extensive
structural damage in fire. However, the collapse of WTC buildings in September 2011
showed that the element-based approach may not be sufficient to be implemented for
structural safety in fire (Wang et al. 2012). Wang et al. argue that the collapse of WTC
building 7 demonstrated a good example of the shortcomings of the element-based
approach. For example, in WTC building 7, it is believed that the main girder detached

Chapter 1- Background of the Study
2
from one of the columns by the effect of fire. This caused the whole structure to
collapse, although the rest of the structural elements remained within their strength
capacity at the moment of the building collapse. Therefore, Wang et al. suggest that the
prescriptive approach, based on element-based behaviour, may not be sufficient.
Therefore, the performance-based approach, which considers the structure as a whole,
should be implemented in order to understand the structural behaviour in fire
conditions.
1.2 Element-based approach and prescriptive fire safety design
The element-based approach considers the structure as a group of elements comprises
the whole structure independently. Hence, the fire resistance of the structure is
determined by the design of the individual elements of the structure to resist fire
(Purkiss 2007). Thus, the interaction of the elements is not considered. Fire resistance
may be defined by any of the time, strength or temperature criteria. Using the time
criterion implies that the required fire resistance time should be more than the factual
fire period imposed on the structure. The strength criterion is similar to the normal
structural design procedure at ambient temperature, taking into consideration the effect
of the elevated temperatures. Finally, the temperature criterion assumed that the critical
temperature in the structure should be lower than the actual temperature experienced in
the structure in fire conditions (Wang et al. 2012). However, the element-based
approach does not take the effects of thermal deformations at elevated temperature into
consideration. Therefore, the application of this approach is allowed when such effects
are negligible or favourable.
Purkiss (2007) and Wang et al. (2012) argue that the element-based approach is simple,
quick, however not economic. Nonetheless, this method is still adopted by codes of
practice including the Eurocodes. Similar to the structural design procedures at ambient
temperature, mechanical and fire loads are calculated; material and loading safety
factors are considered and then standards are applied depending on the used
construction materials (i.e. concrete, steel, timber and masonry).
The prescriptive approach provides good instructions and prerequisites for safety and
minimizing losses. However, such potential loss for a specific situation is vague. For
instance, the prescriptive approach specifies the number and spacing of sprinklers and

Chapter 1- Background of the Study
3
fire detectors even though the designers do not know the extent of the possible damage
before these sprinklers are activated, or the extent of fire spread before evacuation is
complete (Meacham & Custer 1995).
In the UK, a prescriptive fire guide was published by the Association for Specialist Fire
Protection (ASFP) under the name “Fire protection for structural steel in buildings”,
also known as the “Yellow Book”. This guide presents fire testing and protection
methods of structural elements to achieve certain fire resistance time. A variety of
materials can be used to protect the structural elements from excessive heat in fire
conditions. These materials can be applied in different ways to achieve the required fire
resistance periods. Sprayed materials can be applied to section profiles; boards can be
used to envelope elements’ sections by forming a box all around the structural element;
and special insulating concrete can be used to surround the section and form solid
protection around it (ASFP 2010). Examples of section profile protection are shown in
Figure 1.
Figure 1: Sprayed, board and solid insulating concrete protection (ASFP 2010)
According to the Yellow Book, the thickness of fire protection materials is specified so
that columns and beams temperatures do not exceed 550ºC and 620ºC, respectively.
This assumes that these elements are heavily loaded during the fire. This is now known
to be conservative in most cases, and unconservative in few others. However, according
to the Eurocodes (EC 3-1.2 and EC 4-1.2) the designers are required to determine the
failing temperature. If this is not possible, the limit temperatures are used.

Chapter 1- Background of the Study
4
1.3 Performance-based approach
The Cardington fire tests in mid 1990s showed that in continuous frames the effects of
restraint to thermal expansion make the element-based approach inapplicable in fire
conditions (Wang et al. 2012). Therefore, it is not appropriate to consider a structure as
an assemblage of individual-isolated members. Then in 2001 the collapse of the World
Trade Center buildings led the designers to question the fire safety procedures and the
prescriptive approach. Although the prescriptive approach is still adopted in many codes
of practice, it is often inadequate for large buildings, inflexible and leads to conservative
designs. On the other hand, despite the fact that the performance-based approach is not
new, it is not used on a wide scale yet, because of a lack of understanding of this
approach by the designers (Green et al. 2003). New techniques are being developed to
enable a wide use of such an approach and make it more flexible, economical and safely
implemented.
While in the prescriptive approach the structural system as a whole and the interaction
of the individual elements are not considered, the performance-based approach
considers these factors. This provides more flexible and cost-effective designs. It also
allows the internal secondary steel beams to be used with no fire protection, without
compromising the safety level (Hamilton 2011). Performance-based fire engineering is
a systematic engineering approach which considers fire as part of the structure, and its
[fire] growth is viewed as a design objective. Hence, this approach includes fire
modelling and dynamics, and risk assessment which is eventually subjected to
engineering judgment (Meacham & Custer 1995).
1.4 World Trade Center collapse, 11 September 2001
The collapse of World Trade Center (WTC) buildings 1, 2 and 7 was one of the main
reasons to questioning the element-based design approach. Therefore, the analysis of the
collapse of the twin towers (buildings 1, 2) and building 7 is discussed briefly in this
section.
The twin towers collapsed following the impact of the planes (one plane hit each tower).
However, the collapse of the twin towers occurred due to the exacerbation of the
situation by the fire. This fire was ignited and fed by the huge amount of jet fuel after

Chapter 1- Background of the Study
5
the attack. A report issued by the Structural Engineering Institute of the American
Society of Civil Engineers (SEI/ASCE) and the Federal Emergency Management
Agency (FEMA) in May 2002 stated that despite the tremendous localised damage
made by the direct impact, both the towers remained standing and did not collapse
immediately (Corley et al. 2002). Corley et al. argue that the jet fuel which flowed
down the elevators and through the damaged floors caused huge fires by igniting most
of the furniture and contents of the buildings. This in turn weakened the steel-framed
structure, leading to progressive collapse. WTC building 7, however, was not directly
hit by any plane. It was hit by debris from the planes collision with the twin towers
which ignited the building. Few parts of building 7 were probably damaged to some
extent, leading to its global collapse after fire was ignited by the debris (NIST NCSTAR
1A 2008).
Alexander (2002) argues that the huge amount of jet fuel carried by the planes (about
38,000 litres by the plane that hit the WTC-1), along with the furniture, burned up in
few minutes, allowing the temperature to rise to 1000ºC. This overwhelmed the
sprinkler system although it was reported to have been in a good state prior to the event.
However, according to the 1968 New York City Building Code, WTC buildings were
classified as Class 1B, contrary to what the early stages of the design indicated as 1A
(Gross & McAllister 2005). To comply with this classification, columns, girders and
trusses should have 3-hour fire-resistance. Yet, as Gross and McAllister mention in their
report, WTC-1 collapsed 102 minutes after the plane impact, while it took only 56
minutes for WTC-2 to collapse after the impact. This probably happened because of the
deteriorated insulation materials of the trusses which was detected in a survey prior to
the September event. The deteriorated insulation materials increased the trusses
temperature beyond the critical temperature. Figure 2 shows dislodged fire insulation in
one of the WTC buildings.

Chapter 1- Background of the Study
6
Figure 2: Dislodged sprayed fire insulation in WTC buildings (Gross & McAllister 2005)
As Wang et al. (2012) argue, the excessive temperature caused the floor trusses to
develop catenary mechanism, applying horizontal pull forces on the columns.
Furthermore, the floor trusses stopped providing lateral restraint to the columns.
Therefore, the buckling length of the columns increased, reaching few floors height
which exceeds these columns capacity.
WTC Building 7 was not hit directly by a plane. Fires were ignited by debris from
WTC-1 when the latter was hit. Since there was no jet fuel over building 7, the fire
developed slowly and unnoticed; spreading between offices and floors uninterrupted by
the sprinkler system as a result of the loss and damage of the city water pipes due to
WTC 1 & 2 collapse (Gann 2008). Gann argues that regardless of the lack of photos of
WTC-7 fires, there was enough information to establish an assessment of fire
development. Gann (2008) and Wang et al. (2012) argue that the collapse of WTC-7
was due to connection failure that caused buckling of key column 79, as shown in
Figure 3. Due to the elevated temperature, lateral forces in beams existed due to their
[beams] expansion. Restraint by the primary beams led to axial compression which was
large due to the large sizes of the beams, leading to shear failure of the connections.
This failure led to the collapse of floor 13 which triggered a series of successive floor
collapse, leaving columns 79, 80 and 81 with insufficient lateral support, therefore
initiating a global building collapse.

Chapter 1- Background of the Study
7
Figure 3: Column 79 buckling in WTC-7 (Gann 2008)
However, Alexander (2002) argues that the fact that the twin towers remained standing
long enough for the evacuation of everyone who had an unblocked route, makes the
incident a success story. After all, only 2923 out of 58,000 people who were in the
buildings died. In a study of the evacuation of the World Trade Center buildings,
Gershon et al. (2011) argue that about 87% of all occupants in the WTC were
evacuated, making this evacuation largely successful.
Although the loss of 2923 is tragic, WTC incident is considered a successful fire safety
story. It could have been far worse if the buildings did not stand long enough after the
impact. Alexander (2002) argues that in general it is not practical to design structures to
withstand impacts from planes. However, buildings need to show more robust and be
redundant enough to further decrease the numbers of casualties as much as possible.

Chapter 1- Background of the Study
8
1.5 Windsor Tower fire, Madrid 2005
In 2005, fire caused partial collapse of the Windsor Tower in Madrid. The Windsor
Tower was a 32-storey building that consisted of a reinforced concrete core supporting
two-way deep waffle flooring system (Wang et al. 2012). At the time of its construction,
Spanish building codes did not require the steelwork to be fire-protected and did not
require sprinkler systems to be installed in buildings. Hence, in accordance to the
Spanish building codes, the perimeter columns and the internal steel beams were not
fire-protected (Parker 2005; Wang et al. 2012). The fire started in floor 21 and spread
downwards quickly. It is believed that fire spread by dropping flamed materials through
service openings and the incomplete vertical compartmentation which lacked fire-
stopping system, especially since the building was in the process of refurbishment at the
time of the incident (Wang et al. 2012).
Fletcher et al. (2006) argue that the concrete structure, floors and columns, performed
very well and remained intact. However, the steel part above floor 21 collapsed.
Fletcher, et al. present an interesting notice that although floor 9 experienced a full fire
flashover, and although the steel members in that floor were not fire-protected, the
overall stability was maintained. No significant collapse occurred despite the fact that
the steel columns suffered from extensive buckling as shown in Figure 4.
Figure 4: Columns buckling of the 9th floor, Windsor Tower (Pope 2006)

Chapter 1- Background of the Study
9
The columns of the floors above and below the 9th
floor were fire-protected. This
provided alternative load paths through these floors. This alternative load path, in turn,
provided support to floor 9, preventing it from total collapse despite the severe buckling
of its columns (Pope 2006; Fletcher et al. 2006).
Although the tower was severely damaged and needed to be demolished and replaced, it
should be given credits for remaining standing after the extensive 20-hour fire.
1.6 Cardington full-scale fire tests
Before the Broadgate fire in 1990, codes of practice for structural behaviour in fire
conditions, including the British Standards and the Eurocodes, were based on structural
element performance as isolated members. Hence, allowing the failure of some steel
members in fire and using the alternative load-carrying mechanism was not considered.
However, this started to change after the Broadgate fire incident, initiating a new
understanding of the structural behaviour of buildings at elevated temperatures. This
new behaviour was possible to be examined and researched by the Cardington structural
fire research programme in the 1990s (Wang et al. 2012).
In the 1990s, a series of large-scale fire tests was conducted by the Building Research
Establishment (BRE), in collaboration with Tata Steel (British Steel that time) within
the BRE Large Building Test facility at Cardington (Lennon 2014). These tests were
conducted in order to examine the behaviour of a composite building in fire conditions.
The building at which the tests were conducted was an 8-storey steel framed structure
with composite slab flooring system which was designed according to the UK national
design codes and complied with the Eurocode provisions of steel structures design. The
total floor area was 945m2 which consists of five 9-meter-bays along the elevation and
6m, 9m, 6m bays successively across the building. For construction cost and time
reduction and for standardization purpose, only four beam sections and three column
sections were used. The peripheral edge beams were protected using double glazed units
while the secondary beams were left unprotected. All the columns were either protected
or located behind walls that were used to fire-protect compartments (Lennon 2014). The
composite floor slab was light-weight concrete comprised trapezoidal steel deck and
Chapter 1- Background of the Study
10
reinforced by anti-cracking A142 steel mesh (i.e. 6mm- bars spacing 200mm) (Bailey
2001).
1.6.1 BRE corner fire test
Lennon (2014) explains that in order to minimise the effect of the high temperatures on
the hangar itself, at which the BRE corner test in 1995 was conducted, the fire was
ignited on the second floor, heating the third floor which was to be tested. Furthermore,
this facilitated the observations during the test. The compartment was formed using fire-
resistant boards, made of British gypsum fireline. The peripheral walls were made by
full height concrete walls, while the boundary was formed using a one-meter high
concrete wall with double glazing units on its top (Huang et al. 2001)
Lennon (2014) argues that in order to simulate a realistic compartment, representing a
corner office which resides in commercial buildings, no additional boundary wall
restraint was provided. Huang et al. (2001) and Lennon (2014) state that a fire load of
40kg/m2 was provided by 12 timber cribs, distributed on the second floor over 54m
2
area, resulting in an overall fire load of 2160kg. According to Huang et al., the
maximum atmosphere temperature recorded in the centre of the compartment during the
test was 1051ºC at 102 minutes. The maximum recorded temperature of the bottom of
the unprotected-secondary beams was 842ºC, and for the protected edge beams the
temperature was 590ºC at 114 minutes. The maximum average recorded temperature of
the bottom of the concrete slab was 285ºC at 114 minutes.
Huang et al. (2001) argue that it was observed in this test that the tension in the central
region of the slab was totally balanced by the peripheral compression in the beams. The
importance of this observation lies in the fact that the slab was almost horizontally
unrestrained. This balance was mainly achieved taking into account that the four
peripheral beams provided vertical support to the slab. This mechanism, which balances
the central tension and the peripheral compression, is essential to supporting the whole
slab at large deflections, as shown in Chapter 3. Since large deflections are acceptable in
fire conditions, this point is the basis of the mechanism which is derived in this study
and is presented in Chapter 6.

Chapter 1- Background of the Study
11
1.6.2 BRE large compartment fire test
The large compartment fire test in Cardington was carried out on the third floor. The
fire was ignited on the second floor, heating and testing the third floor. The test took
place in a large compartment representing a modern wide office which has an area of
18m x 21m (Lennon 2014). Uniformly distributed timber cribs gave a fire load of
40kg/m2. The fire load was distributed differently from the corner fire test, with more
timber in each crib and larger distance between them. Lennon argues that this different
fire-load distribution, along with the ventilation conditions, had a significant effect on
the fire development in the compartment.
All the secondary steel beams were left unprotected. The columns, and their
connections, were fire protected. The maximum atmosphere temperature reached
763ºC; steelwork temperature reached 691ºC and the maximum average temperature of
the bottom of the slab reached 260ºC (Huang et al. 2001). Table 1 shows the summery
of Cardington fire tests results:
Table 1: Building Research Establishment (BRE), United Kingdon; BS, British Steel (now Tata Steel), United Kingdom; SCI, Steep Construction Institute, United Kingdom; CTU, E.U.
collaborative research led by Czech Technical University in Prague. (Wang et al., 2012)
No. Organization Level
Time to max
temperature
[Minutes]
Reached
temperature
[ºC]
Measured
deformations [mm]
Gas Steel Max permanent
1 BS 7 170 913 875 232 113
2 BS 4 125 820 800 445 265
3 BS 2 75 1020 950 325 425
4 BRE + SCI 3 114 1000 903 269 160
5 BRE 3 70 --- 691 557 481
6 BS 2 40 1150 1060 610 ---
7 CTU 4 55 1108 1088 >1000 925
Table 1 shows the temperatures that the steelwork and the structure in general were
subjected to. Since the steel was left unprotected, temperature differences between the
gas and the steel did not exceed 90ºC at most. This illustrates that the unprotected steel

Chapter 1- Background of the Study
12
can become extremely heated in fire conditions. In levels 2 and 7, this temperature
difference was only 20ºC. Nevertheless, with the maximum temperatures to which the
steel was subjected, reaching 1150ºC and 1108ºC in levels 2 and 4 respectively, the
maximum measured deformations were 610mm in level 2 and over 1000mm in level 4,
as illustrated in Table 1. Based on the predictions of the element-based approach,
runaway collapse should have been witnessed in tests with such high temperatures.
However, observations from the Cardington fire tests showed no runaway collapse in
the composite beams. This was interesting since the downstand steel beams were
subjected to excessively high temperatures beyond their critical limits. These beams
would have failed and collapsed if they were tested on an individual basis, (Burgess et
al. 2014). At temperatures exceeded 1000ºC, the composite slab had undergone large
deflection of (L/20), as shown in Figure 5. Signs of local buckling on the beams and
signs of connection fracture due to high tensile forces appeared, as shown in Figure 6.
However, no structural collapse occurred (Lim 2003).
Figure 5: Composite slab in large deflection after Cardington fire tests (Kirby 1998)

Chapter 1- Background of the Study
13
Figure 6: Beam buckling in Cardington (Newman et al. 2000)
Bailey (2001) argues that these results show that the composite slab which experienced
large deflections had larger fire resistance than what was thought according to the
conventional design methods, which were then mainly based on flexural behaviour.
Burgess et al. (2014) argue that the mechanism which caused the capacity enhancement
of the slab is somewhat a two-dimensional catenary action. In a cable, catenary action
resists the pull-in and the vertical forces, providing that support is available on the both
ends of the cable. A similar mechanism takes place in highly-deflected slabs by
horizontal reaction which is provided by compressive membrane stresses on the
perimeter of the slab. However, if two-way continuity of the concrete slab panels is
provided, the heated parts of the slab, which are vertically supported by their cool
surrounding structure, generate high biaxial curvatures. This leads to the creation of a
tensile membrane stress area in the central zone of the slab.
Today, this mechanism of membrane stresses is known as the Tensile Membrane Action
(TMA). Burgess et al. (2014) argue that TMA depends on two factors: 1. good degree
of vertical support around the edge of the slab; 2. the extent of the deflection of the
central zone of the slab. In fire conditions, the secondary steel beams which are left
unprotected lose significant degree of their strength, leading to large deflections. Under
such large deflections, TMA carries the loads, leading to enhancement in load-carrying
capacity of the slab beyond the capacity predicted by conventional flexural-behaviour
methods.

Chapter 1- Background of the Study
14
Hayes (1968a) explains TMA by considering a one-way spanning strip. At large
deflections, the ends of the strip moves inward. If this movement is resisted, the so-
called “catenary action” is generated and the loads on the slab are supported by catenary
mechanism. However, in case of a two-way spanning slab, a similar mechanism in both
ways is generated even without restraining the edges of the slab. Thus, this tensile
membrane action mechanism can be generated at large deflections even for isolated
slabs with no restraint. Bailey (2001) argues that the application of TMA is limited
since the required large deflections to initiate this behaviour are not usually encountered
in normal conditions. However, such large deflections are acceptable in fire conditions.
Therefore, this behaviour is important when it is about studying slabs behaviour at
elevated temperatures. The behaviour of composite slabs at large deflections is further
discussed in Chapter 3. The TMA mechanism, which was behind the survival of the
slab in the BRE large compartment fire test, was developed in this study as is discussed
in Chapter 6.
1.6.3 BRE ambient temperature test
This test was conducted at ambient temperature to investigate the tensile membrane
action in slabs. Although the test was conducted at ambient temperature, the intention
was to examine TMA in slabs in fire conditions (Lim 2003). The slab was built on
trapezoidal steel deck, which was removed later to study the slab while reinforced only
with A142 anti-cracking steel mesh. The removal of the steel deck was necessary due to
the fact that the steel sheeting has only nominal strength, especially since BRE tests
showed that temperatures can go beyond 1100ºC. Furthermore, it was observed that
steel decks in composite slabs detach from the concrete part of the slab due to the steam
released at high temperatures (Bailey 2001).
The slab was simply supported around its edges. No horizontal restraint was provided.
The test showed that the composite slab failed when the load was about double that
expected by the normal yield-line theory. Failure occurred by the formation of a full-
depth crack at the central zone of the slab. This failure mode is essential to studying the
behaviour of the composite slabs when they undergo large deflections. Examining this
failure mode is the key to this research, as is further discussed in Chapters 5 and 6.

Chapter 1- Background of the Study
15
In the 1960s, attempts were made to establish simplified methods to predict slabs’ load-
carrying capacity in compliance with test observations. These methods are briefly
presented in Chapter 3. An existing simplified method to calculate the slab load
enhancement is presented in Section 3.4. However, the enhancement according to the
existing method has been found to be conservative for flat concrete slabs (Burgess et al.
2014). The alternative simplified method that was established by Burgess et al. (2014)
has been extended in this study in order to calculate the enhancement factors for
composite slabs at elevated temperatures and predict the extent of the load that
composite slabs can withstand beyond the predictions of conventional methods.
It should be noted that all previous methods, in addition to this study, used the same
coordinate system with its origin at the corner of the slab. The exception to this was
Kemp (1967), who restricted attention to a bisymmetric problem of square slabs.
Therefore, Kemp used the centre of the slab as the origin of the coordinate system. The
original coordinate system of each method is used when presented in this thesis.

Chapter 2- Yield Line Method
16
2 Yield Line Method
2.1 Introduction
Structural analysis based on the elastic theory of structures gives good estimation of
deformations and stresses for structures obeying the Hooke’s law at small deformations.
However, at structural failure, the assumptions of the elastic theory are not valid; and its
estimation of the real load-carrying capacity is not accurate. This leads to an inaccurate
safety factors against collapse, mostly conservative. On the other hand, there are some
cases at which the theory of elasticity might give unsafe results (Szilard 2004). The
yield line analysis, based on the plastic theory, eliminates the shortcomings and the
limitations of the theory of elasticity. Since this study is based on the yield line theory,
its principles are briefly presented in this chapter.
2.2 Principles of the yield-line method
2.2.1 A brief on plasticity
The method proposed in this study is based on plastic yield-line analysis. A yield-line is
a linear plasticized hinge on a slab. Therefore, the concept of plasticity and plastic
hinges is discussed in this section, prior to introducing the concept of the yield-lines in
Section 2.2.2.
When a beam, for example, is loaded, the stress distribution takes the usual triangular
pattern according to the elastic theory. However, if the load is progressively increased
further, the outer fiber of the beam yields (i.e. reaches the yield stress as shown in
Figure 7(a)). With further load increase, yielding takes place in the adjacent fibers
towards the neutral axis of the beam as shown in Figure 7 (b) & (c). With the yield
stress penetrating the cross-section fibers and reaching the neutral axis, the stress
distribution of the beam becomes nearly rectangular as shown in Figure 7(d). This fully
plasticized section forms a plastic hinge in the structural element. The plastic hinge
rotates under a constant moment which does not increase further in case of adding

Chapter 2- Yield Line Method
17
additional loads. The collapse of the structural element, however, is dependent on the
number of the plastic hinges that the element can take (i.e. determinacy).
Figure 7: Stress distribution of a plastically bending beam; (a) elastic stress distribution; (b & c) yielding towards the neutral axis; (d) fully plasticized section (i.e. plastic hinge)
2.2.2 The concept of yield-lines
The concept of the plastic analysis of beams and frames was extended to include slabs
in what is called the yield line analysis. A yield line is a two-dimension plastic hinge,
which is observed in particular patterns on slabs when plasticized. While the
conventional design methods attempt to work out the elastic deformation shape of
slabs, the yield-line analysis defines all the possible failure patterns (Szilard 2004). The
optimum yield-line mechanism is the mechanism which corresponds to the smallest
load that causes the collapse. This load is called the optimum yield-line capacity, or the
ultimate load. In this study, the optimum yield-line capacity is used as the basic capacity
of the slab in order to determining the load enhancement (i.e. the extra load that the slab
can carry beyond its basic capacity). Therefore, conducting yield-line analysis is the key
to determine the efficiency of the tensile membrane action at large deflections.
When a slab is loaded to the verge of failure, yield-lines form along the most stressed
areas of the slab by the formation of continuous plastic hinges. These yield-lines
together form what is known as the yield-line pattern (Kennedy & Goodchild 2004). It
is important to determine the correct yield-line pattern in order to conduct the yield-line
(a) (b) (c) (d)

Chapter 2- Yield Line Method
18
analysis and to calculate the optimum yield-line capacity correctly, as is discussed in
Chapter 6. The yield-lines divide the slab into parts which are called slab elements.
When the slab deflects, these slab elements rotate about the yield lines as rigid bodies
(Szilard 2004). A typical yield-line pattern is demonstrated in Figures 8 and 9.
Figure 8: Yield line pattern of a rectangular slab
Figure 9: Typical yield-line pattern on a rectangular slab
l is the short span of the slab.
n is the yield-lines intersection point distance from the short edge of the slab.
θ is the angle of rotation of slab element about it the short span of the slab.
ϕ is the angle of rotation of slab element about it the larger span of the slab.
δ is the maximum deflection of the slab

Chapter 2- Yield Line Method
19
This study considers a few of the yield-line method’s assumptions. These are:
1. The yield lines are straight lines.
2. The yield lines pass through the intersection points of the axis of rotation of two
adjacent elements (i.e. the slab corners).
3. The yield lines end at the boundary of the slab.
4. The yield lines develop along the lines of maximum moments. These moments
develop to the ultimate moment and then remain constant.
5. The slab elements, which are defined by the formation of the yield lines, are
rigid bodies; and the elastic deformations within these elements are negligible.
6. When the yield-line pattern is optimum, no twisting moments exist.
The first three of these assumptions are apparent in Figure 9. Although these
assumptions are used in this study, they are over-simplified, as is further discussed in
Section 8.2. Nonetheless, this is justifiable in simplified methods. This study presents an
alternative simplified method intended to replace the Bailey-BRE method, and the
effects of such simplification is not significant. The last four assumptions are key to the
calculation of the optimum yield-line capacity. When calculating this optimum capacity,
only the sagging moments at the yield-lines are considered, and no twisting moments
are considered within the slab elements, as is discussed in Section 6.2.
2.3 The work method
The work method, also known as the virtual work or energy method, is the simplest
method of implementing the yield line theory in order to calculate the critical load, thus
the resisting moment, at which the slab fails (Kennedy & Goodchild 2004). The main
principle of the method is that the work done externally and the work dissipated
internally on the slab must be in balance. That is, the external work done by the loads on
the slab equals the internal work dissipated by the slab along the yield lines. This
balance principle is mathematically expressed by:
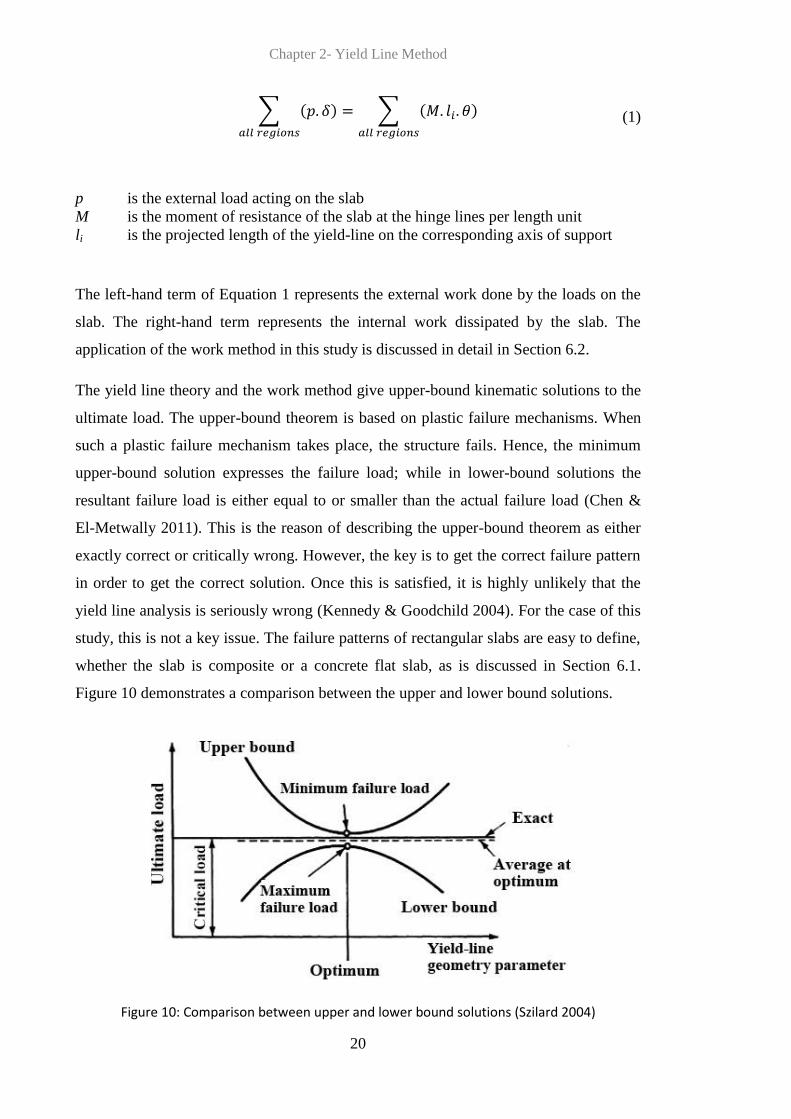
Chapter 2- Yield Line Method
20
(1)
p is the external load acting on the slab
M is the moment of resistance of the slab at the hinge lines per length unit
li is the projected length of the yield-line on the corresponding axis of support
The left-hand term of Equation 1 represents the external work done by the loads on the
slab. The right-hand term represents the internal work dissipated by the slab. The
application of the work method in this study is discussed in detail in Section 6.2.
The yield line theory and the work method give upper-bound kinematic solutions to the
ultimate load. The upper-bound theorem is based on plastic failure mechanisms. When
such a plastic failure mechanism takes place, the structure fails. Hence, the minimum
upper-bound solution expresses the failure load; while in lower-bound solutions the
resultant failure load is either equal to or smaller than the actual failure load (Chen &
El-Metwally 2011). This is the reason of describing the upper-bound theorem as either
exactly correct or critically wrong. However, the key is to get the correct failure pattern
in order to get the correct solution. Once this is satisfied, it is highly unlikely that the
yield line analysis is seriously wrong (Kennedy & Goodchild 2004). For the case of this
study, this is not a key issue. The failure patterns of rectangular slabs are easy to define,
whether the slab is composite or a concrete flat slab, as is discussed in Section 6.1.
Figure 10 demonstrates a comparison between the upper and lower bound solutions.
Figure 10: Comparison between upper and lower bound solutions (Szilard 2004)

Chapter 3- Previous Work on Tensile Membrane Action
21
3 Previous Work on Tensile Membrane Action
3.1 Sawczuk & Winnicki, 1965
Sawczuk & Winnicki (1965) examined the behaviour of simply supported concrete
slabs at large deflections. Their paper came after the analysis of post-yield behaviour of
circular reinforced concrete plates by R. H. Wood in 1961. Following previous studies,
it was noticed that beyond the plastic collapse stage, two factors influence the behaviour
of structures: 1. the material strain-hardening; 2. the change in the geometry of the
structure during plastic deformations. The assumptions which were considered for
Sawczuk and Winnicki's method include the following:
1. The model is based on an energy method.
2. The slab which is considered in this method is a rectangular reinforced concrete slab.
3. The slab is assumed to be simply supported along its four edges.
4. Two failure modes of the slab are considered. The main mode of failure included
tension cracks starting at the intersection points of the yield-lines. This mode of failure
is adopted in the calculations. The second failure mode included a crack starting at the
centre of the slab.
Sawczuk & Winnicki (1965) argue that according to observations, slabs’ load-carrying
capacity is larger than those estimated by the limit analysis theory, even after modifying
for the material strain-hardening. It is observed from experiments that in rectangular
reinforced concrete slabs the post yield membrane action is either localized in bending
yield hinges zones, or additional membrane hinges form. To balance the membrane
action, compressive forces are carried by the supporting edges of the slab, forming what
is known as the compressive ring. As deflection increases, membrane forces Nαβ appear.
Thus, the yield condition is dependent on bending stresses Mαβ and membrane forces
Nαβ. Since deflection is accompanied with energy dissipation, Sawczuk and Winnicki
express this dissipation d by two components; bending and stretching as follows:

Chapter 3- Previous Work on Tensile Membrane Action
22
(2)
Where and express the curvature and the extension rates respectively.
According to the energy theory, the work done by the external forces must not be
smaller than the energy dissipated by the internal work. Following arrangements, the
load-deflection relationship is written as:
(3)
p is the transverse loading
W is the deflection
M is the bending moment
N is the axial force
is the angle of rotation of the slab element about its support
li is the length of the hinge line
A is the area of the slab
Sawczuk and Winnicki consider a cross section of unit width, with reinforcement lies at
the bottom of the section at distance H from the section’s middle plane as shown in
Figure 11.
Figure 11: (a) geometry of deformation; (b) stress distribution at failure (Sawczuk & Winnicki
1965)
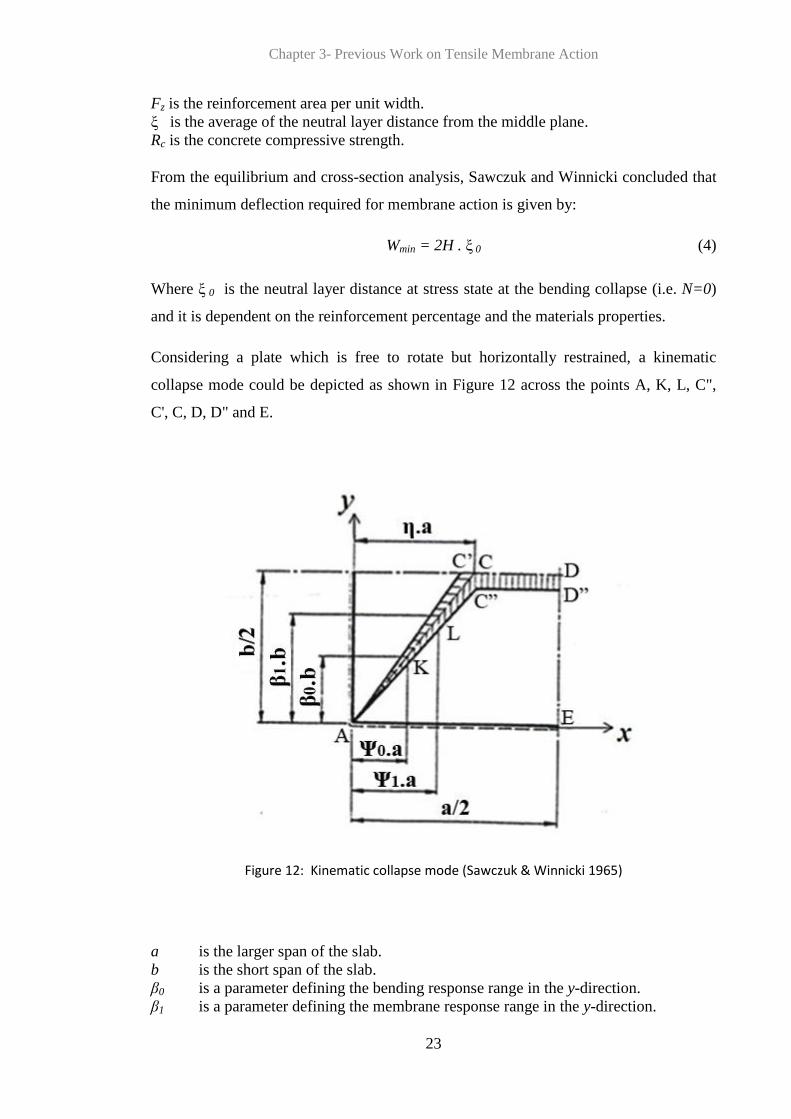
Chapter 3- Previous Work on Tensile Membrane Action
23
Fz is the reinforcement area per unit width.
ξ is the average of the neutral layer distance from the middle plane.
Rc is the concrete compressive strength.
From the equilibrium and cross-section analysis, Sawczuk and Winnicki concluded that
the minimum deflection required for membrane action is given by:
Wmin = 2H . ξ 0 (4)
Where ξ 0 is the neutral layer distance at stress state at the bending collapse (i.e. N=0)
and it is dependent on the reinforcement percentage and the materials properties.
Considering a plate which is free to rotate but horizontally restrained, a kinematic
collapse mode could be depicted as shown in Figure 12 across the points A, K, L, C",
C', C, D, D" and E.
Figure 12: Kinematic collapse mode (Sawczuk & Winnicki 1965)
a is the larger span of the slab.
b is the short span of the slab.
β0 is a parameter defining the bending response range in the y-direction.
β1 is a parameter defining the membrane response range in the y-direction.

Chapter 3- Previous Work on Tensile Membrane Action
24
Ψ0 is a parameter defining the bending response range in the x-direction.
Ψ1 is a parameter defining the membrane response range in the x-direction.
η is a parameter defining the collapse mode of the slab.
The process goes through many stages, depending on the magnitude of the deflection W
as follows:
Pure bending moment work: within the range 0 ≤ W ≤ 2ξ0.H.
Combined bending moment and membrane action: within the range
2ξ0 ≤ W ≤ 2H.
Pure membrane action: when W ≥ 2H.
Taking other cases into account, in consistence with Wood (1961), Sawczuk &
Winnicki (1965) argue that if a rectangular slab is horizontally unrestrained, then as the
deflection increases, a full-depth crack appears perpendicularly to the slab’s long edge
with no rotation of its adjacent parts relatively to the crack is observed. This is
illustrated in Figure 13 across the slab points A, F0, F1, C", C', C, D, D", E" and E . The
difference between this collapse mode and the mode presented in Figure 12 is the
rotation of the element ACDE around its perpendicular-to-plane axis when the slab is
horizontally unrestrained. The authors observe that the extent of the bending zone
depends on the deflection magnitude. Furthermore, it appears that the compression in
the slab is carried without any energy dissipation.

Chapter 3- Previous Work on Tensile Membrane Action
25
Figure 13: Collapse mode for horizontally unrestrained rectangular plates (Sawczuk & Winnicki
1965)
Sawczuk and Winnicki argue that the collapse mode, shown in Figure 13, occurs with
small values of limit loads accompanied by deflection of the order of magnitude of the
slab thickness. However, with larger deflections, transverse cracks form with a lower
load value.
Figure 14 shows a collapse mode with tension cracks involved. Bending moments act
along the hinge ACD, while the line FC is subjected to concentrated axial extension.

Chapter 3- Previous Work on Tensile Membrane Action
26
Figure 14: Failure mode involving tension cracks (Sawczuk & Winnicki 1965)
W0 is the maximum deflection of the central yield-line of the slab.
Sawczuk & Winnicki (1965) argue that tests conducted on reinforced concrete slabs
showed agreement with the predictions of the theoretical method of post-yield analysis
for reinforced concrete slabs. The authors also argue that their study demonstrates the
significant influence of geometry changes on slabs’ load-carrying capacity, especially in
the case of restrained edges.
The method that was established by Sawczuk & Winnicki (1965) had certain benefits
and shortcomings as follows:
Benefits:
The method includes the formation of cracks across the short span of the slab in
the failure modes. Although the adopted failure mode itself is not correct, at
least the model includes slab tension cracking.
Shortcomings:
The mode of failure which is adopted for the method contradicts Wood’s (1961)
test observations.

Chapter 3- Previous Work on Tensile Membrane Action
27
The method shows slab boundary forces, even for simply supported slabs. This
is illogical (Hayes 1967b).
The moments along the yield-lines are equal to the moments given by the simple
yield-line theory. Therefore, taking the transverse moment equilibrium of rigid
slab portions does not lead to load-enhancement (Hayes 1967b).
Although Sawczuk’s method includes one of the probable modes of failure (i.e. cracks
across the short span of the slab) a new model that includes the correct mode of failure
was necessary to be developed. A superior model which took the cracking failure mode
into account was established later by Hayes (1968 a&b), changing the method from
energy based to equilibrium based method, as is further discussed in Section 3.3.
3.2 K. O. Kemp, 1967
Kemp (1967) developed a solution for a yield load of a square reinforced concrete slab.
The solution had the following list of assumptions:
1. Upper bound solution for square reinforced concrete slabs is assumed.
2. Slabs in this method are simply supported.
3. Rigid-perfectly plastic behaviour is assumed for this model.
4. The slab fails in a diagonal yield-line pattern.
5. The method is limited to isotropic reinforcement, located at the bottom of the
slab.
Kemp (1967) argues that when a slab is loaded, a yield line mechanism forms according
to the simple yield-line theory. Only after this formation of the yield line mechanism,
membrane forces can be significant. Kemp assumes normal diagonal yield line pattern
forming four triangular portions, as illustrated in Figure 15.

Chapter 3- Previous Work on Tensile Membrane Action
28
Figure 15: Diagonal yield-line pattern of a square slab (Kemp 1967)
The four triangular portions of the slab, which are defined by the yield-lines, are
assumed to be rigid. Kemp argues that plastic deformations, whether axial or bending,
can only occur along the yield lines. The axial-plastic strains in the mid-plane surfaces
of the portions depend on the two possible movements of these surfaces, which are: 1-
the rotation of the rigid body about the simply supported edges; 2- the horizontal rigid-
body movement perpendicularly on the slab's edges. In order to determine the axial
forces at the slab's mid-depth, Kemp determines the axial strains at that depth. Kemp
uses the geometry equilibrium. At a particular deflection wo, the rotation and horizontal
movement of each element can be obtained. Taking the rigidity of each triangular
element, the plastic axial elongation e at any point on the yield line can be determined.
Kemp gives the relationship between the rotation θ, horizontal movement Δ and the
elongation e by:
(5)
x is the distance of the studied point on the yield line from the origin in the x-
direction.
L is the span of the square slab.
θ is the rotation of the triangular middle surface element about the free edge
With rearrangement and substitution, the height of the neutral axis from the mid-depth
of the slab μ in relation to the deflection wo is given by:

Chapter 3- Previous Work on Tensile Membrane Action
29
(6)
μo is the height of the neutral axis from the mid-depth at the origin.
To determine the value of μo for a given deflection wo, the horizontal equilibrium for
each triangular element should be considered. The triangular element, shown in Figure
16, should be in horizontal equilibrium when subjected to the axial force N along the
yield lines.
Figure 16: Horizontal forces on the triangular element before the pure membrane action occurs (Kemp 1967)
The full derivation is not presented in this study. The calculations done by Kemp (1967)
give the value of μo as:
(7)
Where
and it represents the height of the neutral axis above mid-
depth when N=0
d is the overall depth of the slab

Chapter 3- Previous Work on Tensile Membrane Action
30
To is the reinforcement yield force per unit width
u is concrete cube strength
Mo is the yield bending moment with zero axial force
k1 is a coefficient related to average compressive stress on concrete at yield.
k2 is a coefficient related to the depth of the resultant compressive force in
concrete at yield.
α is a coefficient related to the yield criterion in a non dimensional form.
Equation 7 is valid for a particular range of deflection (i.e.
.)
Where is the deflection limit to keep the neutral axis depth inside the slab section.
When the central deflection exceeds the limit , the neutral axis lies outside of the slab
section, and the slab cracks at its central zone. The axial force then is N= - To (i.e.
tensile membrane action is mobilized). As the deflection increases, the pure membrane
action spreads outwards from the central zone of the slab. Kemp assumes that the yield
line pattern remains unchanged, and plasticity still applies to the diagonal yield lines
and thus the equilibrium persists. However, Kemp argues that if the outwards-extension
of the pure membrane action reached a position x=l/2, a discontinuity in the forces at
that position takes place, as shown in Figure 17.
Figure 17: Horizontal forces on a triangular element after the formation of pure membrane action (Kemp 1967)

Chapter 3- Previous Work on Tensile Membrane Action
31
l is the extension of the pure tensile membrane.
dx and dy represent differential distances in the x and y directions, respectively.
Kemp’s calculations give the relationship between the deflection in the central region wo
and the extension of the pure tensile membrane l as the follows:
(8)
β is a coefficient related to the yield criterion in a non dimensional form. It is given by:
(9)
k3 is a coefficient related to the average compressive force in the concrete at yield.
The extension of the pure tensile membrane l is given by:
(10)
The axial force N can be determined by the relation:
(11)
x in Equation 11 represent an arbitrary distance on x axis.
As Equation 11 shows, for deflections lower than , the axial force changes linearly
along the yield line and equals zero when x=L/4. Thus, the membrane force is tensile at
the inner half of the slab, and compressive at the outer half of it (Kemp 1967).
Since the yield membrane forces
and the yield moments
(where M is the yield
bending moment) were determined as a function of the slab deflection wo, Kemp
determined the yield loads corresponding to any magnitude of the deflection wo by
taking the equilibrium of the slab. Due to the symmetry, vertical shear and torsional
moments along the yield lines are zero. Thus, yield-load calculations can be done for

Chapter 3- Previous Work on Tensile Membrane Action
32
one of the triangular elements of the slab. Kemp takes the moment equilibrium about
the mid-depth of a simply supported slab edge, as shown in Figure 18.
Figure 18: Moment equilibrium of a triangular rigid-element (Kemp 1967)
The whole derivation is not presented in this thesis. Thus the equations of the two cases
are presented directly.
For deflections less than the critical deflection of w'o (i.e. ):
(12)
p is the uniformly distributed load
py is the yield-line theory collapse load
For deflections larger than the critical deflection of wo (i.e. ):
(13)

Chapter 3- Previous Work on Tensile Membrane Action
33
Kemp (1967) argues that the yield load due to membrane action stays pretty small until
full-depth cracks occur in the slab. The magnitude of this yield load becomes
significantly larger as deflections exceed this stage, and noticeable for slabs with low
reinforcement percentage. The effect of the reinforcement ratio on the increase of the
yield load, due to membrane action, beyond the yield line theory collapse load is
illustrated in Figure 19.
Figure 19: The effect of membrane action of yield load due to deflections and steel ratio (Kemp 1967)
t is the slab reinforcement ratio.
Figure 19 shows no deflection before reaching the simple yield line theory collapse
load. The reason for this is the assumed rigid perfectly plastic behaviour of the slab.
However, such deflections before this stage appear in the experimental results. Kemp
argues that these theoretical yield loads are obtained as upper bound solutions.
Therefore, these theoretical values are conservative, where in reality the yield loads are
estimated to be larger than what is shown. This is due to the strain-hardening in the
reinforcement, until reaching a deflection value of wo/d1 =1, where d1 is the effective

Chapter 3- Previous Work on Tensile Membrane Action
34
depth of the slab. In practice, a collapse load is reached as the reinforcement in the
central region of the slab fractures, or when the concrete on the perimeter of the slab
crushes (Kemp 1967).
The benefits and shortcomings of Kemp's model are summaries as the following:
Benefits:
Kemp’s method presents the relationship between the slab deflection and the
load-enhancement. This relationship is key for the mechanics of tensile
membrane action at large deflection for future studies, including this thesis, as is
further discussed in Section 6.3.
Shortcomings:
Hayes (1968b) shows that the neutral axis depth of the slab affects the load
enhancement by only 2%. This means that the method is almost insensitive to
neutral axis depth.
Bailey (2001) shows that Kemp ignored the development of a large crack across
the short span of the slab, which leads to overestimating the enhancement factor.
Because of such shortcomings, especially ignoring the formation of full-depth cracks, a
new model was necessary as a replacement for Kemp’s model of square slabs, in
addition to addressing rectangular slabs. Hayes (1968 a&b), Bailey (2001) and Burgess
et al. (2014) corrected this and took the formation of full-depth cracks into
consideration. As an extension of the method that was established by Burgess et al.
(2014), this study also takes the full-depth cracks into consideration, as is further
discussed in Chapter 6.
3.3 Brian Hayes, 1968
3.3.1 TMA for square slabs
Hayes (1968a) presents an equilibrium based method to examine the tensile membrane
action, TMA, for concrete slabs. The assumptions that are considered in Hayes' method
include the following:
1. Square and rectangular reinforced concrete slabs are considered.

Chapter 3- Previous Work on Tensile Membrane Action
35
2. The slab is considered simply-supported along its four edges.
3. Reinforcement is considered at yield stress in this model.
4. The equilibrium method is assumed for this model, based on yield-line theory.
5. Plastic analysis at large deflections is assumed.
6. Cracks across the short span of the slab at the intersections of the yield-lines are
assumed as the main failure mode of the slab.
7. Compression is confined to a peripheral ring around the central region of the
slab with triangular compressive stress blocks at large deflections.
The collapse pattern that of the slab that was considered by Hayes (1968a) is shown in
Figure 20.
Figure 20: Diagonal collapse pattern of a simply supported slab (Hayes 1968a)
At large deflections, internal slab strips, as the strip X as illustrated in Figure 20, tend to
move inward. However, the strips on the edge of the slab, like the strip Y, do not deflect
due to their being supported. Therefore, these supported strips do not move inward.
Within reinforced concrete slabs, the adjacent strips of the two kinds (i.e. X and Y

Chapter 3- Previous Work on Tensile Membrane Action
36
strips) interact as the slab deflects; leading to tensile stresses in the internal strips, and
compression stresses in the edge strips. Eventually, tensile net is generated at the centre
of the slab, and a compression ring appears around it. This membrane action is added to
the flexural stresses. However, at large deflections pure tension is generated across the
depth of the slab at its central region.
Hayes (1968a) argues that this mechanism can be developed in both square and
rectangular slabs. Hayes argues that the triangular part (i.e. the triangular slab element)
of a square slab which is collapsing in a diagonal yield-line pattern acts as a deep beam
which is relatively strong in resisting the in-plane bending. However, in isolated
rectangular slabs, the bigger the aspect ratio is (i.e. the longer the rigid part) the weaker
its resistance to the in-plane bending action. This is illustrated in Figure 21.
Figure 21: TMA in square and rectangular slabs (Hayes 1968a)
Hayes (1968a) observed from previous tests on slabs that excessive loads which go
beyond the predictions of the simple yield-line theory can be supported. Hayes’ study is
based on a proposition made by Taylor (1965), that the load carrying capacity could be
determined by allowing the increase in the reinforcement effective depth which results
from the redistribution of the compression zone. This is illustrated in Figure 22.

Chapter 3- Previous Work on Tensile Membrane Action
37
Figure 22: Development of TMA at large deflections (Hayes, 1968)
C is the total compressive membrane force.
L is the larger span of the slab
Figure 22 shows that the problem is based on the analysis of triangular compression
zones at the slab’s edges at large deflections. Hayes took Mattock & Kriz (1961)
approach to address this problem. Mattock & Kriz came up with two methods to analyse
sections with irregular compression zones. The first method used the same normal
assumptions of the ultimate load analysis of reinforced concrete sections. It was
programmed in computer software which calculated the ultimate strength of reinforced
sections with irregular compression zones. The second method used rectangular stress
zones for the analysis. By comparing both methods, Mattock and Kriz found that for
under-reinforced sections the difference between a rectangular stress zone and linear
approximations did not exceed 2% as a maximum. Hayes (1968a) argues that slab
sections are usually under-reinforced, so little difference is expected between the
methods that were presented by Mattock & Kriz (1961). Hayes also argues that
comparisons show that the British Standard Code of Practice (CP 114) parameters are
very similar and close to Mattock and Kriz’s rectangular stress zones parameters.
Hayes’ analysis of the development of TMA in square simply-supported reinforced
concrete slabs is based on the development of the compression zone through successive
stages as deflection increases. In the first stage, rectangular compression zones exist
during the zero-deflection state. The analysis then depend on the simple yield-line
Chapter 3- Previous Work on Tensile Membrane Action
38
theory and complied with the calculation of the ultimate moment of the section. In the
second stage, according to Hayes (1968a), the compression zone becomes triangular at
large deflections. Therefore, the whole reinforcement is at its yield stress. Hayes argues
that this is due to small strength-deflection characteristic at this stage. At the third stage,
the compression zone goes deeper until the reinforcement at the corner of the slab is
subjected to compression, hence it is prevented from reaching its yield stress. With the
compression zone reaching the soffit of the slab, the analysis ends. It is worth noting
that the intermediate stage between the first and the second stages, where the
compression zone is trapezoidal, is not considered in Hayes’ analysis. Figure 23
demonstrates the development of TMA through the three stages.

Chapter 3- Previous Work on Tensile Membrane Action
39
Figure 23: Tensile membrane stages (Hayes 1968a)

Chapter 3- Previous Work on Tensile Membrane Action
40
A here is merely a reference point.
dn is the concrete compression depth at zero deflection analysis.
h is the depth of the slab.
fy is the steel yield stress.
δ is a parameter fixing maximum reduction in the reinforcement stress.
γ is a parameter fixing the proportion of the reinforcement which does not attain
yield stress.
Hayes argues that at the third stage, the depth of the compression zone causes reduction
in the reinforcement force. This reduction, in turn, affects the area of the compression
zone. The enhancement of the load-carrying capacity is given by the ratio of k’/k1.
Where:
, for zero deflection analysis
, for tensile membrane analysis
This analysis was coded in computer software for the strength-deflection characteristic
purpose. This was carried out for simply-supported slabs. A deflection increase, in
increments of one tenth of the slab thickness was loaded to the program up to three
times the slab thickness in order to calculate the enhancements in load carrying
capacity, compared to the simple yield-line theory prediction. Presentation of the
analysis results is shown in Figure 24.
As Figure24 shows, the greatest enhancement corresponds to slabs with lightest
reinforcement. However, as Hayes explains, it should be noticed that for such lightly
reinforced concrete slabs, the steel force reduction does not occur. Hayes argues that the
enhancement due to membrane action is increased when the reinforcement is
concentrated towards the centre of the slab, compared to uniform reinforcement
spacing. The degree of such reinforcement concentration depends on the design method.
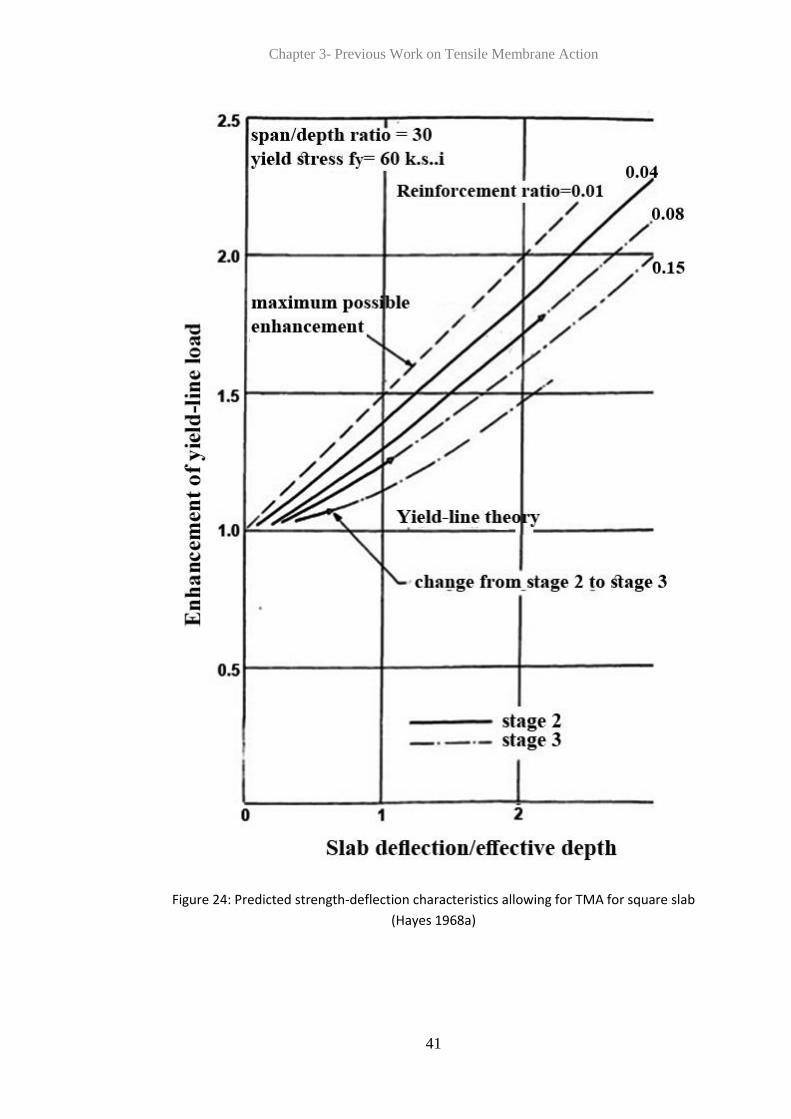
Chapter 3- Previous Work on Tensile Membrane Action
41
Figure 24: Predicted strength-deflection characteristics allowing for TMA for square slab
(Hayes 1968a)

Chapter 3- Previous Work on Tensile Membrane Action
42
3.3.2 TMA for rectangular slabs
Hayes (1968a) argues that, according to Kemp (1967), if the forces in a square slab
which are acting on the triangular elements of the slab are considered, then the
triangular elements are subjected to in-plane bending action. While this was
occasionally observed in square slabs, it could be generally realized in tests on
rectangular slabs. This in-plane bending action was discovered by Sawczuk & Winnicki
(1965), allowing the mobilization of tensile membrane action only due to the boundary
conditions. Sawczuk considers the isotropic reinforcement case only. This was extended
to cover orthotropic reinforcement in rectangular slabs by Hayes. Hayes argues that the
increase of strength compared to the yield line theory is proportional to deflection.
However, this increase becomes smaller as the coefficient of orthotropy and the aspect
ratio (i.e. the rectangularity) increase. Thus, Hayes (1968b) argues that in order to invest
in membrane action, high orthotropy coefficients are not desirable.
Hayes (1968a) established a new equilibrium method, considering a rectangular simply-
supported slab subjected to uniformly distributed loads. Rigid-plastic behaviour with
rigid rotations and translations are assumed. Whether the cracks are full-depth cracks
penetrating the upper surface of the slab, or not, is dependent on the stress distribution.
Figure 25 shows the stress distribution when there are no tension cracks penetrating the
upper surface of the slab.
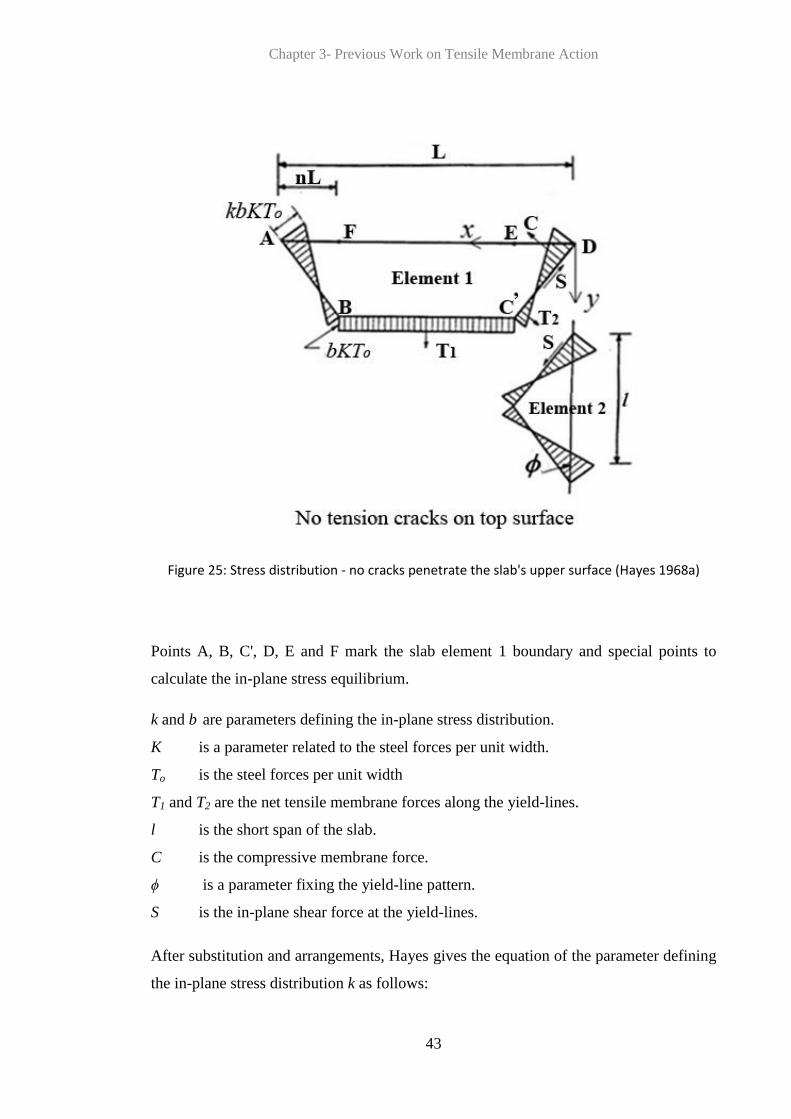
Chapter 3- Previous Work on Tensile Membrane Action
43
Figure 25: Stress distribution - no cracks penetrate the slab's upper surface (Hayes 1968a)
Points A, B, C', D, E and F mark the slab element 1 boundary and special points to
calculate the in-plane stress equilibrium.
k and b are parameters defining the in-plane stress distribution.
K is a parameter related to the steel forces per unit width.
To is the steel forces per unit width
T1 and T2 are the net tensile membrane forces along the yield-lines.
l is the short span of the slab.
C is the compressive membrane force.
ϕ is a parameter fixing the yield-line pattern.
S is the in-plane shear force at the yield-lines.
After substitution and arrangements, Hayes gives the equation of the parameter defining
the in-plane stress distribution k as follows:
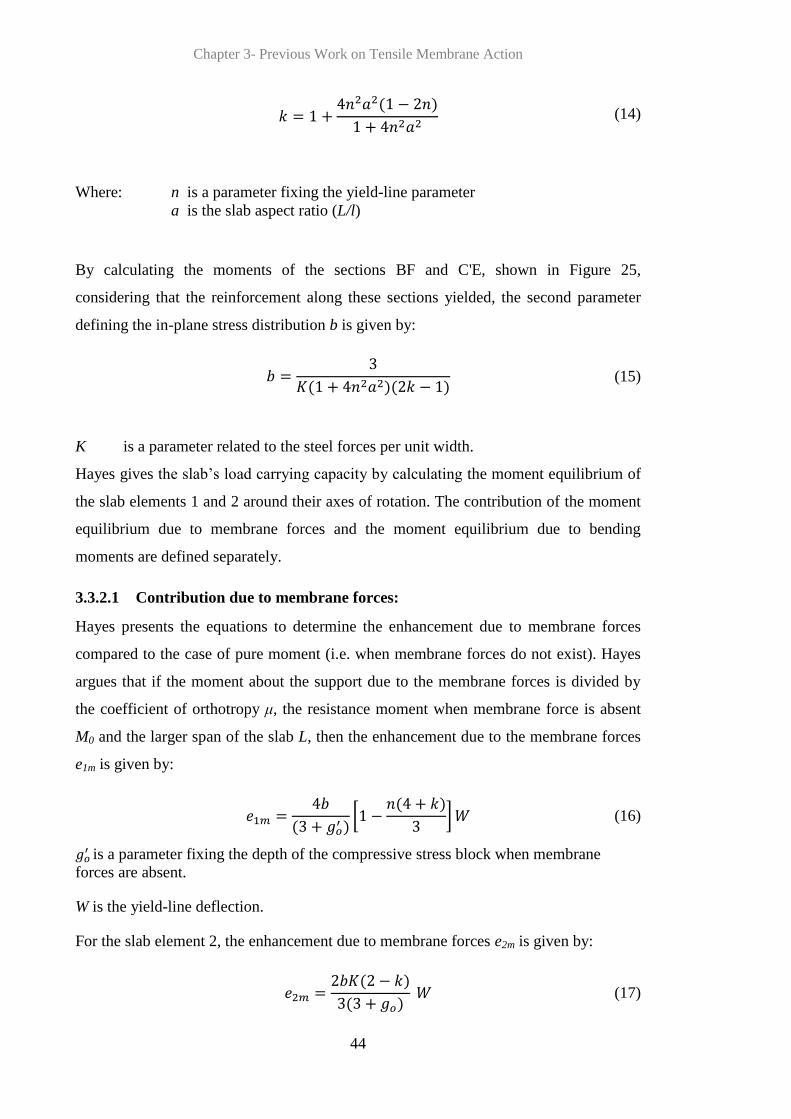
Chapter 3- Previous Work on Tensile Membrane Action
44
(14)
Where: n is a parameter fixing the yield-line parameter
a is the slab aspect ratio (L/l)
By calculating the moments of the sections BF and C'E, shown in Figure 25,
considering that the reinforcement along these sections yielded, the second parameter
defining the in-plane stress distribution b is given by:
(15)
K is a parameter related to the steel forces per unit width.
Hayes gives the slab’s load carrying capacity by calculating the moment equilibrium of
the slab elements 1 and 2 around their axes of rotation. The contribution of the moment
equilibrium due to membrane forces and the moment equilibrium due to bending
moments are defined separately.
3.3.2.1 Contribution due to membrane forces:
Hayes presents the equations to determine the enhancement due to membrane forces
compared to the case of pure moment (i.e. when membrane forces do not exist). Hayes
argues that if the moment about the support due to the membrane forces is divided by
the coefficient of orthotropy μ, the resistance moment when membrane force is absent
M0 and the larger span of the slab L, then the enhancement due to the membrane forces
e1m is given by:
(16)
is a parameter fixing the depth of the compressive stress block when membrane
forces are absent.
W is the yield-line deflection.
For the slab element 2, the enhancement due to membrane forces e2m is given by:
(17)

Chapter 3- Previous Work on Tensile Membrane Action
45
is a parameter fixing the depth of the compressive stress block when membrane
forces are absent.
3.3.2.2 Contribution due to bending moments:
Hayes presents an approach similarly to what was presented by Wood (1961). The full
derivation is not presented here. For the slab element 1, the enhancement due to bending
moments e1b is given by:
(18)
A' and B' are parameters in the yield-line criterion. They are given by:
For the slab element 2, the enhancement due to bending moments e2b is given by:
(19)
A and B are parameters in the yield-line criterion. They are given by:
Thus, the ultimate enhancements of combined membrane forces and bending moments
e1 , for the slab element 1, and e2 for the slab element 2, are given by:
e1 = e1m + e1b (20)
e2 = e2m + e2b (21)

Chapter 3- Previous Work on Tensile Membrane Action
46
In the case of cracks penetrating the upper surface of the slab (i.e. full-depth cracks) a
similar approach is taken in order to determine the in-plane stress distribution. Hayes
gives the relations for the full-depth cracks case as follows:
(22)
v is a parameter fixing the extent of the central membrane.
(23)
(24)
(25)
Figure 26 shows the stress distribution when cracks penetrate the upper face of the slab.

Chapter 3- Previous Work on Tensile Membrane Action
47
Figure 26: Stress distribution – cracks penetrate the slab’s upper surface (Hayes 1968a)
The benefits and shortcomings of the method that was established by Hayes (1968a) can
be summarised as follows:
Benefits:
Hayes presented an equilibrium method which takes into account the formation
of cracks across the short span of the slab in the central region. This was an
improvement of Kemp’s model by taking into account the formation of the
cracks through the surface of the slab.
Shortcomings:
The failure mode which is adopted as the main mode by Hayes contradicts test
observations. This is evident when compared to the BRE ambient-temperature
test. This is based on the same wrong assumption that was made by Sawczuk.

Chapter 3- Previous Work on Tensile Membrane Action
48
The rectangular slab model is handled as a deep beam, assuming that any slab
cross-section is in equilibrium in the same way as a beam. This is wrong since a
slab is in equilibrium as a whole, not at every arbitrary slice taken from the slab.
The tension force along the diagonal yield-lines varies linearly with distance as
it appeared in the equilibrium figures. This contradicts the assumed plasticity of
this model. It also implies that the slab does not crack along the diagonal yield-
lines, in contrast to what Hayes assumed in the analysis.
The orthotropic reinforcement solution is wrong at large deflections. At large
deflections, the orthotropy results in two different neutral axis depths for the
same section of the slab in the x and y directions. This means that the same
section has two different concrete contact zones in the x and y directions. This is
intuitively wrong.
Two incompatible enhancement components (i.e. bending and membrane
actions) are irrationally added in a single final enhancement factor without
justifying the process.
The enhancement which results from slab element 1 is not equal to the
enhancement from slab element 2. This is due to the wrong equilibrium
assumption which was taken from the beginning of the calculations.
Hayes’ model was a development of the load enhancement calculations of square and
rectangular slabs. However, since Hayes’ method adopts the wrong mode of failure, and
wrong equilibrium assumptions (i.e. the wrong in-plane stress distribution) a new model
which corrects these shortcomings was necessary. A correction of Hayes’ model was
presented by Bailey & Moore (2000a). The method is known as the Bailey-BRE method
which is widely used today.
3.4 The Bailey-BRE method
3.4.1 Initial method by Bailey & Moore
Based on a similar equilibrium to the one that Hayes (1968b) took, Bailey & Moore
(2000 a&b) presents a new simplified method to calculate the resistance of lightly
composite slabs in fire. The simplified method is based on the membrane action to
calculate the load enhancement of slabs at high deflections. The method is currently

Chapter 3- Previous Work on Tensile Membrane Action
49
used in the fire design guides in the UK, Europe (Vassart & Zhao 2011) and New
Zealand. Bailey developed the method through follow-up publications. The method is
briefly discussed in this chapter through the original and the follow-up papers.
The assumptions that are considered for this method include the following:
1. Equilibrium method based on the yield-line theory is assumed.
2. Reinforcement is at ultimate stress which is 1.1fy instead of the yield stress fy as
Hayes assumed.
3. Unlike Hayes and Sawczuk, Bailey considers a failure mode of the slab which
includes a crack at the centre of the slab across the short span.
4. Rigid plastic behaviour is assumed in the analysis.
5. The slab is divided into panels; each of which are bounded by protected steel
beams, while the internal secondary beams were left unprotected.
6. Slab panels are horizontally unrestrained.
7. Perfect vertical support along the primary beams is assumed.
8. Full connection between the beam and the slab through shear studs is assumed.
9. In elevated-temperature analysis, the slab is heated across its cross-section with
a linear temperature gradient.
The design method presented by Bailey & Moore (2000a) divides the slab into multiple
panels. Each panel is bounded by protected steel beams on the perimeter, while the
other steel beams within the panel were left unprotected, as shown in Figure 27. Each
slab panel utilises membrane action, taking into consideration the elevated temperatures
of the slab. The contribution of the steel deck under the slab is ignored. This is justified
since the deck detaches from the bottom of the slab in fire conditions because of the
steam released as the temperature increases. The method assumes that each panel is
horizontally unrestrained. This assumption is based on observations from the
Cardington fire tests, where it was found that the reinforcement at the protected-
peripheral beams fractures at early stages because of the high hogging moments at the
perimeter of each panel.

Chapter 3- Previous Work on Tensile Membrane Action
50
Figure 27: Division of the floor into slab panels
Bailey (2001) argues that both the energy method developed by Sawczuk & Winnicki
(1965) and the equilibrium method presented by Hayes (1968b) were based on the
assumption that the critical failure mode was caused by the formation of full-depth
cracks across the short span of the slab at the intersection of the yield lines. According
to Bailey, this assumption contradicts test observations, especially the BRE ambient
temperature test. Therefore, Bailey & Moore (2000a) developed a new method to
estimate the membrane behaviour of a simply supported concrete slab.
Assuming a rigid plastic behaviour, with a crack forming across the short span of the
slab, the distribution of the in-plane stress is shown in Figure 28.
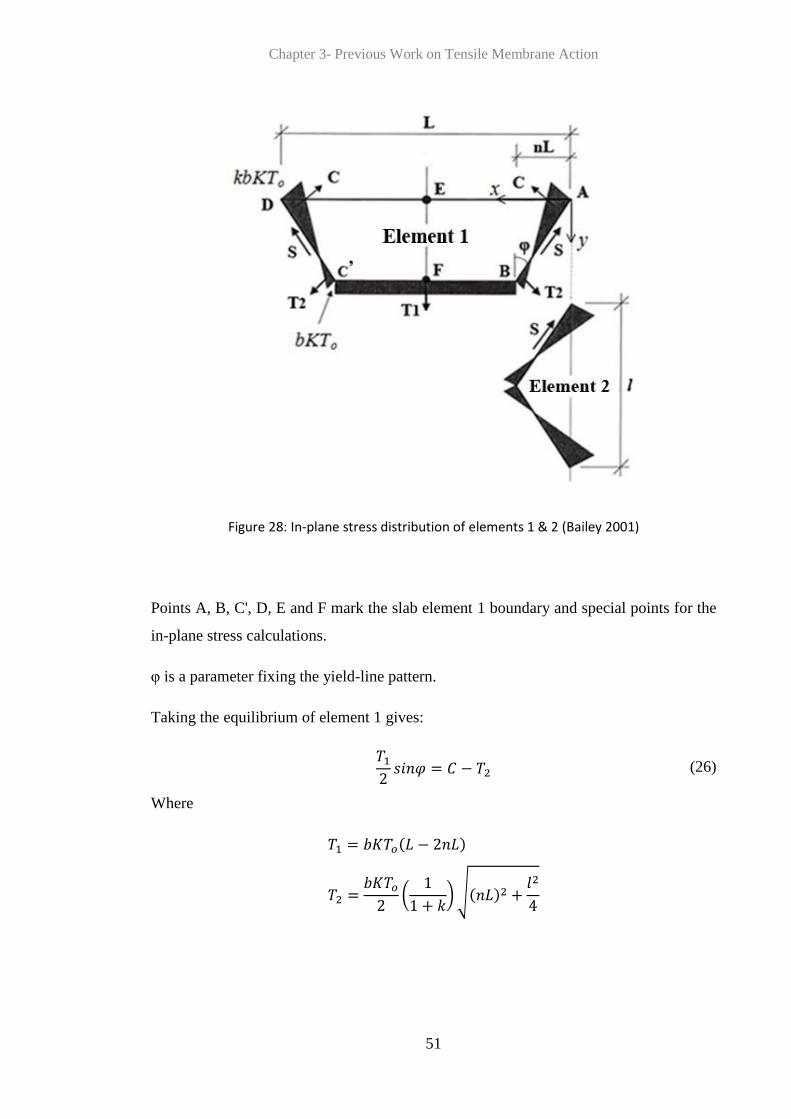
Chapter 3- Previous Work on Tensile Membrane Action
51
Figure 28: In-plane stress distribution of elements 1 & 2 (Bailey 2001)
Points A, B, C', D, E and F mark the slab element 1 boundary and special points for the
in-plane stress calculations.
φ is a parameter fixing the yield-line pattern.
Taking the equilibrium of element 1 gives:
(26)
Where

Chapter 3- Previous Work on Tensile Membrane Action
52
Bailey (2001) calculates the in-plane moment of resistance along the line EF at the
centre of the slab, shown in Figure 28, assuming that the full-depth crack appears at the
centre. This is different than Hayes (1968a) who estimates the moment of resistance
along the intersection of the yield-lines. Furthermore, while Hayes (1968a) assumes that
the reinforcement at the sections passing through the yield-lines intersection points
yielded, Bailey considers that the reinforcement along the line EF is at ultimate stress
with a value of fu = 1.1.fy. Bailey (2001) argues that this assumption is reasonable since
the mode of failure here was the fracture of the reinforcement.
By estimating the moments, Bailey’s calculations give the value of b. Bailey (2001)
calculates the enhancement of the slab as a combination of enhancement factors due to
the membrane forces and bending resistance. The rationality behind combining these
dependent components is further discussed in Section 3.5. By dividing the contribution
of each of the membrane forces and bending in the total enhancement, on the yield-line
load-carrying capacity, the enhancement of the slab is obtained. Thus, the enhancement
factor due to membrane forces for element 1 e1m is given by:
(27)
M1m is the moment about the slab supports due to membrane forces in element 1. It is
given by:
(28)
The resistance moment when membrane force is absent M0 is given by:
(29)
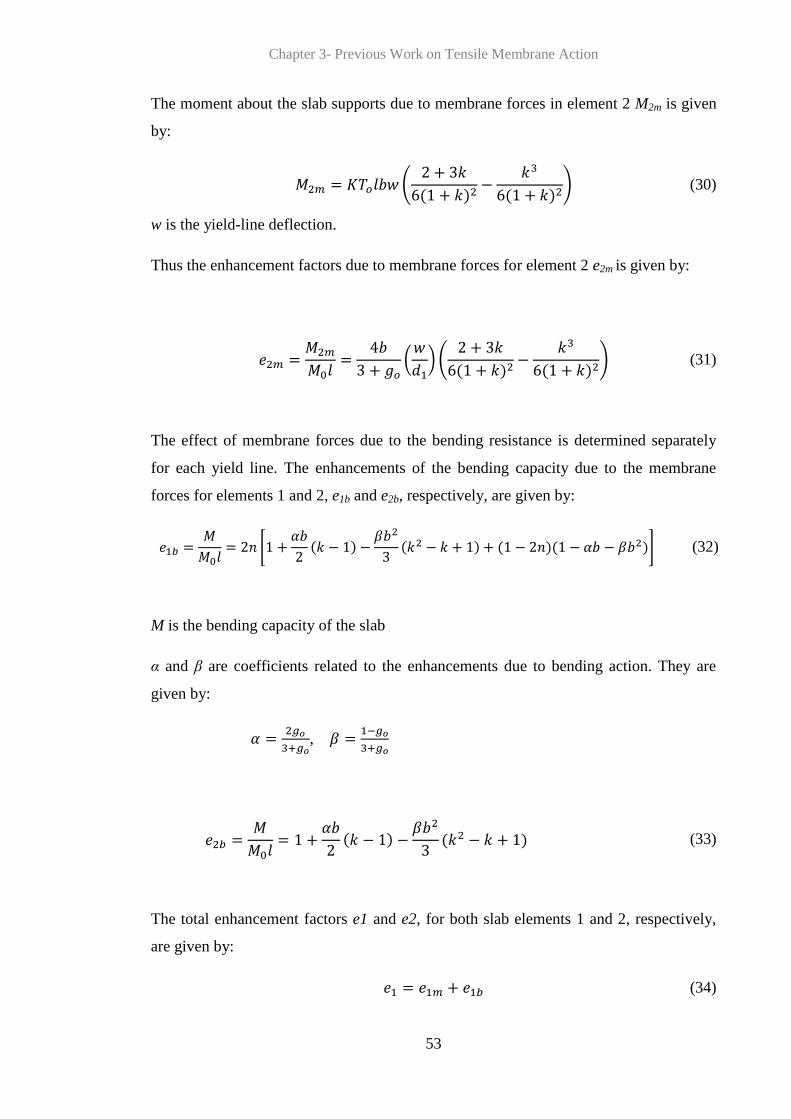
Chapter 3- Previous Work on Tensile Membrane Action
53
The moment about the slab supports due to membrane forces in element 2 M2m is given
by:
(30)
w is the yield-line deflection.
Thus the enhancement factors due to membrane forces for element 2 e2m is given by:
(31)
The effect of membrane forces due to the bending resistance is determined separately
for each yield line. The enhancements of the bending capacity due to the membrane
forces for elements 1 and 2, e1b and e2b, respectively, are given by:
(32)
M is the bending capacity of the slab
α and β are coefficients related to the enhancements due to bending action. They are
given by:
,
(33)
The total enhancement factors e1 and e2, for both slab elements 1 and 2, respectively,
are given by:
(34)

Chapter 3- Previous Work on Tensile Membrane Action
54
(35)
The total enhancements of elements 1 and 2, taking into consideration both the
membrane forces and bending capacity, are not the same. As Hayes (1968b) explains,
this difference between the enhancements of both elements is due to the shear effect
whether it is the vertical or in-plane shear. Thus, Bailey (2001) takes an averaging
enhancement which represented the total enhancement of the slab as follows:
(36)
Figures 29-32 show comparisons between the enhancement factors given by Bailey’s,
Sawczuk’s and Hayes’ methods against the displacement/effective depth of the slab for
different aspect ratios. Both of Sawczuk's failure modes (crack at centre of the slab and
crack at intersection of yield lines) are considered in this comparison. Note that the
parameter fixing the depth of the compressive stress block when no membrane action
exists go is the same for all the comparisons here.
Figure 29: Comparison between Sawczuk's, Hayes' and Bailey's methods with slab’s aspect ratio of 3.0 (Bailey 2001)
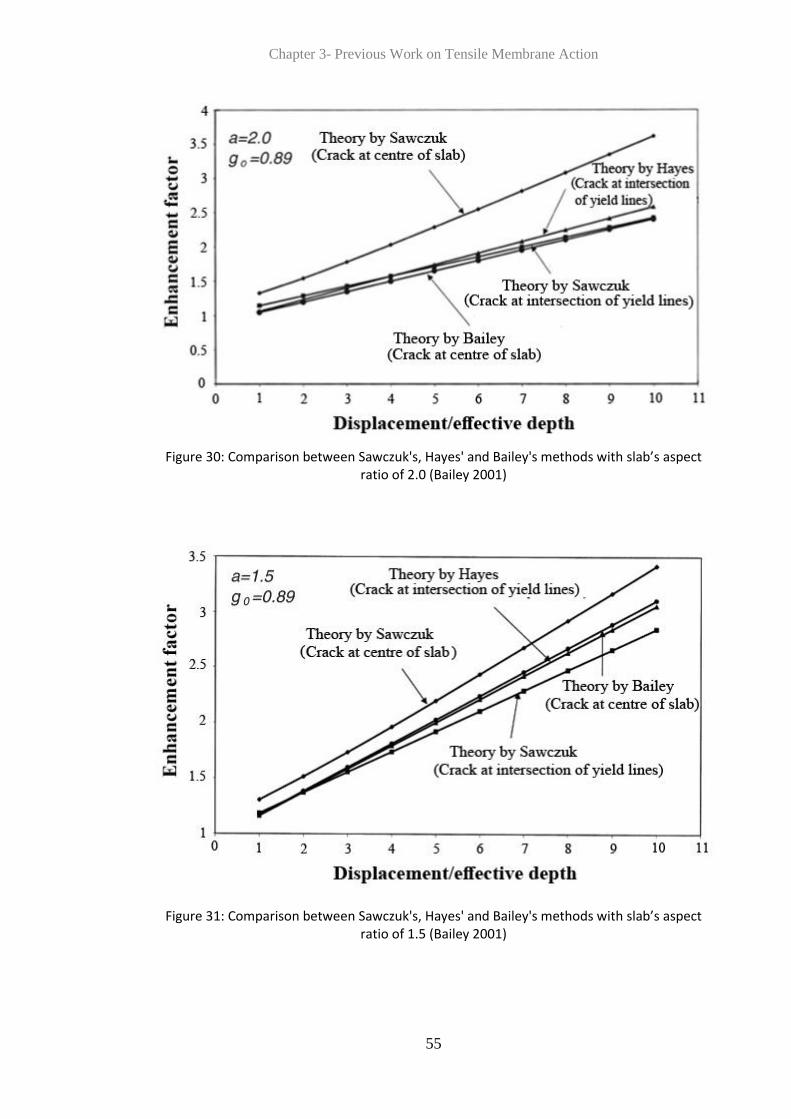
Chapter 3- Previous Work on Tensile Membrane Action
55
Figure 30: Comparison between Sawczuk's, Hayes' and Bailey's methods with slab’s aspect ratio of 2.0 (Bailey 2001)
Figure 31: Comparison between Sawczuk's, Hayes' and Bailey's methods with slab’s aspect ratio of 1.5 (Bailey 2001)
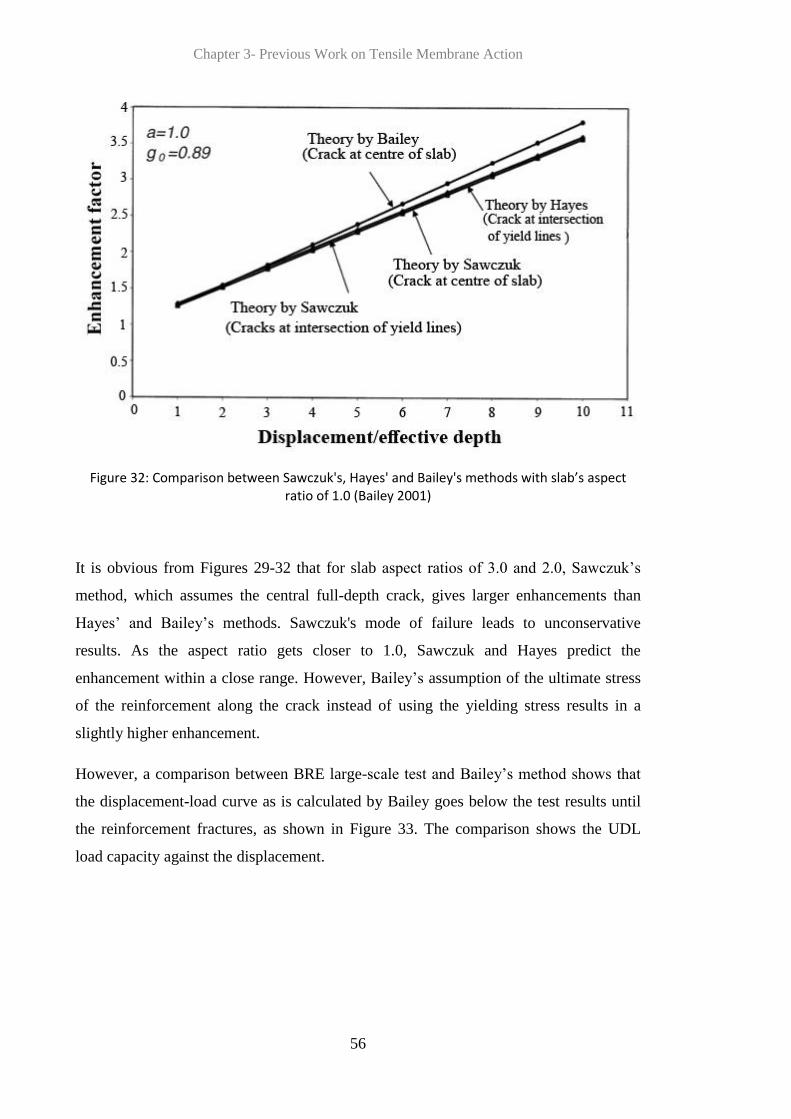
Chapter 3- Previous Work on Tensile Membrane Action
56
Figure 32: Comparison between Sawczuk's, Hayes' and Bailey's methods with slab’s aspect ratio of 1.0 (Bailey 2001)
It is obvious from Figures 29-32 that for slab aspect ratios of 3.0 and 2.0, Sawczuk’s
method, which assumes the central full-depth crack, gives larger enhancements than
Hayes’ and Bailey’s methods. Sawczuk's mode of failure leads to unconservative
results. As the aspect ratio gets closer to 1.0, Sawczuk and Hayes predict the
enhancement within a close range. However, Bailey’s assumption of the ultimate stress
of the reinforcement along the crack instead of using the yielding stress results in a
slightly higher enhancement.
However, a comparison between BRE large-scale test and Bailey’s method shows that
the displacement-load curve as is calculated by Bailey goes below the test results until
the reinforcement fractures, as shown in Figure 33. The comparison shows the UDL
load capacity against the displacement.

Chapter 3- Previous Work on Tensile Membrane Action
57
Figure 33: Comparison between BRE large-scale test and Bailey's method (Bailey 2001)
3.4.2 Tensile membrane action of orthotropic reinforced slabs
Bailey (2003) extended the simplified method in order to consider both isotropic and
orthotropic reinforcement, since the previous version of the method considered isotropic
reinforcement only.
The full derivation of Bailey’s extended method is not presented in this thesis since it is
mostly identical to the previous derivation presented in Section 3.4.1, with few
modifications to take the orthotropy into account. In Equations 27 & 31, determining
the enhancement factors presented in Section 3.4.1, go takes two values (i.e. (go)1 and
(go)2 for e1m and e1m, respectively), to account for the different reinforcement ratio in the
x and y directions. The effective depth of the reinforcement takes two values: d1 and d2,
representing the different depths of the reinforcement meshes in each direction. The
moment resistance M0 when no axial force exists is multiplied by the coefficient of
orthotropy μ in one direction, depending on the reinforcement distribution and
arrangement in each direction.
Bailey (2003) compares his method against tests conducted by Hayes & Taylor (1969).
In these tests, the reinforcement ratio was increased in the short span, but decreased in

Chapter 3- Previous Work on Tensile Membrane Action
58
the long span. From the tests results, Bailey observed the reduction of the maximum
load due to membrane action as the coefficient of orthotropy μ increased. This implies
that increasing the reinforcement on the short span, relatively to the reinforcement on
the long span, reduces the effect of the membrane action. Bailey considers this
observation consistent with his analytical method which emphasizes the influence of
increasing the reinforcement along the longer span on the membrane action effect, and
in turn, on the overall load capacity of the slab. Bailey checked this point on slabs with
different aspect ratios. The comparison shows that this is true for rectangular slabs with
an aspect ratio up to 3.0. The comparison shows that for aspect ratios of 2.0 or 3.0, the
load carrying capacity due to the flexural behaviour decreases with lower orthotropy
coefficient μ, while the load carrying capacity due to membrane action increases as μ
decreases and therefore dominates the overall load-carrying capacity of the slab.
However, for slabs with aspect ratios of 4.0 or 5.0, the reduction of the load-carrying
capacity due to the flexural behaviour overrides as μ decreases; therefore, the total load-
carrying capacity of the slab due to both membrane action & flexural behaviour
decreases as μ decreases. The comparison is shown in Figure 34. The most effective
orthotropy coefficient for slabs is highlighted in bold black for each aspect-ratio case.
Note that when μ=1, the reinforcement is isotropic. μ >1 means that more reinforcement
was placed in the shorted span of the slab. Finally, μ <1 means that more reinforcement
was placed in the longer span of the slab.
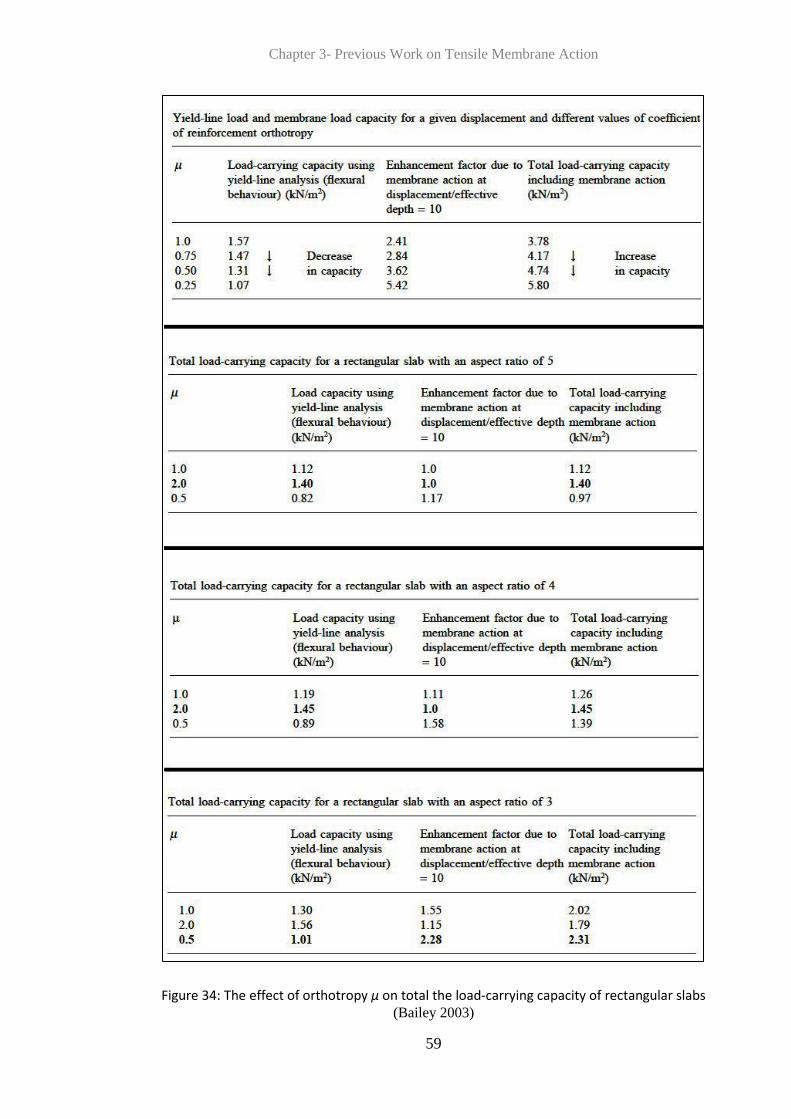
Chapter 3- Previous Work on Tensile Membrane Action
59
Figure 34: The effect of orthotropy μ on total the load-carrying capacity of rectangular slabs (Bailey 2003)
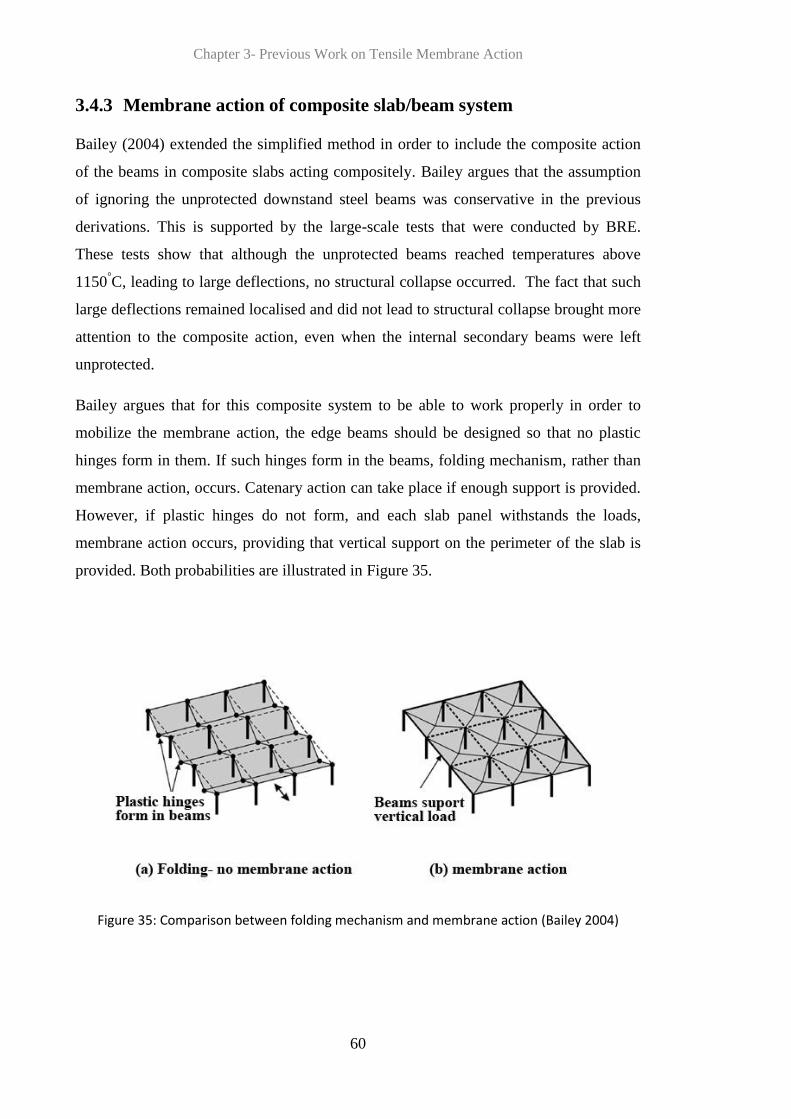
Chapter 3- Previous Work on Tensile Membrane Action
60
3.4.3 Membrane action of composite slab/beam system
Bailey (2004) extended the simplified method in order to include the composite action
of the beams in composite slabs acting compositely. Bailey argues that the assumption
of ignoring the unprotected downstand steel beams was conservative in the previous
derivations. This is supported by the large-scale tests that were conducted by BRE.
These tests show that although the unprotected beams reached temperatures above
1150°C, leading to large deflections, no structural collapse occurred. The fact that such
large deflections remained localised and did not lead to structural collapse brought more
attention to the composite action, even when the internal secondary beams were left
unprotected.
Bailey argues that for this composite system to be able to work properly in order to
mobilize the membrane action, the edge beams should be designed so that no plastic
hinges form in them. If such hinges form in the beams, folding mechanism, rather than
membrane action, occurs. Catenary action can take place if enough support is provided.
However, if plastic hinges do not form, and each slab panel withstands the loads,
membrane action occurs, providing that vertical support on the perimeter of the slab is
provided. Both probabilities are illustrated in Figure 35.
Figure 35: Comparison between folding mechanism and membrane action (Bailey 2004)

Chapter 3- Previous Work on Tensile Membrane Action
61
Bailey (2004) uses the same principles that were used in the previous derivations by
Bailey & Moore (2000a), so that the slab is divided into panels as shown in Figure 36.
On the perimeter, the primary edge beams are fire-protected in order to provide the
vertical support; while the internal secondary beams were left unprotected. During fire,
when membrane action is mobilized, loads are transferred from the internal unprotected
beams towards the protected primary beams.
Figure 36: Mobilization of membrane action within slab panels (Bailey 2004)
Bailey (2004) argues that the vertical support, which is provided by the peripheral
primary beams, is essential for the mobilization of the membrane action. This is
important in case that the slab is horizontally unrestrained; therefore the required
anchorage should be provided by the compressive membrane action on the perimeter of
the slab, which is provided by this vertical support on the perimeter. The horizontal
unrestraint of the slab panels might be neutralized when the slab is adjacent to
surrounding buildings which provide the horizontal restraint. It can even be assumed
that the slab is horizontally restrained since the reinforcement is continuous over the
protected beams. However, Bailey argues that the large hogging moments at the
peripheral supporting beams cause the reinforcement to fracture along the perimeter of
the slab, thus this horizontal restraint is lost. Therefore, the conservative assumption of

Chapter 3- Previous Work on Tensile Membrane Action
62
the fractured reinforcement along the edges (i.e. isolated panels) is considered (Bailey
2004).
Bailey describes the load-carrying system in composite slabs under fire, considering a
one-way slab with one downstand beam. As temperatures rise, the unprotected steel
beam loses strength and stiffness until a plastic hinge forms in it. A fan-type yield line
pattern appears and directs loads away from the centre, towards the vertically supported
edges of the slab. With further temperature increase, a travelling hinge forms in the
beam until it [the beam] cannot take any further loads. At this moment, the slab fully
supports the loads in a typical envelope yield line pattern. As the yield line pattern
forms, membrane action develops as the deflection increases further.
Bailey expressed the load carrying capacity for a slab/beam system wp as follows:
(37)
Where esys is the enhancement of the slab-beam system due to membrane action.
Equation 37 assumes full connection between the slab and the beam. Thus, it is assumes
that all tensile forces that were mobilized by the beam are transferred to the slab. These
tensile forces are balanced by the compressive membrane forces ring on the perimeter
of the slab.
The enhancement factors for elements 1 and 2 due to membrane action for the
slab/beam system e1m and e2m are given by:
(38)
(39)
Mfi is the moment capacity of the steel beam at elevated temperatures.

Chapter 3- Previous Work on Tensile Membrane Action
63
Taking into account that a downstand steel beam exists, M2m is given by:
(40)
Tb is the tensile capacity of the steel beam at elevated temperatures.
The enhancement factors for elements 1 and 2 due to flexural behaviour for the
slab/beam system e1b and e2b are given by:
(41)
(42)
As it was considered by Bailey, recalling Equations 34 to 36, the enhancement factors
for elements 1 and 2 due to bending and membrane action are given by:
The total averaging enhancement factor esys, for both slab elements 1 and 2, is given by:
The catenary capacity of the unprotected steel beam is taken into account by Bailey
(2004) , and no longer ignored as previously done. The membrane action becomes
related to the deflected slab shape which is defined by the continuously-changing yield-
line pattern.
The benefits and shortcomings of the Bailey-BRE method can be summarised as
follows:

Chapter 3- Previous Work on Tensile Membrane Action
64
Benefits:
It is the first method to address composite slabs including the slab/beam system.
The failure mode which is adopted in this method correlates to the test
observations (i.e. the BRE ambient-temperature test).
Shortcomings:
Inherited from Hayes’ model, the equilibrium of the slab is assumed as the
equilibrium of a deep beam. This is illogical.
Like Hayes, two incompatible enhancement components (i.e. bending and
membrane actions) are illogically added to give a single enhancement factor.
The equilibrium of the method is based on a linear distribution of tension force
along the diagonal yield-lines, similar to Hayes’ method. However, even when
Bailey & Toh (2007) presented a more realistic in-plane stress distribution, this
did not result in a tangible change (Burgess et al. 2012).
The averaging enhancement factor equation, which combines the enhancements
from slab elements 1 and 2, ignores the effect of the vertical shear force. This
leads to an incorrect prediction of the total enhancement.
The method cannot predict reinforcement fracture. Therefore it is necessary to
set a conservative deflection limit.
The deflection limit set by Bailey is given as a combination of two incompatible
components (i.e. thermal bowing of the slab and deflection of the slab). This is
illogical. Mechanics-wise, the first component is based on a simply supported
beam, while the second component is based on a beam which is fixed at both its
ends. These components are simply added in the method, with no rational
justification of such an illogical process.
The method does not take the reinforcement ductility into account, although the
reinforcement ductility is key as the bars fracture.
Checks by Abu & Burgess (2010) show that the Bailey-BRE method is
conservative when low reinforcement ratio is used. However, a marginal
reinforcement ratio increase leads to a large enhancement and the method then
overestimates the slab's load-carrying capacity.

Chapter 3- Previous Work on Tensile Membrane Action
65
The loss of vertical support of the primary beams is ignored. The vertical
support of the primary beams should be taken into account to avoid unrealistic
enhancements.
Bailey corrected the mode of failure that Hayes used in his model. A more realistic in-
plane stress distribution was presented by Bailey & Toh (2007). However, the
shortcomings still exist and it was necessary to established a new method in order to
address the limitations of the Bailey-BRE method and keep the predicted enhancement
reasonable. The method that was established by Burgess et al. (2014), in addition to this
study, considered a similar equilibrium assumptions to the Bailey-BRE method, but
with different kinematic assumptions, as is further discussed in Sections 5.3 and 6.3.
3.5 The necessity of a new alternative simplified method
The existing simplified method which was presented by Bailey & Moore (2000 a&b) is
widely used in the UK in practical structural fire engineering design. In Europe, the
project FRACOF (Vassart & Zhao 2011) extended this method resulting in a design
guide similar to the one used in the United Kingdom. However, the existing simplified
method has shortcomings which lead to inaccurate results that differ from the slabs'
behaviour in reality.
Firstly, the existing method assumes that the vertical support along the edges of the
slab, which is provided by the fire-protected primary beams, is ideal without reduction
in fire conditions. Bailey (2004) argues that if the peripheral protected beams are
designed so that no plastic hinges form in them, then membrane action can occur. This
assumes that this vertical support can be maintained, ignoring the fact that when the
temperature of the protected steel beams reaches the beams limit temperature, these
beams start to lose capacity and deflect under the effect of the imposed loads. This leads
to probable folding mechanism which decreases the mobilization of tensile membrane
action. Thus, assuming that the vertical support remains ideal at all times in fire
conditions is invalid. Having the vertical support condition partially lost transfers the
slab’s two-way bending, which is a one of the essential requirements for the
mobilization of tensile membrane action, to one-way bending mechanism. This means
that the slab fails in sagging without effectively mobilizing tensile membrane action
(Burgess et al. 2012). Ignoring this fact leads to unrealistically optimistic designs.

Chapter 3- Previous Work on Tensile Membrane Action
66
Secondly, the capacity enhancement in the existing method is calculated due to two
independent components: 1. bending enhancement; 2. tensile membrane action
enhancement. These two enhancements are then irrationally merged into a single
enhancement factor by simply adding them together, without justifying the rationality
behind this process. The capacity enhancement of the slab cannot be merely the sum of
two independent components in the way it is presented in the Bailey-BRE method.
Thirdly, Abu & Burgess (2010) show by, comparing to finite-element analysis, that the
Bailey-BRE method leads to over-conservative designs when lower reinforcement size
is used. On the other hand, the method leads to unrealistically significant enhancement
by a marginal increase of the reinforcement ratio. Burgess et al. (2012) present a more
detailed study, which was conducted using finite-element analysis using Vulcan
software, on the effect of reinforcement ratio on composite slabs behaviour in fire. The
authors show that even after the developed method which was presented by Bailey &
Toh (2007), a marginal increase in the reinforcement ratio leads to an optimistic yield-
line capacity enhancement. Compared to the finite-element results, the simplified
method was found to be conservative when using A142 and A193 meshes, but
unconservative when using larger mesh sizes. Burgess et al. (2012) argue that this
disproportionate increase of the calculated capacity when using large mesh sizes is due
to ignoring the stability loss of the protected beams. Therefore, this unconservative
design is intuitively seen in slabs with large spans, since such large slabs require larger
mesh sizes.
Fourthly, the Bailey-BRE method cannot predict the real deflection at which
reinforcement fracture or concrete crushing actually occurs (Bailey & Toh 2007).
Therefore the method considers a deflection limit wlim in order to avoid integrity failure.
This limit is given by:
(43)
αT is the coefficient of thermal expansion of concrete
Ttop is the temperature at the slab bottom surface
Tbot is the temperature at the slab top surface
E is the elastic modulus of the reinforcement

Chapter 3- Previous Work on Tensile Membrane Action
67
The first term of Equation 43 represents the thermal bowing of the slab, where a linear
temperature gradient is assumed across the slab’s depth, assuming that the slab is heated
from its bottom surface. The second term of the equation represents the resulted
deflection of the slab when applying a 50% reinforcement mechanical strain at ambient
temperature (20ºC) along the longer span L. These two components of deflection are
irrationally summed, ignoring the fact that they represent two incompatible components
of deflection.
Furthermore, the second component of the Equation 43 uses an elastic modulus of
reinforcement to calculate the mechanical strain. Using the elastic modulus results in
conservative elastic deflection limits that the slab can definitely go beyond in fire
conditions when tensile membrane action is being mobilized.
All these factors lead to inaccuracies in various cases, leading to conservative or
optimistic designs.
Burgess et al. (2013) present an alternative simplified method of tensile membrane
action of thin concrete flat slabs, which is based on the yield-line theory. It uses the
same yield-line pattern which is used by Bailey & Moore (2000a), however, with
different kinematic assumptions. This alternative simplified method shows that the
Bailey-BRE method can lead to over-estimated enhancement. Burgess et al. (2014)
presents a re-examination of the mechanics of tensile membrane action of thin-flat
concrete slabs at large deflections. The analysis of the re-examination starts from the
initial yield-line capacity, allowing monitoring the changes in the stress patterns along
the yield-lines. It also monitors the formation of cracks over the slab, up to the loss of
the slab's load capacity. The alternative simplified method and the re-examination of
tensile membrane action accounts for flat slabs enhancements at ambient temperature.
This thesis presents an extension of the alternative simplified method and the re-
examination of the mechanics of TMA, in order to include composite slabs in fire.
Based on the yield-line theory, this study considers the equilibrium of the forces over
the slab, in order to work out the internal work dissipated by the slab at large deflections
and high temperatures.

Chapter 4- The Theory and Principles Behind this Study
68
4 The Theory and Principles Behind this Study
4.1 Assumptions
The new mechanics of tensile membrane action of composite slabs is based on the yield
line theory, starting from small-deflection analysis, followed by large-deflection plastic
analysis. This is justified since weakly-reinforced slabs, such as composite slabs, do not
show tension stiffening; hence such slabs crack along the yield-lines after the latter
formed. Since it is highly unlikely that the yield-line pattern changes after it formed, the
large-deflection analysis can be safely implemented following the small-deflection
analysis. In other words, the formation of the yield-line pattern marks the end of the
small-deflection phase, establishing for the large-deflection phase if any further
deflection is experienced.
The slab which is considered in this study is a rectangular composite slab with an aspect
ratio r, vertically supported along its four edges by fire-protected primary beams.
Within the slab, a single secondary beam exists along the long span of the slab. This
single secondary beam was left unprotected. The slab is reinforced by isotropic
reinforcement in the x and y directions. Both reinforcement layers of the mesh are
assumed to be at the mid-depth of the slab. The slab is considered isolated, although the
mechanism is not limited to this condition. The mesh reinforcement bars are assumed to
be welded, forming anchorage points for the reinforcement. The slab is vertically loaded
over its surface by a uniform load which remained constant during the analysis. As it is
usually considered in the case of composite slabs in fire conditions, the metal deck is
not included in the calculations since the steam which is usually released at high
temperatures pushes the deck to detach from the bottom surface of the slab.
Since concrete has a low thermal conductivity, the reinforcement is considered well
insulated within the concrete and remained at relatively cool temperatures. Therefore, it
is assumed that only the secondary unprotected steel beam is considerably affected by
the temperature increase. Therefore, the overall loss of the load capacity is due to the
capacity degradation of the unprotected steel beam.

Chapter 4- The Theory and Principles Behind this Study
69
4.2 Methodology
Two main stages are distinguished in the study. The first stage is the small-deflection
analysis at which the optimum yield-line capacity of the slab is calculated at high
temperature, based on the plastic energy theory. As temperatures increase, the changing
yield-line capacity is continuously compared to the applied load at every temperature
increment. This temperature increase reduces the strength capacity of the unprotected
secondary downstand beam, leading to the degradation of the overall load capacity of
the slab. Once the small-deflection load-carrying capacity of the slab degrades to the
applied load, the yield-line pattern forms. The small-deflection analysis phase ends here.
In the next stage, large-deflection analysis is conducted, using the optimum yield-line
intersection point distance resulted from the small-deflection analysis. An iteration of
two intersected loops of deflection and temperature is conducted in the large-deflection
analysis, coded in Matlab. This iteration is deflection-controlled, at which deflection is
increased by constant increments, allowing tensile membrane action, therefore more
capacity, to be mobilized at elevated temperatures. As the deflection increases, yield-
lines starts to crack through distinguishable phases, leaving the reinforcement across the
cracks in pure tension. When an actual crack width reaches the crack limit-width, the
reinforcement across this crack fractures, transferring the analysis to a new phase within
the large-deflection stage. In the Matlab code, the slab's load capacity is continuously
compared to the applied load at the end of every deflection loop. These intersected
loops (i.e. deflection and temperature) continue mobilizing TMA until no further
enhancement is possible. At this point, the slab is considered structurally failed. This
process gives the enhancement in terms of the calculated temperature.
It was observed in previous tests on loaded thin-concrete slabs that after the initial
yield-line pattern, failure is likely to occur by the formation of a full-depth crack. This
crack penetrated the slab across its short span at the middle of the central yield-line
(Burgess et al. 2014). However, the initial failure mechanism, which is called
mechanism-b in this study, represents the optimum yield-line pattern at which cracks
open along the yield lines and the slab might fail even before the formation of the full-
depth crack perpendicularly to the central yield line. This optimum pattern is shown in
Figure 37.
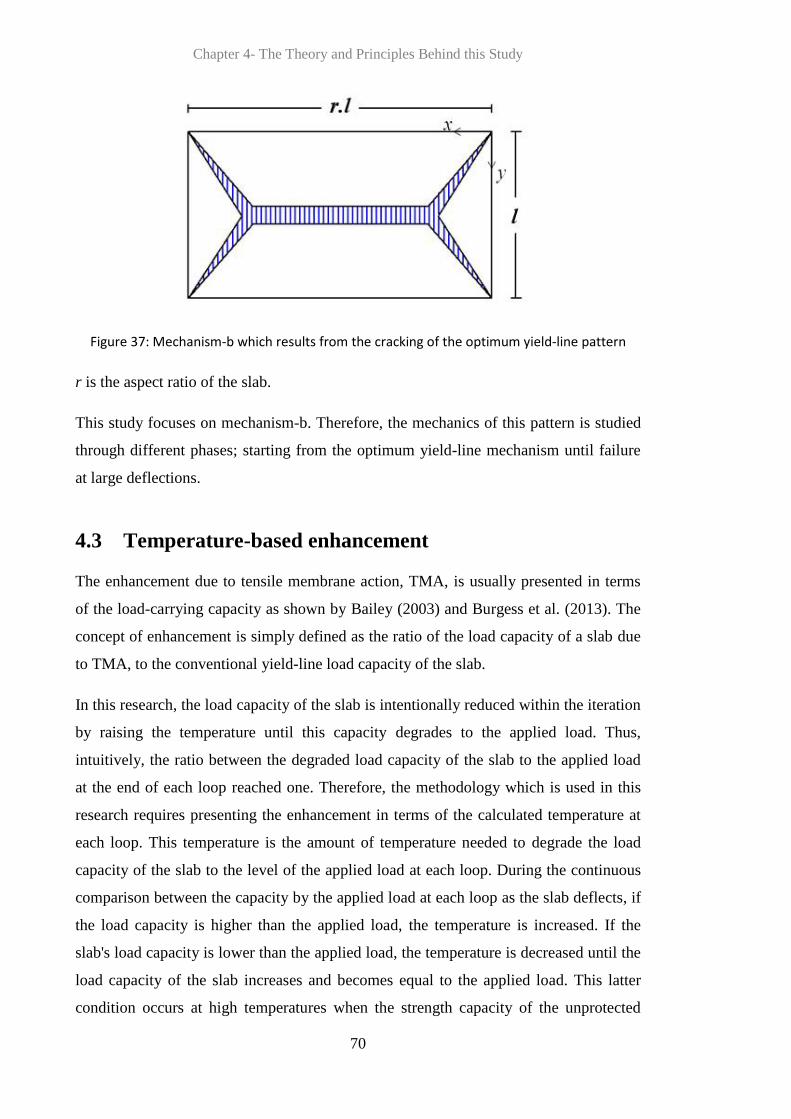
Chapter 4- The Theory and Principles Behind this Study
70
Figure 37: Mechanism-b which results from the cracking of the optimum yield-line pattern
r is the aspect ratio of the slab.
This study focuses on mechanism-b. Therefore, the mechanics of this pattern is studied
through different phases; starting from the optimum yield-line mechanism until failure
at large deflections.
4.3 Temperature-based enhancement
The enhancement due to tensile membrane action, TMA, is usually presented in terms
of the load-carrying capacity as shown by Bailey (2003) and Burgess et al. (2013). The
concept of enhancement is simply defined as the ratio of the load capacity of a slab due
to TMA, to the conventional yield-line load capacity of the slab.
In this research, the load capacity of the slab is intentionally reduced within the iteration
by raising the temperature until this capacity degrades to the applied load. Thus,
intuitively, the ratio between the degraded load capacity of the slab to the applied load
at the end of each loop reached one. Therefore, the methodology which is used in this
research requires presenting the enhancement in terms of the calculated temperature at
each loop. This temperature is the amount of temperature needed to degrade the load
capacity of the slab to the level of the applied load at each loop. During the continuous
comparison between the capacity by the applied load at each loop as the slab deflects, if
the load capacity is higher than the applied load, the temperature is increased. If the
slab's load capacity is lower than the applied load, the temperature is decreased until the
load capacity of the slab increases and becomes equal to the applied load. This latter
condition occurs at high temperatures when the strength capacity of the unprotected

Chapter 4- The Theory and Principles Behind this Study
71
beam degrades. Therefore, some reinforcement fractures, consequently degrading the
slab's load capacity further, so that this capacity of the slab decreases to an extent that
the slab cannot withstand the applied loads at such high temperatures and the deflection
level. Therefore the temperature is decreased to get the capacity back to the applied
load, marking a stage at which the slab's load capacity reduces and can no more take as
high temperatures as it did in the previous stages. This temperature is the limit
temperature at which the slab survives at the corresponding conditions. In the next loop,
the internal deflection loop runs again and the mechanics is applied for every deflection
value, looking for the limit temperature for the new slab status. Temperature affects
only the unprotected steel beams as it is considered in this study. This thermal reduction
of the strength occurs due to the thermal reduction factor ky, as given in (Eurocode 3 BS
EN 1993-1-2: 2005). The thermal reduction factor is shown in Figure 38.
Figure 38: Steel reduction factor (BS EN 1993-1-2: 2005)
fy is the yield stress of the steel at ambient temperature
fy,θ is the effective yield strength of the steel at elevated temperatures.
kp,θ is the reduction factor relative to the steel yield stress for the proportional limit.

Chapter 4- The Theory and Principles Behind this Study
72
fp,θ is the proportional limit for the steel at elevated temperatures.
kE,θ is the reduction factor for the slope of linear elastic range at the steel
temperature.
Ea,θ is the slop of linear elastic range for the steel at elevated temperatures.
Ea is the modulus of elasticity of the steel for normal temperature design.
4.4 Load-carrying capacity of the slab
According to the energy theory, the load-carrying capacity of the slab P is given by:
(44)
4.4.1 Internal work of the slab
The internal work, or the internal energy, is the work dissipated by the components of
the slab that are working in tension or compression. Reinforcement and steel beams
dissipate plastic work when they are in tension, thus both of them dissipate work by the
extension undergone through the deflection. Concrete, on the other hand, dissipates
work when it is in compression along slab regions which are in contact.
4.4.1.1 Internal work of the reinforcement
The reinforcement which is left in tension when a crack widens, extends across the
crack. The extension of the reinforcement depends on the actual crack width and the
angle of rotation of the slab facets which form the crack. The internal work dissipated
by the reinforcement is given by its extension multiplied by its tension force.
Reinforcement bars keep on dissipating work in tension until fracture. This fracture
occurs when the actual crack width reaches the limit crack width.
The limit crack width depends on the spacing of the reinforcement bars of the mesh, and
the ductility of these bars. This limit is given by:
(45)
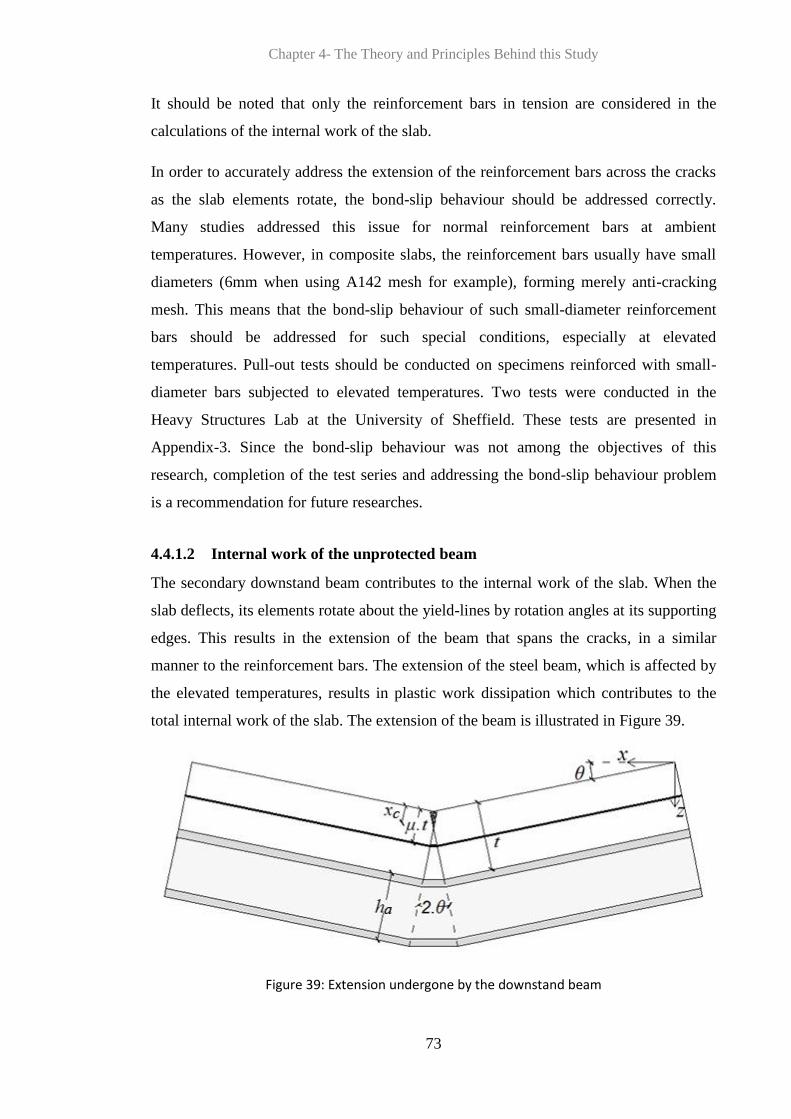
Chapter 4- The Theory and Principles Behind this Study
73
It should be noted that only the reinforcement bars in tension are considered in the
calculations of the internal work of the slab.
In order to accurately address the extension of the reinforcement bars across the cracks
as the slab elements rotate, the bond-slip behaviour should be addressed correctly.
Many studies addressed this issue for normal reinforcement bars at ambient
temperatures. However, in composite slabs, the reinforcement bars usually have small
diameters (6mm when using A142 mesh for example), forming merely anti-cracking
mesh. This means that the bond-slip behaviour of such small-diameter reinforcement
bars should be addressed for such special conditions, especially at elevated
temperatures. Pull-out tests should be conducted on specimens reinforced with small-
diameter bars subjected to elevated temperatures. Two tests were conducted in the
Heavy Structures Lab at the University of Sheffield. These tests are presented in
Appendix-3. Since the bond-slip behaviour was not among the objectives of this
research, completion of the test series and addressing the bond-slip behaviour problem
is a recommendation for future researches.
4.4.1.2 Internal work of the unprotected beam
The secondary downstand beam contributes to the internal work of the slab. When the
slab deflects, its elements rotate about the yield-lines by rotation angles at its supporting
edges. This results in the extension of the beam that spans the cracks, in a similar
manner to the reinforcement bars. The extension of the steel beam, which is affected by
the elevated temperatures, results in plastic work dissipation which contributes to the
total internal work of the slab. The extension of the beam is illustrated in Figure 39.
Figure 39: Extension undergone by the downstand beam

Chapter 4- The Theory and Principles Behind this Study
74
ha is the total depth of the beam.
t is the depth of the concrete part of the slab.
xc is the neutral axis depth.
θ is the angle of the rotation of the slab about the short span.
μ is the reinforcement depth ratio.
The tension force of the beam Tb is calculated by:
(46)
A is the cross-section area of the beam
The internal work of the beam is given by its tension force at its temperature multiplied
by its extension. The extension of the beam can be calculated linearly at the mid-height
of the beam, determined by the depth of the neutral axis of the slab, the angle of rotation
of the slab facets, and the extension of the reinforcement.
4.4.1.3 Internal work of concrete
The contribution of concrete in plastic work dissipation is considered in this study,
although it is relatively small compared to the work dissipated by the reinforcement and
the steel beam. The internal work done by the concrete is related to the compression
which is applied on the concrete and between the facets of the slab which are in contact.
Hence, the work dissipated by concrete should be calculated as the area of concrete in
compression multiplied by the corresponding compression force. Once a crack opens,
the contact between the slab facets is lost. Therefore the compression force is lost and
the corresponding internal work of concrete over that area is zero. The compression loss
occurs abruptly along the central yield-line crack, which is met by a sudden
reinforcement fracture along this line. Meanwhile, along the diagonal yield-lines the
cracks open progressively, leading to progressive loss of contact between the slab
elements. Therefore, the compression force retreats along these yield-lines towards the
corners of the slab until it [compression force] becomes concentrated in a single point at
each corner of the slab.
The slab goes through different phases during the large-deflection stage. These phases
are defined by the compression stress blocks converting from thin blocks to triangular,

Chapter 4- The Theory and Principles Behind this Study
75
and then to trapezoidal; eventually putting the whole depth of the slab edges in
compression. Concrete compression force is directly related to these stress-block phases
which is further discussed in Section 6.3.4.
4.4.2 External work of the slab
The external work of the slab is simply calculated according to the work method, as the
transverse loading on the slab multiplied by the corresponding deflection of the slab
element under the loads. This is further discussed in Section 6.2.1.3.

Chapter 5- An Alternative Simplified Method of the Mechanics of TMA
76
5 An Alternative Simplified Method of the
Mechanics of TMA
5.1 Kinematic mechanism
Burgess et al. (2013) presented an alternative simplified method to estimate the
mechanics of tensile membrane action of thin-flat concrete floor slabs. The derivations
of the alternative simplified method were presented in more details by Staikova (2014).
The assumptions that were considered for this method include the following:
1. Plain flat concrete slabs are considered.
2. Analysis is based on large-deflection plastic yield-line analysis.
3. Vertical support along the primary beams is assumed.
4. The slab can be reinforced with isotropic or orthotropic reinforcement.
5. Reinforcement bars are welded at constant spacing, forming a reinforcing mesh.
6. The formulation accounts for the plasticity and fracture of reinforcement mesh.
7. The reinforcement bars contribute to the total internal work of the slab by the
extension of these bars as the slab deflects.
8. Only the reinforcement in tension contributes in the slab internal work
calculation.
9. The method allows for a change in stress patterns around the yield-lines. This
pattern change could be monitored through the analysis.
10. The concrete in compression contributes to the internal work of the slab.
The alternative method considers a two-way spanning rectangular slab with an aspect
ratio r. The slab is reinforced with anti-cracking reinforcement mesh, which is
considered isotropic. Both layers of the mesh lie at a single layer in the mid-depth of the
slab thickness.
The slab is loaded transversally until the plastic yield line pattern appears by means of
cracks as shown in Figure 40.

Chapter 5- An Alternative Simplified Method of the Mechanics of TMA
77
Figure 40: Small-deflection yield-line pattern (Burgess et al. 2013)
l is the short span of the slab
n is the yield-lines intersection point distance from the short edge of the slab.
r is the aspect ratio of the slab
For the lowest failure load, the optimum yield line mechanism is defined by the yield
lines intersection distance parameter n, which is given by:
(47)
This method allows for four probable kinematically correct mechanisms. These
mechanisms a, b, c and d, shown in Figure 41, are anticipated for small-deflection
patterns of composite slabs (Staikova 2014).

Chapter 5- An Alternative Simplified Method of the Mechanics of TMA
78
Figure 41: Probable yield-line mechanisms (Staikova 2014)
Full-depth cracks might form either in the middle of the slab across the short span or at
the intersection points of the yield lines as shown in Figure 41(c). Mechanism b, shown
in Figure 41(b), is the optimum yield line pattern which is expected to take place
initially.
After the formation of the optimum yield line pattern, any further increase of the load on
the slab results in further rotations of the slab facets about the yield lines, leading to
cracks formation along the yield lines. Once cracks form, the reinforcement along these
cracks starts to fracture.
For the optimum yield-line pattern of mechanism-b, according to the work method, the
external work done by the loads on the slab E is given by:
(48)
δ is the maximum deflection of the slab

Chapter 5- An Alternative Simplified Method of the Mechanics of TMA
79
The internal work of the slab IS is calculated by multiplying the projected length of each
yield line on the axis of rotation, by the plastic moment acting on it, multiplied by the
angle of rotation of the corresponding slab facets. Since both the external work done
and the internal work dissipated are in balance, the load-carrying capacity of the slab P
can be calculated as follows:
(49)
IS is the internal work of the slab.
By dividing this load-capacity P at the current deflection by the initial yield-line load
Po, the enhancement factor e, which indicates the excess capacity that the slab can take,
is given by:
(50)
Po is the initial yield-line load capacity. It is given by:
(51)
Cs is the number of continuous short edges of the slab (=0, 1 or 2)
Cr is the number of continuous long edges of the slab (=0, 1 or 2)
mp is the sagging moment of the slab
is the hogging moment of the slab
The detailed calculations are not presented in this thesis since they are presented by
Staikova (2014).
5.2 Extension and failure of reinforcement bars
The behaviour of the reinforcement bars in terms of extension and failure should be
addressed in order to calculate the internal work dissipated by the reinforcement.

Chapter 5- An Alternative Simplified Method of the Mechanics of TMA
80
Burgess et al. (2013) consider a concrete slab of depth t, reinforced with anti-cracking
mesh at the mid-depth of the slab μ.t. The rotation of the slab’s facets leads to concrete
cracking, with no opening at the beginning as illustrated in Figure 42(a), and the neutral
depth shown in Figure 42(b) for that stage.
Figure 42: (a) slab cracking before opening; (b) compression stress block (Mangeon 2013)
However, for deflections beyond the small-deflection state, cracks open as the facets of
the slab rotate about the yield lines. Meanwhile, the embedded reinforcement bar is
stretched across the crack as shown in Figure 43(a), and the tensile force is balanced by
a thin compression block in the concrete on top of the section as shown in Figure 43(b).
Figure 43: (a) the extension of the reinforcement bar across the crack; (b) shallow compression
stress block (Mangeon 2013)
η is the angle of rotation between the slab elements across cracks.
As the crack opens further, the rotation of the slab facets increases, and the extension of
the reinforcement bars increases until they fracture, as shown in Figure 44.

Chapter 5- An Alternative Simplified Method of the Mechanics of TMA
81
Figure 44: Reinforcement extension due to crack opening and slab facets rotation (Burgess et
al. 2013)
ξ is the rotation angle between two slab elements.
Sr is the distance between the reinforcement bar in tension and the edge of the slab.
The extension of the reinforcement bar Δ is given by:
ξ (52)
The maximum extension of the reinforcement ΔLim is given by:
(53)
d is the space between two reinforcement bars in any direction.
is the fracture ductility strain of the reinforcement.
5.3 The re-examination of the mechanics of TMA
5.3.1 Mechanism-b geometrics
Burgess et al. (2014) presented a re-examination of the mechanics of tensile membrane
action of thin flat concrete slabs at ambient temperature. The re-examination accounts
for reinforcement fracture based on large-deflection plastic analysis. It assumes a
changing compression stress block, which its depth is governed by the deflection.
In the beginning, when the deflection is zero or negligible, a rectangular compression
block is assumed over the slab, at which loads are resisted by bending mechanism. As
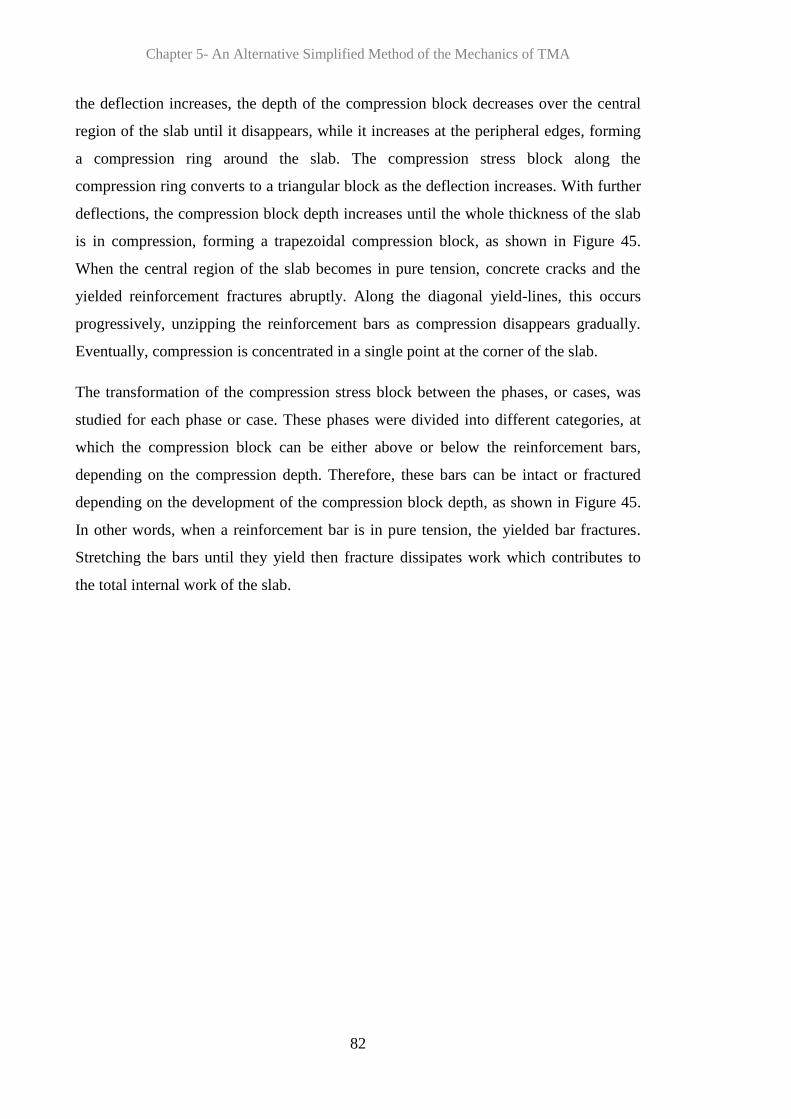
Chapter 5- An Alternative Simplified Method of the Mechanics of TMA
82
the deflection increases, the depth of the compression block decreases over the central
region of the slab until it disappears, while it increases at the peripheral edges, forming
a compression ring around the slab. The compression stress block along the
compression ring converts to a triangular block as the deflection increases. With further
deflections, the compression block depth increases until the whole thickness of the slab
is in compression, forming a trapezoidal compression block, as shown in Figure 45.
When the central region of the slab becomes in pure tension, concrete cracks and the
yielded reinforcement fractures abruptly. Along the diagonal yield-lines, this occurs
progressively, unzipping the reinforcement bars as compression disappears gradually.
Eventually, compression is concentrated in a single point at the corner of the slab.
The transformation of the compression stress block between the phases, or cases, was
studied for each phase or case. These phases were divided into different categories, at
which the compression block can be either above or below the reinforcement bars,
depending on the compression depth. Therefore, these bars can be intact or fractured
depending on the development of the compression block depth, as shown in Figure 45.
In other words, when a reinforcement bar is in pure tension, the yielded bar fractures.
Stretching the bars until they yield then fracture dissipates work which contributes to
the total internal work of the slab.
Chapter 5- An Alternative Simplified Method of the Mechanics of TMA
83
Figure 45: Compression stress block cases which vary depending on the slab’s deflection
z1 is the compression depth at the slab edge.
z2 is the compression depth at the central region of the slab.
As the slab deflects, the slab elements rotate in particular angles of rotation, θ and ϕ, in
the x and y directions as shown in Figure 46, leading to geometric changes over the slab.
The slab elements move horizontally in the both main the directions x and y. These
movements, ∆x and ∆y, govern the calculation of other important geometrics, like the
compression stress block.

Chapter 5- An Alternative Simplified Method of the Mechanics of TMA
84
Figure 46: Failure mechanism b (Staikova 2014)
L is the larger span of the slab.
θ is the angle of rotation of the slab about the short span.
ϕ is the angle of rotation of the slab about the larger span.
γ is the angle between diagonal yield lines and the slab support.
α is the angle of the diagonal yield lines cracks.
ΔA is the displacement in the x direction between the edges of the slab elements 1
and 2
Δ'A is the displacement in the y direction between the edges of the slab elements 1
and 2

Chapter 5- An Alternative Simplified Method of the Mechanics of TMA
85
Figure 47 illustrates the geometrics of the slab as it deflects, including the horizontal
movements and rotations of the slab elements. The rotation angles of the slab elements
are calculated as follows:
(54)
(55)
Figure 47: Movement and rotation of the slab elements (Staikova 2014)
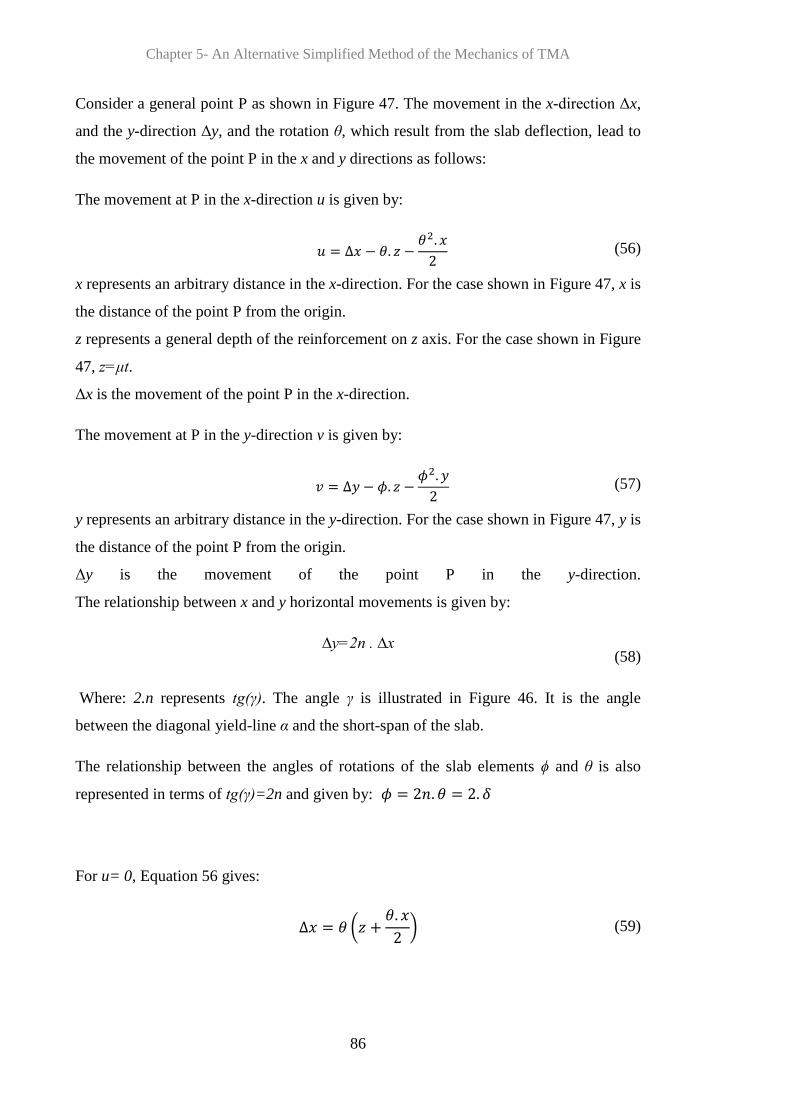
Chapter 5- An Alternative Simplified Method of the Mechanics of TMA
86
Consider a general point P as shown in Figure 47. The movement in the x-direction Δx,
and the y-direction Δy, and the rotation θ, which result from the slab deflection, lead to
the movement of the point P in the x and y directions as follows:
The movement at P in the x-direction u is given by:
(56)
x represents an arbitrary distance in the x-direction. For the case shown in Figure 47, x is
the distance of the point P from the origin.
z represents a general depth of the reinforcement on z axis. For the case shown in Figure
47, z=μt.
Δx is the movement of the point P in the x-direction.
The movement at P in the y-direction v is given by:
(57)
y represents an arbitrary distance in the y-direction. For the case shown in Figure 47, y is
the distance of the point P from the origin.
Δy is the movement of the point P in the y-direction.
The relationship between x and y horizontal movements is given by:
∆y=2n . ∆x
(58)
Where: 2.n represents tg(γ). The angle γ is illustrated in Figure 46. It is the angle
between the diagonal yield-line α and the short-span of the slab.
The relationship between the angles of rotations of the slab elements ϕ and θ is also
represented in terms of tg(γ)=2n and given by:
For u= 0, Equation 56 gives:
(59)
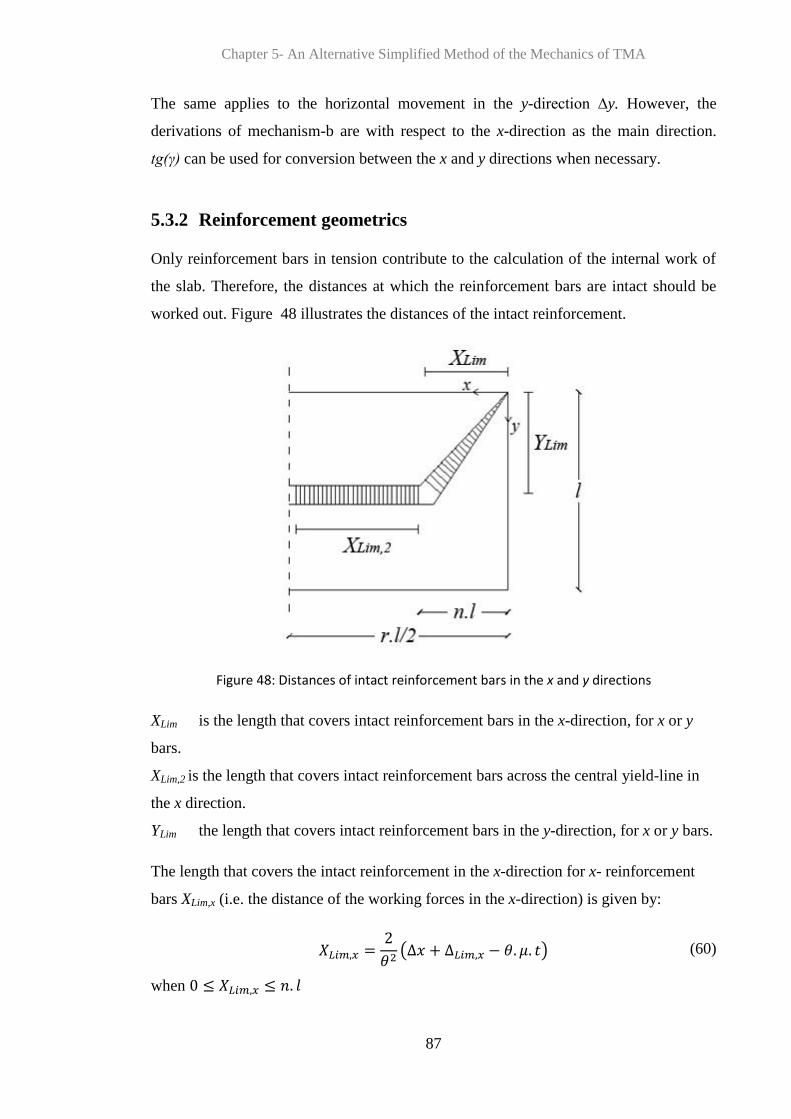
Chapter 5- An Alternative Simplified Method of the Mechanics of TMA
87
The same applies to the horizontal movement in the y-direction ∆y. However, the
derivations of mechanism-b are with respect to the x-direction as the main direction.
tg(γ) can be used for conversion between the x and y directions when necessary.
5.3.2 Reinforcement geometrics
Only reinforcement bars in tension contribute to the calculation of the internal work of
the slab. Therefore, the distances at which the reinforcement bars are intact should be
worked out. Figure 48 illustrates the distances of the intact reinforcement.
Figure 48: Distances of intact reinforcement bars in the x and y directions
XLim is the length that covers intact reinforcement bars in the x-direction, for x or y
bars.
XLim,2 is the length that covers intact reinforcement bars across the central yield-line in
the x direction.
YLim the length that covers intact reinforcement bars in the y-direction, for x or y bars.
The length that covers the intact reinforcement in the x-direction for x- reinforcement
bars XLim,x (i.e. the distance of the working forces in the x-direction) is given by:
(60)
when

Chapter 5- An Alternative Simplified Method of the Mechanics of TMA
88
∆Lim,x is the deformation in the x-direction when the reinforcement bar fractures (i.e.
reinforcement maximum extension in the x-direction). It is given by:
(61)
The deformation can be calculated similarly for the middle yield-line and the diagonal
yield lines.
The distance that covers the intact reinforcement in the y-direction for y- reinforcement
bars YLim,y (i.e. the distance of the working forces in the y-direction) is given by:
(62)
when:
∆Lim,y is the deformation in the y-direction when the reinforcement bar fractures (i.e.
reinforcement maximum extension in the y-direction). It is given by:
(63)
Since the reinforcement bars across the central yield line fracture abruptly when the
yield line cracks as the slab deflects, the distance of the intact reinforcement bars in the
y-direction across the central yield line (i.e. the distance XLim,y)can be either of:
XLim,y = l/2.(r-2n) when the yield-line reinforcement bars are intact.
XLim,y = 0 when the yield-line reinforcement bars are all fractured.
Each working force distance (i.e. XLim,x and YLim,y) can be written in terms of the
other direction. This is required for the methodology of the re-examination, and it is
given by Burgess et al. (2014) as follows:
For x-reinforcement bars:
(64)
YLim,x is the distance in the y-direction that covers the intact x-reinforcement bars, as
shown in Figure 49.

Chapter 5- An Alternative Simplified Method of the Mechanics of TMA
89
For y-reinforcement bars:
(65)
XLim,y is the distance in the x-direction that covers the intact y-reinforcement bars, as
shown in Figure 49.
Figure 49: Illustrating the distance of intact reinforcement bars in the x and y directions
5.3.3 Concrete geometrics
The geometrics of the compression stress blocks have great influence on the
calculations of the internal work of the slab. This is due to the fact that reinforcement
bars which are embedded in compression blocks do not contribute to the internal work
of the slab. Therefore, the geometrics of the concrete compression stress blocks need to
be worked out as presented by Burgess et al. (2014).
Figure 50 shows the compression stress block of a slab at an early stage of deflection.
Compression still exists over the central region of the slab, with a thickness of z2 as
shown in Figure 50. Meanwhile, the thickness of the compression block increases along
the edge of the slab (i.e. z1). Some reinforcement bars are embedded in compression in
this case as illustrated in Figure 50.

Chapter 5- An Alternative Simplified Method of the Mechanics of TMA
90
Figure 50: Cross-section of diagonal yield-line α, illustrating compression stress block
XCA is the distance in the x-direction from the origin to the centroid of the concrete
compression area.
XT is the distance that covers the reinforcement bars in compression in the x-
direction.
From Equation 59, at distance x=0, z1 is given by:
(66)
From Equation 59, at distance x=nl, z2 is given by:
(67)
Figure 50 shows that XT is the length of which the reinforcement bars are embedded in
compression stress block; therefore these bars do not dissipate work. XT is given by:
(68)
The distance that covers the reinforcement bars in compression in the y-direction YT is
given by the relationship between the x and y directions as follows:

Chapter 5- An Alternative Simplified Method of the Mechanics of TMA
91
(69)
These reinforcement bars in compression need to be subtracted from the working force
distance in order to calculate the internal work of the reinforcement. This is conducted
as follows:
For x-reinforcement bars: when YLim,x<0 and YT>0:
(70)
For y-reinforcement bars: when XLim,y<0 and XT>0:
(71)
5.3.4 Compression stress block development
Burgess et al. (2014) consider three phases when the slab goes through large
deflections. These phases are divided into sub-phases which are called “cases”; in which
the reinforcement bars, all or part of them, might be either intact or fractured, depending
the reinforcement bars being below or embedded in the compression stress blocks.
These phases and cases were divided as the following:
1. Phase (a): Compression block is trapezoidal. Cases within the phase are divided
as:
(a1) Cases: All of the compression is above reinforcement bars:
a1) All reinforcement bars are intact.
a1’) Central yield-line reinforcement bars, in the y-direction, are
fractured.
a1*) Reinforcement bars in the x-direction are partly fractured, while the
y-direction bars are intact.
a1**) Reinforcement bars in the y-direction are partly fractured, the x-
direction bars are intact.

Chapter 5- An Alternative Simplified Method of the Mechanics of TMA
92
a1’*) Reinforcement bars in the x-direction are partly fractured, the y-
direction middle yield-line are bars fractured.
a***) Reinforcement bars in the x and y directions are partly fractured.
(a2) Cases: Some of the reinforcement bars are embedded in
compression:
Similar to (a1) cases, but in (a2) cases some reinforcement bars are
embedded in compression. These compressed bars should not taken into
consideration in internal work calculations.
2. Phase (b): the compression block becomes triangular as the deflection increases
and compression over the central region disappears (i.e. z2=0). The concept is
similar to phase (a), taking into consideration the different geometrics of the
triangular compression block and the related geometries to this difference.
3. Phase (c): the compression block becomes trapezoidal as the deflection increases
further; and the depth of compression block theoretically becomes larger than
the depth of the slab, and the whole slab depth is in compression. Phase (c) has
similar process and cases to phase (a), with new geometry regulations depending
on the compression block geometrics.
These phases and cases were fully presented by Staikova (2014). In this study, the
whole mechanism of the re-examination was developed and extended, taking into
consideration the presence of a composite beam and the effects of elevated
temperatures.
The benefits and shortcomings of the alternative simplified method can be summarized
as follows:
Benefits:
The method allows monitoring of the behaviour of the reinforcement fracture as
the slab deflects.
Monitoring the reinforcement fracture allows removal of the conservative and
unrealistic deflection limit which was imposed by the Bailey-BRE method. This
Chapter 5- An Alternative Simplified Method of the Mechanics of TMA
93
allows the designer to decide when the analysis should be stopped, complying
with the desired safety factor.
Compared to the Bailey-BRE method, the alternative simplified method is not as
conservative as the Bailey-BRE method when it is compared to Cardington tests
(Burgess et al. 2012). Furthermore, it is not over-sensitive to marginal changes
of reinforcement ratio, as is the Bailey-BRE method.
Shortcomings:
Since the development of the method was incomplete, the following shortcomings
existed at the time of this study :
The loss of vertical support by the primary beams was ignored.
The detailed bond-slip behaviour between the reinforcement bars and the
adjacent concrete was not addressed.
The method addresses only flat concrete slabs before it was extended to include
composite slabs in this study.
The alternative method gives reasonable results for slab load enhancement at large
deflections. However, the alternative method exclusively considers plain flat slabs in
ambient temperature. The method, however, is not limited to these factors (i.e. flat slab
and ambient temperature). As a main aim of this study, the alternative method was
extended in order to account for the composite action with unprotected internal
secondary beams. In addition, the effect of elevated temperatures was addressed in the
extension of the alternative method.

Chapter 6- The Mechanics of Tensile Membrane Action in Composite Slabs in Fire
94
6 The Mechanics of Tensile Membrane Action in
Composite Slabs in Fire
6.1 Rotated yield-line pattern
In this chapter, the alternative simplified method of tensile membrane action, which was
developed by Burgess et al. (2013), and the re-examination of the mechanics of TMA at
ambient temperature, developed by Burgess et al. (2014), are presented after they were
developed and extended to include composite slabs at elevated temperatures.
As mentioned in Section 4.1, one secondary steel beam was added to the slab, attached
to it by shear studs. This single secondary beam was left unprotected against fire and
elevated temperatures. The composite action, which was provided by the downstand
beam, changed the yield line pattern from normal pattern, aligned to the x-direction, to
rotated yield-line pattern, aligned to the y-direction as illustrated in Figure 51.
Figure 51: Comparison between normal and rotated alignments of yield line patterns
N is the yield-lines intersection point distance from the larger span of the slab.
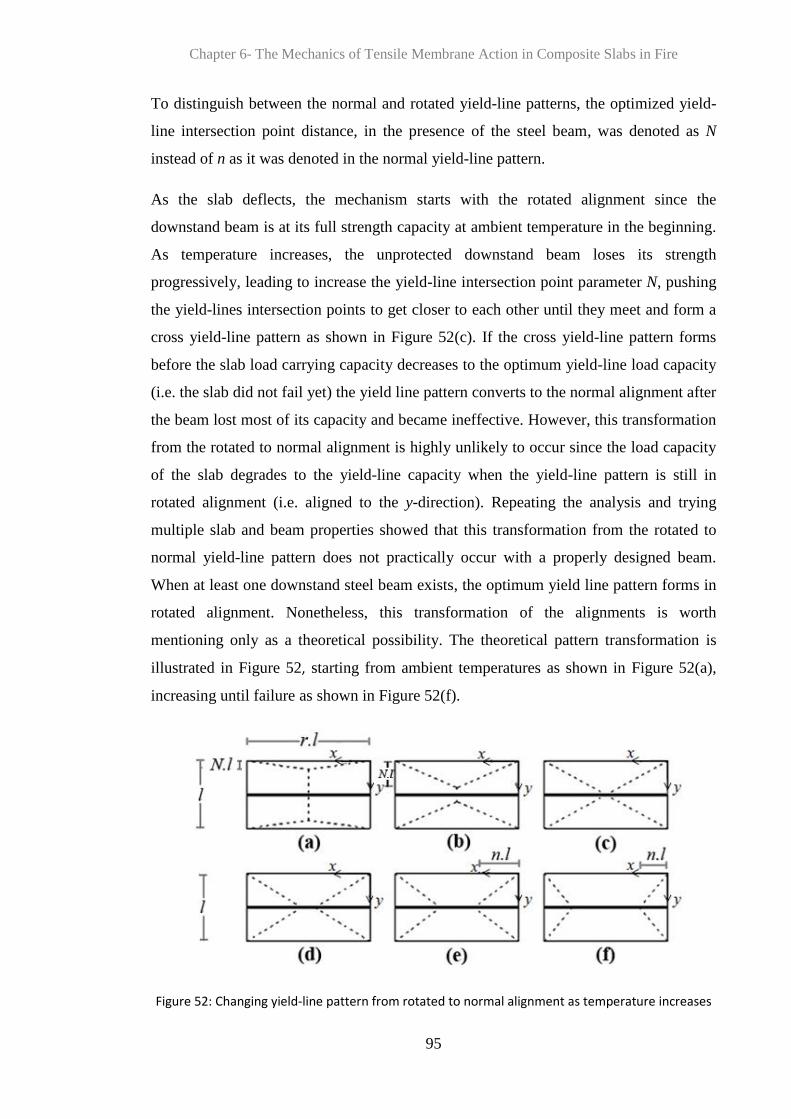
Chapter 6- The Mechanics of Tensile Membrane Action in Composite Slabs in Fire
95
To distinguish between the normal and rotated yield-line patterns, the optimized yield-
line intersection point distance, in the presence of the steel beam, was denoted as N
instead of n as it was denoted in the normal yield-line pattern.
As the slab deflects, the mechanism starts with the rotated alignment since the
downstand beam is at its full strength capacity at ambient temperature in the beginning.
As temperature increases, the unprotected downstand beam loses its strength
progressively, leading to increase the yield-line intersection point parameter N, pushing
the yield-lines intersection points to get closer to each other until they meet and form a
cross yield-line pattern as shown in Figure 52(c). If the cross yield-line pattern forms
before the slab load carrying capacity decreases to the optimum yield-line load capacity
(i.e. the slab did not fail yet) the yield line pattern converts to the normal alignment after
the beam lost most of its capacity and became ineffective. However, this transformation
from the rotated to normal alignment is highly unlikely to occur since the load capacity
of the slab degrades to the yield-line capacity when the yield-line pattern is still in
rotated alignment (i.e. aligned to the y-direction). Repeating the analysis and trying
multiple slab and beam properties showed that this transformation from the rotated to
normal yield-line pattern does not practically occur with a properly designed beam.
When at least one downstand steel beam exists, the optimum yield line pattern forms in
rotated alignment. Nonetheless, this transformation of the alignments is worth
mentioning only as a theoretical possibility. The theoretical pattern transformation is
illustrated in Figure 52, starting from ambient temperatures as shown in Figure 52(a),
increasing until failure as shown in Figure 52(f).
Figure 52: Changing yield-line pattern from rotated to normal alignment as temperature increases

Chapter 6- The Mechanics of Tensile Membrane Action in Composite Slabs in Fire
96
6.2 Small-deflection analysis
6.2.1 Rotated yield-line mechanism
Figure 53 shows the rotated alignment of the yield-line pattern when the downstand
beam is still at full or significant ratio of its strength capacity before reaching high
temperatures. As temperatures increase, the unprotected steel beam is affected by the
heat which reduces its strength capacity. This capacity degradation leads to slab
deflection under the effect of the load.
Figure 53: Rotated alignment yield-line pattern
As mentioned in Section 2.2.2, the slab elements, which are defined by the straight
yield-lines, rotate as rigid bodies in two angels of rotations: θ and ϕ, in the x and y
directions, respectively, resulting in a maximum deflection δ at the yield lines
intersection points. These angles θ, ϕ, in addition to γ as shown in Figure 53, are
calculated as follows:
(72)

Chapter 6- The Mechanics of Tensile Membrane Action in Composite Slabs in Fire
97
(73)
(74)
6.2.1.1 Internal work of the secondary beam
In order to calculate the load capacity of the slab, the internal work should be worked
out. Therefore, the internal work of the steel beam should be calculated. For the small-
deflection analysis, the internal work dissipated by the secondary steel beam is
calculated by its moment capacity, multiplied by its angle of rotation as it deflects. The
moment capacity of the composite beam is given by:
(75)
Mpl is the moment of resistance of the beam.
A is the area of the beam.
fy is the yield stress of the steel.
ha is the total height of the beam.
t is the thickness of the concrete part of the slab.
xc is the neutral axis distance from the top of surface of the slab.
The internal work dissipated by the single secondary beam IB is calculated as follows:
(76)
Substituting Equation 74 into Equation 76 leads to:
(77)
(78)
Chapter 6- The Mechanics of Tensile Membrane Action in Composite Slabs in Fire
98
6.2.1.2 Internal work of the slab
The internal work of the flat slab without the secondary beam IS is calculated according
to the work method as presented in Section 2.3. It is given by:
(79)
mp is the sagging moment the slab per unit length
l is the projected length of the yield-line on the corresponding axis of support
Consider K=2.mp
By substituting the angles of rotation in Equations 73 and 74 and arranging:
(80)
(81)
The total internal work of the slab Itot is the sum of the internal work of the flat IS slab
and the internal work of the beam IB as follows:
Itot = IS + IB (82)
Substituting Equations 78 and 81 give:
(83)
6.2.1.3 External work done on the slab
The external work done by the load on the slab E is calculated according to the work
method as follows:
(84)
P is the load-carrying capacity of the slab.
Rearranging Equation 84 gives:

Chapter 6- The Mechanics of Tensile Membrane Action in Composite Slabs in Fire
99
(85)
(86)
6.2.1.4 Slab's load capacity
According to the work method: the internal work dissipated by the slab= the external
work expended by loads
By substituting Equations 78, 81 and 86 into the external work expended by loads:
(87)
By rearranging Equation 87:
(88)
In order to get the smallest yield-line load capacity (i.e. the optimum yield-line load
capacity) the parameter N should be optimized so that it gives the minimum failure load.
Taking the first derivative of P in Equation 88 with respect to N, gives:
(89)
When the numerator = 0. This is given by:
(90)
Chapter 6- The Mechanics of Tensile Membrane Action in Composite Slabs in Fire
100
Rearranging Equation 90 gives:
(91)
(92)
By solving Equation 92, the solution for N which gives the smaller value for P is given
by:
(93)
The other solutions for N from Equation 92 and from the denominator of Equation 89
give either too large values of N or negative values. Therefore, Equation 93 represents
the ideal solution for the optimized yield-line capacity P.
6.2.2 Normal yield-line mechanism
The transformation from the initial rotated yield-line pattern, aligned to the y-direction
to the normal yield-line pattern, aligned to the x-direction, was found to be merely
theoretical hypothesis when a downstand steel beam exists. However, the derivation of
the normal yield-line mechanism which proved this is presented in this section only for
the small-deflection analysis part of this study. Figure 54 shows the normal yield-line
pattern in the presence of the downstand steel beam.

Chapter 6- The Mechanics of Tensile Membrane Action in Composite Slabs in Fire
101
Figure 54: Normal alignment yield-line pattern
The internal work of the slab IS is given by:
(94)
(95)
The internal work of the beam IB is given by:
(96)
The external work done by the loads on the slab E is given by:
(97)
Rearranging Equation 97 gives:
(98)

Chapter 6- The Mechanics of Tensile Membrane Action in Composite Slabs in Fire
102
According to the energy method: the internal energy dissipated by the slab = the
external work done by loads. Therefore:
(99)
Rearranging Equation 99 to make P the subject gives:
(100)
In order to get the optimum yield-line load capacity, the parameter n should be
optimized so that it gives the minimum P. Similarly to the rotated yield-line mechanism,
the numerator of
was found to give the ideal value of n for the optimum yield-line
load capacity as follows:
(101)
when the numerator = 0 as follows:
(102)
Rearranging Equation 102 gives:
(103)

Chapter 6- The Mechanics of Tensile Membrane Action in Composite Slabs in Fire
103
The solution that gives the minimum value of the load P is given by:
(104)
6.2.3 Failure of the slab
Consider the uniformly applied load on the slab Pa. As temperatures increase, the slab
load capacity P decreases progressively until P=Pa. At this point, the yield lines form
over the slab and the yield-line pattern is fixed (i.e. highly unlikely to change later). At
this point, the slab is considered failed according to conventional design methods,
including the yield-line theory. The yield-lines form as plastic hinge lines. The
corresponding load-carrying capacity of the slab at this point is referred to as the failure
load. However, as this study takes the membrane action into account, it was considered
that this failure load is no more than the yield-line load (i.e. the load at which the yield-
lines form over the slab). Actually, the slab does not really fail, but it moves from the
small-deflection phase to the large-deflection phase as the slab deflects further. This
allows the mobilization of tensile membrane action which provides further capacity
with more deflection and further work dissipation, until the real failure occurs in the
end. The large-deflection phase is discussed in Section 6.3.
6.2.4 Critical temperature
In order to calculate the temperature which is required for the yield-line load to decrease
until it is equal to the applied load, an iteration should be conducted starting from the
rotated alignment until the slab loses its load-carrying capacity and fail, whether this
failure occurs during the rotated or normal alignment phase eventually. It was found that
the transformation from the rotated to normal alignment does not happen. However, this
was conducted here for checking purpose. The iteration increased the temperature
gradually and therefore reduced the capacity of the downstand steel beam. To simulate
the decrease of the beam strength, the moment resistance capacity of the unprotected
downstand beams Mpl was multiplied by a reduction factor ky, as discussed in Section

Chapter 6- The Mechanics of Tensile Membrane Action in Composite Slabs in Fire
104
4.2. At ambient temperatures, ky = 1, which means that the secondary unprotected beam
retains its full strength capacity so far. At elevated temperatures, ky decreases, therefore
the load capacity of the steel beam decreases too.
The initial value of ky was considered 1.0 in the beginning of the analysis (i.e. the
temperature was still below or equal 400ºC). In the beginning of the iteration, an initial
temperature of 400ºC was considered as a starting temperature; and with every loop, the
temperature increased by a small increment. A temperature of 400ºC was chosen as a
start instead of 20ºC only for programming issues, with no difference in the results since
the reduction factor has a constant value of 1 between 20ºC and 400ºC. The
corresponding reduction factor ky was, then, calculated from Table 3.1 in EN 1993-1-2:
2005, depending on the steel temperature.
The iteration continued until the continuously-decreasing load capacity of the slab P
dropped to the level of the applied load Pa. This whole process was carried out using
Microsoft Excel Visual Basic (VBA). The programming code is presented in Appendix-
2, in addition to the coding methodology.
6.3 Large-deflection analysis - compression stress block
method
The mechanics of the compression stress block method was derived in order to work out
the geometrics, rotations and movements of the slab elements as the slab deflects
beyond the level of the yield-line mechanism. These geometrics, rotations and
movements govern the forces and stress blocks over the slab which are required to
calculate the slab's plastic load capacity P at large deflections. This capacity P is
required to determine the critical temperature of the slab for every large deflection level
until failure. The forces on the slab are: concrete compression forces, and tension forces
of both the reinforcement and the unprotected downstand steel beam. Before working
out the equilibrium of the forces on the composite slab, the geometric arrangements
should be worked out.

Chapter 6- The Mechanics of Tensile Membrane Action in Composite Slabs in Fire
105
6.3.1 General geometrics
Consider an arbitrary point P' on the slab. As the slab deflects, the slab elements rotate
as shown in Figure 55. In addition to the rotation, the slab elements experience
horizontal movements in the x and y directions.
Figure 55: Slab element rotation and movement
The movements and rotations of the slab elements 1 and 2, in the x and y directions,
result in crushing the concrete at the corners of the slab as shown in Figure 56 . These
crushing corners give compressive forces which contribute to the internal work
dissipated by the slab as it deflects. At a late stage of deflections, the compression
forces are confined at these corners of the slab.

Chapter 6- The Mechanics of Tensile Membrane Action in Composite Slabs in Fire
106
Figure 56: Crushing concrete at the corners of the slab at large deflections
From the geometry of the deflecting slab shown in Figure 55, the movement of the point
P' or any point in the y-direction v, is calculated as follows:
(105)
The term y represents an arbitrary distance in the y-direction. For the case which is
shown in Figure 55, y is the distance of the point P' from the origin.
From the geometry of the deflecting slab shown in Figure 55, the movement of the point
P' or any point in the x-direction u, is calculated as follows:
(106)
The term x represents an arbitrary distance in the x-direction. For the case which is
shown in Figure 55, x is the distance of the point P' from the origin.
For v=0:
(107)

Chapter 6- The Mechanics of Tensile Membrane Action in Composite Slabs in Fire
107
Rearranging Equation 107 gives:
(108)
From Equation 108, when y=0, the compression block depth z1 is given by:
(109)
From Equation 108, when y=N.l, the compression block depth z2 is given by:
(110)
The compression block depths z1 and z2 are illustrated in Figure 57.
Figure 57: Compression block depths z1 and z2 along diagonal yield-line
The distances of the intact reinforcement forces in the x and y directions XLim,x and YLim,y
are illustrated in Figure 58, and given by:
When
(111)
When (112)
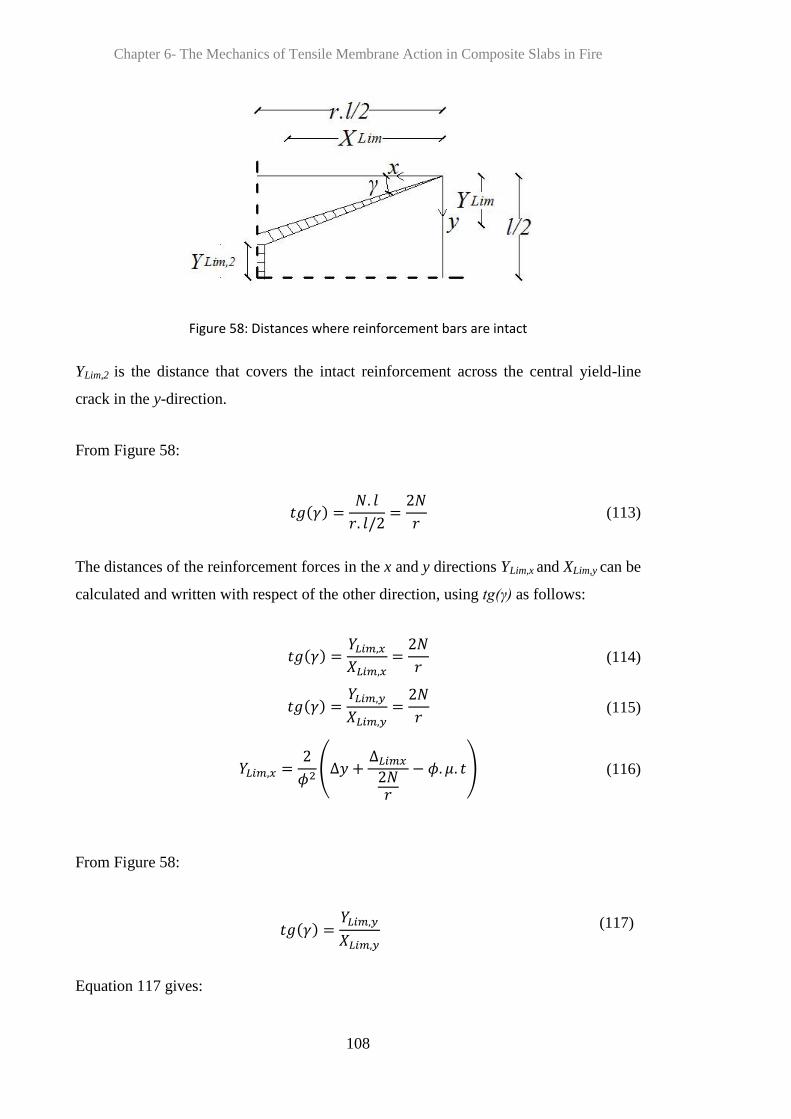
Chapter 6- The Mechanics of Tensile Membrane Action in Composite Slabs in Fire
108
Figure 58: Distances where reinforcement bars are intact
YLim,2 is the distance that covers the intact reinforcement across the central yield-line
crack in the y-direction.
From Figure 58:
(113)
The distances of the reinforcement forces in the x and y directions YLim,x and XLim,y can be
calculated and written with respect of the other direction, using tg(γ) as follows:
(114)
(115)
(116)
From Figure 58:
(117)
Equation 117 gives:

Chapter 6- The Mechanics of Tensile Membrane Action in Composite Slabs in Fire
109
(118)
Substituting Equations 112 and 117 into 118 gives:
(119)
Rearranging gives:
(120)
Equations 116 and 120 give the distances that cover the intact reinforcement bars in the
x and y directions with respect to the other direction.
6.3.2 Geometrics of mechanism-b
As the slab deflects beyond the formation of the optimum yield-line pattern, the yield-
lines start to crack, leaving the reinforcement in pure tension, therefore, to fracture after
it yielded. This process occurs in different phases as the deflection increases. Each
phase is distinguished by the shape that the compression stress block takes. The process
is similar to what was explained in Section 5.3, but the geometrics are different.
Therefore, it is presented in this chapter with the new mechanism and geometrics behind
it . Phase (a), for example, is the first phase that the slab goes through, at which the
compression stress block is nearly rectangular, spread over the whole region of the slab,
converting to trapezoid at the peripheral edge along the supporting beams. Phase (b)
witnesses the disappearance of the compression from the central region of the slab, and
the conversion of the compression block to triangular shape at the perimeter of the slab,
or what is called the compression ring.
Each of phases (a) and (b) was, in turn, divided into different cases, representing the
different scenario paths that these phases might go through. For example, Phase (b)
contains different cases, like: case (b1), case (b1’) and case (b1*). These scenario paths,
or cases, depend on the fracture sequence of the reinforcement bars. Across a particular
yield-line, reinforcement bars might fracture in the x-direction first, then the bars in the

Chapter 6- The Mechanics of Tensile Membrane Action in Composite Slabs in Fire
110
y-direction follow; or the opposite scenario might occur. This is further discussed in
Section 6.3.7 when the equilibrium of these cases is presented.
6.3.2.1 Initial Phase (a)
In the initial large-deflection phase, compression exists over the whole area of the slab.
The slab resists the loads in bending. As it is illustrated in Figure 59, the upper level of
central region of the slab is still in compression with a compression block depth of z2.
At the perimeter of the slab, the compression thickness increases gradually towards the
supporting edges, reaching its maximum z1. The reinforcement bars can be either below
the compression block (i.e. case a1) or embedded in the compression block (i.e. case
a2). It is important that this is determined, since reinforcement bars which are embedded
in compression do not contribute to the internal work of the slab. Therefore, when the
compression block is below the reinforcement bars (i.e. the distance that covers the
reinforcement bars in compression in the y-direction YT>0) only the working distance
over which the reinforcement bars are intact is considered (i.e. YLim,y – YT). In order to
calculate the compression force for each phase and case, the rest of the geometric
parameters of the cross-section, which are shown in Figure 59, should be calculated.
Figure 59: Compression stress block in phase (a)
A1x is the compression area in the diagonal yield-lines at the edge of the slab.
A2x is the compression area in the diagonal yield-lines at the central region of the slab.
YT is the distance that covers the reinforcement bars in compression in the y-direction.

Chapter 6- The Mechanics of Tensile Membrane Action in Composite Slabs in Fire
111
The distance from the edge of the slab to the centroid of the compression stress block in
the y-direction YCA is given by:
(121)
The distance of which the reinforcement bars are embedded in compression YT is given
by:
(122)
This distance YT is zero for all (a1) cases, since these cases represent a scenario of
which all reinforcement bars are below the compression stress block, as is discussed in
Section 6.3.5.
The areas of the compression stress blocks at the edge and centre zones of the slab A1x
and A2x, respectively, are given by:
(123)
(124)
6.3.2.1.1 Case (a1): compression above all reinforcement bars
In this case, the depth of the compression stress block z1 is smaller than the
reinforcement vertical depth within the slab μt, and the compression block over the
central region of the slab still exists (i.e. z2>0). This is illustrated in Figure 60.

Chapter 6- The Mechanics of Tensile Membrane Action in Composite Slabs in Fire
112
Figure 60: Case (a1) - compression above all reinforcement bars
There are two mathematical probabilities here: 1. the distance that covers the intact
reinforcement bars is larger than N.l (in this situation this distance is taken as N.l as a
maximum); 2. the distance that covers the intact reinforcement bars has a certain value
which can be calculated. These two probabilities are interpreted as follows:
For reinforcement bars in the x-direction:
(125)
(126)
For reinforcement bars in the y-direction:
(127)
(128)
6.3.2.1.2 Case (a2): compression below reinforcement
This case represents phase (a) when the compression stress block is below some of the
reinforcement bars (i.e. some of the reinforcement bars are embedded in compression).
In this case, XT and YT are larger than zero and should be calculated according to

Chapter 6- The Mechanics of Tensile Membrane Action in Composite Slabs in Fire
113
Equation 120. To calculate the distance YLim,x, the relationship between the x and y
directions can be used by converting between these directions in Equation 120 by using
tg(γ).
6.3.2.2 Phase (b):
As the deflection increases, the depth of the compression block z1 increases while z2
decreases until z2=0, although it theoretically becomes negative as shown in Figure 61.
This converts the compression stress block area to a triangular block. This scenario is
represented by Phase (b) that has different geometrics from phase (a). A slab cross-
section in Phase (b) is illustrated in Figure 61.
Figure 61: Phase (b) - triangular compression block
The parameters of Phase (b) can be calculated from the geometrics as shown in Figure
61 as follows:
(129)
Y1 is the length of the triangular concrete compression block in the y-direction.
Since z2 is negative here, it was not considered in the calculations. Therefore, the area
of the compression block A1x is given by:

Chapter 6- The Mechanics of Tensile Membrane Action in Composite Slabs in Fire
114
(130)
The distance of the centroid of the compression stress block in the y-direction from the
edge of the slab YCA is given by:
(131)
YT is calculated according to Equation 122.
6.3.2.2.1 Case (b1): triangular compression above all reinforcement bars
Case (b1) represents Phase (b) when the triangular compression block is effectively
above all the reinforcement bars in the slab (i.e. none of the reinforcement bars is in
compression). In other words, the depth of the compression block at the edge of the slab
z1 is smaller than the depth of the reinforcement within the slab μt, and z2<0, therefore
YT and XT =0. Case (b1) is illustrated in Figure 62.
Figure 62: Case (b1) – triangular compression block above the reinforcement
Similar to Case (a1), there are two probabilities as follows:
For reinforcement bars in the x-direction
(132)

Chapter 6- The Mechanics of Tensile Membrane Action in Composite Slabs in Fire
115
(133)
For reinforcement bars in the y-direction
(134)
(135)
6.3.3 Forces equilibrium
The compression and tension stresses within the slab can be represented by compression
and tension forces which are used to calculate the internal work of the slab. The
equilibrium of these forces should be worked out in order to calculate the internal work
of the slab. The forces in elements 1 and 2 of the slab are shown in Figure 63.
Figure 63: The forces of elements 1 and 2 of the slab
C is the concrete compression force in the diagonal yield-lines.
Cx2 is the concrete compression force in the central yield-line.
Tx1, Tx2 are the reinforcement tension forces in the x-direction across the diagonal and
central yield-lines, respectively.

Chapter 6- The Mechanics of Tensile Membrane Action in Composite Slabs in Fire
116
Ty1 is the reinforcement tension force in the y-direction across the diagonal yield-
lines.
Tb is the tension force of the steel beam.
S is the shear force between the slab elements.
γ is the angle between the diagonal yield-lines and the slab support (i.e. the x axis
here).
Taking the equilibrium of the forces on the element 2 of the slab in the x-direction
gives:
(136)
By eliminating the shear force (i.e. taking the equilibrium of the slab forces
perpendicularly to the direction of the shear force) gives:
(137)
Rearranging Equation 137 gives:
(138)
Equation 138 is the general forces equilibrium equation which is used in Sections 6.3.5
to 6.3.11 to calculate the deformations of the slab including the horizontal movements
∆x and ∆y.
6.3.4 Forces on the slab
Each force in the slab has a certain value depending on the phase or case that the slab go
through as it deflects. In this regard, what actually changes from a phase or case to
another one is the distance of which reinforcement bars are intact (i.e. the number of
intact reinforcement bars). The forces on the slab are given by:
(139)
(140)
(141)

Chapter 6- The Mechanics of Tensile Membrane Action in Composite Slabs in Fire
117
(142)
(143)
fpx is the reinforcement yield stress in the x-direction.
fpy is the reinforcement yield stress in the y-direction.
6.3.5 Case (a1) equilibrium
Recalling the geometrics of case (a1), these geometrics are illustrated in Figure 64.
Figure 64: Geometrics of case (a1)
Case (a1) represents the case of which the compression stress block is above all
reinforcement bars which are left in tension; therefore all reinforcement bars are intact.
The distances that cover the intact reinforcement bars in the x and y directions, (XLim,y -
XT) and (YLim,x - YT), respectively, are given by:
(144)
(145)
Substituting the forces from Equations 139 to 143, and the distance of the working
forces from Equations 144 and 145 in Equation 138, gives:
Chapter 6- The Mechanics of Tensile Membrane Action in Composite Slabs in Fire
118
(146)
Recalling the geometrics of this case from Section 6.3.2.1, and by substituting these
geometries in Equation 146 gives:
(147)
fc is the concrete characteristic strength.
Rearranging Equation 147 gives:
(148)
By dividing all terms in Equation 148 by cos(γ), noting that tg(γ)=2.N/r:
(149)
Multiplying Equation 149 by l gives:
(150)

Chapter 6- The Mechanics of Tensile Membrane Action in Composite Slabs in Fire
119
Rearranging Equation 150 gives:
(151)
Equation 151 represents the equilibrium for case (a1).
6.3.6 Case (b1) equilibrium
As the deflection increases, the compression stress block becomes triangular at the
peripheral edge of the slab, and the central region becomes in pure tension. Case (b1)
represents the case of which the all reinforcement bars in the x and y directions are still
intact, with the existence of triangular compression stress block above these bars. The
geometrics of case (b1) are shown in Figure 65.
Figure 65: Geometrics of case (b1)
From the geometrics of case (b1), the distances of the intact reinforcement bars in the x
and y directions, (XLim,y - XT) and (YLim,x - YT), respectively, are given by:
(152)

Chapter 6- The Mechanics of Tensile Membrane Action in Composite Slabs in Fire
120
(153)
Since z2<0, A2x was not considered in this case.
Substituting the geometries of case (b1), and the distances of the intact reinforcement
from Equations 152 and 153, in Equation 138 gives:
(154)
Rearranging Equation 154, following the same steps followed in case (a1), gives:
(155)
By making
the subject:
(156)
6.3.7 Case (b1’) equilibrium
Case (b1’) represents a scenario which descends from Phase (b), at which the
reinforcement bars across the central yield-line in the x-direction fractured, while the
reinforcement in the y-direction is still intact as shown in Figure 66. The fracture of the
central yield-line reinforcement occurs abruptly. Hence, all the central yield-line
reinforcement is either intact or fractured. This case is illustrated in Figure 66.

Chapter 6- The Mechanics of Tensile Membrane Action in Composite Slabs in Fire
121
Figure 66: Distances of intact and fractured reinforcement bars in the x and y directions,
representing Case (b1’)
Taking the distances that cover intact reinforcement bars in the x and y directions from
Equations 132 to 135, and substituting them in Equation 138 gives:
(157)
Executing similar rearranging steps as cases (a1) and (b1) cases to Equation 157 gives:
(158)
By making
the subject:
(159)
6.3.8 Case (b1*) equilibrium
In this scenario, the reinforcement bars of the diagonal yield-lines unzip in the y-
direction (i.e. the reinforcement partly fractured) while the bars in the x-direction remain

Chapter 6- The Mechanics of Tensile Membrane Action in Composite Slabs in Fire
122
intact. Therefore, by taking YLim,x=l/2 (i.e. all bars are intact) and by taking the distance
XLim,y from Equation 135, the forces of the reinforcement for this case are given by:
(160)
(161)
Substituting the forces from Equations 160 and 161 in Equation 138 gives:
(162)
Rearranging Equation 162 to make
the subject gives:
(163)
6.3.9 Case (b1’*) equilibrium
In this case, the reinforcement bars in the y-direction across the diagonal yield-lines are
partly fractured; and the reinforcement along the central yield-line in the x-direction
fractured too.
Thus, Tx2=0; Ty1=fpy.XLim,y; Tx1=fpx.N.l
Therefore, Equation 138 becomes:
(164)

Chapter 6- The Mechanics of Tensile Membrane Action in Composite Slabs in Fire
123
Substituting the forces of this case in Equation 164 gives:
(165)
Executing similar procedures conducted on case (b1*) gives the equilibrium equation of
case (b1’*) as follows:
(166)
6.3.10 Case (b1**) equilibrium
This case represents the scenario when the reinforcement in the y-direction is fractured,
while in the x-direction the reinforcement is intact.
Therefore, Tx2=0; Ty1=fpy.r.l/2; Tx1=fpx.YLim,x
(167)
Substituting these forces and YLim,x in Equation 138 gives:
(168)
Rearranging Equation 168, and making
the subject gives:

Chapter 6- The Mechanics of Tensile Membrane Action in Composite Slabs in Fire
124
(169)
6.3.11 Case (b1***) equilibrium
This case represents the scenario at which the reinforcement along the central yield-line
in the x-direction already fractured; and reinforcement along the diagonal yield-lines in
the x and y directions partly fractured (i.e. unzipping). Therefore, the extent of the intact
reinforcement in the x and y directions are XLim,y and YLim,x respectively.
Hence, the forces of the reinforcement are given by:
(170)
(171)
Substituting Equations 170 and 171 in Equation 138 gives:
(172)
Rearranging Equation 172 and making
the subject gives:
(173)

Chapter 6- The Mechanics of Tensile Membrane Action in Composite Slabs in Fire
125
6.3.12 The development of the slab deformations against deflection
The phases and cases which are presented in Sections 6.3.5 to 6.3.11 give the
deformations of the slab as it deflects. These deformations are the key components to
monitor cracks formation and reinforcement fracture at large deflections. The equations
of these deformations (i.e. Equations 151 to 173) were coded and processed in Matlab
in order to conduct an iteration. In this iteration, a temperature increase was applied in
order to determine the critical temperature of the slab for each deflection level (i.e. the
temperature enhancement). The details and methodology of this iteration are presented
in Appendix 2.
6.3.13 Crack widths
The internal work of the working forces depends on the extension of the reinforcement
bars and the beam, as discussed in Sections 4.4.1.1 and 4.4.1.2. This extension is
governed by the corresponding crack widths. Therefore, these crack widths should be
calculated. Two distinctive crack types are apparent in mechanism-b: diagonal cracks α,
and the central crack β as shown in Figure 67. The central crack β has a constant width
along its length. Each diagonal crack α, however, is at its maximum width at the yield-
lines intersection point, and gets narrower reaching zero-width at the corner of the slab.
Therefore, when the width of α crack was used in the internal work calculations, the
width was taken at the middle distance of the intact reinforcement bars row.
Figure 67: Crack types on the slab

Chapter 7- Application of the Method
126
7 Application of the Method
7.1 Example of composite slab in fire
The mechanism which was derived and presented in Chapter 6 was coded in Matlab in
order to examine the behaviour of composite slabs at elevated temperatures, and to
calculate the enhancement of the slab's load capacity at large deflections.
The slab which is used in the example is a rectangular slab (9m x 6m) with an aspect
ratio r=1.5. The thickness of the slab t=130mm. The slab is reinforced by isotropic
A142 mesh. The mesh consists of two layers which are welded, forming bars spacing of
200mm. Both mesh layers lie at the slab’s mid-depth (i.e. μ.t=65mm). Reinforcement
yield stress fpx= fpy =500N/mm2. Reinforcement ductility = 5%. Concrete characteristic
strength fc=35N/mm2.
The secondary-unprotected downstand steel beam is UKB 406x140x39. As is
mentioned in Section 4.1, one secondary beam is used. The secondary beam is aligned
in the direction of the larger span of the slab. The yield stress of the beam fy=355N/mm2.
The slab is loaded by uniformly distributed transverse loading with an intensity of
4kN/m2.
The slab-beam cross section is shown in Figure 68.

Chapter 7- Application of the Method
127
Figure 68: Slab-beam cross section; beam Section (UKB 406x140x39)
7.1.2 Small-deflection analysis results
The first phase of the analysis (i.e. the small-deflection yield-line analysis) was coded in
Visual Basic on Microsoft Excel. The composite slab information, including the
geometric information of the slab, the load capacity of the unprotected beam, the
reinforcement and the applied transverse loading intensity, and the other characteristics
of the slab as mentioned in Section 7.1, was entered to the computer program that was
designed for the small-deflection analysis. Then, the program took this information
from the excel sheet cells, and the small-deflection analysis was conducted. The detailed
process and methodology of this program are presented in Appendix 2.
The results of the small-deflection analysis were as follows:
The optimized yield-line intersection dimension (i.e. the yield-line parameter)
N=0.4181679.
The critical temperature of the optimum yield-line capacity Tcr= 762ºC.
The yield-line parameter N which resulted from the small-deflection analysis was used
as a constant in the large-deflection analysis since the optimum yield-line pattern
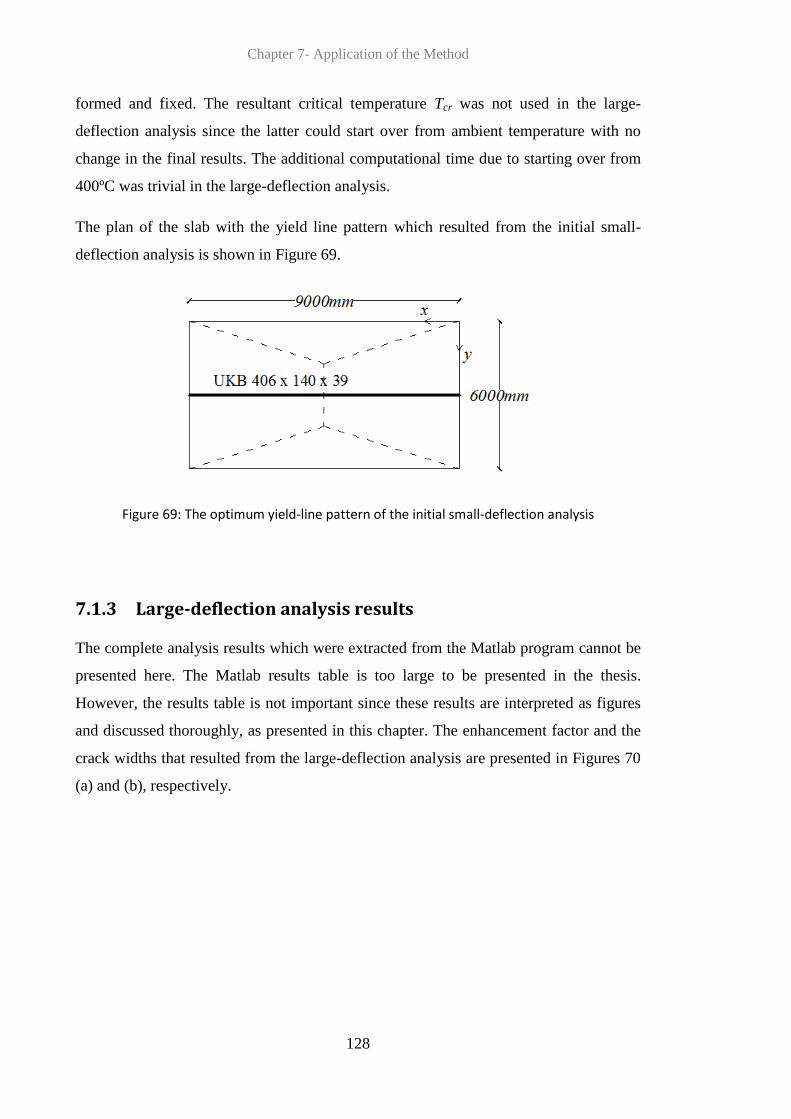
Chapter 7- Application of the Method
128
formed and fixed. The resultant critical temperature Tcr was not used in the large-
deflection analysis since the latter could start over from ambient temperature with no
change in the final results. The additional computational time due to starting over from
400ºC was trivial in the large-deflection analysis.
The plan of the slab with the yield line pattern which resulted from the initial small-
deflection analysis is shown in Figure 69.
Figure 69: The optimum yield-line pattern of the initial small-deflection analysis
7.1.3 Large-deflection analysis results
The complete analysis results which were extracted from the Matlab program cannot be
presented here. The Matlab results table is too large to be presented in the thesis.
However, the results table is not important since these results are interpreted as figures
and discussed thoroughly, as presented in this chapter. The enhancement factor and the
crack widths that resulted from the large-deflection analysis are presented in Figures 70
(a) and (b), respectively.

Chapter 7- Application of the Method
129
Figure 70: (a) Temperature against dimensionless deflection; (b) crack width development against deflection. Vertical lines represent transmission between two successive cases
Figure 70(a) represents the temperature enhancement against the dimensionless
deflection of the slab (i.e. δ/l. Figure 70(a)) demonstrates the changing critical
temperature as the deflection increases. The temperature peaks shown in Figure 70(a)
mark reinforcement fracture in distinguishable phases. Each reinforcement fracture at
each enhancement peak marks a case transition through the analysis. The last case
transition (i.e. case b1***) is marked by the vertical line (IV) as shown in Figures 70(a)
and (b).

Chapter 7- Application of the Method
130
Figure 70(b) demonstrates the development of the various crack widths against the
dimensionless deflection of the slab. The horizontal dotted line represents the limit-
crack width at which the corresponding reinforcement fractures.
The vertical lines (I) to (IV) that go through Figures 70(a) and (b), mark the end of a
case and the start of a following one as deflection increases. The vertical line (I) marks
the end of case (a1), at which all the reinforcement bars are intact, with the presence of
a thin compression stress block over the whole slab, and the start of case (b1), at which
the compression stress block converts to triangular along the peripheral ring of the slab
and disappears from the central region, as discussed in Section 6.3.2.2. The vertical line
(II) marks the abrupt fracture of the central yield line reinforcement in the x-direction,
met by a temperature peak in Figure 70(a), which takes the analysis from case (b1) to
case (b1’). The vertical line (III) marks the transition to case (b1’*), which is met by the
second peak of the temperature enhancement in Figure 70(a), at which the
reinforcement in the y-direction unzip along the diagonal yield-lines as the slab deflects.
The vertical line (IV) marks the start of case (b1***), at which the reinforcement in the
x and y directions fracture, unzipping the mesh together, degrading the slab's load
capacity until no further enhancement is possible and the slab structurally fails.
The development of the forces on the slab facets against the deflection are shown in
Figure 71. It is intuitive that the forces are affected by the temperature changes due to
the tension force in the beam Tb which is affected by the temperature increase and the
slab deflection. This is demonstrated by the distinguishable two peaks in the beam force
Tb, shown in Figure 71, which mirror the two temperature peaks in Figure 70(a).

Chapter 7- Application of the Method
131
Figure 71: Internal forces on the slab facets
If it occurs that the actual maximum temperature exceeds the highest temperature
enhancement at any point, then the slab fails and the printed forces in Figure 71 after the
collapse point are merely theoretical. This potential theoretical part of the forces is
printed in thin lines to account for this probability. On the other hand, if the actual
temperature does not reach the theoretical temperature peaks, the rest of the solution
scenario presented here is also theoretical and the slab survives. This also applies to the
temperature enhancement and crack widths.
7.2 Comparisons against other methods
Straightforward comparisons with the original alternative simplified method and the
Bailey-BRE method are not possible since the results of this study were presented as
temperature enhancement rather than load capacity enhancement as in the other
methods. Although enhancement in this study was related to the load capacity
enhancement, since the temperature enhancement was derived from the load
enhancement, the final results were interpreted differently (temperature instead of load
capacity enhancement). However, behaviour-wise comparison against the alternative
Chapter 7- Application of the Method
132
simplified method and maximum temperature comparison against the Bailey-BRE
method were conducted. These comparisons are presented in Sections 7.2.1 and 7.2.2.
7.2.1 Comparison against the alternative simplified method
The re-examination of the mechanics of tensile membrane action was conducted by
Burgess et al. (2014) in order to re-examine the behaviour of flat concrete slabs at
ambient temperature. Therefore, intuitively its results cannot be directly compared to
the results of this study which addressed composite slabs at high temperatures. As is
mentioned in Section 6.1, the presence of the unprotected steel beam changed the
mechanism and the process of the analysis. In addition, the re-examination gives the
enhancement with respect to the load capacity, while this study gives the temperature
enhancement. However, the behaviour trend in both situations of a slab with and
without a composite beam, at ambient or elevated temperatures, should be similar
behaviour-wise. The mechanics behind both studies is the same. Therefore, a slab which
mobilizes tensile membrane action at large deflections witnesses similar towards-failure
phases, as is discussed in Sections 6.3.5 to 6.3.11. Hence, in spite of the different
structures of flat and composite slabs, at ambient or elevated temperatures, the main
behaviour trends of both the original alternative method and the extended one in this
study should be alike.
The re-examination of TMA was modelled in a spreadsheet which was programmed in
the University of Sheffield by Burgess et al. (2014). In this spreadsheet of the re-
examination, a flat slab was considered, with no downstand beam. The analysis was
conducted at ambient temperature. The parameters of the same slab which is used in the
example of this study in Section 7.1 were entered to the spreadsheet. It should be noted
that the optimum yield line pattern in the spreadsheet of the re-examination of TMA of
flat slabs is aligned to the x-direction, while in the example of this study the optimum
yield-line is rotated by 90o (i.e. aligned in the y-direction) due to the presence of the
downstand beam. However, the comparison was conducted only to compare the
behaviour of both situations. Furthermore, in the re-examination of TMA example,
which was analyzed in a spreadsheet, the enhancement was given by the ratio of the
excessive load that the slab could carry when TMA was mobilized for every deflection
increment of the slab, to the optimum yield-line load.

Chapter 7- Application of the Method
133
Figure 72(a) shows the results of the flat slab analysis at ambient temperature. Figure
72(b) shows the results of the slab which is presented in the original example of this
study in Section 7.1, with the same dimensions and the same reinforcement and
concrete configurations.
Figure 72: Comparison between the re-examination of TMA and this study, (a) no temperature and no beams; (b) with an unprotected beam in fire
Figure 72(a) presents the enhancement with respect to the load-capacity, which starts
from the value 1 (i.e. the optimum yield-line capacity). Figure 72(b) presents the
enhancement of the slab with respect to temperature.

Chapter 7- Application of the Method
134
The behaviour of the flat and composite slabs in Figures 72(a) and (b) is similar. Figure
72(a) shows two distinctive peaks in the enhancement factor. The first peak represents
the central yield-line reinforcement fracture in the y-direction, perpendicular to the
yield-line. The second peak represents the fracture of the diagonal yield-line
reinforcement bars in the x-direction, unzipping the mesh. Just after the second peak, a
change in the inclination of the enhancement (at the value 1.2 in Figure 72(a))
represents the fracture of the reinforcement bars in the x and y-directions, unzipping the
mesh until the slab fails.
Figure 72(b) shows the same behaviour, also with two distinguishable enhancement
peaks, taking into consideration the rotated yield-line pattern. The first peak in Figure
72(b) represents the abrupt fracture of the central yield-line reinforcement bars in the x-
direction perpendicular to the yield-line. The second peak represents the fracture of
reinforcement bars across the diagonal yield-lines in the y-direction. After the second
peak, a change in the inclination of the temperature enhancement is apparent ( similar to
the small peak which was marked by the vertical line (IV) as shown in Figure 70(a)).
This peak represents the reinforcement fracture in the x and y-direction, unzipping the
mesh across the diagonal yield-lines until the slab fails. Because of the rotated yield-line
pattern in the example of this study, the direction of the fracturing reinforcement bars is
rotated by 90o compared to the alternative simplified method, however, with the same
behaviour.
As a direct comparison, the first peak in the example of this study which is shown in
Figure 72(b) represents the fracture of the reinforcement in the x-direction across the
central yield-line. In the example of the flat slab at ambient temperature shown in
Figure 72(a) the first peak represents the fracture of the reinforcement in the y-direction
across the central yield-line. The second enhancement peak shown in Figure 72(b)
represents the fracture of reinforcement in the y-direction along the diagonal yield-lines;
while the second peak in Figure 72(a) represents the fracture of the diagonal yield-lines
reinforcement in the x-direction. Technically, the behaviour of the slab in both methods
is identical but the yield-lines, therefore the cracks, are rotated as illustrated in Figure
73.

Chapter 7- Application of the Method
135
Figure 73 (a) Normal yield-line alignment; (b) Rotated yield-line alignment
7.2.2 Comparison against the Bailey-BRE method
A direct comparison against the Bailey-BRE method is not possible because this study
gives the temperature enhancement of a composite slab at elevated temperatures, not the
load enhancement. This is different from the Bailey-BRE method which gives the slab's
load capacity enhancement. However, comparing the maximum allowed temperatures
from both methods for the same slab configurations is possible. This comparison does
not fully show the complete behaviour of the slab in both methods, but it shows the
maximum allowed critical temperatures for both of them.
When the comparison between this study and the Bailey-BRE method was conducted, a
difference between the maximum deflections corresponding to the maximum
temperatures in the two methods was found. The main reason behind this was the
reinforcement ductility, which can be changed in the method of this study, but cannot be
changed in the Bailey-BRE method. Nonetheless, this issue was addressed by changing
the ductility in the example of this study from 5 to 6 percent. This was found to make
the maximum critical temperatures given by both methods occur at the same slab
deflection level. Therefore, a direct temperature comparison is possible. The
comparison against the Bailey-BRE method is shown in Figure 74. Note that the caption
“new method” refers to this study, which is the extension of the alternative simplified
method.
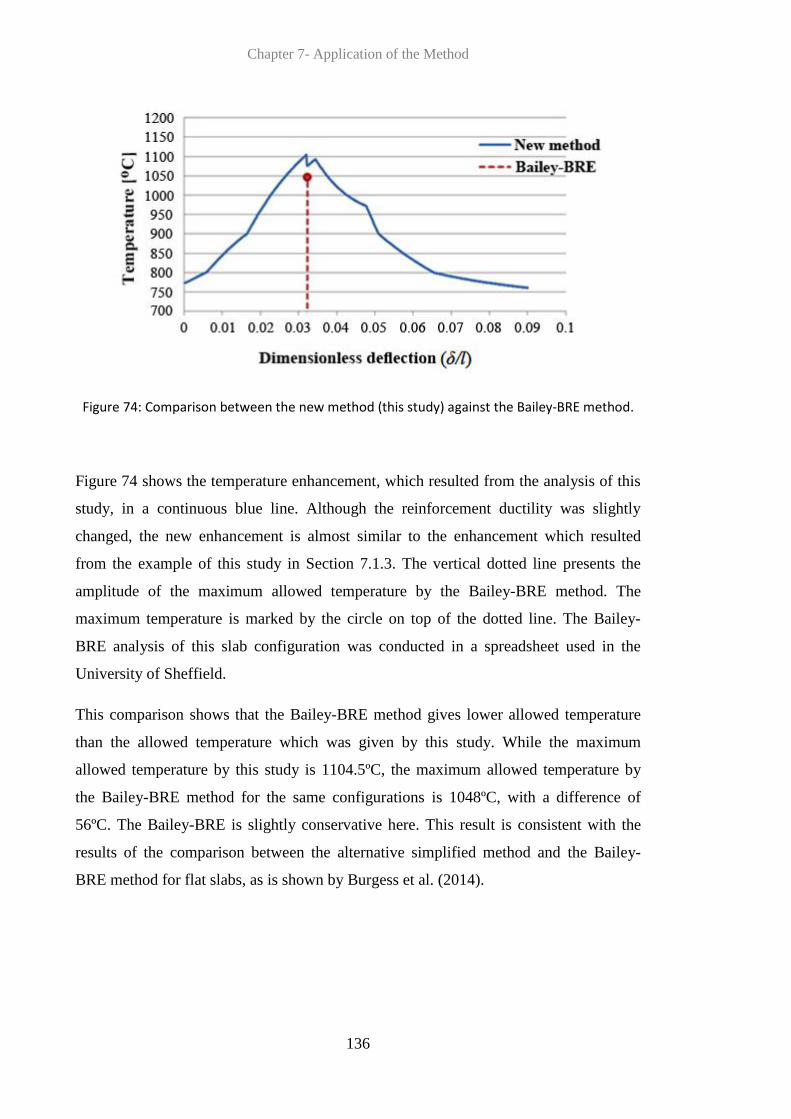
Chapter 7- Application of the Method
136
Figure 74: Comparison between the new method (this study) against the Bailey-BRE method.
Figure 74 shows the temperature enhancement, which resulted from the analysis of this
study, in a continuous blue line. Although the reinforcement ductility was slightly
changed, the new enhancement is almost similar to the enhancement which resulted
from the example of this study in Section 7.1.3. The vertical dotted line presents the
amplitude of the maximum allowed temperature by the Bailey-BRE method. The
maximum temperature is marked by the circle on top of the dotted line. The Bailey-
BRE analysis of this slab configuration was conducted in a spreadsheet used in the
University of Sheffield.
This comparison shows that the Bailey-BRE method gives lower allowed temperature
than the allowed temperature which was given by this study. While the maximum
allowed temperature by this study is 1104.5ºC, the maximum allowed temperature by
the Bailey-BRE method for the same configurations is 1048ºC, with a difference of
56ºC. The Bailey-BRE is slightly conservative here. This result is consistent with the
results of the comparison between the alternative simplified method and the Bailey-
BRE method for flat slabs, as is shown by Burgess et al. (2014).

Chapter 8- Discussion and Conclusions
137
8 Discussion and Conclusions
8.1 Discussion
This study is an extension of the alternative simplified method which handled flat
concrete slabs and conducted by Burgess et al. (2013) and Burgess et al. (2014). The
study was set out to investigate the effects of an unprotected steel beam on the
enhancement of composite slabs in fire. The main question of this research was to
examine the importance of the slab large deflection in mobilizing tensile membrane
action and its effect on the enhancement factor beyond the conventional yield-line
mechanism; and how does the presence of an unprotected steel beam affect the whole
failure mechanism.
In order to achieve this main goal of this research, the mechanics of the original
alternative simplified method had to be extended to include the influence of the
unprotected steel beam on the tensile membrane action mechanism. The extended
mechanics behind this study was divided into two parts: small-deflection and large
deflection analyses.
In this chapter, general discussion and important points related to this research are
presented. These important points include: study limitations, factors influencing the new
method and recommendations for further researches.
8.1.1 Small-deflection analysis
Originally, the slab resists the transverse loading in bending. Conventional load-
carrying capacity methods are used up to the point of the formation of the optimum
yield-line pattern. Based on the yield-line theory and work method, this small-deflection
mechanism determines the slab status at the moment of the yield-line pattern formation.
The extension which is presented in this study accounts for the mechanism change
which occurs by adding an unprotected secondary steel beam to the slab. This steel

Chapter 8- Discussion and Conclusions
138
beam, which is attached to the slab by shear studs, changes the yield-line pattern from
the x-alignment to y-alignment, rotating the pattern by 90o. The formation of the
optimum yield-line pattern is mainly dependent on the strength capacity of the beam
which is affected by elevated temperatures. The yield-line pattern forms when the beam
significantly loses its capacity. The corresponding temperature is marked as the critical
temperature for the small-deflection analysis. What was used from the output of the
small-deflection analysis was the yield-line parameter N. This parameter was the main
purpose of conducting the small-deflection analysis, although the core part of the study
is the large-deflection analysis which is further discussed in Section 8.1.2.
8.1.2 Large-deflection analysis
The large-deflection analysis makes up the main body of this research. Following the
advantages of the re-examination of the mechanics of tensile membrane action which
was presented by Burgess et al. (2014), this extension inherited the same advantages
from the original method. In addition to the inherited advantages, this extension
accounts for the effects of elevated temperatures in the presence of the unprotected
secondary steel beam. One of the advantages of this study is that it allows the cracks
formation over the slab to be monitored. Furthermore, reinforcement fracture is also
monitored across the corresponding cracks on the slab. This reinforcement fracture
governs the enhancement through the deflection until failure. The changing stress
patterns along the yield-lines are also monitored.
Through the large-deflection analysis, using the compression stress block method, the
load-carrying capacity of the slab with the effect of tensile membrane was calculated at
every deflection increment. The ratio of the slab's load capacity, with the effect of
TMA, to the optimum yield-line capacity gives the temperature enhancement at each
level of deflection. This temperature enhancement represents the excessive temperature
which is allowed beyond the critical temperature given by conventional methods.
Technically, it is the temperature which is required to degrade the enhanced load
capacity, due to TMA, to the level of the yield-line load capacity.
As is presented in Section 7.2.1, the identical behaviour of the slab according to this
study and the results presented by the original re-examination by Burgess et al. (2014),
gives this study good credibility. The sequence of the different phases and cases which

Chapter 8- Discussion and Conclusions
139
the slab went through in the Matlab model, monitoring the reinforcement fracture as the
deflection increased until failure, was exactly as theoretically expected according to the
original alternative simplified method. These phases and cases were fully coded, but the
sequence itself was only monitored and not dictated by any means.
Comparisons against the Bailey-BRE method showed that the latter is conservative, as
is discussed by Burgess et al. (2014). This comparison was merely a comparison
between the maximum allowed temperatures from both methods.
8.1.3 The new aspects of this study compared to Burgess et al. (2014)
This study presents an extension of the alternative simplified method proposed by
Burgess et al. (2014). The same kinematics and in-plane stress distribution were
considered in both models. The main differences between the models are listed as
follows:
1. The proposed model of this study addressed composite slabs instead of plain flat
concrete slabs as it was in the original method by Burgess et al. (2014). The
extended model took into consideration the beam-slab composite action at large
deflections and its effect on the tensile membrane action mechanism.
2. Due to the composite action of a single downstand beam, as assumed in this
study, the rotated yield-line pattern which resulted from the strength of the beam
was addressed as it led to a rotated mode of failure.
3. The proposed model of this study addressed the effect of elevated temperatures
instead of ambient temperature analysis as it was in the original method
proposed by Burgess et al. (2014). The effect of elevated temperature was
applied to a single secondary steel beam across the larger span of the slab.
8.1.4 The key benefits of this study over the Bailey-BRE method
The extension of the alternative method, which is proposed by this study, has certain
benefits over the Bailey-BRE method. Although the proposed model of this study has
its own limitations, as is presented in Section 8.2, the model addressed the following
limitations of the Bailey-BRE method:

Chapter 8- Discussion and Conclusions
140
1. This study takes different slab kinematic assumptions and accounts for the
horizontal movements and rotations of the slab elements at large deflections;
while the Bailey-BRE method inherits the same equilibrium and in-plane stress
distribution from Hayes’ model which leads to either conservative or optimistic
results. Although Bailey & Toh (2007) corrected the in-plane stress distribution,
the results of the Bailey-BRE method were not tangibly improved.
2. The proposed method in this study allows monitoring the behaviour of the slab
at large deflections. This includes reinforcement fracture in tension and concrete
crushing under compression. This allows the prediction of the real time history
behaviour of the slab as it deflects, starting from the yield-line pattern formation
until failure.
3. Since the proposed model of this study predicts the reinforcement fracture, the
unrealistically safe deflection limit, as proposed by the Bailey-BRE method, is
not necessary. It is up to the designer to decide on the fracture ductility of the
reinforcement which leads to slab failure.
4. The proposed method accounts for the effect of the reinforcement ductility and
its effect on the bars fracture across the cracks, while the Bailey-BRE method
completely ignores the effects of reinforcement ductility.
5. The method implies that the compression force is confined at each corner of the
slab, which complies with the true behaviour of slabs as they fail, rather than the
suggested compression arch cracks at the corners as suggested by the Bailey-
BRE method.
8.2 Study limitations
The alternative simplified method, presented by Burgess et al. (2014), was originally
conducted to come up with a new method because of the shortcomings and limitations
which are found in the Bailey-BRE method. Following the alternative simplified
method, which focuses on thin-flat reinforced concrete slabs, this study aims to extend it
to account for composite slabs at elevated temperatures. The results that were obtained
from this research present the temperature enhancement of composite slabs beyond the
conventional solutions. The results were found to be logic and give similar slab
behaviour to that shown by the original simplified method. However, the main course of
this alternative method does not end with this study. Limitations that are related to

Chapter 8- Discussion and Conclusions
141
original alternative simplified method, and limitations inherited from the mechanics of
tensile membrane action methods still persist. Furthermore, the assumptions that are
considered in this study were over-simplified in certain cases. The result of these over-
simplified assumptions might slightly affect the future physical validation of the model
proposed in this study. As is mentioned in Section 2.2.2, the yield-lines are assumed to
be straight lines. In reality, the yield-lines, and therefore the corresponding cracks, do
not form perfectly straight lines. However, the effect of this over-simplification is not
significant. Moreover, as is mentioned in Section 2.2.2, the slab facets rotate as rigid
bodies as the slab deflects. In practice, the deflected shape of the slab is unlikely to be a
collection of perfectly flat facets. Therefore, the deflected shape of slabs in test
observations is not a perfect deflection curve. Nevertheless, these over-simplified
assumptions are justified since the method proposed in this study is a simplified
method. However, the limitations of this study, as presented in Sections 8.2.1, 8.2.2 and
8.2.3, should be addressed in future studies in order to implement this extended method
correctly and get accurate results. These limitations include: vertical support of the slab
edges, isotropic reinforcement and thermal deflection.
8.2.1 Vertical support of the slab edges
This limitation, which the Bailey-BRE method is criticized for (Burgess et al. 2012),
still persists in the alternative simplified method that was presented by Burgess et al.
(2014) and in this study. As is mentioned in Section 3.5, ignoring the capacity
degradation of the primary beams as the temperature increases might lead to the
formation of plastic hinges in these beams, therefore less tensile membrane action to be
mobilized. This means that the actual load enhancement factor is less than the calculated
enhancement. Therefore, the results might be optimistic to some extent when the
temperature exceeds the critical temperature of the primary beams. Thus, there is a
probability that a folding mechanism occurs and the slab fails in catenary action rather
than failing after the tensile membrane action is fully mobilized as the slab
configurations allow. This depends on the fire protection of the primary beams and the
actual temperature during the fire.

Chapter 8- Discussion and Conclusions
142
8.2.2 Isotropic reinforcement limitation
The reinforcement which is considered in this study is isotropic reinforcement;
therefore, the neutral axis depth in the x and y directions is the same for every cross-
section of the slab. However, the mechanics behind the small-deflection analysis which
forms the initial part of this study is limited to isotropic reinforcement. Using
orthotropic reinforcement in the small-deflection analysis leads to different neutral axis
depths in the slab in the x and y directions for the same cross-section, which is
intuitively irrational. Only the small-deflection analysis is limited to this, due to its
equations which depend on the yield-line theory and the work method. The same
problem is encountered with the Bailey-BRE method, though it has not properly
addressed or corrected yet. Nonetheless, in spite of the existence of the unprotected steel
beam, when using isotropic reinforcement as it is the case in this study, the effect of this
limitation itself is extremely limited and leads to trivial differences in the final results
(i.e. the temperature enhancement). This is completely justified since the only output
parameter which was extracted from the small-deflection analysis in order to be used in
the large-deflection analysis is the yield-line intersection point distance N. As
mentioned in Section 7.1.2, the critical temperature Tcr which resulted from the small-
deflection analysis was not used in the large-deflection analysis, as the latter started
over from 400ºC. This is justified since the computational time is trivial in the large-
deflection analysis. Similarly, the optimum yield-line load capacity P which results
from the small-deflection analysis was not used in the large-deflection analysis. In the
large-deflection analysis, the load capacity of the slab was calculated from scratch,
using completely different equations based on the compression stress block method.
This newly calculated slab's load capacity P was compared to the applied load on the
slab Pa. Hence, the only output that was extracted from the small-deflection analysis in
order to be used in the large-deflection analysis was the yield-line intersection point
distance parameter N. In other words, the isotropic reinforcement limitation is of trivial
effects.
The fact that only one unprotected secondary steel beam is used in this study makes the
offset of the resultant yield-line intersection point distance N extremely small. Such
differences in N values were found to be confined to the third decimal digit after
comma. Applying such differences to N led to extremely trivial difference in the final
results of the large-deflection analysis (i.e. the temperature enhancement).

Chapter 8- Discussion and Conclusions
143
8.2.3. Thermal deflection
The large-deflection analysis in this study is based on the deflection which mainly
results from the degradation of the unprotected steel beam's load capacity at high
temperatures. In fact, there is another factor that affects the overall slab deflection in
fire, which is the thermal bowing. A slab which is affected by heat bows towards the
direction of the fire. Since the slab is heated from the bottom, it bows downwards. This
thermal bowing should contribute to the deflection calculations, therefore the
mobilization of tensile membrane action. However, because of the low thermal
conductivity of concrete and the relatively long time it needs to be heated up, the
required period for the slab to bow under the effect of the heat is longer than the period
at which the unprotected steel beam starts to lose strength at elevated temperatures and
becomes dominant. This makes it more probable that the deflection which results from
the degradation of the steel beam's capacity governs the overall deflection of the slab.
The question lies in the extent of the further enhancement generated by the additional
deflection from the thermal bowing; and if this additional deflection leads to further
enhancement at all. This should be checked in future researches, examining the effects
of the thermal deflection of slabs and its contribution to the overall enhancement.
8.3 Other factors affecting the failure mechanism
There are few factors that are believed to have a significant effect on the slab failure
mechanism. These factors should be examined in order to determine the extent of their
influence on tensile membrane action efficiency before the slab failure. These factors
are: bond-slip behaviour, reinforcement heating effect and beam-slab detachment.
8.3.1 Bond-slip behaviour
In composite slabs in fire, two issues regarding the bond-slip behaviour between the
reinforcement and concrete arise: firstly, composite slabs reinforcement is usually anti-
cracking mesh, which its reinforcement is small-diameter bars, typically 6mm. This is
different from the pull-out tests with normal structural reinforcement which is usually
14mm in diameter; secondly, the bond-slip behaviour of the reinforcement bars is
different at elevated temperatures from what it is at ambient temperature. Therefore, in
these conditions the bond behaviour between the reinforcement and concrete might not

Chapter 8- Discussion and Conclusions
144
be similar to normal situations when structural reinforcement at ambient temperature is
used. Two pull-out tests, aimed at studying the bond-slip behaviour, were designed and
conducted in the Heavy Structures lab at the University of Sheffield. However, since the
bond behaviour was not the aim of this study, data analysis related to these tests were
not completed. Nonetheless, for future researches, the design of the tests and their
results are presented in Appendix 3.
8.3.2 Reinforcement heating effect
From the beginning of this study, it was assumed that the gradient heat across the slab's
cross-section is ignored, as mentioned in Section 4.1, since the unprotected downstand
steel beam loses its capacity far quicker than the heat is transferred across the slab's
cross-section. This assumption is strongly justified before cracks form and widen.
However, once the slab cracks, the reinforcement is heated up and therefore it is
affected by the elevated temperatures. This should have consequences on the overall
behaviour of the reinforcement. The effect of the elevated temperatures on the
reinforcement depends on the vertical depth of the mesh within the slab, the width of
the cracks, and the time it takes the crack to form and open as the slab deflects (i.e. the
reinforcement exposure time to elevated temperatures). These factors affect the
reinforcement strength and the bond-slip behaviour as well, and should be investigated
in future researches.
8.3.3 Beam-slab detachment
In composite slabs, composite action is provided by connecting the downstand beams to
the slab by connectors (i.e. shear studs). However, in fire conditions the unprotected
steel beams are quickly heated, therefore they expand quickly. The expansion of the
beam, in addition to the slab deflection as the result of the strength degradation of the
beams due to the elevated temperature which in turn causes cracks to penetrate the slab,
all these factors might lead to the fracture of the shear studs after they yield near the
cracks. This puts the attachment between the slab and the beam in question. The
detachment, if it occurs at all, and its effects should be examined in future researches.

Chapter 8- Discussion and Conclusions
145
8.4 Validation of this study by future research
The validation of this study should be conducted taking into account the limitations that
are mentioned in Section 8.2 in order to correlate with the model proposed by this study.
No suitable isolated furnace tests were reported at the time of this study, except the
COSSFIRE test which was conducted in 2008. However, the test was terminated early
because the reinforcement bars were badly tack-welded together and broke at an early
stage of the test. Therefore, for the purpose of future validation of this study, a proper
slab model is presented in this section in order to be tested by future researchers.
A slab with an aspect ratio of 1.5 can be cast, with unprotected downstand steel beam
attached to it with shear studs. The steel beam should be aligned to the long span of the
slab. Since this study assumes full connection between the composite beam and the slab,
the shear studs should be designed so that they withstand the loads with no shear
fracture.
The slab should be left horizontally unrestrained, which is even easier than the other
alternatives, taking into account that the slab is cast for testing in a lab. However, since
vertical support was assumed with no loss along the perimeter of the slab, the slab
should be supported on its four edges with strong primary beams. This should not
compromise the horizontal unrestraint.
The slab should be reinforced with small reinforcement bars, forming merely anti-
cracking mesh. Typically, a reinforcement bar of the mesh is 6mm in diameter. Setting
the same depth of the reinforcement mesh layer for the theoretical analysis and the test
is key (i.e. at the mid-depth of the slab cross-section). It is worth noting that the slab
does not contain a steel deck, since the deck is assumed to have been detached from the
slab due to the released steam as temperatures increase.
As the cross-section of the slab was assumed to be cool during the analysis, only the
single secondary steel beam should be heated during the test in order to address this
limitation of a cool slab cross-section. This leaves the reinforcement bars cool as the
slab deflects and keeps the bars’ ductility unchanged. The composite slab design is left
to the future researcher according to the budget allowance for the test.

Chapter 8- Discussion and Conclusions
146
Uniformly distributed loads can be provided by loading the slab with sand bags evenly
on its top surface. In order to allow enough temperature increase of the single
unprotected steel beam, the load intensity should not be very low. In the case that the
load is very low, the slab will be unrealistically safe and the slab will not fail in the
proposed pattern. This means that the beam will be heated until it loses its strength
capacity with a probability that the slab does not even fail with virtually zero beam
capacity.
These points can be summarized as follows:
1. Perfect vertical support along the slabs four edges should be provided.
2. The slab should be horizontally unrestrained.
3. The slab is reinforced with anti-cracking mesh.
4. No steel deck is attached to the bottom surface of the slab.
5. A single unprotected steel beam should be attached along the large span of the
slab, attached with strong shear studs to the slab.
6. Only the unprotected steel beam should be heated during the test. The slab
should remain cool.
8.5 Final conclusions
This study presents an extension of the alternative simplified method which was
originally presented in order to replace the existing method of TMA (i.e. the Bailey-
BRE method) due to significant shortcomings in its assumptions and results. However,
although this study itself has its own limitations, still it gives reasonable results. The
importance of this study lies in that it confirms the expected insights about the
behaviour of composite slabs in fire. It extends the alternative simplified method that
was presented in 2014, retaining its advantages while eliminating some flaws of the
Bailey-BRE method regarding the latter being either conservative or unconservative
depending on the reinforcement ratios. Furthermore, this method allows monitoring the
cracks formation and reinforcement fracture as deflection increases at elevated
temperatures. Therefore, real-time monitoring of the slab's load capacity enhancement is
possible, with no need to impose a deflection limit in the elastic range as the Bailey-
BRE method is forced to do, which is intuitively conservative.
Chapter 8- Discussion and Conclusions
147
As the main purpose of this study was to examine the behaviour of the composite action
effect on the enhancement factor as the slab deflects, it was found that the strength
degradation of the unprotected steel beam allows further slab deflection, which in turn
allows work dissipation of the reinforcement, concrete and the steel beam itself. This
work dissipation allows further capacity to be mobilized by the tensile membrane
action. The results of the examination of the unprotected steel beam effect agree with
previous studies regarding slabs at large deflections. Therefore, the answer to one of the
questions of this study, whether the large deflection of composite slabs is also beneficial
as the alternative simplified method shows for flat slabs, the answer is yes. The results
of this research confirm this point, providing that the tensile membrane action is
allowed to be properly mobilized. Slabs at large deflections are able to withstand more
loads and withstand higher temperatures than what was previously thought in the
conventional methods. This is not merely a safety factor; it also has to do with the
economical aspect of the structural design. Leaving the secondary beams within the slab
panels unprotected against fire is beneficial structural-wise as this study shows,
economically efficient and time & effort saving.
Comparisons against the Bailey-BRE method, as shown in Section 7.2.2, confirms that
the latter method is conservative for lightly reinforced slabs. The maximum allowed
temperature that the Bailey-BRE method gives is lower than the maximum temperature
allowed by this study. This was already expected, as the other previous studies showed.
Addressing the limitations of this research should be the course of new studies in this
field. Hence, the recommendations for future researches were already mentioned as the
limitations of this research in Section 8.2, the other important factors to investigate in
Section 8.3 and the validation model proposed for future research in Section 8.4. Some
of these limitations are believed to have an important impact, such as the peripheral
vertical support of the slab and the probability of folding mechanism occurrence. The
other limitations might or might not have a significant influence. Therefore, they also
should be examined.
Although the small-deflection analysis should be implemented carefully, limited to
isotropic reinforcement, the mechanics of the large-deflection analysis can be
confidently used as the basis for future researches in this field. In addition to the small-

Chapter 8- Discussion and Conclusions
148
deflection coding, the complete Matlab code is presented Appendix 2 for future
modifications and development.
References
149
References
Abu, A.K. & Burgess, I.W., 2010. The effect of edge support on tensile membrane action of composite slabs in fire. In Stability and Ductility of Steel Structures. Rio de Janeiro: University of Canterbury. Civil and Natural Resources Engineering, pp. 21–32.
Alexander, R.S., 2002. The World Trade Center Collapse, Institution of Civil Engineers, Proceedings of the Insitution of Civil Engineers, Structures & Buildings 152.
ASFP, 2010. Fire protection for structural steel in buildings 4th ed., Bordon, Hampshire: Association for Specialist Fire Protection.
Bailey, C.G., 2003. Efficient arrangement of reinforcement for membrane behaviour of composite floor slabs in fire conditions. Journal of Constructional Steel Research, 59, pp.931–949. Available at: http://linkinghub.elsevier.com/retrieve/pii/S0143974X02001165 [Accessed October 3, 2014].
Bailey, C.G., 2004. Membrane action of slab/beam composite floor systems in fire. Engineering Structures, 26, pp.1691–1703. Available at: http://linkinghub.elsevier.com/retrieve/pii/S0141029604001853 [Accessed November 11, 2014].
Bailey, C.G., 2001. Membrane Action of Unrestrained Lightly Reinforced Concrete Slabs at Large Displacements. Engineering Structures, 23(5), pp.470–483. Available at: http://linkinghub.elsevier.com/retrieve/pii/S014102960000064X.
Bailey, C.G. & Moore, D.B., 2000a. The structural behaviour of steel frames with composite floors slabs subject to fire—part 1 Theory. Struct Eng, 78, pp.19–27.
Bailey, C.G. & Moore, D.B., 2000b. The structural behaviour of steel frames with composite floors slabs subject to fire—part 2 Design. The Structural Engineer, 78(11), pp.28–33.
Bailey, C.G. & Toh, W.S., 2007. Behaviour of concrete floor slabs at ambient and elevated temperatures. Fire Safety Journal, 42(6-7), pp.425–436.
Burgess, I.W., Dai, X. & Huang, S., 2013. An Alternative Simplified Model of Tensile Membrane Action of Slabs in Fire. In Proceedings of International Conference Application of Structural Fire Engineering. Applications of Structural Fire Engineering conference. Prague, Czech: CTU Publishing House.
Burgess, I.W., Huang, S. & Staikova, S., 2014. A Re-examination of the Mechanics of Tensile Membrane Action in Composite Floor Slabs in Fire. In 8th International Conference on Structures in Fire. Shanghai, China.
Burgess, I.W., Plank, R.J. & Abu, A.K., 2012. The effect of reinforcement ratios on composite slabs in fire. Proceedings of the ICE - Structures and Buildings, 165(7), pp.385–398.
Chen, F.C. & El-Metwally, S.E.D., 2011. Understanding Structural Engineering: From Theory to Practice, Broken Sound Parkway, NW: CRC Press. Available at: https://books.google.co.uk/books?id=zRjOBQAAQBAJ&printsec=frontcover#v=onepage&q&f=false.
Corley, G., Hamburger, R. & McAllister, T., 2002. World Trade Center Building Performance Study: Data Collection, Preliminary Observations, and Recommendations, New York. Available at: http://www.fema.gov/pdf/library/fema403_execsum.pdf.

References
150
Eurocode 3, 2005. BS EN 1993-1-2:2005 Eurocode 3: Design of Steel Structures,
Fletcher, I., Borg, A., Hitchen, N. & Welch, S., 2006. Performance of Concrete in Fire: A Review of the State of the Art , With A Case Study of the Windsor Tower Fire. In Proceedings of the 4th International Workshop in Structures in Fire. Aveiro, Portugal, pp. 779–790.
Foster, S.J., 2006. Tensile Membrane Action of Reinforced Concrete Slabs at Ambient and Elevated Temperatures. PhD. University of Sheffield.
Gann, R.G., 2008. Final Report on the Collapse of World Trade Center Building 7, Federal Building and Fire Safety Investigation of the World Trade Center Disaster (NIST NCSTAR 1A),
Gershon, R.R.M., Magda, L.A., Riley, H.E.M. & Sherman, M.F., 2011. The World Trade Center evacuation study: Factors associated with initiation and length of time for evacuation. Wiley Online Library. Available at: http://onlinelibrary.wiley.com/doi/10.1002/fam.1080/full [Accessed February 6, 2015].
Green, M., Butterworth, N., Burgess, I.W. & Plank, R., 2003. Practical case studies in performance-based structural fire engineering design. In Designing Structures for Fire. Baltimore: American Society of Civil Engineers (ASCE), pp. 259–269.
Gross, J.L. & McAllister, T.P., 2005. Structural Fire Response and Probable Collapse Sequence of the World Trade Center Towers. Federal Building and Fire Safety Investigation of the World Trade Center Disaster (NIST NCSTAR 1-6),
Hamilton, S.R., 2011. Performance-Based Fire Engineering for Steel Framed Structures: A Probabilistic Methodology. PhD. Stanford University.
Hayes, B., 1968a. A Study of the Design of Reinforced Concrete Slab Structures. PhD. University of Manchester.
Hayes, B., 1968b. Allowing for Membrane Action in the Plastic Analysis of Rectangular Reinforced Concrete Slabs. Magazine of Concrete Research, 20(65), pp.205–212.
Hayes, B. & Taylor, R., 1969. Load-testing RC slabs. Consult Eng, 33(11), pp.46–7.
Huang, Z., Burgess, I.W. & Plank, R.J., 2001. The Influence of Tensile Membrane Action in Concrete Slabs on the Behaviour of Composite Steel-framed Buildings in Fire. In ASCE Structures Congress. Washington DC, pp. 1–14. Available at: http://ascelibrary.org/doi/abs/10.1061/40558%282001%2986.
Kemp, K.O., 1967. Yield of a square reinforced concrete slab on simple supports, allowing for membrane forces. The Structural Engineer, 45(7), pp.235–240.
Kennedy, G. & Goodchild, C.H., 2004. Practical Yield Line Design: An introduction to the practical use of Yield Line Theory in the design of flat slabs, raft foundations and refurbishment, Surrey, UK: The Concrete Centre. Made available on the website of the Reinforced Concrete Council.
Kirby, B.R., 1998. THE BEHAVIOUR OF A MULTI-STOREY STEEL FRAMED BUILDING SUBJECTED TO FIRE ATTACK, Rotherham, UK: British Steel, Swinden Technology Centre.
Lennon, T., 2014. BRE-Cardington Steel Framed Building Fire Tests-SM, Available at: http://data.bre.co.uk/page.jsp?id=4.
Lim, L.C.S., 2003. Membrane Action in Fire Exposed Concrete Floor Systems. University of Canterbury.
Mangeon, W., 2013. Behaviour of steel and concrete composite floor slabs at elevated

References
151
temperature. University of Sheffield - Polytech’Clermont Ferrand.
Mattock, A.H. & Kriz, L.B., 1961. Ultimate Strength of Non Rectangular Structural Concrete members. A.C.I Journal, 57.
Meacham, B.J. & Custer, R.L.P., 1995. Performance-Based Fire Safety Engineering: an Introduction of Basic Concepts. Journal of Fire Protection Engineering, 7(2), pp.35–53. Available at: http://jfe.sagepub.com/cgi/doi/10.1177/104239159500700201 [Accessed October 16, 2014].
Newman, G.M., Robinson, J.T. & Bailey, C.G., 2000. Fire Safe Design - A New Approach to Multi-Storey Steel Framed Buildings, SCI-P288, Ascot, Berkshire, UK: Steel Construction Institute.
NIST NCSTAR 1A, 2008. Final Report on the Collapse of World Trade Center Building 7, Gaithersburg, MD, USA.
Parker, D., 2005. Madrid tower designer blames missing fire protection for collapse. New Civil Engineer. Available at: http://www.nce.co.uk/madrid-tower-designer-blames-missing-fire-protection-for-collapse/532985.article [Accessed February 3, 2015].
Pope, R., 2006. Lessons from Madrid. Carba Consulting Ltd.
Purkiss, J.A., 2007. Fire Safety Engineering - Design of Structures 2nd ed., Oxford, UK: Elsevier Ltd.
Sawczuk, A. & Winnicki, L., 1965. Plastic Behavior of simply supported reinforced concrete plates at moderately large deflections. International Journal of Solids and Structures, 1, p.97 to 111.
Staikova, S., 2014. Development of a kinematically correct simplified fire resistance design process for composite floor systems in buildings. The University of Sheffield.
Szilard, R., 2004. Theories and Applications of Plate Analysis: Classical, Numerical and Engineering Methods, WILEY.
Taylor, R., 1965. A Note on a Possible Basis for a New Method of Ultimate Load Design of Reinforced Concrete Slabs. Magazine of Concrete Research, 17.
Vassart, O. & Zhao, B., 2011. Fire Resistance Assessment of Partially Protected Composite Floors (FRACOF), The Steel Construction Institute (SCI).
Wang, Y., Burgess, I.W., Wald, F. & Gillie, M., 2012. Performance-Based Fire Engineering of Structures, Broken Sound Parkway, NW: CRC Press.
Wood, R.H., 1961. Plastic and Elastic Design of Slabs and Plates, London: Thames and Hudson.


Appendix 1- Publications
A1-1
Appendix 1
A1 Publications
The publication which is presented in this appendix was accepted in July 2015 as a
proceeding for the ASFE’15 conference, Croatia.

Appendix 1- Publications
A1-2
THE MECHANICS OF TENSILE MEMBRANE ACTION IN
COMPOSITE SLABS AT HIGH TEMPERATURES
A. Alskeif a, I.W. Burgess
a, S.-S. Huang
a
a Department of Civil & Structural Engineering, University of Sheffield, UK
Abstract
The mechanics of tensile membrane action of thin lightly-reinforced concrete slabs has been re-
examined during the last two years. The re-examination is based on large-deflection plastic
yield-line analysis, applied to flat slabs. As deflection increases beyond the optimum yield-line
pattern, tensile membrane action is mobilized and further load carrying capacity is provided.
This paper represents an extension of this re-examination to include composite slabs at high
temperatures. As temperature increases, the unprotected downstand steel beams significantly
lose capacity, allowing for further deflection until the overall capacity degrades to the applied
load. Tensile membrane action then allows further increase of steel temperature until a
maximum is reached.
Keywords: Tensile membrane action, composite slab, fire, Bailey-BRE method
1 INTRODUCTION
Bailey & Moore (2000a, b) presented a simplified method for the fire design of composite slabs,
based on a calculation of the enhanced load capacity of the slab at large deflection due to its
tensile membrane action, which was originally published by Hayes (1968). The simplified
method considers that, as the unprotected downstand steel beams lose considerable strength at
high temperature, the mechanism by which the slab resists the applied loads changes from
bending resistance to tensile membrane action (TMA) at large deflection. TMA increases as the
downstand steel beams lose strength, allowing for further deflection as temperature increases,
until no further capacity can be mobilized. However, the existing simplified method is based on
empirical assumptions, which are made at many stages without mentioning the effects of these
assumptions. The method considers two components of load enhancement, namely bending
resistance and membrane action, as independent of one another. These two independent
components are eventually combined as one single enhancement, without justifying the
rationality of such a process. Furthermore, the method is based on calculations which use
different neutral axis depths in the x and y directions for the same cross-section, which is
intuitively irrational. Burgess et al. (2013) presented an alternative simplified method based on
the mechanics of TMA using the same yield-line pattern, which had been used by Bailey and
Moore, but with different subsequent kinematic assumptions. This yield-line pattern has been
observed in tests on loaded thin slabs which experience a full-depth central crack penetrating the
slab perpendicular to its long span. The mechanism used in this paper is based on the
equilibrium and kinematics presented by Burgess et al., extended to account for the presence of
the unprotected downstand steel beams at high temperature, and their effects on the yield-line
pattern and enhancement factor.

Appendix 1- Publications
A1-3
2 YIELD LINE MECHANISM AND CRACKING SYSTEM EQUILIBRIUM
As an extension of the work presented by Burgess et al. (2014), the same initial assumptions are
considered in this paper. A two-way rectangular slab of aspect ratio r is considered. The slab is
supported vertically along its four edges, and is reinforced by two layers of isotropic welded
mesh, which lie at its mid-surface. The slab is considered as isolated, but is in no way limited to
this, or to the assumptions mentioned above. However, due to the contribution of the downstand
steel beams, the resulting yield-line pattern is rotated by 90° from that of a non-composite slab,
due to the strength added in the original direction of the yield-line alignment. For the purpose of
this paper, only one steel beam is considered in the study. A comparison of the usual and rotated
alignments of yield-line patterns is shown in Figure 75.
Figure 75: Rotated & normal yield-line alignments
As is the case with the normal yield-line pattern, each resulting flat facet of the slab rotates
about its supporting edge by angles θ or ϕ, as shown in Figure 75. The rotation of these facets
results in the same maximum deflection δ at both yield line intersection points, as shown in
Figure 76.
Figure 76: Rotated yield-line pattern illustrated in 3D
The optimized yield-line intersection dimension in the presence of the steel beam, which is
denoted as N to distinguish the rotated from the normal alignment, is given as:
(1)
θ θ
ϕ ϕ
δ δ
δ δ

Appendix 1- Publications
A1-4
Where K is 2*mP (mP is the sagging moment capacity of the slab), and Mpl is the steel beam
strength capacity. r is the slab aspect ratio, and l is the slab short span. This represents the level
at which the yield-line capacity is minimized. It is highly unlikely that the optimum yield-line
pattern will change after the yield lines have been formed. Temperature increase allows further
increase of deflection due to weakening of the steel beam, allowing further capacity to be
mobilized by tensile membrane action. As the deflection increases, the compression block depth
in the central region of the slab decreases until it disappears completely, when the whole central
area is then in pure tension. During this retreat of compression from the central region of the
slab, the stress blocks on the diagonal yield lines change from trapezoidal to triangular, and its
depth at a slab corner can increase until the whole slab corner is in compression as shown in
Figure 77 Concrete dissipates internal work wherever slab elements are in contact. The
reinforcement dissipates internal work when it is plastically stretched under tension. The extent
by which the cracks between facets of the slab widen during deflection plays a crucial role in
determining the existence of both the concrete compression blocks and reinforcement tension
zones.
Figure 77: Compression block phases shown at the edge of the slab as deflection increases
As shown in Figure 77, it is possible for compression and tension to co-exist over a complete
yield line cross-section. However, as the crack widens the compression zones move towards the
corners and tension exists wherever the mesh lies below the neutral axis. Only reinforcement
bars which are in tension are considered in the calculation of energy dissipation. Therefore, only
those between any intersection with the neutral axis and the limiting distances YLim,x (for x-
aligned bars) and XLim,y (for y-aligned bars) at which the bars fracture are taken into account in
calculation of load capacity. When the slab deflects, its facets rotate about the yield-lines by the
rotation angles at its supporting edges. This results in the beams spanning the cracks to extend
in a similar fashion to the reinforcement bars as shown in Figure 78. This extension of the

Appendix 1- Publications
A1-5
heated steel beams results in dissipation of plastic work which has to be included in the load
capacity calculation.
Figure 78: Extension undergone by the downstand beam, and reinforcement
Due to the compression stress blocks in the concrete, and the extensions of the reinforcement
and the steel beams, in-plane equilibrium of the slab facets must exist under the compression
and tension forces crossing the yield lines. The forces involved in this equilibrium are shown in
Figure 79. Tx1 and Tx2 represent reinforcement tension forces on Elements 1 and 2 respectively
in the x-direction. Ty1 is the reinforcement tension force in the y-direction. Tb is the tension force
generated by the extension of the downstand beam. C & Cx2 are the resultant concrete
compression forces and S represents the resultant shear force between facets on a diagonal yield
line. When the central yield line opens as the slabs facets lose contact, Cx2 disappears abruptly,
leaving only the pure reinforcement tensile force across this yield line. Along the diagonal
yield-lines, this complete separation does not occur, but it develops progressively, starting from
the intersection point of the yield-lines, towards the corner of the slab, effectively “unzipping”
the mesh.
Figure 79: Force equilibrium on the slab elements
Eliminating the shear force S, the equilibrium state can be expressed by the equation:
(2)
In which the forces are given by:
(3)
(4)
(5)

Appendix 1- Publications
A1-6
(6)
(7)
The terms (XLim,y-XT), and (YLim,x-YT) are the distances over which the reinforcement bars are still
intact and generating their full yield strength. fpx and fpy are reinforcement forces in both
directions. A1x and A2x are the compression block areas, as illustrated in Figure 77.
3 KINEMATICS OF THE SOLUTION
The forces, which were calculated above, are substituted into the equilibrium equation and
expressed as a function of the horizontal movement in the y-direction ∆y as shown in Figure 80.
Y is taken as the major direction in the calculations since it is the direction of the obtained
rotated yield-line pattern. This horizontal movement ∆y changes as deflection increases. A
program has been coded in Matlab to conduct a deflection-controlled iteration. At each
deflection level, the temperature is increased, until the slab capacity has degraded to the level of
the applied load. This allows further deflection until a maximum load capacity is reached and
the slab is considered to have structurally failed.
Figure 80: Horizontal movements seen from the top surface of the slab
The calculated forces and geometry allow the calculation of the internal energy dissipated
within the slab, which allows the calculation of the load capacity of the slab P. The internal
plastic work of the reinforcement is expressed using the plastic stretch of the bars across the
widening crack width between the slab elements. As for concrete areas which are still in
contact, the internal energy is expressed in terms of the compression forces between the
overlapped elements. The loss of potential energy of the transverse loading on the surface of the
slab P is calculated similarly to the optimal small-deflection yield-line mechanism, and is given
as:
(8)
Where: E is the external work done by loads; δ is the maximum deflection of slab elements.
According to plastic energy theory, external work done = internal energy dissipated. This gives
the load capacity of the slab as:
(9)
Where: Is is the internal work of the slab. The iteration increases the temperature of the
unprotected steel beams until this calculated load capacity P has reduced to the applied load.
Then the deflection loop is repeated. This iteration continues until no further increase is
possible. The enhancement is taken in terms of the temperature calculated at the end of every
internal loop.
4 APPLICATION OF THE METHOD

Appendix 1- Publications
A1-7
A composite slab will be considered in order to demonstrate the application of the newly
extended method. The slab used in the Matlab model is 9m by 6m with an aspect ratio r=1.5;
thickness t=130mm; reinforced by isotropic A142 mesh (142mm2/m in both directions) located
at the slab mid-depth; The mesh bar spacing is 200mm. Reinforcement ductility=5%; Yield
stress of reinforcement fp,x,y=500MPa; Beam section (UKB 406x140x39); Yield stress of the
steel beam fy=355MPa; Concrete characteristic strength fc=35MPa. Uniformly distributed
transverse loading on the slab= 4kN/m2. The result of the analysis is shown in Figure 81.
Figure 81: (a) represents temperature against deflection; (b) represents crack width development
against deflection. The vertical lines (I) to (IV) define phase changes through the process
Figure 81(a) shows the enhancement in terms of temperature against normalized deflection.
Figure 81(b) shows the development of the crack widths of the diagonal yield-lines in the x and
y directions. It also monitors the development of the central yield-line crack width β. The limit
crack width, demonstrated by a horizontal line, represents the limit at which reinforcement
fractures. The vertical line (I) in Figure 81(b) represents the end of the first phase at which the
compression stress block becomes triangular on the diagonal yield lines of the slab, while
compression disappears from the central yield line. The end of second phase witnesses the
fracture of the mid yield-line bars, coinciding with a temperature decrease which gives the first
peak shown in Figure 81(a). The final two phases account for the unzipping of the bars in the y-
direction and then x and y, respectively. However, if it happens that the slab cools down before
any of the temperature enhancement peaks, shown in Figure 81(a), has been reached, the slab
will survive with its current reinforcement and crack status, and the rest of the chart will simply
be theoretical in this case. If, on the other hand, the temperature happens to rise higher than the

Appendix 1- Publications
A1-8
temperature enhancement peak for the same slab configurations, the slab fails due to excessive
temperature and the rest of the enhancement chart does not apply any more. Similarly, the slab
forces, shown in Figure 82, which have been illustrated in thinner lines after the second peak,
account for the theoretical course of action which might change in case the factual fire scenario
differs from the theoretical one.
Figure 82: Internal forces on the slab facets
5 CONCLUSIONS
This paper has demonstrated an extension of the alternative simplified method which accounts
for composite slabs with unprotected downstand steel beams at high temperature. The analysis
conducted in this study is based on plastic yield-line mechanism at large deflection. The
temperature is assumed only to affect the unprotected steel beams since concrete has low
thermal conductivity, which causes the unprotected steel beams to heat faster, leaving the
reinforcement at a relatively cool temperature. Temperature increase controls the enhancement,
accounting for the reinforcement fracture that occurs when the slab experiences large
deflections, as the unprotected steel beams lose capacity. The enhancement depends on the
temperature to which the slab is subjected, and different fire scenarios will affect the actual
enhancement.
REFERENCES
Bailey, C.G. & Moore, D.B., 2000. The structural behaviour of steel frames with composite
floors slabs subject to fire—part 1 Theory. Struct Eng, 78, pp.19–27.
Burgess, I.., Huang, S. & Staikova, S., 2014. A re-examination of the mechanics of tensile
membrane action in composite floor slabs in fire. In 8th International Conference on
Structures in Fire. Shanghai, China.
Burgess, I.W., Dai, X. & Huang, S., 2013. An alternative simplified model of tensile membrane
action of slabs in fire. ASFE 2013, Prague.
Hayes, B., 1968. Allowing for Membrane Action in the Plastic Analysis of Rectangular
Reinforced Concrete Slabs. Magazine of Concrete Research, 20(65), pp.205–212.
Appendix 2- Code Scripts and Coding Methodology
A2-1
Appendix 2
A2 Code Scripts and Coding Methodology
A2.1 Introduction
The analysis of this study comprises two distinguishable parts: small-deflection and
large-deflection analyses. In this appendix, the methodology of the coding of both parts
of the analysis is presented with the full code scripts attached in the end of each analysis
part.
The first part of this study (i.e. the small-deflection analysis) was coded in Microsoft
Excel- Visual Basic macro in order to determine the characteristics of the optimum
yield-line pattern of the composite slab at elevated temperatures.
The second part of the analysis (i.e. the large-deflection analysis) which forms the core
of this study, was coded in Matlab in order to conduct the controlled-deflection iteration
of the composite slab at elevated temperatures until failure.
A2.2 Coding methodology
A2.2.1 Small-deflection coding
The derivations of the small-deflection analysis were fully presented in Chapter 6. The
equations that resulted from these derivations were coded in Microsoft Excel- Visual
Basic macro. The slab parameters should be entered in details; for example, the slab
dimensions, reinforcement diameter and the vertical depth of the mesh within the slab,
the yield stress of reinforcement and concrete, the applied load and the strength capacity
of the unprotected secondary steel beam. These parameters were entered in the

Appendix 2- Code Scripts and Coding Methodology
A2-2
spreadsheet and then imported by the visual basic code when the Run macro button was
clicked.
The equations of the optimized yield-line intersection point distances n and N were
coded in order to calculate the initial yield-line load capacity P at ambient temperature.
The analysis started from 400ºC, rather than 20ºC since the Eurocodes define the
reduction factor of the yield strength of the steel ky as constant and equals one, when the
temperature is less than or equals 400ºC (Eurocode 3 BS EN 1993-1-2: 2005). Hence, it
is a waste of time to raise the temperature in small increments from 20ºC to 400ºC, as
this makes a noticeable difference in computational time of this program. Calculations
were done to determine if the yield-line pattern was aligned to the x or y-direction, so
that the analysis was conducted according to the detected mechanism. Although the
yield-line pattern was theoretically rotated (aligned to the y-direction) in the presence of
a downstand secondary steel beam, both alignments were derived and coded to double
check this issue. It was found later that when at least one steel beam existed, the initial
and the optimum yield-line patterns (when the pattern forms) were rotated by 90o. This
check, however, was conducted in order to be certain that the large-deflection analysis
was conducted on correct basis.
Once the yield-line load capacity was calculated at the current temperature, it was
compared to the applied load on the slab. If the load capacity is higher than the applied
load, the temperature is increased by a small increment and the reduction factor of the
yield strength ky is calculated according the newly increased temperature in a new loop.
The steel strength reduction factor ky was calculated according to the Eurocode 3. It
decreased as the temperature increased. Since heating across the cross-section of the
slab was not considered in this study, only the strength capacity of the steel beam was
reduced by the steel reduction factor as the temperature increased. In the new loop, the
parameters (i.e. the yield-line parameter N and load capacity P) were calculated again in
the light of the new increased temperature. The new yield-line capacity P was compared
again to the applied load Pa. Temperature was increased, decreasing the capacity of the
unprotected steel beam until the yield-line capacity degraded to the level of the applied
load (i.e. P=Pa). At this point, the final temperature, which led to the reduction of the
yield-line capacity to the level of the applied load, was called the critical temperature
Tcr. The corresponding yield-line intersection distance N defines the optimum yield-line
pattern. After this point it is highly unlikely that the already formed yield-line pattern

Appendix 2- Code Scripts and Coding Methodology
A2-3
changes. The yield lines rather crack if further deflection is experienced beyond the
point of their formation.

Appendix 2- Code Scripts and Coding Methodology
A2-4
A2.2.2 Small-deflection analysis coding flowchart

Appendix 2- Code Scripts and Coding Methodology
A2-5
A2.2.3 Small-deflection analysis code script – Visual Basic
Sub complete()
'Defining the parameters
Dim ti 'initial T
Dim tj 'next step T
Dim ky 'reduction factor Ky
Dim deltat 'Delta T
Dim deltap 'P - pa
Dim Ddeltap, Dd 'For deltap refine process
Dim nj 'new n
Dim Sj, acj, bj, n, k, e, r, m, mp, l, p, pa, Mky, pre
'MAIN PARAMETERS
pa:
mp = Range("g1")
l = Range("g2")
k = (2 * Range("G1"))
r = Range("b2")
m = Range("b4")
Range("h18") = "" 'reset
tj = 400 'starting from 400 doesn't affect initial steps
pre = Range("c22") 'precision of temperature increment increase
If pre < 0.01 Or pre > 5 Then
Range("c22") = 0.5
pre = Range("c22")
End If
Rotated:
'start with Rotated alignment since the slab contains steel beams - highly likely to be
rotated-aligned
Range("d19") = "N" 'Telling the user that the process is currently at Rotated
Alignment
ky = 1 'for initial step
m = m * ky
Mky = m
a = (2 * k * l ^ 2 / 3) + (4 * m * l / 3)
b = 2 * k * r ^ 2 * l ^ 2 / 3
c = -0.5 * k * r ^ 2 * l ^ 2
n = (-b + Sqr((b ^ 2) - 4 * a * c)) / (2 * a)
'Range("a12") = "N=" 'Telling the user that the process is currently at Rotated
Alignment
If n > 0.5 Then GoTo Normal
p = ((k * r / n) + (2 * k / r) + (4 * m / (r * l))) / (0.5 * r * l ^ 2 - r * l ^ 2 * n /
3)
pa = Application.InputBox(Prompt:="Enter Applied Load Value; or enter 0 to exit",
Title:="Pa", Type:=1)
If pa = False Then
MsgBox ("You entered 0 value. Application will end")
End
End If
If pa > p Then
MsgBox ("Applied Loads cannot be bigger than slab's capacity at ambient temperature")
GoTo pa
End If
Range("b18") = pa
Do
tj = tj + pre 'Start increasing temperature gradually
If tj > 1200 Then
MsgBox ("Applied Load is too small to cause collapse")
tj = 400
GoTo pa
End If

Appendix 2- Code Scripts and Coding Methodology
A2-6
' Calculating corresponding Ky for the new tj temperature
If 20 < tj And tj < 400 Then
ky = 1
ElseIf 400 <= tj And tj < 500 Then
ky = 1 - 0.22 * (tj - 400) / 100
ElseIf 500 <= tj And tj < 600 Then
ky = 0.78 - 0.31 * (tj - 500) / 100
ElseIf 600 <= tj And tj < 700 Then
ky = 0.47 - 0.24 * (tj - 600) / 100
ElseIf 700 <= tj And tj < 800 Then
ky = 0.23 - 0.12 * (tj - 700) / 100
ElseIf 800 <= tj And tj < 900 Then
ky = 0.11 - 0.05 * (tj - 800) / 100
ElseIf 900 <= tj And tj < 1000 Then
ky = 0.06 - 0.02 * (tj - 900) / 100
ElseIf 1000 <= tj And tj < 1100 Then
ky = 0.04 - 0.02 * (tj - 1000) / 100
ElseIf 1100 <= tj And tj < 1200 Then
ky = 0.02 - 0.02 * (tj - 1100) / 100
ElseIf 1200 <= tj Then
ky = 0
End If
'##########################################
Mky = Mky * ky 'Reduced moment strength
Range("a20") = tj
a = (2 * k * l ^ 2 / 3) + (4 * Mky * l / 3) 'new a
n = (-b + Sqr((b ^ 2) - 4 * a * c)) / (2 * a)
If n > 0.5 Then GoTo Normal
p = ((k * r / n) + (2 * k / r) + (4 * Mky / (r * l))) / (0.5 * r * l ^ 2 - r * l ^ 2 * n
/ 3)
If p > pa Then
Mky = m
Else
Range("a20") = tj
Range("b20") = p
Range("c20") = p - pa
Range("d20") = n
End
End If
Loop
'###################################################################
Normal: 'Normal Allignment
' Increasing Temperature gradually
Range("d19") = "n" 'to tell that the process is at normal alignment
'MAIN PARAMETERS
pa_n:
Mky = m
a = (2 * k * r * l ^ 2 / 3)
b = (2 * k * l ^ 2 / 3) + (4 * m * l / 3)
c = -0.5 * k * r * l ^ 2 - m * r * l
n = (-b + Sqr((b ^ 2) - 4 * a * c)) / (2 * a)
p = (2 * k * r * n + k + 2 * m / l) / ((2 * n ^ 2 * l ^ 2 / 3) + 0.5 * n * l ^ 2 * r - n
^ 2 * l ^ 2)
Range("h18") = p
Do
tj = tj + pre 'Start increasing temperature gradually
If tj > 1200 Then
MsgBox ("Applied Load is too small")
tj = 400
End
End If
' Calculating corresponding Ky for the new tj temperature
If 20 < tj And tj < 400 Then
ky = 1

Appendix 2- Code Scripts and Coding Methodology
A2-7
ElseIf 400 <= tj And tj < 500 Then
ky = 1 - 0.22 * (tj - 400) / 100
ElseIf 500 <= tj And tj < 600 Then
ky = 0.78 - 0.31 * (tj - 500) / 100
ElseIf 600 <= tj And tj < 700 Then
ky = 0.47 - 0.24 * (tj - 600) / 100
ElseIf 700 <= tj And tj < 800 Then
ky = 0.23 - 0.12 * (tj - 700) / 100
ElseIf 800 <= tj And tj < 900 Then
ky = 0.11 - 0.05 * (tj - 800) / 100
ElseIf 900 <= tj And tj < 1000 Then
ky = 0.06 - 0.02 * (tj - 900) / 100
ElseIf 1000 <= tj And tj < 1100 Then
ky = 0.04 - 0.02 * (tj - 1000) / 100
ElseIf 1100 <= tj And tj < 1200 Then
ky = 0.02 - 0.02 * (tj - 1100) / 100
ElseIf 1200 <= tj Then
ky = 0
End If
Mky = Mky * ky 'Reduced moment strength
Range("a20") = tj
'New parameters
b = (2 * k * l ^ 2 / 3) + (4 * Mky * l / 3)
c = -0.5 * k * r * l ^ 2 - Mky * r * l
n = (-b + Sqr((b ^ 2) - 4 * a * c)) / (2 * a)
p = (2 * k * r * n + k + 2 * Mky / l) / ((2 * n ^ 2 * l ^ 2 / 3) + 0.5 * n * l ^ 2 * r -
n ^ 2 * l ^ 2)
If p > pa Then
Mky = m
Else
Range("a20") = tj
Range("b20") = p
Range("c20") = p - pa
Range("d20") = n
End
End If
Loop
End Sub

Appendix 2- Code Scripts and Coding Methodology
A2-8
A2.2.4 Large-deflection coding
A2.2.4.1 Geometrics of the deflected slab
The large-deflection analysis was coded in Matlab in order to conduct a deflection-
controlled iteration of two intersected loops: deflection and temperature. As explained
in Chapter 4, in the large-deflection analysis deflection was increased in increments
beyond the optimum yield-line pattern until the load capacity of the slab degraded to the
level of the applied load, then the temperature was increased to reduce the capacity
strength of the unprotected secondary downstand steel beam, allowing further deflection
and therefore the mobilization of tensile membrane action. In conventional methods, the
optimum yield-line capacity is considered as the failure load of the slab. But as a main
goal of this study, the composite slab was allowed to deflect further, allowing further
load-capacity beyond the limit of conventional load limit.
The yield-line intersection point distance N was the only parameter that was imported
from the small-deflection analysis output in order to be used in the large-deflection
analysis. The optimum yield-line capacity that resulted from the small-deflection
analysis was not used in this part; and the critical temperature of the optimum yield-line
pattern was not used here either. The large-deflection analysis started over from 400ºC
since the computational time of this stage of analysis is trivial and not noticeable.
The detailed specifications of the composite slabs should be entered to the Matlab
program, such as: the beam cross-section height, the area and the yield stress of the
beam; the dimensions of the slab, reinforcement details such as the diameter of the bars
that form the mesh, the vertical depth of the mesh within the slab, spacing of the bars
and the ductility and yield stress of the reinforcement. Furthermore, the characteristic
strength of concrete should be entered. The yield-line intersection point distance N
should be entered as it resulted from the previous small-deflection analysis. The
transversely applied load which should definitely be the same.
The iteration started by the calculation of the rotation angles of the slab elements (i.e. θ
and ϕ) and the movement components that result from these rotations, as
mathematically explained in Section 6.3. These values, and the rest of the calculations,

Appendix 2- Code Scripts and Coding Methodology
A2-9
were calculated for every single increment of the increasing deflection. The equations of
each case scenario were coded in order to calculate the horizontal movement in the main
direction ∆y, which resulted from the increasing deflection of the slab. The limit crack
was calculated at the beginning as explained in Chapter 4, depending on the
reinforcement bars ductility and spacing.
A2.2.4.2 Checking flags
It was mentioned in Chapter 8 that the sequence which the cases follow as the slab
deflects, was monitored and not dictated by any means. All cases were fully coded, but
the sequence of these cases was monitored through checking flags that determine which
of the cases was active at each moment through the analysis phase. These flags are sets
of IF conditional statements. Based on the results of these statements, the flags were
given certain values (1 or 0, or even other values as required); digitally simulating True
or False output. Depending on the results of these conditional statements (1 or 0 for
example), the required actions and considerations can be taken later in the code.
After the horizontal movement of every single scenario case was calculated, a set of flag
checks was conducted to check whether this case was, or was not, valid at every
moment of the analysis (i.e. currently active for the current deflection phase). These
flags are:
Compression above the reinforcement bars:
It is valid (therefore its flag =1) as long as ∆y < ϕ.μ.t. Hence, it [compression]
exists as long as the horizontal movement in the y-direction is smaller than the
distance that results from the rotation ϕ. If not, the flag value is zero.
Compression in the central yield-line:
It is valid (i.e. its flag given a value of 2 to distinguish it from the previous flag)
as long as the horizontal displacement in the y-direction ∆y is smaller than the
increasing distance resulted from the rotation of the slab element ϕ 2
.N.l/2.
Middle yield-line reinforcement unbroken in the x-direction:
It is true (hence its flag = 4) if the limit crack width is bigger than double the
current crack width at the corresponding point of the yield-line. The limit crack
is compared to double the value of the existing crack because the central yield-

Appendix 2- Code Scripts and Coding Methodology
A2-10
line consists of a crack width that comes from the rotation from both the slab
elements from both sides of the horizontal axis of the slab.
Diagonal yield-line reinforcement in the x-direction unbroken:
True (hence the flag is given a value 8) when the limit crack width is bigger than
the calculated existing crack widths in the x-direction.
Diagonal yield-line reinforcement in the y-direction unbroken:
True (hence the flag is given a value 16) when the limit crack width is bigger
than the calculated existing crack widths in the y-direction.
Case Flag:
This flag is the sum of all the previous flags. This flag is used to check if a
particular case is valid (currently in action) or not. Each case scenario has a
particular configuration of intact and fractured reinforcement in order to be
activated or not. For example, case (b1’) at which the compression stress block
is triangular and the reinforcement of the central yield-line fractured, this case is
activated when only the flag of the unbroken middle yield-line reinforcement is
zero (i.e. false). Therefore, if the case flag of case (b1’)= 1+2+0+8+16=27, then
case(b1’) is currently valid and the slab is going through this case scenario at the
moment. These summed numbers are the values of the all the flags, respectively.
Other cases have other values in order to be valid. For example, scenario case
(b1***) represents a slab with its middle yield-line reinforcement had already
fractured, and its reinforcement along the diagonal yield-lines are being
fractured (unzipping) in the x and y directions. Thus, for the validation flag of
case (b1***) to be true, the corresponding case flag should equal 1+2+0+0+0=3.
Validation Flag
A particular scenario case is currently valid if the case flag takes its
corresponding value. Taking the two examples which were mentioned in the
case flag explanation, if the case flag occurs to equal 27, then the current case in
action is certainly case (b1’), and the validation flag of this case is given the
value 1, pointing out that this case is true currently. Otherwise, for other values
of the case flag, the validation flag of case (b1’) is zero, i.e. false. If the case flag
occurs to equal 3, then the slab is going through case (b1***), and its validation
flag equals 1, otherwise the validation flag equals 0 and this case is not currently

Appendix 2- Code Scripts and Coding Methodology
A2-11
active. Duplication of active cases is not possible, and if it occurs it points out to
coding or calculation error. This did not occur during this study, but if it does in
any future researches, checks and corrections must be done.
According to this set of the flags for each case, monitoring the sequence of the cases
that the slab went through is possible for every deflection level. Depending on the
activated flags of each case, therefore the current scenario case of the analysis, the
geometric parameters of the slab were calculated; like: z1 and z2 (i.e. the depth of the
compression at the edge of the slab and at the intersection point of the yield-lines,
respectively), the area of concrete compression stress blocks.
A2.2.4.3 Yield-lines crack widths
The crack widths across the yield-lines on the slab were calculated by the geometric
changes as the slab deflects. These changes comprise the slab elements rotations and the
horizontal movements of the elements ∆x and ∆y. The crack width of the central yield-
line is constant, according to the yield-line theory. However, since the crack width of
the diagonal yield-line has variable width, changing from its maximum at the
intersection points of the yield lines and getting narrower and closing at the corners of
the slab, the width of a diagonal yield line was taken at the middle of the distance which
covers the intact-working reinforcement bars. This is important for the calculations of
the internal work.
A2.2.4.4 Internal work
The internal work is the force multiplied by the corresponding deformation. This
applied to the internal work dissipated by the concrete, reinforcement bars and the
downstand steel beam.
A2.2.4.4.1 Reinforcement
The internal work of the reinforcement is the reinforcement force multiplied by the
corresponding deformation. Reinforcement deformation is the extension of the
reinforcement across the cracks, as explained in Chapter 5. Therefore, it is taken as the
corresponding crack width, unless this crack width exceeds the limit-crack width, so

Appendix 2- Code Scripts and Coding Methodology
A2-12
that the corresponding reinforcement bar is then considered fractured and technically
out of service.
A2.2.4.4.2 The downstand steel beam
The internal work dissipated by the beam is the extension undergone by the beam under
the deflection, multiplied by the tension force of the beam. This was explained in
Chapter 4.
A2.2.4.4.3 Concrete
The internal work of concrete is the area of the compression stress block multiplied by
the corresponding compression force. The internal work is dissipated where
compression exists; therefore, it disappears when a crack opens and the slab facets
widen.
A2.2.4.5 Load-capacity of the slab
Once the total internal work of the slab is calculated, the external work done by the
transverse loads on the slab is worked out as the follows:
(A.2.1)
The term
represents the external work done by the load, divided on p,
as derived in Section 6.2.1, Equation 73.
A2.2.4.6 Temperature enhancement
Once the slab's load capacity P is calculated for every deflection increment, it is
compared to the applied load on the slab Pa.
If P>Pa , then the temperature is increased by a small-constant increment and a new
loop calculates the load capacity of the slab after the strength of the unprotected steel

Appendix 2- Code Scripts and Coding Methodology
A2-13
beam is degraded by the newly increased temperature. If the load capacity of the slab is
still higher when they are compared again, the temperature is further increased, and so
on. This is repeated until the load capacity of the slab degrades and equals the applied
load of the slab (i.e. P=Pa). At this point, the temperature, which caused the load
capacity of the slab degradation to the level of the applied load, is saved as the limit
temperature of the current deflection level. Then, deflection is increased further, and
more tensile membrane action is mobilized, allowing more strength and therefore more
temperature increase. Meanwhile, the reinforcement fractures, marking temperature
enhancement peaks as presented in Chapter 7, Figure 70; or even temperature
enhancement degradation until no further strength can be mobilized, and the slab fails.
When P<Pa, and this happens once a certain set of reinforcement fractures at high
temperature, the temperature is decreased until the load capacity of the slab meets the
applied load, and so on. The results of these conditional statements are presented as the
temperature enhancement which was presented in Chapter 7.
P<Pa (i.e. the load capacity of the slab is lower than the applied load) occurs when
reinforcement fractures at high temperature as the slab deflects. This tells that the slab
became weaker after some of the reinforcement fractured; therefore the slab cannot
withstand the applied loads at such an elevated temperature and the corresponding
deflection level. The temperature is therefore reduced, so that the load capacity of the
slab increases and meets the applied load level again. This temperature reduction gives
the maximum temperature that the slab can withstand at the current temperature and
deflection level. It should be noted that this situation (i.e. P<Pa) is not allowed to
happen at the start of the analysis, as this is considered as an input error at which the
program user entered a higher applied load than the slab can initially withstand. The
program asks the user to re-enter the applied load properly so that it is within the slab’s
strength capacity. This error should not occur anyway, since the slab survived the
applied load in the small-deflection analysis in the first place.
The detailed results of the Matlab code cannot be presented in details in this thesis. The
output table is 900 x 98 lines and columns. Nonetheless, the output presentation is by no
means necessary.

Appendix 2- Code Scripts and Coding Methodology
A2-14
A2.2.5 Large-deflection analysis coding flowchart

Appendix 2- Code Scripts and Coding Methodology
A2-15
A2.2.6 Large-deflection code - Matlab
clear all
pa= 0.004; %0.01; %'APPLIED LOAD';
&&&&&&&&&&&&&&&&&&&&&&&&&&&&&&&&&&&&&&&&&&&&&&&&&&&&&&&&&&&&&&&&&&&&&&&&&&&&&&
&&&&&
N=0.41800;
A=4970; 'steel beam area
ha=398; 'steel beam height';
r=1.5;
l=6000;
'mm2/m , reinforcement area';
As=141.4;
sp=200; %rebar spacing
duc=5; %percent; %Ductility of rebars
fy=355; beam'
tj=400; 'initial temperature'
[p]=capacity(j); 'only to establish the load capacity empty matrix before it
is calculated.
'MPa , rebar strength';
fs=500 ;
fpx=As*fs/1000;
fpy=fpx;
mu=0.5;
t=130;
tau=t/l;
fc=35;
crk=sp*duc/100; %Crack width at yield line
dlimy=crk/l; %dlimy/l
dlimx=dlimy; %dlimy/l
'dlimx & y are dimensionless ( /l)';
gam=acos(1/(1+4*N^2)^0.5);
hc=t; 'concrete slab thickness';
ky=1;
if pa>p(1) %This is to terminate the code if applied load is larger than
the capacity of the slab from the beginning
warndlg('Applied Load > Slab Capacity. Change Applied Load Value','Code
Terminated')
break
end
mainstep=0.5; %temperature raise step
for i=1:900
tt=0 %to measure the internal loop steps
step=mainstep;
% tj=tj+step; stopped for now
%p(i)=1.1*pa;
if i==287
tete=1
end

Appendix 2- Code Scripts and Coding Methodology
A2-16
while pa;
'Calculate the corresponding ky';
if 20 < tj & tj < 400 ;
ky = 1;
elseif 400 <= tj & tj < 500 ;
ky = 1 - 0.22 * (tj - 400) / 100;
elseif 500 <= tj & tj < 600 ;
ky = 0.78 - 0.31 * (tj - 500) / 100;
elseif 600 <= tj & tj < 700 ;
ky = 0.47 - 0.24 * (tj - 600) / 100;
elseif 700 <= tj & tj < 800 ;
ky = 0.23 - 0.12 * (tj - 700) / 100;
elseif 800 <= tj & tj < 900 ;
ky = 0.11 - 0.05 * (tj - 800) / 100;
elseif 900 <= tj & tj < 1000 ;
ky = 0.06 - 0.02 * (tj - 900) / 100;
elseif 1000 <= tj & tj < 1100 ;
ky = 0.04 - 0.02 * (tj - 1000) / 100;
elseif 1100 <= tj & tj < 1200 ;
ky = 0.02 - 0.02 * (tj - 1100) / 100;
elseif 1200 <= tj
ky = 0;
end
%other cases include phi so they were put inside the loop
' -----------------------------------------------------------------Note-
1';
if i==1
delta(i)=0.000001;
else
delta(i)=0+(i/10000);
end
theta(i)=asin(2*delta(i)/r);
phi(i)=asin(delta(i)/N);
%phi(i)=asin(2*delta(i)); OLD
delta_ry(i)=phi(i)*mu*tau;
delta_cy(i)=phi(i)^2*0.5*N;
'Case a1 parameters ===========';
AB=0.5*r*l^2*fpy;
AC=2*N*(l/r)*(fpx*0.5*l+0.5*A*ky*fy); '0.5*A*ky because half of the beam
is taken - half a beam included in the considered quarter section of the slab
';
AD=N*l^3*fc*((-N/r)+2*(N^2/r)-(N/(4*sin(gam)*cos(gam)))) ;
AE=fc*l^3*(2*(N/r)-4*(N^2/r)+N/(sin(gam)*cos(gam))) ;
'Case b1 parameters ===========';
b1a=fpy*0.5*r*l^2+fpx*l^2*N/r+(0.5*A*ky*fy)*l*2*N/r;
b1b=sin(gam)*cos(gam);
b1c=fc*l^3;
'Case b1p (b1 prime) parameters ===========';
b1pa=(0.5*fpy*r*l^2)+(fpx*2*N^2*l^2/r)+(0.5*A*ky*fy*l*2*N/r);
b1pb=b1b;
b1pc=b1c;
'Case b1t (b1* star) parameters ===========';
b1ta(i)=fc*l^3/(phi(i)^3*sin(gam)*cos(gam));

Appendix 2- Code Scripts and Coding Methodology
A2-17
b1tb(i)=-fpy*r*l^2/(N*phi(i)^2);
b1tc(i)=-((fpy*r*l^2*dlimy/(N*phi(i)^2))-
(fpy*r*l^2*mu*tau/(N*phi(i)))+(N*l^2*fpx/r)+(2*N*l*0.5*A*ky*fy/r));
'Case b1pt (b1 prime-star) parameters ===========';
b1pta(i)=fc*l^3/(phi(i)^3*sin(gam)*cos(gam));
b1ptb(i)=-fpy*r*l^2/(N*phi(i)^2);
b1ptc(i)=-(dlimy*(fpy*r*l^2/(N*phi(i)^2))-
(mu*tau*fpy*r*l^2/(N*phi(i)))+(2*N^2*l^2*fpx/r)+(2*N*l*0.5*A*ky*fy/r));
'Case b1tt (b1 prime-Double star) parameters ===========';
b1tta(i)= fc*l^3/(phi(i)^3*sin(gam)*cos(gam));
b1ttb(i)= -4*N*l^2*fpx/(r*phi(i)^2);
b1ttc(i)= -(((fpy*0.5*r*l^2)+2*l^2*fpx*dlimx/(phi(i)^2))-
(4*fpx*N*l^2*mu*tau/(r*phi(i)))+2*N*l*0.5*A*ky*fy/r);
'Case b1tr (b1 Triple-star) parameters ===========';
b1tra(i)= fc*l^3/(phi(i)^3*sin(gam)*cos(gam));
b1trb(i)= -((fpy*r*l^2/(N*phi(i)^2))+(4*fpx*N*l^2/(r*phi(i)^2)));
b1trc(i)= -(fpy*r*l^2*(((dlimy/phi(i))-
mu*tau)/(N*phi(i)))+(4*N*l^2*fpx*((dlimx*r/(phi(i)*2*N))-
mu*tau)/(r*phi(i)))+(2*N*l*0.5*A*ky*fy/r));
'Case b2 parameters ==================================';
b2a(i)=fc*l^3/(phi(i)^3*sin(gam)*cos(gam));
b2b(i)=(fpy*r*l^2/(N*phi(i)^2))+(4*fpx*N*l^2/(r*phi(i)^2));
b2c(i)=-
(fpy*0.5*r*l^2+fpy*r*l^2*mu*tau/(N*phi(i))+(fpx*N*l^2/r)+(4*fpx*N*l^2*mu*tau/(
r*phi(i)))+2*N*l*0.5*A*ky*fy/r);
%----------- Delta_y for each case-------------
deltay_a1(i)=((phi(i)*AB)+(phi(i)*AC)-(phi(i)^2*AD))/AE; 'Delta y/l - case
a1 --------------';
if delta(i)==0.0274
aaa=1;
end
'checkings for a1 case';
'rebars checks';
'compr above rebar';
if deltay_a1(i)<delta_ry(i);
abva1(i)=1;
else;
abva1(i)=0;
end;
'compr in mid y-l';
if deltay_a1(i)>delta_cy(i);
mid_yla1(i)=2;
else;
mid_yla1(i)=0;
end;
'mid y-l x rebars unbroken'; '2*--- because movement occurs on two sides';
if dlimx>(2*((2*N)/r)^+1*(delta_ry(i)+delta_cy(i)-deltay_a1(i)));
'1/tan(gam) because here it is about x and y rebars on x and y directions';
miduna1(i)=4;
else;
miduna1(i)=0;
end

Appendix 2- Code Scripts and Coding Methodology
A2-18
'diagonal-x y-l unbroken - CHECK tg RELATION - last update against
normal';
if dlimx>((2*N)/r)^1*(delta_ry(i)+delta_cy(i)-deltay_a1(i));
diag_xa1(i)=8;
else;
diag_xa1(i)=0;
end;
'diag-y y-l unbroken';
if dlimy>(delta_ry(i)+delta_cy(i)-deltay_a1(i));
diag_ya1(i)=16;
else;
diag_ya1(i)=0;
end;
a1flag(i)=abva1(i)+mid_yla1(i)+miduna1(i)+diag_xa1(i)+diag_ya1(i);
'validate a1 flags';
if a1flag(i)>30;
valid_a1(i)=1;
else;
valid_a1(i)=0;
end
use_a1(i)=deltay_a1(i)*valid_a1(i); 'Usable a1 cases (only a1 so far) -
refere to BP45'; 'TO BE EXTENDED FOR OTHER a1s';
deltay_b1(i)=sqrt((b1a*phi(i)^3*b1b)/b1c); 'Delta y/l - case b1-----------
--------------------------';
'Checkings for b1 case';
'rebars checks';
'compr above rebar';
if deltay_b1(i)<delta_ry(i);
abvb1(i)=1;
else;
abvb1(i)=0;
end;
'compr in mid y-l';
if deltay_b1(i)<delta_cy(i);
mid_ylb1(i)=2;
else;
mid_ylb1(i)=0;
end;
'mid y-l unbroken'; '';
if dlimx>(2*((2*N)/r)^1*(delta_ry(i)+delta_cy(i)-deltay_b1(i))); '2*---
because movement occurs on two sides'; '1/tan(gam) because here it is about x
and y rebars on x and y directions';
midunb1(i)=4;
else;
midunb1(i)=0;
end
'diagonal-x y-l unbroken - CHECK tg RELATION';
if dlimx>((2*N)/r)^1*(delta_ry(i)+delta_cy(i)-deltay_b1(i));
diag_xb1(i)=8;
else;
diag_xb1(i)=0;
end;
'diag-y y-l unbroken';
if dlimy>(delta_ry(i)+delta_cy(i)-deltay_b1(i));

Appendix 2- Code Scripts and Coding Methodology
A2-19
diag_yb1(i)=16;
else;
diag_yb1(i)=0;
end;
b1flag(i)=abvb1(i)+mid_ylb1(i)+midunb1(i)+diag_xb1(i)+diag_yb1(i);
'validate b1 flags';
if b1flag(i)==31;
valid_b1(i)=1;
else;
valid_b1(i)=0;
end
deltay_b1p(i)=sqrt(b1pa*b1pb*phi(i)^3/b1pc); 'Delta y/l - case b1 prime---
------------------------------------';
'Checkings for b1 case';
'rebars checks';
'compr above rebar';
if deltay_b1p(i)<delta_ry(i);
abvb1p(i)=1;
else;
abvb1p(i)=0;
end;
'compr in mid y-l';
if deltay_b1p(i)<delta_cy(i);
mid_ylb1p(i)=2;
else;
mid_ylb1p(i)=0;
end;
'mid y-l unbroken';
if dlimx>(2*((2*N)/r)^1*(delta_ry(i)+delta_cy(i)-deltay_b1(i))); because
here it is about x and y rebars on x and y directions';
midunb1p(i)=4;
else;
midunb1p(i)=0;
end
'diagonal-x y-l unbroken';
if dlimx>((2*N)/r)^1*(delta_ry(i)+delta_cy(i)-deltay_b1p(i));
diag_xb1p(i)=8;
else;
diag_xb1p(i)=0;
end;
'diag-y y-l unbroken';
if dlimy>(delta_ry(i)+delta_cy(i)-deltay_b1p(i));
diag_yb1p(i)=16;
else;
diag_yb1p(i)=0;
end;
b1pflag(i)=abvb1p(i)+mid_ylb1p(i)+midunb1p(i)+diag_xb1p(i)+diag_yb1p(i);
'validate b1p flags';
if b1pflag(i)==27;
valid_b1p(i)=1;
else;
valid_b1p(i)=0;
end

Appendix 2- Code Scripts and Coding Methodology
A2-20
deltay_b1t(i)=(-b1tb(i)+sqrt((b1tb(i)^2-4*b1ta(i)*b1tc(i))))/(2*b1ta(i));
'Delta y/l - case b1 star -----------------------------';
'Checkings for b1* case';
'rebars checks';
'compr above rebar';
if deltay_b1t(i)<delta_ry(i);
abvb1t(i)=1;
else;
abvb1t(i)=0;
end;
'compr in mid y-l';
if deltay_b1t(i)<delta_cy(i);
mid_ylb1t(i)=2;
else;
mid_ylb1t(i)=0;
end;
'mid y-l unbroken';
if dlimx>(2*((2*N)/r)^1*(delta_ry(i)+delta_cy(i)-deltay_b1t(i)));
midunb1t(i)=4;
else;
midunb1t(i)=0;
end
'diagonal-x y-l unbroken';
if dlimx>((2*N)/r)^1*(delta_ry(i)+delta_cy(i)-deltay_b1t(i));
diag_xb1t(i)=8;
else;
diag_xb1t(i)=0;
end;
'diag-y y-l unbroken';
if dlimy>(delta_ry(i)+delta_cy(i)-deltay_b1t(i));
diag_yb1t(i)=16;
else;
diag_yb1t(i)=0;
end;
b1tflag(i)=abvb1t(i)+mid_ylb1t(i)+midunb1t(i)+diag_xb1t(i)+diag_yb1t(i);
'validate b1t flags';
if b1tflag(i)==15;
valid_b1t(i)=1;
else;
valid_b1t(i)=0;
end
deltay_b1pt(i)=(-b1ptb(i)+sqrt((b1ptb(i)^2-
4*b1pta(i)*b1ptc(i))))/(2*b1pta(i)); 'Delta y/l - case b1 prime-star --------
-----------------------------';
'Checkings for b1 prime-star case';
'rebars checks';
'compr above rebar';
if deltay_b1pt(i)<delta_ry(i);
abvb1pt(i)=1;
else;
abvb1pt(i)=0;
end;
'compr in mid y-l';
if deltay_b1pt(i)<delta_cy(i);

Appendix 2- Code Scripts and Coding Methodology
A2-21
mid_ylb1pt(i)=2;
else;
mid_ylb1pt(i)=0;
end;
'mid y-l unbroken';
if dlimx>(2*((2*N)/r)^1*(delta_ry(i)+delta_cy(i)-deltay_b1pt(i)));
midunb1pt(i)=4;
else;
midunb1pt(i)=0;
end
'diagonal-x y-l unbroken';
if dlimx>((2*N)/r)^1*(delta_ry(i)+delta_cy(i)-deltay_b1pt(i));
diag_xb1pt(i)=8;
else;
diag_xb1pt(i)=0;
end;
'diag-y y-l unbroken';
if dlimy>(delta_ry(i)+delta_cy(i)-deltay_b1pt(i));
diag_yb1pt(i)=16;
else;
diag_yb1pt(i)=0;
end;
b1ptflag(i)=abvb1pt(i)+mid_ylb1pt(i)+midunb1pt(i)+diag_xb1pt(i)+diag_yb1pt(i);
'validate b1pt flags';
if b1ptflag(i)==11;
valid_b1pt(i)=1;
else;
valid_b1pt(i)=0;
end
deltay_b1tt(i)=(-b1ttb(i)+sqrt((b1ttb(i)^2-
4*b1tta(i)*b1ttc(i))))/(2*b1tta(i)); 'Delta y/l - case b1-Double Star ------
-------------------------------';
'Checkings for b1 Double-star case';
'rebars checks';
'compr above rebar';
if deltay_b1tt(i)<delta_ry(i);
abvb1tt(i)=1;
else;
abvb1tt(i)=0;
end;
'compr in mid y-l';
if deltay_b1tt(i)<delta_cy(i);
mid_ylb1tt(i)=2;
else;
mid_ylb1tt(i)=0;
end;
'mid y-l unbroken';
if dlimx>(2*((2*N)/r)^1*(delta_ry(i)+delta_cy(i)-deltay_b1tt(i)));
midunb1tt(i)=4;
else;
midunb1tt(i)=0;
end

Appendix 2- Code Scripts and Coding Methodology
A2-22
'diagonal-x y-l unbroken';
if dlimx>(((2*N)/r)^1)*(delta_ry(i)+delta_cy(i)-deltay_b1tt(i));
diag_xb1tt(i)=8;
else;
diag_xb1tt(i)=0;
end;
'diag-y y-l unbroken';
aatt(i)=(delta_ry(i)+delta_cy(i)-deltay_b1tt(i));
if dlimy>(delta_ry(i)+delta_cy(i)-deltay_b1tt(i));
diag_yb1tt(i)=16;
else;
diag_yb1tt(i)=0;
end;
b1ttflag(i)=abvb1tt(i)+mid_ylb1tt(i)+midunb1tt(i)+diag_xb1tt(i)+diag_yb1tt(i);
'validate b1tt flags';
if b1ttflag(i)==19;
valid_b1tt(i)=1;
else;
valid_b1tt(i)=0;
end
deltay_b1tr(i)=(-b1trb(i)+sqrt((b1trb(i)^2-
4*b1tra(i)*b1trc(i))))/(2*b1tra(i)); 'Delta y/l - case b1-Triple Star ------
-------------------------------';
'Checkings for b1 Triple-star case';
'rebars checks';
'compr above rebar';
if deltay_b1tr(i)<delta_ry(i);
abvb1tr(i)=1;
else;
abvb1tr(i)=0;
end;
'compr in mid y-l';
if deltay_b1tr(i)<delta_cy(i);
mid_ylb1tr(i)=2;
else;
mid_ylb1tr(i)=0;
end;
'mid y-l unbroken';
if dlimx>(2*((2*N)/r)^1*(delta_ry(i)+delta_cy(i)-deltay_b1tr(i)));
midunb1tr(i)=4;
else;
midunb1tr(i)=0;
end
'diagonal-x y-l unbroken';
if dlimx>((2*N)/r)^1*(delta_ry(i)+delta_cy(i)-deltay_b1tr(i));
diag_xb1tr(i)=8;
else;
diag_xb1tr(i)=0;
end;
'diag-y y-l unbroken';
if dlimy>(delta_ry(i)+delta_cy(i)-deltay_b1tr(i));
diag_yb1tr(i)=16;

Appendix 2- Code Scripts and Coding Methodology
A2-23
else;
diag_yb1tr(i)=0;
end;
b1trflag(i)=abvb1tr(i)+mid_ylb1tr(i)+midunb1tr(i)+diag_xb1tr(i)+diag_yb1tr(i);
'validate b1tr flags';
if b1trflag(i)==3;
valid_b1tr(i)=1;
else;
valid_b1tr(i)=0;
end
deltay_b2(i)=(-b2b(i)+sqrt((b2b(i)^2-4*b2a(i)*b2c(i))))/(2*b2a(i));
'Delta y/l - case b2 ------------------------------------------';
'Checkings for b2 case';
'rebars checks';
'compr BELOW rebar';
if deltay_b2(i)>delta_ry(i);
belb2(i)=1;
else;
belb2(i)=0;
end;
'compr in mid y-l';
if deltay_b2(i)<delta_cy(i);
mid_ylb2(i)=2;
else;
mid_ylb2(i)=0;
end;
'mid y-l unbroken';
if dlimx>(2*((2*N)/r)^1*(delta_ry(i)+delta_cy(i)-deltay_b2(i)));
midunb2(i)=4;
else;
midunb2(i)=0;
end
'diagonal-x y-l unbroken';
if dlimx>((2*N)/r)^1*(delta_ry(i)+delta_cy(i)-deltay_b2(i));
diag_xb2(i)=8;
else;
diag_xb2(i)=0;
end;
'diag-y y-l unbroken';
if dlimy>(delta_ry(i)+delta_cy(i)-deltay_b2(i));
diag_yb2(i)=16;
else;
diag_yb2(i)=0;
end;
'comp abv bottom';
if deltay_b2(i)<phi(i)*tau
abvb2(i)=32;
else
abvb2(i)=0;
end
b2flag(i)=belb2(i)+mid_ylb2(i)+midunb2(i)+diag_xb2(i)+diag_yb2(i)+abvb2(i);

Appendix 2- Code Scripts and Coding Methodology
A2-24
'validate b2 flags';
if b2flag(i)==63;
valid_b2(i)=1;
else;
valid_b2(i)=0;
end
use_b1(i)=deltay_b1(i)*valid_b1(i)+deltay_b1p(i)*valid_b1p(i)+deltay_b1t(i)*va
lid_b1t(i)+deltay_b1pt(i)*valid_b1pt(i)+deltay_b1tt(i)*valid_b1tt(i)+deltay_b1
tr(i)*valid_b1tr(i); 'Usable ALL b1 cases (combination)'
'case a1 flag - ALL a1 CASES';
ca_a1f(i)=a1flag(i)*valid_a1(i); 'All a1 cases';
'case b1 flag - ALL b1 CASES (b1 & b1 prime)';
ca_b1f(i)=b1flag(i)*valid_b1(i)+b1pflag(i)*valid_b1p(i)+b1tflag(i)*valid_b1t(i
)+b1ptflag(i)*valid_b1pt(i)+b1ttflag(i)*valid_b1tt(i)+b1trflag(i)*valid_b1tr(i
); 'All b1 cases';
'CASE FLAG'; 'MT'; if ca_a1f(i)>0;
flag(i)=1;
elseif ca_b1f(i)>0;
flag(i)=3;
else;
flag(i)=0;
end
if flag(i)==1 'in case a1';
z1(i)=(use_a1(i))/phi(i); 'z1/l';
z2(i)=((use_a1(i))/phi(i))-0.5*N*phi(i); 'z2/l';
elseif flag(i)==3 'in case b1';
z1(i)=(use_b1(i))/phi(i); 'z1/l';
z2(i)=0;
else
z1(i)=0;
z2(i)=0;
end
if flag(i)==1
A1x(i)=(z1(i)+z2(i))*0.5*N; 'A1x/l^2';
A2x(i)=(0.5-N)*z2(i); 'A2x/l^2';
elseif flag(i)==3
A1x(i)=use_b1(i)^2/phi(i)^3; 'A1x/l^2';
A2x(i)=0; 'A2x/l^2';
end
'FINAL DELTA_Y/L';
if flag(i)==1 'case a1';
use_dy(i)= use_a1(i);
elseif flag(i)==3 'cases b1 (All b1 cases)';
use_dy(i)=use_b1(i);
else;
error_cases_finished=1;

Appendix 2- Code Scripts and Coding Methodology
A2-25
break
end
'Final Delta Y after having multiplied by l';
dyl(i)= use_dy(i)*l;
'FORCES';
C(i)=A1x(i)*fc*l^2/sin(gam);
Cx2(i)=A2x(i)*fc*l^2;
if (2/phi(i)^2)*(use_dy(i)+(dlimx/(2*N/r))-phi(i)*mu*tau)> N;
ylim(i)=N;
'ylim/l';
else;
ylim(i)=(2/phi(i)^2)*(use_dy(i)+(dlimx/(2*N/r))-phi(i)*mu*tau);
end;
if flag(i)>0 & flag(i)<2; 'case a1 & b1 Cases';
YT(i)=0;
elseif flag(i) >2 & flag(i)<4; 'b1 CASES';
YT(i)=0;
else
YT(i)=0;
end
Tx1(i)=(ylim(i)-YT(i))*fpx*l;
if (r/(N*phi(i)^2))*(use_dy(i)+dlimy-phi(i)*mu*tau)>0.5*r;
xlim(i)=0.5*r;
'xlim/l';
else;
xlim(i)=(r/(N*phi(i)^2))*(use_dy(i)+dlimy-phi(i)*mu*tau);
end
if flag(i)>0 & flag(i)<2; 'case a1';
XT(i)=0;
elseif flag(i)>2 & flag(i)<4 'b1 CASES';
XT(i)=0;
else
XT(i)=0;
end
miduna1s(i)=miduna1(i)*valid_a1(i); 'Middle y-l x-rebar intact for a1
cases
midunb1s(i)=midunb1(i)*valid_b1(i)+midunb1p(i)*valid_b1p(i)+midunb1t(i)*valid_
b1t(i)+midunb1pt(i)*valid_b1pt(i)+midunb1tt(i)*valid_b1tt(i)+midunb1tr(i)*vali
d_b1tr(i); 'Middle y-l x-rebar intact for ALL b1 CASES (b1 & b1 prime)' ;
'Eventual middle y-l x-rebar intact'; 'account for a1 &b1 &b1 prime';
Mid_yl(i)= (miduna1s(i)+midunb1s(i))/4;
'for cases a1 & b1';
Ty1(i)=(xlim(i)-XT(i))*fpx*l;
'Flags check for the mid y-l unbroken';
Tx2(i)=l*(0.5-N)*fpx*Mid_yl(i); 'Tx2 exists as long Mid_yl, the eventual
Mid yl rebars, is unbroken';
'CASES';

Appendix 2- Code Scripts and Coding Methodology
A2-26
Tb(i)=nu*A*ky*fy;
Z1(i)=z1(i)*l;
Z2(i)=z2(i)*l;
if flag(i)==1; 'Y_ca1/l case a1';
Y_ca1(i)=N^2*(z1(i)+2*z2(i))/(6*A1x(i)); %A1x is actually A1x/l^2
elseif flag(i)==3 'case b1 & b1 prime';
Y_ca1(i)= (2/3)*use_dy(i)/phi(i)^2;
else
Y_ca1(i)= 0; 'CASE NOT FOUND YET. WILL WORK ON IT LATER';
end
Z_ca(i)=0.5*(Z1(i)*(1-Y_ca1(i))+Z2(i)*Y_ca1(i));
dy_ca(i)=dyl(i)-phi(i)*Z_ca(i)-0.5*(phi(i)^2)*Y_ca1(i)*l; 'alpha';
dely(i)=-(dyl(i)-phi(i)*mu*(tau*l)-0.5*phi(i)^2*0.5*l*(ylim(i)+YT(i)));
'alpha';
dx_ca(i)= dy_ca(i)*2*N/r; 'alpha';
delx(i)=-(dyl(i)*(2*N)/r-phi(i)*mu*(tau*l)*2*N/r-
0.5*(phi(i)*2*N/r)^2*0.5*l*(ylim(i)+YT(i))); 'alpha'; dcx2(i)=dyl(i)*2*N/r-
phi(i)*(2*N)/r*Z2(i)/2-0.5*(phi(i)*2*N/r)^2*0.5*r*l; 'Beta'
dsx2(i)= -(dyl(i)*2*N/r-phi(i)*(2*N/r)*mu*(tau*l)-0.5*(phi(i)*2*N/r)^2*r*l/2);
' Beta';
xc(i)=dyl(i)/theta(i);
x(i)=(mu*t-xc(i))*cos(phi(i)*2*N/r); 'geometry parameter';
L(i)=(hc-xc(i)+0.5*ha)*cos(phi(i)*2*N/r); 'geometry parameter';
if xc(i)==0
error_xc=1;
end
dbeam(i)=dely(i)*L(i)/x(i); 'Delta Beam';
'>>>>>>>>>>>>>>>>>>>>>>>>>>>>>>>>>>>>>>>>>>>>>>>>>>>>>>>>>>>>>>>>>>>';
'INTERNAL WORK';
iwC(i)=4*(C(i)*sin(gam)*dx_ca(i)+C(i)*cos(gam)*dy_ca(i)); 'force c1';
iwTx1(i)=4*Tx1(i)*delx(i); 'force Tx1';
iwTy1(i)=4*Ty1(i)*dely(i); 'force Ty1';
iwTx2(i)=4*Tx2(i)*dsx2(i); 'force Ty2';
iwCx2(i)=4*Cx2(i)*dcx2(i); 'force Cx2';
iwb(i)=dbeam(i)*A*fy*ky; 'Beams';
totiw(i)=iwC(i)+iwTx1(i)+iwTy1(i)+iwTx2(i)+iwCx2(i)+iwb(i); 'Total
Internal work';
'External Work P';
delta_A(i)=delta(i)*l; 'delta_A';
EWP(i)=delta_A(i)*r*l^2*(0.5-N/3); 'the external work p';
'Capacity';
p(i)=totiw(i)/EWP(i);
'Enhancement'; %This is only load capacity enhancement. It is a flat line
equals one
e(i)=p(i)/pa;
pi=p(i);
if p(i)>pa
step=mainstep
tj=tj+step;

Appendix 2- Code Scripts and Coding Methodology
A2-27
elseif p(i)<pa
step=mainstep*0.5;
tj=tj-step;
end
pp=abs(pa-p(i)); %to measure how much p is away from pa
tt=tt+1 %to measure how many internal steps within "while" loop
k(i)=ky;
cep=0.003; %Circle of Error Probable for how much p should be close to pa
pcep=cep*pa;
if abs(pa-p(i))<=cep*pa
Temp(i)=tj;
break
end
%This is to avoid big shift differences.
if tt>1000
tata=1;
end
if tt>5000
Temp(i)=tj;
%tt_break=tt_break+1;
tete=1
break
end
if tj>1199
break
elseif tj<400
error_Temp=1;
break
end
end
if error_cases_finished==1
break
end
if tj>1199
break
elseif tj<400
error_Temp=2;
break
end
sss=1+1;
end
if error_cases_finished==1
warndlg('Programmed cases finished','Code Terminated')
break
end
%Final Matrix
z_mat=[delta' phi' delta_ry' delta_cy' deltay_a1' abva1' mid_yla1' miduna1'
diag_xa1' diag_ya1' a1flag' valid_a1' z1' z2' A1x' A2x' ...
use_a1' deltay_b1' abvb1' mid_ylb1' midunb1' diag_xb1' diag_yb1' b1flag'
valid_b1' deltay_b1p' abvb1p' mid_ylb1p' midunb1p' ...

Appendix 2- Code Scripts and Coding Methodology
A2-28
diag_xb1p' diag_yb1p' b1pflag' valid_b1p' deltay_b1t' abvb1t' mid_ylb1t'
midunb1t' diag_xb1t' diag_yb1t' b1tflag' valid_b1t' ...
deltay_b1pt' abvb1pt' mid_ylb1pt' midunb1pt' diag_xb1pt' diag_yb1pt'
b1ptflag' valid_b1pt' deltay_b1tt' abvb1tt' mid_ylb1tt' ...
midunb1tt' diag_xb1tt' diag_yb1tt' b1ttflag' valid_b1tt' deltay_b1tr'
abvb1tr' mid_ylb1tr' midunb1tr' diag_xb1tr' diag_yb1tr' b1trflag' valid_b1tr'
flag' ...
C' Cx2' xlim' ylim' XT' YT' Tx1' Ty1' Tx2' Tb' use_dy' dyl' Y_ca1' Z_ca'
dx_ca' dy_ca' delx' ...
dely' dcx2' dsx2' iwC' iwTx1' iwTy1' iwTx2' iwCx2' iwb' totiw' delta_A'
EWP' p' Temp' e'];

Appendix 3- Pull Out Test of Small-Diameter Reinforcement
A3-1
Appendix 3
A3 Pull Out Test of Small-Diameter Reinforcement
A3.1 The purpose of the test
Plenty of pull-out tests were conducted to study the bond-slip behaviour of reinforced
concrete elements in structures. However, almost all of these tests studied the behaviour
of bars that far exceed the diameters used in composite slabs. The reinforcement used in
composite slabs is anti-cracking mesh, which is usually 6mm in diameter. Thus, the
bond behaviour of such small diameter bars differ than normal ones with diameter of
14mm or larger.
The other important factor which is important to examine is the bond-slip behaviour at
elevated temperatures. In fire, slabs are subjected to high temperatures. When the slab
cracks and these cracks widen to certain extent, the temperature affects the
reinforcement bars. At such high temperatures, bond behaviour is not supposed to be the
same as it is at ambient temperature.
In order to study the bond-slip behaviour of small-diameter reinforcement, a new pull
out test should be conducted. Such a test aims to examine the bond behaviour of a
cylindrical concrete specimen, reinforced with a single reinforcement bar of a diameter
of 6mm, subjected to high temperature. Applying pull-out forces from both sides until
the fracture of the bar is a proper method to simulate the tension force on the bar.
A3.2 Test specimens
Since the used reinforcement bar is small in diameter (6mm), the important aspect of the
test is to observe if such a reinforcement bar fractures in a brittle manner, or if it pulls
out smoothly. For this purpose, two types of failure should be considered:

Appendix 3- Pull Out Test of Small-Diameter Reinforcement
A3-2
The concrete cracks before the reinforcement bar fractures. The bar is then in
pure tension.
The reinforcement bar fractures while it is still embedded in concrete before the
latter cracks.
Therefore, two specimens should be tested in order to simulate both the types.
Specimens should comprise the following:
1. A Specimen with a split in the middle which simulates cracked concrete and an
exposed reinforcement bar.
2. A Normal specimen at which the reinforcement is embedded in concrete; with a
notch in the middle of the specimen in order to control the failure mode. In this
case, concrete should fracture at the notch.
Figure 83 shows both types of specimens; Specimen (a) with a notch, and specimen
(b) with a split in the middle.
Figure 83: (a) Specimen with notch; (b) Specimen with a split in the middle

Appendix 3- Pull Out Test of Small-Diameter Reinforcement
A3-3
Both specimens are cylindrical with a reinforcement bar which has a diameter of 6mm.
The rebar (in both specimens) is welded from both sides to M20 bolts as shown in
Figure 84. These bolts are used to anchor the specimens to the pull out test machine in
order to apply the pull-out forces.
A3.3 Specimens design
It is important that the specimens fail at the middle of their cylindrical body, not at the
area of their bases. In other words, the specimens should not fail around the bolts
washers where the concrete cross-section is smaller than the rest of the specimen’s
body. Failure should be due to slip after the bond was lost and the concrete cracked in
case of specimen (a). Hence, the specimens should fail in the middle, away from their
bases. To prevent an unwanted failure mode, some calculations should be done in order
to make sure that the test goes as planned, allowing the desired observation.
The reinforcement bars that are used in this test have a yield strength of 460MPa. Since
the design is aimed to study the actual behaviour for scientific purposes (not
commercial design), the actual yield strength, rather than the factored strength, should
be considered. This is estimated by 1.3 times the commercially declared strength
(460MPa), as it is recommended by technicians.
A3.3.1 Specimen specifications
Figure 84 shows the dimensions of the specimen before customizing it with a notch or a
split in the middle.
Rebar diameter: 6mm. Specimen diameter: 100mm (cylindrical). Bolts used: M20
Rebar cross section area

Appendix 3- Pull Out Test of Small-Diameter Reinforcement
A3-4
Figure 84: Specimen dimensions
Maximum force the bar can take:
Concrete Tensile Strength:
According to EN 1992-1-1
Where: fctm is the mean axial tensile strength of concrete

Appendix 3- Pull Out Test of Small-Diameter Reinforcement
A3-5
ti < 28 days → αi=1
ti ≥ 28 days → αi=2/3
Notch Design (The Second Specimen)
The notch around the specimen is intended to guarantee the failure of the specimen
occurs at the middle of the specimen’s body, rather than breaking around the bolts
washer. A cross-section area reduction of 36mm leaves the specimen with a diameter of
65mm at the notch.
Concrete cross-section area at the notch:
Where: 65 is the radios of the concrete at the notch
28 is the area of the 6mm-reinforcement bar
Notch breaks at a force of:
The stress of the bar at this point = 7419/28.3=262.2MPa
Concrete Tensile Strength around the Bolt
The area of the bolts head occupies space within the specimen. This means that the net
concrete cross-section around the bolt’s head is smaller than the rest of the specimen.
Concrete tensile strength at that area should be checked in order to prevent tensile
failure near the bolt's head. Figure 85 shows this area around the bolt’s head.

Appendix 3- Pull Out Test of Small-Diameter Reinforcement
A3-6
Figure 85: The base of the specimen with the net concrete area around the bolt's head
Concrete area around the bolt:
Maximum force applied = 7419MPa
Since the maximum stress at this area is smaller than the concrete mean tensile strength,
the concrete does not fail in tension around the bolt’s head.
Bolt embedded length (h):
When the tension force is applied, the bolts tend to pull out of the concrete, tending to
pull concrete cone out of the specimen. The concrete cone cracks in an angle of 45o as
Figure 86 shows.
To prevent the formation of pull-out cones at each end of the specimen, a minimum
embedded length of the bolt should be satisfied.
The force which is needed to pull out the bolt is equal to the concrete tensile strength
multiplied by the lateral surface area of the pull-out cone La.

Appendix 3- Pull Out Test of Small-Diameter Reinforcement
A3-7
Figure 86: Concrete pull-out cone in 45° angle
Lateral surface area of the concrete frustum:
Where: r1 and r2 are the small and big bases of the frustum, respectively
he is the height of the frustum
F=17000=2.25 . La
→ La=7522mm
This is the minimum lateral surface area of the frustum necessary to keep the bolt
embedded in the concrete.
To make sure the bolt will not be pulled out, h is taken 40mm.
A3.4 Loading rate
The tension-loading rate which is applied to the specimens is calculated by the
following equation, as suggested by many other pull-out tests:

Appendix 3- Pull Out Test of Small-Diameter Reinforcement
A3-8
Where, ds is the diameter of the reinforcement bar.
Vp= 0.56*62 =20 N/sec
A3.5 Tests results
A3.5.1 First specimen – with the split
The first specimen is the one which has a split in the middle. This split simulates a crack
that widened, leaving the reinforcement bar to be exposed to elevated temperatures. The
result of the first specimen tests is shown in Figure 87.
Figure 87: Load vs. displacement for the first specimen, with split
The first specimen went slightly higher in resistance than it was expected. This is
mainly because of the extra safety factor of the reinforcement bar which took a larger
load than what was believed to be the unfactored strength.
A3.5.2 Second specimen – with the notch
Unfortunately, the second specimen test did not go as planned. The base of the
specimen broke before reaching the failure load in a brittle manner. Load vs.
displacement data of the second specimen is presented in Figure 88. The base of the

Appendix 3- Pull Out Test of Small-Diameter Reinforcement
A3-9
specimen broke due to rebar-bolt detachment, although the same base design was used
in the first specimen, which took even a higher load than what was expected. Therefore,
the reason for this base failure is due to flawed welding between the reinforcement bar
and the bolt. This flaw welding caused the detachment in a brittle manner.
Figure 88: Load vs. displacement of the second specimen showing an abrupt breaking of the
specimen
Since the bond-slip behaviour issue was not an objective of this study, information and
specimen design procedures was presented in this appendix, so that the future
researchers can re-do the test and conduct data analysis properly.
Images of the second specimen after failure are presented in Figures 89 and 90.
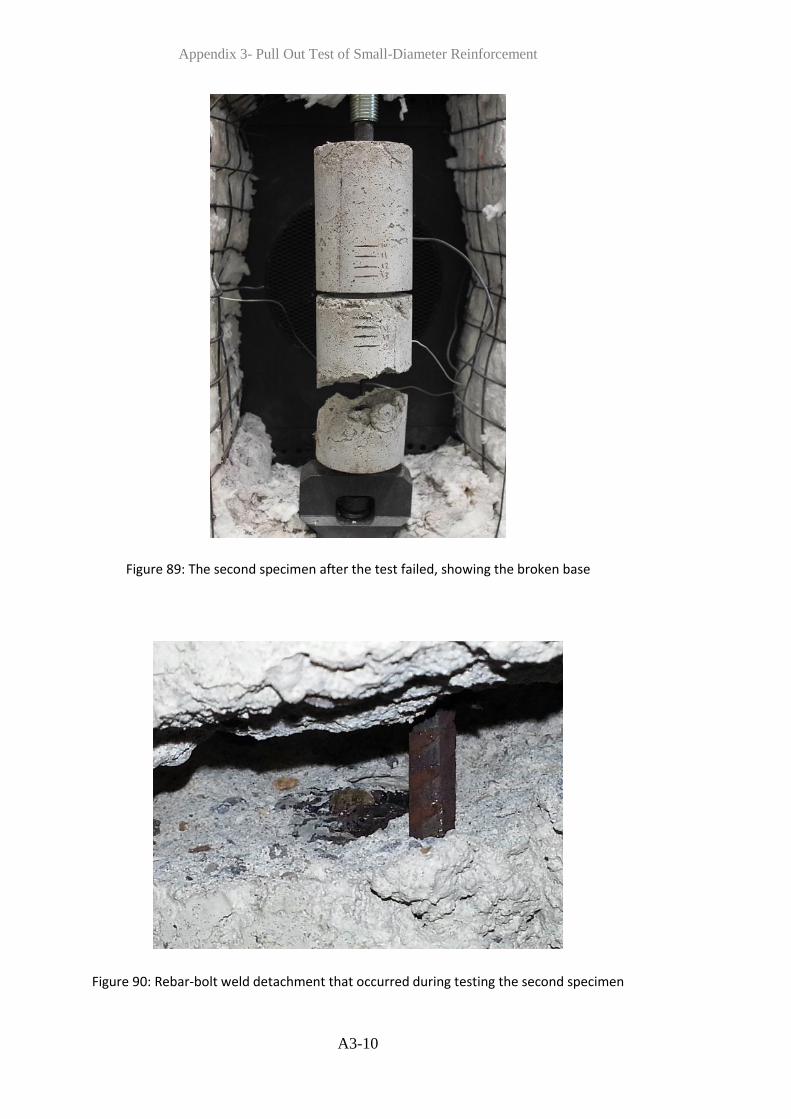
Appendix 3- Pull Out Test of Small-Diameter Reinforcement
A3-10
Figure 89: The second specimen after the test failed, showing the broken base
Figure 90: Rebar-bolt weld detachment that occurred during testing the second specimen