development of a flexural bond strength test to …
TRANSCRIPT

DEVELOPMENT OF A FLEXURAL BOND STRENGTH TEST TO DETERMINE
ENVIRONMENTAL DEGRADATION OF CARBON FIBER-REINFORCED POLYMER (CFRP) COMPOSITES BONDED TO CONCRETE
By
AMBER LEE GARTNER
A THESIS PRESENTED TO THE GRADUATE SCHOOL OF THE UNIVERSITY OF FLORIDA IN PARTIAL FULFILLMENT
OF THE REQUIREMENTS FOR THE DEGREE OF MASTER OF ENGINEERING
UNIVERSITY OF FLORIDA
2007
1

Copyright 2007
By
Amber Lee Gartner
2

ACKNOWLEDGMENTS
I would first like to thank all the teachers I have learned from throughout my many
years of study. Without teachers, I would not have the knowledge or desire for
knowledge that I have today. It takes great teachers to create successful professionals. I
would especially like to thank Dr. Hamilton for his constant guidance and education. I
have learned from him in more ways than one.
I would like to thank my parents and family for supporting me from the time I was
born until the start of my graduate studies. Without their emotional and financial support,
I don’t believe I would have been able to achieve as much as I have. They allowed me to
focus on my studies and always encouraged me to pursue any dream I had.
I would like to thank my husband, Mike, for supporting me throughout the
completion of my graduate degree. It was not always easy, and many times I considered
quitting, but he made sure I kept going. Now I am very thankful that he did, because I
have learned invaluable lessons throughout the process. I thank him and all the others
who supported me for not letting me give up.
3
TABLE OF CONTENTS page
ACKNOWLEDGMENTS ...................................................................................................3
LIST OF TABLES...............................................................................................................7
LIST OF FIGURES .............................................................................................................9
ABSTRACT.......................................................................................................................12
CHAPTER
1 INTRODUCTION ........................................................................................................14
2 BACKGROUND ..........................................................................................................17
Previous Research in CFRP Durability ....................................................................17 Moisture...............................................................................................................17 Moisture/Salt .......................................................................................................19 Moisture/Alkali....................................................................................................21 UV Radiation.......................................................................................................22 Fatigue .................................................................................................................23 Conclusions of Previous CFRP Environmental Durability Research .................23
Durability Design .....................................................................................................24 NCHRP Research ................................................................................................25 Research Contribution .........................................................................................25
3 RESEARCH APPROACH ...........................................................................................27
Accelerated Aging Model ........................................................................................27 Research Plan ...........................................................................................................30
4 BEAM TEST: DEVELOPMENT................................................................................32
Concrete Beam Fabrication......................................................................................32 Concrete construction..........................................................................................32 Surface preparation..............................................................................................34 Composite Application........................................................................................36
Flexural Testing Procedures.....................................................................................39
4
Variables in Test Protocol ........................................................................................41 3-pt vs. 4-pt Testing Procedures..........................................................................41 Beam Size............................................................................................................42 Additional Flexural Reinforcement .....................................................................44 Concrete Strength ................................................................................................45
5 BEAM TEST: RESULTS AND DISCUSSION..........................................................47
Failure Modes...........................................................................................................47 Analysis ....................................................................................................................51 Effect of Beam Size..................................................................................................53 Effect of CFRP Composite Width............................................................................56 Effect of Concrete Strength......................................................................................60 Effect of Composite System.....................................................................................63 Effect of Testing Configuration ...............................................................................65 Effect of Saw-cut......................................................................................................67 Effect of Added Tensile Reinforcement...................................................................68 Pilot Study Conclusions ...........................................................................................70
6 ENVIRONMENTAL EXPOSURE SYSTEM: DESIGN AND CONSTRUCTION ..71
Specimen Nomenclature ..........................................................................................71 Concrete Construction and Testing ..........................................................................74
Construction procedure .......................................................................................74 Saw-cutting and surface preparation ...................................................................79 28-day testing procedure and results ...................................................................81
Composite Properties and Application Procedures..................................................83 Composite A........................................................................................................84 Composite B ........................................................................................................86 Composite C ........................................................................................................88 Composite D and E..............................................................................................90 Other specimens ..................................................................................................91
Exposure Tank Set-up ..............................................................................................92 Description of Exposure Systems........................................................................92 Procedures for Installation...................................................................................97 Infrared Scanning of Specimens........................................................................100
7 ENVIRONMENTAL EXPOSURE: RESULTS AND DISCUSSION......................102
8 CONCLUSIONS AND FUTURE WORK .................................................................106
APPENDIX
A CONCRETE MIX DESIGNS FOR NCHRP PROJECT 12-73.................................108
B NCHRP 12-73 UF TESTING MATRIX....................................................................113
5

C STANDARD TEST METHOD FOR FLEXURAL STRENGTH OF CFRP COMPOSITE BONDED CONCRETE (USING SIMPLE BEAM WITH THREE-POINT LOADING) ......................................................................................................................121
LIST OF REFERENCES.................................................................................................124
6

LIST OF TABLES
Table page 2-1 Environmental-reduction factors given by ACI 440.3R for various CFRP
systems and exposure conditions ....................................................................... 24 3-1 Environmental Conditioning Test Matrix.......................................................... 31 4-1 Factors investigated for determination of specimen configuration.................... 32
4-2 Physical and mechanical properties of graphite fabrics and laminate ............... 36
4-3 Material properties of epoxy resins.................................................................... 37
4-4 Specimens investigated for flexural loading condition...................................... 42
4-5 Beam and CFRP dimensions for beam size investigation ................................. 43
4-6 Specimens used to analyze effect of concrete strength...................................... 46 5-1 Definition and description of Beam Test failure modes .................................... 48
5-2 Failure modes of concrete geometry specimens ................................................ 54
5-3 Flexural testing results for composite width comparison .................................. 57
5-4 Failure modes for concrete strength comparison ............................................... 61
5-5 Fiber weight and stiffness for composites C, A, and S...................................... 64
5-6 Failure mode and load for specimens investigated for composite type ............. 65
5-7 Flexural testing results for testing procedure study ........................................... 66
5-8 Flexural testing results for specimens with and without a saw-cut ................... 68
5-9 Flexural test results for tensile reinforcement investigation.............................. 69 6-1 Specimen Matrix for University of Florida NCHRP project 12-73................... 72
6-2 Symbols used for Exposure Period.................................................................... 73
7

6-3 Symbols used for Exposure Conditions............................................................. 73
6-4 Symbol used for Manufacturer/Composite System ........................................... 74
6-5 Symbol used for Resin Type.............................................................................. 74
6-6 Example Specimen Nomenclature for Resin Samples....................................... 74
6-7 28-day compressive strength results .................................................................. 82
6-8 28-day MOR test results .................................................................................... 83
6-9 Material properties for Composite A ................................................................. 84
6-10 Material properties for Composite B ................................................................. 86
6-11 Material properties for Composite C ................................................................. 88
6-12 List of specimens hung from each fender beam ................................................ 96
6-13 Specimen location in exposure tanks................................................................. 99 7-1 Load and failure mode of sustained load specimens ....................................... 105
8

LIST OF FIGURES
Figure page 1-1 CFRP application............................................................................................ 16 3-1 Arrhenius correlation plots ............................................................................. 28 4-1 Materials used for concrete construction ........................................................ 33
4-2 Concrete saw creating half-depth saw-cut ...................................................... 34
4-3 Surface sandblasting a specimen .................................................................... 35
4-4 Sandblasted surface with aggregate exposed compared to ICRI profiling chip......................................................................................................................... 35
4-5 Graphite reinforcement used for the composite.............................................. 36
4-6 Application of saturant to concrete surface for fabric composite ................... 38
4-7 Application of adhesive using a spatula.......................................................... 38
4-8 Fabric composite placed on adhesive ............................................................. 39
4-9 Schematic of flexural testing loading conditions............................................ 40
4-10 Small beam flexural testing with Instron machine ......................................... 41
4-11 Beam and CFRP dimensions for beam size investigation .............................. 43
4-12 Schematic showing placement of additional reinforcement ........................... 45 5-1 Load vs. position plot for a typical beam test ................................................. 48
5-2 Adhesive failure mode .................................................................................... 49
5-3 Interfacial failure mode................................................................................... 49
5-4 Adhesive/Interfacial failure mode................................................................... 50
5-5 Flexure-shear failure mode ............................................................................. 50
9

5-6 Composite delamination failure mode ............................................................ 51
5-7 Cross-section of beam showing internal moments used to calculate shear stress in composite .......................................................................................... 51
5-8 Flexural failure progression ............................................................................ 53
5-9 Interfacial failure caused by short CFRP........................................................ 53
5-10 Bond line shear stress vs. length to span ratio ................................................ 55
5-11 Failure load vs. composite length for 3 different composites......................... 56
5-12 Bond line shear stress vs. composite length for 3 different composites ......... 56
5-13 Failure load vs. width for different composites .............................................. 58
5-14 Failure mode progression for increasing CFRP width.................................... 59
5-15 Bond line shear stress vs. CFRP composite width for different composites .. 60
5-16 Failure load with increasing concrete strength ............................................... 62
5-17 Comparison of failure load for composites with different adhesives ............. 63
5-18 Interfacial failure modes for two different composite systems with the same adhesive (Saturant S) ...................................................................................... 64
5-19 Failed specimens with (B and C) and without (A) additional tensile reinforcement. ................................................................................................. 70
6-1 “Butter” mix used to coat the mixer ............................................................... 75
6-2 Addition of coarse aggregate to mixer............................................................ 76
6-3 Addition of admixtures to the mixer............................................................... 76
6-4 Slump measurement........................................................................................ 77
6-5 Casting concrete beams................................................................................... 78
6-6 De-molding of concrete beams from steel forms............................................ 79
6-7 Saw-cutting a beam......................................................................................... 80
6-8 A sandblasted concrete surface....................................................................... 80
6-9 Cylinder compression strength test at 28-days ............................................... 81
10

6-10 Modulus of rupture flexural strength test at 28-days ...................................... 82
6-11 Application of Composite A ........................................................................... 85
6-12 Application of Composite B ........................................................................... 87
6-13 Construction of Composite C.......................................................................... 89
6-14 Application of Composites D and E. .............................................................. 91
6-15 Salt used for Chloride Solution....................................................................... 92
6-16 Calcium Hydroxide used for Alkali Solution ................................................. 93
6-17 Schematic of sustained load frame ................................................................. 93
6-18 Sustained Load exposure set-up...................................................................... 94
6-19 Location of SR 206 bridge.............................................................................. 95
6-20 Fender beams to be used to hang concrete beams .......................................... 95
6-21 UVA-340 spectrum vs. Sunlight spectrum ..................................................... 96
6-22 Layout of exposure tanks in plan view ........................................................... 99
6-23 Exposure tank set-up..................................................................................... 100
6-24 Addition of beams to exposure tanks............................................................ 100
6-25 Set-up of IR scans ........................................................................................ 101 7-1 A sustained load frame with 2 failed specimens........................................... 102
7-2 Adhesive failure on a sustained load specimen ............................................ 104
7-3 Hairline crack in sustained load specimen.................................................... 104 A-1 Concrete mix 1 properties............................................................................. 108
A-2 Concrete mix 2 properties............................................................................. 109
A-3 Concrete mix 3 properties............................................................................. 110
A-4 Concrete mix 4 properties............................................................................. 111
A-5 Concrete mix 5 properties............................................................................. 112 C-1 Diagrammatic View of a Suitable Apparatus for Flexure Test of Concrete. 122
11
Abstract of Thesis Presented to the Graduate School
of the University of Florida in Partial Fulfillment of the Requirements for the Degree of Master of Engineering
DEVELOPMENT OF A FLEXURAL BOND STRENGTH TEST TO DETERMINE ENVIRONMENTAL DEGRADATION OF CARBON FIBER-REINFORCED
POLYMER (CFRP) COMPOSTIES BONDED TO CONCRETE
By
Amber Lee Gartner
May 2007
Chair: H.R Hamilton, III Major: Civil Engineering
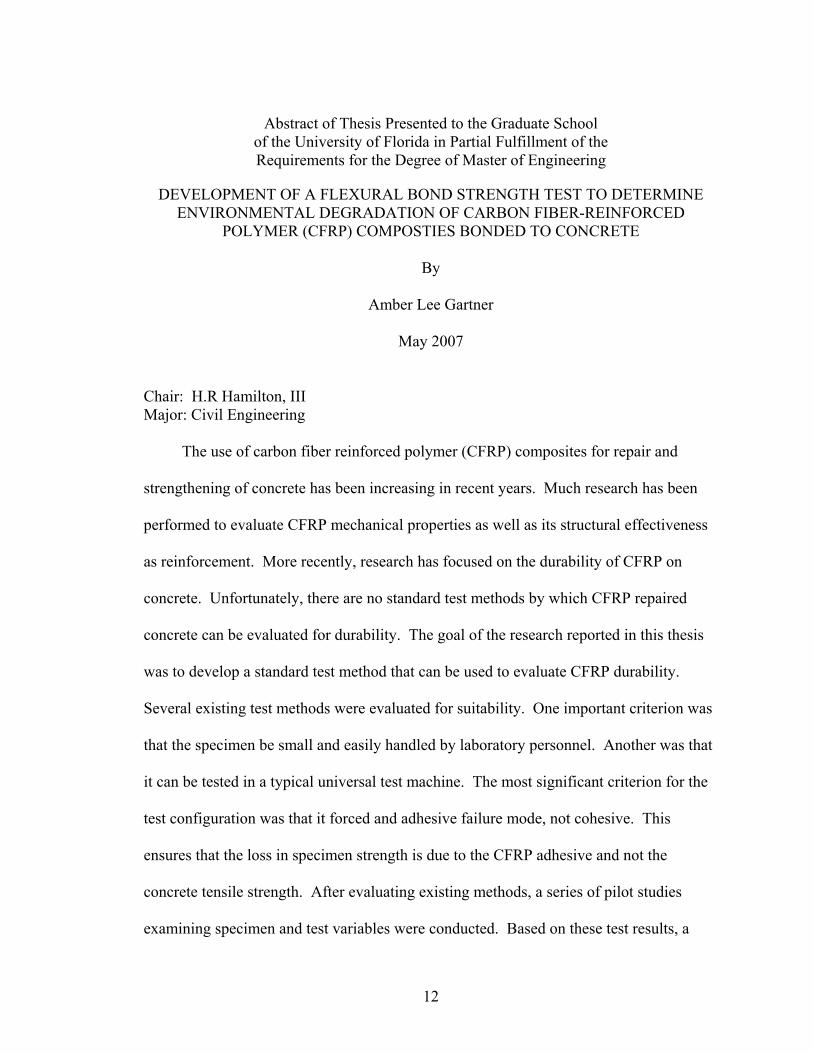
The use of carbon fiber reinforced polymer (CFRP) composites for repair and
strengthening of concrete has been increasing in recent years. Much research has been
performed to evaluate CFRP mechanical properties as well as its structural effectiveness
as reinforcement. More recently, research has focused on the durability of CFRP on
concrete. Unfortunately, there are no standard test methods by which CFRP repaired
concrete can be evaluated for durability. The goal of the research reported in this thesis
was to develop a standard test method that can be used to evaluate CFRP durability.
Several existing test methods were evaluated for suitability. One important criterion was
that the specimen be small and easily handled by laboratory personnel. Another was that
it can be tested in a typical universal test machine. The most significant criterion for the
test configuration was that it forced and adhesive failure mode, not cohesive. This
ensures that the loss in specimen strength is due to the CFRP adhesive and not the
concrete tensile strength. After evaluating existing methods, a series of pilot studies
examining specimen and test variables were conducted. Based on these test results, a
12
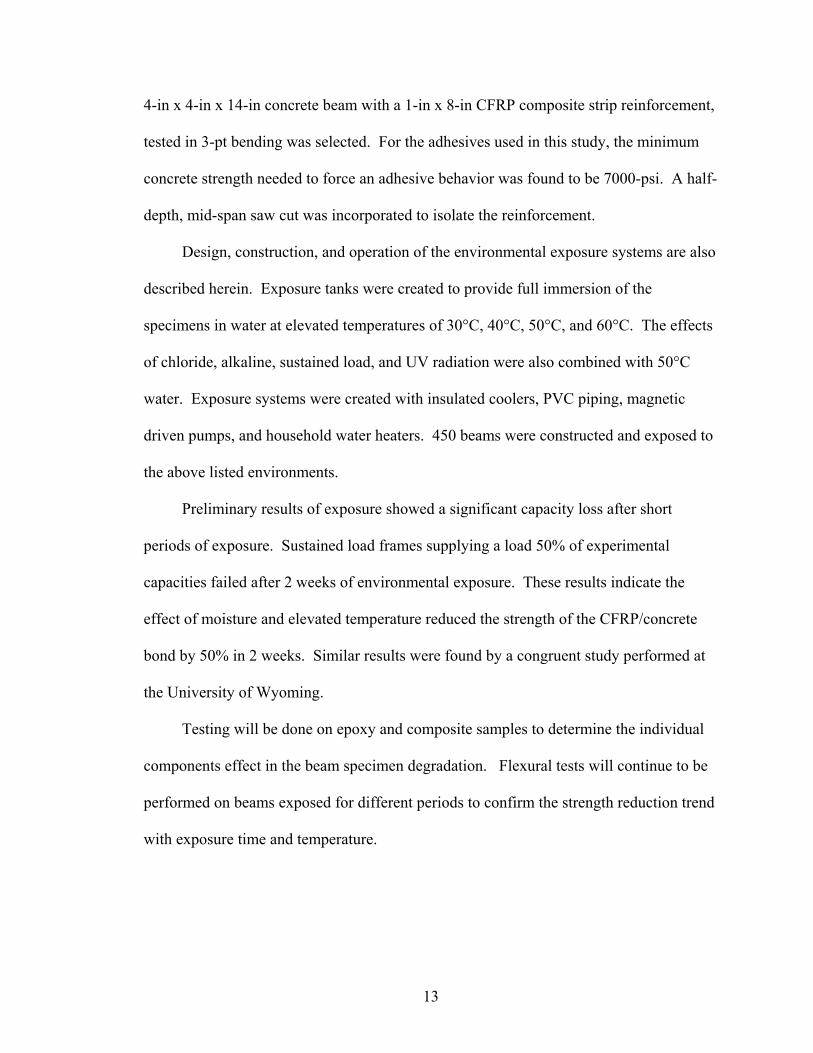
4-in x 4-in x 14-in concrete beam with a 1-in x 8-in CFRP composite strip reinforcement,
tested in 3-pt bending was selected. For the adhesives used in this study, the minimum
concrete strength needed to force an adhesive behavior was found to be 7000-psi. A half-
depth, mid-span saw cut was incorporated to isolate the reinforcement.
Design, construction, and operation of the environmental exposure systems are also
described herein. Exposure tanks were created to provide full immersion of the
specimens in water at elevated temperatures of 30°C, 40°C, 50°C, and 60°C. The effects
of chloride, alkaline, sustained load, and UV radiation were also combined with 50°C
water. Exposure systems were created with insulated coolers, PVC piping, magnetic
driven pumps, and household water heaters. 450 beams were constructed and exposed to
the above listed environments.
Preliminary results of exposure showed a significant capacity loss after short
periods of exposure. Sustained load frames supplying a load 50% of experimental
capacities failed after 2 weeks of environmental exposure. These results indicate the
effect of moisture and elevated temperature reduced the strength of the CFRP/concrete
bond by 50% in 2 weeks. Similar results were found by a congruent study performed at
the University of Wyoming.
Testing will be done on epoxy and composite samples to determine the individual
components effect in the beam specimen degradation. Flexural tests will continue to be
performed on beams exposed for different periods to confirm the strength reduction trend
with exposure time and temperature.
13

CHAPTER 1 INTRODUCTION
Carbon fiber-reinforced polymer (CFRP) composites are being used in civil
infrastructure in applications ranging from reinforcing bars, column wrapping for
improved seismic resistance, and externally bonded reinforcement for strengthening of
walls, beams, and slabs. The use of CFRP for building infrastructure is a relatively new
concept, and the durability of these materials has not been extensively researched. The
capacity of CFRP materials under sustained load and changing environmental conditions
is a particular concern. Concrete bridge beams have in practice been repaired and
strengthened with externally bonded polymer CFRP composite sheets or prefabricated
CFRP laminates. The short-term behavior of these applications has been studied, and
construction specifications for bonded repair were developed under NCHRP Project 10-
59A. Nevertheless, research into their long-term performance is incomplete, and
durability issues remain unanswered.
There are a several CFRP systems available for surface-bonded treatment of
concrete. The more common methods include wet lay-up and pre-cured laminates. In the
wet lay-up system, dry sheets of unidirectional or multidirectional fabric are saturated at
the job site and rolled onto the surface using the saturant as the adhesive. Sometimes a
primer is needed to aid in bonding to the surface. The system is formed in the field,
including mixing of the resin and catalyst. Pre-cured systems include laminates and grids
that are manufactured in a controlled factory setting. These pre-cured systems are then
bonded to the surface of the concrete with an adhesive putty to provide stress transfer.
14

The adhesive putty consists of resin and catalyst which are mixed in the field. Another
category of CFRP composite used in building infrastructure is spray-up. This technology
is similar to that used in boat manufacturing. The final product is a chopped mat of
randomly oriented, discontinuous fibers encapsulated by a resin that is usually a polyester
or vinylester. This material is adhered to the substrate surface by the matrix resin during
the spraying process, eliminating the need for an additional coupling or bonding agent.
Due to their limited use in beam repair, spray-up systems will be considered similar to
wet lay-up systems for this study.
CFRP composites have been successfully used for years in automotive, marine,
industrial and aerospace applications. In these applications, however, the CFRP
composite is manufactured in a controlled environment and not in the environment to
which the component will be exposed. This same controlled manufacturing setting is
applied to pre-cured laminate systems. The wet lay-up or spray-up systems include
mixing and impregnating the resin matrix on-site. On-site resin curing conditions are not
as well controlled as the factory counterparts, perhaps leading to very different
performance characteristics.
For civil engineering structures, field conditions can present significant challenges
to ensuring that proper temperature and humidity conditions are maintained during
installation and curing periods. Mixing and wetting of the fabric is performed on site for
wet lay-up applications as shown in Figure 1-1, and is therefore not easily controlled.
Moreover, the temperature and humidity during mixing, saturation, and curing are
generally controlled by the ambient weather conditions.
15

A B
Figure 1-1. CFRP application A) pre-cured laminate application B) wet lay-up application
In adhesively bonded CFRP systems, one face of the material is adhered to the
concrete while the other is exposed to the environment. Consequently, the exposure
conditions (related to moisture) for the CFRP composite are controlled simultaneously by
the local environment and the underlying concrete. Highly or even moderately porous
concrete will readily transmit available moisture to the bond line. In addition, cracks and
porosity in the underlying concrete allow moisture access through diffusion and capillary
action. Moisture can gain access to the resin and fibers from the exposed face as well.
Accumulated moisture behind the bond line can create water cells that may initiate or
accelerate corrosion of the steel reinforcement.
Environmental durability issues of CFRP composites as investigated by previous
research are outlined in the next chapter. The current environmental durability design
procedure for CFRP composites is outlined and the role that this research plays in
perfecting the durability design is given.
16

CHAPTER 2 BACKGROUND
Previous Research in CFRP Durability
Some research has been performed on CFRP durability, but the bulk of the studies
have been performed on constituents of the CFRP system, mainly neat resin samples and
composite testing. Little research has been performed on CFRP bonded to concrete and
most have involved a peel, bond, or shear tests. Durability of CFRP bonded concrete
beams tested in flexure has not been studied extensively. The main research performed
and findings on CFRP materials exposed to environmental conditioning are given below.
Moisture
Exposure to moisture can have degrading effects on CFRP. The moisture can
lower the glass transition temperature (Tg) and also cause relaxation in the polymer
matrix. Stress-induced cracking and a reduction in fiber-matrix adhesion also occurs due
to moisture exposure. The overall effect of moisture exposure on CFRP is reduced
strength and mechanical properties, eventually leading to a matrix/fiber bond failure as
shown by the previous research outlined below.
Au and Buyukozturk (2006) performed peel and shear tests on pre-cured CFRP
laminate bonded to concrete with epoxy. Specimens were exposed to 100% relative
humidity (RH) at 23º and 50º C for 0-56 days. Dry specimens failed cohesively within
concrete. Wet specimens failed adhesively at the epoxy/concrete bond line. A 50-60%
loss in fracture toughness was observed after environmental exposure.
17

Tu and Kruger (1996) and Aiello et al. (2002) performed bond strength tests on
epoxy bonded concrete. The bond test was performed according to ASTM C882. A loss
in bond strength of 20-50% was found after 135 days immersion in 23°C water (Tu and
Kruger 1996). After a cycle of 48 hours immersion in 23°C water followed by 48 hours
of drying, Aiello, Frigione, and Acierno (2002) found 17-35% reduction in bond strength.
Hulatt et al. (2002) exposed prepreg CFRP coupons to wet-dry cycles which
consisted of complete immersion for 5 hours and drying in 50% relative humidity for 2
days, up to a total immersion time of 2000 hours. The samples were then tested in
tension on an Instron model 1185 according to ASTM D3039M. The coupons subjected
to moisture exposure were found to have a 3.8% reduction in failure stress when
compared to unexposed coupons. This reduction has been attributed to water infiltration
weakening the fiber/matrix bond and therefore causing stress relaxation within the
specimen.
Karbhari et al. (1997) constructed 9-in. x 6-in. x 1-in. test beams reinforced with
2-ply 12-in. x 1-in. strips of wet lay-up unidirectional CFRP. The beams were then
immersed for 60 hours at 20°C. A peel test was performed, where the peel force was
read directly from the load cell. It was found that interfacial fracture energy decreased
with exposure to water as plasticization of the matrix occurs and bond stresses on the
resin/fiber surface increased due to matrix swelling.
Banks et al. (2004) immersed prepreg CFRP coupons for 330 days at 65°C. The
specimens underwent dielectric measurements to determine moisture absorption and
shear testing to determine deleterious effects of exposure. It was found that the failure
mode of the coupons changed from fiber tear to adhesive failure upon exposure. The
18

water was also found to be ‘bound’ to the adhesive rather than located as free water in
voids.
Ferrier and Hamelin (2002) constructed wet lay-up CFRP samples and exposed
them to immersion in water at 20°C and 45°C for up to 2500 hours. The specimens were
then tested using Barcol hardness, Differential Scanning Calorimetry (DSC), and water
absorption analysis. It was found that increased water exposure decreased Tg, surface
hardness, and mechanical properties of the CFRP. An increase in temperature also
increased the water absorption of the sample, decreasing mechanical properties.
Moisture/Salt
The exposure of CFRP to salt and other chemical solutions will have similar
effects as that with water exposure. The moisture will penetrate the composite and cause
the matrix material to swell and relax. The addition of salt and other solutions accelerates
the degradation of the polymer matrix further.
Sen et al. (1999) exposed CFRP wet lay-up bonded to concrete to cyclic
environmental exposures involving seawater. The specimens underwent17 months
followed by 6 months of continuous outdoor exposure or 23 months continuous outdoor
exposure. The specimens then underwent torsion and tension testing through an
apparatus bonded to the surface of the CFRP. A 0-55% loss in bond strength was
observed after salt water exposure and a 0-45% loss in bond strength for outdoor
exposure.
El-Hawary et al. (2000) exposed epoxy bonded concrete to tidal saltwater
exposure. Exposure times were 6, 12, and 18 months. Split tension and slant shear tests
were performed on exposed specimens. It was found that the failure mode changes from
cohesive to adhesive with aging time. No change in tensile strength was observed upon
19
exposure, and a 25% decrease in bond strength was observed after 18 months of
exposure. Specimens appeared to become protected by build-up of shells.
Toutanji and Gomez (1997) exposed CFRP and GCFRP wet lay-up bonded
concrete beams to simulated saltwater. One cycle involved 4 hours immersion and 2
hours at 35º C and 90% RH. Specimens were exposed for 75 days and then tested in 4-pt
flexure. A 5-30% loss in flexural strength was observed with exposure.
Karbhari et al. (1997) constructed 9-in. x 6-in. x 1-in. test beams reinforced with
2-ply 12-in. x 1-in. strips of wet lay-up unidirectional CFRP. The beams were then
immersed in synthetic sea water according to ASTM D1141 for 60 hours at 20°C. The
peel force of the composite was read directly from a load cell during a peel test.
Dynamic Mechanical Analysis (DMA) results show exposure to sea water reduced
interfacial fracture energy when compared to unexposed specimens. This result occurs
due to plasticization of the matrix and stresses developing between the fiber and matrix
due to matrix swelling.
Hulatt et al. (2002) tested prepreg CFRP coupons for reduction in tensile stress on
an Instron model 1185 according to ASTM D3039M. The exposed specimens were
subjected to wet-dry cycles which consisted of complete immersion for 5 hours in sodium
chloride solution and drying in 50% relative humidity for 2 days, up to a total immersion
time of 2000 hours. The coupons subjected to salt solution exposure were found to have
a 3.1% increase in failure stress when compared to unexposed coupons.
Banks et al. (2004) subjected prepreg unidirectional CFRP to 330 days of
immersion in simulated ocean water (ASTM D1141-90) at 65°C. Dielectric
measurements for moisture absorption showed the adhesive absorbed 1% water. Shear
20

tests determined the mode of failure changed from fiber tear to adhesive failure upon
exposure to simulated ocean water.
Moisture/Alkali
Alkali solutions can be created by concrete pore water and have high pH values of
12-13. Exposure to these solutions degrades the polymer matrix in excess to that of water
exposure. The alkali attacks the polymer chains and assists in the degradation. This
attack is especially severe for under-cured specimens.
Katsuki and Uomoto (1995) exposed CFRP rods (6-mm diameter, 40-mm length)
to NaOH solution at 40°C for 7-120 days. The rods were then tensile tested to determine
effects of exposure. It was determined that there was not penetration of alkali or
reduction in failure stress upon exposure.
Nanni et al. (1998) performed pullout testing on carbon vinyl-ester rods in
concrete. The exposure conditions were immersion in Ca(OH)2 with a pH of 12-13 at 26,
60, and 80°C. It was found that the pullout load reduced for increasing temperature and
exposure time.
Chin et al. (1998) constructed dogbone specimens of isophthalic polyester and
vinyl ester resins. The dogbones were immersed in 0.32 mol/L KOH, 0.17 mol/L NaOH,
0.07 mol/L Ca(OH)2 solution with distilled water (pH 13.5) at room temperature, 60°C,
and 90°C up to 1300 hours. Tensile tests were performed on dogbone specimens after
exposure and were found to have 60% of original strength when exposed to solution at
room temperature and have deteriorating strength as temperature and exposure are
increased. Isophthalic polyester specimens lost all strength after 10 weeks of exposure at
90°C.
21
UV Radiation
Ultraviolet radiation causes degradation in polymeric materials due to chain
scission. Long term exposure of CFRP to UV radiation will cause surface defects and
cracks, which could facilitate the entrance of water and other surface impurities into the
composite. This facilitation could eventually lead to loss of mechanical properties in the
composite system.
Hulatt et al. (2002) exposed CFRP prepreg coupons to 2000 hours of UV
radiation according to ASTM G53. After exposure, coupons were tested in tension and
compared to unexposed specimens. It was found that the stress at failure increased after
exposure. This result was attributed to possible cross-linking during post-cure due to UV
exposure.
Startsev et al. (1999) performed long-term experiments with carbon/epoxy
specimens exposed to hot, humid environmental conditions for 2 years. The specimens
underwent interlayer tensile and fatigue testing after exposure. The outer surface
underwent degradation, causing an outer layer decrease in shear and fatigue, while the
inner portion of the sample remained unaffected.
Liau and Tsent (1998). performed tensile tests on exposed coupons of prepreg
CFRP. The results indicated surface degradation. The surface degradation caused crack
initiation, eventually reducing the strength due to stress concentration. As exposure time
increased, it was found that the tensile strength retention of the specimens decreased.
Haeberle et al. created carbon fiber vinylester resin matrix coupons 1.5-mm thick
and 2.54-cm square. The specimens were exposed to a 100 watt arc bulb for 45 days of
exposure, 1.5 hours of exposure per side per day. After exposure, specimens were tested
22
on an Instron testing machine. It was found that exposure caused surface cracking, but
no decrease in tensile strength.
Fatigue
Fatigue loading is common in service bridges. This loading can cause stress
relaxation in the polymer composite, leading to reduced strength and stress to failure.
Heffernan, Wight, and Eriki (2002) performed fatigue testing on one-way steel
and CFRP reinforced slabs. The fatigue test was a four point test where the specimens
were fatigue loaded to failure. It was found that the CFRP reinforcing increased load to
failure over un-reinforced specimens. In all cases, the steel yielded, causing a transfer of
the load to the CFRP, resulting in bond line failure.
Brena, Wood, and Kreger (2002) created test beams reinforced with either
unidirectional CFRP or pultruded CFRP plates. The specimens were subjected to cyclic
loading of 10000 or 1000000 cycles with a strain equal to 33-50% yield load. The
specimens were then tested to failure using a four-point bend test. It was found that the
CFRP did not fail at the strain levels typical to service loads, but if the load was increased
above the service load, failure did occur. The larger the stress was in the CFRP, the
lower the number of cycles to failure. Both the pultruded bars and unidirectional CFRP
failed by debonding.
Conclusions of Previous CFRP Environmental Durability Research
The combination of moisture, elevated temperature, and other aggravating effects
such as alkaline, salt, UV, and sustained load have proven to have deleterious effects on
the performance of CFRP bonded concrete. Moisture exposure from relative humidity or
immersion at room temperature was found to have a decrease of mechanical properties up
to 60%. Addition of alkali and salt to the moisture exposure resulted in reduction of the
23
mechanical properties of the CFRP and a change in failure mode. Exposure to UV did
not have an effect on the mechanical properties when investigated independently, but did
cause micro-cracking which aids in moisture facilitation to the impregnating resin matrix
when moisture exposure is congruently investigated.
Durability Design
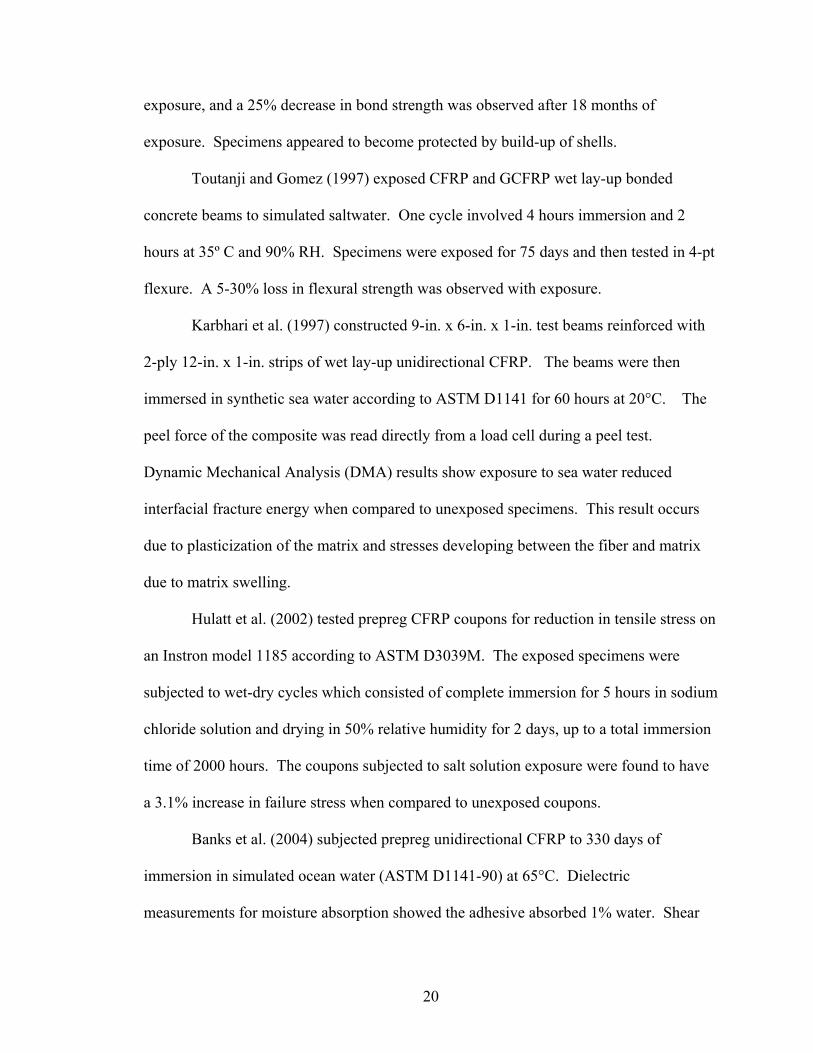
Currently, an environmental reduction factor is used in design of CFRP systems
according to ACI Report 440.3R. This factor is applied to manufacturer specified
composite material properties to account for long-term exposure to environmental
conditions. The design ultimate tensile strength and rupture strain are determined by
applying the environmental reduction factors given by Table 8.1 in ACI 440.3R (Table 2-
1) to the design values given by the composite manufacturer. The environmental
reduction factors currently in use are “conservative estimates based on the relative
durability of each fiber type” (ACI 440R). There is little research supporting these
values.
Table 2-1. Environmental-reduction factors given by ACI 440.3R for various CFRP systems and exposure conditions
24
NCHRP Research
Limited research has been performed on CFRP bonded to concrete, but mostly in
the form of peel and hardness tests. Little research was found in the literature related to
flexural testing of concrete beams with bonded CFRP composite reinforcement. What
research has been performed does not relate to long term durability of this type of
specimen.
Durability of CFRP composite bonded to concrete tested in flexure will be
investigated by the National Cooperative Highway Research Program (NCHRP) project
12-73 “Design Guidelines for Durability of Bonded CFRP Repair/Strengthening of
Concrete Beams”. The objectives of the NCHRP research are to develop 1) design
guidelines and 2) material selection criteria that consider the effects of mechanical and
environmental loads on the durability of bonded carbon fiber-reinforced polymer (CFRP)
repair and strengthening of concrete beams. The methods used to fulfill the objectives
are threefold. First, the current knowledge available on the durability of CFRP
composites used in bridge applications will be evaluated to identify the environments that
appear to have the most extreme effect on the CFRP mechanical properties. Next, a
series of mechanical tests will be created and performed to determine effect of the
selected environments on the adhesive bond properties of the CFRP composite. Finally,
a single “environmental reduction factor” will be developed based on the measured
reduction in capacity of the CFRP composites exposed to the critical environments.
Research Contribution
The research reported in this thesis is in support of the NCHRP project 12-73.
Standard test procedures and specimen configuration were developed to be used in the
NCHRP project. Several factors such as concrete specimen geometry, concrete strength,
25

and CFRP geometry were investigated to determine a suitable configuration for the
project. The results from flexural testing were used to determine the desired
configuration. Once the specimen configuration and test procedures were determined,
specimens were constructed for the NCHRP study. An environmental exposure system
was developed and constructed for aging the specimens. Specimens exposed to
environmental conditioning were tested to provide preliminary durability results.
26
CHAPTER 3 RESEARCH APPROACH
A design factor is required to be applied to the mechanical properties of the CFRP
composites used during the design process. As of yet, the factor used for durability
design is not founded by research. Results from durability research will need to be
correlated into a factor that can be used for design of CFRP systems. Short-term
durability results will need to be extrapolated for long-term structural design.
Accelerated Aging Model
Specimens will be exposed to hygrothermal conditions at four temperatures and
three time points. The results from the hygrothermal exposure tests will then be used
with an accelerated aging model to predict long term results. These long term results can
be used to predict the behavior of CFRP composite bonded to concrete, and therefore be
used for structural design.
The Arrhenius model was chosen to predict long term behavior using accelerated
test data. Traditionally, the method of extrapolation for aging is done through the
Arrhenius relationship given in Equation 3-1.
⎟⎠⎞⎜
⎝⎛
⋅−
= TRQ
AeK Equation 3-1
Coefficients A and Q are pre-exponential and activation energies, respectively. If they
are assumed constants then the above can be rewritten for two different test conditions as:
( ) ⎥⎦
⎤⎢⎣
⎡⎟⎠⎞
⎜⎝⎛−=⎟
⎠⎞
⎜⎝⎛
refref TTRQ
tt 11ln Equation 3-2
27
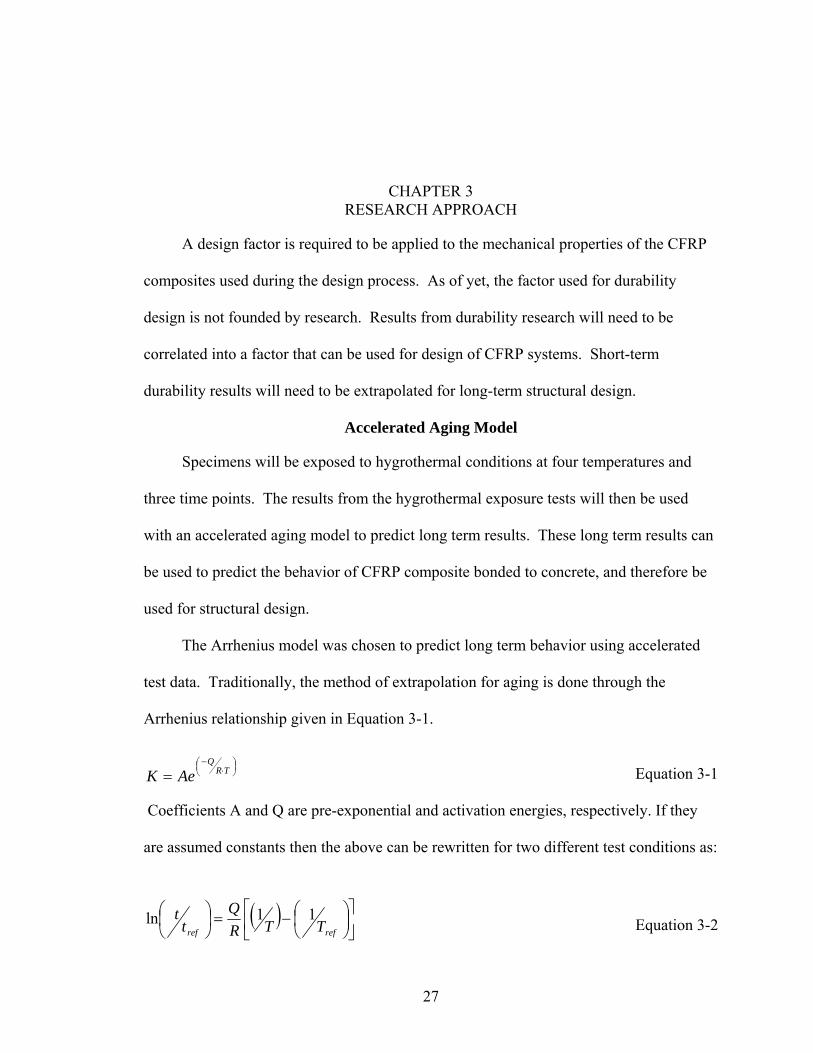
The activation energy can be determined as the slope and intercept of the ln (1/t)
(time) vs. (1/T) (Temperature) plot. Figure 3-1 shows such plots for a typical sample
material. Once the activation energy is known, Equation 3-2 can be used to predict the
service time for a given property value at a service temperature, given the time and
temperature for that same property value under the accelerated aging conditions. This
procedure is considered the “standard” aging relationship and is applied to metals,
ceramics and polymers equally. (National Academy Press 1996; LuValle et al. 1998;
Nickles and Wiest 2000; Caruso and Dasgupta 1998; White and Turnbull 1994)
Figure 3-1. Arrhenius correlation plots (National Academy Press 1996)
An understanding of the theoretical basis behind this extrapolation procedure
provides a basis for extending the accelerated test conditions. For the situations
considered in this work, property changes in the resin occur due to plasticization effects
from moisture absorption. Thus, increasing the temperature at constant relative humidity
causes acceleration in aging due to two effects: an increase in the diffusion coefficient
and an increase in the absolute concentration of moisture in the aging environment. Both
of these factors cause an increase in the rate of moisture absorption by the resin, and thus
an increase in the aging rate. The increases in diffusion coefficient and the moisture
28

concentration at constant relative humidity are described by the Arrhenius relation. Thus,
use of the procedure described above results from a superposition of the two effects, and
the “apparent” activation energy measured in aging experiments is a combination of the
activation energies for the two processes.
The assumptions made for use of this model are:
• Moisture is the critical parameter governing degradation
• Alkali, salt, and other aggravating factors accelerate deterioration, but the governing transport mechanism is the basic mechanism of moisture diffusion
• The Arrehenius law, based on moisture migration, can be used to model the moisture degradation. The Arrehenius law results in exponential decay behavior.
• The Arrehenius law can be correlated across different temperatures
Specimens will be immersed in water at four different temperatures and a minimum
of three time points. The capacity loss relative to control specimens at each time and
temperature point will be used to create decay curves similar to that of Figure 3-1. A
horizontal line at any desired capacity can be used to generate a (1/T) vs ln(1/t) plot.
From these data, equivalent exposure times for elevated temperatures can be determined.
For example, exposure at 20°C for 24 months could be equivalent to exposure at 40°C for
6 months.
The data from the Arrehenius durability correlation tests will be used to develop a
design coefficient, Ce. Over time the degradation due to environmental effects will
increase. To account for the effect of time, two forms of evaluation will considered.
First, for a given reduction in strength (e.g. Ce = 0.85), the time for the reduction to occur
will be computed using the methods outlined above. For example, a repair system may
have a Ce of 0.85 for a 48-year life-span. Inversely, for a given time (say t = 50-years),
29

the strength reduction due to environmental factors will be computed. In this case, a
repair system designed for a 50 life span may have a Ce of 0.84.
Research Plan
This thesis covers the development of the standard test procedures and the design,
construction, and operation of the exposure system. The milestones performed were the
development of a testing procedure, creation and testing of pilot specimens, construction
of the 375 specimens to be tested at UF, and design and construction of the exposure
system.
The objective of the pilot study was to determine an ideal specimen and test configuration
as part of the larger study. The specimens needed to be of the beam type so as to be
tested in flexure. This type of specimen was chosen based on ASTM standard C78-02.
The study required a large number of specimens to be exposed to different environmental
conditioning, as shown in Table 3-1. The table shows the seven environmental
conditions considered, as well as the temperatures and times investigated. For each
environmental condition, multiple composites were to be investigated, each unique
combination including 3 replicates. This produced a specimen requirement of around
400 in number. The specimen configuration needed to be small enough for this large
number to be produced, yet large enough to accurately represent the behavior of the
concrete.
The goal of the environmental conditioning study was to produce a correlation
between the flexural strength of the CFRP bond to the concrete for the different
environmental conditions and time periods. To compare the results of the flexural
testing, it was imperative that the failure modes for all tests be the same. The failure
mode needed to be adhesive to ensure the failure load was indicative of the bond failure
30

strength. It was therefore necessary to determine the configuration of each composite
that would produce an adhesive failure mode. The failure mode was governed by the
surface preparation, concrete strength, CFRP bond strength, and CFRP width. Each of
these factors was investigated to determine the desired specimen configuration that would
cause adhesive failure.
Table 3-1. Environmental Conditioning Test Matrix
Condition Solution Temp. (°C)
Exposure Time (mos) # Specimens
6 18 12 18 24 18 60 12
Control Atmospheric Room Temp
120 12 Thermal & Chloride Chloride Water 50 12 12 Thermal & Alkali Alkali Water 50 12 12
6 12 12 15 Sustained Load Water 50 24 12
UV/Wet/Dry Water/UV drying 50 12 12 24 9 60 12 Real Time Outdoors N/A 120 9 6 12 12 12 24 18 30
60 6 6 9 12 9 24 15 40
60 3 6 9 12 9 24 15 50
60 3 6 12 12 12 24 18
Arrhenius Water
60
60 6
31

CHAPTER 4 BEAM TEST: DEVELOPMENT
This chapter covers the experimental work conducted to optimize the specimen and
testing configuration for determining the bond strength of CFRP composite reinforcement
bonded to concrete. The investigation was designed to consider the variables shown in
Table 4-1. Three beam sizes and two concrete strengths were investigated. In addition,
four different composite systems, both commercially available and homemade, were
tested. Supplemental reinforcement both internal and external was tested as well.
Although each variable was not evaluated independently, 104 specimens were
constructed and tested before finalizing the test protocol. The following sections describe
the fabrication and testing techniques used.
Table 4-1. Factors investigated for determination of specimen configuration
Beam Type
Concrete Strength
CFRP System
CFRP Size
Added Reinforcement
Load Config.
6 X 6 X 30 (in)
5 ksi Composite C
Length None 3-pt
6 X 6 X 22 (in)
7 ksi Composite T
Width External steel plate
4-pt
4 X 4 X 14 (in)
Composite A
Internal steel bar
Composite S
Internal glass bar
Concrete Beam Fabrication
Concrete construction
The concrete beams were cast at the Florida Department of Transportation (FDOT)
State Materials Office (SMO) located in Gainesville, FL using concrete mixed at their
32
facility. The 104 specimens were constructed using nine different batches of concrete.
The beams were created by pouring concrete into steel or wooden forms in the desired
dimensions. The concrete was Class V and a mix typically used by the SMO in bridge
applications. The cement used was Type I/II and the ratio of cement:sand:coarse
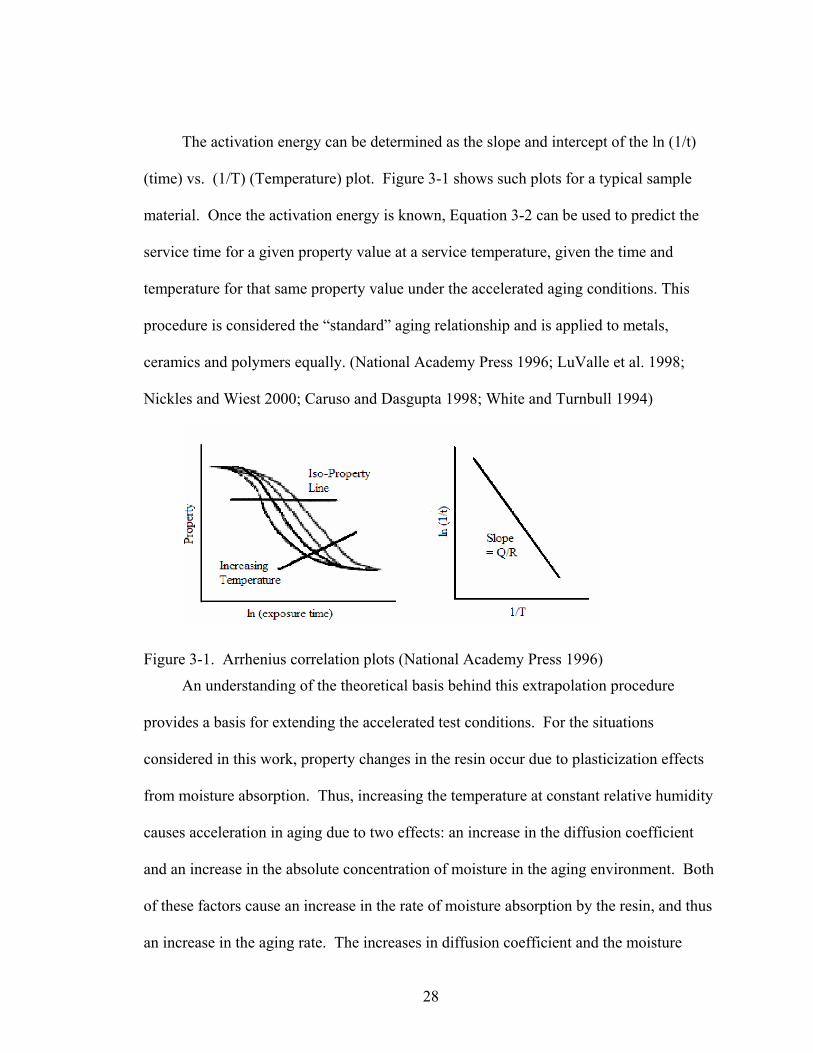
aggregate was 1.0:2.07:2.30 by weight. The materials used for the concrete construction
are showed in Figure 4-1.
A B C
Figure 4-1. Materials used for concrete construction A) Type I cement B) Sand C) Coarse aggregate
Each mix had a 28-day compressive strength ranging from 4500-psi to 7500-psi.
The beams were poured into the forms and covered with plastic for 24 hours to set up.
The forms were then removed from the beams, and they were transported to a moisture
chamber to cure. The beams were cured for a minimum of two weeks and removed to
dry before application of the CFRP composite.
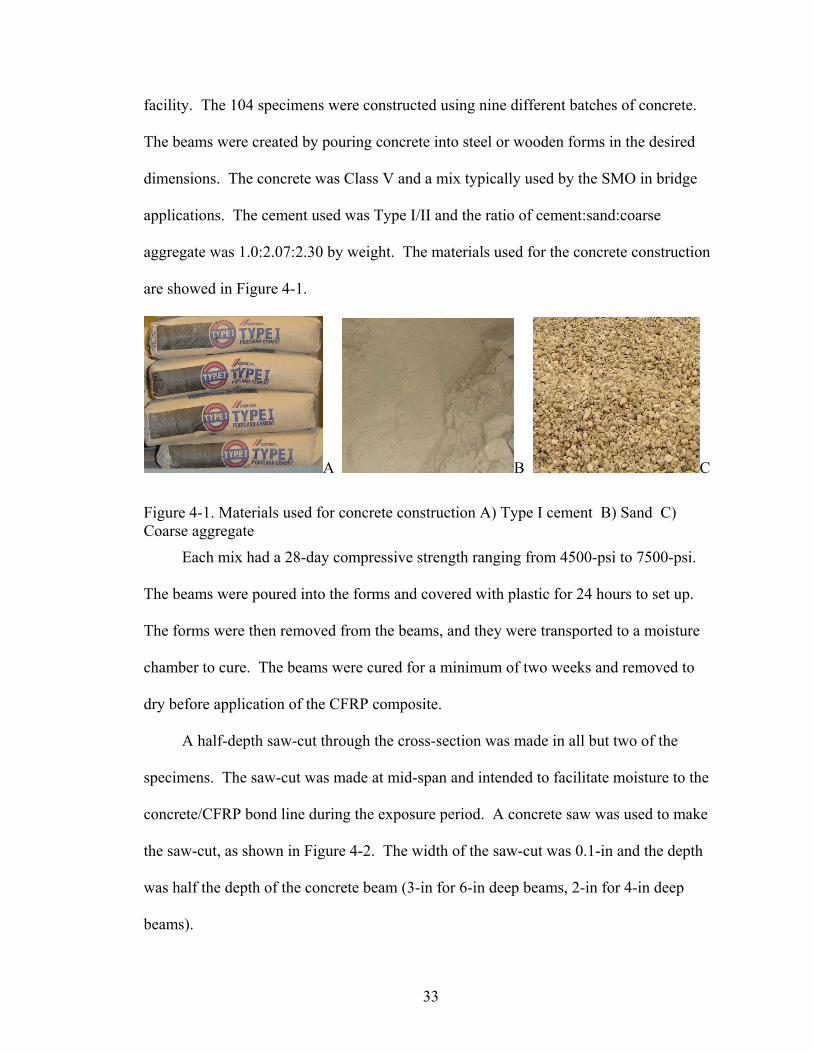
A half-depth saw-cut through the cross-section was made in all but two of the
specimens. The saw-cut was made at mid-span and intended to facilitate moisture to the
concrete/CFRP bond line during the exposure period. A concrete saw was used to make
the saw-cut, as shown in Figure 4-2. The width of the saw-cut was 0.1-in and the depth
was half the depth of the concrete beam (3-in for 6-in deep beams, 2-in for 4-in deep
beams).
33

Figure 4-2. Concrete saw creating half-depth saw-cut
Surface preparation
Before application of the composite, the surface of the specimen was prepared by
sand-blasting. According to the NCHRP Report 514:
“Surface preparation shall promote continuous intimate contact between CFRP and
concrete by providing a clean, smooth, and flat or convex surface. Cleaning shall
remove any dust, laitance, grease, oil, curing compounds, wax, impregnations, stains,
paint coatings, surface lubricants, foreign particles, weathered layers, or any other bond
inhibiting material. The cleaned surface shall be protected against redeposit of any bond
inhibiting materials”.
To promote continuous contact between the CFRP and concrete, the surface was
roughened with a sand blaster (Figure 4-3). After sand blasting, the surface was cleaned
and free of sand and dust as specified by the NCHRP Report.
34

Figure 4-3. Surface sandblasting a specimen
The amount of surface roughness was found to relate directly to the performance of
the CFRP system. The greater the surface roughness, the greater the surface area contact
between the CFRP and concrete, creating a better bond, and allowing the CFRP to be
engaged as stress is transferred across the concrete/CFRP bond line. Good sandblasted
surfaces were characterized by a rough surface caused by exposed aggregate. According
to the composite manufacturer, the sandblasted surface should have an ICRI profile
minimum of 3, as shown in Figure 4-4.
Figure 4-4.Sandblasted surface with aggregate exposed compared to ICRI profiling chip
35
Composite Application
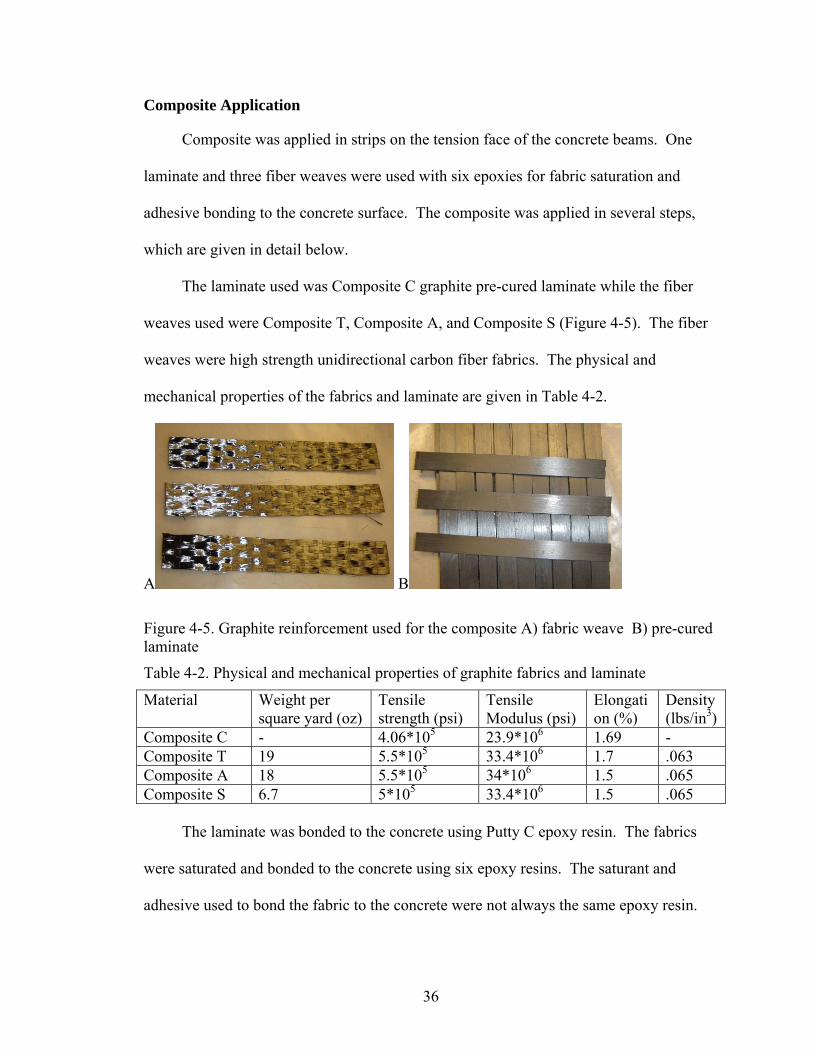
Composite was applied in strips on the tension face of the concrete beams. One
laminate and three fiber weaves were used with six epoxies for fabric saturation and
adhesive bonding to the concrete surface. The composite was applied in several steps,
which are given in detail below.
The laminate used was Composite C graphite pre-cured laminate while the fiber
weaves used were Composite T, Composite A, and Composite S (Figure 4-5). The fiber
weaves were high strength unidirectional carbon fiber fabrics. The physical and
mechanical properties of the fabrics and laminate are given in Table 4-2.
A B
Figure 4-5. Graphite reinforcement used for the composite A) fabric weave B) pre-cured laminate
Table 4-2. Physical and mechanical properties of graphite fabrics and laminate
Material Weight per square yard (oz)
Tensile strength (psi)
Tensile Modulus (psi)
Elongation (%)
Density (lbs/in3)
Composite C - 4.06*105 23.9*106 1.69 - Composite T 19 5.5*105 33.4*106 1.7 .063 Composite A 18 5.5*105 34*106 1.5 .065 Composite S 6.7 5*105 33.4*106 1.5 .065
The laminate was bonded to the concrete using Putty C epoxy resin. The fabrics
were saturated and bonded to the concrete using six epoxy resins. The saturant and
adhesive used to bond the fabric to the concrete were not always the same epoxy resin.
36

The epoxy resins used were Putty C, Saturant A, Saturant S, Saturant T, Tack Coat T, and
Saturant T with Cab-O-Sil®, with mechanical properties for each given in Table 4-3.
Table 4-3. Material properties of epoxy resins
Epoxy Resin Tensile Strength (ksi)
Tensile Modulus (ksi)
Flexural Strength (ksi)
Flexural Modulus (ksi)
Elongation (%)
Putty C 3.60 650 6.8 1700 1.0 Saturant A 8.00 250 11.5 500 3.0 Saturant S 4.35 551 - 551 1.5 Saturant T 10.50 461 17.9 452 5.0 Tack Coat T N/A N/A N/A N/A N/A Saturant S w/Cab-O-Sil®
10.50 461 17.9 452 5.0
The composite application was a multi-step process. The laminate was provided in
a 2-in wide, 10-ft long coil. It was then cut to length using tin-snips and cut to width
using a razor. The cutting process was done so as to ensure no cracking along the length
of the laminate. Once the laminate was the desired dimensions, it was adhered to the
concrete. The epoxy resin paste was prepared by mixing the appropriate ratio of parts A
and B (1:.34 by weight) for three minutes. The paste was then applied with a consistent
thickness to both the laminate and the concrete surface using a spatula. The laminate was
then placed on the concrete surface with the pasted surfaces touching. Pressure was
applied to the laminate to ensure bonding. The excess resin squeezed from between the
laminate and concrete was removed with a spatula.
The fabric application began with cutting the fabric in strips to length using fabric
scissors. The fabric was supplied in rolls approximately 2-ft wide and 20-ft long and was
cut to width between fiber rovings, so as to not fray the edges. The surface of the
concrete was cleaned with acetone. The manufacturer specified ratio of parts A and B of
the saturant resin epoxy were hand mixed for three minutes. A layer of epoxy was
37
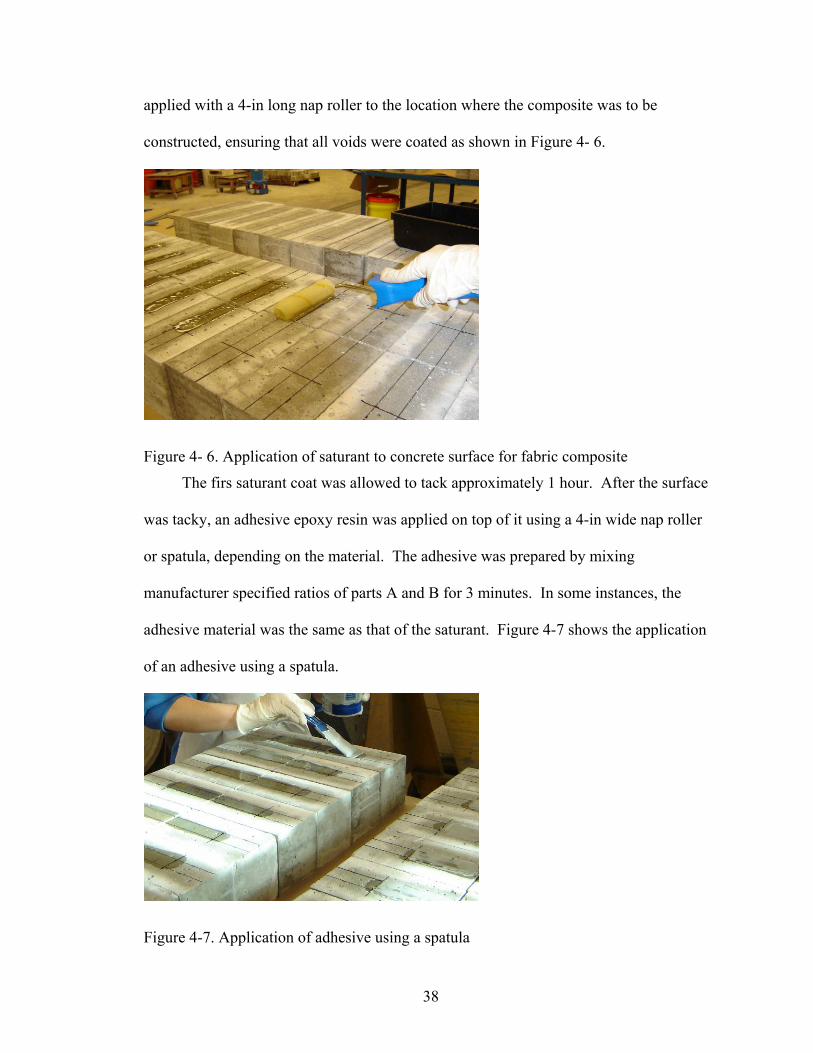
applied with a 4-in long nap roller to the location where the composite was to be
constructed, ensuring that all voids were coated as shown in Figure 4- 6.
Figure 4- 6. Application of saturant to concrete surface for fabric composite
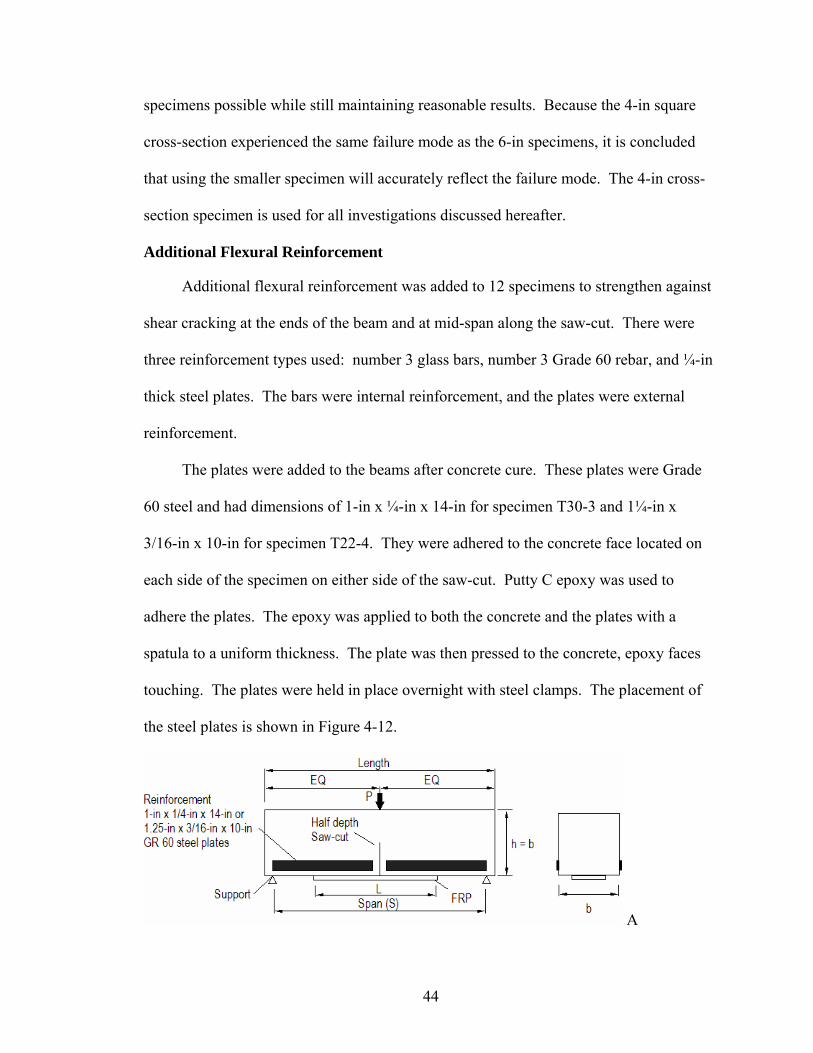
The firs saturant coat was allowed to tack approximately 1 hour. After the surface
was tacky, an adhesive epoxy resin was applied on top of it using a 4-in wide nap roller
or spatula, depending on the material. The adhesive was prepared by mixing
manufacturer specified ratios of parts A and B for 3 minutes. In some instances, the
adhesive material was the same as that of the saturant. Figure 4-7 shows the application
of an adhesive using a spatula.
Figure 4-7. Application of adhesive using a spatula
38

The fiber fabric strips were saturated with the saturant epoxy resin, causing a
saturant:fabric weight ratio of 1:1. The saturant was rolled through the rovings of the
fabric using a nap roller. The fabric was then placed on the concrete surface on top of the
adhesive, as shown in Figure 4-8. The composite was then rolled with the nap roller to
ensure adhesion.
Figure 4-8. Fabric composite placed on adhesive
Flexural Testing Procedures
As a starting point, the standard test method for flexural testing of concrete beams
(ASTM C78-02) was looked to. This test method, shown in Figure 4-9A, has two load
points that create a region of constant maximum moment and zero shear. Three-point
loading was investigated because it will create a higher moment at mid-span with the
same applied load. To achieve the maximum moment capacity of the CFRP, a higher
load would have to be applied with the 4-pt loading configuration. This higher load
could potentially lead to a shear failure at the ends of the beam. For this reason, a 3-point
loading as shown in Figure 4-9B, was also investigated.
39

A
B
Figure 4-9. Schematic of flexural testing loading conditions. A) Four-point loading B) Three-point loading
The specimens were loaded using an Instron 3384 testing machine as shown in
Figure 4-10 with the CFRP composite on the bottom face (not visible in photos). The
bottom and top of the beam when placed in the testing apparatus corresponded to surfaces
that were formed. This ensured flat and parallel testing surfaces.
The software used to control the cross-head was Partner, a program configured to
work with the testing machine. The load was applied at a constant rate of 0.01 in/min so
as to cause specimen failure 1-2 minutes after half-capacity was reached. Load and cross-
head position were recorded during testing by the Partner program. These data were then
exported to a spreadsheet.
40

A B
Figure 4-10. Small beam flexural testing with Instron machine A) 3-pt loading B) 4-pt loading
Variables in Test Protocol
3-pt vs. 4-pt Testing Procedures
Twenty-eight specimens were used to compare flexural loading conditions. Load
was applied using one or two application points, separated by a distance, D. D was
varied to compare beam behavior. Two composites were investigated, along with the
effect of internal reinforcement. The specimens investigated, including the composite
type and geometry and load application spacing are shown in Table 4-4.
The failure mode and strength of specimens tested in the 3-pt configuration were
compared to those of the 4-point loading. Similar results were desired between the two
tests to ensure that the 3-point loading was indicative of the results obtained using the
standard test method. All aspects except the location of the load application remained
constant in all tests. The effect of load application spacing, D, was also investigated.
41

Table 4-4. Specimens investigated for flexural loading conditionSpecimen D w Fiber Adhesive Reinforcement
(in) (in) TG-1 TG-2 TG-3
0
TG-4 TG-5 2
1 A
Saturant A
Glass bar
TR-1 TR-2 TR-3
0
TR-4 TR-5 2
1 A
Saturant A
Steel bar
TS-5 TS-6
0
T4-5 T4-6 2
T4-7 T4-8 4
1 A
Saturant A
None
TS-9 TS-10 TS-11 TS-12
0 A
Saturant A
T4-1 T4-2 2
T4-3 T4-4 4
2
T
Cab-O-Sil
None
Beam Size
In total, 24 specimens were constructed and tested to compare concrete geometric
properties. The specimens included eight 30-in long specimens (6-in square cross-
section), eight 22-in long specimens (6-in square cross-section), and eight 14-in long
specimens (4-in square cross section). The specimen set-up is shown in Figure 4-11 and
the dimensions investigated are given in Table 4-5. The 6-in cross-section specimens
were originally investigated because this is the size that ASTM standards recommend.
The 4-in cross-section specimens were further investigated due to their ease of use and
the large number of specimens needed for the research program. Each specimen was
42

constructed with varying CFRP dimensions. The composite system used was Composite
T. The composite system consisted of Saturant T, Tack Coat T, and graphite
unidirectional fiber weave. Once the specimens were constructed and cured, they were
loaded in a 3-point flexure test to failure. The failure load and mode were examined and
used to determine the ideal specimen size.
Figure 4-11. Beam and CFRP dimensions for beam size investigation
Table 4-5. Beam and CFRP dimensions for beam size investigation
Specimen b=h (in) Span (in) w (in) L (in)T30-1, T30-2 6 28 4 12 T30-3, T30-4 6 28 4 16 T30-5, T30-6 6 28 2 8 T30-7, T30-8 6 28 2 6 T22-1, T22-2 6 20 4 8 T22-3, T22-4 6 20 4 12 T22-5, T22-6 6 20 2 6 T22-7, T22-8 6 20 2 4 T14-1, T14-2 4 12 3 6 T14-3, T14-4 4 12 3 8 T14-5, T14-6 4 12 1 4 T14-7, T14-8 4 12 1 2
Comparing specimens of different cross-section dimensions, it was found that the
failure mode was consistent. This is significant because the investigation calls for the use
of numerous environmental conditions. A large volume of specimens will be required to
accomplish this elaborate investigation. It is therefore necessary to use the smallest
43
specimens possible while still maintaining reasonable results. Because the 4-in square
cross-section experienced the same failure mode as the 6-in specimens, it is concluded
that using the smaller specimen will accurately reflect the failure mode. The 4-in cross-
section specimen is used for all investigations discussed hereafter.
Additional Flexural Reinforcement
Additional flexural reinforcement was added to 12 specimens to strengthen against
shear cracking at the ends of the beam and at mid-span along the saw-cut. There were
three reinforcement types used: number 3 glass bars, number 3 Grade 60 rebar, and ¼-in
thick steel plates. The bars were internal reinforcement, and the plates were external
reinforcement.
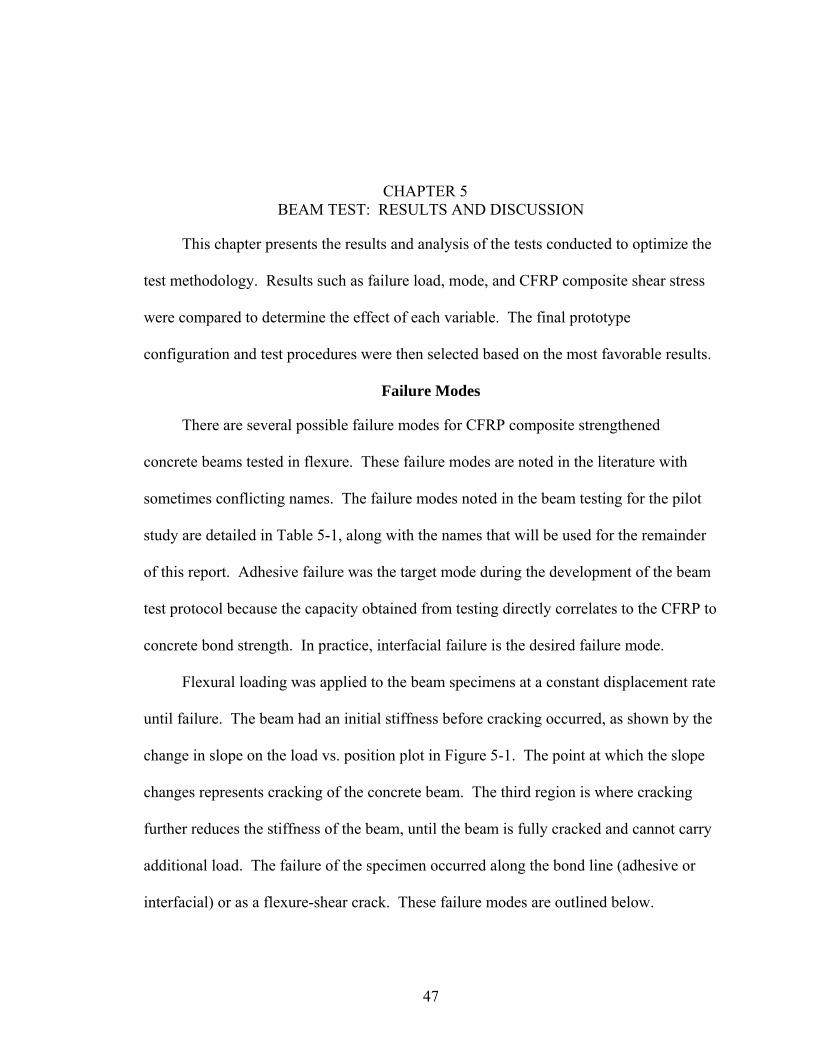
The plates were added to the beams after concrete cure. These plates were Grade
60 steel and had dimensions of 1-in x ¼-in x 14-in for specimen T30-3 and 1¼-in x
3/16-in x 10-in for specimen T22-4. They were adhered to the concrete face located on
each side of the specimen on either side of the saw-cut. Putty C epoxy was used to
adhere the plates. The epoxy was applied to both the concrete and the plates with a
spatula to a uniform thickness. The plate was then pressed to the concrete, epoxy faces
touching. The plates were held in place overnight with steel clamps. The placement of
the steel plates is shown in Figure 4-12.
A
44

B
Figure 4-12. Schematic showing placement of additional reinforcement A) external reinforcing plates B) internal reinforcing bars
The internal reinforcing bars were added during concrete pouring. The bars were
placed in the specimen molds so as to sit 1.5-in from the tension face of the beam and
were centered on the width of the beam as shown in Figure 4-12. They were continuous
through the length of the beam, but were cut at mid-span when the 0.1-in saw-cut was
made.
Concrete Strength
Little data are available in literature that addresses the effect of concrete strength on
the failure mode of CFRP composite bonded concrete. Preliminary testing indicated that
an adhesive failure could be forced if the concrete strength was sufficiently high. Initial
tests performed with a concrete strength of 5000-psi yielded inconsistent failure modes.
Consequently, beams were constructed with 7000-psi concrete, which proved to be
successful in promoting a consistent adhesive failure mode.
Two fiber types and six epoxy types were investigated with the two strength
concretes. The specimens analyzed for this study, including the CFRP types and
dimensions are shown in Table 4-6.
45

Table 4-6. Specimens used to analyze effect of concrete strength
Specimen f'c (ksi) composite adhesive w (in) L (in)T14-13-2 7.00 Composite T Putty C 1 12 T14-14-2 7.00 Composite T Putty C 1 12 T14-15-2 7.00 Composite T Putty C 1 12 T14-16-2 7.00 Composite T Putty C 1 12 T14-17 7.00 Composite T Cab-O-Sil 1 12 T14-18 7.00 Composite T Cab-O-Sil 1 12 T14-19 7.00 Composite T Cab-O-Sil 1 12 T14-20 7.00 Composite T Cab-O-Sil 1 12 T14-21 7.00 Composite T Saturant T 1 12 T14-22 7.00 Composite T Saturant T 1 8 T14-23 7.00 Composite T Saturant T 1 12 T14-24 7.00 Composite T Saturant T 1 8 T14-25 7.00 Composite T Cab-O-Sil 1 8 T14-26 7.00 Composite T Cab-O-Sil 1 8 T14-27 7.00 Composite T Cab-O-Sil 1 8 T14-28 7.00 Composite T Cab-O-Sil 1 8 TS-1 7.00 Composite A Saturant A 1 8 TS-2 7.00 Composite A Saturant A 1 8 TS-3 7.00 Composite A Saturant A 1 8 TS-4 7.00 Composite A Saturant A 1 8 TS-5 5.32 Composite A Saturant A 1 8 TS-6 5.32 Composite A Saturant A 1 8 TS-13 5.32 Composite A Saturant S 1 8 TS-14 5.32 Composite A Saturant S 1 8 TS-15 4.74 Composite A Saturant S 1 8 TS-16 4.74 Composite A Saturant S 1 8 TS-17 5.32 Composite A Putty C 1 8 TS-18 5.32 Composite A Putty C 1 8 TS-19 4.74 Composite A Putty C 1 8 TS-20 4.74 Composite A Putty C 1 8
It was necessary to ensure that the adhesive failure would occur for all fiber and
epoxy types. Flexural testing was performed, and the failure mode of each specimen
noted. The two concrete strengths were compared, and it was determined that having a
strength of 7000-psi or greater would cause adhesive failure, while strengths less than this
value will result in the other types of failure discussed previously.
46
CHAPTER 5 BEAM TEST: RESULTS AND DISCUSSION
This chapter presents the results and analysis of the tests conducted to optimize the
test methodology. Results such as failure load, mode, and CFRP composite shear stress
were compared to determine the effect of each variable. The final prototype
configuration and test procedures were then selected based on the most favorable results.
Failure Modes
There are several possible failure modes for CFRP composite strengthened
concrete beams tested in flexure. These failure modes are noted in the literature with
sometimes conflicting names. The failure modes noted in the beam testing for the pilot
study are detailed in Table 5-1, along with the names that will be used for the remainder
of this report. Adhesive failure was the target mode during the development of the beam
test protocol because the capacity obtained from testing directly correlates to the CFRP to
concrete bond strength. In practice, interfacial failure is the desired failure mode.
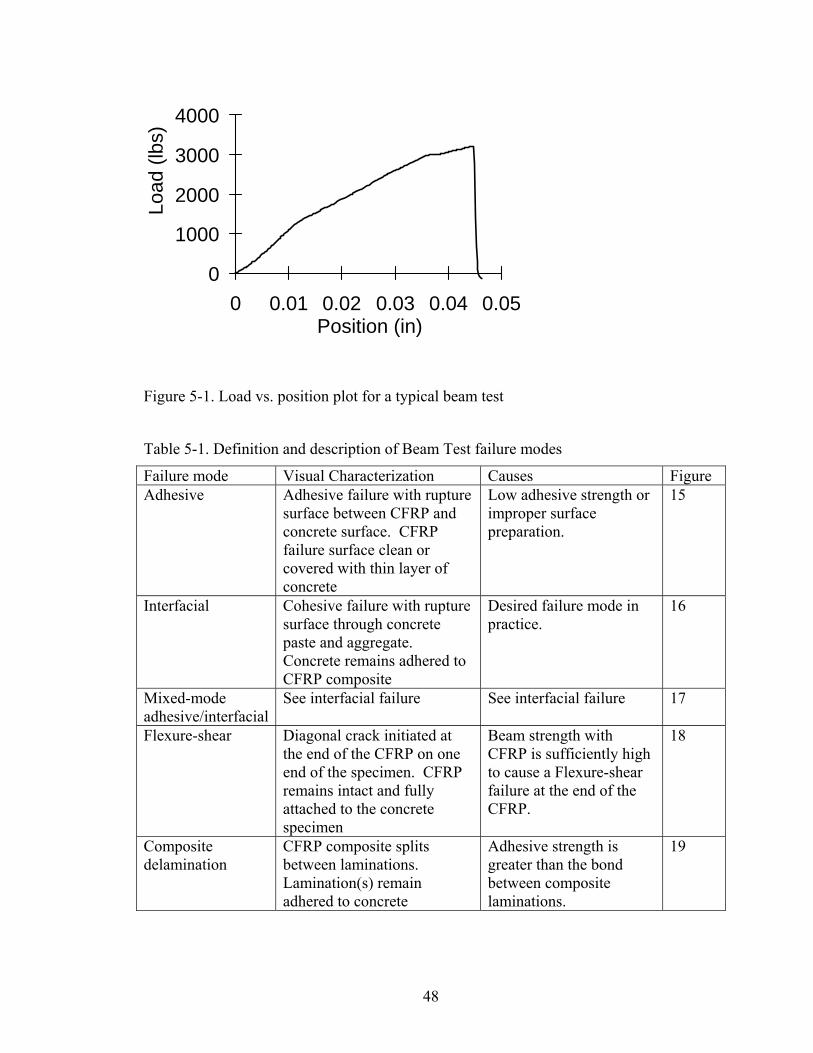
Flexural loading was applied to the beam specimens at a constant displacement rate
until failure. The beam had an initial stiffness before cracking occurred, as shown by the
change in slope on the load vs. position plot in Figure 5-1. The point at which the slope
changes represents cracking of the concrete beam. The third region is where cracking
further reduces the stiffness of the beam, until the beam is fully cracked and cannot carry
additional load. The failure of the specimen occurred along the bond line (adhesive or
interfacial) or as a flexure-shear crack. These failure modes are outlined below.
47
0
1000
2000
3000
4000
0 0.01 0.02 0.03 0.04 0.05Position (in)
Load
(lbs
)
Figure 5-1. Load vs. position plot for a typical beam test
Table 5-1. Definition and description of Beam Test failure modes
Failure mode Visual Characterization Causes Figure Adhesive Adhesive failure with rupture
surface between CFRP and concrete surface. CFRP failure surface clean or covered with thin layer of concrete
Low adhesive strength or improper surface preparation.
15
Interfacial Cohesive failure with rupture surface through concrete paste and aggregate. Concrete remains adhered to CFRP composite
Desired failure mode in practice.
16
Mixed-mode adhesive/interfacial
See interfacial failure See interfacial failure 17
Flexure-shear Diagonal crack initiated at the end of the CFRP on one end of the specimen. CFRP remains intact and fully attached to the concrete specimen
Beam strength with CFRP is sufficiently high to cause a Flexure-shear failure at the end of the CFRP.
18
Composite delamination
CFRP composite splits between laminations. Lamination(s) remain adhered to concrete
Adhesive strength is greater than the bond between composite laminations.
19
48
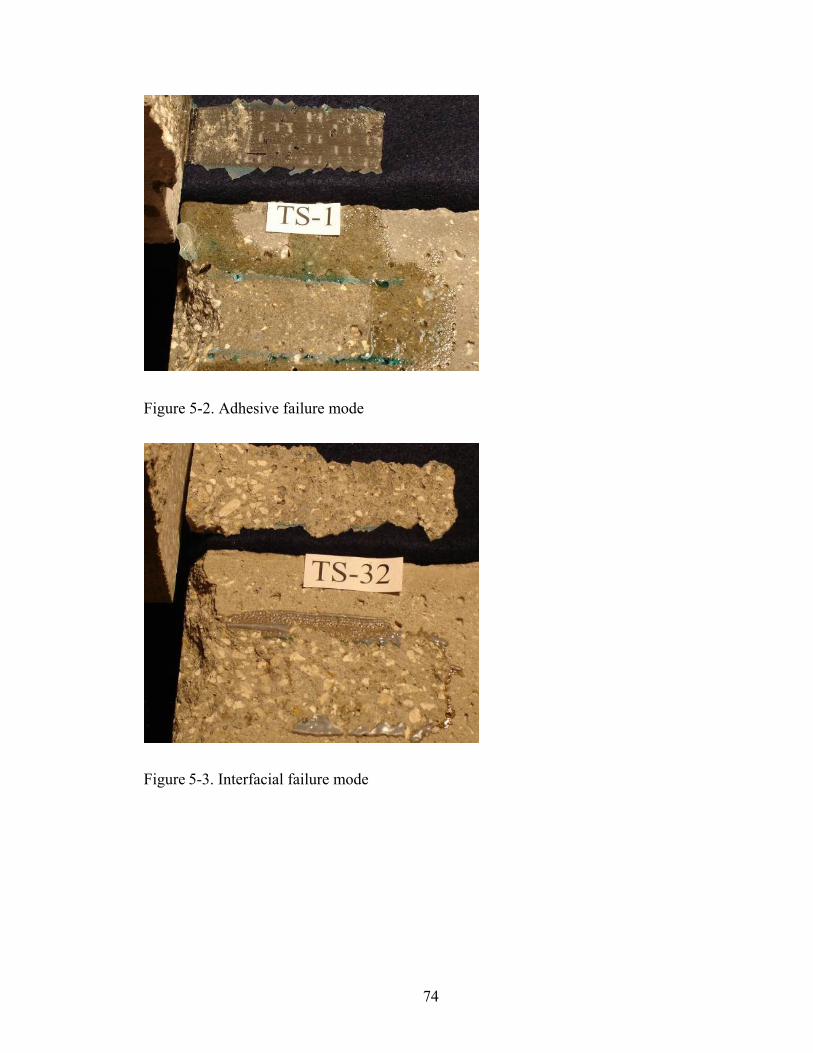
Figure 5-2. Adhesive failure mode
Figure 5-3. Interfacial failure mode
74
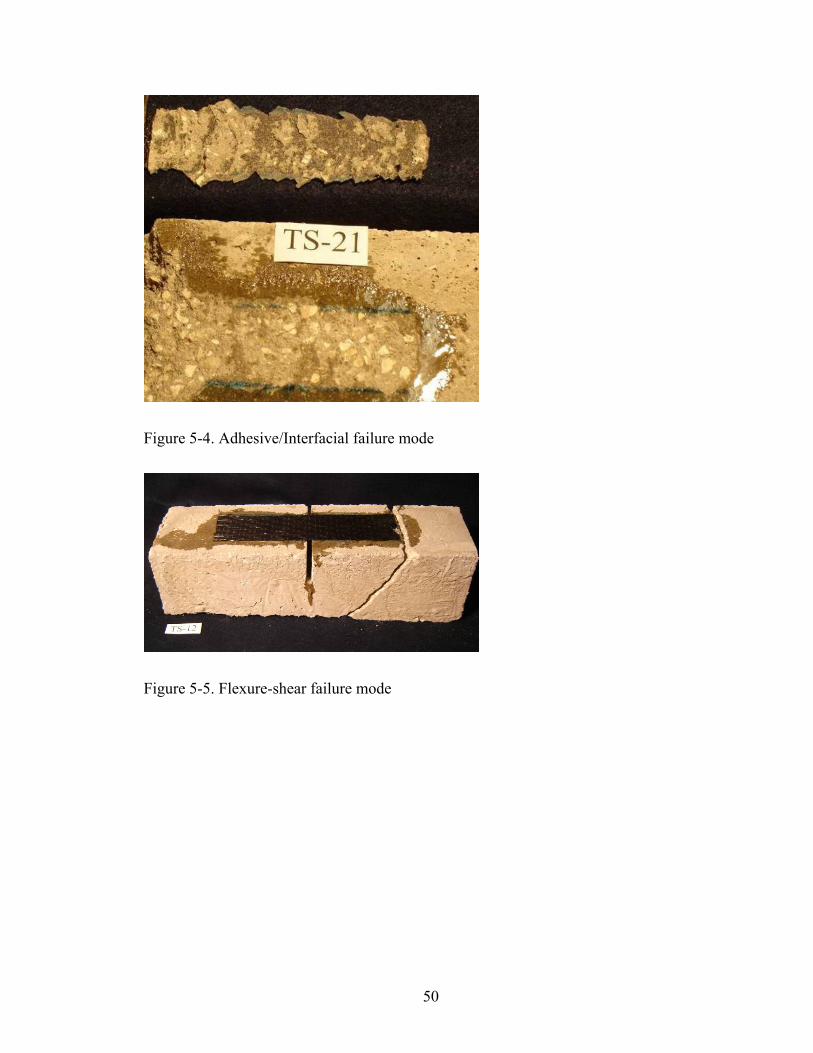
Figure 5-4. Adhesive/Interfacial failure mode
Figure 5-5. Flexure-shear failure mode
50
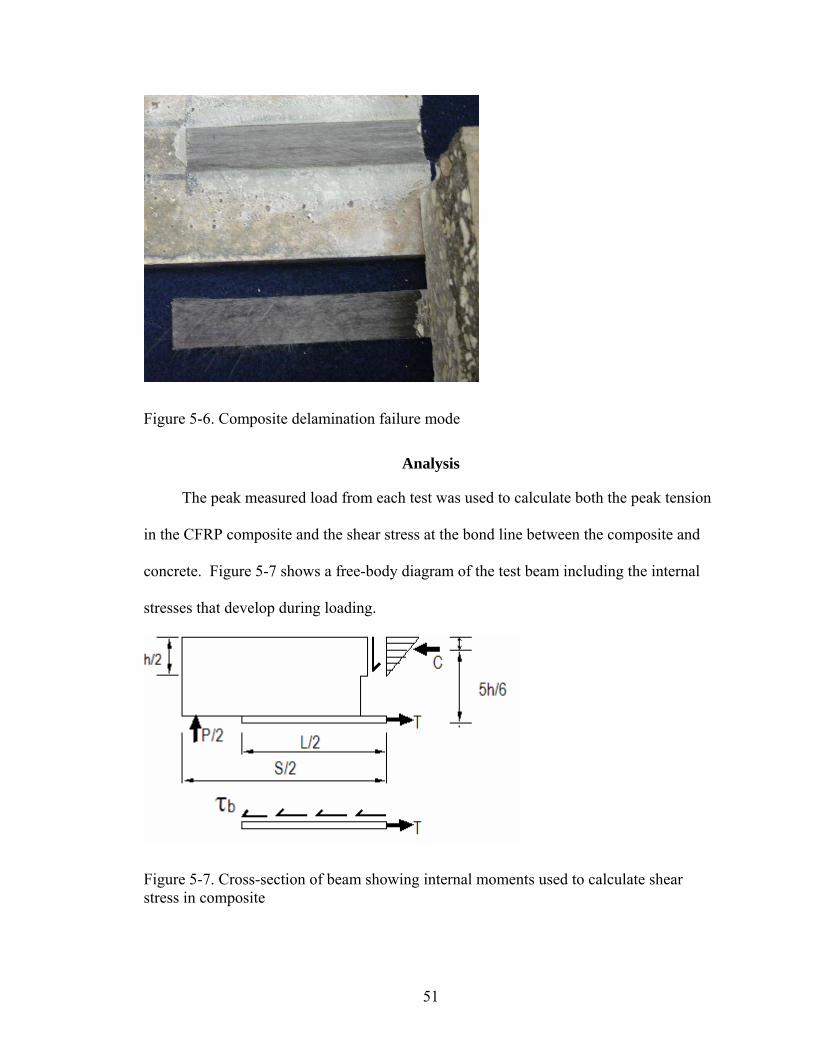
Figure 5-6. Composite delamination failure mode
Analysis
The peak measured load from each test was used to calculate both the peak tension
in the CFRP composite and the shear stress at the bond line between the composite and
concrete. Figure 5-7 shows a free-body diagram of the test beam including the internal
stresses that develop during loading.
Figure 5-7. Cross-section of beam showing internal moments used to calculate shear stress in composite
51
52
2w Lb⋅
Equating the mom
Equation 5-1
olving for T gives the force in the CFRP composite at the peak load:
5-2
It is a well known fact that the bond line shear stress varies drastically along the length of
d
Equation 5-3
Equation 5-4
pression region does not realistically extend the entire region
and
ent from the internal actions to the applied moment gives:
ThSP⋅⋅=
⋅65
4
S
Equationh⋅10SPT ⋅⋅
=3
T=τ
the composite. For simplification, the analysis presented in this report has assumed an
average bond line shear stress (τb) along the length of the composite, which is calculate
by dividing T by the contact area on one side of the saw-cut and using the peak measured
load from the beam test for P:
whSP
b ⋅⋅⋅⋅⋅
=5
3τL
Although the concrete com
above the saw-cut, it has been generalized in this analysis for easy comparison among
specimens. During testing, a crack in the concrete was visible above the saw-cut,, thus
increasing the internal moment arm from that shown in Figure 21. The simplified
analysis procedure will be used for comparison of specimens with similar concrete
composite stiffness, so the assumed moment arm is appropriate.

Effect of Beam Size
Table 5-2 presents the results of beam tests in which the beam size and reinforcement
length were varied. All beams were tested in 3-point bending. The failure mode was
typically bi-modal in which a portion of the de-bonded length was interfacial and the
remainder was adhesive (Figure 5-8). As the overall length of composite was reduced,
however, the interfacial portion remained fairly constant while the adhesive portion
shortened. The extreme example of this behavior is shown in Figure 5-9 where the
adhesive failure was eliminated due to the short length of the composite used.
Figure 5-8. Flexural failure progression
A B
Figure 5-9. Interfacial failure caused by short CFRP A) concrete failure surface B) CFRP failure surface
53
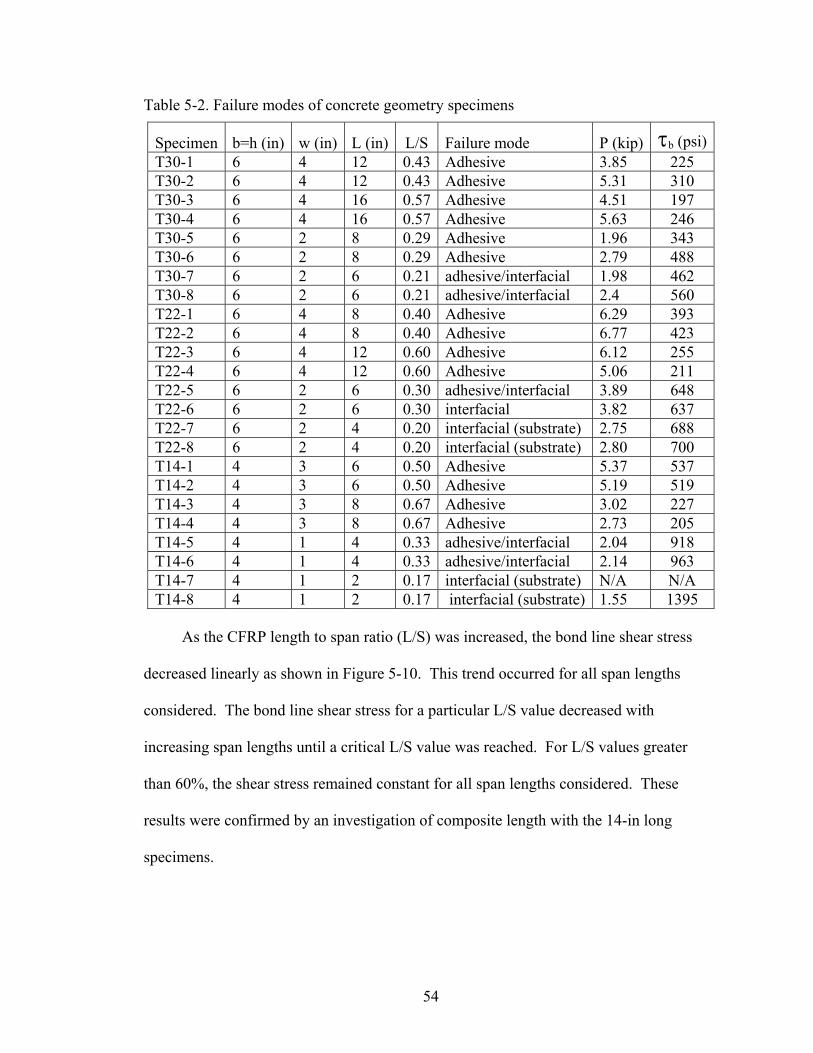
Table 5-2. Failure modes of concrete geometry specimens
Specimen b=h (in) w (in) L (in) L/S Failure mode P (kip) τb (psi)T30-1 6 4 12 0.43 Adhesive 3.85 225 T30-2 6 4 12 0.43 Adhesive 5.31 310 T30-3 6 4 16 0.57 Adhesive 4.51 197 T30-4 6 4 16 0.57 Adhesive 5.63 246 T30-5 6 2 8 0.29 Adhesive 1.96 343 T30-6 6 2 8 0.29 Adhesive 2.79 488 T30-7 6 2 6 0.21 adhesive/interfacial 1.98 462 T30-8 6 2 6 0.21 adhesive/interfacial 2.4 560 T22-1 6 4 8 0.40 Adhesive 6.29 393 T22-2 6 4 8 0.40 Adhesive 6.77 423 T22-3 6 4 12 0.60 Adhesive 6.12 255 T22-4 6 4 12 0.60 Adhesive 5.06 211 T22-5 6 2 6 0.30 adhesive/interfacial 3.89 648 T22-6 6 2 6 0.30 interfacial 3.82 637 T22-7 6 2 4 0.20 interfacial (substrate) 2.75 688 T22-8 6 2 4 0.20 interfacial (substrate) 2.80 700 T14-1 4 3 6 0.50 Adhesive 5.37 537 T14-2 4 3 6 0.50 Adhesive 5.19 519 T14-3 4 3 8 0.67 Adhesive 3.02 227 T14-4 4 3 8 0.67 Adhesive 2.73 205 T14-5 4 1 4 0.33 adhesive/interfacial 2.04 918 T14-6 4 1 4 0.33 adhesive/interfacial 2.14 963 T14-7 4 1 2 0.17 interfacial (substrate) N/A N/A T14-8 4 1 2 0.17 interfacial (substrate) 1.55 1395
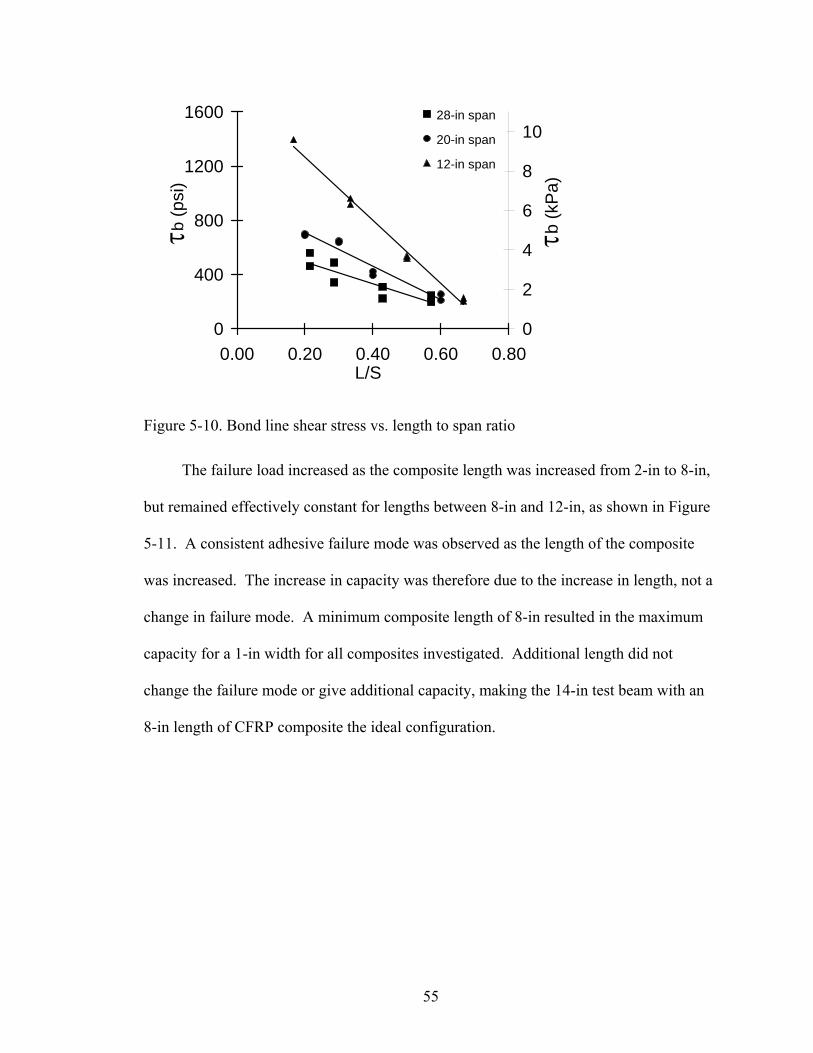
As the CFRP length to span ratio (L/S) was increased, the bond line shear stress
decreased linearly as shown in Figure 5-10. This trend occurred for all span lengths
considered. The bond line shear stress for a particular L/S value decreased with
increasing span lengths until a critical L/S value was reached. For L/S values greater
than 60%, the shear stress remained constant for all span lengths considered. These
results were confirmed by an investigation of composite length with the 14-in long
specimens.
54
0
400
800
1200
1600
0.00 0.20 0.40 0.60 0.80L/S
τb (p
si)
0
2
4
6
8
10
τb (k
Pa)
28-in span
20-in span
12-in span
Figure 5-10. Bond line shear stress vs. length to span ratio
The failure load increased as the composite length was increased from 2-in to 8-in,
but remained effectively constant for lengths between 8-in and 12-in, as shown in Figure
5-11. A consistent adhesive failure mode was observed as the length of the composite
was increased. The increase in capacity was therefore due to the increase in length, not a
change in failure mode. A minimum composite length of 8-in resulted in the maximum
capacity for a 1-in width for all composites investigated. Additional length did not
change the failure mode or give additional capacity, making the 14-in test beam with an
8-in length of CFRP composite the ideal configuration.
55

0
1
2
3
4
0 2 4 6 8 10 12CFRP Composite Length (in)
Failu
re L
oad
(kip
s)
0369121518
0 6 12 18 24 30CFRP Composite Length (cm)
Failu
re L
oad
(kN
)Tack Coat TCab-O-SilSaturant T
Figure 5-11. Failure load vs. composite length for 3 different composites
0
400
800
1200
1600
0 2 4 6 8 10 12CFRP Composite Length (in)
τb (p
si)
0
2
4
6
8
10
0 6 12 18 24 30CFRP Composite Length (cm)
τb (k
Pa)
Tack Coat TCab-O-SilSaturant T
Figure 5-12. Bond line shear stress vs. composite length for 3 different composites
Effect of CFRP Composite Width
The width of the CFRP composite reinforcement influenced the failure capacity
and behavior of the beam specimens. To produce the desired results for this study, two
56

widths CFRP wet lay-up composite and three widths of CFRP laminate were analyzed
with respect to their failure mode, load, and composite shear stress as given in Table 5-3.
Table 5-3. Flexural testing results for composite width comparison
Specimen Composite Adhesive w L Failure mode P (kip)
Pavg (kip)
Τb (psi)
TS-5 A Saturant A 1 8 interfacial 2.98 3.21 671 TS-6 A Saturant A 1 8 interfacial 3.43 772 TS-9 A Saturant A 2 8 flexure-shear 4.13 4.09 465 TS-10 A Saturant A 2 8 flexure-shear 4.51 507 TS-11 A Saturant A 2 8 interfacial 3.88 437 TS-12 A Saturant A 2 8 flexure-shear 3.82 430 TS-21 S Saturant A 1 8 interfacial 1.67 1.91 376 TS-22 S Saturant A 1 8 adhesive/interfacial 1.94 437 TS-23 S Saturant A 1 8 adhesive/interfacial 2.02 455 TS-24 S Saturant A 1 8 adhesive/interfacial 1.99 448 TS-25 S Saturant A 2 8 adhesive/interfacial 3.18 3.21 358 TS-26 S Saturant A 2 8 adhesive/interfacial 2.99 336 TS-27 S Saturant A 2 8 adhesive 3.30 371 TS-28 S Saturant A 2 8 interfacial 3.38 380 TS-33 C Putty C 2 8 flexure-shear 4.99 4.94 570 TS-34 C Putty C 2 8 flexure-shear 4.75 543 TS-35 C Putty C 2 8 flexure-shear 4.70 537 TS-36 C Putty C 2 8 flexure-shear 5.32 608 TB-1 C Putty C 1 8 interfacial 3.85 3.75 866 TB-2 C Putty C 1 8 interfacial 3.64 819 TB-3 C Putty C 1 8 flexure-shear 3.70 3.76 833 TB-4 C Putty C 1 8 flexure-shear 3.81 857 TB-5 C Putty C ¾ 8 adhesive 3.48 3.42 1040TB-6 C Putty C ¾ 8 adhesive 3.37 1010
Increasing widths of CFRP composite were tested to determine the effect on the
specimen failure behavior. As the width of the CFRP composite was increased, the
capacity of the composite and the specimen increased, as shown in Figure 5-13. This
increase in capacity caused a change in failure mode from adhesive to flexure-shear.
57

0
1
2
3
4
5
0 0.5 1 1.5 2CFRP Composite Width (in)
Failu
re L
oad
(kip
s)
0
5
10
15
20
0 1 2 3 4 5CFRP Composite Width (cm)
Failu
re L
oad
(kN
)
Composite AComposite SComposite C
gray - adhesivehollow - adhesive/intblack - flexure-shear
Figure 5-13. Failure load vs. width for different composites
Adhesive failure behavior was observed for small widths of composite as shown
in Figure 5- 14a, because the composite bond strength was less than the interfacial failure
strength of the concrete. As the width of the CFRP was increased, the bond strength of
the composite exceeded the concrete interfacial strength resulting in a transition from
adhesive to interfacial failure (Figure 5- 14b and c). As the width of the composite was
further increased, the flexural strength of the reinforced portion of the beam became
greater than the flexure-shear strength of the concrete. The specimen then failed in
flexure-shear and the CFRP remained fully bonded to the tension face of the concrete, as
shown in Figure 5- 14d.
58

A B
C D
Figure 5- 14. Failure mode progression for increasing CFRP width A) adhesive failure B) adhesive/interfacial failure C) adhesive/interfacial failure D) flexure-shear failure
Results showed that each composite system tested had a maximum width, defined
as the adhesive failure transition width, at which adhesive failure occurred. Figure 5-13
shows the failure modes for each composite as a function of capacity and composite
width. At 3.5 kips, Composite C had an adhesive failure transition width of 0.75-in.
Composite A also had an adhesive failure and a capacity of 3.5 kips, but with a width of
1-in. With a larger 2-in width, Composite S failed adhesively, but did not reach a
capacity of 3.5 kips. Therefore, the adhesive transition width for all composites was
associated with a failure capacity of 3.5-kips for this mix of concrete. Once the width
was increased past this transition point, the concrete capacity controlled and the failure
59

mode changed to interfacial or flexure-shear. The controlling capacity of 3.5-kips is for
the particular concrete used in this study, and will change depending on the strength of
the concrete.
A change in the failure mode from adhesive to flexure-shear caused a decrease in
the bond line shear stress (Figure 5-15). Composite S exhibited adhesive/interfacial
failure for both 1-in and 2-in widths. The bond line shear stress remained constant with
an increase in width because the failure mode remained the same. For composites A and
C, a change in failure mode occurred, causing a decrease in bond line shear stress.
0200400600800
10001200
0 0.5 1 1.5 2CFRP Composite Width (in)
τb (p
si)
0
2
4
6
8
0 1 2 3 4 5CFRP Composite Width (cm)
τb (k
Pa)
Composite AComposite SComposite C
Figure 5-15. Bond line shear stress vs. CFRP composite width for different composites
Effect of Concrete Strength
It is well established that the concrete tensile strength varies with the square root of
f’c. In addition, the interfacial failure mode is likely to be greatly influenced by the
concrete tensile strength. Consequently to force an adhesive failure (or avoid an
interfacial failure), it is necessary to increase the concrete strength of the beam. Flexural
testing of thirty specimens with concrete strengths between 4-ksi and 7-ksi produced
60

failure modes ranging from adhesive to interfacial, as shown in Table 5-4. Nearly all
specimens with a concrete strength of 7-ksi or greater had adhesive failures, while those
with a concrete strength less than 7-ksi had interfacial failures.
Table 5-4. Failure modes for concrete strength comparison
Specimen f'c (ksi) composite adhesive failure mode
P (kip)
Pavg (kip) τb
(psi) T14-13-2 7.00* T Putty C adhesive/interfacial 3.68 552 T14-14-2 7.00 T Putty C adhesive/interfacial 4.41 662 T14-15-2 7.00 T Putty C adhesive/interfacial 3.58 537 T14-16-2 7.00 T Putty C adhesive/interfacial 3.97
3.91
596 T14-17 7.00 T Cab-O-Sil adhesive/interfacial 3.19 479 T14-18 7.00 T Cab-O-Sil adhesive/interfacial 3.16 474 T14-19 7.00 T Cab-O-Sil adhesive/interfacial 3.05 458 T14-20 7.00 T Cab-O-Sil adhesive/interfacial 3.65
3.26
548 T14-21 7.00 T Saturant T adhesive 2.78 417 T14-22 7.00 T Saturant T adhesive 2.63
2.71 592
T14-25 7.00 T Cab-O-Sil interfacial 3.75 844 T14-26 7.00 T Cab-O-Sil adhesive 3.64 819 T14-27 7.00 T Cab-O-Sil adhesive 3.59 808 T14-28 7.00 T Cab-O-Sil adhesive/interfacial 3.55
3.63
799 TS-1 7.00 A Saturant A adhesive 2.92 657 TS-2 7.00 A Saturant A adhesive 3.20 720 TS-3 7.00 A Saturant A adhesive 3.21 722 TS-4 7.00 A Saturant A adhesive 2.64
2.88
594 TS-5 5.32 A Saturant A interfacial 2.98 671 TS-6 5.32 A Saturant A interfacial 3.43
3.21 772
TS-13 5.32 A Saturant S interfacial 2.76 621 TS-14 5.32 A Saturant S interfacial 2.53 569 TS-15 4.74 A Saturant S interfacial 2.64 594 TS-16 4.74 A Saturant S interfacial 2.70
2.66
608 TS-17 5.32 A Putty C interfacial 2.43 547 TS-18 5.32 A Putty C interfacial 2.96 666 TS-19 4.74 A Putty C interfacial 2.54 572 TS-20 4.74 A Putty C adhesive/interfacial 2.85
2.70
641 * Actual strength not measured, but mix design was for concrete strength equal to or greater than 7.00 ksi
As the concrete strength was increased from 5-ksi to 7-ksi, the failure mode of all
specimens changed from interfacial to adhesive or mixed mode. For some specimens, as
61
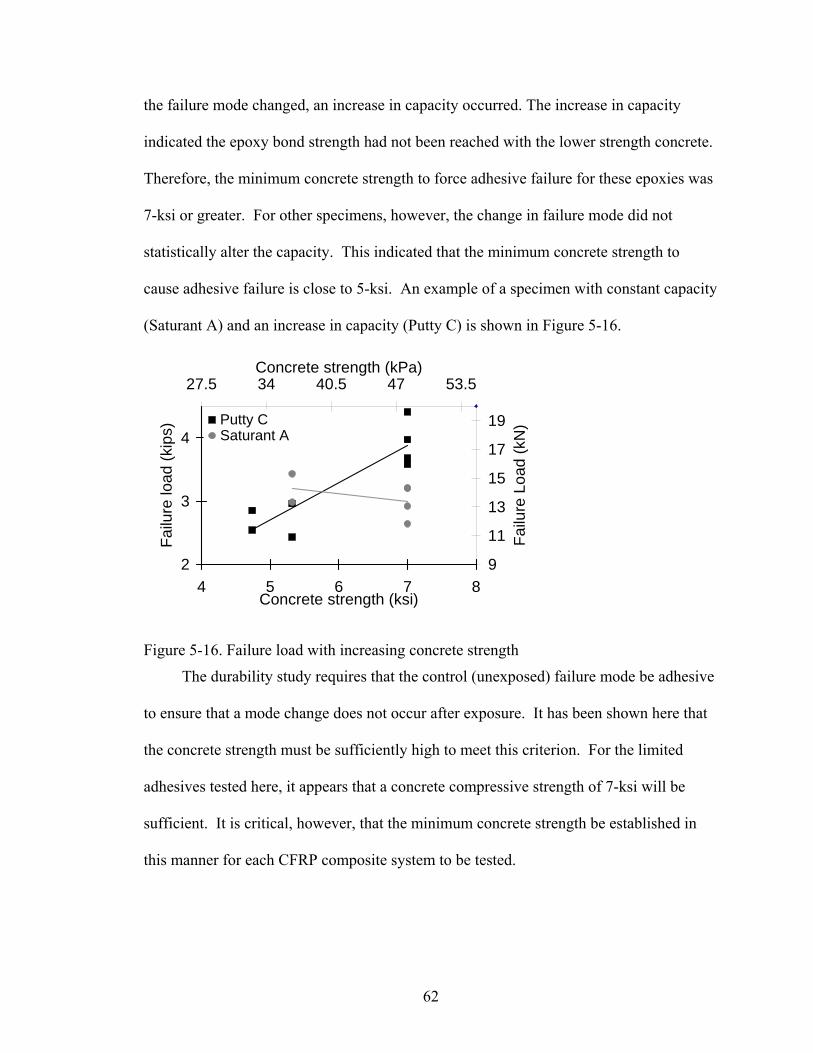
the failure mode changed, an increase in capacity occurred. The increase in capacity
indicated the epoxy bond strength had not been reached with the lower strength concrete.
Therefore, the minimum concrete strength to force adhesive failure for these epoxies was
7-ksi or greater. For other specimens, however, the change in failure mode did not
statistically alter the capacity. This indicated that the minimum concrete strength to
cause adhesive failure is close to 5-ksi. An example of a specimen with constant capacity
(Saturant A) and an increase in capacity (Putty C) is shown in Figure 5-16.
2
3
4
4 5 6 7 8Concrete strength (ksi)
Failu
re lo
ad (k
ips)
9
11
13
15
17
19
27.5 34 40.5 47 53.5Concrete strength (kPa)
Failu
re L
oad
(kN
)Putty CSaturant A
Figure 5-16. Failure load with increasing concrete strength
The durability study requires that the control (unexposed) failure mode be adhesive
to ensure that a mode change does not occur after exposure. It has been shown here that
the concrete strength must be sufficiently high to meet this criterion. For the limited
adhesives tested here, it appears that a concrete compressive strength of 7-ksi will be
sufficient. It is critical, however, that the minimum concrete strength be established in
this manner for each CFRP composite system to be tested.
62

Effect of Composite System
Flexural testing results show the composite type had an effect on the capacity of the
specimen, while the adhesive type had a minimal effect. Changing the adhesive with a
particular composite fiber did not effectively alter the capacity. Changing composite
fibers with a particular adhesive did alter the capacity, as can be seen in Figure 5-17.
0
1
2
3
4
Adhesive
Failu
re L
oad
(kip
s)
024681012141618
Failu
re L
oad
(kN
)
Composite AComposite SComposite C
Saturant A Saturant S Putty C
Figure 5-17. Comparison of failure load for composites with different adhesives
Although interfacial failure was observed for most specimens, the failure load
varied among different composite systems. Interfacial failure occurred when the
interfacial concrete strength was less than the adhesive strength of the composite. The
location of the interfacial crack along the concrete bond line was dependant on the shear
stress developed across the composite concrete bond line. Table 5-6 shows the relation
between failure load and shear stress developed in the CFRP composite. As the shear
stress in the composite was increased, the counteracting shear stress in the concrete was
increased, developing a deeper interfacial region (Figure 5-18).
63
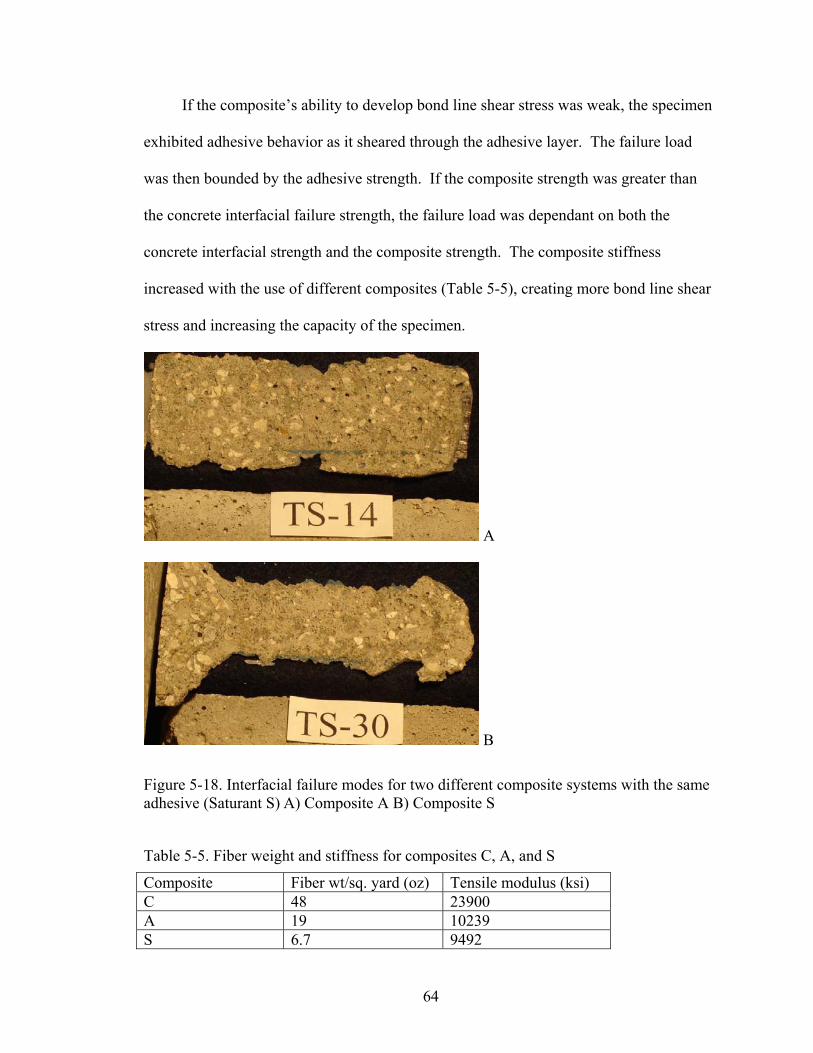
If the composite’s ability to develop bond line shear stress was weak, the specimen
exhibited adhesive behavior as it sheared through the adhesive layer. The failure load
was then bounded by the adhesive strength. If the composite strength was greater than
the concrete interfacial failure strength, the failure load was dependant on both the
concrete interfacial strength and the composite strength. The composite stiffness
increased with the use of different composites (Table 5-5), creating more bond line shear
stress and increasing the capacity of the specimen.
A
B
Figure 5-18. Interfacial failure modes for two different composite systems with the same adhesive (Saturant S) A) Composite A B) Composite S
Table 5-5. Fiber weight and stiffness for composites C, A, and S
Composite Fiber wt/sq. yard (oz) Tensile modulus (ksi) C 48 23900 A 19 10239 S 6.7 9492
64

Table 5-6. Failure mode and load for specimens investigated for composite type
Specimen Composite Adhesive Failure mode P (kip)
Pavg (kip)
tau (ksi)
TS-1 A Saturant A adhesive 2.92 0.66 TS-2 A Saturant A adhesive 3.20 0.72 TS-3 A Saturant A adhesive 3.21 0.72 TS-4 A Saturant A adhesive 2.64 0.59 TS-5 A Saturant A interfacial 2.98 0.67 TS-6 A Saturant A interfacial 3.43
3.06 0.77
TS-13 A Saturant S interfacial 2.76 0.62 TS-14 A Saturant S interfacial 2.53 0.57 TS-15 A Saturant S interfacial 2.64 0.59 TS-16 A Saturant S interfacial 2.70
2.66 0.61
TS-17 A Putty C interfacial 2.43 0.55 TS-18 A Putty C interfacial 2.96 0.67 TS-19 A Putty C interfacial 2.54 0.57 TS-20 A Putty C adhesive/interfacial 2.85
2.70 0.64
TS-21 S Saturant A interfacial 1.67 0.38 TS-22 S Saturant A adhesive/interfacial 1.94 0.44 TS-23 S Saturant A adhesive/interfacial 2.02 0.45 TS-24 S Saturant A adhesive/interfacial 1.99
1.91 0.45
TS-29 S Saturant S interfacial 1.74 0.39 TS-30 S Saturant S interfacial 1.79 0.40 TS-31 S Saturant S interfacial 2.01 0.45 TS-32 S Saturant S interfacial 1.75
1.82 0.39
TB-1 C Putty C interfacial 3.85 0.87 TB-2 C Putty C interfacial 3.64 0.82 TB-3 C Putty C flexure-shear 3.70 0.83 TB-4 C Putty C flexure-shear 3.81
3.75
0.86
Effect of Testing Configuration
The use of both 3 and 4 point load configurations were investigated. Assuming that
the loads are at the third points in the four-point bending, the shear in the 4-point bending
must be 50% greater than that in the 3-point bending for the same applied moment. The
4-point bending configuration has a zero shear where the moment is maximum, which is
desirable. When testing a strengthened beam, however, it was found that the large forces
generated could precipitate a flexure-shear failure at the end of the reinforcement.
65

Three loading configurations were investigated to determine the effect of the
increased shear on the failure mode:
1) Three-point loading
2) Four-point loading with 2-in. between loads
3) Four-point loading with 4-in. between loads
The results of flexural testing, including failure load, CFRP shear stress, and failure mode
as given in Table 5-7 were compared for the different load configurations.
Table 5-7. Flexural testing results for testing procedure study
Specimen Composite w D f'c P avg. P τb
avg τb
st. dev. Failure mode
(in) (in) (ksi) (kip) (kip) (psi) (psi) (ksi) TG-1 7.94 4.18 470 adhesive TG-2 7.94 3.10 349 adhesive TG-3
0 7.94 3.43
3.57 386
402 adhesive
TG-4 7.94 3.38 317 adhesive TG-5
Composite A/Saturant A with glass bar
1
2 7.94 4.26 3.82 399 358
0.06
adhesive/interfacial TR-1 7.94 3.69 415 adhesive/interfacial TR-2 7.94 3.57 402 adhesive TR-3
0 7.94 3.10
3.45 349
389 adhesive
TR-4 7.94 3.53 331 adhesive TR-5
Composite A/Saturant A with steel bar
1
2 7.94 3.83 3.68 359 345
0.04
adhesive TS-5 5.32 2.98 335 interfacial TS-6
0 5.32 3.43
3.21 386
361 interfacial
T4-5 4.85 3.37 316 interfacial T4-6 2 4.85 3.28 3.33 307 312 adhesive/interfacial T4-7 4.74 4.17 313 interfacial T4-8
Composite A/Saturant A
1
4 4.74 3.81 3.99 286 300
0.03
interfacial TS-9 5.32 4.13 232 flexure-shear TS-10 5.32 4.51 254 flexure-shear TS-11 4.85 3.88 218 interfacial TS-12
0
4.85 3.82
4.09
215
230
flexure-shear T4-1 7.00 5.30 248 flexure-shear T4-2 2 7.00 5.93 5.62 278 263 flexure-shear T4-3 7.00 7.36 276 flexure-shear T4-4
Composite A/Saturant A (3-pt), Composite T/Cab-O-Sil (4-pt)
2
4 7.00 5.61 6.49 210 243
0.03
flexure-shear
66

As the distance D was decreased from 4-in to 0-in, the failure mode for like
specimens remained the same. Specimens with 1-in CFRP strips exhibited adhesive or
interfacial failure while specimens with 2-in CFRP strips had flexure-shear failure.
Although the capacity of the 2-in CFRP specimens increased with an increased
distance between load points, the shear stress in the composite remained constant for all
loading conditions. There was a decrease in shear stress for the 1-in CFRP strip
specimens as the load points were separated, but the standard deviation between like
specimens was the same as that between specimens with different loading conditions.
The shear stresses were therefore equal within standard deviation with different loading
conditions.
By changing the loading condition from 4-pt to 3-pt, there was no change in failure
mode or CFRP shear stress for like specimens. An increase in failure capacity was
however observed with an increase in distance D between load points. This increase in
failure capacity produced greater shear at the end of the specimen, creating a potential for
shear failure. The 3-pt loading condition was therefore determined to be the ideal testing
configuration for this study.
Effect of Saw-cut
The inclusion of a half-depth saw-cut for moisture transfer to the bond line did not
result in a change in failure mode for the specimens tested. The concrete compressive
strength was great enough that even when the cross-section was reduced by the inclusion
of the saw-cut, the failure mode remained adhesive. The reduction in concrete cross-
sectional area at the point of maximum moment did however lead to a reduction in
capacity, as shown in Table 5-8. For the NCHRP study, the specimens will be compared
by percent capacity retained, so the reduction in capacity due to the inclusion of a saw-cut
67

is not of concern. It is important, however, that the failure mode remain adhesive
throughout the study. It was proven that the adhesive failure mode can be achieved with
the inclusion of the saw-cut, and it will therefore be used in the durability study to
facilitate moisture to the CFRP composite to concrete bond line.
Table 5-8. Flexural testing results for specimens with and without a saw-cut
Specimen Saw-cut L (in) P (kips) τb(ksi) ffu (ksi) Failure mode T14-21 Yes 12 2.78 0.42 63 adhesive T14-22 Yes 8 2.63 0.59 59 adhesive T14-23 No 12 3.61 0.68 102 adhesive T14-24 No 8 3.38 0.95 95 adhesive
Effect of Added Tensile Reinforcement
Flexural testing of specimens including tensile reinforcement in addition to the
CFRP composite resulted in similar failure behavior to those specimens reinforced solely
with CFRP. The concrete batches used for those specimens with and without additional
reinforcement had varying strengths as shown in
Table 5-9. The failure loads cannot therefore be compared solely on the basis of
added tensile reinforcement. The addition of reinforcement causes an increase in
capacity, but not outside of the standard deviation. Moreover, the specimens with
additional reinforcement had concrete with greater strength than specimens without
additional reinforcement. Therefore, the increase in capacity could be attributed to the
difference in concrete strength.
The internal bars were cut at the center with the inclusion of a saw-cut in the
specimen and the external bars were applied so as to straddle the saw-cut. The additional
reinforcement therefore did not affect the centerline behavior. This supports the result
that capacity was not increased upon addition of reinforcement.
68

Table 5-9. Flexural test results for tensile reinforcement investigation
Specimen f’c Composite Reinforcement P Failure mode T30-2 7.41 Composite T External steel plate 5.31 adhesive T22-4 7.41 Composite T External steel plate 5.06 adhesive T30-1 7.41 Composite T None 3.85 adhesive T22-3 7.41 Composite T None 6.12 adhesive TG-1 7.94 Composite A internal glass bar 4.18 adhesive TG-2 7.94 Composite A internal glass bar 3.10 adhesive TG-3 7.94 Composite A internal glass bar 3.43 adhesive TR-1 7.94 Composite A internal steel bar 3.69 adhesive/interfacialTR-2 7.94 Composite A internal steel bar 3.57 adhesive TR-3 7.94 Composite A internal steel bar 3.10 adhesive TA-1 7.08 Composite A None 2.93 adhesive TA-2 7.08 Composite A None 3.29 adhesive TG-4 7.94 Composite A internal glass bar 3.38 adhesive TG-5 7.94 Composite A internal glass bar 4.26 adhesive/interfacialTR-4 7.94 Composite A internal steel bar 3.53 adhesive TR-5 7.94 Composite A internal steel bar 3.83 adhesive T4-5 7.00 Composite A None 3.37 interfacial T4-6 7.00 Composite A None 3.28 adhesive/interfacialTG-6 7.94 Composite C internal glass bar 3.81 adhesive/interfacialTR-6 7.94 Composite C internal steel bar 4.00 adhesive/interfacialTB-5 7.08 Composite C None 3.48 adhesive TB-6 7.08 Composite C None 3.37 adhesive/interfacial
Specimens TG-4, TG-5, TR-4, TR-5, T4-5, and T4-6 were tested in four-point
flexure and the load was therefore applied where the internal bars were continuous. The
specimens failed at mid-span where the reinforcement bars were absent and exhibited
adhesive/interfacial failure as shown in Figure 5-19. The load capacity also remained the
same as specimens without additional reinforcement. The specimen configuration did not
allow the additional reinforcement to engage, and they showed no signs of being stressed.
The inclusion of additional reinforcement was therefore unnecessary as it did not increase
capacity or change the failure behavior of the specimens tested.
69
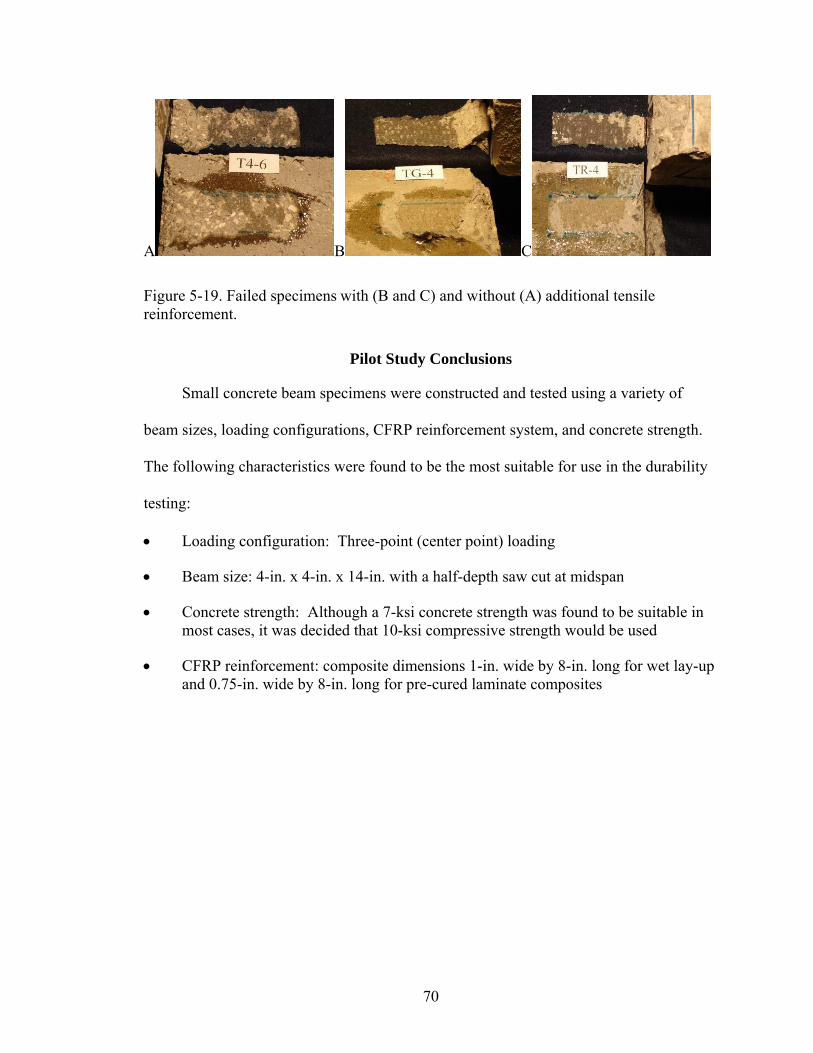
A B C
Figure 5-19. Failed specimens with (B and C) and without (A) additional tensile reinforcement.
Pilot Study Conclusions
Small concrete beam specimens were constructed and tested using a variety of
beam sizes, loading configurations, CFRP reinforcement system, and concrete strength.
The following characteristics were found to be the most suitable for use in the durability
testing:
• Loading configuration: Three-point (center point) loading
• Beam size: 4-in. x 4-in. x 14-in. with a half-depth saw cut at midspan
• Concrete strength: Although a 7-ksi concrete strength was found to be suitable in most cases, it was decided that 10-ksi compressive strength would be used
• CFRP reinforcement: composite dimensions 1-in. wide by 8-in. long for wet lay-up and 0.75-in. wide by 8-in. long for pre-cured laminate composites
70
CHAPTER 6 ENVIRONMENTAL EXPOSURE SYSTEM: DESIGN AND CONSTRUCTION
This chapter describes the design, construction, and development of the
environmental exposure system. A standard testing procedure based on the results from
the pilot study was also developed. A total of 450 beams were made as detailed in the
specimen matrix shown in Table 6-1.
Specimen Nomenclature
The following nomenclature was developed for use in identifying the variables
during the experimental work and during analysis and reporting of the results. The
naming system includes the exposure period, exposure condition, composite
manufacturer, and replicate number. Each specimen name consists of letters and
numbers, corresponding to an exposure period, exposure environment, composite
manufacturer, and replicate number. Each name consists of six digits, with the order of
the naming system as follows:
Exposure condition, Exposure time, Composite Manufacturer-Replicate Number
For resin samples, another letter representing the type of resin (saturant, primer, putty,
top coat) is used following the composite manufacturer designation. The naming for the
resin samples is as follows:
Exposure condition, Exposure time, Composite Manufacturer, Resin Type-
Replicate Number
71

Table 6-1. Specimen Matrix for University of Florida NCHRP project 12-73Condition Solution Temperature Time # Specimens Per Composite Total Total per
exposure °C months A B C D E MOR Control N/A N/A 6,12,24,60,120 15 15 15 9 9 15 78 78 Thermal & Chloride
Chloride Water
50 12 3 3 3 0 0 3 12 12
Thermal & Alkali Alkali Water 50 12 3 3 3 0 0 3 12 12 6 4 4 4 0 0 0 12 12 4 4 4 0 0 3 15
Sustained Load Water 50
24 4 4 4 0 0 0 12
39
UV/Wet/Dry Water/UV drying
50 12 3 3 3 0 0 3 12 12
24 3 3 3 0 0 0 9 60 3 3 3 0 0 3 12
Real Time Outdoors N/A
120 3 3 3 0 0 0 9
30
6 0 0 3 3 3 3 12 12 0 0 3 3 3 3 12 24 3 3 3 3 3 3 18
30
60 0 0 3 0 0 3 6
48
6 0 0 3 3 3 0 9 12 0 0 3 3 3 0 9 24 3 3 3 3 3 0 15
40
60 0 0 3 0 0 0 3
36
6 0 0 3 3 3 0 9 12 0 0 3 3 3 0 9 24 3 3 3 3 3 0 15
50
60 0 0 3 0 0 0 3
36
6 0 0 3 3 3 3 12 12 0 0 3 3 3 3 12 24 3 3 3 3 3 3 18
Arrhenius Water
60
60 0 0 3 0 0 3
48
6
72
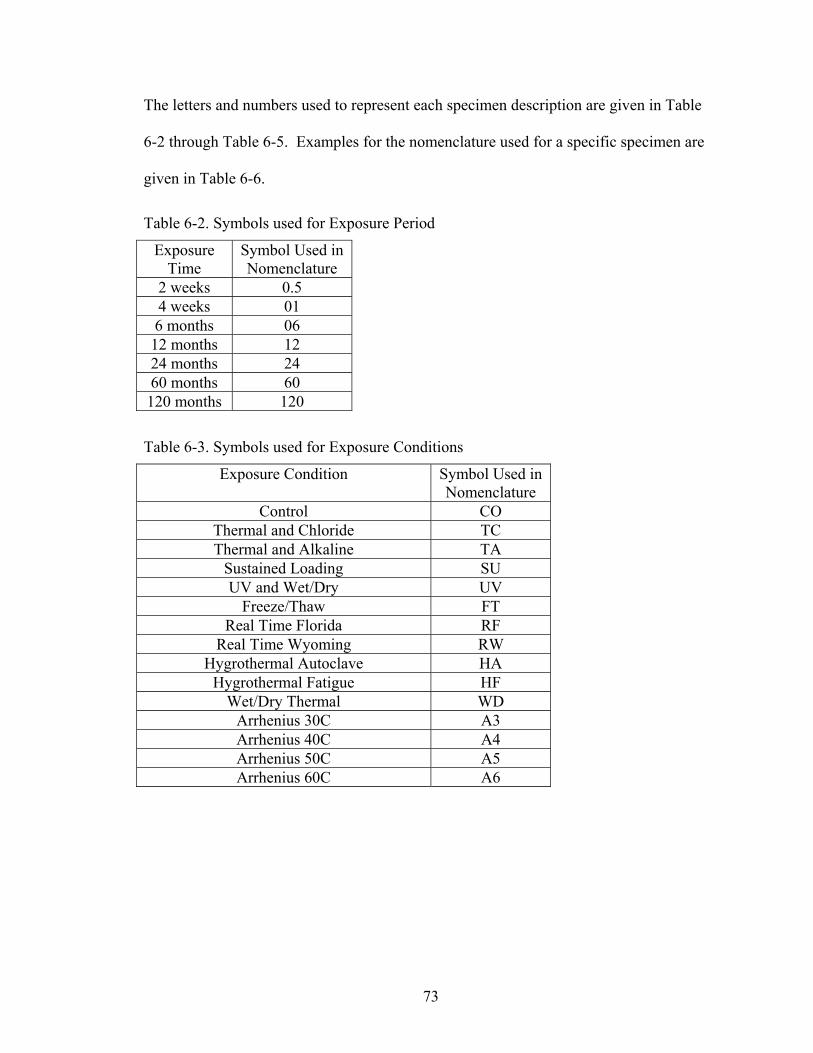
The letters and numbers used to represent each specimen description are given in Table
6-2 through Table 6-5. Examples for the nomenclature used for a specific specimen are
given in Table 6-6.
Table 6-2. Symbols used for Exposure Period
Exposure Time
Symbol Used in Nomenclature
2 weeks 0.5 4 weeks 01 6 months 06 12 months 12 24 months 24 60 months 60 120 months 120
Table 6-3. Symbols used for Exposure Conditions
Exposure Condition Symbol Used in Nomenclature
Control CO Thermal and Chloride TC Thermal and Alkaline TA
Sustained Loading SU UV and Wet/Dry UV
Freeze/Thaw FT Real Time Florida RF
Real Time Wyoming RW Hygrothermal Autoclave HA
Hygrothermal Fatigue HF Wet/Dry Thermal WD
Arrhenius 30C A3 Arrhenius 40C A4 Arrhenius 50C A5 Arrhenius 60C A6
73

Table 6-4. Symbol used for Manufacturer/Composite System
Manufacturer/Composite System Symbol used in Nomenclature
Manufacturer A A Manufacturer B B Manufacturer C C Manufacturer D D Manufacturer E E Manufacturer F F
Table 6-5. Symbol used for Resin Type
Specimen Type Symbol used in Nomenclature
Epoxy Resin (Primer) R Epoxy Resin (Putty) P
Epoxy Resin (Saturant) S Epoxy Resin (Top Coat) T
Table 6-6. Example Specimen Nomenclature for Resin Samples
Exposure time
Exposure Condition
Composite System
Resin Type
Replicate Nomenclature
12 months Freeze Thaw Manufacturer B Primer 2 FT12BR-2 12 months Real Time Fl Manufacturer C Putty 1 RF12CP-1 60 months Arrhenius 50C Manufacturer D Saturant 3 A560DS-3
Concrete Construction and Testing
The 450 beams to be used for the NCHRP study were constructed in six batches of
75 beams each at the FDOT SMO in Gainesville, Fl. Twenty-eight day testing was
performed on concrete cylinders and beams. The details of the concrete construction and
testing are given in the subsequent sections.
Construction procedure
The six batches of concrete were designed to have a target concrete 28-day
compressive strength of 10000-psi to promote adhesive failure behavior. The mix had a
water/cement ratio of 0.35 (lbs/lbs) and a ratio of cement/fine aggregate/coarse aggregate
74
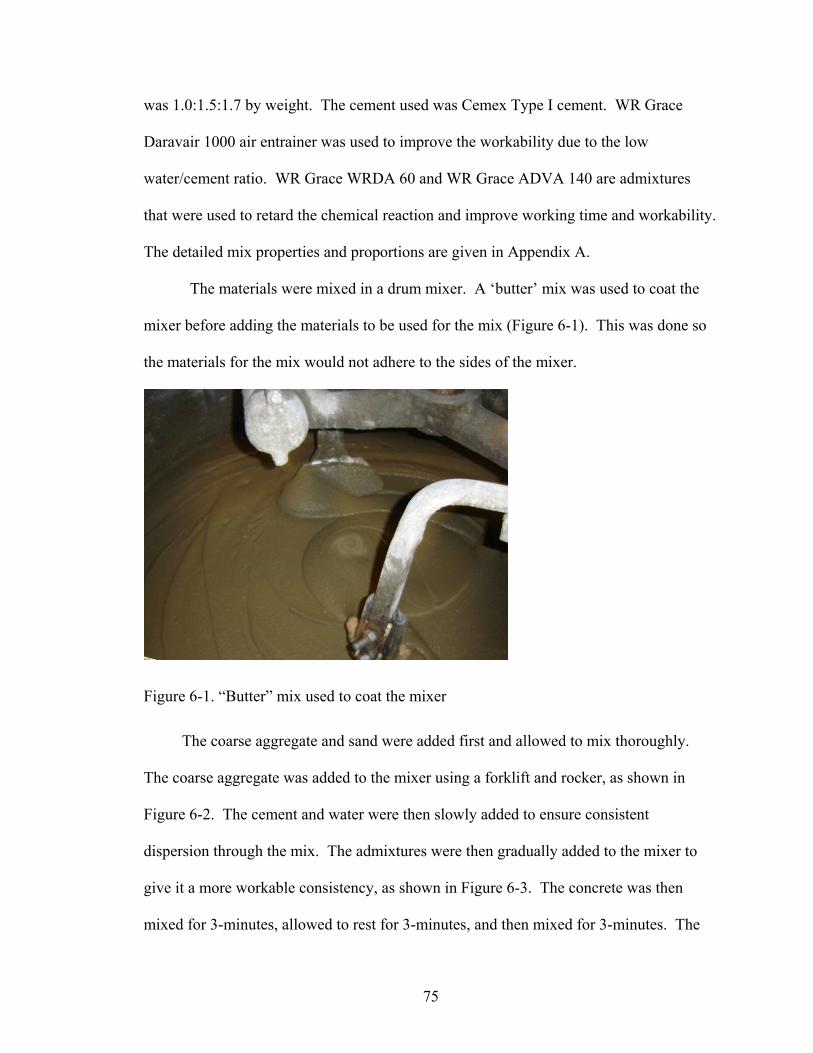
was 1.0:1.5:1.7 by weight. The cement used was Cemex Type I cement. WR Grace
Daravair 1000 air entrainer was used to improve the workability due to the low
water/cement ratio. WR Grace WRDA 60 and WR Grace ADVA 140 are admixtures
that were used to retard the chemical reaction and improve working time and workability.
The detailed mix properties and proportions are given in Appendix A.
The materials were mixed in a drum mixer. A ‘butter’ mix was used to coat the
mixer before adding the materials to be used for the mix (Figure 6-1). This was done so
the materials for the mix would not adhere to the sides of the mixer.
Figure 6-1. “Butter” mix used to coat the mixer
The coarse aggregate and sand were added first and allowed to mix thoroughly.
The coarse aggregate was added to the mixer using a forklift and rocker, as shown in
Figure 6-2. The cement and water were then slowly added to ensure consistent
dispersion through the mix. The admixtures were then gradually added to the mixer to
give it a more workable consistency, as shown in Figure 6-3. The concrete was then
mixed for 3-minutes, allowed to rest for 3-minutes, and then mixed for 3-minutes. The
75

slump of the concrete was then measured to ensure the correct consistency was reached.
The slump of the concrete batches ranged from 3-in to 3.75-in (Figure 6-4).
Figure 6-2. Addition of coarse aggregate to mixer
Figure 6-3. Addition of admixtures to the mixer
76

Figure 6-4. Slump measurement
Fifteen steel forms that held five beams each were used for construction. The
forms were machined to give exact 4-in x 4-in x 14-in dimensions and had smooth form
edges that were free of defects to give smooth concrete surfaces. The form surfaces were
lightly oiled to retard corrosion and aid in de-molding the concrete.
The steel forms were placed 2 at a time on a vibrating table and were half filled
with concrete as shown in Figure 6-5a-b. The vibrating table was then turned on for
approximately 90-seconds to remove excess air and ensure proper gradation (Figure 6-
5c). The forms were then filled completely with concrete and continued to vibrate for
90-seconds. The surfaces of the concrete beams were then finished until smooth and
level using a concrete float (Figure 6-5d).
77

A B
C D
Figure 6-5. Casting concrete beams. A) steel forms B) first lift of concrete in forms C) consolidation of concrete with vibrating table D) finished concrete in the forms.
Concrete cylinders were also constructed in the same manner. Four-inch diameter
by eight-inch tall cylinder forms were filled in two lifts. The forms were filled halfway,
and agitated on a vibrating table for 90-seconds. The forms were then filled completely
and vibrated again for 90-seconds. The excess concrete was struck from the top of the
forms. The top of the cylinder was then smoothed with a trowel.
The finished concrete beams and cylinders were covered with plastic to ensure
moisture retention. Twenty-four hours after construction, the beams and cylinders were
de-molded as shown in Figure 6-6. Once the beams and cylinders were de-molded, they
were transferred to a pallet and placed in the moist cure room at the FDOT SMO. The
concrete samples remained in the moist cure room for 28-days until cured.
78
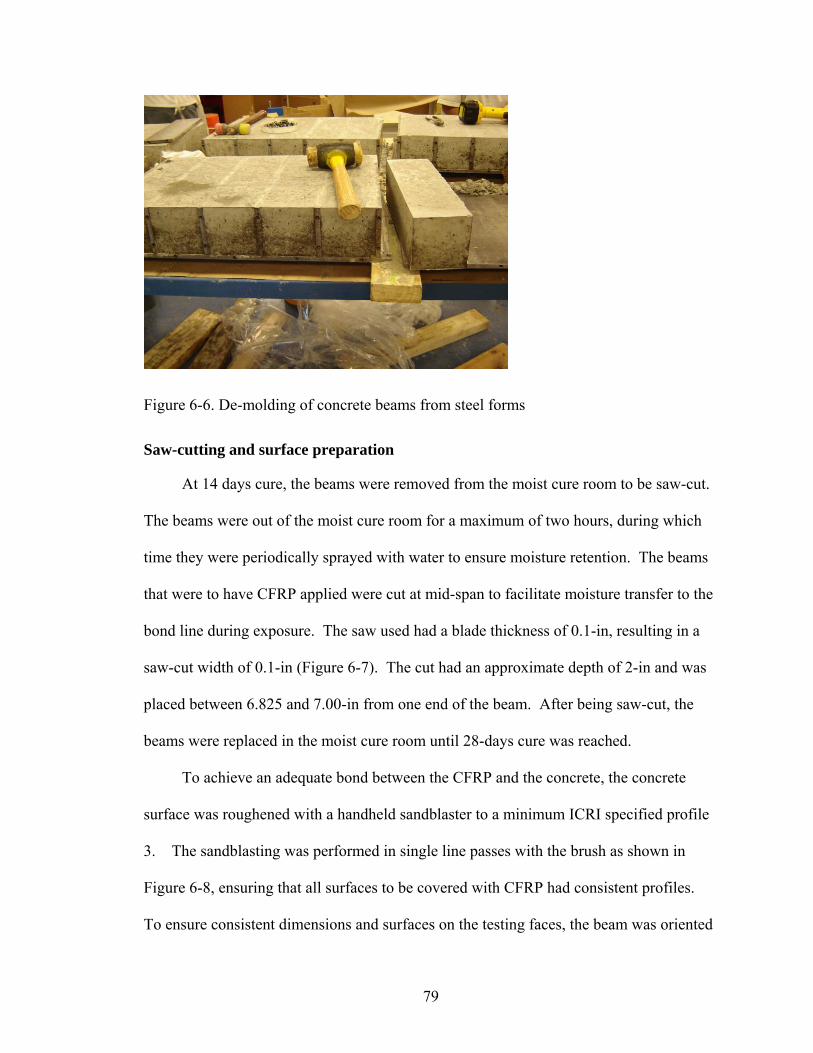
Figure 6-6. De-molding of concrete beams from steel forms
Saw-cutting and surface preparation
At 14 days cure, the beams were removed from the moist cure room to be saw-cut.
The beams were out of the moist cure room for a maximum of two hours, during which
time they were periodically sprayed with water to ensure moisture retention. The beams
that were to have CFRP applied were cut at mid-span to facilitate moisture transfer to the
bond line during exposure. The saw used had a blade thickness of 0.1-in, resulting in a
saw-cut width of 0.1-in (Figure 6-7). The cut had an approximate depth of 2-in and was
placed between 6.825 and 7.00-in from one end of the beam. After being saw-cut, the
beams were replaced in the moist cure room until 28-days cure was reached.
To achieve an adequate bond between the CFRP and the concrete, the concrete
surface was roughened with a handheld sandblaster to a minimum ICRI specified profile
3. The sandblasting was performed in single line passes with the brush as shown in
Figure 6-8, ensuring that all surfaces to be covered with CFRP had consistent profiles.
To ensure consistent dimensions and surfaces on the testing faces, the beam was oriented
79
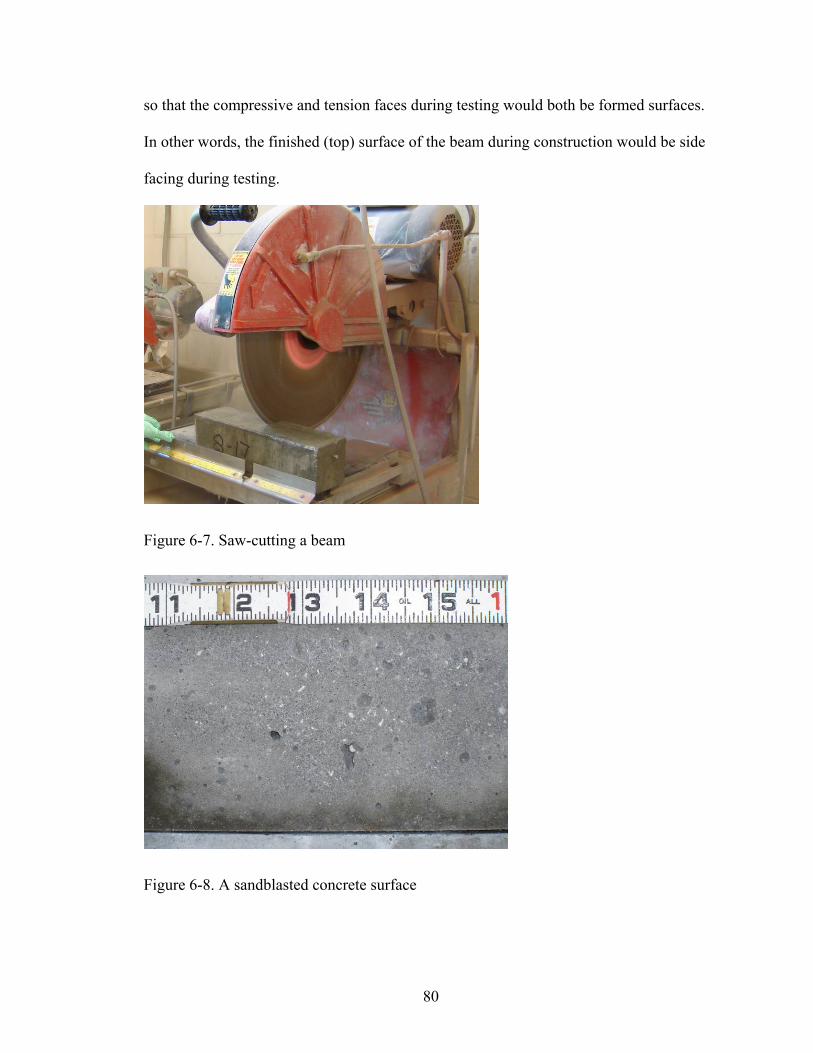
so that the compressive and tension faces during testing would both be formed surfaces.
In other words, the finished (top) surface of the beam during construction would be side
facing during testing.
Figure 6-7. Saw-cutting a beam
Figure 6-8. A sandblasted concrete surface
80
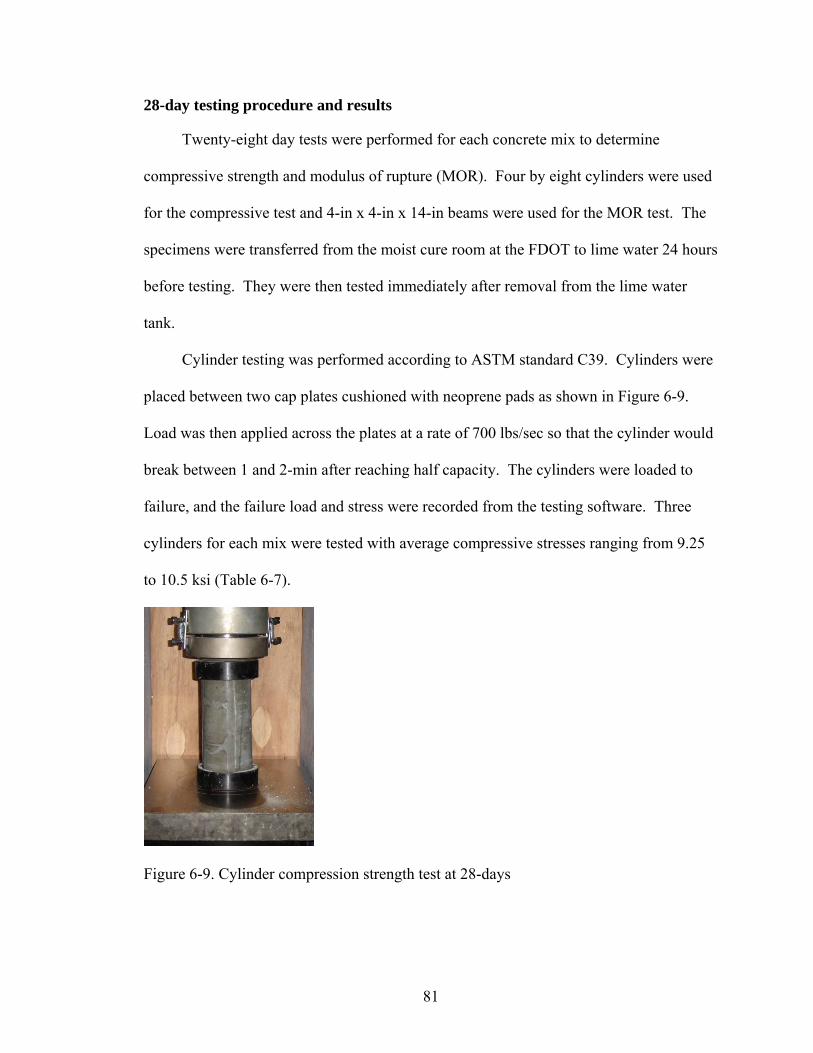
28-day testing procedure and results
Twenty-eight day tests were performed for each concrete mix to determine
compressive strength and modulus of rupture (MOR). Four by eight cylinders were used
for the compressive test and 4-in x 4-in x 14-in beams were used for the MOR test. The
specimens were transferred from the moist cure room at the FDOT to lime water 24 hours
before testing. They were then tested immediately after removal from the lime water
tank.
Cylinder testing was performed according to ASTM standard C39. Cylinders were
placed between two cap plates cushioned with neoprene pads as shown in Figure 6-9.
Load was then applied across the plates at a rate of 700 lbs/sec so that the cylinder would
break between 1 and 2-min after reaching half capacity. The cylinders were loaded to
failure, and the failure load and stress were recorded from the testing software. Three
cylinders for each mix were tested with average compressive stresses ranging from 9.25
to 10.5 ksi (Table 6-7).
Figure 6-9. Cylinder compression strength test at 28-days
81

Table 6-7. 28-day compressive strength resultsMix Cylinder Failure load (lbs) f’c (ksi) Avg. f’c (ksi)
1 117770 9.371 2 132330 10.531
1
3 121550 9.673
9.86
1 127050 10.111 2 130220 10.363
2
3 112640 8.964
9.81
1 110300 8.777 2 122620 9.758
3
3 116100 9.239
9.26
1 123230 9.806 2 121480 9.667
4
3 110750 8.813
9.43
1 131580 10.471 2 132190 10.519
5
3 129410 10.298
10.43
1 120390 9.580 2 129740 10.324
6
3 122860
9.89
9.777
The modulus of rupture test was performed in accordance to ASTM standard C78-
02. Loading was applied at the third points with an Instron testing machine as shown in
Figure 6-10. The bottom supports were placed 1-in from the edges of the beam. The
load frame was designed for the specimen size and accordance with the ASTM standard.
Figure 6-10. Modulus of rupture flexural strength test at 28-days
82

The load was applied at a constant displacement rate of 0.01-in/min until failure
occurred. The failure load recorded by the testing machine and the measured cross-
ensions were then used to determine the MOR (fr) with Equation 6-1. sectional dim
Equation 6-1
P is the failure load, S is the span between bottom supports, b is the cross-sectional width,
s
(psi) Avg. fr (psi)
2hbSPfr ⋅⋅
=
and h is the cross-sectional depth. The average MOR for the concrete mixes ranged from
1034-psi to 1095-psi (Table 6-8).
Table 6-8. 28-day MOR test result
Mix Beam Failure load (lbs) fr1 5699 1060 2 5465 1014
1
3 5513
1034
1028 1 5510 1033 2 5628 1055
2 1058
3 5793 1086 1 6103 1135 2 5751 1070
3 1091
3 5741 1068 1 5875 1101 2 5442 1018
4 1053
3 5552 1041 1 6010 1124 2 5966 1118
5 1095
3 5622 1043 1 5219 979 2 5506 1032
6 988
3 9894 954
mposite Pro es and Application Procedures
Four unidire on laminate
system ete
Co perti
ctional carbon fiber weaves and one unidirectional carb
were used to construct the specimens. Before composite application, the concr
surface was cleaned of any debris and grease. Lines were drawn on the concrete surface
centered on the saw-cut, where the composite would be applied. The properties of each
83
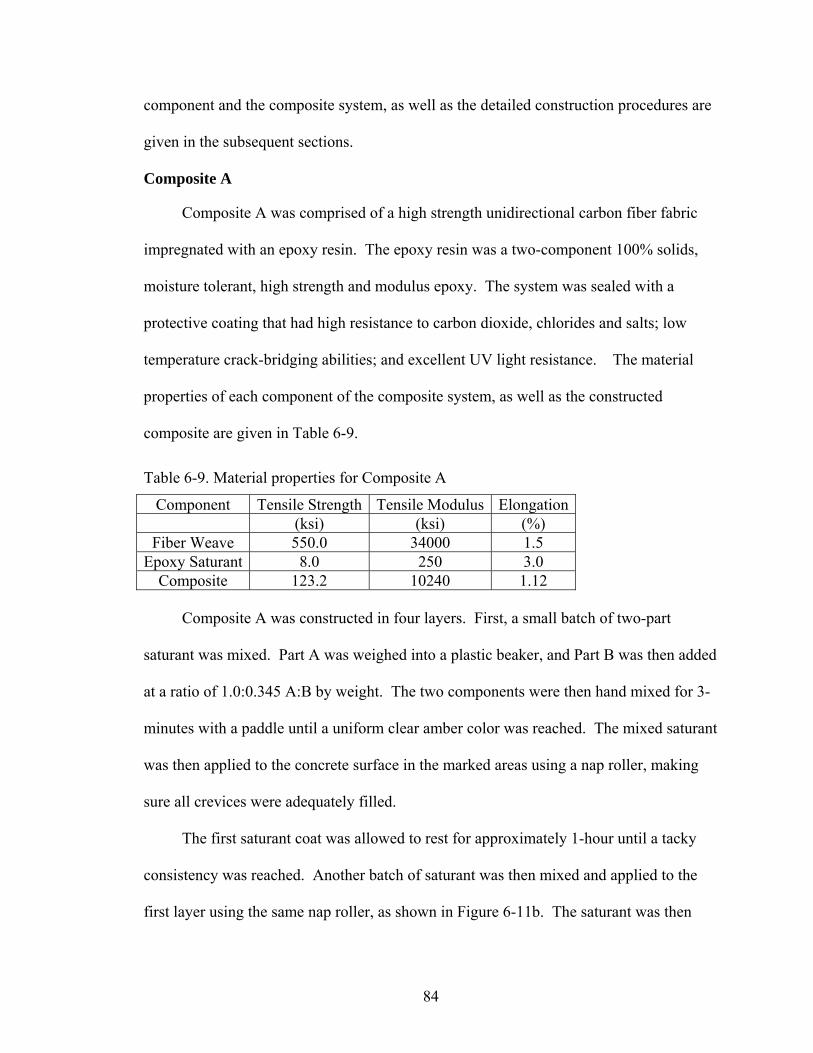
component and the composite system, as well as the detailed construction procedures are
given in the subsequent sections.
Composite A
te A was comprised of a high strength unidirectional carbon fiber fabric
impre
omposite A
dulus Elongation
Composi
gnated with an epoxy resin. The epoxy resin was a two-component 100% solids,
moisture tolerant, high strength and modulus epoxy. The system was sealed with a
protective coating that had high resistance to carbon dioxide, chlorides and salts; low
temperature crack-bridging abilities; and excellent UV light resistance. The material
properties of each component of the composite system, as well as the constructed
composite are given in Table 6-9.
Table 6-9. Material properties for C
Component Tensile Strength Tensile Mo (ksi) (ksi) (%)
Fiber Weave 550.0 34000 1.5 Epoxy Saturant 8.0 250 3.0
Composite 123.2 10240 1.12
Composite A wa ucted in fo . First, a batch of two-part
satura added
t
to rest for approximately 1-hour until a tacky
consi
s constr ur layers small
nt was mixed. Part A was weighed into a plastic beaker, and Part B was then
at a ratio of 1.0:0.345 A:B by weight. The two components were then hand mixed for 3-
minutes with a paddle until a uniform clear amber color was reached. The mixed saturan
was then applied to the concrete surface in the marked areas using a nap roller, making
sure all crevices were adequately filled.
The first saturant coat was allowed
stency was reached. Another batch of saturant was then mixed and applied to the
first layer using the same nap roller, as shown in Figure 6-11b. The saturant was then
84
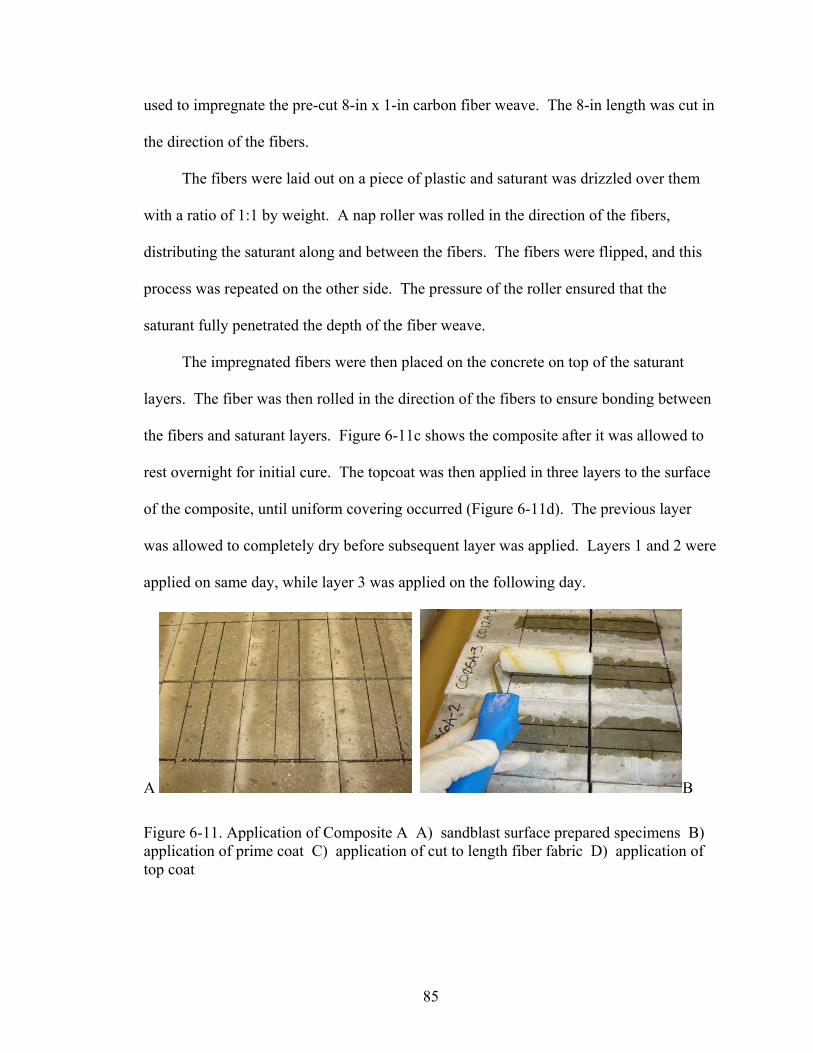
used to impregnate the pre-cut 8-in x 1-in carbon fiber weave. The 8-in length was cut in
the direction of the fibers.
The fibers were laid out on a piece of plastic and saturant was drizzled over them
with a ratio of 1:1 by weight. A nap roller was rolled in the direction of the fibers,
distributing the saturant along and between the fibers. The fibers were flipped, and this
process was repeated on the other side. The pressure of the roller ensured that the
saturant fully penetrated the depth of the fiber weave.
The impregnated fibers were then placed on the concrete on top of the saturant
layers. The fiber was then rolled in the direction of the fibers to ensure bonding between
the fibers and saturant layers. Figure 6-11c shows the composite after it was allowed to
rest overnight for initial cure. The topcoat was then applied in three layers to the surface
of the composite, until uniform covering occurred (Figure 6-11d). The previous layer
was allowed to completely dry before subsequent layer was applied. Layers 1 and 2 were
applied on same day, while layer 3 was applied on the following day.
A B
Figure 6-11. Application of Composite A A) sandblast surface prepared specimens B) application of prime coat C) application of cut to length fiber fabric D) application of top coat
85

C D
Figure 6-11. Continued.
Composite B
Composite B consisted of epoxy primer, epoxy putty, epoxy saturant, fiber weave,
and protective top coat. The fiber weave was unidirectional carbon fiber with high
strength and stiffness, lightweight, highly durable, and non-corrosive. The primer was a
low viscosity, 100% solids, polyamine cured epoxy. The putty was a 100% solids non-
sag paste used to level small surface defects and provided a smooth surface to apply the
composite system. The saturant was a 100% solids, low viscosity epoxy material used to
encapsulate the fiber fabric. The top coat was a coating used to protect against UV
radiation and mild abrasion. Table 6-10 gives the material properties for the components
of Composite B.
Table 6-10. Material properties for Composite B
Component Tensile Strength Tensile Modulus Elongation Tg CTE ksi ksi % °C 10-6/°C
Fiber Weave 550.0 33000 1.67 - -.38 Epoxy Primer 2.5 105 2.0 77 35 Epoxy Putty 2.2 260 1.5 75 35
Epoxy Saturant 8.0 440 2.5 71 35
The five components of Composite B were applied in a layered fashion. The
primer, putty, and saturant were 2-part epoxies made by hand mixing appropriate
86

amounts of parts A and B in a plastic beaker for 3 minutes until a uniform color and
viscosity were reached. The proportions of A to B by weight for each component are as
follows: primer 1.0:0.30, putty 1.0:0.30, saturant 1.0:0.34.
First, the primer was applied to the surface with a nap roller to fill all crevices,
Figure 6- 12a. The primer was allowed to set for approximately one hour on the concrete
surface until a tacky consistency was reached. The putty was then applied over the prime
coat with a spatula, as shown in Figure 6- 12b, to smooth the surface and fill any
remaining voids.
The prepared saturant was then rolled onto the fiber strips in the direction of the
fibers to squeeze the saturant between the roving of fabric. The saturation was performed
on both sides of the fiber strip so that the entire fabric was coated. The saturated fibers
were then placed on the putty and a nap roller was used to promote adhesion as shown in
Figure 6- 12c. The composite was allowed to dry overnight and then two layers of
topcoat were applied to a uniform consistency with a brush (Figure 6- 12d). The first
layer was allowed to completely dry before application of the second layer.
A B
Figure 6- 12. Application of Composite B. A) application of prime coat with a nap roller B) application of putty with spatula C) application of saturated fiber fabric with roller D) application of top coat with brush
87

C D
Figure 6-12. Continued
Composite C
Composite C consisted of a pre-cured laminate and epoxy putty. The laminate was
a unidirectional pultruded carbon reinforced polymer laminate. The putty used was a
100% solids, moisture tolerant, high modulus and strength structural epoxy paste
adhesive that conformed to the current ASTM C-881 and AASHTO M-235
specifications. Table 6-11 lists material properties for both components of composite C.
Table 6-11. Material properties for Composite C
Component Tensile Strength Tensile Modulus Elongation (ksi) (ksi) (%)
Fiber Laminate 406.0 23900 1.69 Epoxy Putty 3.6 650 1.0
The laminate came as a 40-foot long piece 1.97-in wide. It was cut to 8-in by 1-in
strips using a razor, with the 8-in dimension was along the direction of the fibers. The
cutting was done so not to cause cracking or splitting in the laminate. The surface of the
laminate was then cleaned of any debris and grease before bonding.
Each part of the putty was mixed separately for three minutes before batching. Part
A was weighed into a plastic beaker, and part B was then added as 30% by weight. The
epoxy paste was then mixed for a minimum of three minutes until a uniform thick gray
88

color was obtained. The putty had a short working time, so the construction of the
specimens was done with four batches of putty, with each batch making between 20 and
30 specimens.
The putty was first smoothed with a uniform thickness onto the concrete substrate
using a spatula, sufficiently filling all voids as shown in Figure 6-13a. The putty was
then applied in a uniform thickness to the laminate using a spatula, Figure 6-13b. The
side of the laminate not labeled ‘do not bond’ was covered by applying the paste in the
direction of the fibers. The laminate was then placed on the concrete, putty side down as
shown in Figure 6-13c. Pressure was applied to the surface of the laminate to allow
adhesion between the puttied substrates. Excess putty squeezed from the sides of the
laminate and was removed with the spatula (Figure 6-13d).
A B
Figure 6-13. Construction of Composite C A) application of putty to concrete surface B) application of putty to laminate C) placing of laminate on concrete (putty to putty) D) completed construction of composite C
89
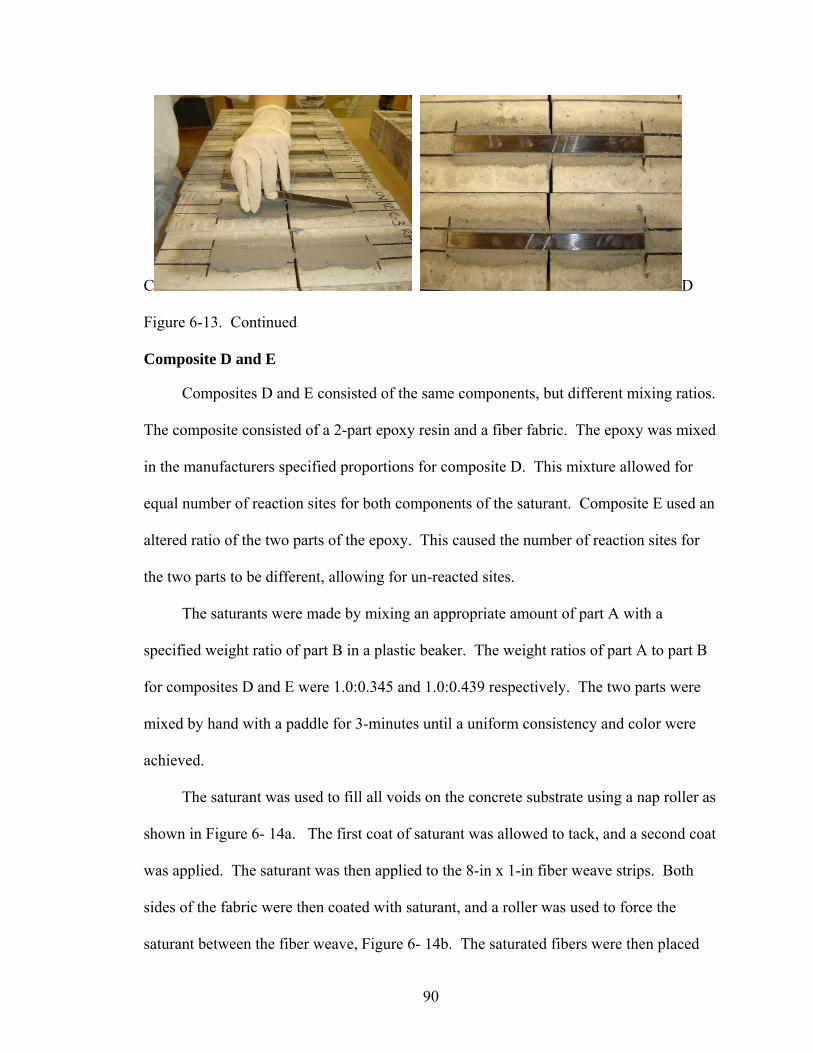
C D
Figure 6-13. Continued
Composite D and E
Composites D and E consisted of the same components, but different mixing ratios.
The composite consisted of a 2-part epoxy resin and a fiber fabric. The epoxy was mixed
in the manufacturers specified proportions for composite D. This mixture allowed for
equal number of reaction sites for both components of the saturant. Composite E used an
altered ratio of the two parts of the epoxy. This caused the number of reaction sites for
the two parts to be different, allowing for un-reacted sites.
The saturants were made by mixing an appropriate amount of part A with a
specified weight ratio of part B in a plastic beaker. The weight ratios of part A to part B
for composites D and E were 1.0:0.345 and 1.0:0.439 respectively. The two parts were
mixed by hand with a paddle for 3-minutes until a uniform consistency and color were
achieved.
The saturant was used to fill all voids on the concrete substrate using a nap roller as
shown in Figure 6- 14a. The first coat of saturant was allowed to tack, and a second coat
was applied. The saturant was then applied to the 8-in x 1-in fiber weave strips. Both
sides of the fabric were then coated with saturant, and a roller was used to force the
saturant between the fiber weave, Figure 6- 14b. The saturated fibers were then placed
90

on the saturant covered concrete surface and the roller was used to ensure adhesion to the
concrete as shown in Figure 6- 14c.
A B
C D
Figure 6- 14. Application of Composites D and E. A) application of prime coat to concrete surface using nap roller B) saturation of fiber fabric C) placing of saturated fabric on concrete surface D) completed construction of composites D and E
Other specimens
Epoxy samples were made at the time of composite construction for analysis during
exposure. Samples were made by pouring each two-part epoxy used during the
composite construction process into rubber stoppers. One sample was made for every
temperature and time period of the Arrhenius exposure.
Composite sheets consisting of the fiber and impregnating resin used for composite
construction were also constructed. The composite sheets were made for the wet lay-up
91

composites (Composites A, B, D, and E). A sheet was made for each temperature in the
Arrhenius exposure (30°C, 40°C, 50°C, 60°C).
Exposure Tank Set-up
The environments constructed were alkali solution, chloride solution, sustained
loading, real time exposure, UV exposure, and Arrhenius correlation heated water bath
exposure. The environments, with exception to the real time exposure, were established
in cooler systems located at the Coastal Engineering Laboratory at the University of
Florida.
Description of Exposure Systems
Salt and high pH solutions have been reported to decrease durability of CFRP
composite bonded concrete. The effect of these solutions was investigated by exposing
12 specimens to each for 12 months. The solutions were held at 50°C.
The salt solution was created by adding water softening salts to water. The water
softening salt was pure NaCl crystals (Figure 6-15) and was added at 5% the water
weight.
A B
Figure 6-15. Salt used for Chloride Solution. A) Product description B) close-up of salt granules
92

Calcium Hydroxide powder was added to water to create an alkali solution (Figure 6-16).
The calcium hydroxide was dissolved into the water until a pH of 11.5 was reached. The
pH was maintained throughout the exposure period.
Figure 6-16. Calcium Hydroxide used for Alkali Solution
Sustained load combined with hygrothermal exposure was investigated by
immersing loaded specimens in 50°C water. The sustained load frames were constructed
so as to apply a constant load at 50% of the ultimate capacity of the specimen. The
frames consisted of two specimens joined by all-thread bars supporting the load of a
compressed spring, as shown in Figure 6-17.
Figure 6-17. Schematic of sustained load frame
93
To create the sustained load frames, holes were drilled in each specimen from the
tension face to the compression face approximately 1.5 inches from the edge. All-thread
bars were then inserted into the holes so that two specimens were joined at the
compression face, the composite facing outwards. A pivot was placed on the
compressive faces between the two specimens at mid-span to act as a third-point load.
Washers and bolts on the tension face connected the beams to the all-thread. A spring
was placed between the washers and concrete surface on one end of a concrete beam and
compressed using torque applied through a hex nut. The springs were compressed to
50% of the ultimate strength determined from previous flexural test results, as shown in
Figure 6-18. The springs for the fiber composites (A and B) were loaded to 750 lb, while
the springs for the laminate composite (C) were loaded to 1000 lb. These spring loads
correspond to pivot loads of 1500 and 2000 lbs for fiber and laminate composites
respectively. The specimens were then placed in a 50°C water bath.
A B
Figure 6-18. Sustained load exposure set-up. A) Single sustained load frame B) loaded springs in a row of sustained load frames
With the cooperation of the FDOT, 29 beams were hung from the fender system of
the SR 206 bridge in Crescent Beach, Florida (Figure 6-19). Five fender beams on the
northeast fender were utilized, as shown in Figure 6-20.
94
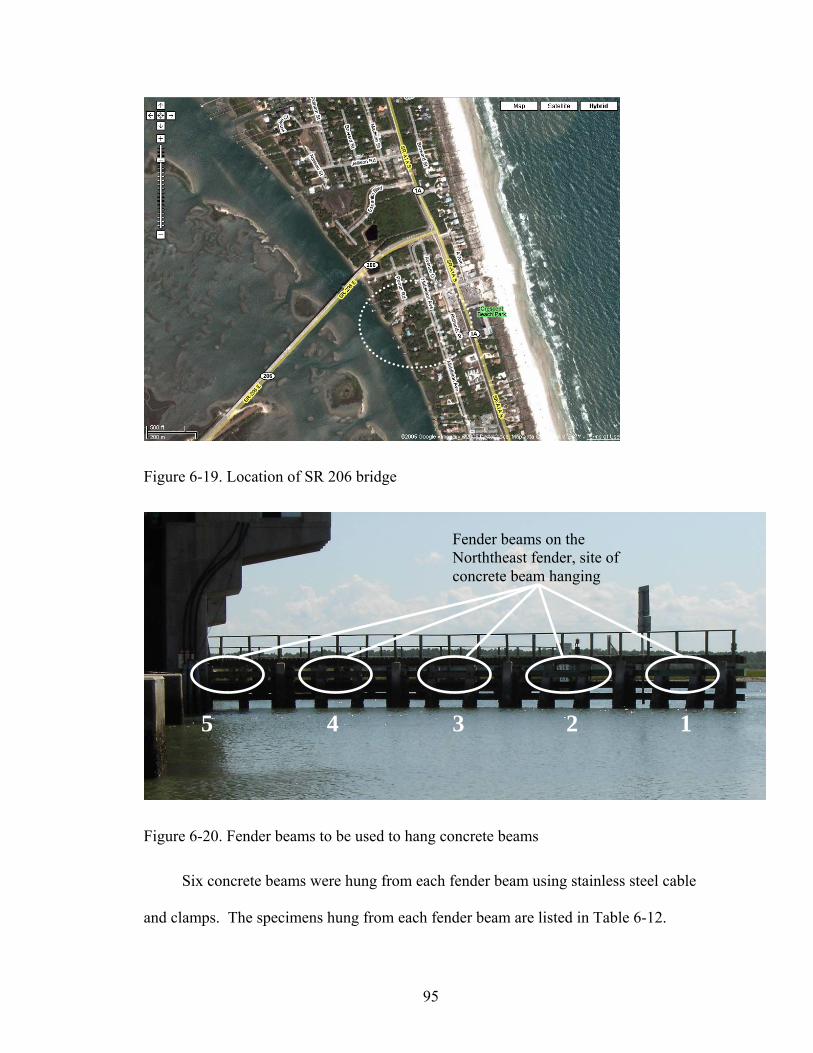
Figure 6-19. Location of SR 206 bridge
Fender beams on the Norththeast fender, site of concrete beam hanging
5 4 3 2 1
Figure 6-20. Fender beams to be used to hang concrete beams
Six concrete beams were hung from each fender beam using stainless steel cable
and clamps. The specimens hung from each fender beam are listed in Table 6-12.
95

Table 6-12. List of specimens hung from each fender beam Fender beam 1 2 3 4 5
RF120B-1 RF60B-1 RF24A-1 RF60A-1 RF24B-1 RF120B-2 RF60B-2 RF24A-2 RF60A-2 RF24B-2 RF120B-3 RF60B-3 RF24A-3 RF60A-3 RF24B-3 RF120C-1 RF60C-1 RF24C-1 RF60M-1 RF120A-1 RF120C-2 RF60C-2 RF24C-2 RF60M-2 RF120A-2
Specimens hung from fender beam
RF120C-3 RF60C-3 RF24C-3 RF60M-3
Twelve specimens were exposed to UV light cycled with immersion in 50°C water.
The UV light was provided by a 4-ft long Phillips TL60W/10R UVA reflector lamp.
UVA light was used for exposure as suggested for accelerated weathering tests by ASTM
standard G154-06. Figure 6-21 shows the UVA-340 spectrum compared to sunlight
spectrum.
Figure 6-21. UVA-340 spectrum vs. Sunlight spectrum
The specimens were rotated between UV exposure and hygrothermal exposure,
having 2 weeks of exposure for each cycle. The UV lamp was placed 6-in away from the
center of the CFRP so that the whole length was exposed. The specimen positions were
rotated with every cycle to ensure consistent exposure among CFRP types.
96

The Arrhenius exposure involved four different temperature water baths. The
specimens were immersed in 30°C, 40°C, 50°C, and 60°C water.
Procedures for Installation
The nine exposure conditions consisted of six systems of 120-qt insulated coolers.
The coolers allowed heat equilibration and retention. Systems that contained more than
one tank were connected with ¾-in PVC plumbing. Each system was equipped with a
pump and a heater connected to the coolers via 5/8-in heater hose. The systems, the
number of tanks involved, and specimens in each tank are listed in
97

Table 6-13.
Systems 1 and 2 were heated by Tiny Titan 2.5-gal point of use heaters, while
systems 3-6 were heated with Whirlpool 6-gal electric residential water heaters. All
systems but system 2 had water circulation from Little Giant 1-MD magnetic driven
pumps. System 2 used a Little Giant 2-MD magnetic driven pump due to the high pH
and corrosive nature of the solution. The pumps ran continuously, while the heaters were
self-regulating and turned on once the temperature of the water dropped below the
programmed temperature.
Each cooler had a one-way ball valve at the inlet that allowed all coolers in a
system to be adjusted to have the same water flow. All tanks in a system maintained
consistent temperatures with fluctuations of plus or minus 1.5°C of the desired
temperature. A plan view of the systems including heaters and plumbing is shown in
Figure 6-22 and pictures of the activated systems are shown in Figure 6-23.
98
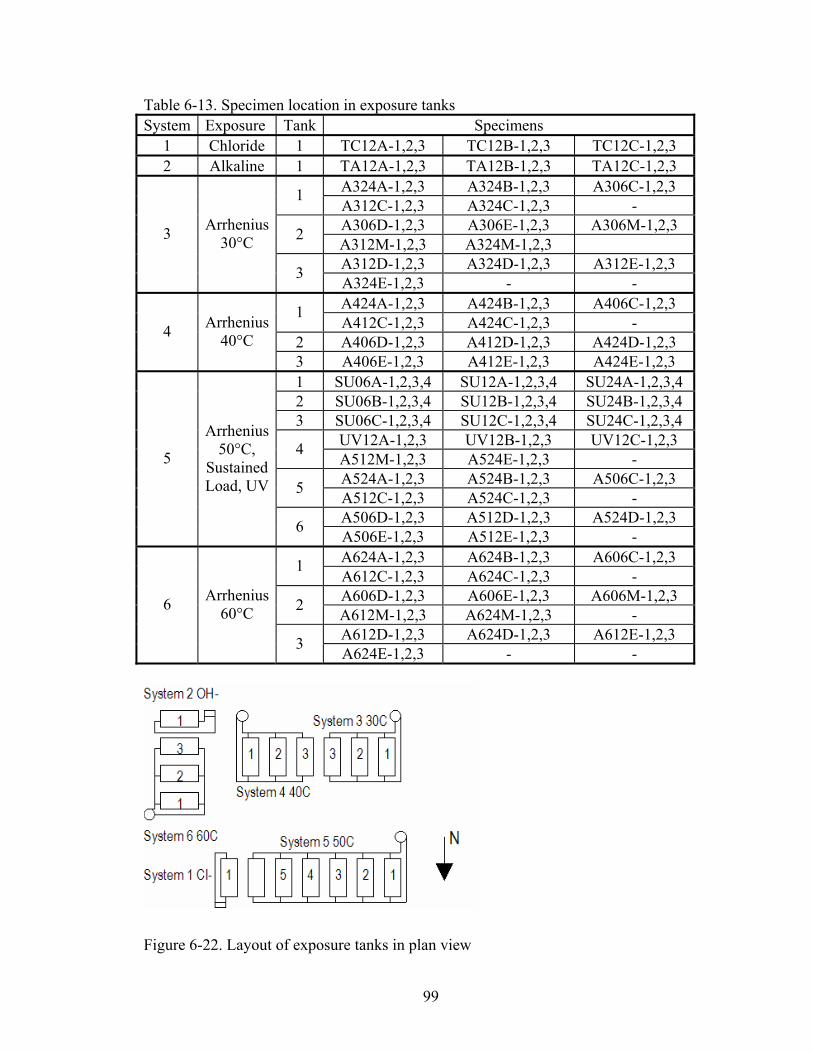
Table 6-13. Specimen location in exposure tanks System Exposure Tank Specimens
1 Chloride 1 TC12A-1,2,3 TC12B-1,2,3 TC12C-1,2,3 2 Alkaline 1 TA12A-1,2,3 TA12B-1,2,3 TA12C-1,2,3
A324A-1,2,3 A324B-1,2,3 A306C-1,2,3 1 A312C-1,2,3 A324C-1,2,3 - A306D-1,2,3 A306E-1,2,3 A306M-1,2,3 2 A312M-1,2,3 A324M-1,2,3 A312D-1,2,3 A324D-1,2,3 A312E-1,2,3
3 Arrhenius 30°C
3 A324E-1,2,3 - - A424A-1,2,3 A424B-1,2,3 A406C-1,2,3 1 A412C-1,2,3 A424C-1,2,3 -
2 A406D-1,2,3 A412D-1,2,3 A424D-1,2,3 4 Arrhenius
40°C 3 A406E-1,2,3 A412E-1,2,3 A424E-1,2,3 1 SU06A-1,2,3,4 SU12A-1,2,3,4 SU24A-1,2,3,4 2 SU06B-1,2,3,4 SU12B-1,2,3,4 SU24B-1,2,3,4 3 SU06C-1,2,3,4 SU12C-1,2,3,4 SU24C-1,2,3,4
UV12A-1,2,3 UV12B-1,2,3 UV12C-1,2,3 4 A512M-1,2,3 A524E-1,2,3 - A524A-1,2,3 A524B-1,2,3 A506C-1,2,3 5 A512C-1,2,3 A524C-1,2,3 - A506D-1,2,3 A512D-1,2,3 A524D-1,2,3
5
Arrhenius 50°C,
Sustained Load, UV
6 A506E-1,2,3 A512E-1,2,3 - A624A-1,2,3 A624B-1,2,3 A606C-1,2,3 1 A612C-1,2,3 A624C-1,2,3 - A606D-1,2,3 A606E-1,2,3 A606M-1,2,3 2 A612M-1,2,3 A624M-1,2,3 - A612D-1,2,3 A624D-1,2,3 A612E-1,2,3
6 Arrhenius 60°C
3 A624E-1,2,3 - -
Figure 6-22. Layout of exposure tanks in plan view
99
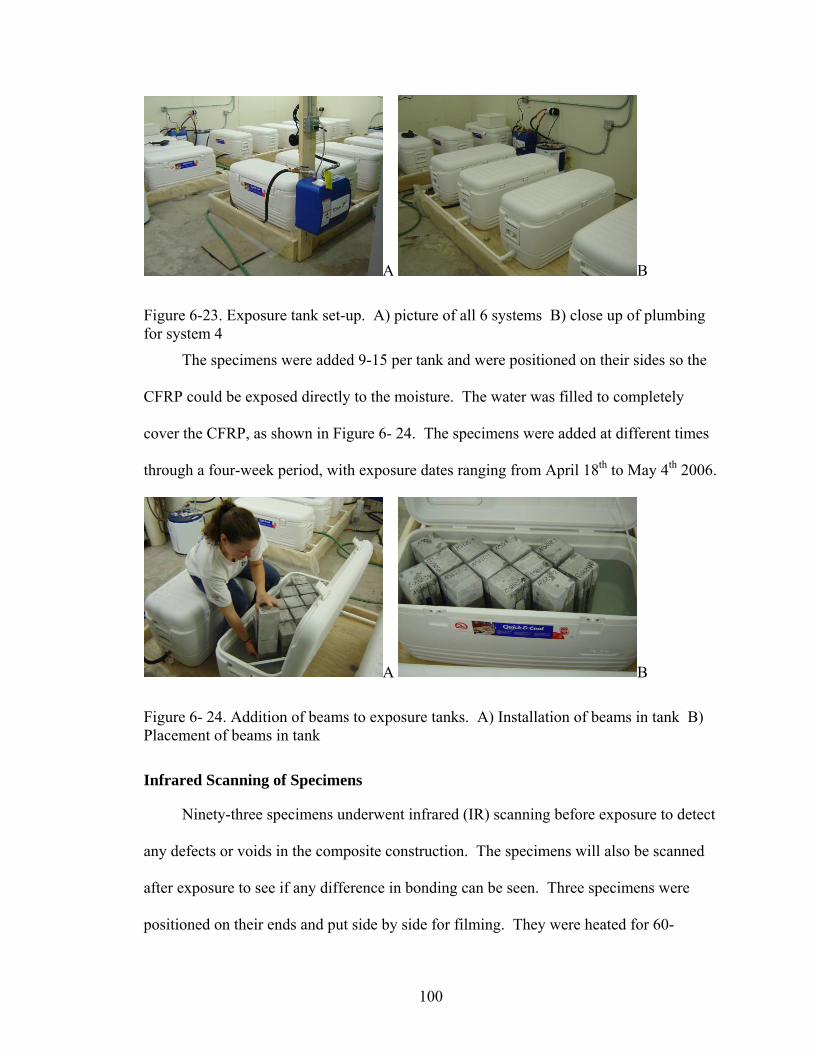
A B
Figure 6-23. Exposure tank set-up. A) picture of all 6 systems B) close up of plumbing for system 4
The specimens were added 9-15 per tank and were positioned on their sides so the
CFRP could be exposed directly to the moisture. The water was filled to completely
cover the CFRP, as shown in Figure 6- 24. The specimens were added at different times
through a four-week period, with exposure dates ranging from April 18th to May 4th 2006.
A B
Figure 6- 24. Addition of beams to exposure tanks. A) Installation of beams in tank B) Placement of beams in tank
Infrared Scanning of Specimens
Ninety-three specimens underwent infrared (IR) scanning before exposure to detect
any defects or voids in the composite construction. The specimens will also be scanned
after exposure to see if any difference in bonding can be seen. Three specimens were
positioned on their ends and put side by side for filming. They were heated for 60-
100
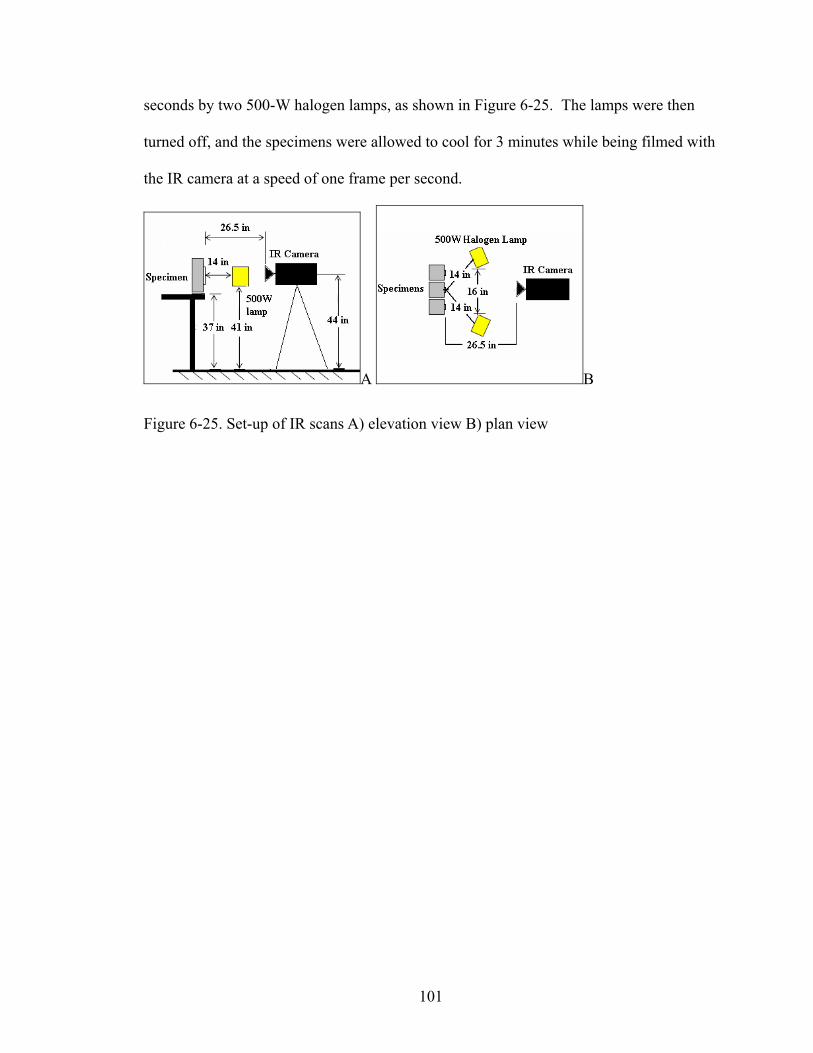
seconds by two 500-W halogen lamps, as shown in Figure 6-25. The lamps were then
turned off, and the specimens were allowed to cool for 3 minutes while being filmed with
the IR camera at a speed of one frame per second.
A B
Figure 6-25. Set-up of IR scans A) elevation view B) plan view
101
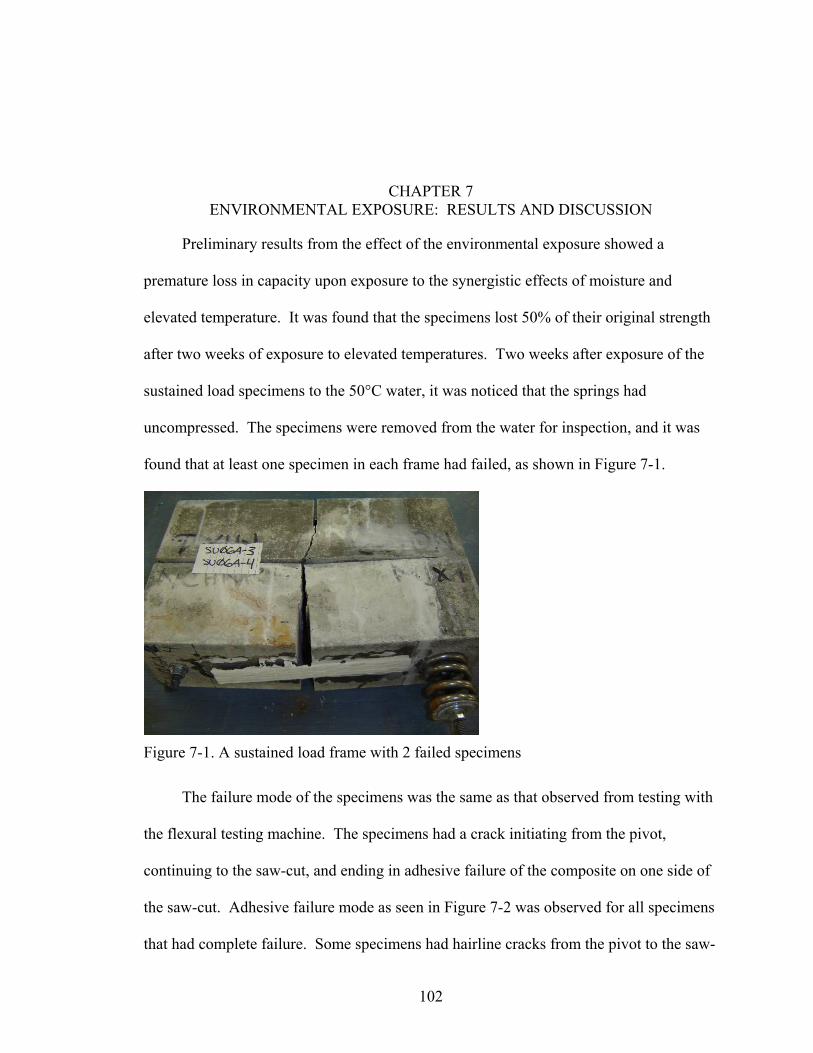
CHAPTER 7 ENVIRONMENTAL EXPOSURE: RESULTS AND DISCUSSION
Preliminary results from the effect of the environmental exposure showed a
premature loss in capacity upon exposure to the synergistic effects of moisture and
elevated temperature. It was found that the specimens lost 50% of their original strength
after two weeks of exposure to elevated temperatures. Two weeks after exposure of the
sustained load specimens to the 50°C water, it was noticed that the springs had
uncompressed. The specimens were removed from the water for inspection, and it was
found that at least one specimen in each frame had failed, as shown in Figure 7-1.
Figure 7-1. A sustained load frame with 2 failed specimens
The failure mode of the specimens was the same as that observed from testing with
the flexural testing machine. The specimens had a crack initiating from the pivot,
continuing to the saw-cut, and ending in adhesive failure of the composite on one side of
the saw-cut. Adhesive failure mode as seen in Figure 7-2 was observed for all specimens
that had complete failure. Some specimens had hairline cracks from the pivot to the saw-
102

cut, while the composite remained intact (Figure 7-3). The failure load and mode for
each sustained load specimen is given in Table 7-1.
The failure of the specimens at the reduced load can be attributed to the effects of
moisture and increased temperature on the CFRP composite/concrete bond. The
specimens were loaded at 50% of their strength when tested at ambient conditions. Once
the bond strength was effectively zero, the concrete had no tensile reinforcement and
could not support the applied load from the spring. .
The loads applied corresponded to failure loads recorded from concrete specimen
testing. The failure loads for the plain concrete MOR tests performed on specimens
without saw-cuts ranged from 5500 to 6000 lbs. Once the saw-cut was induced, the mid-
span cross-section reduced by half. Based on Table 7-1, a 50% reduction in cross-section
relates to a 75% reduction in load, giving a concrete failure load of approximately 1500-
lbs, which is consistent with the applied sustained loads.
The other specimens in the test matrix do not involve flexural testing at an elevated
temperature. The test procedure requires a 24-hour immersion in room temperature water
before testing so the specimens will all be tested at the same temperature. This ensures
that the effects of hygrothermal exposure will be compared based on their effect on the
composite properties, and not a function of test temperature.
The specimens that did not fail in the initial loading were reloaded to 500-lbs (25%
of the control strength). Specimens SU24A-4, SU12B-2, SU12C-4, SU06C-3 were
immersed in a room temperature water bath, while specimens SU06A-1, SU12C-2,
SU24C-1, SU24C-2 were placed in dry ambient conditions. After two months, the
specimens remained intact and continued to age in the exposure environment.
103
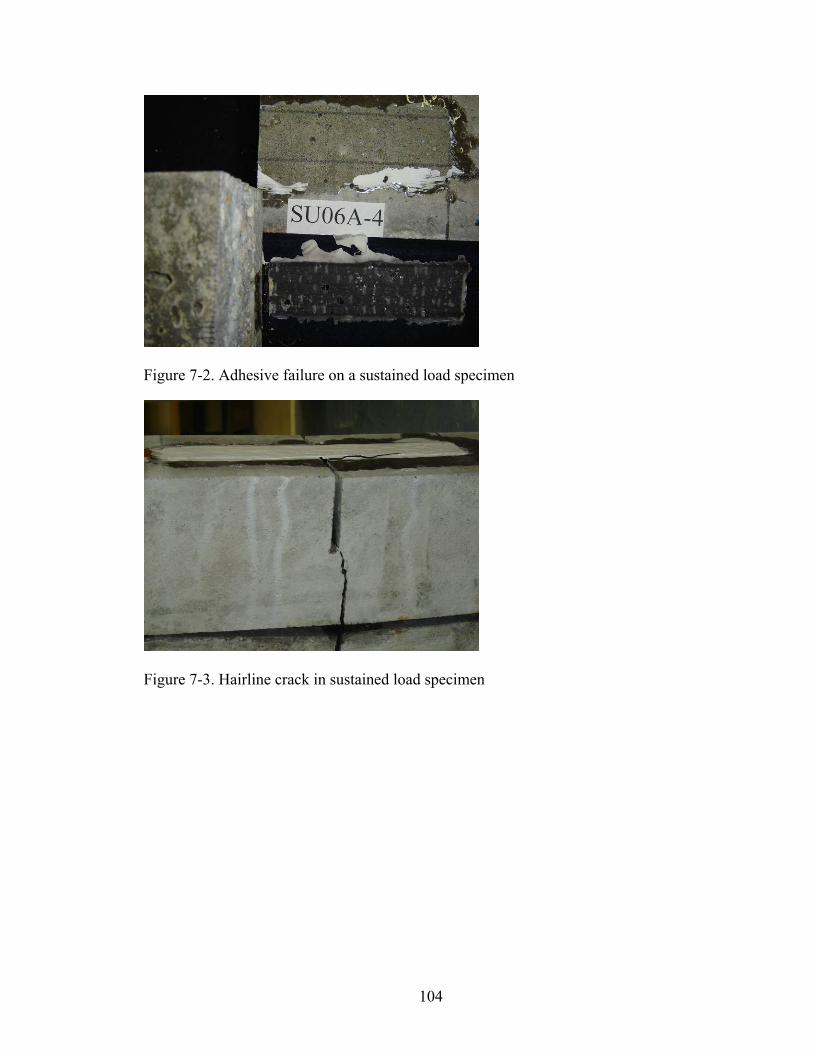
Figure 7-2. Adhesive failure on a sustained load specimen
Figure 7-3. Hairline crack in sustained load specimen
104
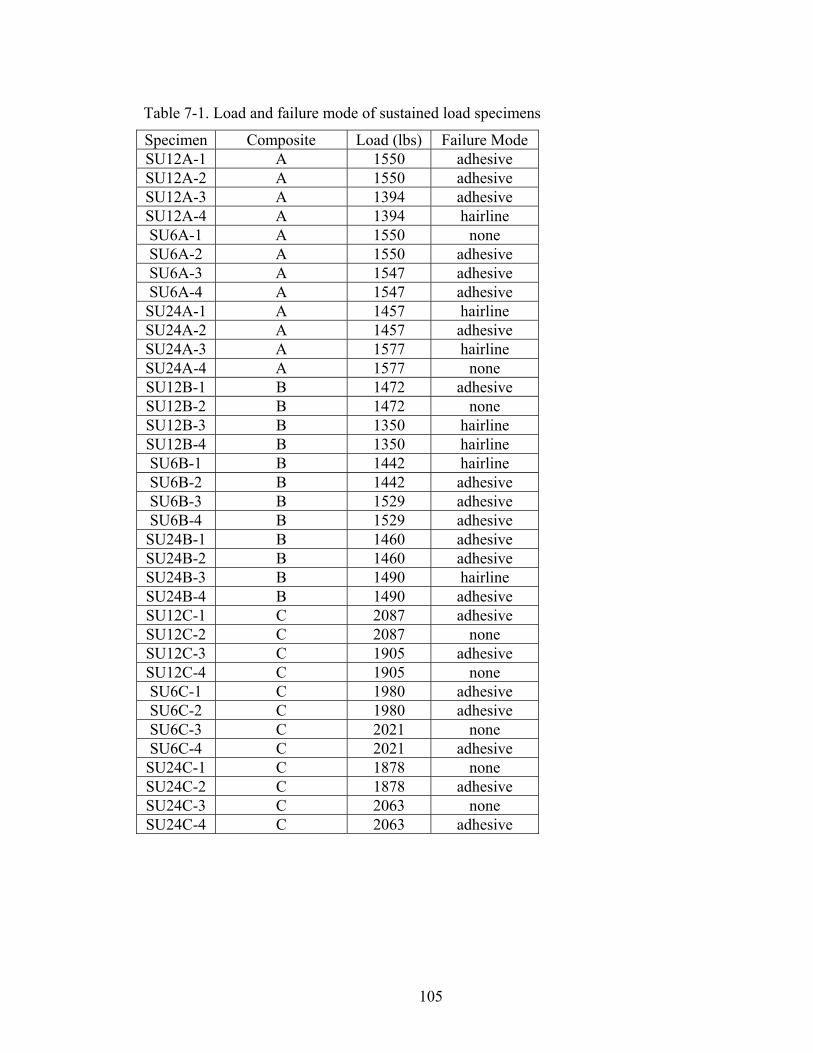
Table 7-1. Load and failure mode of sustained load specimens
Specimen Composite Load (lbs) Failure Mode SU12A-1 A 1550 adhesive SU12A-2 A 1550 adhesive SU12A-3 A 1394 adhesive SU12A-4 A 1394 hairline SU6A-1 A 1550 none SU6A-2 A 1550 adhesive SU6A-3 A 1547 adhesive SU6A-4 A 1547 adhesive SU24A-1 A 1457 hairline SU24A-2 A 1457 adhesive SU24A-3 A 1577 hairline SU24A-4 A 1577 none SU12B-1 B 1472 adhesive SU12B-2 B 1472 none SU12B-3 B 1350 hairline SU12B-4 B 1350 hairline SU6B-1 B 1442 hairline SU6B-2 B 1442 adhesive SU6B-3 B 1529 adhesive SU6B-4 B 1529 adhesive SU24B-1 B 1460 adhesive SU24B-2 B 1460 adhesive SU24B-3 B 1490 hairline SU24B-4 B 1490 adhesive SU12C-1 C 2087 adhesive SU12C-2 C 2087 none SU12C-3 C 1905 adhesive SU12C-4 C 1905 none SU6C-1 C 1980 adhesive SU6C-2 C 1980 adhesive SU6C-3 C 2021 none SU6C-4 C 2021 adhesive SU24C-1 C 1878 none SU24C-2 C 1878 adhesive SU24C-3 C 2063 none SU24C-4 C 2063 adhesive
105

CHAPTER 8 CONCLUSIONS AND FUTURE WORK
A standard test procedure for evaluating durability of CFRP composite bonded
concrete beams was created and implemented to create specimens for the NCHRP
durability study. The specimen configuration included a 4-in x 4-in x 14-in concrete
beam with a half-depth saw cut at midspan. The concrete strength was targeted at 10-ksi.
The specimens incorporated CFRP flexural reinforcement with the dimensions of 8-in
long by 1-in wide for wet lay-up composites and 8-in long by 0.75-in wide for procured
laminates. The testing procedure chosen was a 3-pt flexure test.
An exposure system was designed and constructed for the accelerated durability
study. Insulated coolers were used for immersion of 450 beams to be tested for
durability. The exposure systems included hygrothermal (30°C, 40°C, 50°C, and 60°C),
alkali (50°C), salt (50°C), UV (50°C), sustained load (50°C), and tidal exposure
(ambient). Specimens subjected to the synergistic effects of sustained loading and
hygrothermal exposure gave the following preliminary results:
• Sustained load of 50% the control capacity caused failure after two weeks when exposed to 50°C water
• The failure mode for all composites investigated remained adhesive after exposure to 50°C water
• The combination of moisture and elevated temperature reduced the capacity of the CFRP adhesive bond, but the mechanisms underlying this reduction are as of yet unknown
Six month testing will be performed to confirm the degradation results shown from
the sustained load specimens. The effect of hygrothermal exposure on the material
106

properties of the CFRP composite will also be investigated. The evaluation of
hygrothermal effect on each component of the CFRP will determine the mechanism of
degradation, and this mechanism can then be pinpointed and corrected.
107

APPENDIX A CONCRETE MIX DESIGNS FOR NCHRP PROJECT 12-73
Figure A- 1. Concrete mix 1 properties
108

Figure A- 2. Concrete mix 2 properties
109
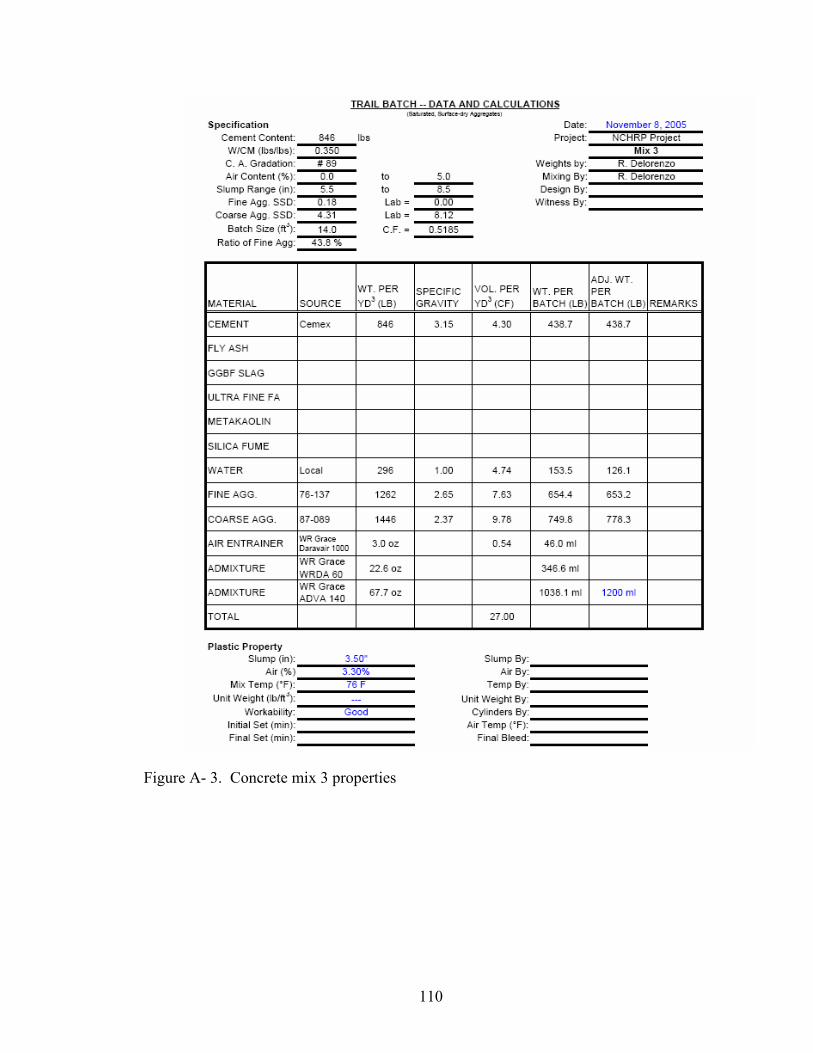
Figure A- 3. Concrete mix 3 properties
110
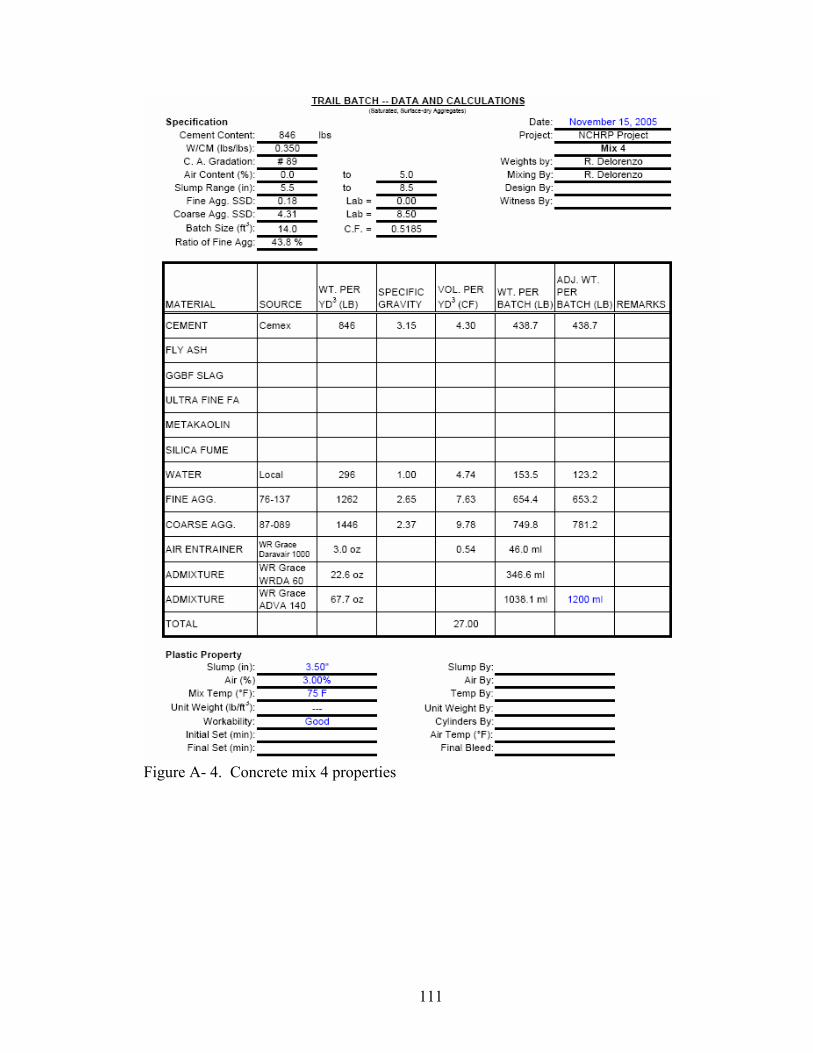
Figure A- 4. Concrete mix 4 properties
111

Figure A- 5. Concrete mix 5 properties
112

113
APPENDIX B NCHRP 12-73 UF TESTING MATRIX
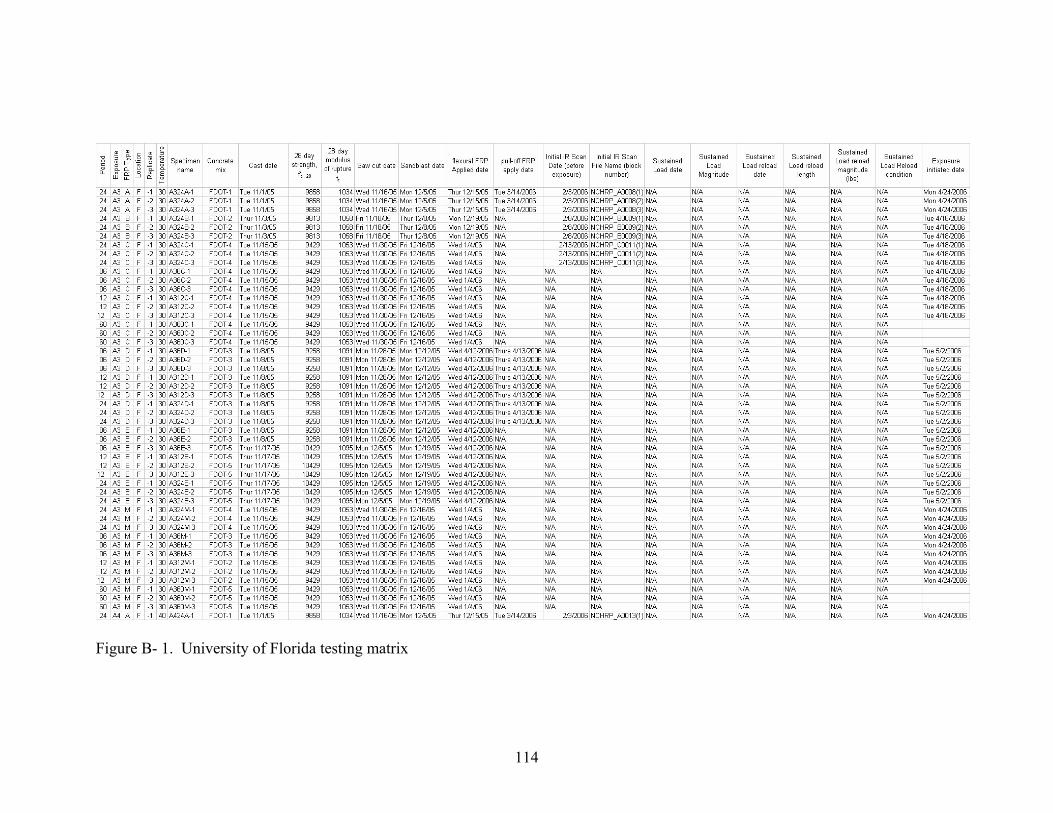
Figure B- 1. University of Florida testing matrix
114
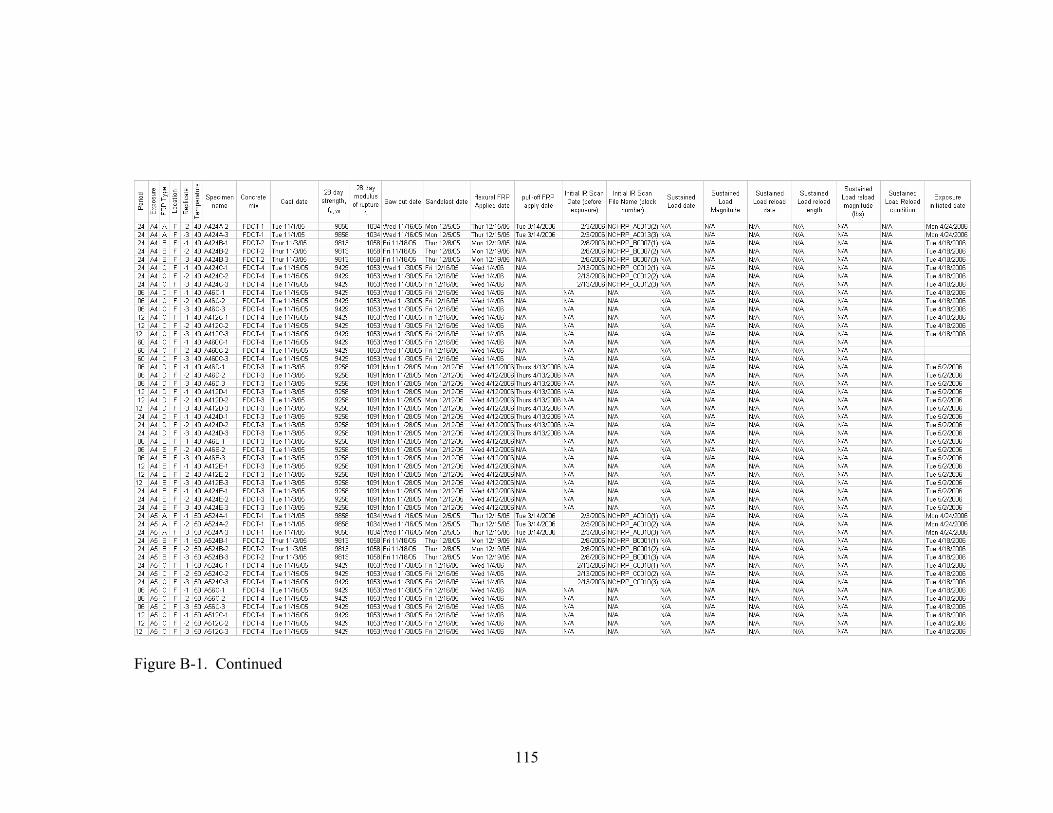
Figure B-1. Continued
115
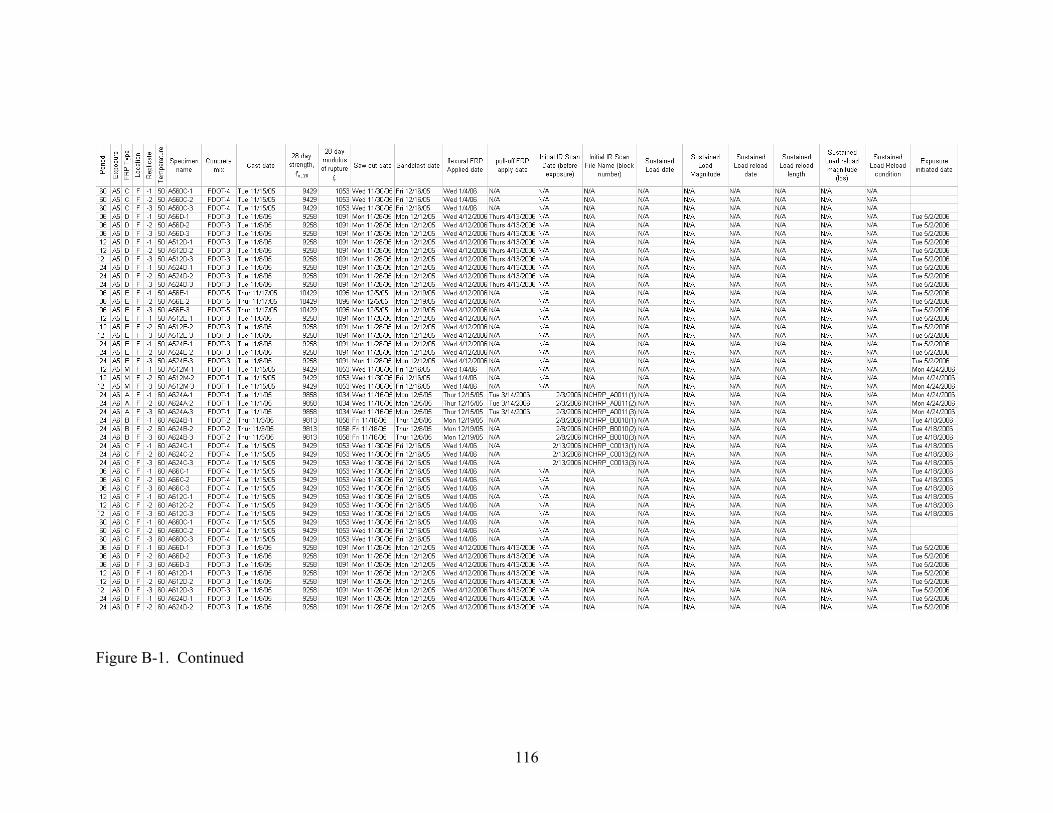
Figure B-1. Continued
116
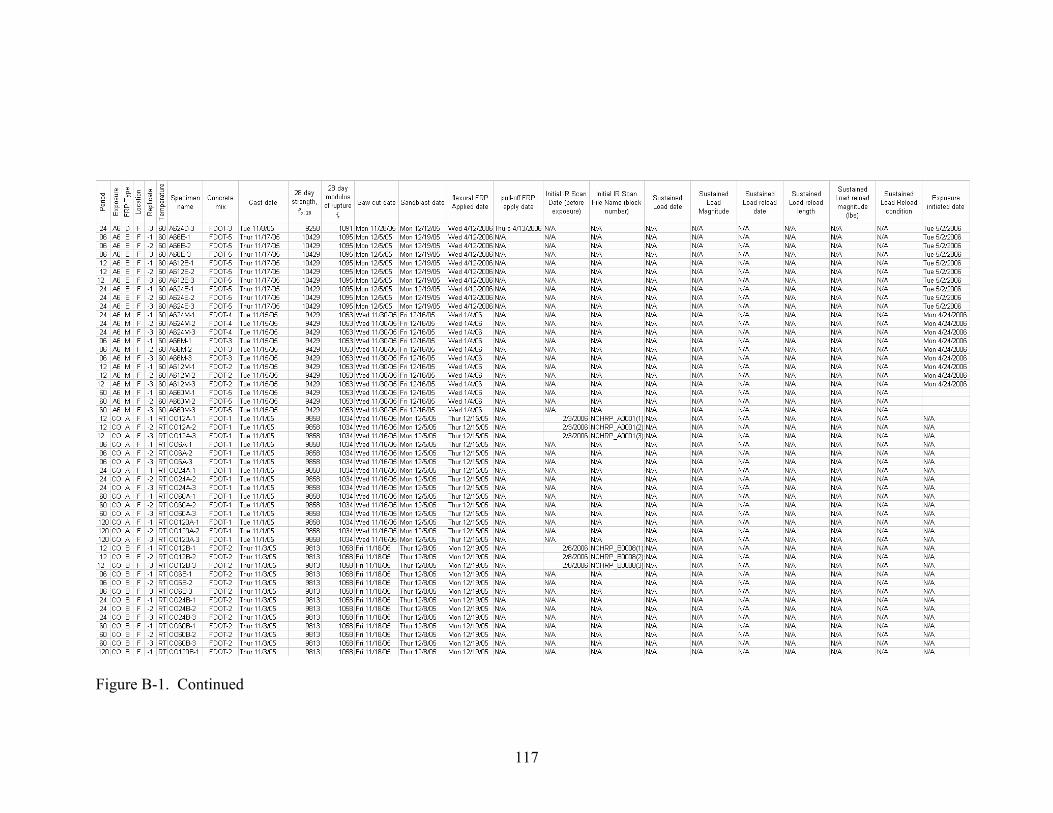
Figure B-1. Continued
117

Figure B-1. Continued
118

Figure B-1. Continued
119

120
Figure B-1. Continued

APPENDIX C STANDARD TEST METHOD FOR FLEXURAL STRENGTH OF CFRP COMPOSITE BONDED CONCRETE (USING SIMPLE BEAM WITH THREE-POINT LOADING)
1. Scope 1.1 This test method covers the determination of the flexural strength of fiber
reinforced polymer (CFRP) composites bonded to concrete by the use of a simple beam with three-point loading.
1.2 The values stated in inch-pound units are to be regarded as the standard. The SI equivalent of inch-pound units has been rounded where necessary for practical application.
1.3 This standard does not purport to address all of the safety concerns, if any, associated with its use. It is the responsibility of the user of this standard to establish appropriate safety and health practices and determine the applicability of regulatory limitations prior to use.
2. Referenced Documents 2A ASTM Standards: C;31 Practice for Making and Curing Concrete Test Specimens in the Field2 C 42 Test Method for Obtaining and Testing Drilled Cores and Sawed Beams of Concrete2 C 192 Practice for Making and Curing Concrete Test Specimens in the Laboratory2 C 617 Practice for Capping Cylindrical Concrete Specimens2 C 1077 Practice for Laboratories Testing Concrete and Concrete Aggregates for Use in Construction and Criteria for Laboratory Evaluation2 E 4 Practices for Force Verification of Testing Machines3 3. Significance and Use
3.1 This test method is used to determine the flexural strength of the CFRP bonded to the tensile face of plain concrete beam specimens. The concrete beams shall be prepared and cured in accordance with Test Methods C42 or Practices C31 or C 192. The CFRP shall be prepared and cured in accordance with NCHRP Report 514 and the manufacturer’s specifications. The stress determined will vary where there are differences in specimen size, preparation, moisture condition, curing, or where the beam has been molded or sawed to size.
3.2 The results of this test method may be used to determine compliance with specifications or as a basis for selection and application of CFRP.
4. Apparatus 4.1 The testing machine shall conform to the requirements of the sections on Basis of
Verification, Corrections, and Time Interval between Verifications of Practices E 4. Hand operated testing machines having pumps that do not provide a continuous loading in one stroke are not permitted. Motorized pumps or hand operated positive displacement pumps
121
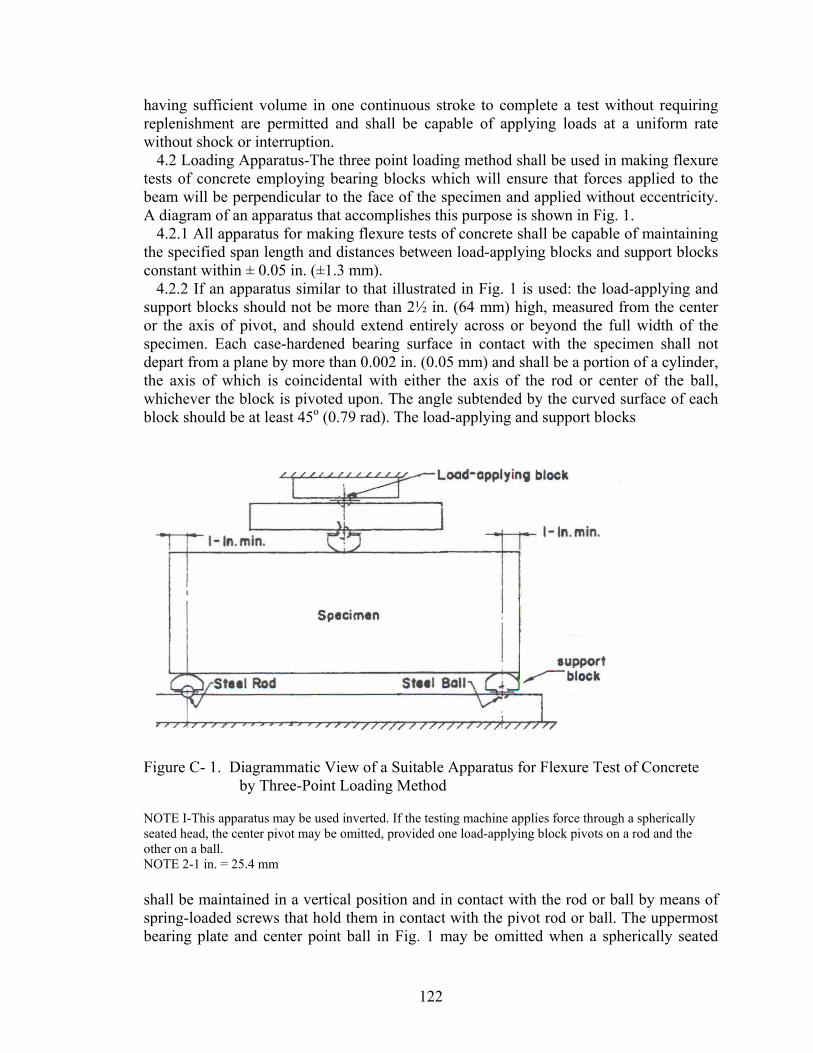
having sufficient volume in one continuous stroke to complete a test without requiring replenishment are permitted and shall be capable of applying loads at a uniform rate without shock or interruption.
4.2 Loading Apparatus-The three point loading method shall be used in making flexure tests of concrete employing bearing blocks which will ensure that forces applied to the beam will be perpendicular to the face of the specimen and applied without eccentricity. A diagram of an apparatus that accomplishes this purpose is shown in Fig. 1.
4.2.1 All apparatus for making flexure tests of concrete shall be capable of maintaining the specified span length and distances between load-applying blocks and support blocks constant within ± 0.05 in. (±1.3 mm).
4.2.2 If an apparatus similar to that illustrated in Fig. 1 is used: the load-applying and support blocks should not be more than 2½ in. (64 mm) high, measured from the center or the axis of pivot, and should extend entirely across or beyond the full width of the specimen. Each case-hardened bearing surface in contact with the specimen shall not depart from a plane by more than 0.002 in. (0.05 mm) and shall be a portion of a cylinder, the axis of which is coincidental with either the axis of the rod or center of the ball, whichever the block is pivoted upon. The angle subtended by the curved surface of each block should be at least 45o (0.79 rad). The load-applying and support blocks
Figure C- 1. Diagrammatic View of a Suitable Apparatus for Flexure Test of Concrete
by Three-Point Loading Method
NOTE I-This apparatus may be used inverted. If the testing machine applies force through a spherically seated head, the center pivot may be omitted, provided one load-applying block pivots on a rod and the other on a ball. NOTE 2-1 in. = 25.4 mm shall be maintained in a vertical position and in contact with the rod or ball by means of spring-loaded screws that hold them in contact with the pivot rod or ball. The uppermost bearing plate and center point ball in Fig. 1 may be omitted when a spherically seated
122

bearing block is used, provided one rod and one ball are used as pivots for the upper load-applying blocks.
5. Testing 5.1 The test specimen shall conform to all requirements of Test Method C 42 or
Practices C 31 or C 192 applicable to beam and prism specimens and shall have a test span within 2 % of being three times its depth as tested. The sides of the specimen shall be at right angles with the top and bottom. All surfaces shall be smooth and free of scars, indentations, holes, or inscribed identification marks.
5.2 The technician performing the flexural strength test should be certified as an ACI Technician-Grade II, or by an equivalent written and performance test program.
NOTE I-The testing laboratory performing this test method may be evaluated in accordance with Practice
C 1077.
6. Procedure 6.1 Specimens shall be removed from exposure condition and immersed in room
temperature (75 F) water 24 hours before testing. Specimens shall be removed from water immersion, surface dried, and allow to air dry for at least one hour, but no more than two hours before flexural testing.
6.2 When using molded specimens, turn the test specimen on its side with respect to its position as molded and center it on the support blocks. When using sawed specimens, position the specimen so that the tension face corresponds to the top or bottom of the specimen as cut from the parent material. Center the loading system in relation to the applied force. Bring the load-applying blocks in contact with the surface of the specimen at the half point and apply a load of between 3 and 6 % of the estimated ultimate load. Using 0.004 in. (0.10 mm) and 0.015 in. (0.38 mm) leaf-type feeler gages, determine whether any gap between the specimen and the load-applying or support blocks is greater or less than each of the gages over a length of 1 in. (25 mm) or more. Grind, cap, or use leather shims on the specimen contact surface to eliminate any gap in excess of 0.004 in. (0.10 mm) in width. Leather shims shall be of uniform 1/4 in. (6.4 mm) thickness, 1 to 2 in. (25 to 50 mm) width, and shall extend across the full width of the specimen. Gaps in excess of 0.015 in. (0.38 mm) shall be eliminated only by capping or grinding. Grinding of lateral surfaces should be minimized inasmuch as grinding may change the physical characteristics of the specimens. Capping shall be in accordance with the applicable sections of Practice C 617. 6.3 Load the specimen continuously and without shock. The load shall be applied at a constant rate to the breaking point. Apply the load so that the specimen will reach ultimate capacity between 1-min and 2-min after reaching half capacity. A displacement rate of .01-in/min has been found to be acceptable for concrete strengths between 5-ksi and 10-ksi.
7. Report 7.1 Report the following information: 7.1.1 Load at failure, 7.1.2 Maximum deflection, 7.1.3 Fiber failure stress, 7.1.4 Fiber shear stress
123

LIST OF REFERENCES
AASHTO M 235M/M 235-03, “Standard Specification for Epoxy Resin Adhesives,” AASHTO, Washington, DC.
ACI Committee 440, 2004, “Guide Test methods for Fiber-Reinforced Polymers (CFRP) for Reinforcing or Strengthening Concrete Structures (440.3R-04),” American Concrete Institute, Farmington Hills, Michigan, 40 pp.
Aiello, M. A., Frigione, M., and Acierno, D, 2002. "Effects of environmental conditions on performance of polymeric adhesives for restoration of concrete structures," Journal of Materials in Civil Engineering, V. 14, pp. 185-189.
ASTM C39-05, “Standard Test Method for Compressive Strength of Cylindrical Concrete Specimens,” ASTM International.
ASTM C78-02, “Standard Test Method for Flexural Strength of Concrete (Using Simple Beam with Third-Point Loading),” ASTM International.
ASTM C881/C881M-02, “Standard Specification for Epoxy-Resin-Base Bonding Systems for Concrete,” ASTM International.
ASTM C882-05, “Standard Test Method for Bond Strength of Epoxy-Resin Systems Used With Concrete By Slant Shear,” ASTM International.
ASTM D1141-98(2003), “Standard Practice for the Preparation of Substitute Ocean Water,” ASTM International.
ASTM D3039/D3039M-00, “Standard Test Method for Tensile Properties of Polymer Matrix Composite Materials,” ASTM International.
ASTM G53-96, “Practice for Operating Light- and Water-Exposure Apparatus (Fluorescent UV-Condensation Type) for Exposure of Nonmetallic Materials,” ASTM International.
ASTM G154-06, “Standard Practice for Operating Fluorescent Light Apparatus for UV Exposure of Nonmetallic Materials,” ASTM International.
Au, C. and Buyukozturk, O, 2006. "Peel and shear fracture characterization of debonding in CFRP plated concrete affected by moisture," Journal of Composites for Construction, V. 10, pp. 35-47.
Banks, W.M., Pethrick, R.A., Armstrong, G.S., Crane, R.L., and Hayward, D, 2004. “Dielectric and mechanical studies of the durability of adhesively bonded CFRP structures subjected to aging in various solvents,” Proceedings of the Institution of Mechanical Engineers, Part L: Journal of Materials: Design and Applications, V. 218, pp. 273-281.
124

Brena, S.F, Wood, S.L., and Kreger, M., 2002. “Fatigue Tests of Reinforced Concrete Beams Strengthened Using Carbon Fiber Reinforced Polymer Composites,” Proceedings of the Second International Conference on Durability of Fibre Reinforced Polymer Composites for Construction, pp. 575-586.
Caruso, H., and Dasgupta, A., 1998. "A Fundamental Overview of Accelerated Testing Analytical Models," Journal of the Institute for Environmental Sciences and Technology, Jan/Feb.
Chin, J.W., Haight, M.R., Hughes, W.L., and Nguyen, T., 1998. “Environmental Effects on Composite Matrix Resins Used in Construction,” Proceedings of CDCC, pp. 229-242.
El-Hawary, M., Al-Khaiat, H., and Fereig, S., 2000. "Performance of epoxy-repaired concrete in a marine environment," Cement and Concrete Research, V. 30, pp. 259-266.
Ferrier, E., and Hamelin, P., 2002. “Effect of Water Absorption on the Durability of Carbon CFRP Reinforcement,” Proceedings of CDCC, pp. 99-112.
Haeberle, D.C., Staff, B.C., Lesko, J., and Riffle, J.S., 2002. “Effect on UV Aging on Strength in Vinyl Ester Matrix Composites,” Proceedings of the Second International Conference on Durability of Fibre Reinforced Polymer Composites for Construction, pp. 273-284.
Halliday, S.T., Banks, W.M., Pethrick, R.A., 2000. “Dielectric Studies of Adhesively Bonded CFRP/epoxy/CFRP Structures-Design for Ageing,” Composites Science and Technology, pp. 197-207.
Heffernan, P.J., Wight, R.G., and Eriki, M.A., 2002. “Fatigue Behavior of Concrete Slabs Strengthened with Prestressed CFRP Sheets,” Proceedings of the Second International Conference on Durability of Fibre Reinforced Polymer Composites for Construction, pp. 465-474.
Hulatt, J., Holloway, L., and Thorne, A., 2002."Preliminary investigations on the environmental effects on new heavyweight fabrics for use in civil engineering," Composites: Part B, V. 33, pp. 407–414.
Karbhari, V.M., Engineer, M., Eckel, D.A. II, 1997. “On the durability of composite rehabilitation schemes for concrete: use of a peel test,” Journal of Materials Science, V. 32, pp. 147-156.
Katsuki, F., and Uomoto, T., 1995. “Prediction of deterioration of CFRP rods due to alkali attack,” Non-metallic (CFRP) reinforcement for concrete structures, pp. 82-89.
Liau, W.B., and Tsent, F.P., 1998. “The Effect of Long-Term Ultraviolet Light Irradiation on Polymer Matrix Composites,” Polymer Composites, V. 4, pp. 440.
125

LuValle, M., Copeland, L., Kannan, S., Judkins, J., and Lemaire, P., 1998. "A Strategy for Extrapolation in Accelerated Testing," Bell Labs Technical Journal, July-September, pp. 139.
Nanni, B.A., Bakis, C.E., and Mathew, J.A., 1998. “Acceleration of CFRP Bond Degradation,” Proceedings of CDCC, pp. 45-56.
National Research Council, 1996. "Accelerated Aging of Materials and Structures: The Effects of Long-Term Elevated-Temperature Exposure (NMAB-479)," National Academy Press, Washington, DC.
NCHRP Report 514, 2004. "Bonded Repair and Retrofit of Concrete Structures Using CFRP Composites, Recommended Construction Specifications and Process Control Manual," Transportation Research Board, Washington, DC.
Nikles, D., Wiest, J., 2000. "Accelerated Aging Studies and the Prediction of the Archival Lifetime of Optical Disk Media," IEEE Symposium on Mass Storage Systems, pp. 31-40.
Sen, R., Shahawy, M., Mullins, G., and Spain, J., 1999. "Durability of carbon fiber-reinforced polymer/epoxy/concrete bond in marine environment," ACI Structural Journal, V. 96, pp. 906-914.
Startsev, O.V., Krotov, A.S., and Startseva, L.T., 1999. “Interlayer Shear Strength of Polymer Composite Materials During Long Term Climactic Aging,” Polymer Degradation and Stability, V. 63, pp. 183.
Toutanji, H.A. and Gomez, W., 1997. "Durability characteristics of concrete beams externally bonded with CFRP composite sheets," Cement and Concrete Composites V. 19, pp. 351-358.
Tu, L. and Kruger, D., 1996. "Engineering properties of epoxy resins used as concrete adhesives," ACI Materials Journal, V. 93, pp. 26-35.
White, J.R.; Turnbull, A., 1994. "Weathering of Polymers: Mechanisms of Degradation and Stabilization, Testing Strategies and Modeling," Journal of Materials Science, V. 29, pp. 584-613.
126

BIOGRAPHICAL SKETCH
Amber Lee Gartner is daughter to Gary and Linda Paul, and sister to Erin Paul.
She grew up in Cape Coral, Florida where she completed her elementary and secondary
education. Amber began studying at the University of Florida in August, 2000. She
pursued engineering because she enjoyed math and science classes throughout her
education. Her undergraduate degree was in Materials Science and Engineering,
specializing in polymer science. Throughout her undergraduate degree, Amber
participated in programs such as Integrated Product and Process Design at UF and
Research Experiences for Undergraduates at Northwestern University. Although she
carried and interest in polymer science, she felt her career goals had her heading towards
the field of civil engineering.
After some post-baccalaureate work in civil engineering, Amber began the Civil
Engineering graduate program in the Spring semester of 2005. Her background in
polymer science proved helpful as she began work with Dr. Hamilton on CFRP research.
The research combined polymer science and civil engineering. Amber received the title
of an engineering intern upon passing the fundamentals of engineering exam in October
2005.
Throughout her graduate studies Amber’s husband Mike has been a constant
support. She will be graduating with a Masters of Engineering Degree, specializing in
structures. She will continue to use her education as she joins an engineering firm in
Ocala, Florida upon graduation.
127