development of a driver information and warning system ...bdeschutter/pub/rep/09_042.pdf · driver...
TRANSCRIPT

Delft University of Technology
Delft Center for Systems and Control
Technical report 09-042
Development of a driver information and
warning system with vehicle
hardware-in-the-loop simulations∗
O.J. Gietelink, J. Ploeg, B. De Schutter, and M. Verhaegen
If you want to cite this report, please use the following reference instead:
O.J. Gietelink, J. Ploeg, B. De Schutter, and M. Verhaegen, “Development of a
driver information and warning system with vehicle hardware-in-the-loop simula-
tions,” Mechatronics, Special Issue on Hardware-in-the-Loop Simulation, vol. 19,
no. 7, pp. 1091–1104, Oct. 2009.
Delft Center for Systems and Control
Delft University of Technology
Mekelweg 2, 2628 CD Delft
The Netherlands
phone: +31-15-278.51.19 (secretary)
fax: +31-15-278.66.79
URL: http://www.dcsc.tudelft.nl
∗This report can also be downloaded via http://pub.deschutter.info/abs/09_042.html

Development of a driver information and
warning system with vehicle
hardware-in-the-loop simulations ⋆
O.J. Gietelink a,b, J. Ploeg a,∗, B. De Schutter b,c,M. Verhaegen b
aTNO Science and Industry, Business Unit Automotive,
P.O. Box 756, 5700 AT, Helmond, The Netherlands
bDelft University of Technology, Delft Center for Systems and Control,
Mekelweg 2, 2628 CD Delft, The Netherlands
cDelft University of Technology, Marine & Transport Technology,
Mekelweg 2, 2628 CD Delft, The Netherlands
Abstract
This paper presents a new method for the design and validation of advanced driverassistance systems (ADASs). With vehicle hardware-in-the-loop (VeHIL) simula-tions the development process, and more specifically the validation phase, of intel-ligent vehicles is carried out safer, cheaper, and more manageable. In the VeHILlaboratory a full-scale ADAS-equipped vehicle is set up in a hardware-in-the-loopsimulation environment, where a chassis dynamometer is used to emulate the roadinteraction and where robot vehicles are used to represent other traffic. In this con-trolled environment the performance and dependability of an ADAS is tested togreat accuracy and reliability. The working principle and the added value of VeHILare demonstrated with test results of a driver information and warning system.Based on the ‘V’ diagram, the position of VeHIL in the development process ofADASs is illustrated.
Key words: hardware-in-the-loop simulation, advanced driver assistance systems,controller validation
Preprint submitted to Elsevier 15 December 2015

1 Introduction
Every year in Europe alone, more than 40 000 casualties and 1.4 million in-juries are caused by vehicle-related accidents [1]. Although advances in passive
safety, as illustrated in Fig. 1, have made passenger cars ever safer, the safetypotential of further improvements in passive safety features is limited. How-ever, active safety systems like ABS and ESP offer possibilities for improvingtraffic safety by assisting the driver in his driving task. In addition, advanceddriver assistance systems (ADASs) have the potential to significantly reducethe number of road accidents. An ADAS is a vehicle control system that usesenvironment sensors (e.g., radar, laser, vision) to improve driving comfort andtraffic safety by assisting the driver in recognising and reacting to potentiallydangerous traffic situations. Since an ADAS can even autonomously intervene,an ADAS-equipped vehicle is popularly referred to as an ‘intelligent vehicle’.As explained in more detail in several surveys [2] [3], the following types ofintelligent vehicle systems can be distinguished:
• Driver information systems aim to support the driver on the strategic level
of the driving task, such as advanced route navigation.• Driver warning systems support the driver on the maneuvering level of thedriving task and actively warn the driver of a potential danger. The drivercan then take appropriate actions in order to mitigate or to completelyavoid the dangerous event. Examples are parking assistant, lane departurewarning assistant, blind spot warning, and forward collision warning (FCW)systems.
• Intervening systems provide active support to the driver on the control levelof the driving task, such as lane keeping and adaptive cruise control (ACC)[7].
• Integrated passive and active safety systems include all systems (includingsome of the above) that work towards vehicle safety in a cooperative manner[8].
In the remainder of this paper we will focus on the development of driverwarning systems. Collision warning algorithms typically issue a warning when
⋆ Research supported by the Netherlands Organisation for Applied Scientific Re-search TNO, the Netherlands Research School for Transport, Infrastructure andLogistics TRAIL, the TNO TRAIL Transport Research T3 program, the Trans-port Research Centre Delft of Delft University of Technology, the European 6thFramework Network of Excellence “HYbrid CONtrol: Taming Heterogeneity andComplexity of Networked Embedded Systems (HYCON)”, contract number FP6-IST-511368, and the subproject SASPENCE of the Integrated Project PReVENT,co-funded by the European Commission under the Sixth Framework Programme.∗ Corresponding author:Email address: [email protected] (J. Ploeg).
2

1965 1970 1975 1980 1985 1990 1995 2000 2005 2010 2015 20200%
100%
200%
300%
400%Total distance traveled [km]Car accidents per distance [km −1]Fatalities per distance [km−1]Estimated future trend [ ]
ABS TCS ESC
BA FCW
ACC NV SG
LDWA
IPAS CACCCA
seat belt
crush zonehead rest
airbag side airbag
PCS
LKA
ABS Anti−lock braking system
TCS Traction control system
ESC Electronic stability control
BA Brake assist
FCW Forward collision warning
ACC Adaptive cruise control
NV Night vision
LDWA Lane departure warning assistant
SG Stop−and−go
PCS Pre−crash system
IPAS Intelligent parking assist system
CACC Cooperative adaptive cruise control
LKA Lane keeping assistant
CA Collision avoidance
−
safety pedal compatibility
Fig. 1. Total number of road accidents and fatalities per total distance travelled,indexed on 1965 data for the EU [1]. In addition, the graph shows when passivesafety systems (which reduce fatalities in case of an accident) and active safetysystems (which assist in avoiding an accident) have first been introduced (or areexpected to be introduced) to the market, as well as the expected safety potentialof these systems [4] [5] [6].
v 2(t )0
L 2
x
host vehicleVehicle 2:
s
x vr r
target vehicleVehicle 1:
L
(t0v )1
s0
2v v= v
warn
,
1
11
Fig. 2. Development over time of a typical scenario for forward collision warning,including a target vehicle (light) and the FCW-equipped host vehicle (dark). Thelength of the bold arrows gives an indication of the absolute vehicle speed.
the current range to an object (the headway) xr is less than the critical warn-ing distance swarn [9] [10] [4]. The warning then allows the driver to stop orapproach no closer than a designated distance s0 behind a stopped or decel-erating target vehicle, as illustrated in Fig. 2. This figure shows a host vehicle
i and target vehicle i − 1, each with state xi =[
xi vi ai
]t
, where xi is posi-
tion, vi velocity, and ai acceleration of vehicle i. The figure also indicates thevehicle length Li, the headway xr = xi−1 − xi − Li, and the relative velocityvr = vi−1 − vi.
Using field-operational test drives with subject drivers, warning algorithmshave been developed for use in several commercial FCW systems [11] [12]to give warnings corresponding with natural driver behaviour. Unfortunately,these algorithms will also warn drivers when they intend to perform a latelane-change maneuver, since the algorithm only considers longitudinal vehi-cle motion. As a result, drivers may find the system conservative and they
3

may become less sensitive to future warnings. This illustrates the need for ap-propriate warnings to the driver. In this respect, drivers expect an ADAS tomeet high requirements in terms of (subjective) performance, reliability (lowrate of false alarms), and safety (low rate of missed detections). Therefore,the ADAS must be tested for the wide variety of complex traffic situationsthat the system should be able to recognise and to handle [10]. Unfortunately,exhaustive testing of an ADAS prototype is usually impossible due to con-straints in costs and time-to-market. Not only the design, but especially thevalidation of ADASs, thus requires a growing effort in the development pro-cess. To address these issues, efficient methods are required for the design ofADAS controllers and for the validation of their safety and performance.
The objective of this paper is to present a new method for the developmentof ADASs that complements the existing development process. This methodconsists of vehicle hardware-in-the-loop (VeHIL) simulations that allow toefficiently and accurately test full-scale ADAS-equipped vehicles in an indoorlaboratory environment.
The remainder of this paper is organised as follows. The problem statement isfurther defined in Section 2 by reviewing the development process of ADASsand state-of-the-art test methods. In Section 3 we then present the workingprinciple and added value of the VeHIL concept, and discuss the position of theVeHIL laboratory in the ADAS development process. This is demonstrated inSection 4, where VeHIL test results for a new driver information and warningsystem are presented. Finally, Section 5 presents the conclusions, and discussesongoing research activities.
2 Tools in the design and validation process
2.1 Challenges in the ADAS development process
In the automotive industry the different phases in the development processof safety-critical mechatronic systems are often connected using the ‘V’ dia-gram [13]. As depicted in Fig. 3, this diagram uses a ‘top-down’ approach fordesign and a ‘bottom-up’ approach for validation, although in practice thedevelopment process does not strictly follow all phases in this sequence andgoes through several iteration loops. For relatively simple mechatronic sys-tems, the design process is quite surveyable, as formalised in various genericmethodologies for the design of mechatronic systems (e.g., [14]). However,the various development phases for complex mechatronic systems, such as anADAS-equipped vehicle, face some specific challenges that are addressed inthis section.
4

Moduleconstruction
Functionalrequirements
Moduledesign specs
Top−leveldesign
Systemspecification
Dependabilityrequirements
Systemvalidation
Systemverification
MIL
, PreS
can
Systemintegrationand testing
Dependabilitytesting
Moduleverification MIL
PreScanSILHILVeHILFTAFMECA
Pre−crash Scenario analyzer
Hardware−in−the−loopVehicle hardware−in−the−loopFault tree analysisFailure modes, effects andcriticality analysis
Desig
n
Val
idat
ion
Test drives, VeHIL
Test drives, VeHIL
FMECA, FTA
VeHILHIL,
Rapid control prototyping
HIL, VeHIL
SIL, HIL,VeHIL
Model−in−the−loop
Software−in−the−loop
Fig. 3. The ‘V’ diagram represents the sequential design and validation phases in thedevelopment of automotive safety-critical systems. The horizontal arrows indicatethe mapping of design phases onto the corresponding validation phases (or viceversa), using the appropriate test tools.
2.1.1 Requirements and specification phase
There are guidelines and procedures available for ADAS development, such asthe ADAS Code of Practice [15] and the ISO standard for FCW [16]. Unfortu-nately, these can only be applied at a high abstraction level in the developmentprocess, and do not provide objective requirements and evaluation criteria forADAS validation and benchmarking, nor do they prescribe the use of specifictools and methods in the validation process.
Quantitative functional requirements are therefore required in terms of thedesired performance, driver comfort, and operational constraints. In addition,ADASs are safety-critical systems that require a high level of dependability.The system designer should therefore perform hazard and risk analyses (suchas FMECA and FTA) to identify the dependability requirements in terms ofthe required level of reliability, safety, and fault tolerance [13].
Reliability is usually defined in terms of the rate of false alarms (when anADAS takes unnecessary action) and missed detections (when it fails to cor-rectly detect a dangerous situation). The NHTSA field-operational test hasdemonstrated a false alarm rate around 2 · 10−3/km for an FCW system, andaround 10−5/km for an ACC [9], but this is still considered too high.
From the functional and safety requirements a system specification is producedto define the precise operation of the system. However, in practice dependabil-
5

ity requirements are often difficult to define and subject to ambiguity, whichmay lead to an incomplete or incorrect specification.
Subsequently, the system specification is used as the basis for the top-level de-sign of the system architecture, followed by detailed module design (environ-ment sensor, controller, actuator, human-machine interface). After implemen-tation of the individual hardware and software modules, system integrationtakes place by assembling the complete system from its component modules.
2.1.2 Verification and validation
In every integration phase verification takes place to determine whether theoutput of a phase meets its specification, as illustrated by the horizontal arrowsin Fig. 3. On the component level this could mean, for example, testing therange, accuracy, and tracking capabilities of the environment sensor [17]. Ona higher level, verification must assure that integration with other subsystemsdoes not have any negative side-effect.
Since verification only confirms compliance with the specification, errors inthe specification may result in a faulty product. Furthermore, faults mustbe identified that have not yet been found during the design process. It istherefore important to perform validation of the integrated system against itsrequirements, especially for type approval and certification purposes.
Usually, the development process involves several iterations, where the resultsof verification and validation are used to modify the system specification anddesign, after which another test cycle takes place. Consequently, manufacturersare facing longer development times, whereas they have an increasing desirefor a shorter time-to-market of their products. Likewise, the costs for thevalidation process increases. It is estimated that verification and validation ofan automotive control system may take up to 50% of the total developmentcosts [18]. Obviously, there is a need to reduce the number of iterations andspeed up this process. Because of the need for fast, flexible, and repeatabletest results, various ‘in-the-loop’ simulation tools are increasingly being usedfor design and validation of ADAS controllers, as indicated in Fig. 3. After areview of these tools, the position of the new VeHIL simulation tool in thisdevelopment process will be clarified in Section 3.
2.2 Model-in-the-loop simulations
The initial design of the ADAS controller is supported by so-called model-in-
the-loop (MIL) simulations, where the controller logic is simulated in closed-loop with models of vehicle dynamics, sensors, actuators, and the traffic envi-
6

ronment. Unfortunately, current simulation tools lack the possibility for test-ing the complete ADAS in a reliable way with full integration of operatingconditions, sensor characteristics, vehicle dynamics, and complex traffic sce-narios. The new simulation concept PRESCAN was therefore developed in[19]. PRESCAN allows reliable MIL simulation of ADASs, using validatedphysical sensor models for radar, lidar, and camera vision in a virtual envi-ronment, illustrated in Fig. 6. The simulation of traffic scenarios is based ona multi-agent approach, as will be explained in Section 3.
2.3 Software-in-the-loop simulations
When MIL simulations have provided sufficient results, software code can becompiled from the simulation model of the control system. The real code canthen be verified with software-in-the-loop (SIL) simulations, where the remain-ing hardware components, vehicle dynamics, and environment are simulatedin real-time.
2.4 Hardware-in-the-loop simulations
Similar to testing the real software in a SIL simulation, the real hardware canbe tested in a real-time hardware-in-the-loop (HIL) simulation. HIL simula-tions consist of a combination of simulated and real components, see Fig. 4.Alternatively, a real component can be emulated, i.e., replaced by an artifi-
cial component that has the same input and output characteristics. Ideally,every component should be unable to distinguish between real, simulated oremulated components that it is connected to in the closed-loop configuration.Therefore, HIL offers the flexibility of a simulation, where the use of realhardware offers a high level of reliability.
The main advantage of a HIL simulation is that it provides a repeatable labora-tory environment for safe, flexible, and reliable controller validation. Controllerperformance and stability can be systematically tested without disturbancesfrom other unrelated systems, and dependability can be tested by controlledinjection of disturbances and faults. HIL also allows validation of the real hard-ware in an early development phase without the need for a prototype vehicle,since any missing vehicle components can be simulated. For these reasons, HILsimulations are more efficient and cheaper than test drives, and are extensivelyused for the development of vehicle control systems, such as ABS [20], enginecontrol systems [21], and semi-active suspension systems [22]. ADASs can alsobe tested in several HIL configurations, as will be discussed next.
As indicated in Fig. 3, in an early stage rapid control prototyping is carried
7

Extension to VEHILConventional HIL
d d d dd
to environment sensors
to vehicle state sensors
Real
Simulated
Artificial Artificial
Real
Simulated
Artificial
Simulated
Real Real
Simulated
Artificial Artificial
Simulated
Real
Real
Simulated
Artificial
Simulated
Real
Artificial
Sensors Controller Actuators Vehicle
Other traffic
Environment
Driver input
Fig. 4. Possible configurations for HIL simulations, where parts of the system maybe real, simulated or artificial. Feedback of signals from environment sensors andvehicle state sensors provides a closed-loop simulation. Additional disturbances d
can be injected by the operator to test the system’s dependability.
out with emulated control functions. This involves implementing a model ofthe desired controller in a prototype vehicle for the purpose of rapid proof-of-concept, controller testing, and parameter adjustments. Next, the hardwarecontroller can be tested in a HIL simulation for its real-time behaviour [23].This limited HIL setup can gradually be extended to include other modules,as the integration of the vehicle progresses. For instance, ADAS controllerscan be tested in a HIL simulation with real actuators [23] and real sensors[24], where all other components are simulated. However, a complex interfacebetween the simulated environment and the real sensor is necessary to generatea sensor signal. Yet another type of HIL simulation is a driving simulator,which creates an artificial environment for an ‘in-the-loop’ human driver [25].Driving simulators are useful for subjective evaluation of the ADAS and forfine-tuning ADAS controller settings.
Finally, the complete system can be real, including sensor, controller, actua-tor, and vehicle dynamics. This complete vehicle system is in interaction withthe road surface (through its actuators), as well as with the traffic environ-ment that is formed by other objects in the world (through its sensors). Sinceenvironment sensors should receive a real input, an artificial traffic environ-ment must be created to test an ADAS-equipped vehicle in a HIL simulation.Up to now, no such HIL environment has been available for testing completeintelligent vehicles.
8

2.5 Test drives
Test drives with prototype vehicles are always the final link in the validationchain to evaluate the system’s performance in the real world environmentthat it will finally be used in. However, the value of test drives for controlsystem design is limited, because test results are hard to reproduce and ofteninaccurate, due to the lack of ‘ground truth’ knowledge on the exact state(e.g., obstacle position) of the vehicles involved in the test. In addition, thesetests are often expensive, unsafe, time consuming, and heavily dependent onweather conditions [10] [23]. In the next section we therefore propose a solutionto combine the advantages of HIL simulations with the representativeness oftest drives, by extending the HIL environment from vehicle level to the trafficlevel, as indicated in Fig. 4.
3 Vehicle hardware-in-the-loop (VeHIL) simulations
To address the challenges mentioned in the previous section, we present anew method for the design and validation of intelligent vehicle systems: vehi-cle hardware-in-the-loop (VeHIL) simulations. VeHIL provides a solution fortesting a full-scale intelligent vehicle in a HIL environment [26]. This papersummarises the VeHIL working principle and discusses the added value of thisnew type of HIL simulations in the ADAS development process based on newtest results with an novel driver information and warning system.
3.1 Working principle of the VeHIL simulation
VeHIL constitutes a multi-agent simulator for intelligent vehicle systems, inwhich some of the simulated vehicles are replaced by real vehicles. These vehi-cles operate in an indoor laboratory that forms an artificial HIL environmentfor the intelligent vehicle. The environment sensors that are used in ADASs(radar, lidar, vision), collect relative position data in the absolute traffic envi-ronment. VeHIL therefore makes a transformation from the absolute motionof the objects in a traffic scenario to relative motion between those objects,as illustrated in Figures 5(a) and (b). Using only the relative motion betweena fixed intelligent vehicle and target vehicles allows to have a controlled andspace-efficient environment.
The software architecture of VeHIL is based on the multi-agent real-time sim-ulator developed by Papp et al. [27], as illustrated in the lower-right partof Fig. 7. This multi-agent framework consists of a collection of autonomous
9
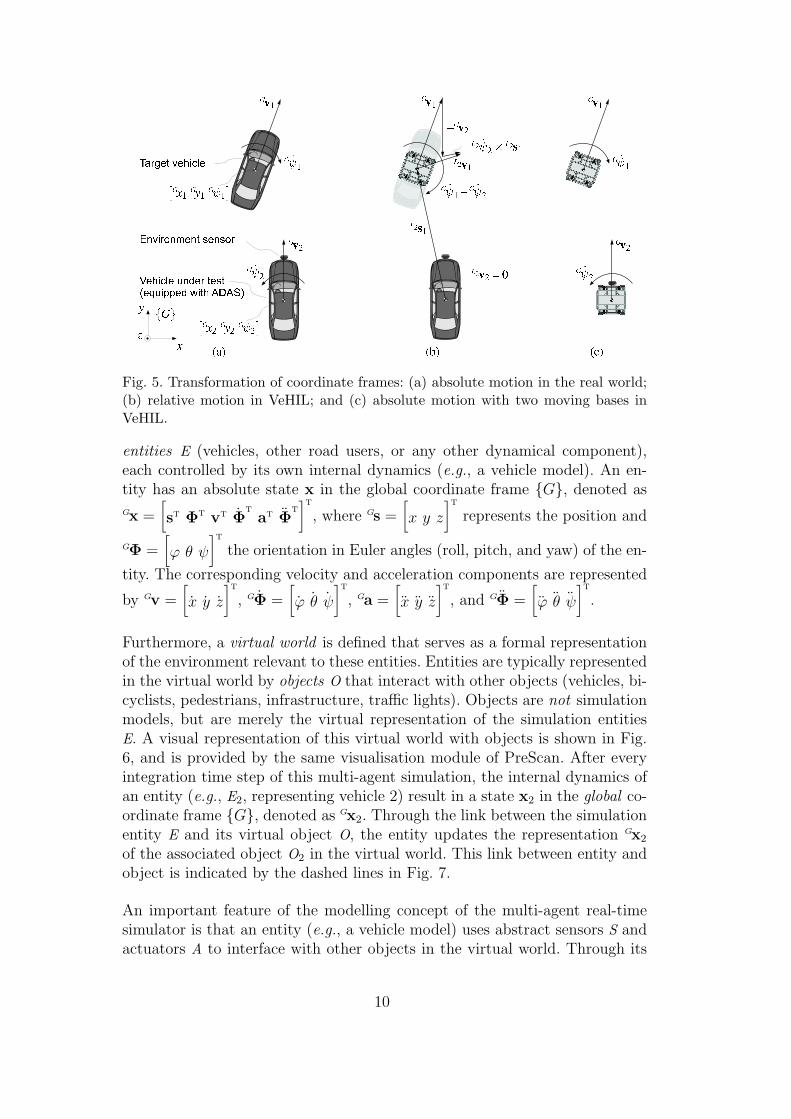
Fig. 5. Transformation of coordinate frames: (a) absolute motion in the real world;(b) relative motion in VeHIL; and (c) absolute motion with two moving bases inVeHIL.
entities E (vehicles, other road users, or any other dynamical component),each controlled by its own internal dynamics (e.g., a vehicle model). An en-tity has an absolute state x in the global coordinate frame {G}, denoted as
Gx =[
st Φt vt Φtat Φ
t]t
, where Gs =[
x y z
]t
represents the position and
GΦ =[
ϕ θ ψ
]t
the orientation in Euler angles (roll, pitch, and yaw) of the en-
tity. The corresponding velocity and acceleration components are represented
by Gv =[
x y z
]t
, GΦ =[
ϕ θ ψ
]t
, Ga =[
x y z
]t
, and GΦ =[
ϕ θ ψ
]t
.
Furthermore, a virtual world is defined that serves as a formal representationof the environment relevant to these entities. Entities are typically representedin the virtual world by objects O that interact with other objects (vehicles, bi-cyclists, pedestrians, infrastructure, traffic lights). Objects are not simulationmodels, but are merely the virtual representation of the simulation entitiesE. A visual representation of this virtual world with objects is shown in Fig.6, and is provided by the same visualisation module of PreScan. After everyintegration time step of this multi-agent simulation, the internal dynamics ofan entity (e.g., E2, representing vehicle 2) result in a state x2 in the global co-ordinate frame {G}, denoted as Gx2. Through the link between the simulationentity E and its virtual object O, the entity updates the representation Gx2
of the associated object O2 in the virtual world. This link between entity andobject is indicated by the dashed lines in Fig. 7.
An important feature of the modelling concept of the multi-agent real-timesimulator is that an entity (e.g., a vehicle model) uses abstract sensors S andactuators A to interface with other objects in the virtual world. Through its
10

Fig. 6. Visual representation of a cut-in scenario in the virtual world: an ACC-e-quipped vehicle drives on the middle lane, when suddenly one of the two precedingvehicles cuts in from the adjacent lane with a lower velocity.
Fig. 7. Schematic representation of the VeHIL closed-loop working principle. Everyintegration time step the simulation loop runs counterclockwise via the vehicle undertest, the chassis dyno, the multi-agent real-time simulator, and the moving base,whose motion is detected by the sensor of the vehicle under test.
abstract sensor S2 the entity E2 can collect information about the state Gx1
of another object O1 (i.e., vehicle 1, associated with E1) in the virtual world.Vice versa, the entity E2 has an abstract actuator A2 to act on the stateGx1 of O1. Note that these sensors and actuators are handled in an abstract
way: they have no dynamics and data processing features. Instead they canbe interpreted as queries and actions on the virtual world. Real sensors andactuators are modelled as part of the entity’s internal dynamics [19].
Using this simulation principle, the relative motion between vehicles 1 and 2(entities E1 and E2) from the viewpoint of vehicle 2 is obtained by a coordinatetransformation, where the state Gx1 of vehicle 1 is represented in the local
coordinate frame {L2} of vehicle 2, i.e.,L2x1. For the transformation to relative
11

position and orientation, we then get
L2s1 =L2
GR(Gs1 −
Gs2), (1)L2t1 =
L2
GtGt1, (2)
where L2
G R is the rotation matrix from frame {G} to {L2} and t representsthe orientation in Euler parameters (also known as quaternions) [28]. If weneglect vertical vehicle dynamics (z, ϕ, θ) and only consider relative motionin the horizontal plane (x, y, ψ), the coordinate transformation in (1) and(2) simplifies to
L2x1
L2y1
=
cos Gψ2 sin Gψ2
− sin Gψ2 cos Gψ2
Gx1
Gy1
−
Gx2
Gy2
, (3)
L2ψ1 =Gψ1 −
Gψ2. (4)
Please refer to Fig. 5 for a visual representation of this transformation. In asimilar way, the transformations to relative velocity (L2v1,
L2ψ1) and relativeacceleration (L2a1,
L2ψ1) are derived [28]. For brevity, these derivations areomitted here.
The simulation is run by execution of entities on computing nodes, whichare connected via a local area network. Each node has its own runtime envi-ronment, which also contains a representation of the virtual world. Entitiescommunicate with this virtual world via their abstract sensors and actua-tors. The ‘engine’ of the entity simulation is an integrator (numerical solver),which invokes the entity’s code (i.e., the vehicle model) in timely manner (syn-chronised with other entities in real-time). The implementation of the systemarchitecture is Java-based with time-critical parts in C/C++. An interface isestablished to Matlab/Simulink: C code compiled from Simulink modelscan be embedded into the runtime environment as entities. More details onthis modelling concept and the runtime environment are described in [27].
The multi-agent simulator provides the framework, in which any type of ve-hicle model can be simulated. The model complexity depends on the type ofADAS and the objective of the simulation. Based on the scenario categorisa-tion in [26], a scenario library is available that contains traffic scenarios, suchas car-following, tailgating, cut-ins, and lane-changes. The PreScan simulationtool, described in Section 2.2, is used for scenario definition and simulationbefore the actual VeHIL test takes place, based on the same multi-agent ap-proach.
12

Table 1Specifications of the chassis dyno.
Wheelbase 1.8m to 4.0m
Track width 1.2m to 2.4m
Drum configuration 4-wheel independent drive
Drum diameter 1592mm
Total peak power 832 kW
Traction force 24 kN
Response time < 10ms
Maximum velocity 250 km/h
Dynamic range passenger cars(500 to 3500 kg)
full dynamics, −10m/s2 to +10m/s2
Dynamic range commercial vehi-cles (≤12 000 kg)
reduced dynamics
3.2 Substitution of a vehicle dynamics model by a vehicle under test
With the ADAS-equipped vehicle and other road users modelled, the real-timesimulation could run as a MIL simulation only, i.e., a PreScan simulation with-out hardware. However, a vehicle model is usually not sufficient to accuratelyrepresent the ADAS-equipped vehicle. In order to test a real intelligent vehiclein a HIL configuration, the vehicle model of entity E2 is substituted by thereal vehicle under test (VUT), hence the term ‘vehicle hardware in-the-loop’.The ADAS-equipped VUT is therefore placed on a chassis dynamometer thatprovides a realistic load for the vehicle’s actuators (engine, brake system) andsensors (e.g., wheel speed sensors).
The dynamic response of the chassis dyno, depicted in Fig. 8, to driving actionsof the VUT must be representative of real road conditions, especially in termsof delay time and phase lag. The operating frequency of the multi-agent real-time simulator is 100Hz, which means that the delay time is at the mostan acceptable 10ms. The dynamics of a passenger vehicle typically has abandwidth in the 1Hz frequency range. This implies that the chassis dynomust at least have a bandwidth of about 5Hz in order to minimise positioningphase lag. Furthermore, an emergency stop of a passenger vehicle can causea maximum deceleration of around 10m/s2. Consequently, the chassis dynomust be able to achieve this as well.
These real-time requirements are met by a setup with four individual electricmotor driven drums. The chassis dyno can fully simulate a vehicle mass be-tween 500 and 3500 kg up to a maximum velocity of 250 km/h. The adjustable
13

Fig. 8. Vehicle under test with radar sensor at the front bumper, driving on thechassis dyno in VeHIL and supported by a rig at the front and back bumper.
(a) (b)
Fig. 9. Moving base: (a) without body and (b) with body.
wheelbase accommodates a wide range of vehicle types: apart from passen-ger vehicles, also trucks, busses, and other automated guided vehicles can betested. Table 1 summarises the main specifications.
Note that the VUT itself replaces the vehicle model and the chassis dyno onlyneeds to emulate the tire forces Ftire,x,ij that the VUT would encounter on theroad. Each force Ftire,x,ij is emulated by the drum moment of inertia Idrum andthe electric motor torque Tdrum,ij as
Ftire,x,ij =C0 + C1ωdrum,ij + C2ω
2
drum,ij + Idrumωdrum,ij − Tdrum,ij
Rdrum
, (5)
where the first three terms in the numerator represent friction losses in thechassis dyno, ωdrum,ij is the measured drum speed, and Rdrum the drum radius.From (5) the reference signals for the required motor torque are then calculated
14

as
Tdrum, ref,ij = Idrumωdrum,ij + C0 + C1ωdrum,ij + C2ω2
drum,ij − Ftire,x,ijRdrum, (6)
where Ftire,x,ij are observer estimated tire forces.
This setup also emulates the correct correlation between the individual drumspeeds:
ωdrum,ij =vwheel,x,ij
Rdrum
, (7)
to enable simulation of different wheel speeds when driving through curves,where vwheel,x,ij are the velocity components at the individual wheels. In ad-dition, a special restraint system that keeps the vehicle on top of the drumsallows realistic heave and pitch motions of the vehicle body, as depicted in Fig-ures 8 and 12(a). This rig produces a realistic dynamic vertical load transferbetween rear and front axle during acceleration and deceleration.
Finally, a road load simulation model estimates the VUT state vector Gx2,vut
using the chassis dyno measurements and updates the state Gx2 of the associ-ated object in the virtual world. No further interfacing between the real VUTand the simulation environment is necessary, such that the VUT can be testedas a black box system in a genuine HIL setup.
3.3 Substitution of a simulated target by a moving base
Similar to incorporation of the real VUT in a HIL simulation, surroundingroad users can be represented by a so-called moving base, depicted in Fig.9(a). The moving base is a 4-wheel driven, 4-wheel steered robot vehicle thatresponds to position commands of the multi-agent real-time simulator andemulates the motion L2x1 of other road users relative to the VUT, such thatthis motion is detected by the VUT’s environment sensor. For this purpose,the soft real-time simulator (Ethernet network) and the hard real-time chassisdyno and moving bases (CAN bus) are linked through dedicated interfaces,indicated in Fig. 7. In order to carry out the desired relative maneuvers, themoving base must be able to perform motions that are not possible with astandard car (e.g., sideways), as illustrated by the resulting velocity vectorL2v1 in Fig. 5(b). For this reason the individual wheels can be steered in arange of −350◦ to +350◦.
Like the chassis dyno, the moving base should also have a control bandwidth ofabout 5Hz in order to minimise positioning phase lag. In addition, the movingbase should be capable of accelerating with 10m/s2 in order to emulate therelative motion resulting from an emergency stop of the VUT. Finally, the topspeed, which in view of the relative VeHIL world corresponds to the maximum
15

Table 2Specifications of a moving base.
Vehicle mass (including body) 650 kg
Wheelbase 1.4m
Track width 1.4m
Chassis configuration 4-wheel independent drive/steerfrom −350◦ to +350◦
Installed power 52 kW
Battery pack 288 NiMH D-cells, 375V, 100 kg
Maximum velocity 50 km/h
Maximum longitudinal acceleration 10m/s2
Maximum longitudinal deceleration −10m/s2
Acceleration from 0 to 50 km/h 2.1 s
Maximum centripetal acceleration 12m/s2
relative velocity, should at least be equal to 50 km/h. This covers almost allhighway scenarios [26].
These requirements are met by a vehicle platform equipped with independentall-wheel steering and all-wheel drive, using battery-powered DC servomotors.The trajectory controller of the moving base realises the desired trajectoryxmb,ref(t), defined by the relative motion L2x1(t) of the target vehicle in thehorizontal plane. The only conditions are that the trajectory L2x1(t) fits withinthe dimensions of the VeHIL laboratory (200m by 40m) and meets the spec-ifications of Table 2. The moving base controller determines the drive torquesand steering torques so as to minimise the difference between the actual anddesired moving base position, such that a repeatable trajectory is achievedwithin a position error ε of at most 0.10m, depending on the dynamics of thescenario. The moving base navigation system uses a combination of a magnetgrid and odometry with a measurement accuracy of 0.04m, resulting in a totalpositioning accuracy of (0.10± 0.04)m. For more information on the designand control of the moving base, the reader is referred to the work by Ploeg et
al. [29] [30].
In order for the VUT to obtain realistic sensor data, the moving base isequipped with a vehicle body that represents similar target characteristicsas a real vehicle, see Fig. 9(b). Its radar cross section is similar to that ofa standard passenger car, and the body has a similar shape and reflectionproperties for testing vision and lidar systems.
Subsequently, the ADAS controller receives realistic input signals through its
16

vehicle state sensors and environment sensors, and outputs command signals tothe vehicle actuators (engine, brake) with a realistic actuator load, just as if theVUT was driving on the road. It must be emphasised that the actual movingbase motion in VeHIL is not known a priori, but is the real-time equivalentof the resulting relative motion between an autonomously simulated targetvehicle and an ADAS-controlled VUT. For example, when the VUT makes anemergency stop with deceleration a2,vut, the moving base accelerates forwardwith a1,mb = −a2,vut. In this way a closed-loop HIL simulation is obtained,such that the ADAS is validated in an artificial traffic environment, includingreal vehicle dynamics and real sensor input.
3.4 Representativeness of VeHIL
A fundamental aspect of a HIL test environment is that it provides a repeatableand representative testing environment. As we have demonstrated, the errorvariance and bandwidth of the moving base and chassis dyno are within thenoise levels of environment sensor systems, such that VeHIL can be regardedas a repeatable testing environment.
Furthermore, the input from the artificial VeHIL environment into the VUTmust be representative for the actual driving conditions on the road. A re-striction of the VeHIL simulation in this respect is that vehicle-based inertialsensors (accelerometers and yaw rate sensors) do not give a representativesignal, since the VUT is held at a stationary position. Another restrictionis that the chassis dyno does not produce correct lateral tire forces Ftire,y,ij
during steering actions of the VUT, since the slip angles of the front wheelsα1j equal the wheel angles δ1j. However, the resulting relative lateral and yawmotion can still be correctly emulated, as shown in Fig. 5(b). On the road,environment sensors can be perturbed by obstacles outside the relevant area(e.g., infrastructure elements outside the path of motion). Much of the effortin sensor post-processing is associated with filtering out these disturbances. InVeHIL these disturbances can be different from the real world or even absent,although the absence of these disturbances does not affect the basic operationof the ADAS.
To solve these issues, the HIL concept allows to feed the ADAS in real-timewith a ‘mixture’ of real and virtual sensor signals. Any missing sensor signalcan be generated from the real-time simulation of the vehicle model in themulti-agent real-time simulator (the internal dynamics of entity E2). This sig-nal then replaces the real sensor signal and is subsequently fed into the ADAScontroller, as schematically presented in Fig. 4. For example, imaging sensorsand detection algorithms could experience problems due to the absence ofmoving lane markings. Instead, simulated road scenarios can be projected on
17

a screen in front of the camera in real-time, as will be illustrated in Section 4.
Alternatively, inertial and environment sensors can be installed on a movingbase that executes a traffic scenario as if it were a standard road vehicle, whileanother moving base represents a target vehicle, as shown in Fig. 5(c). Thissetup also allows to obtain a relative velocity of up to 100 km/h, when twomoving bases drive towards each other.
Due to the absence of a realistic driving environment, VeHIL is not intendedto serve as a driving simulator, although it has potential to include driverinteraction, as will be illustrated in Section 4. VeHIL is therefore not meantto replace test drives, but focusses on repeatable and accurate testing of theADAS performance and dependability before ‘human-in-the-loop’ test drivestake place. In addition, VeHIL tests are used for those scenarios that are toodifficult or dangerous to perform on the road.
3.5 Added value of VeHIL in the development process of ADASs
By providing a world-wide unique HIL environment for intelligent vehicle sys-tems, the VeHIL laboratory offers a number of distinct advantages:
• Tests are performed in a repeatable and flexible way with high accuracy,since the moving bases are operated from a computer-controlled environ-ment. This allows precise variation of test parameters to assess the influenceof specific parameters and failure modes on the ADAS performance.
• Tests are safer, due to the absence of high absolute velocities. Further-more, traffic scenarios are monitored by a supervisory safety system, whichprevents any real collisions. This allows to test ADASs in safety-criticalscenarios.
• The costs of the validation process are reduced, because many tests areperformed in a short time frame. The VUT can drive for hours and becontinuously tested, which is not possible during test drives. Depending onthe complexity of the scenarios, up to 20 tests per hour can be performed,including scenario compilation, trial runs, test execution, and data acquisi-tion. A test cycle is therefore significantly faster than is possible with testdrives [10]. This will also be demonstrated in the case studies.
• Due to the high accuracy of tests, a high success rate for testing is obtained.
Because of these advantages, VeHIL complements the existing developmentprocess of ADASs in many phases and on many of the levels of the ‘V’-diagramof Fig. 3:
• Rapid control prototyping in VeHIL can help to define the system specifi-cations in an early development stage. In addition, based on safety-critical
18

maneuvers and fault injection, potential hazards can be analysed.• The flexible transition from MIL simulation in PreScan to HIL simulationin VeHIL allows a model-based development of the controller. Critical sce-narios that are identified with MIL simulations can be quickly uploaded inVeHIL for experimental testing. Test results can then be compared with thesimulation results for validation of sensor and vehicle models.
• On the module level the ability to combine high position accuracy with highand accurate relative speeds makes VeHIL an efficient tool in verificationand benchmarking of the exact performance of environment sensors (e.g.,sensor calibration).
• On the system level VeHIL especially facilitates the functional validation ofthe performance and dependability of complex black-box controllers againstobjective measures. Algorithm evaluation, fine-tuning, and benchmarkingcan be done efficiently.
• For production sign-off and certification purposes the high repeatability andability to deal with safety-critical applications make VeHIL a strong tool.
• Finally, VeHIL facilitates the transition from simulations to outdoor testdrives that are used to evaluate the real performance and dependability onthe road. These test drives can be performed with a much higher confidenceand less risk, when the ADAS has already been thoroughly tested in VeHIL.
We will demonstrate the suitability and added value of VeHIL in the nextsection with a case study.
4 Case study: Validation of a driver information and warning sys-tem
This section demonstrates the application of the validation methodology thatwas developed in [26] using VeHIL simulations. The subject in the presentcase study is a novel driver information and warning system for safe speed andsafe distance (SASPENCE), which has been developed within the IntegratedProject PReVENT (Preventive and Active Safety Applications), co-fundedby the European Commission under the Sixth Framework Programme [31].The goal of the PReVENT subproject SASPENCE is the development andevaluation of a ‘Safe Speed and Safe Distance’ application that supports thedriver in avoiding potentially dangerous situations and that improves drivercomfort [32]. The SASPENCE system should cooperate unobtrusively withthe driver by suggesting a safe speed and safe distance to keep, relative to thevehicle in front [33]. In addition, the system gives a speed advice, taking intoaccount speed limits, road infrastructure, and weather conditions.
19

Table 3Traffic scenarios and operating conditions for the SASPENCE system.
No.a Scenario description Warning level w
1 Host vehicle breaks speed limit 1
2 Critical weather conditions present (e.g., fog, heavyrain, snow)
1
3 Obstacle appears ahead, but not on the host path 0
4 Obstacle appears ahead on the host path, without be-ing dangerous
0
5 Obstacle appears ahead and could become dangerous 2
6 Obstacle appears ahead and is dangerous 3
7 On-coming vehicles approaching (on one-way ruralroad)
1
8 Host vehicle approaches hazardous infrastructure toofast (e.g., sharp bend, traffic light, or pedestrian cross-ing)
1
aSee Fig. 10 for an illustration of these scenarios (except scenario 7).
4.1 A system for safe speed and safe distance
Since speeding and tailgating are widespread traffic hazards, the SASPENCEsystem considers a wide range of traffic scenarios and operating conditions, aslisted in Table 3. Some of these scenarios are illustrated in Fig. 10. The tablealso indicates the corresponding system response in terms of the warning levelw. Warning level 0 means that no warning is given, level 1 is an informationmode, level 2 a mild warning, and level 3 an emergency warning.
Since the safety potential that is expected from a system capable to appropri-ately warn the driver in case of excessive speed and small headway looks verypromising [34], it is of paramount importance to accelerate the deploymentof such an ADAS. In order to have a system ready for the short-term mar-ket, the SASPENCE project aims to develop a low-cost system by combiningADAS components that are already available in modern passenger cars (suchas components for ACC, lane departure warning, and satellite navigation). Thecorresponding system architecture based on existing hardware components istherefore presented next.
The SASPENCE system is installed in a Fiat Stilo Multiwagon that servesas one of the two demonstrator vehicles for this project. In the system ar-chitecture of Fig. 11 several modules can be distinguished. The sensor arrayof the SASPENCE system consists of a long-range ACC radar for obstacle
20

Fig. 10. Overview of scenarios for the SASPENCE system.
communication
Long−range radar
Lane detectioncamera
Digital map
DGPS
Vehicle statesensors
Sensor fusion forobstacle
state estimation
Sensor fusion forroad geometry
estimation
Sensor fusion forhost vehicle
state estimation
Referencemaneuvercalculation
Warningand
inter−vention
strategies
Obstaclepath prediction
Host vehiclepath prediction
Visual warningdisplay
Audio warningsignals
Hapticaccelerator pedal
Vibratingseat belt
Sensor array Sensor fusion and scenario assessment HMI
Vehicle−to−vehicle
Fig. 11. System architecture of the SASPENCE system.
detection, mounted on the front of the vehicle. Lane recognition by videoimage processing is used to distinguish potentially dangerous obstacles fromobjects in adjacent lanes and on the side of the road. In addition, vehicle-to-vehicle communication enhances the selection of relevant targets. DifferentialGPS (DGPS) combined with digital map navigation is used for global stateestimation and for providing information on speed limits and relevant infras-tructure [35]. Several human-machine interface (HMI) channels are availableto provide information and warnings to the driver: a haptic accelerator pedal(trough force feedback and pedal vibration), a visual warning display, seatbelt vibration, and audio signals. In-vehicle networking between the sensorarray, the signal processing modules, and the HMI is primarily provided by adedicated CAN bus.
Sensor data is fused at multiple levels to provide an enhanced view of the envi-ronment. Sensor fusion of DGPS and vehicle state sensors based on extendedKalman filtering provides an estimate of the host vehicle’s global state Gx. Aprecise estimation of the road course ahead is created by fusion of navigationalmap points and lane detection information [36]. All detected vehicles are pro-jected into the estimated road geometry to determine their relative positionsto the host vehicle and their predicted paths [37].
The output of the sensor fusion and path prediction modules is then used to
21

compute an optimal reference maneuver by solving the optimisation problem
J =1
S
S∫
0
f(
x(s),u(s))
ds, (8)
subject to a given set of inequality constraints (used to impose trajectory con-straints) and equality constraints (includes the vehicle model with x(s) thevehicle state vector). The functional J has to be minimised over the plan-ning distance interval [0, S ] by finding the control functions u(s) (steering,throttle, and brake input). The penalty function f (x(s),u(s)) is used to de-fine the driving style. In addition, the penalty function can be considered arisk performance measure, where the integral is a measure for the risk level ofthe maneuver. Apart from these safety considerations, requirements for useracceptance and mobility are included in the penalty function. This allows theSASPENCE system to compute an appropriate speed and safe distance to thepreceding vehicle, as well as to consider speed limits and weather conditions.
The optimal reference maneuver is then compared to the predicted path of thehost vehicle. In case the difference crosses a threshold, the system intervenesby giving information and/or warnings to the driver. The warning and inter-vention module computes the appropriate warning type and warning level,and directs this to the available HMI channels. For more information on thecalculation of the reference maneuver for the SASPENCE system, we referto the work by Biral et al. [38]. In the remainder of this section we focus onthe validation of the system’s capability for giving appropriate and reliablewarnings in response to potentially dangerous obstacles ahead.
4.2 Definition of the validation objectives
The first step in the validation process is to define suitable evaluation cri-teria from the system requirements, with emphasis on measures that relateto an appropriate interaction with the driver. The dependability is assessedthrough the missed alarm rate pfn and false alarm rate pfp. For each individ-ual scenario j, these performance measures are calculated by comparison ofthe output of the SASPENCE system wj with a reference system wref,j, whichgives information on the warning level and when it should be given from theperspective of an average attentive driver. This reference warning is based onempirical data from the CAMP project [39], that indicates the most appro-priate warning time and warning level of a forward collision warning systemfor a representative set of drivers.
The associated dependability can then be estimated according to the method-ology of Gietelink [26]. Furthermore, the timeliness of a scenario j indicates
22

to what extent the warning is given too soon or too late:
etime,j = twarn,j − tref,j (9)
with twarn,j the first sample for which wj > 0 (i.e., a warning) and tref,j thefirst sample for which wref,j > 0.
The impact of the system on traffic safety and driver comfort is validated bycomparing a scenario where a driver is assisted by the SASPENCE systemto the same scenario where the SASPENCE system is not operational. Thesafety is measured in terms of the minimum time-to-collision (TTC) duringthe scenario and the comfort in terms of the RMS value of the longitudinalacceleration.
With respect to the dependability of the system, we require a maximum falsealarm rate pfp in the order of 1 · 10−4, and a maximum missed alarm ratepfn in the order of 1 · 10−3. These values are chosen in accordance with thestate-of-the-art values discussed in Section 2. The objective of this case studyis to validate the comfort, performance, and dependability of the warningfunctions of the SASPENCE system against the system requirements. Thesystem must conform to the requirements for a representative set of trafficscenarios, operating conditions, and driver characteristics.
The value of these performance measures for a particular traffic scenario j ob-viously depends on the perturbations imposed by that scenario. Based on thesystem specifications [35], a parameter set is defined, composed of traffic sce-narios, operating conditions, sensor characteristics, and driver characteristics.For the traffic scenario parameters we use the microscopic traffic model devel-oped in [26]. The measurement noise of the environment sensors is taken fromthe system specifications [33]. The driver is modelled for conventional car-following behaviour after the Gipps model [40], using three different drivertypes: conservative, intermediate, and aggressive drivers.
4.3 Functional validation with VeHIL tests
Obviously, in practice simulations have their limitations with regard to thecredibility of the results. Driving simulator tests have therefore been carriedout in [41], but these do not take into account the actual hardware of thevehicle and the SASPENCE system. On the other hand, driving tests withthe demonstrator vehicles have also been performed [42], but they are lim-ited in their ability to test safety-critical scenarios. To provide a preliminaryfunctional validation of the SASPENCE system in an early stage of its de-velopment, the most critical scenarios that were identified with the simulatorstudy are therefore selected to be reproduced in the VeHIL laboratory.
23

(a) (b)
Fig. 12. VeHIL laboratory setup: (a) the SASPENCE vehicle is set up on the chassisdyno (beneath the floor), and approaches another road user, represented by themoving base; (b) the real-time traffic scene is projected on a display in front ofthe camera system (located behind the rear-view mirror), while a preliminary HMIdisplay shows the output of the SASPENCE system.
As shown in Fig. 12(a), the Fiat demonstrator vehicle is mounted on thechassis dyno to emulate the tire-road interaction and the moving base is usedto emulate the preceding vehicle. The visual input to the camera system isemulated by projecting a real-time animation of the traffic scene in front ofthe camera, as shown in Fig. 12(b). Similarly, DGPS satellite navigation andvehicle-to-vehicle communication are emulated by a real-time ethernet linkfrom the real-time simulation environment.
Since the SASPENCE system is a driver warning system, a closed-loop config-uration requires that a driver reacts to warnings and takes appropriate action.The prototype vehicle is therefore instrumented with a driving robot, con-sisting of two actuators to control the brake and throttle pedal positions. Thedriving robot is linked to the driver model, as illustrated in Fig. 13. The drivermodel receives real-time information on the host absolute state G
′
x2 and therelative target motion L2x1 from the simulation environment. The driver modelalso receives the warning level w from the SASPENCE system, such that itcan calculate a desired speed vref , which is sent to the actuator controller ofthe driving robot. Hence, the experiment is a closed-loop hardware-in-the-loopsimulation. The flow of information between these components is illustratedin the schematic diagram in Fig. 13.
Using the results of the simulation study, a test schedule has been developedfor a representative set of traffic scenarios. The test schedule is biased towardsscenarios that are considered more critical, i.e., with a lower value for the min-imum TTC, as obtained from the simulation study. Correspondingly, scenarioparameters are selected, such as the velocities v1(0) and v2(0), target accel-eration a1, initial distance xr(0), and initial lateral offset yr(0). Fig. 14 showsan overview of these parameters, where the SASPENCE vehicle, driving at
24

Fig. 13. Schematic representation of the closed-loop VeHIL setup for theSASPENCE vehicle. The inputs from the driver, camera, DGPS, and vehicle-to-ve-hicle communication (VVC) are emulated from the real-time simulation environ-ment, whereas the relative motion for the radar sensor is emulated by the movingbase.
Fig. 14. Overview of the scenario parameters in an approach scenario.
a velocity v2, approaches a slower target vehicle, driving at v1. The resultingrelative motion for the moving base is vmb = vr = v1 − v2. Around 150 testswere carried out, for each of which the performance criteria were calculated.For comparison of the VeHIL experimental results with the PreScan simula-tion results, the approach scenarios (Scenario 5) were carried out both with
and without the SASPENCE system. On a test track it would be very difficultto safely and reproducibly carry out such a test with human drivers, but inVEHIL the scenario can be accurately reproduced.
4.4 Experimental results
Fig. 15 illustrates these VeHIL test results for a typical approach scenario withthe SASPENCE-equipped vehicle approaching a slower target vehicle. Theinitial velocities for this test are vvut(0) = v2 = 33.3m/s and v1(0) = 22.2m/s,and the initial distance xr(0) = 0. It can be seen that at t = 5.1 s, the time-to-collision drops below 6 s, which causes the reference algorithm to give a
25

0 5 10 15 20 25
0 5 10 15 20 25
0 5 10 15 20 25
0 5 10 15 20 25
100
50
0
20
0
5
0
−5
10
5
0
3
2
1
05 10 15 20 250
[s]Time
Warn
ing
[−]th
TT
Ct
[s]
[s]a
2[m
/s]
v[k
m/h
][m
]r
x
w
w ref
t
th
TTC
a
aVUTMB
v
v 1VUT
x
xr,realr,radar
Fig. 15. VeHIL test results for an approach scenario.
warning signal wref . However, only at t = 7.5 s the SASPENCE system gives awarning, after which the driving robot decelerates the vehicle. As the vehicledecelerates, the TTC rises again from t = 9.3 s onwards, indicating that acollision is being averted. Correspondingly, the reference signal wref disappears.However, the SASPENCE warning signal w remains present, and the warninglevel is even increased at t = 11.8 s, even though the distance xr is increasingagain.
Of course, the choice of the reference model is quite arbitrary, and a more con-servative or a more sensitive algorithm might be selected. Nevertheless, thedifference between the reference warning wref and the SASPENCE warning wis used to illustrate the dependability validation. Fig. 16 shows the distribu-tion of the timeliness of the warning. On average, the SASPENCE warning isgiven at approximately the same time instance as the reference warning, whichindicates that the reference warning wref has acceptable behaviour. However,the time difference ranges between 5 s too soon and 5 s too late. This varietyin warning timeliness means that the presence or absence of a warning mightbe interpreted by the driver as a false or missed alarm.
26

0 2 4 6 8−8 −6 −4 −2
Timeliness [s]
10
8
6
4
2
0
Nu
mb
er o
f tes
ts
Fig. 16. Distribution of the timeliness of the warning (negative means too soon,positive too late).
If we look again at Fig. 15, the lack of a SASPENCE warning in the timeinterval t = [5.1, 7.5] indicates a missed alarm. Similarly, the time interval[9.3, 12.7] indicates a false alarm. By combining the test results for all scenar-ios, it is possible to obtain a representative overview of the dependability ofthe SASPENCE system. The results show that the estimated missed alarmrate is pfn = 0.021 and the estimated false alarm rate pfp = 0.011, i.e., thereliability measures are all in the order of 10−2.
These results show that in practice the dependability and timeliness of theSASPENCE warning function must be improved. This could also be observedduring the VeHIL tests, where occasionally the SASPENCE system did notconsider safety-critical scenarios threatening. Vice versa, warnings were some-times given, even when the preceding vehicle did not pose any threat (it wasfar away or driving away from the vehicle under test). Because of the inher-ent trade-off between false and missed alarms for a given detection accuracy,it is not possible to simply lower or raise the obstacle detection thresholds.Instead, the path prediction and reference maneuver algorithms should befurther fine-tuned to reduce the above-mentioned probabilistic values.
Despite the fact that the dependability of the system must be improved, theeffectiveness of SASPENCE in terms of traffic safety and driver comfort canstill be validated for the scenarios with a correct alarm. For this purposethe experimental results are compared for scenarios with and without theSASPENCE system, as well as for different driver types (conservative, mediumor aggressive), considering equal initial conditions for all six experiments.
In Table 4, the minimum TTC that occurs during an approach scenario isdisplayed for different driver types. From the table it can be concluded that
27

Table 4VeHIL test results for the minimum TTC [s] at different initial relative velocitiesvr(0) [m/s] for different drivers.
Initial relative velocity vr(0) [m/s]
Driver type SASPENCE −2.8 −5.6 −8.3 −11.1 −13.9
Conservativeoff * 7.35 7.22 2.89 4.76
on 20.22 13.79 9.41 6.85 4.84
Intermediateoff 11.83 7.15 5.33 3.87 1.86
on 16.00 9.77 7.21 5.18 3.87
Aggressiveoff 12.17 2.01 3.40 4.18 *
on * * * 1.84 2.98
*Data not available.
Table 5VeHIL test results for the RMS of the longitudinal acceleration [m/s2] at differentinitial relative velocities vr(0) [m/s] for different drivers.
Initial relative velocity vr(0) [m/s]
Driver type SASPENCE −2.8 −5.6 −8.3 −11.1 −13.9
Conservativeoff * 0.64 0.87 0.71 0.88
on 0.17 0.15 0.26 0.70 0.99
Intermediateoff 0.48 0.10 0.80 0.90 1.00
on 0.11 0.17 0.26 0.69 1.05
Aggressiveoff 0.24 0.66 0.64 0.97 *
on * * * 0.62 1.12
*Data not available.
the SASPENCE system has a positive effect on the safety of conservativeand medium drivers, since the minimum TTC increases for them. Not enoughconsistent results for the aggressive driver were available to validate the benefitof the system for these drivers.
The effect that the SASPENCE system has on comfort is expressed in the RMSvalue of the longitudinal acceleration. VeHIL test results are given in Table 5.This table shows that the RMS value of the acceleration generally decreaseswhen using the SASPENCE system, which means that the SASPENCE systemalso increases driver comfort.
28

4.5 The role of test drives
Obviously, in the end outdoor test drives are still necessary to evaluate thesystem’s performance on the road and to provide a subjective assessment ofthe SASPENCE system. However, these tests can now be focussed on specificproblem areas, since the system has already been thoroughly tested for a largenumber of scenarios in PreScan and VeHIL. These test drives can be used toevaluate the performance and dependability over a longer period of time. Thiswill serve as validation of the expected probabilistic values from the simulationstudy and the VeHIL test results. In addition, test drives will be used to assigna subjective rating to the system and to test the HMI. It is a topic of ongoingresearch to carry out these test drives and to compare the test results withthose presented in this chapter [42].
5 Conclusions
This paper has presented the new VeHIL concept for testing ADASs, where areal intelligent vehicle is operated in a HIL environment. VeHIL experimentsare performed in an accurate, reproducible, and controllable way to create arepresentative test environment. Furthermore, tests are performed more effi-ciently than with outdoor test drives, and test scenarios can be varied veryeasily, due to the connection to the underlying simulation environment.
It was demonstrated that VeHIL has an added value in the development pro-cess of an ADAS, using a case study of a driver information and warningsystem for safe speed and safe distance (SASPENCE). Results of the VeHILexperiments show that the warning and intervention strategies need to befine-tuned to further improve the dependability of the system. Based on thesefindings, the scenario assessment modules of the SASPENCE system can bemodified.
Subsequent test drives can then be performed with a much higher confidence inthe system, since the SASPENCE system has already been thoroughly testedin VeHIL. VeHIL is therefore not meant to replace MIL simulations and testdrives, but to form an efficient link between them. Consequently, the numberof iteration loops in the development process is reduced, saving on time andcosts.
29

References
[1] International Road Traffic Database (IRTAD).
[2] S. Shladover, Review of the state of development of advanced vehicle controlsystems, International Journal of Vehicle System Dynamics 24 (6–7) (1995)551–595.
[3] R. Bishop, Intelligent Vehicle Technology and Trends, Artech House, Norwood,MA, USA, 2005. ISBN: 1-58053-911-4.
[4] P. Zador, S. Krawchuk, R. Voas, Automotive collision avoidance system (ACAS)program, Final Report DOT HS 809 080, DOT/NHTSA, Washington, DC, USA(Aug. 2000).
[5] H. Jagtman, V. Marchau, T. Heijer, Current knowledge on safety impactsof Collision Avoidance Systems (CAS), in: P. Herder, W. Thissen (Eds.),Proceedings of the 5th International Conference on Technology, Policy andInnovation, Delft, 2001, paper number: 1152.
[6] J. Golias, G. Yannis, C. Antoniou, Classification of driver-assistance systemsaccording to their impact on road safety and traffic efficiency, Transport Reviews22 (2) (2002) 179–196.
[7] H. Winner, S. Witte, W. Uhler, B. Lichtenberg, Adaptive cruise control systemaspects and development trends, SAE Technical Paper Series 961010.
[8] M. Flament, Integrated passive and active safety solutions, in: Proceedings ofthe 5th European MADYMO User Meeting, Cambridge, UK, 2005.
[9] NHTSA, Automotive collision avoidance system field operational test (ACASFOT), Final Program Report DOT HS 809 866, DOT/NHTSA, Washington,DC, USA (May 2005).
[10] R. Kiefer, D. LeBlanc, M. Palmer, J. Salinger, R. Deering, M. Shulman,Development and validation of functional definitions and evaluation proceduresfor collision warning/avoidance systems, Final Report DOT HS 808 964,DOT/NHTSA, Washington, DC, USA (Aug. 1999).
[11] P. Seiler, B. Song, J. Hedrick, Development of a collision avoidance system,SAE Technical Paper Series 98PC-417.
[12] A. Doi, T. Butsuen, T. Niibe, T. Yakagi, Y. Yamamoto, H. Seni, Developmentof a rear-end collision avoidance system with automatic braking control, JSAEReview 15 (4) (1994) 335–340.
[13] J. Pimentel (Ed.), Safety-Critical Automotive Systems, No. PT-103, SAEInternational, Warrendale, PA, USA, 2006. ISBN: 0-7680-1243-0.
[14] R. Isermann, Mechatronic Systems, Springer-Verlag, London, 2003. ISBN: 1-85233-693-5.
30

[15] J. Schwarz, editor, Code of Practice for the design and evaluation of ADAS,RESPONSE 3 – PReVENT subproject, Brussels, Belgium (Oct. 31, 2006).
[16] International Organization for Standardization (ISO), Transport informationand control systems — forward vehicle collision warning systems — performancerequirements and test procedures, ISO Standard 15623, First edition 2002-10-01, Geneva, Switzerland (2002).
[17] R. Abou-Jaoude, ACC radar sensor technology, test requirements, and testsolutions, IEEE Transactions on Intelligent Transportation Systems 4 (3) (2003)115–122.
[18] C. Hote, Abstract interpretation techniques for software testing, BusinessBriefing: Global Automotive Manufacturing & Technology (2002) 1–7.
[19] Z. Papp, K. Labibes, A. Thean, M. van Elk, Multi-agent based HIL simulatorwith high fidelity virtual sensors, in: Proceedings of the IEEE IntelligentVehicles Symposium (IV), Columbus, OH, USA, 2003, pp. 213–219.
[20] J. Li, F. Yu, J.-W. Zhang, J.-Z. Feng, H.-P. Zhao, The rapid development ofa vehicle electronic control system and its application to an antilock brakingsystem based on hardware-in-the-loop simulation, Proceedings of the Institutionof Mechanical Engineers – Part D: Journal of Automobile Engineering 216(2002) 95–105.
[21] R. Isermann, J. Schaffnit, S. Sinsel, Hardware-in-the-loop simulation for thedesign and testing of engine-control systems, Control Engineering Practice 7 (5)(1999) 643–653.
[22] R. Isermann, Diagnosis methods for electronic controlled vehicles, InternationalJournal of Vehicle System Dynamics 36 (2–3) (2001) 77–117.
[23] K. Athanasas, C. Bonnet, H. Fritz, C. Scheidler, G. Volk, VALSE – validation ofsafety-related driver assistance systems, in: Proceedings of the IEEE IntelligentVehicles Symposium (IV), Columbus, OH, USA, 2003, pp. 610–615.
[24] K. Yi, M. Woo, S. Kim, S. Lee, Study on a road-adaptive CW/CA algorithmfor automobiles using HiL simulations, JSME International Journal Series C –Mechanical Systems Machine Elements and Manufacturing 42 (1) (1999) 163–170.
[25] G. Reymond, A. Heidet, M. Canry, A. Kemeny, Validation of Renault’s dynamicsimulator for adaptive cruise control experiments, in: Proceedings of the DrivingSimulation Conference (DSC2000), Paris, France, 2000, pp. 181–192.
[26] O. Gietelink, Design and validation of advanced driver assistance systems,T2007/11, TRAIL Thesis Series, Delft University of Technology, Delft, TheNetherlands (Nov. 2007).
[27] Z. Papp, M. Dorrepaal, D. Verburg, Distributed hardware-in-the-loop simulatorfor autonomous continuous dynamical systems with spatially constrainedinteractions, in: Proceedings of the 11th IEEE/ACM International Workshopon Parallel and Distributed Real-Time Systems, Nice, France, 2003.
31

[28] J. Craig, Introduction to Robotics, Mechanics and Control, 3rd Edition,Addison-Wesley, Boston, MA, USA, 2004. ISBN: 0-20110-326-5.
[29] J. Ploeg, A. van der Knaap, D. Verburg, ATS/AGV, design, implementation andevaluation of a high performance AGV, in: Proceedings of the IEEE IntelligentVehicles Symposium (IV), Vol. 1, Versailles, France, 2002, pp. 127–134.
[30] J. Ploeg, J. Vissers, H. Nijmeijer, Control design for an overactuated wheeledmobile robot, in: Proceedings of the 4th IFAC Symposium on MechatronicSystems (MECHATRONICS 2006), Heidelberg, Germany, 2006.
[31] Integrated Project PReVENT – Preventive and Active Safety Applications.
[32] PREVENT-SASPENCE Consortium, SASPENCE project description –appendix of PReVENT Technical Annex, European Commission, IPPReVENT, Subproject SASPENCE, Brussels, Belgium (2003).
[33] F. Tango, A. Saroldi, System specifications, Deliverable D20.34, EuropeanCommission, IP PReVENT, Subproject SASPENCE, Brussels, Belgium (Jun.9, 2005).
[34] F. Tango, A. Saroldi, Towards a new approach in supporting drivers function:specifications of the SASPENCE system, in: Proceedings of the 5th EuropeanCongress and Exhibition on Intelligent Transport Systems and Services (ITS),Hannover, Germany, 2005, pp. 614–620.
[35] M. Alonso, P. Garayo, L. Herran, Functional requirements, Deliverable D20.33,European Commission, IP PReVENT, Subproject SASPENCE, Brussels,Belgium (Nov. 30, 2004).
[36] H. Weigel, H. Cramer, G. Wanielik, A. Polychronopoulos, A. Saroldi, Accurateroad geometry estimation for a safe speed application, in: Proceedings of theIEEE Intelligent Vehicles Symposium (IV), Tokyo, Japan, 2006, pp. 516–521.
[37] N. Floudas, M. Tsogas, A. Amditis, H. Weigel, Positioning and path predictionfor scenario assessment of safe speed system, in: Proceedings of the 14th WorldCongress on Intelligent Transport Systems and Services (ITS), Beijing, P.R.China, 2007.
[38] F. Biral, M. Da Lio, E. Bertolazzi, Combining safety margins and userpreferences into a driving criterion for optimal control-based computation ofreference maneuvers for an ADAS of the next generation, in: Proceedings ofthe IEEE Intelligent Vehicles Symposium (IV), Las Vegas, NV, USA, 2005, pp.36–41.
[39] R. Kiefer, M. Cassar, C. Flannagan, D. LeBlanc, M. Palmer, R. Deering,M. Shulman, Forward Collision Warning Requirements Project Task 1, FinalReport DOT HS 809 574, DOT/NHTSA, Washington, DC, USA (Jan. 2003).
[40] P. Gipps, Behavioural car-following model for computer simulation,Transportation Research B 15B (2) (1981) 105–111.
32

[41] L. Bruel, J.-P. Colinot, E. Adell, A. Varhelyi, M. Dalla Fontana,M. D’Alessandro, HMI tests in simulator, Deliverable D20.54, EuropeanCommission, IP PReVENT, Subproject SASPENCE, Brussels, Belgium (Jul.4, 2006).
[42] O. Gietelink, M. Lammers, S. Jansen, SASPENCE validation results,Deliverable D20.70, European Commission, IP PReVENT, SubprojectSASPENCE, Brussels, Belgium, to be published (2007).
33