development of a decision support system using data...
TRANSCRIPT
www.elsevier.com/locate/autcon
Automation in Construction 13 (2004) 525–542
Development of a decision support system using data warehousing
to assist builders/developers in site selection
Irtishad Ahmada,*, Salman Azharb, Pranas Lukauskisc
aDepartment of Construction Management, Florida International University, Miami, FL, USAbDepartment of Civil and Environmental Engineering, Florida International University, Miami, FL 33174, USA
cLukas Construction LLC, Bonita Springs, FL, USA
Accepted 11 March 2004
Abstract
Site selection process depends on a number of spatial and business-related factors, making it a complex decision-making
task. It is common for the decision makers to use their subjective judgment and gut feelings based on their experience in
selecting the most appropriate site for development. The reason is that data for site selection originate from varied sources and
are not organized in a format that decision makers can readily use to derive any meaningful information. One possible solution
of this problem is to develop a decision support system (DSS) to help retrieve data from different databases and information
sources and analyze them in order to provide useful and explicit information. Based on this concept, a DSS is presented in this
paper as an aid to builders/developers in site selection for residential housing development. The prototype DSS is developed
using data warehousing technology, which is a fairly recent database management technique. It is an improved approach for
integrating data from multiple, often very large, distributed, heterogeneous databases and other information sources. Data
warehousing is based on online analytical processing (OLAP) concept. The OLAP analyzes data using special data warehousing
schemas and enables users to view data using any combination of variables. The users can also generate data trends over a
period of time to make any forecasts. First reviewed in this paper are the concepts of data warehousing, OLAP and advantages
of the data warehouse over traditional databases in the context of decision making. Next, a step-by-step methodology is
presented to illustrate the different stages of the prototype DSS development. The DSS design is illustrated with particular
emphasis on the development of data warehousing schemas and analytical processing techniques. The prototype DSS has been
developed with input and refined with feedback obtained from selected local builder/developer companies. Finally, the
application of the prototype DSS for selecting the most appropriate residential site for development from among a list of several
available sites is presented.
D 2004 Elsevier B.V. All rights reserved.
Keywords: Decision support system (DSS); Data warehouse; Online analytical processing (OLAP); Site selection; Land development
0926-5805/$ - see front matter D 2004 Elsevier B.V. All rights reserved.
doi:10.1016/j.autcon.2004.03.001
* Corresponding author. Tel.: +1-305-348-3045; fax: +1-305-
348-6255.
E-mail address: [email protected] (I. Ahmad).
1. Introduction
The selection of a suitable piece of land for
development is the first and foremost challenge to
builders/developers. The factors that influence the
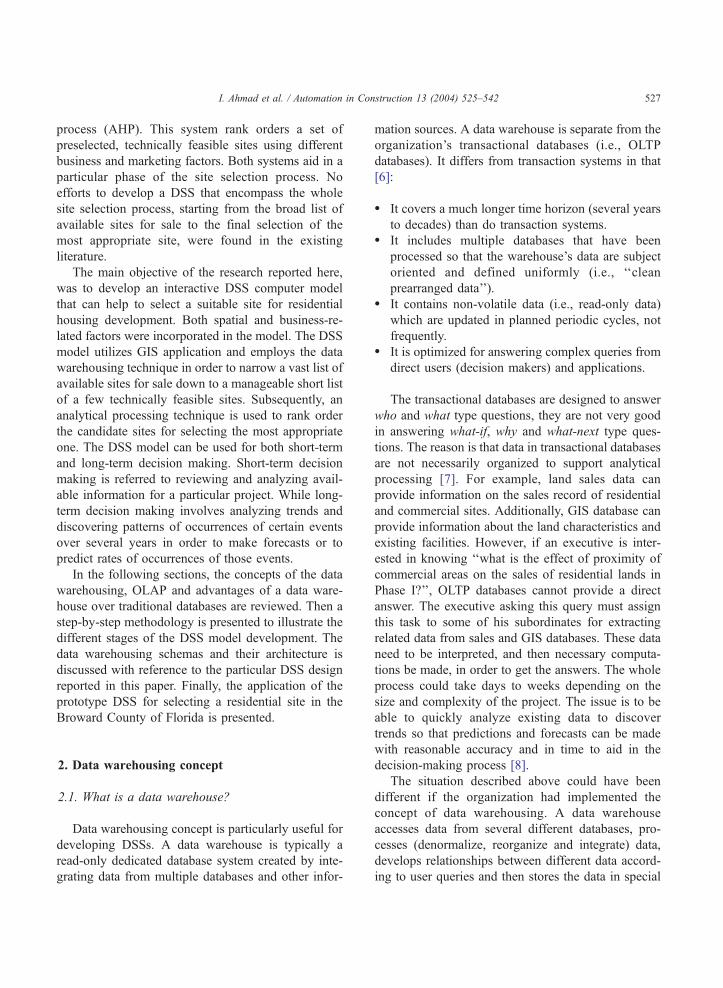
Table 1
Comparison of OLAP and OLTP (adapted form Ref. [6])
Characteristics OLAP OLTP
Operation Analyze Update
Level of detail Aggregate Detail
Time Historical,
current,
projected
Current
Orientation Attributes Records
I. Ahmad et al. / Automation in Construction 13 (2004) 525–542526
process of residential site selection include cost of
land and appreciation trend, location of existing
serviced areas, zoning and environmental regulations,
physical and geological characteristics of the land,
demographic characteristics, proximity to hospitals,
public schools and other facilities, and possibilities of
the site being of archeological significance or con-
taminated. Despite the availability of accurate and
reliable data, top executives are found to make deci-
sions regarding site selection on the basis of their
experience and gut feelings. The reason is that they
often have to make quick decisions. The data are
usually very large, complex and not organized in a
suitable format helpful to decision makers for extract-
ing any meaningful information without help of
database technicians. Moreover, strategic decision
making requires analysis of data of several years to
derive conclusive trends or patterns of land sale.
Existing databases and their formats are not designed
to efficiently and directly provide such information to
decision makers. In situations like this, a decision
support system (DSS) using data warehousing tech-
nology can be useful to decision makers, or executives
in building/land-developing companies in making
quick and critical decisions during crucial site selec-
tion process.
Data warehousing is a fairly recent development in
the field of database and information systems (IS).
Conceptually, a data warehouse is a read-only data-
base created by combining data from multiple data-
bases for purposes of analysis [1]. A data warehouse
literally warehouses information about an organiza-
tion or process in a secured computing systems
environment and allow multiple users to extract
meaningful, consistent and accurate data for decision
making [2].
Builder/developer companies typically deal with
large volumes of data containing valuable information
about land characteristics, existing land development
projects, land sales records, etc. These data are nor-
mally stored in operational databases that are not
easily accessible to decision makers or executives in
usable forms and formats. A majority of database
management systems used in these organizations are
based on the concept of online transaction processing
(OLTP). OLTP databases are designed to handle
individual records of land characteristics, lands sale,
accounting and other similar operations. These data-
bases are updated continually on a regular basis and
are suitable to support day-to-day business operations.
OLTP databases cannot provide a direct answer to
many questions or queries asked at the executive
level, such as the what-if and what-next type ques-
tions. Decision makers at this level would like to
quickly analyze existing data to discover trends so that
predictions and forecasts can be made with reasonable
accuracy and in time to aid in the decision-making
process. However, existing databases cannot provide
such information quickly and efficiently. The concept
of data warehousing provides a powerful mechanism
to solve such information access problems. Data
warehousing is based on the idea of online analytical
processing (OLAP) as opposed to OLTP. Basically,
this technology supports reorganization, integration
and analysis of data that enable users to access
information quickly and accurately [3]. Table 1 shows
a comparison between OLTP and OLAP. In nutshell,
OLAP is an analyst’s tool used for planning and
decision making.
There have been prior efforts to develop DSS for
assistance in site selection. For instance, Oloufa et al.
[4] developed an integrated information management
system for site investigation using a Geographical
Information System (GIS). Their system assists a user
to rank order potential sites by visually correlating
subsurface conditions to corresponding surface geo-
graphic locations. The system provides partial assis-
tance in the site selection process as it only considers
the subsurface conditions. The site selection process,
however, depends on a number of other factors such
as the location of existing serviced areas, zoning and
environmental regulations, demographic characteris-
tics, etc. that are not considered in this system.
McIntyre and Parfitt [5] developed another DSS for
selecting the most appropriate site among a set of
candidate sites by using the analytical hierarchy
I. Ahmad et al. / Automation in Construction 13 (2004) 525–542 527
process (AHP). This system rank orders a set of
preselected, technically feasible sites using different
business and marketing factors. Both systems aid in a
particular phase of the site selection process. No
efforts to develop a DSS that encompass the whole
site selection process, starting from the broad list of
available sites for sale to the final selection of the
most appropriate site, were found in the existing
literature.
The main objective of the research reported here,
was to develop an interactive DSS computer model
that can help to select a suitable site for residential
housing development. Both spatial and business-re-
lated factors were incorporated in the model. The DSS
model utilizes GIS application and employs the data
warehousing technique in order to narrow a vast list of
available sites for sale down to a manageable short list
of a few technically feasible sites. Subsequently, an
analytical processing technique is used to rank order
the candidate sites for selecting the most appropriate
one. The DSS model can be used for both short-term
and long-term decision making. Short-term decision
making is referred to reviewing and analyzing avail-
able information for a particular project. While long-
term decision making involves analyzing trends and
discovering patterns of occurrences of certain events
over several years in order to make forecasts or to
predict rates of occurrences of those events.
In the following sections, the concepts of the data
warehousing, OLAP and advantages of a data ware-
house over traditional databases are reviewed. Then a
step-by-step methodology is presented to illustrate the
different stages of the DSS model development. The
data warehousing schemas and their architecture is
discussed with reference to the particular DSS design
reported in this paper. Finally, the application of the
prototype DSS for selecting a residential site in the
Broward County of Florida is presented.
2. Data warehousing concept
2.1. What is a data warehouse?
Data warehousing concept is particularly useful for
developing DSSs. A data warehouse is typically a
read-only dedicated database system created by inte-
grating data from multiple databases and other infor-
mation sources. A data warehouse is separate from the
organization’s transactional databases (i.e., OLTP
databases). It differs from transaction systems in that
[6]:
� It covers a much longer time horizon (several years
to decades) than do transaction systems.� It includes multiple databases that have been
processed so that the warehouse’s data are subject
oriented and defined uniformly (i.e., ‘‘clean
prearranged data’’).� It contains non-volatile data (i.e., read-only data)
which are updated in planned periodic cycles, not
frequently.� It is optimized for answering complex queries from
direct users (decision makers) and applications.
The transactional databases are designed to answer
who and what type questions, they are not very good
in answering what-if, why and what-next type ques-
tions. The reason is that data in transactional databases
are not necessarily organized to support analytical
processing [7]. For example, land sales data can
provide information on the sales record of residential
and commercial sites. Additionally, GIS database can
provide information about the land characteristics and
existing facilities. However, if an executive is inter-
ested in knowing ‘‘what is the effect of proximity of
commercial areas on the sales of residential lands in
Phase I?’’, OLTP databases cannot provide a direct
answer. The executive asking this query must assign
this task to some of his subordinates for extracting
related data from sales and GIS databases. These data
need to be interpreted, and then necessary computa-
tions be made, in order to get the answers. The whole
process could take days to weeks depending on the
size and complexity of the project. The issue is to be
able to quickly analyze existing data to discover
trends so that predictions and forecasts can be made
with reasonable accuracy and in time to aid in the
decision-making process [8].
The situation described above could have been
different if the organization had implemented the
concept of data warehousing. A data warehouse
accesses data from several different databases, pro-
cesses (denormalize, reorganize and integrate) data,
develops relationships between different data accord-
ing to user queries and then stores the data in special
I. Ahmad et al. / Automation in Construction 13 (2004) 525–542528
data warehousing schemas. Data warehousing
evolved to support OLAP as opposed to OLTP. Thus,
the focus in data warehousing is analytical processing
and not transaction processing. OLAP enables users to
analyze data stored in a data warehouse using differ-
ent analytical models and tools, such as the AHP, the
expected utility value based decision tree models or
any other numerical/analytical techniques. With the
appropriate user-friendly query tools, one can exper-
iment with different views of the analyzed data, thus
gaining a better insight into the situation in order to
make informed decisions [9].
2.2. Generic data warehouse architecture
Typically, a data warehouse architecture has three
components or tiers, as follows:
1. Data acquisition tools (back end) that extract data
from transactional databases (i.e., OLTP systems)
and external sources, consolidate and summarize
the data, and load it into the data warehouse.
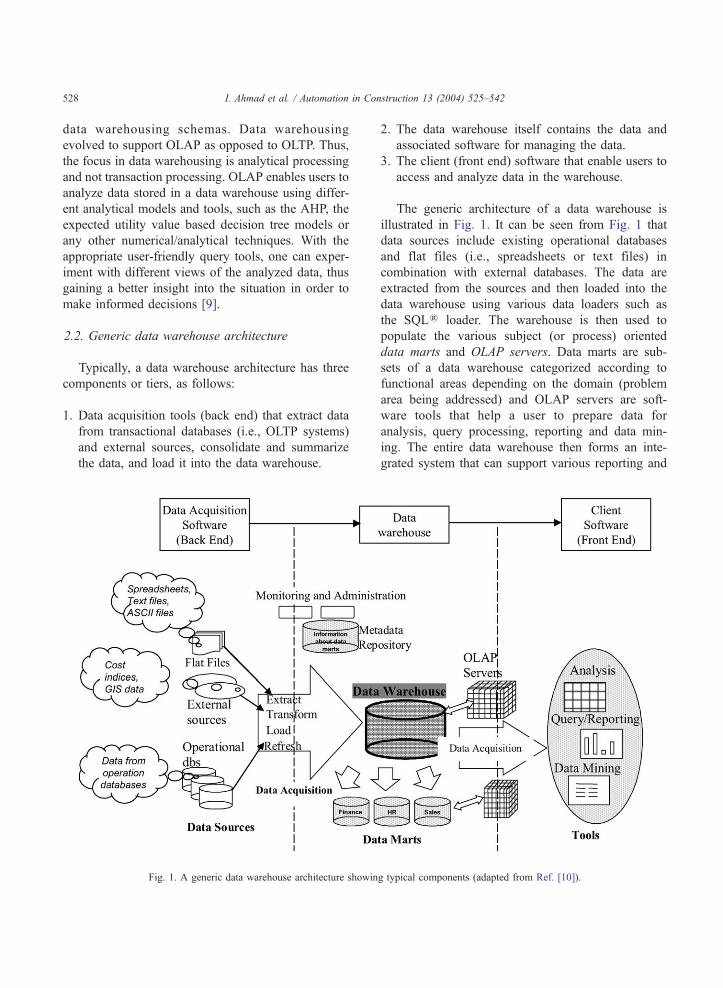
Fig. 1. A generic data warehouse architecture showin
2. The data warehouse itself contains the data and
associated software for managing the data.
3. The client (front end) software that enable users to
access and analyze data in the warehouse.
The generic architecture of a data warehouse is
illustrated in Fig. 1. It can be seen from Fig. 1 that
data sources include existing operational databases
and flat files (i.e., spreadsheets or text files) in
combination with external databases. The data are
extracted from the sources and then loaded into the
data warehouse using various data loaders such as
the SQLR loader. The warehouse is then used to
populate the various subject (or process) oriented
data marts and OLAP servers. Data marts are sub-
sets of a data warehouse categorized according to
functional areas depending on the domain (problem
area being addressed) and OLAP servers are soft-
ware tools that help a user to prepare data for
analysis, query processing, reporting and data min-
ing. The entire data warehouse then forms an inte-
grated system that can support various reporting and
g typical components (adapted from Ref. [10]).
I. Ahmad et al. / Automation in Construction 13 (2004) 525–542 529
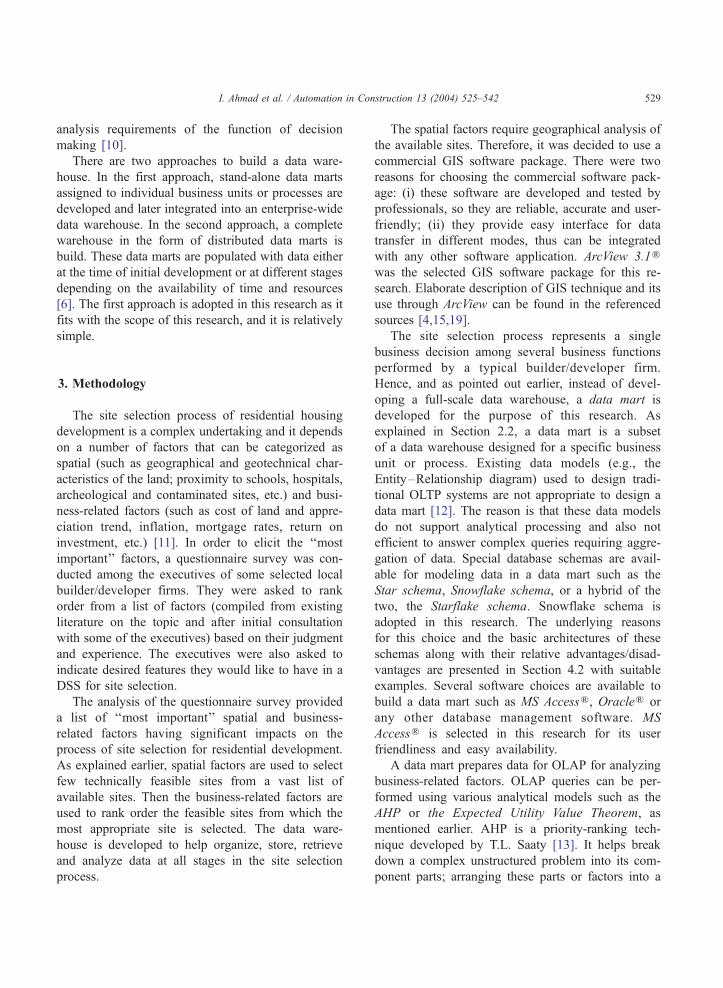
analysis requirements of the function of decision
making [10].
There are two approaches to build a data ware-
house. In the first approach, stand-alone data marts
assigned to individual business units or processes are
developed and later integrated into an enterprise-wide
data warehouse. In the second approach, a complete
warehouse in the form of distributed data marts is
build. These data marts are populated with data either
at the time of initial development or at different stages
depending on the availability of time and resources
[6]. The first approach is adopted in this research as it
fits with the scope of this research, and it is relatively
simple.
3. Methodology
The site selection process of residential housing
development is a complex undertaking and it depends
on a number of factors that can be categorized as
spatial (such as geographical and geotechnical char-
acteristics of the land; proximity to schools, hospitals,
archeological and contaminated sites, etc.) and busi-
ness-related factors (such as cost of land and appre-
ciation trend, inflation, mortgage rates, return on
investment, etc.) [11]. In order to elicit the ‘‘most
important’’ factors, a questionnaire survey was con-
ducted among the executives of some selected local
builder/developer firms. They were asked to rank
order from a list of factors (compiled from existing
literature on the topic and after initial consultation
with some of the executives) based on their judgment
and experience. The executives were also asked to
indicate desired features they would like to have in a
DSS for site selection.
The analysis of the questionnaire survey provided
a list of ‘‘most important’’ spatial and business-
related factors having significant impacts on the
process of site selection for residential development.
As explained earlier, spatial factors are used to select
few technically feasible sites from a vast list of
available sites. Then the business-related factors are
used to rank order the feasible sites from which the
most appropriate site is selected. The data ware-
house is developed to help organize, store, retrieve
and analyze data at all stages in the site selection
process.
The spatial factors require geographical analysis of
the available sites. Therefore, it was decided to use a
commercial GIS software package. There were two
reasons for choosing the commercial software pack-
age: (i) these software are developed and tested by
professionals, so they are reliable, accurate and user-
friendly; (ii) they provide easy interface for data
transfer in different modes, thus can be integrated
with any other software application. ArcView 3.1Rwas the selected GIS software package for this re-
search. Elaborate description of GIS technique and its
use through ArcView can be found in the referenced
sources [4,15,19].
The site selection process represents a single
business decision among several business functions
performed by a typical builder/developer firm.
Hence, and as pointed out earlier, instead of devel-
oping a full-scale data warehouse, a data mart is
developed for the purpose of this research. As
explained in Section 2.2, a data mart is a subset
of a data warehouse designed for a specific business
unit or process. Existing data models (e.g., the
Entity–Relationship diagram) used to design tradi-
tional OLTP systems are not appropriate to design a
data mart [12]. The reason is that these data models
do not support analytical processing and also not
efficient to answer complex queries requiring aggre-
gation of data. Special database schemas are avail-
able for modeling data in a data mart such as the
Star schema, Snowflake schema, or a hybrid of the
two, the Starflake schema. Snowflake schema is
adopted in this research. The underlying reasons
for this choice and the basic architectures of these
schemas along with their relative advantages/disad-
vantages are presented in Section 4.2 with suitable
examples. Several software choices are available to
build a data mart such as MS AccessR, OracleR or
any other database management software. MS
AccessR is selected in this research for its user
friendliness and easy availability.
A data mart prepares data for OLAP for analyzing
business-related factors. OLAP queries can be per-
formed using various analytical models such as the
AHP or the Expected Utility Value Theorem, as
mentioned earlier. AHP is a priority-ranking tech-
nique developed by T.L. Saaty [13]. It helps break
down a complex unstructured problem into its com-
ponent parts; arranging these parts or factors into a
I. Ahmad et al. / Automation in Construction 13 (2004) 525–542530
hierarchy in order to assign numerical values repre-
senting subjective judgment based on the relative
importance of the factors. These values are then
synthesized in order to determine or choose the
factor (or the option) with the highest priority or
score. The Expected Utility Value Theorem trans-
forms the monetary value of each variable (or
option) into an equivalent utility function reflecting
a decision maker’s risk behavior. Then using a
decision tree, a technique to structure a decision
problem, the best alternative could be determined.
[14]. For this research, AHP was selected for its
simplicity and due to the fact that it can be easily
implemented using any spreadsheet software appli-
cation such as the MS ExcelR.It is important to note that OLAP software pack-
ages such as MS OLAP ServerR or SQL ServerR 7.0
are also available in the market. These software
packages allow users to write their queries using
any chosen analytical model. The advantage is that
the users can use different graphical wizards to easily
write their queries and display results in different
graphical formats. Since our intention is not to
develop a commercial software product, we utilized
MS ExcelR. Moreover, the main thrust of this re-
search is not the techniques or tools used in the front-
end of the model, but the technique of data ware-
housing itself.
The design of the data mart and the associated
OLAP queries constitute the major portion of the DSS
development effort. At the end, several interfaces are
developed to link the GIS application, the data mart
and the OLAP queries.
Once the DSS is developed, it is tested for
selecting the most appropriate residential site for
housing development from among a list of 16
available sites. The manual and system results
were consistent for this test run. The area selected
for testing the DSS is the city of Miramar,
located in the Broward County of the state of
Florida. This city is currently experiencing a boom
period in heavy-commercial and residential devel-
opment. The necessary spatial and non-spatial data
for this location were obtained from the Broward
County development office, the city of Miramar
development office, United States Census Bureau,
and the Federal Emergency Management Agency
(FEMA).
The results of selected sample runs were shown
to some builder/developer company executives to
get their feedback. In light of their feedback, fol-
lowing portions of the DSS were improved.
1. Data input forms to ensure easy and consistent data
input.
2. OLAP analysis (by changing some values in the
criteria matrix to better reflect the real life
scenario).
3. Output forms format.
After the improvement, the system was shown to
the same executives. Minor adjustments were made
on the basis of second feedback.
4. System development
4.1. How does the system work?
A logical model illustrating the developed DSS for
site selection is shown in Fig. 2. The following steps,
as highlighted in black circles in Fig. 2, explain how
the DSS works:
1. The load manager uses a series of interactive forms
to input the following data: land parcel records
(e.g., land boundaries; location of roads, streets,
schools, hospitals; flood zones; wetlands; contam-
inated and archeological sites, etc.), lands for sale
data and geotechnical data of the available sites.
This data is called the source data (i.e., the data
provided by the user or by existing data files used
in the OLTP systems). The source data is stored in
the temporary data files.
2. The source data (typically normalized OLTP
data) stored in the temporary data files is
converted into target data using predefined
queries. The target data is the data which will
be stored in the data warehouse schemas. The
purpose of this conversion is to rearrange the
data, delete duplicate data and convert different
data formats (e.g., .xls, .df2, .doc, etc) into one
unique format (e.g., .df2) This is a basic step in
building a data mart or a data warehouse. Details
about this conversion process are given in the
last part of Section 4.2.3.

Fig. 2. Conceptual model of the proposed DSS.
I. Ahmad et al. / Automation in Construction 13 (2004) 525–542 531
3. The load manager then activates the GIS applica-
tion and asks the user to input site layout plans,
digital air photography files and other related
spatial data into the GIS application.
4. The target data stored in the data mart is also
imported into GIS application and spatial analysis
is performed. The spatial analysis narrows the list
of available sites for sale to a few candidate sites
that fulfill a set of user-defined criteria, an example
of which is given below (the criteria can be
changed by users).
Site selection criteria: Selected sites should be
(a) within or up to 100 ft from water and sewer
serviced zones.
(b) out of wet land areas.
(c) within 2 miles of public schools and 1.5 miles of
main hospitals.
(d) out of a 500-ft radius from contaminated sites and
out of a 1500-ft radius from archeological sites.
5. The GIS application exports the list of candidate
sites and their layout maps into data mart. A flow
chart explaining steps 3 through 5 in detail is
shown in Fig. 3.
6. The candidate sites are then rank ordered using
OLAP analysis. The data is imported from the data
mart into a spreadsheet application to perform
OLAP analysis using the AHP. The details of this
analysis are given in Section 4.3.
7. The data is then exported from spreadsheet
application into data mart where query manager
prepares the output forms and special layouts for
managers and executives using predefined and user
defined queries.
4.2. Data mart design
The data mart design constitutes the major portion
of the DSS development and hence will be explained in
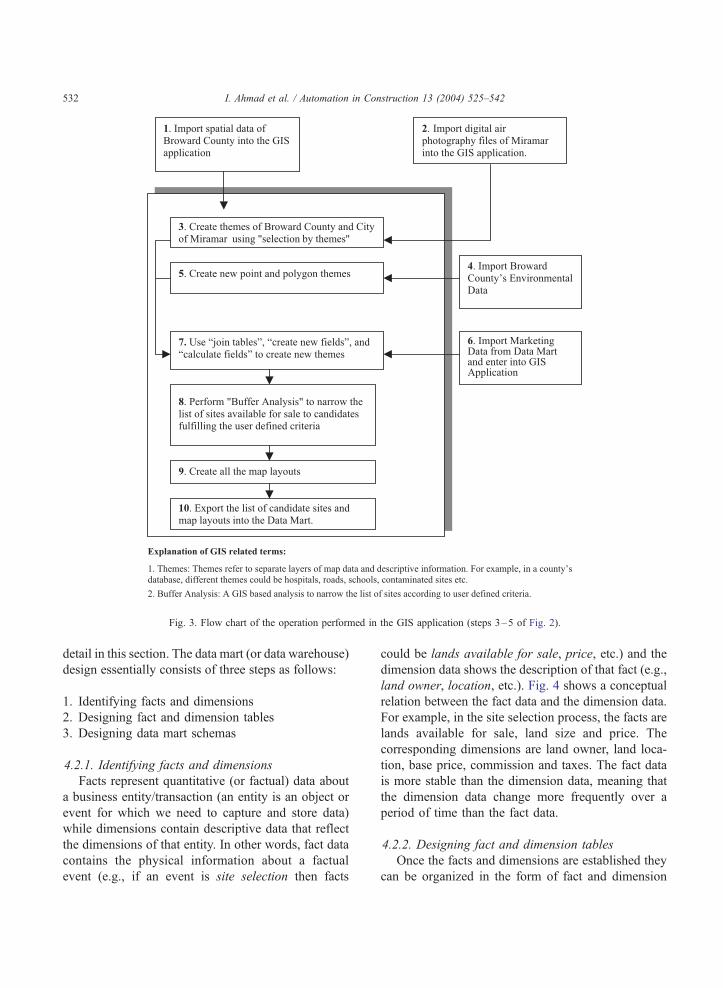
Fig. 3. Flow chart of the operation performed in the GIS application (steps 3–5 of Fig. 2).
I. Ahmad et al. / Automation in Construction 13 (2004) 525–542532
detail in this section. The data mart (or data warehouse)
design essentially consists of three steps as follows:
1. Identifying facts and dimensions
2. Designing fact and dimension tables
3. Designing data mart schemas
4.2.1. Identifying facts and dimensions
Facts represent quantitative (or factual) data about
a business entity/transaction (an entity is an object or
event for which we need to capture and store data)
while dimensions contain descriptive data that reflect
the dimensions of that entity. In other words, fact data
contains the physical information about a factual
event (e.g., if an event is site selection then facts
could be lands available for sale, price, etc.) and the
dimension data shows the description of that fact (e.g.,
land owner, location, etc.). Fig. 4 shows a conceptual
relation between the fact data and the dimension data.
For example, in the site selection process, the facts are
lands available for sale, land size and price. The
corresponding dimensions are land owner, land loca-
tion, base price, commission and taxes. The fact data
is more stable than the dimension data, meaning that
the dimension data change more frequently over a
period of time than the fact data.
4.2.2. Designing fact and dimension tables
Once the facts and dimensions are established they
can be organized in the form of fact and dimension
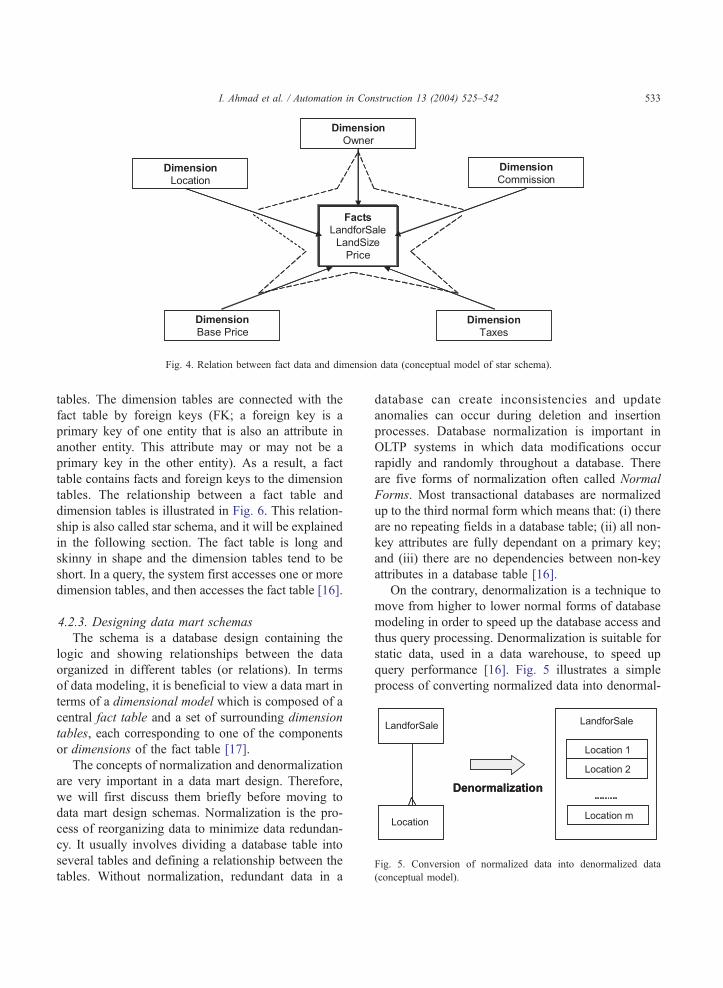
Fig. 5. Conversion of normalized data into denormalized data
(conceptual model).
Fig. 4. Relation between fact data and dimension data (conceptual model of star schema).
I. Ahmad et al. / Automation in Construction 13 (2004) 525–542 533
tables. The dimension tables are connected with the
fact table by foreign keys (FK; a foreign key is a
primary key of one entity that is also an attribute in
another entity. This attribute may or may not be a
primary key in the other entity). As a result, a fact
table contains facts and foreign keys to the dimension
tables. The relationship between a fact table and
dimension tables is illustrated in Fig. 6. This relation-
ship is also called star schema, and it will be explained
in the following section. The fact table is long and
skinny in shape and the dimension tables tend to be
short. In a query, the system first accesses one or more
dimension tables, and then accesses the fact table [16].
4.2.3. Designing data mart schemas
The schema is a database design containing the
logic and showing relationships between the data
organized in different tables (or relations). In terms
of data modeling, it is beneficial to view a data mart in
terms of a dimensional model which is composed of a
central fact table and a set of surrounding dimension
tables, each corresponding to one of the components
or dimensions of the fact table [17].
The concepts of normalization and denormalization
are very important in a data mart design. Therefore,
we will first discuss them briefly before moving to
data mart design schemas. Normalization is the pro-
cess of reorganizing data to minimize data redundan-
cy. It usually involves dividing a database table into
several tables and defining a relationship between the
tables. Without normalization, redundant data in a
database can create inconsistencies and update
anomalies can occur during deletion and insertion
processes. Database normalization is important in
OLTP systems in which data modifications occur
rapidly and randomly throughout a database. There
are five forms of normalization often called Normal
Forms. Most transactional databases are normalized
up to the third normal form which means that: (i) there
are no repeating fields in a database table; (ii) all non-
key attributes are fully dependant on a primary key;
and (iii) there are no dependencies between non-key
attributes in a database table [16].
On the contrary, denormalization is a technique to
move from higher to lower normal forms of database
modeling in order to speed up the database access and
thus query processing. Denormalization is suitable for
static data, used in a data warehouse, to speed up
query performance [16]. Fig. 5 illustrates a simple
process of converting normalized data into denormal-
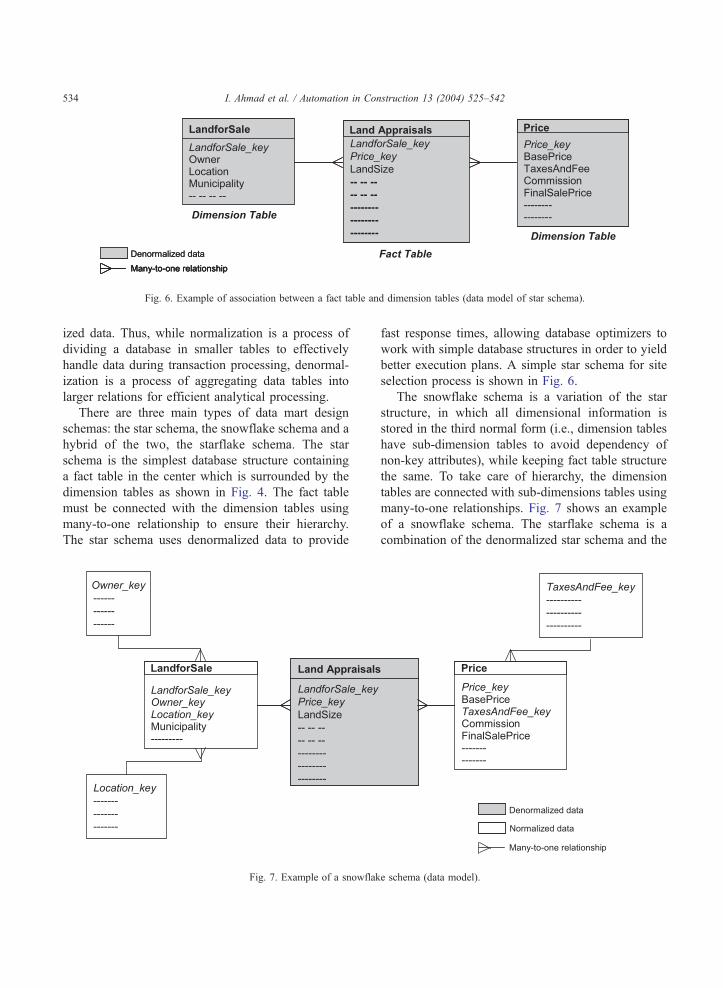
Fig. 6. Example of association between a fact table and dimension tables (data model of star schema).
I. Ahmad et al. / Automation in Construction 13 (2004) 525–542534
ized data. Thus, while normalization is a process of
dividing a database in smaller tables to effectively
handle data during transaction processing, denormal-
ization is a process of aggregating data tables into
larger relations for efficient analytical processing.
There are three main types of data mart design
schemas: the star schema, the snowflake schema and a
hybrid of the two, the starflake schema. The star
schema is the simplest database structure containing
a fact table in the center which is surrounded by the
dimension tables as shown in Fig. 4. The fact table
must be connected with the dimension tables using
many-to-one relationship to ensure their hierarchy.
The star schema uses denormalized data to provide
Fig. 7. Example of a snowflak
fast response times, allowing database optimizers to
work with simple database structures in order to yield
better execution plans. A simple star schema for site
selection process is shown in Fig. 6.
The snowflake schema is a variation of the star
structure, in which all dimensional information is
stored in the third normal form (i.e., dimension tables
have sub-dimension tables to avoid dependency of
non-key attributes), while keeping fact table structure
the same. To take care of hierarchy, the dimension
tables are connected with sub-dimensions tables using
many-to-one relationships. Fig. 7 shows an example
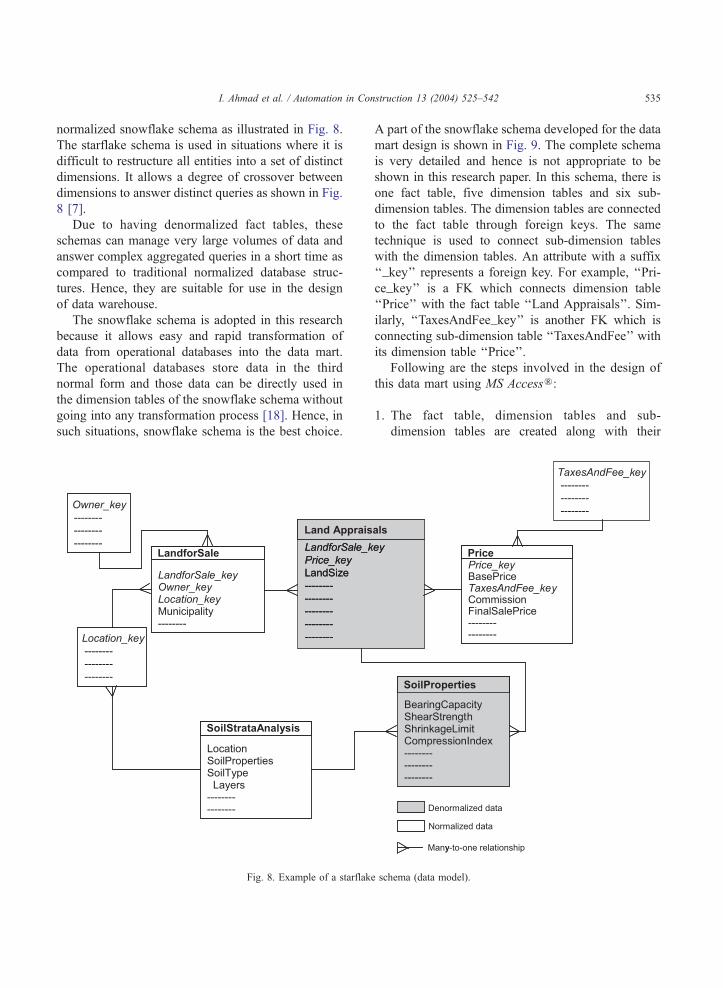
of a snowflake schema. The starflake schema is a
combination of the denormalized star schema and the
e schema (data model).
I. Ahmad et al. / Automation in Construction 13 (2004) 525–542 535
normalized snowflake schema as illustrated in Fig. 8.
The starflake schema is used in situations where it is
difficult to restructure all entities into a set of distinct
dimensions. It allows a degree of crossover between
dimensions to answer distinct queries as shown in Fig.
8 [7].
Due to having denormalized fact tables, these
schemas can manage very large volumes of data and
answer complex aggregated queries in a short time as
compared to traditional normalized database struc-
tures. Hence, they are suitable for use in the design
of data warehouse.
The snowflake schema is adopted in this research
because it allows easy and rapid transformation of
data from operational databases into the data mart.
The operational databases store data in the third
normal form and those data can be directly used in
the dimension tables of the snowflake schema without
going into any transformation process [18]. Hence, in
such situations, snowflake schema is the best choice.
Fig. 8. Example of a starflake
A part of the snowflake schema developed for the data
mart design is shown in Fig. 9. The complete schema
is very detailed and hence is not appropriate to be
shown in this research paper. In this schema, there is
one fact table, five dimension tables and six sub-
dimension tables. The dimension tables are connected
to the fact table through foreign keys. The same
technique is used to connect sub-dimension tables
with the dimension tables. An attribute with a suffix
‘‘_key’’ represents a foreign key. For example, ‘‘Pri-
ce_key’’ is a FK which connects dimension table
‘‘Price’’ with the fact table ‘‘Land Appraisals’’. Sim-
ilarly, ‘‘TaxesAndFee_key’’ is another FK which is
connecting sub-dimension table ‘‘TaxesAndFee’’ with
its dimension table ‘‘Price’’.
Following are the steps involved in the design of
this data mart using MS AccessR:
1. The fact table, dimension tables and sub-
dimension tables are created along with their
schema (data model).
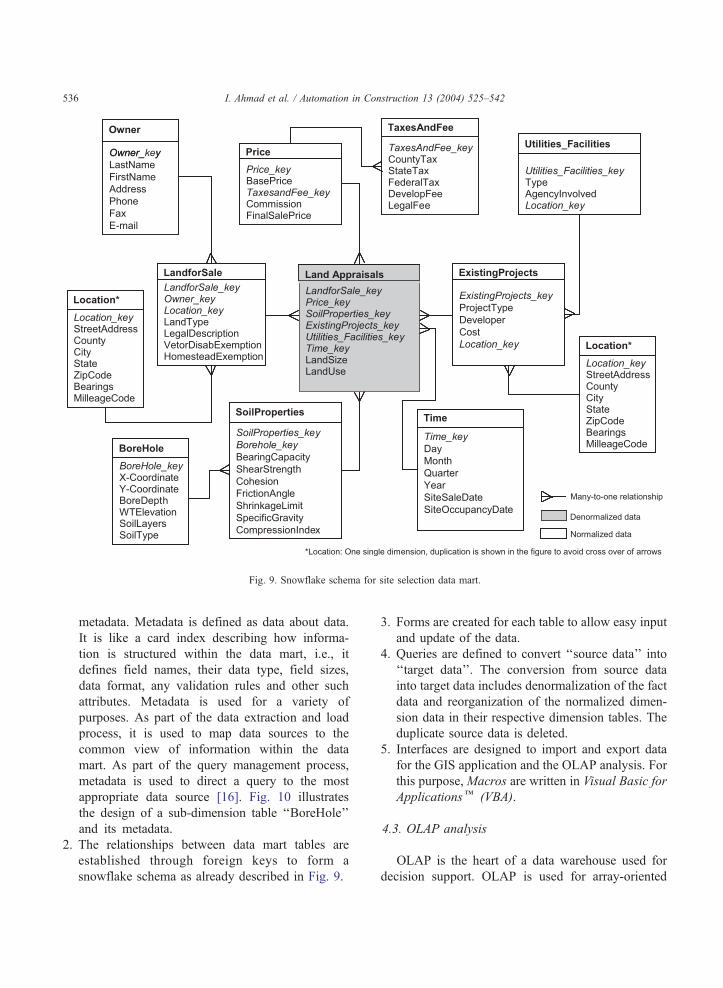
Fig. 9. Snowflake schema for site selection data mart.
I. Ahmad et al. / Automation in Construction 13 (2004) 525–542536
metadata. Metadata is defined as data about data.
It is like a card index describing how informa-
tion is structured within the data mart, i.e., it
defines field names, their data type, field sizes,
data format, any validation rules and other such
attributes. Metadata is used for a variety of
purposes. As part of the data extraction and load
process, it is used to map data sources to the
common view of information within the data
mart. As part of the query management process,
metadata is used to direct a query to the most
appropriate data source [16]. Fig. 10 illustrates
the design of a sub-dimension table ‘‘BoreHole’’
and its metadata.
2. The relationships between data mart tables are
established through foreign keys to form a
snowflake schema as already described in Fig. 9.
3. Forms are created for each table to allow easy input
and update of the data.
4. Queries are defined to convert ‘‘source data’’ into
‘‘target data’’. The conversion from source data
into target data includes denormalization of the fact
data and reorganization of the normalized dimen-
sion data in their respective dimension tables. The
duplicate source data is deleted.
5. Interfaces are designed to import and export data
for the GIS application and the OLAP analysis. For
this purpose, Macros are written in Visual Basic for
Applicationsk (VBA).
4.3. OLAP analysis
OLAP is the heart of a data warehouse used for
decision support. OLAP is used for array-oriented

Fig. 10. Design of a sub-dimension table and its metadata. (a) Design of the sub-dimension table ‘‘BoreHole’’. (b) Metadata of the
‘‘BoreHole’’ table.
I. Ahmad et al. / Automation in Construction 13 (2004) 525–542 537
applications such as market analysis and financial
forecasting. Besides these applications, OLAP should
be used where [6]:
1. Requests for data are analytic, not transactional in
nature.
2. Significant calculations and aggregation of trans-
action-level data are involved.
3. The primary type of data element being analyzed is
numeric.
4. Cross-sectional views of data are often required
across multiple dimensions and along multiple
consolidation paths.
In this research, as mentioned in earlier sections,
OLAP analysis is performed using the AHP. Elaborate
description of the AHP process and its application for
the site selection are available in the referenced sources
[5,13]. The major steps involved are as follows:
1. Based on the results of the questionnaire survey,
five factors are selected for OLAP analysis, which
are Market research, Feasibility study, Physical
factors, Regulatory conditions and Offsite factors.
2. Ratio scales are defined for pair-wise comparison
of the factors using a scale of 1–10 as shown in
Fig. 11(a).

I. Ahmad et al. / Automation in Construction 13 (2004) 525–542538
3. The AHP criteria matrix is developed using the
relative importance of one factor over the other as
shown in Fig. 11(b).
4. The criteria matrix is normalized (by dividing a cell
value by the sum of each column) and then
checked for consistency using Eigen values.
5. For each factor (e.g., market research), a separate
criteria matrix is developed to relatively compare
the given candidate sites for that factor as shown in
Fig. 11(c). These matrices are also normalized and
checked for consistency.
6. Using the priorities determined through these
matrices, the weighted overall priority of each
candidate site is determined.
Fig. 11. (a) Ratio scale for pair-wise comparison of the factors. (b) AHP cr
sites. (d) Final AHP analysis indicating the most appropriate site for resid
7. The site with the highest score became the selected
candidate site as shown in Fig. 11(d).
5. Application
The prototype DSS, developed using the data
warehousing technique, was used to select the most
appropriate residential site for housing development
in the city of Miramar, located in the Broward County
of Florida. The results demonstrate the capabilities of
the system in a real-life but hypothetical application
scenario. In the following this process of application
is described and discussed.
iteria matrix. (c) Criteria matrix of each factor to compare candidate
ential housing.
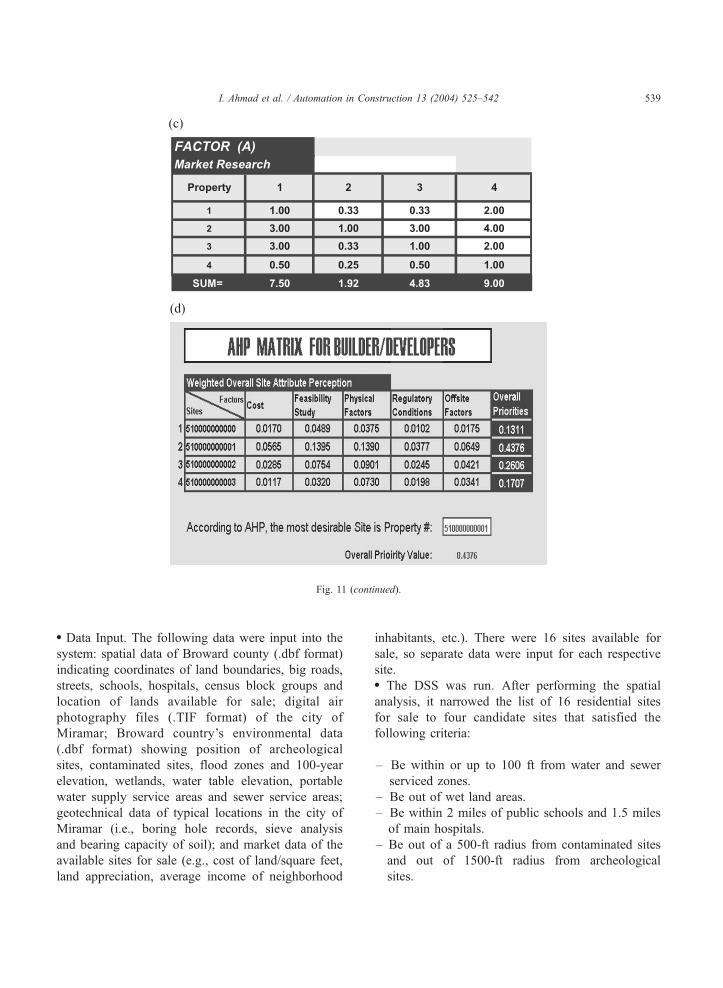
Fig. 11 (continued).
I. Ahmad et al. / Automation in Construction 13 (2004) 525–542 539
. Data Input. The following data were input into the
system: spatial data of Broward county (.dbf format)
indicating coordinates of land boundaries, big roads,
streets, schools, hospitals, census block groups and
location of lands available for sale; digital air
photography files (.TIF format) of the city of
Miramar; Broward country’s environmental data
(.dbf format) showing position of archeological
sites, contaminated sites, flood zones and 100-year
elevation, wetlands, water table elevation, portable
water supply service areas and sewer service areas;
geotechnical data of typical locations in the city of
Miramar (i.e., boring hole records, sieve analysis
and bearing capacity of soil); and market data of the
available sites for sale (e.g., cost of land/square feet,
land appreciation, average income of neighborhood
inhabitants, etc.). There were 16 sites available for
sale, so separate data were input for each respective
site.. The DSS was run. After performing the spatial
analysis, it narrowed the list of 16 residential sites
for sale to four candidate sites that satisfied the
following criteria:
– Be within or up to 100 ft from water and sewer
serviced zones.
– Be out of wet land areas.
– Be within 2 miles of public schools and 1.5 miles
of main hospitals.
– Be out of a 500-ft radius from contaminated sites
and out of 1500-ft radius from archeological
sites.

Fig. 12. Layout map showing location of four candidate sites after performing the spatial analysis.
I. Ahmad et al. / Automation in Construction 13 (2004) 525–542540
Fig. 12 illustrates the location of these four candi-
date sites along with other details.. Before performing the OLAP analysis based on
AHP, a user could view the list of candidate sites
for sale on the basis of the following factors:
– Cost of land per square foot
– Land appreciation
– Households per square mile
– Average income of neighborhood inhabitants (e.g.,
between US$50,000 and US$75,000)
– Population density (no. of persons/square mile)
This purpose of this option is to allow the user to
apply his/her subjective judgment for choosing the
most suitable site.. Then the option of analytical module was chosen.
The DSS performed the OLAP analysis using AHP
and displayed the most suitable site for residential
housing development as shown earlier in Fig. 11(d).
This demonstration clearly shows that the proto-
type DSS can aid decision makers in selecting the
most appropriate site for residential development. The
land selection criteria in the DSS can be customized
according to user requirements. Thus, the system
could be extended to select the land for commercial
development or for any other purpose.
In this DSS, the user cannot add more attributes in
the fact table and the dimension tables. However, it is
possible to develop a data mart where users can add
more data attributes to the appropriate tables to meet
their requirements. Although not demonstrated in this
system but it is also possible that the users can
redesign or customize the data mart schema(s) to best
fit their needs. For this purpose, suitable input forms
can be generated (e.g., in VBAR) to allow the users to
define the fact and the dimension data attributes. Then
with the help of user defined queries, suitable rela-
tionship can be generated between the fact table and
the dimension tables to form an appropriate data mart
schema. In this way, a more customized data ware-
housing solution can be produced to satisfy user
requirements. This is an issue of balancing between
the scope of a system-developer’s task and that of a
user. Since the purpose of this research study was to
demonstrate the concept of data warehousing, the
simpler approach of developing a ready-made proto-
type system was used. Thus, in this prototype DSS
I. Ahmad et al. / Automation in Construction 13 (2004) 525–542 541
system, schemas are already developed based on a
predefined model. This is also an issue of commercial
software development (not the intent of this paper) as
opposed to development of an innovative concept as
presented here. The above example illustrates the
application of the DSS for a single project (i.e.,
short-term planning). However, as the system is used
over a number of years for several projects, it could
utilize the data of those projects to generate a trend or
pattern of land sale in different types of urban and
rural areas. These trends can aid the executives in
making effective decisions regarding site selection.
Moreover, decision makers can use these trends to
further refine their land selection criteria thus improv-
ing the effectiveness and usefulness of the system.
6. Conclusions
Application of the data warehousing technique in
developing a prototype DSS for use in selecting sites
for residential housing development is illustrated in
this paper. The objective of the prototype DSS is to
help investors or builders/developers to select the
most appropriate site from a list of available ones by
rank ordering. The DSS is interactive and is built
using data from several sources including spatial and
financial ones. A GIS software has been used in the
back-end of the system while an analytical modeling
technique, AHP has been employed in the front-end.
In between, the data warehouse is placed. It gathers
data, rearranges them in schemas specially developed
to support the particular decision-making process,
processes user-defined queries, and finally prepares
data for eventual analysis by the AHP model. A
number of builder/developer companies were con-
sulted during the development of the prototype DSS
for their advice regarding the criteria for site selection.
A smaller subset of the same group was contacted
again once the prototype was fully developed for their
feedback. To the extent possible given the scope of the
study, their input were incorporated.
If populated with data from a number of projects, the
data warehouse could generate site selection patterns
for different areas reflecting their unique character-
istics. These patterns can help users to further refine
the site selection criteria. The process followed to
develop the prototype DSS in this research demon-
strates that, depending on the domain and scope of the
problem at hand, a DSS can be built fairly quickly and
can be used effectively. The process is continuous and
ongoing. With continual use of the system, a data
warehouse should keep growing from one or two data
marts to a full-blown data warehouse. It should get
enriched as well by retaining useful data in appropriate
formats and by discarding data that are proved not to be
very useful for decision-making. User-friendly features
can be added gradually by improving flexibility in the
system. As shown in this paper, a data warehouse can
be used in an effective DSS if powerful software
systems, such as the GIS, and analytical methods or
tools, such as the AHP, are incorporated in the system.
References
[1] D. Theodoratos, T. Sellis, Design data warehouse, Data and
Knowledge Engineering 31 (1999) 279–301.
[2] A. Polevoy, J. Ingham, Data warehousing: a tool for facilitat-
ing assessment, Proceedings of the 29th ASEE/IEEE Frontiers
in Education Conference, November 10–13, San Juan, Puerto
Rico, IEEE, USA, vol. 11b1, 1999, pp. 7–11.
[3] I. Ahmad, Data warehousing in construction organizations,
ASCE Construction Congress-6, February 2000, Orlando, FL.
[4] A.A. Oloufa, A.A. Eltaham, C.S. Papacostas, Integrated GIS
for Construction Site Investigation, ASCE Journal of Con-
struction Engineering and Management 120 (1) (1994)
211–222.
[5] C. McIntyre, M.K. Parfitt, Decision support system for resi-
dential land development site selection process, ASCE Journal
of Architectural Engineering 4 (4) (1998) 125–131.
[6] P.G. Gray, H.J. Watson, Decision Support in the Data Ware-
house, Prentice-Hall, New Jersey, 1998.
[7] I. Ahmad, S. Azhar, Data warehousing in construction: from
conception to application, Proceedings of the First International
Conference on Construction in the 21st Century: Challenges
and Opportunities in Management and Technology, Miami,
Florida, USA, April 25–26, Florida International University,
Miami, 2002, pp. 739–746.
[8] J. Ang, T.S.H. Teo, Management issues in data warehousing:
insight from the housing and development board, Decision
Support Systems 29 (2000) 11–20.
[9] W.H. Inmon, Building the Data Warehouse, Wiley, New York,
1992.
[10] S. Chaudhuri, U. Dayal, OLAP technology and data ware-
housing, ACM SIGMOD Records, Hewlett-Packard Labs,
San Jose, 1997.
[11] A. Rabinowitz, Land Investment and the Predevelopment Pro-
cess, Quorum Books, New York, 1998.
[12] J.P. Shim, M. Warkentin, J.F. Courtney, D.J. Power, R. Sharda,
C. Carlsson, Past, present and future of decision support tech-
nology, Decision Support Systems 33 (2002) 111–126.

I. Ahmad et al. / Automation in Construction 13 (2004) 525–542542
[13] T.L. Saaty, Decision Making for Leaders: The Analytical Hie-
rarchy Process for Decisions in a Complex World, Lifetime
Learning Publications, California, 1982.
[14] D. Meredith, Design and Planning of Engineering Systems,
McGraw-Hill, New York, 1988.
[15] B. Plewe, GIS Online: Information Retrieval, Mapping, and
the Internet, OnWord Press, New Mexico, 1997.
[16] R. Kimball, M. Ross, The Data Warehouse Toolkit, 2nd edi-
tion, Wiley, New York, 2002.
[17] M. Levene, G. Loizou, Why is the snowflake schema a good
data warehouse design? Information Systems 28 (3) (2003)
225–240.
[18] K.W. Chau, Y. Cao, M. Anson, J. Zhang, Application of data
warehouse and decision support system in construction man-
agement, Automation in Construction 12 (2) (2003) 213–224.
[19] ESRI Business Information Solutions. ArcView Information.
[online] http://www.esri.com/software/arcgis/arcview/
index.html.