development of a classification system based on corneal
TRANSCRIPT
RESEARCH Open Access
Development of a classification systembased on corneal biomechanical propertiesusing artificial intelligence predictingkeratoconus severityRobert Herber* , Lutz E. Pillunat and Frederik Raiskup
Abstract
Background: To investigate machine-learning (ML) algorithms to differentiate corneal biomechanical propertiesbetween different topographical stages of keratoconus (KC) by dynamic Scheimpflug tonometry (CST, Corvis ST,Oculus, Wetzlar, Germany). In the following, ML models were used to predict the severity in a training andvalidation dataset.
Methods: Three hundred and eighteen keratoconic and one hundred sixteen healthy eyes were included in thismonocentric and cross-sectional pilot study. Dynamic corneal response (DCR) and corneal thickness related(pachymetric) parameters from CST were chosen by appropriated selection techniques to develop a ML algorithm.The stage of KC was determined by the topographical keratoconus classification system (TKC, Pentacam, Oculus).Patients who were classified as TKC 1, TKC 2 and TKC 3 were assigned to subgroup mild, moderate, and advancedKC. If patients were classified as TKC 1–2, TKC 2–3 or TKC 3–4, they were assigned to subgroups according to thenormative range of further corneal indices (index of surface variance, keratoconus index and minimum radius).Patients classified as TKC 4 were not included in this study due to the limited amount of cases. Linear discriminantanalysis (LDA) and random forest (RF) algorithms were used to develop the classification models. Data were dividedinto training (70% of cases) and validation (30% of cases) datasets.
Results: LDA model predicted healthy, mild, moderate, and advanced KC eyes with a sensitivity (Sn)/specificity (Sp)of 82%/97%, 73%/81%, 62%/83% and 68%/95% from a validation dataset, respectively. For the RF model, a Sn/Sp of91%/94%, 80%/90%, 63%/87%, 72%/95% could be reached for predicting healthy, mild, moderate, and advanced KCeyes, respectively. The overall accuracy of LDA and RF was 71% and 78%, respectively. The accuracy for KCdetection including all subgroups of KC severity was 93% in both models.
© The Author(s). 2021 Open Access This article is licensed under a Creative Commons Attribution 4.0 International License,which permits use, sharing, adaptation, distribution and reproduction in any medium or format, as long as you giveappropriate credit to the original author(s) and the source, provide a link to the Creative Commons licence, and indicate ifchanges were made. The images or other third party material in this article are included in the article's Creative Commonslicence, unless indicated otherwise in a credit line to the material. If material is not included in the article's Creative Commonslicence and your intended use is not permitted by statutory regulation or exceeds the permitted use, you will need to obtainpermission directly from the copyright holder. To view a copy of this licence, visit http://creativecommons.org/licenses/by/4.0/.The Creative Commons Public Domain Dedication waiver (http://creativecommons.org/publicdomain/zero/1.0/) applies to thedata made available in this article, unless otherwise stated in a credit line to the data.
* Correspondence: [email protected] parts presented as paper presentation at CXL Experts Meeting in Zurich2019, Annual Conference of the German Society of Ophthalmology in Berlin2019 and accepted as paper presentation at ARVO 2020.Department of Ophthalmology, University Hospital Carl Gustav Carus,Universitätsklinikum Carl Gustav Carus an der Technischen UniversitätDresden, Fetscherstraße 74, TU 01307 Dresden, Germany
Herber et al. Eye and Vision (2021) 8:21 https://doi.org/10.1186/s40662-021-00244-4
Conclusion: The RF model showed good accuracy in predicting healthy eyes and various stages of KC. Theaccuracy was superior with respect to the LDA model. The clinical importance of the models is that the standalonedynamic Scheimpflug tonometry is able to predict the severity of KC without having the keratometric data.
Trial registration: NCT04251143 at Clinicaltrials.gov, registered at 12 March 2018 (Retrospectively registered).
Keywords: Artificial intelligence, Corneal biomechanics, Corvis ST, Grading, Keratoconus, Machine learning
BackgroundKeratoconus (KC) is a bilateral ectatic disease of the cor-nea that is characterized by corneal steepening and thin-ning [1]. As a result, irregular astigmatism may lead toloss of vision. Former studies have reported low inci-dence and prevalence of keratoconus [2]. Recently, itwas shown that KC does not occur as rarely as described[3]. Due to improving diagnosis, it is assumed thatprevalence is higher and depends on geographic regions[4]. Placido-disk, Scheimpflug or optical coherence tom-ography (OCT) technology are useful tools to image cor-neal topography and tomography for screening ectasia.In the case of KC, biomechanical properties are alteredto the effect that corneal tissue is biomechanically weak-ened [5]. Especially, focal weakening of elastic propertiesmight be the initial trigger for stromal thinning and in-creasing steepening [6]. Thus, in vivo biomechanical as-sessment of the cornea became popular by releasing thenon-contact tonometer labeled as ocular responseanalyzer (ORA, Reichert, Ophthalmic Instruments, De-pew, NY, USA) in the field of refractive surgery, kerato-conus and glaucoma [7]. ORA provides informationregarding corneal viscoelastic properties that are de-scribed as corneal hysteresis and corneal resistance fac-tor [7, 8]. Furthermore, keratoconus match index (KMI,ORA) and probability (KMP, ORA) are derived from in-dividual waveform characteristics of the measurementsignal and are compared to a normative database [9, 10].Furthermore, investigations have shown that this data-base was not related to an objective keratoconus classifi-cation; besides, cases were classified by individuals offour different settings [11]. Therefore, no clear correl-ation to the topographic keratoconus classification(TKC, Pentacam, Oculus, Wetzlar, Germany) or anteriorsurface indices such as keratoconus index (KI, Penta-cam), could be found throughout several investigations.Later, a Scheimpflug-based tonometer was introducedby Oculus that records the corneal deformation processinduced by an air-puff using an ultra-high-speed camera(Corvis ST, Oculus, Wetzlar, Germany). The measure-ment outcome of the Corvis ST is described as dynamiccorneal response (DCR) parameters. It has been shownthat DCR parameters are highly repeatable in healthy[12] and KC eyes [13]. Additionally, Corvis ST can beused to assess alterations before and after corneal cross-
linking (CXL) [14–16]. Corvis biomechanical index(CBI) and tomographic and biomechanical index (TBI)are indices that are able to differentiate between healthyand KC eyes as well as healthy and subclinical ectasia[17, 18]. Subclinical eyes were defined as those with nor-mal topography in one eye and manifest KC in the fel-low eye with very asymmetric ectasia [17]. However,these indices were not designed to differentiate betweenvarious stages of KC. Previously, we showed that DCRparameters were different in several stages of KC [19].The aim of this pilot study was to develop a corneal bio-mechanical based classification model, called Dresdenkeratoconus index (DKI), to predict the severity of KC ina standalone Corvis ST measurement without havingkeratometry data from the cornea.
Materials and methodsSubjectsThis monocentric pilot study was conducted at the De-partment of Ophthalmology, University Hospital CarlGustav Carus, TU Dresden, Germany. The study proto-col was approved by the ethics committee of the Univer-sity Hospital Carl Gustav Carus, Dresden, TU Dresden,Germany following the tenets of the Declaration ofHelsinki. Participants and KC patients were enrolled be-tween January 2017 and March 2020 from the refractiveand keratoconus clinic at the Department of Ophthal-mology, University Hospital Carl Gustav Carus. All sub-jects had to confirm their approval by signing theinformed consent. Furthermore, healthy subjects andkeratoconus patients have received a complete ophthal-mologic examination including slit lamp biomicroscopyof the anterior segment and fundus biomicroscopy aswell as a survey of their medical history. Inclusion cri-teria for healthy participants were an age between 18and 45 years, normal tomography, an intraocular pres-sure less than 21 mmHg and an ordinary optic nervehead. KC patients had to present clear signs of keratoco-nus in corneal maps (derived from Scheimpflug tomog-raphy) that was approved by an experienced clinician(FR) and optometrist (RH). The topographical keratoco-nus classification (TKC) had to be at least stage 1 (TKC1). Of note, one follow-up examination was necessary toconfirm topographical stability. Healthy participants andKC patients were requested to discontinue the wearing
Herber et al. Eye and Vision (2021) 8:21 Page 2 of 11
of contact lenses for 10 days. Exclusion criteria wereprevious corneal and ocular surgeries (e.g., cornealcross-linking), diabetes mellitus and severe cases of KC.
Measurement of dynamic corneal response parametersThe Corvis ST measures the corneal response to an in-duced, predefined air-puff using an ultra-high speedScheimpflug camera [20, 21]. DCR and corneal thicknessrelated (pachymetric) parameters are derived from 2-dimensional cross-section records of the cornea and de-scribing the corneal behavior during different deform-ation phases. First, the air-puff reaches the cornea andpushes it to the 1st applanation. While the air-puff is ac-tive, the cornea is forced into a concave shape (describedas highest concavity, HC). After that, the air pressure de-creases and the cornea moves back through the 2ndapplanation to its physiological state. Some of the DCRparameters indicate time and velocity to 1st and 2ndapplanation as well as maximum deformation [18, 20–22]. Furthermore, corneal pachymetry (Pachy) and cor-neal thickness related parameters (ARTh, Ambrosio Ra-tional Thickness horizontal [18] and Pachyslope [23])are measured before the air-puff reaches the cornea.ARTh is calculated as the thinnest corneal thickness di-vided by pachymetric progression to periphery [18].Contrarily, Pachyslope is calculated as the difference ofmean corneal thickness at ±2.5 mm and corneal thick-ness at the apex [23, 24]. The latest software release hasincluded novel parameters like biomechanical correctedintraocular pressure (bIOP) [25, 26]; maximum inverseconcave radius (InverseR) [18]; integrated inverse radius(IntInverseR) [18]; ratio of central and peripheral de-formation in a distance of 1 mm and 2mm (DAR1/DAR2) [18] and stiffness parameter at the 1st applana-tion (SPA1) [22]. Furthermore, the CBI is a combinedindex of several DCR parameters based on logistic re-gression analysis that distinguishes between healthy andKC eyes [18]. Instead, the TBI combines DCR and tomo-graphic parameters using a random forest method [17].
Corneal tomography measurements and classification ofkeratoconusCorneal tomography of healthy participants and KC pa-tients were evaluated by Scheimpflug technology (Penta-cam, Oculus, Wetzlar, Germany). Topographical datawere derived from these measurements. The followingparameters were used in this study: maximal keratome-try (Kmax), thinnest corneal thickness (TCT), Belin/Ambrósio total deviation value (BAD-D) and inferior-superior keratometric difference (I-S value). Pentacamprovides two KC classification systems: the topographickeratoconus classification (TKC) [27] and the ABCDgrading [28]. Both of them are related to the Amsler-Krumeich KC classification [27, 28]. The ABCD grading
offers an independent staging of anterior as well as pos-terior surface and TCT. However, our clinical experiencehas shown that it is difficult to find patients, which havethe same stage in each category (e.g., A2B2C2). There-fore, we decided to use TKC as target classification forpredicting KC severity by DCR and pachymetric parame-ters. TKC is based on topographic indices like index ofsurface variance (ISV), keratoconus index (KI) and mini-mum radius (Rmin) [27]. KC patients who were classi-fied as TKC 1, TKC 2 and TKC 3, were assigned tosubgroups “mild KC”, “moderate KC” and “advancedKC”, respectively. Patients classified as “TKC 1–2” and“TKC 2–3” were assigned to mild and moderate, accord-ing to the normative range of ISV, KI and Rmin (shownin Table 1). Patients classified as “TKC 4” were not in-cluded in this study due to the limited number of cases.
Statistical analysis and classification modelsStatistical analysis and machine learning algorithms wereperformed using SPSS (version 25, IBM Statistics,Armonk, New York, USA) and R (R Foundation for Stat-istical Computing, Vienna, Austria; https://www.R-project.org/). Incomplete data, insufficient quality ofCorvis ST measurement or outliers of patients’ datasetswere removed. One eye per participant or patient wasused. The dataset was randomly divided into a training(around 70% of cases) and a validation (around 30% ofcases) dataset. To solve this classification problem, ran-dom forest (RF) and linear discriminant analysis (LDA)were selected due to their suitability for multiclass classi-fication. Both RF [17, 29] and LDA [30–32] were used inthe past to solve classification problems in ophthalmol-ogy. The RF model is a machine learning algorithm thatincludes and combines a large number of decision treesto solve classification and regression issues [33, 34]. Adecision tree is built up based on nodes where one inde-pendent variable is chosen to cause a decision to findthe final prediction [33]. In RF, the outcome of each de-cision tree is a vote and the most predicted decision de-termines the final prediction [33]. On the other hand,LDA is a classification algorithm that uses discriminantfunctions, a linear combination of selected parameters,to classify two or more groups [35]. The discriminantfunction describes the numeric properties of the sub-groups where the mean of these results constitute a cen-troid [35]. The differences of these means of two ormore groups represent the cut-off value [35].In general, machine learning approaches are catego-
rized as supervised, unsupervised and reinforcementlearning [33, 34]. Both RF and LDA are supervised ma-chine learning algorithms. The aim of this application isthat the machine learning algorithms are able to learnfrom a labeled dataset and to construct rules to predictunlabeled data, which is not in the dataset [34]. The
Herber et al. Eye and Vision (2021) 8:21 Page 3 of 11
learning process also includes an improvement in the ac-curacy if new data are added. The accuracy of the result-ing model from the machine learning process dependson the amount and the quality of the data. There is alsoa risk of a biased training dataset that leads to a falseprediction of unlabeled and independent data.DCR and pachymetric parameters were exported from
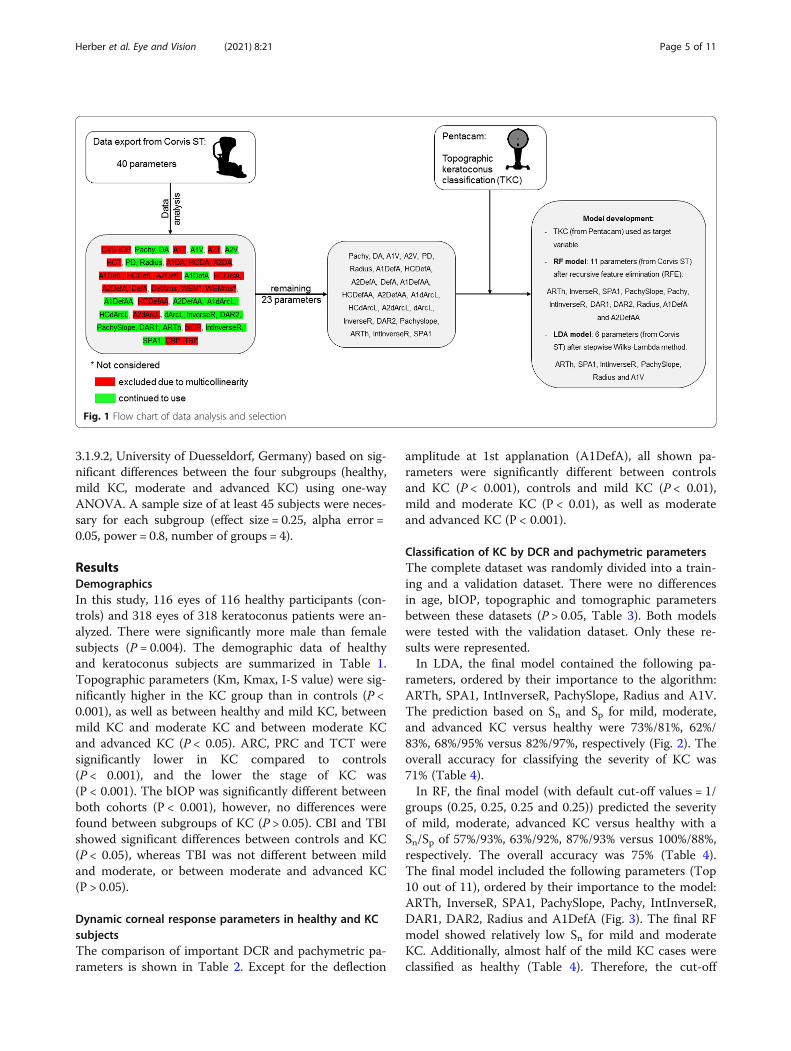
the Corvis ST software (version 1.5r1902) including 40variables. The CBI and TBI were excluded because theyrepresent already established indices and were later usedfor comparative analysis. Whole eye movement were notconsidered in the analysis because it does not directlyrepresent corneal biomechanical properties. Parameterswere assessed in their multicollinearity to each other bycalculating the variance inflation factor (VIF) from theregression analysis. In the following, the final selectionof DCR and pachymetric parameters were done by re-cursive feature elimination (caret package, R) and step-wise Wilks-Lambda method (SPSS) for RF and LDA,respectively (Fig. 1). The performance of each algorithmwas evaluated with the validation dataset by generating aconfusion matrix. Additionally, accuracy of the algo-rithm determined the overall performance, whereas sen-sitivity (Sn) and specificity (Sp) were determined for each
subgroup (“healthy”, “mild KC”, “moderate KC” and “ad-vanced KC”). Sn was calculated from
true positive= true positiveþ false negativeð Þ ð1Þ
Sp was calculated from
true negative= true negativeþ false positiveð Þ ð2ÞIn cases where Sn and Sp were calculated for each sub-
group (e.g., “mild KC”), true positives were all cases thatwere classified as mild KC. True negatives were all non-mild KC cases that were not classified as mild KC. Falsepositives were all non-mild KC cases that were classifiedas mild KC, whereas false negatives were all mild KCcases that were not classified as mild KC.The developed algorithms were compared with respect
to their suitability of detecting KC in general using theCBI and TBI. Finally, receiver operating characteristics(ROC) curves were plotted and area under the curves(AUC) were determined. For multiple comparisons, one-way ANOVA with Bonferroni correction was used. A Pvalue of less than 0.05 showed statistical significance.Sample size calculation was done using G Power (version
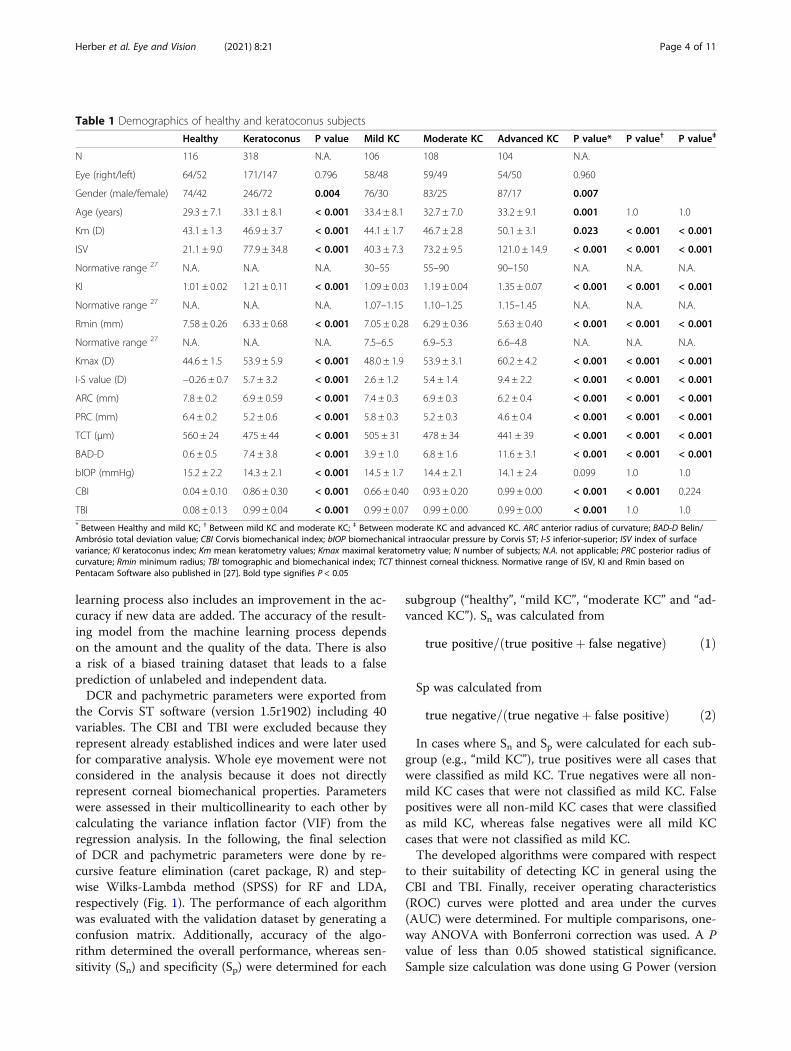
Table 1 Demographics of healthy and keratoconus subjects
Healthy Keratoconus P value Mild KC Moderate KC Advanced KC P value* P value† P value‡
N 116 318 N.A. 106 108 104 N.A.
Eye (right/left) 64/52 171/147 0.796 58/48 59/49 54/50 0.960
Gender (male/female) 74/42 246/72 0.004 76/30 83/25 87/17 0.007
Age (years) 29.3 ± 7.1 33.1 ± 8.1 < 0.001 33.4 ± 8.1 32.7 ± 7.0 33.2 ± 9.1 0.001 1.0 1.0
Km (D) 43.1 ± 1.3 46.9 ± 3.7 < 0.001 44.1 ± 1.7 46.7 ± 2.8 50.1 ± 3.1 0.023 < 0.001 < 0.001
ISV 21.1 ± 9.0 77.9 ± 34.8 < 0.001 40.3 ± 7.3 73.2 ± 9.5 121.0 ± 14.9 < 0.001 < 0.001 < 0.001
Normative range 27 N.A. N.A. N.A. 30–55 55–90 90–150 N.A. N.A. N.A.
KI 1.01 ± 0.02 1.21 ± 0.11 < 0.001 1.09 ± 0.03 1.19 ± 0.04 1.35 ± 0.07 < 0.001 < 0.001 < 0.001
Normative range 27 N.A. N.A. N.A. 1.07–1.15 1.10–1.25 1.15–1.45 N.A. N.A. N.A.
Rmin (mm) 7.58 ± 0.26 6.33 ± 0.68 < 0.001 7.05 ± 0.28 6.29 ± 0.36 5.63 ± 0.40 < 0.001 < 0.001 < 0.001
Normative range 27 N.A. N.A. N.A. 7.5–6.5 6.9–5.3 6.6–4.8 N.A. N.A. N.A.
Kmax (D) 44.6 ± 1.5 53.9 ± 5.9 < 0.001 48.0 ± 1.9 53.9 ± 3.1 60.2 ± 4.2 < 0.001 < 0.001 < 0.001
I-S value (D) −0.26 ± 0.7 5.7 ± 3.2 < 0.001 2.6 ± 1.2 5.4 ± 1.4 9.4 ± 2.2 < 0.001 < 0.001 < 0.001
ARC (mm) 7.8 ± 0.2 6.9 ± 0.59 < 0.001 7.4 ± 0.3 6.9 ± 0.3 6.2 ± 0.4 < 0.001 < 0.001 < 0.001
PRC (mm) 6.4 ± 0.2 5.2 ± 0.6 < 0.001 5.8 ± 0.3 5.2 ± 0.3 4.6 ± 0.4 < 0.001 < 0.001 < 0.001
TCT (μm) 560 ± 24 475 ± 44 < 0.001 505 ± 31 478 ± 34 441 ± 39 < 0.001 < 0.001 < 0.001
BAD-D 0.6 ± 0.5 7.4 ± 3.8 < 0.001 3.9 ± 1.0 6.8 ± 1.6 11.6 ± 3.1 < 0.001 < 0.001 < 0.001
bIOP (mmHg) 15.2 ± 2.2 14.3 ± 2.1 < 0.001 14.5 ± 1.7 14.4 ± 2.1 14.1 ± 2.4 0.099 1.0 1.0
CBI 0.04 ± 0.10 0.86 ± 0.30 < 0.001 0.66 ± 0.40 0.93 ± 0.20 0.99 ± 0.00 < 0.001 < 0.001 0.224
TBI 0.08 ± 0.13 0.99 ± 0.04 < 0.001 0.99 ± 0.07 0.99 ± 0.00 0.99 ± 0.00 < 0.001 1.0 1.0* Between Healthy and mild KC; † Between mild KC and moderate KC; ‡ Between moderate KC and advanced KC. ARC anterior radius of curvature; BAD-D Belin/Ambrósio total deviation value; CBI Corvis biomechanical index; bIOP biomechanical intraocular pressure by Corvis ST; I-S inferior-superior; ISV index of surfacevariance; KI keratoconus index; Km mean keratometry values; Kmax maximal keratometry value; N number of subjects; N.A. not applicable; PRC posterior radius ofcurvature; Rmin minimum radius; TBI tomographic and biomechanical index; TCT thinnest corneal thickness. Normative range of ISV, KI and Rmin based onPentacam Software also published in [27]. Bold type signifies P < 0.05
Herber et al. Eye and Vision (2021) 8:21 Page 4 of 11
3.1.9.2, University of Duesseldorf, Germany) based on sig-nificant differences between the four subgroups (healthy,mild KC, moderate and advanced KC) using one-wayANOVA. A sample size of at least 45 subjects were neces-sary for each subgroup (effect size = 0.25, alpha error =0.05, power = 0.8, number of groups = 4).
ResultsDemographicsIn this study, 116 eyes of 116 healthy participants (con-trols) and 318 eyes of 318 keratoconus patients were an-alyzed. There were significantly more male than femalesubjects (P = 0.004). The demographic data of healthyand keratoconus subjects are summarized in Table 1.Topographic parameters (Km, Kmax, I-S value) were sig-nificantly higher in the KC group than in controls (P <0.001), as well as between healthy and mild KC, betweenmild KC and moderate KC and between moderate KCand advanced KC (P < 0.05). ARC, PRC and TCT weresignificantly lower in KC compared to controls(P < 0.001), and the lower the stage of KC was(P < 0.001). The bIOP was significantly different betweenboth cohorts (P < 0.001), however, no differences werefound between subgroups of KC (P > 0.05). CBI and TBIshowed significant differences between controls and KC(P < 0.05), whereas TBI was not different between mildand moderate, or between moderate and advanced KC(P > 0.05).
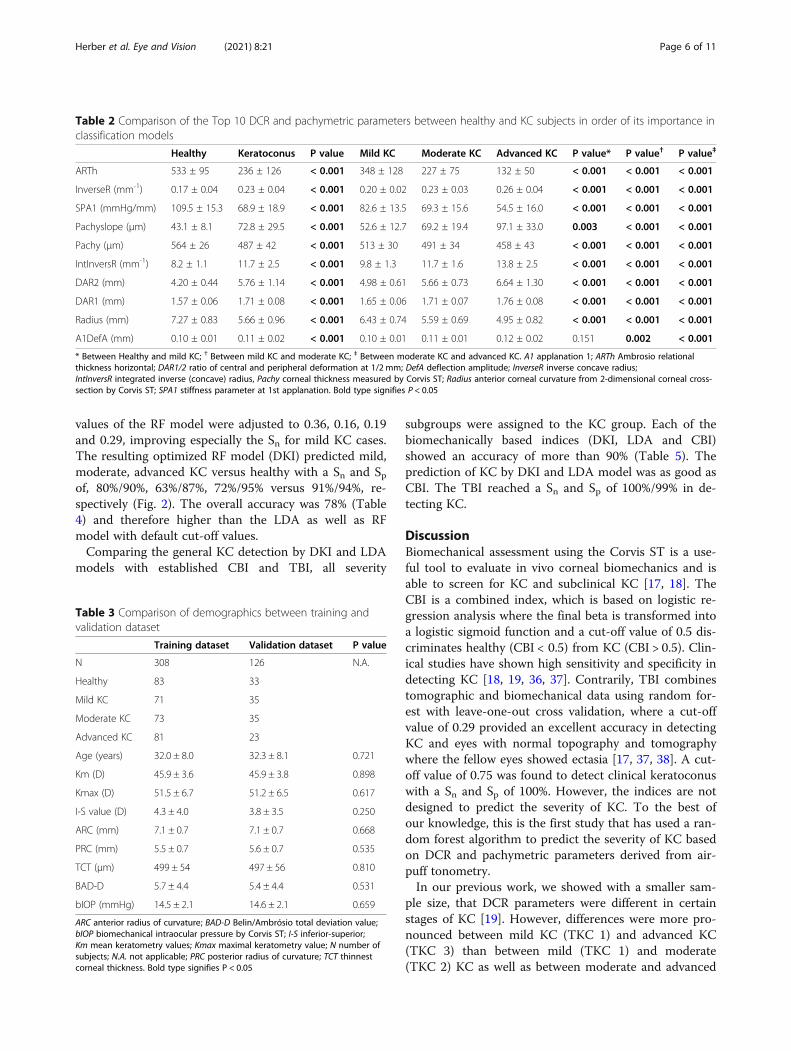
Dynamic corneal response parameters in healthy and KCsubjectsThe comparison of important DCR and pachymetric pa-rameters is shown in Table 2. Except for the deflection
amplitude at 1st applanation (A1DefA), all shown pa-rameters were significantly different between controlsand KC (P < 0.001), controls and mild KC (P < 0.01),mild and moderate KC (P < 0.01), as well as moderateand advanced KC (P < 0.001).
Classification of KC by DCR and pachymetric parametersThe complete dataset was randomly divided into a train-ing and a validation dataset. There were no differencesin age, bIOP, topographic and tomographic parametersbetween these datasets (P > 0.05, Table 3). Both modelswere tested with the validation dataset. Only these re-sults were represented.In LDA, the final model contained the following pa-
rameters, ordered by their importance to the algorithm:ARTh, SPA1, IntInverseR, PachySlope, Radius and A1V.The prediction based on Sn and Sp for mild, moderate,and advanced KC versus healthy were 73%/81%, 62%/83%, 68%/95% versus 82%/97%, respectively (Fig. 2). Theoverall accuracy for classifying the severity of KC was71% (Table 4).In RF, the final model (with default cut-off values = 1/
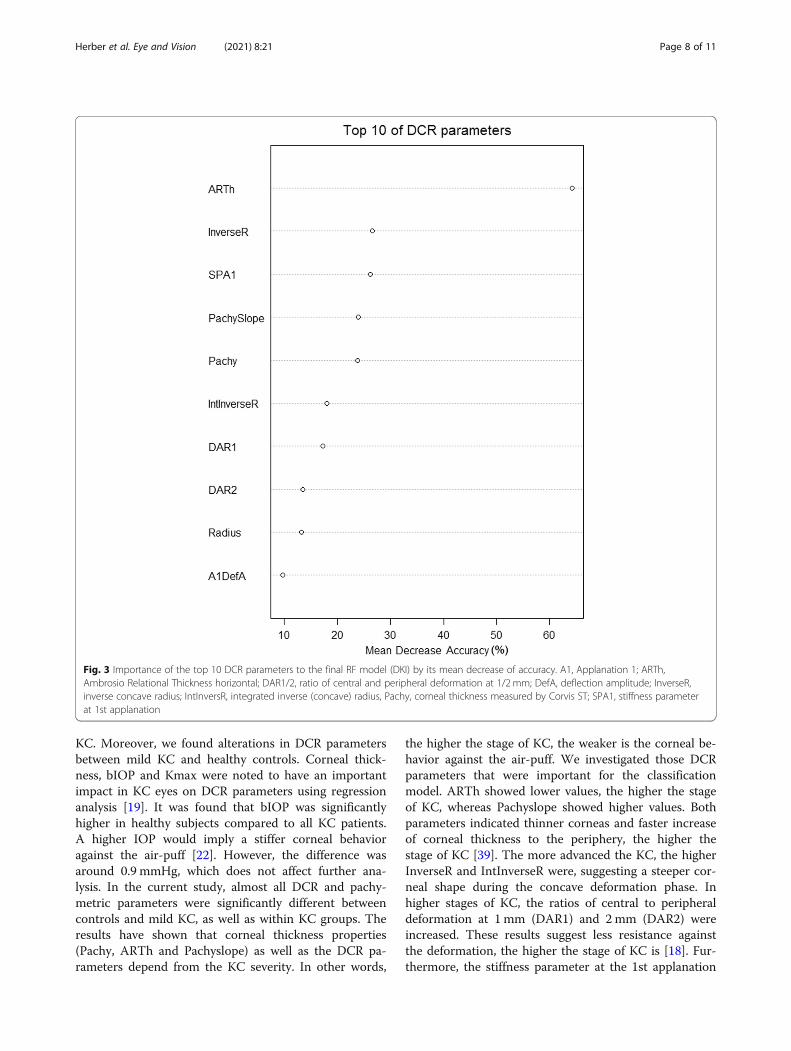
groups (0.25, 0.25, 0.25 and 0.25)) predicted the severityof mild, moderate, advanced KC versus healthy with aSn/Sp of 57%/93%, 63%/92%, 87%/93% versus 100%/88%,respectively. The overall accuracy was 75% (Table 4).The final model included the following parameters (Top10 out of 11), ordered by their importance to the model:ARTh, InverseR, SPA1, PachySlope, Pachy, IntInverseR,DAR1, DAR2, Radius and A1DefA (Fig. 3). The final RFmodel showed relatively low Sn for mild and moderateKC. Additionally, almost half of the mild KC cases wereclassified as healthy (Table 4). Therefore, the cut-off
Fig. 1 Flow chart of data analysis and selection
Herber et al. Eye and Vision (2021) 8:21 Page 5 of 11
values of the RF model were adjusted to 0.36, 0.16, 0.19and 0.29, improving especially the Sn for mild KC cases.The resulting optimized RF model (DKI) predicted mild,moderate, advanced KC versus healthy with a Sn and Spof, 80%/90%, 63%/87%, 72%/95% versus 91%/94%, re-spectively (Fig. 2). The overall accuracy was 78% (Table4) and therefore higher than the LDA as well as RFmodel with default cut-off values.Comparing the general KC detection by DKI and LDA
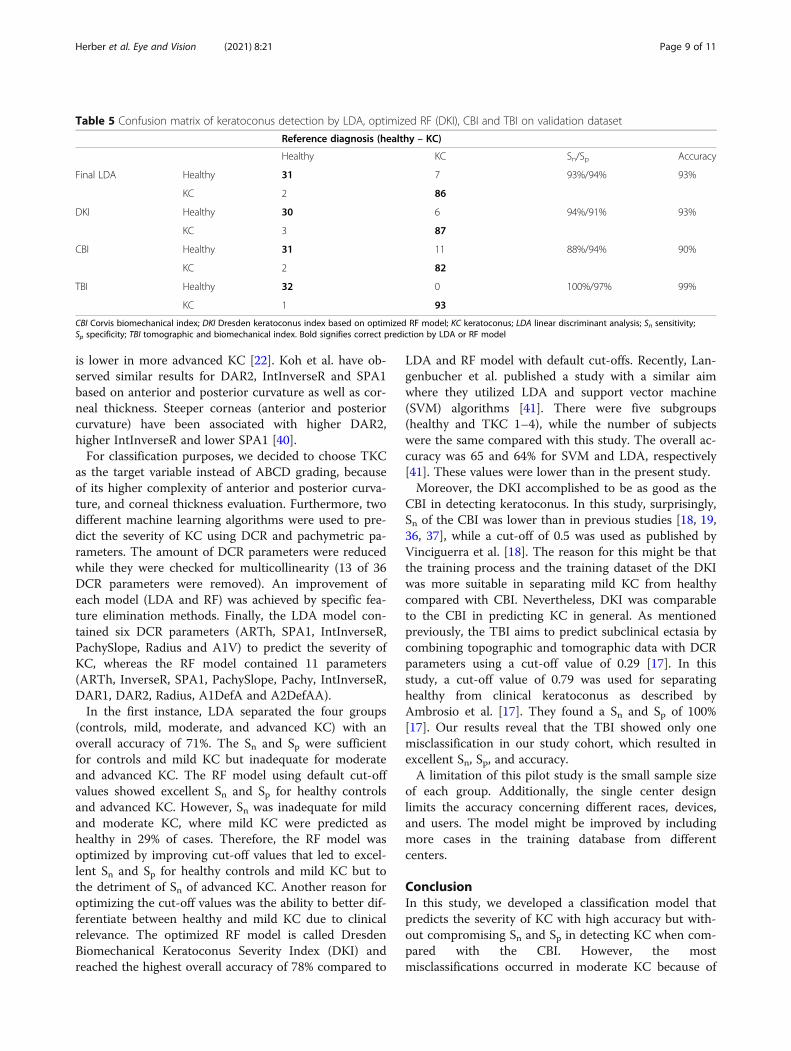
models with established CBI and TBI, all severity
subgroups were assigned to the KC group. Each of thebiomechanically based indices (DKI, LDA and CBI)showed an accuracy of more than 90% (Table 5). Theprediction of KC by DKI and LDA model was as good asCBI. The TBI reached a Sn and Sp of 100%/99% in de-tecting KC.
DiscussionBiomechanical assessment using the Corvis ST is a use-ful tool to evaluate in vivo corneal biomechanics and isable to screen for KC and subclinical KC [17, 18]. TheCBI is a combined index, which is based on logistic re-gression analysis where the final beta is transformed intoa logistic sigmoid function and a cut-off value of 0.5 dis-criminates healthy (CBI < 0.5) from KC (CBI > 0.5). Clin-ical studies have shown high sensitivity and specificity indetecting KC [18, 19, 36, 37]. Contrarily, TBI combinestomographic and biomechanical data using random for-est with leave-one-out cross validation, where a cut-offvalue of 0.29 provided an excellent accuracy in detectingKC and eyes with normal topography and tomographywhere the fellow eyes showed ectasia [17, 37, 38]. A cut-off value of 0.75 was found to detect clinical keratoconuswith a Sn and Sp of 100%. However, the indices are notdesigned to predict the severity of KC. To the best ofour knowledge, this is the first study that has used a ran-dom forest algorithm to predict the severity of KC basedon DCR and pachymetric parameters derived from air-puff tonometry.In our previous work, we showed with a smaller sam-
ple size, that DCR parameters were different in certainstages of KC [19]. However, differences were more pro-nounced between mild KC (TKC 1) and advanced KC(TKC 3) than between mild (TKC 1) and moderate(TKC 2) KC as well as between moderate and advanced
Table 2 Comparison of the Top 10 DCR and pachymetric parameters between healthy and KC subjects in order of its importance inclassification models
Healthy Keratoconus P value Mild KC Moderate KC Advanced KC P value* P value† P value‡
ARTh 533 ± 95 236 ± 126 < 0.001 348 ± 128 227 ± 75 132 ± 50 < 0.001 < 0.001 < 0.001
InverseR (mm-1) 0.17 ± 0.04 0.23 ± 0.04 < 0.001 0.20 ± 0.02 0.23 ± 0.03 0.26 ± 0.04 < 0.001 < 0.001 < 0.001
SPA1 (mmHg/mm) 109.5 ± 15.3 68.9 ± 18.9 < 0.001 82.6 ± 13.5 69.3 ± 15.6 54.5 ± 16.0 < 0.001 < 0.001 < 0.001
Pachyslope (μm) 43.1 ± 8.1 72.8 ± 29.5 < 0.001 52.6 ± 12.7 69.2 ± 19.4 97.1 ± 33.0 0.003 < 0.001 < 0.001
Pachy (μm) 564 ± 26 487 ± 42 < 0.001 513 ± 30 491 ± 34 458 ± 43 < 0.001 < 0.001 < 0.001
IntInversR (mm-1) 8.2 ± 1.1 11.7 ± 2.5 < 0.001 9.8 ± 1.3 11.7 ± 1.6 13.8 ± 2.5 < 0.001 < 0.001 < 0.001
DAR2 (mm) 4.20 ± 0.44 5.76 ± 1.14 < 0.001 4.98 ± 0.61 5.66 ± 0.73 6.64 ± 1.30 < 0.001 < 0.001 < 0.001
DAR1 (mm) 1.57 ± 0.06 1.71 ± 0.08 < 0.001 1.65 ± 0.06 1.71 ± 0.07 1.76 ± 0.08 < 0.001 < 0.001 < 0.001
Radius (mm) 7.27 ± 0.83 5.66 ± 0.96 < 0.001 6.43 ± 0.74 5.59 ± 0.69 4.95 ± 0.82 < 0.001 < 0.001 < 0.001
A1DefA (mm) 0.10 ± 0.01 0.11 ± 0.02 < 0.001 0.10 ± 0.01 0.11 ± 0.01 0.12 ± 0.02 0.151 0.002 < 0.001
* Between Healthy and mild KC; † Between mild KC and moderate KC; ‡ Between moderate KC and advanced KC. A1 applanation 1; ARTh Ambrosio relationalthickness horizontal; DAR1/2 ratio of central and peripheral deformation at 1/2 mm; DefA deflection amplitude; InverseR inverse concave radius;IntInversR integrated inverse (concave) radius, Pachy corneal thickness measured by Corvis ST; Radius anterior corneal curvature from 2-dimensional corneal cross-section by Corvis ST; SPA1 stiffness parameter at 1st applanation. Bold type signifies P < 0.05
Table 3 Comparison of demographics between training andvalidation dataset
Training dataset Validation dataset P value
N 308 126 N.A.
Healthy 83 33
Mild KC 71 35
Moderate KC 73 35
Advanced KC 81 23
Age (years) 32.0 ± 8.0 32.3 ± 8.1 0.721
Km (D) 45.9 ± 3.6 45.9 ± 3.8 0.898
Kmax (D) 51.5 ± 6.7 51.2 ± 6.5 0.617
I-S value (D) 4.3 ± 4.0 3.8 ± 3.5 0.250
ARC (mm) 7.1 ± 0.7 7.1 ± 0.7 0.668
PRC (mm) 5.5 ± 0.7 5.6 ± 0.7 0.535
TCT (μm) 499 ± 54 497 ± 56 0.810
BAD-D 5.7 ± 4.4 5.4 ± 4.4 0.531
bIOP (mmHg) 14.5 ± 2.1 14.6 ± 2.1 0.659
ARC anterior radius of curvature; BAD-D Belin/Ambrósio total deviation value;bIOP biomechanical intraocular pressure by Corvis ST; I-S inferior-superior;Km mean keratometry values; Kmax maximal keratometry value; N number ofsubjects; N.A. not applicable; PRC posterior radius of curvature; TCT thinnestcorneal thickness. Bold type signifies P < 0.05
Herber et al. Eye and Vision (2021) 8:21 Page 6 of 11

Fig. 2 Comparison ROC curves of final LDA (left) and RF model with optimized cut-offs (DKI, right). ROC, receiver operating characteristics; AUC,area under curve; LDA, linear discriminant analysis; DKI, Dresden keratoconus index
Table 4 Confusion matrix of keratoconus severity prediction by LDA and RF models on validation dataset
Reference classification based on TKC
Final LDA model Healthy Mild KC Moderate KC Advanced KC Overall accuracy
Prediction Healthy 31 7 0 0 71%
Mild KC 2 19 5 0
Moderate KC 0 9 21 4
Advanced K 0 0 9 19
Sn/Sp 82%/97% 73%/81% 62%/83% 68%/95%
Final RF model (default cut-off) Healthy Mild KC Moderate KC Advanced KC Overall accuracy
Prediction Healthy 33 10 1 0 75%
Mild KC 0 20 6 0
Moderate KC 0 4 22 3
Advanced K 0 1 6 20
Sn/Sp 100%/88% 57%/93% 63%/92% 87%/93%
Final RF model (optimized cut-off) Healthy Mild KC Moderate KC Advanced KC Overall accuracy
Final prediction (DKI) Healthy 30 5 1 0 78%
Mild KC 3 28 6 0
Moderate KC 0 1 22 5
Advanced KC 0 1 6 18
Sn/Sp 91%/94% 80%/90% 63%/87% 72%/95%
DKI Dresden keratoconus index based on optimized RF model; KC keratoconus; LDA linear discriminant analysis; RF random forest; Sn sensitivity; Sp = specificity;TBI tomographic and biomechanical index. Bold signifies correct prediction by LDA or RF model
Herber et al. Eye and Vision (2021) 8:21 Page 7 of 11
KC. Moreover, we found alterations in DCR parametersbetween mild KC and healthy controls. Corneal thick-ness, bIOP and Kmax were noted to have an importantimpact in KC eyes on DCR parameters using regressionanalysis [19]. It was found that bIOP was significantlyhigher in healthy subjects compared to all KC patients.A higher IOP would imply a stiffer corneal behavioragainst the air-puff [22]. However, the difference wasaround 0.9 mmHg, which does not affect further ana-lysis. In the current study, almost all DCR and pachy-metric parameters were significantly different betweencontrols and mild KC, as well as within KC groups. Theresults have shown that corneal thickness properties(Pachy, ARTh and Pachyslope) as well as the DCR pa-rameters depend from the KC severity. In other words,
the higher the stage of KC, the weaker is the corneal be-havior against the air-puff. We investigated those DCRparameters that were important for the classificationmodel. ARTh showed lower values, the higher the stageof KC, whereas Pachyslope showed higher values. Bothparameters indicated thinner corneas and faster increaseof corneal thickness to the periphery, the higher thestage of KC [39]. The more advanced the KC, the higherInverseR and IntInverseR were, suggesting a steeper cor-neal shape during the concave deformation phase. Inhigher stages of KC, the ratios of central to peripheraldeformation at 1 mm (DAR1) and 2mm (DAR2) wereincreased. These results suggest less resistance againstthe deformation, the higher the stage of KC is [18]. Fur-thermore, the stiffness parameter at the 1st applanation
Fig. 3 Importance of the top 10 DCR parameters to the final RF model (DKI) by its mean decrease of accuracy. A1, Applanation 1; ARTh,Ambrosio Relational Thickness horizontal; DAR1/2, ratio of central and peripheral deformation at 1/2 mm; DefA, deflection amplitude; InverseR,inverse concave radius; IntInversR, integrated inverse (concave) radius, Pachy, corneal thickness measured by Corvis ST; SPA1, stiffness parameterat 1st applanation
Herber et al. Eye and Vision (2021) 8:21 Page 8 of 11
is lower in more advanced KC [22]. Koh et al. have ob-served similar results for DAR2, IntInverseR and SPA1based on anterior and posterior curvature as well as cor-neal thickness. Steeper corneas (anterior and posteriorcurvature) have been associated with higher DAR2,higher IntInverseR and lower SPA1 [40].For classification purposes, we decided to choose TKC
as the target variable instead of ABCD grading, becauseof its higher complexity of anterior and posterior curva-ture, and corneal thickness evaluation. Furthermore, twodifferent machine learning algorithms were used to pre-dict the severity of KC using DCR and pachymetric pa-rameters. The amount of DCR parameters were reducedwhile they were checked for multicollinearity (13 of 36DCR parameters were removed). An improvement ofeach model (LDA and RF) was achieved by specific fea-ture elimination methods. Finally, the LDA model con-tained six DCR parameters (ARTh, SPA1, IntInverseR,PachySlope, Radius and A1V) to predict the severity ofKC, whereas the RF model contained 11 parameters(ARTh, InverseR, SPA1, PachySlope, Pachy, IntInverseR,DAR1, DAR2, Radius, A1DefA and A2DefAA).In the first instance, LDA separated the four groups
(controls, mild, moderate, and advanced KC) with anoverall accuracy of 71%. The Sn and Sp were sufficientfor controls and mild KC but inadequate for moderateand advanced KC. The RF model using default cut-offvalues showed excellent Sn and Sp for healthy controlsand advanced KC. However, Sn was inadequate for mildand moderate KC, where mild KC were predicted ashealthy in 29% of cases. Therefore, the RF model wasoptimized by improving cut-off values that led to excel-lent Sn and Sp for healthy controls and mild KC but tothe detriment of Sn of advanced KC. Another reason foroptimizing the cut-off values was the ability to better dif-ferentiate between healthy and mild KC due to clinicalrelevance. The optimized RF model is called DresdenBiomechanical Keratoconus Severity Index (DKI) andreached the highest overall accuracy of 78% compared to
LDA and RF model with default cut-offs. Recently, Lan-genbucher et al. published a study with a similar aimwhere they utilized LDA and support vector machine(SVM) algorithms [41]. There were five subgroups(healthy and TKC 1–4), while the number of subjectswere the same compared with this study. The overall ac-curacy was 65 and 64% for SVM and LDA, respectively[41]. These values were lower than in the present study.Moreover, the DKI accomplished to be as good as the
CBI in detecting keratoconus. In this study, surprisingly,Sn of the CBI was lower than in previous studies [18, 19,36, 37], while a cut-off of 0.5 was used as published byVinciguerra et al. [18]. The reason for this might be thatthe training process and the training dataset of the DKIwas more suitable in separating mild KC from healthycompared with CBI. Nevertheless, DKI was comparableto the CBI in predicting KC in general. As mentionedpreviously, the TBI aims to predict subclinical ectasia bycombining topographic and tomographic data with DCRparameters using a cut-off value of 0.29 [17]. In thisstudy, a cut-off value of 0.79 was used for separatinghealthy from clinical keratoconus as described byAmbrosio et al. [17]. They found a Sn and Sp of 100%[17]. Our results reveal that the TBI showed only onemisclassification in our study cohort, which resulted inexcellent Sn, Sp, and accuracy.A limitation of this pilot study is the small sample size
of each group. Additionally, the single center designlimits the accuracy concerning different races, devices,and users. The model might be improved by includingmore cases in the training database from differentcenters.
ConclusionIn this study, we developed a classification model thatpredicts the severity of KC with high accuracy but with-out compromising Sn and Sp in detecting KC when com-pared with the CBI. However, the mostmisclassifications occurred in moderate KC because of
Table 5 Confusion matrix of keratoconus detection by LDA, optimized RF (DKI), CBI and TBI on validation dataset
Reference diagnosis (healthy – KC)
Healthy KC Sn/Sp Accuracy
Final LDA Healthy 31 7 93%/94% 93%
KC 2 86
DKI Healthy 30 6 94%/91% 93%
KC 3 87
CBI Healthy 31 11 88%/94% 90%
KC 2 82
TBI Healthy 32 0 100%/97% 99%
KC 1 93
CBI Corvis biomechanical index; DKI Dresden keratoconus index based on optimized RF model; KC keratoconus; LDA linear discriminant analysis; Sn sensitivity;Sp specificity; TBI tomographic and biomechanical index. Bold signifies correct prediction by LDA or RF model
Herber et al. Eye and Vision (2021) 8:21 Page 9 of 11
an overlap with mild and advanced KC. The DKI ismainly influenced by pachymetric parameters. However,DCR parameters describing properties of corneal de-formation against the air-puff have a major impact onDKI as well. The clinical importance of the DKI is that asole measurement of Scheimpflug-based tonometry isable to predict the severity of KC without any topo-graphical and tomographical information. This could beinteresting for clinical users that have a standalone Cor-vis ST without a Pentacam. Further studies should beconducted to determine the suitability of the DKI as afollow up parameter.
Supplementary InformationThe online version contains supplementary material available at https://doi.org/10.1186/s40662-021-00244-4.
Additional file 1.
AcknowledgementsThe authors thank Prof. Dr. Eberhard Spoerl for his valuable support in thisproject.
Authors’ contributionsRH and FR designed the study. RH collected, analyzed and interpreted thedata. RH drafted the manuscript. LEP and FR critically revised the manuscriptfor intellectual content. All authors read and approved the final manuscript.
FundingRH and FR were supported by a research grant from the Indo-German Sci-ence and Technology Center, Department of Science and Technology, DLR,Germany (grant number: 01DQ15016A).
Availability of data and materialsThe dataset used and/or analyzed during the current study are availablefrom the corresponding author upon reasonable request.
Declarations
Ethics approval and consent to participateThe study protocol was approved by the ethics committee of the UniversityHospital Carl Gustav Carus, Dresden, TU Dresden, Germany following thetenets of the Declaration of Helsinki (EK 104032018). The study is part of the“Dresden Corneal Disease and Treatment Study” (NCT04251143). Beforeenrolment, all participants were informed about study purposes, methodsand data analysis and an informed consent was signed.
Consent for publicationAll participants have confirmed a consent for publication.
Competing interestsAll authors have no conflicts of interests to be declared. There are nofinancial interests to disclose.
Received: 17 November 2020 Accepted: 6 May 2021
References1. Wagner H, Barr JT, Zadnik K. Collaborative longitudinal evaluation of
keratoconus (CLEK) study: methods and findings to date. Cont Lens AnteriorEye. 2007;30(4):223–32.
2. Kennedy RH, Bourne WM, Dyer JA. A 48-year clinical and epidemiologicstudy of keratoconus. Am J Ophthalmol. 1986;101(3):267–73.
3. Godefrooij DA, de Wit GA, Uiterwaal CS, Imhof SM, Wisse RP. Age-specificincidence and prevalence of keratoconus: a nationwide registration study.Am J Ophthalmol. 2017;175:169–72.
4. Torres Netto EA, Al-Otaibi WM, Hafezi NL, Kling S, Al-Farhan HM, RandlemanJB, et al. Prevalence of keratoconus in paediatric patients in Riyadh, SaudiArabia. Br J Ophthalmol. 2018;102(10):1436–41.
5. Andreassen TT, Simonsen AH, Oxlund H. Biomechanical properties ofkeratoconus and normal corneas. Exp Eye Res. 1980;31(4):435–41.
6. Roberts CJ, Dupps WJ Jr. Biomechanics of corneal ectasia andbiomechanical treatments. J Cataract Refract Surg. 2014;40(6):991–8.
7. Terai N, Raiskup F, Haustein M, Pillunat LE, Spoerl E. Identification ofbiomechanical properties of the cornea: the ocular response analyzer. CurrEye Res. 2012;37(7):553–62.
8. Roberts CJ. Concepts and misconceptions in corneal biomechanics. JCataract Refract Surg. 2014;40(6):862–9.
9. Labiris G, Gatzioufas Z, Sideroudi H, Giarmoukakis A, Kozobolis V, Seitz B.Biomechanical diagnosis of keratoconus: evaluation of the keratoconusmatch index and the keratoconus match probability. Acta Ophthalmol.2013;91(4):e258–62.
10. Goebels S, Eppig T, Wagenpfeil S, Cayless A, Seitz B, Langenbucher A.Staging of keratoconus indices regarding tomography, topography, andbiomechanical measurements. Am J Ophthalmol. 2015;159(4):733–8.
11. Goebels S, Eppig T, Wagenpfeil S, Cayless A, Seitz B, Langenbucher A.Complementary keratoconus indices based on topographical interpretationof biomechanical waveform parameters: a supplement to establishedkeratoconus indices. Comput Math Methods Med. 2017;2017:5293573.
12. Lopes BT, Roberts CJ, Elsheikh A, Vinciguerra R, Vinciguerra P, Reisdorf S,et al. Repeatability and reproducibility of intraocular pressure and dynamiccorneal response parameters assessed by the Corvis ST. J Ophthalmol. 2017;2017:8515742.
13. Herber R, Vinciguerra R, Lopes B, Raiskup F, Pillunat LE, Vinciguerra P, et al.Repeatability and reproducibility of corneal deformation responseparameters of dynamic ultra-high-speed Scheimpflug imaging inkeratoconus. J Cataract Refract Surg. 2020;46(1):86–94.
14. Hashemi H, Ambrósio R Jr, Vinciguerra R, Vinciguerra P, Roberts CJ, GhaffariR, et al. Two-year changes in corneal stiffness parameters after acceleratedcorneal cross-linking. J Biomech. 2019;93:209–12.
15. Vinciguerra R, Romano V, Arbabi EM, Brunner M, Willoughby CE, BatterburyM, et al. In vivo early corneal biomechanical changes after corneal cross-linking in patients with progressive keratoconus. J Refract Surg. 2017;33(12):840–6.
16. Vinciguerra R, Tzamalis A, Romano V, Arbabi EM, Batterbury M, Kaye SB.Assessment of the association between in vivo corneal biomechanicalchanges after corneal cross-linking and depth of demarcation line. J RefractSurg. 2019;35(3):202–6.
17. Ambrósio R Jr, Lopes BT, Faria-Correia F, Salomão MQ, Bühren J, Roberts CJ,et al. Integration of Scheimpflug-based corneal tomography andbiomechanical assessments for enhancing ectasia detection. J Refract Surg.2017;33(7):434–43.
18. Vinciguerra R, Ambrósio R Jr, Elsheikh A, Roberts CJ, Lopes B, Morenghi E,et al. Detection of keratoconus with a new biomechanical index. J RefractSurg. 2016;32(12):803–10.
19. Herber R, Ramm L, Spoerl E, Raiskup F, Pillunat LE, Terai N. Assessment ofcorneal biomechanical parameters in healthy and keratoconic eyes usingdynamic bidirectional applanation device and dynamic Scheimpfluganalyzer. J Cataract Refract Surg. 2019;45(6):778–88.
20. Valbon BF, Ambrósio R Jr, Fontes BM, Alves MR. Effects of age on cornealdeformation by non-contact tonometry integrated with an ultra-high-speed(UHS) Scheimpflug camera. Arq Bras Oftalmol. 2013;76(4):229–32.
21. Hon Y, Lam AK. Corneal deformation measurement using Scheimpflugnoncontact tonometry. Optom Vis Sci. 2013;90(1):e1–8.
22. Roberts CJ, Mahmoud AM, Bons JP, Hossain A, Elsheikh A, Vinciguerra R,et al. Introduction of two novel stiffness parameters and interpretation of airpuff-induced biomechanical deformation parameters with a dynamicScheimpflug analyzer. J Refract Surg. 2017;33(4):266–73.
23. Pillunat KR, Herber R, Spoerl E, Erb C, Pillunat LE. A new biomechanicalglaucoma factor to discriminate normal eyes from normal pressureglaucoma eyes. Acta Ophthalmol. 2019;97(7):e962–7.
24. Ramm L, Spoerl E, Pillunat LE, Terai N. Is the corneal thickness profile alteredin diabetes mellitus? Curr Eye Res. 2020;45(10):1228–34.
25. Joda AA, Shervin MM, Kook D, Elsheikh A. Development and validation of acorrection equation for Corvis tonometry. Comput Methods BiomechBiomed Engin. 2016;19(9):943–53.
Herber et al. Eye and Vision (2021) 8:21 Page 10 of 11
26. Vinciguerra R, Elsheikh A, Roberts CJ, Ambrósio R Jr, Kang DS, Lopes BT,et al. Influence of pachymetry and intraocular pressure on dynamic cornealresponse parameters in healthy patients. J Refract Surg. 2016;32(8):550–61.
27. Spira C, Grigoryan A, Szentmáry N, Seitz B, Langenbucher A, Eppig T.Comparison of the specificity and sensitivity of various instrument-guidedkeratoconus indices and classifiers. Ophthalmologe. 2015;112(4):353–8.
28. Belin MW, Duncan JK. Keratoconus: the ABCD grading system. Klin MonatsblAugenheilkd. 2016;233(6):701–7.
29. Lopes BT, Ramos IC, Salomão MQ, Guerra FP, Schallhorn SC, Schallhorn JM,et al. Enhanced tomographic assessment to detect corneal ectasia based onartificial intelligence. Am J Ophthalmol. 2018;195:223–32.
30. Rabinowitz YS, Rasheed K, Yang H, Elashoff J. Accuracy of ultrasonicpachymetry and videokeratography in detecting keratoconus. J CataractRefract Surg. 1998;24(2):196–201.
31. Maeda N, Klyce SD, Smolek MK, Thompson HW. Automated keratoconusscreening with corneal topography analysis. Invest Ophthalmol Vis Sci. 1994;35(6):2749–57.
32. Kleinhans S, Herrmann E, Kohnen T, Buhren J. Comparison of discriminantanalysis and decision trees for the detection of subclinical keratoconus. KlinMonatsbl Augenheilkd. 2019;236(6):798–805.
33. Lopes BT, Eliasy A, Ambrósio R Jr. Artificial intelligence in corneal diagnosis:where are we? Curr Ophthalmol Rep. 2019;7(3):204–11.
34. Rebala G, Ravi A, Churiwala S. An introduction to machine learning. Cham:Springer International Publishing; 2019.
35. Timm NH. Applied multivariate analysis. New York: Springer; 2002.36. Sedaghat MR, Momeni-Moghaddam H, Ambrósio R Jr, Heidari HR, Maddah
N, Danesh Z, et al. Diagnostic ability of corneal shape and biomechanicalparameters for detecting frank keratoconus. Cornea. 2018;37(8):1025–34.
37. Kataria P, Padmanabhan P, Gopalakrishnan A, Padmanaban V, Mahadik S,Ambrósio R. Accuracy of Scheimpflug-derived corneal biomechanical andtomographic indices for detecting subclinical and mild keratectasia in aSouth Asian population. J Cataract Refract Surg. 2019;45(3):328–36.
38. Ferreira-Mendes J, Lopes BT, Faria-Correia F, Salomão MQ, Rodrigues-BarrosS, Ambrósio R Jr. Enhanced ectasia detection using corneal tomographyand biomechanics. Am J Ophthalmol. 2019;197:7–16.
39. Ambrósio R Jr, Alonso RS, Luz A, Coca Velarde LG. Corneal-thickness spatialprofile and corneal-volume distribution: tomographic indices to detectkeratoconus. J Cataract Refract Surg. 2006;32(11):1851–9.
40. Koh S, Inoue R, Ambrósio R Jr, Maeda N, Miki A, Nishida K. Correlationbetween corneal biomechanical indices and the severity of keratoconus.Cornea. 2020;39(2):215–21.
41. Langenbucher A, Häfner L, Eppig T, Seitz B, Szentmáry N, Flockerzi E.Keratoconus detection and classification from parameters of the Corvis® ST :a study based on algorithms of machine learning. Ophthalmologe. 2020.https://doi.org/10.1007/s00347-020-01231-1.
Herber et al. Eye and Vision (2021) 8:21 Page 11 of 11