development management group, inc. - californiaeconomy.scag.ca.gov/economy site document...
TRANSCRIPT
Development Management Group, Inc.economic development fiscal & economic analysis development management
41-625 Eclectic Street, Suite D-2 Palm Desert, CA 92260
Office: (760) 346-8820 Mobile: (760) 272-9136 Fax: (760) 346-8887
[email protected] www.dmgeconomics.com
SOUTHERN CALIFORNIA ASSOCIATION OF GOVERNMENTS
Project: 12-043-C09-T06
(Imperial County, California)
Economic Forecast 2016
Final Report
December 18, 2015

SCAG 12-043-C9-T06 Imperial County, CA 2016 Economic Forecast 12/18/15 Final Page 1
Task Order Information
The Southern California Association of Governments (SCAG) has contacted with Development Management Group, Inc.
(DMG) to provide a 2016 Economic Forecast for Imperial County ( SCAG Task Order Number 12-043-C09-T06: 2016
Economic Forecast for Imperial County, California). The forecast will provide key data points and analysis in a number
of areas. This information is used in concert with similar research and analysis to better determine the potential for
economic growth across Southern California as a whole and Imperial County specifically.
1. Introduction to Imperial County
Imperial County is located in the southeast corner of California and shares borders with San Diego County, Riverside
County, Yuma County (Arizona) and Mexico (and the region and City of Mexicali). The County has a population of
approximately 179,091. This represents an increase of 4,563 from 174,528 (or about 3% since 2010). The economy of
the region is based on the following industries:
A. Agriculture
B. Energy Production (Solar, Wind, Geothermal)
C. Prison/Detention Facilities (Federal and State)
D. Border Security (namely Department of Homeland Security)
E. Logistics (Goods Movement of Agriculture Products and Products Assembled in Mexicali through the
Maquiladora Program).
The Imperial Valley, as with most regions based on seasonal economies (like agriculture) does experience high
unemployment rates. Additionally, because agriculture workers are generally paid a low wage, the rate of poverty in the
region is higher than state or national averages.
Over the last ten (10) years, the region has experienced a renaissance through economic investment in the form of
utility scale renewable power production facilities (solar, wind, geothermal) and foreign-direct investment through the
EB-5 Visa program*.
Note: The EB-5 Visa program, administered through the United States Customs and Immigration Service (USCIS) provides
an opportunity to for permanent residency in the United States by foreign nationals that invest a minimum of $500,000
into a business/development that generates 10 or more permanent full-time jobs.
As the Renewable Portfolio Standard (RPS) requirements continue to increase, so will investment in the region.
California is just finishing up an era where the RPS was 33% and that helped lead to a total of thirty-four (34) separate
renewable production projects. By 2020, it is projected that all of the major investor owned utilities will meet the 33%
RPS standard with SDG&E leading the way at 38.8%. SDG&E’s leadership can be attributed (in part) to the Sunrise
Powerlink that moves utility-scale power production from the Imperial Valley to San Diego County. Assembly Bill 197
moves the needle from 33% (2020) to 50% by 2030. This will pave the way for additional economic investment.
The Imperial Valley currently hosts thirty-four (34) renewable energy projects comprising of some 32,746 acres (51.16
square miles) which is larger than the entire City of Anaheim, CA. The region produces over 3,266MW of power (enough
for approximately 2.3 million people or the entire population of the Cities of San Diego and San Francisco COMBINED!).

SCAG 12-043-C9-T06 Imperial County, CA 2016 Economic Forecast 12/18/15 Final Page 2
The report that follows will provide a statistical understanding of the region’s economy. After which the report will
conclude with a forecast section to guide potential investors, government officials, business leaders and residents into
2016.
Table of Contents
1. Introduction to Imperial County
2. Status of Economic Recovery
Ex. A: Total Available Workforce
Ex. B: Total Persons Employed
Ex. C: Total Persons Unemployed
Ex. D: Unemployment Rate
3. Industry & Occupational Analysis
Ex. E: Distribution of Jobs by Occupation (2015)
Ex. F: Professions with Highest Anticipated Growth (2012-2022) by Number of Positions
Ex. G: Professions with Highest Anticipated Growth (2012-2022) by Percentage of Position Growth
Ex. H: Occupational Categories by Median Pay
Ex. I: Median Pay of Occupations Identified as High Growth Industries (Annual Pay of $40k+)
4. Agriculture Production as a Leading Industry
Ex. J: Total Agriculture Production
Ex. K: Livestock Production
Ex. L: Field Crop Production
Ex. M: Vegetable & Melon Crop Production
Ex. N: Total Fruit & Nut Production
Ex. O: Seed & Nursery Production
Ex. P: Apiary (Honey/Wax/Pollination) Production
5. Income/Poverty Statistics
Ex. Q: Median Household Income
Ex. R: Household Income Distribution
Ex. S: Median Per Capita Income
Ex. T: Percentage of Residence Living in Poverty (Adults & Children)
Ex. U: Percentage of Residents With-out Health Insurance
6. Educational Attainment & Earnings
Ex. V: Educational Attainment by Adults 25+
Ex. W: Median Earnings by Educational Attainment
7. Residential Real Estate Market & Assessed Valuation
Ex. X: New Home Sales
Ex. Y: Median Home Prices
Ex. Z: Total Number of Foreclosures by Year
Ex. AA: Total Home Sales (New & Existing)
Ex. BB: Total Assessed Valuation (County of Imperial)
Ex. CC: Property Tax Collection Rates

SCAG 12-043-C9-T06 Imperial County, CA 2016 Economic Forecast 12/18/15 Final Page 3
8. Consumer Confidence
Ex. DD: Sales & Use Tax Permits
Ex. EE: Taxable Sales by Quarter
Ex. FF: Change in Taxable Sales by Quarter
9. K-12 Education Test Scores (Selected 3rd , 7th & 11th Grades)
Ex. GG: 2015 CAASPP 3rd Grade English/Language Arts Test Results
Ex. HH: 2015 CAASPP 3rd Grade Math Test Results
Ex. II: 2015 CAASPP 7th Grade English/Language Arts Test Results
Ex. JJ: 2015 CAASPP 7th Grade Math Test Results
Ex. KK: 2015 CAASPP 11th Grade English/Language Arts Test Results
Ex. LL: 2015 CAASPP 11th Grade Math Test Results
10. Economic Outlook for 2016
11. References
12. Certification
2. Status of Economic Recovery
As of November, 2015 (the latest number available), the unemployment rate in Imperial County was 20.п%. This figure is
down from 23.9% this time in 2014 and 26.3% at this time in 2013. During the “Great Recession”, unemployment rates
in Imperial County peaked at about 32%.
The total number of persons in the labor force is 300 less today than it was one year ago while the total number of those
employed has increased by 2,500. This is what has resulted in a significant decline in the unemployment rate (from
23.7% to 20.3%). In past forecasts, it has been discussed that as the economy began to recover, migrant workers from
Mexicali were reentering the workforce through Imperial County. The reduction in workforce availability is likely a result
of these same workers moving toward jobs in more urbanized areas (San Diego, Orange County and Los Angeles)
returning to the industries they were in prior to the “Great Depression”.
Exhibits A-D provides trend data regarding the labor force, employment, total persons unemployed and the
unemployment percentage. The region appears to have survived two major economic blows from 2014 which included
the closing of the National Beef Processing Facility (Brawley, CA) and the Immigration Detention Facility (El Centro, CA).
It is noted that a new Immigration Detention Facility opened east of Calexico, CA in late 2014, though due to the design
and technology, it employs about ½ as many persons as the previous facility in El Centro.
SCAG has often posed the question to regional economist, “When will the County recover the jobs lost in the economic
meltdown of 2007-2009?” In the case of Imperial County, the jobs lost were restored three (3) years ago. Today, there
are 7,600 MORE jobs in the Imperial Valley than there were in 2008 (the previous peak). As you will see throughout this
report, there is evidence of region-wide poverty and low educational achievement that manifests in the types of jobs
generally available.

SCAG 12-043-C9-T06 Imperial County, CA 2016 Economic Forecast 12/18/15 Final Page 4
Exhibit A: Total Available Labor Force
Exhibit B: Total Persons Employed
Exhibit C: Total Persons Unemployed
56,000
61,000
66,000
71,000
76,000
81,000
YR2003
YR2004
YR2005
YR2006
YR2007
YR2008
YR2009
YR2010
YR2011
YR2012
YR2013
YR2014
YR2015
Tota
lPe
rso
ns
Imperial County, CAAvailable Labor Force
48,000
50,000
52,000
54,000
56,000
58,000
60,000
62,000
64,000
YR2003
YR2004
YR2005
YR2006
YR2007
YR2008
YR2009
YR2010
YR2011
YR2012
YR2013
YR2014
YR2015
Pe
rso
ns
Emp
loye
d
Total Persons Employed
7,500
9,500
11,500
13,500
15,500
17,500
19,500
21,500
23,500
YR2003
YR2004
YR2005
YR2006
YR2007
YR2008
YR2009
YR2010
YR2011
YR2012
YR2013
YR2014
YR2015
Pe
rso
ns
Un
em
plo
yed
Total Persons Unemployed

SCAG 12-043-C9-T06 Imperial County, CA 2016 Economic Forecast 12/18/15 Final Page 5
Exhibit D: Unemployment Rate
3. Industry & Occupational Analysis
Economist note: the graphs and analysis that follow in this section are based on minimum current employment of
between 50-150 persons within a specific category (position). While this sounds low in terms of pure numbers, consider
that the population of Imperial County is about 180,000. Scaled in comparison to Los Angeles County where the
population is almost 10 million people, the same minimum requirement ratio is 53.33 persons per Imperial County
person. Another way to explain is for each 50 persons employed in a position in Imperial County it would take 2,667
persons in Los Angeles County to reach the same scaled ratio.
Approximately 30% of the total jobs in Imperial County are within government agencies (local, state and federal). The
seven incorporated cities along with the school and utility districts account for local jobs while state jobs are driven by
the presence of state prisons and Federal jobs are predominately by border security (Department of Homeland
Security). The greatest numbers of private sector jobs are in the agriculture and retail sectors. Exhibit E provides a
breakdown of the number of jobs by occupation to provide a better understanding of skill sets being utilized in the
regional economy. Office/administrative support, sales (mostly retail) and personal care occupations are most plentiful
in the Imperial Valley. The next three highest do include more high paying jobs in the fields of transportation/logistics,
protective services (includes local police/sheriff, prison/detention facility guards and Department of Homeland Security)
and education/training (mostly teachers).
(the balance of this page intentionally left blank)
15.00%
17.00%
19.00%
21.00%
23.00%
25.00%
27.00%
29.00%
YR2003
YR2004
YR2005
YR2006
YR2007
YR2008
YR2009
YR2010
YR2011
YR2012
YR2013
YR2014
YR2015
%o
fLa
bo
rU
ne
mp
loye
d
Imperial County, CAUnemployment Rate

SCAG 12-043-C9-T06 Imperial County, CA 2016 Economic Forecast 12/18/15 Final Page 6
Exhibit E: Distribution of Jobs by Occupation Type
In terms of professional with anticipated growth, Exhibits F provides the total new positions anticipated between 2012-
2022 while Exhibit G provides percentage growth per occupation for the same time period.
Exhibit F: Professions with Anticipated Growth by Total New Positions (100 or More) (2012-2022)
100 1100 2100 3100 4100 5100 6100 7100 8100
Office/Admin Support
Sales
Personal Care
Transportation/Moving
Protective Services
Education/Training
Farming
Management
Construction/Extraction
Building Grounds Maintenance
Production
Food Prep/Service
Maintenance Repair
Business/Financial Operations
Health Practitioner/Tech
Community/Social Services
Healtcare Support
Computer/Mathematical
Architect/Engineer
Legal
Life/Physical/Social Science
Arts/Entertainment/Sports
Imperial County Employment by Occupation (2015)
50
100
150
200
250
300
350
2012-2022 Fastest Growing Occupations(by Total Job Growth: 100 or More)
SCAG 12-043-C9-T06 Imperial County, CA 2016 Economic Forecast 12/18/15 Final Page 7
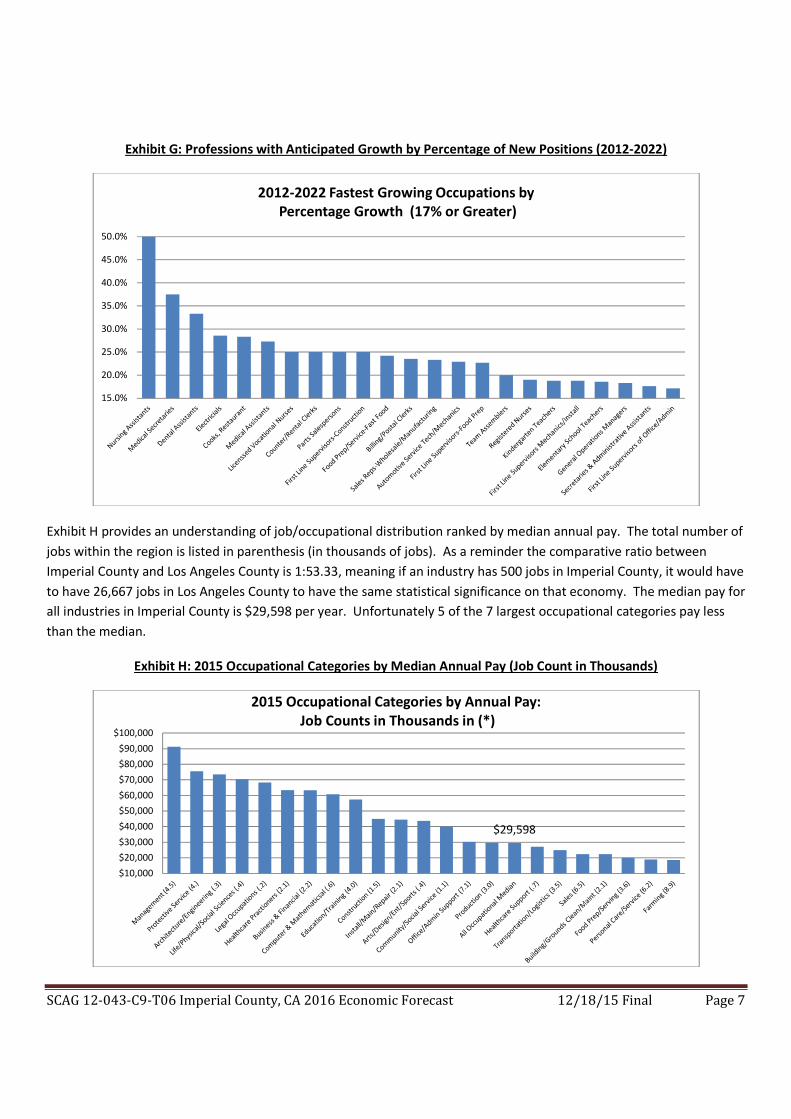
Exhibit G: Professions with Anticipated Growth by Percentage of New Positions (2012-2022)
Exhibit H provides an understanding of job/occupational distribution ranked by median annual pay. The total number of
jobs within the region is listed in parenthesis (in thousands of jobs). As a reminder the comparative ratio between
Imperial County and Los Angeles County is 1:53.33, meaning if an industry has 500 jobs in Imperial County, it would have
to have 26,667 jobs in Los Angeles County to have the same statistical significance on that economy. The median pay for
all industries in Imperial County is $29,598 per year. Unfortunately 5 of the 7 largest occupational categories pay less
than the median.
Exhibit H: 2015 Occupational Categories by Median Annual Pay (Job Count in Thousands)
15.0%
20.0%
25.0%
30.0%
35.0%
40.0%
45.0%
50.0%
2012-2022 Fastest Growing Occupations byPercentage Growth (17% or Greater)
$29,598
$10,000
$20,000
$30,000
$40,000
$50,000
$60,000
$70,000
$80,000
$90,000
$100,000
2015 Occupational Categories by Annual Pay:Job Counts in Thousands in (*)

SCAG 12-043-C9-T06 Imperial County, CA 2016 Economic Forecast 12/18/15 Final Page 8
In terms of employment opportunities that are expected to generate at least 50 jobs in the coming years (by 2022) and
provide an income of at least $40,000 annually, there are only nine categories. Shown below (Exhibit H) include
detective/criminal investigator, general operations managers, teachers, registered nurses, electricians,
accountants/auditors, automotive mechanics, sales representatives (wholesale/manufacturing) and first-line
administrative supervisors.
Exhibit I: Median Pay for Occupations of $40k+ Annually (High Growth Occupations)
4. Agriculture Production as a Leading Industry
Agriculture is still the largest private sector industry in the Imperial Valley. While the jobs associated with the industry
are traditionally low pay, agriculture supports many families in a variety of occupations (direct farming,
professional/business (including accountants) and transportation. Since many of the agriculture related companies are
family owned, the “private” wealth within the region is often rooted in agriculture. For these reasons, additional
analysis is provided on this specific industry.
Exhibit J provides the total agriculture production for Imperial County. In 2014, agriculture production totaled $1.859
billion. This represents a reduction of $299 million from the record high production of $2.158 billion in 2013. Two-
thirds of the reduction can be attributed to the decrease production of livestock as the Imperial Valley saw the closing of
its only beef processing plant in the second quarter of 2014. Livestock production was about $206.9 million (or 34%)
less than it was in 2013. Crop production of vegetables and melons also decreased by $142.1 (16%) million between
2013 and 2014. Much of the reduction in vegetables can be attributed to softer market prices rather than decreased
total production. Crops such as potatoes, sweet corn, cabbage and cauliflower saw significant decreases in market
price.
$30,000
$40,000
$50,000
$60,000
$70,000
$80,000
$90,000
2012-2022 Fastest Growing Occupations(50+ Jobs, $40k+ Annual Age)

SCAG 12-043-C9-T06 Imperial County, CA 2016 Economic Forecast 12/18/15 Final Page 9
The Imperial Valley continues to export a significant amount of crop/seed. In fact 46% of hay production as well as 38%
of vegetables and 16% of seeds are exported to foreign nations. Mexico (39%), Japan (37%) and Republic of Korea (8%)
represent the three nations where the largest amount of crop is exported to. Imperial Valley production is also exported
to other states. Of the crops exported, Hawaii (66.4%) and Florida (29.7%) account for almost all export demand.
In looking at future economic prospects for the agriculture industry, the water crisis in California still looms large, though
there is little statistical or anecdotal evidence of impact. DMG, Inc. still predicts that there could be movement of higher
value crops from the Central Valley (Bakersfield to Sacramento) to the Imperial Valley over time to utilize a more stable
water supply. That said, as world-wide demand for Imperial Valley hay and grass crops continue to keep yields strong
and prices increasing ($220 per ton in 2014 for alfalfa production), farmers may be reluctant to convert their lands.
Exhibit J: Total Agriculture Production (in billions of $) by Year
Exhibit K provides historic production numbers for livestock. Much of the livestock production is specific to “feeder
beef” which is the raising of calves to prepare them for market. During this time an individual animal may consume
approximately 3 tons of feed. Therefore the profit (value) in a particular animal is a function of both market price and
the cost of food. In general the value of livestock in Imperial County has increased over the last four years. This is a
factor of increased domestic and international demand for cattle (beef) as the world economy has continued recovery.
As noted previously in this report, the industry has essentially collapsed in the Imperial Valley as National Beef ceased
operations earlier in 2014. We will see the full impact of the closure in the 2015 Agriculture Report (to be released mid
to late 2016). Outside of beef, there is a small amount of aquatic-fish farming ($13.3 million in 2014) and feedlot sheep
($5.6 million in 2014) produced in the region.
1
1.2
1.4
1.6
1.8
2
2.2
YR2002
YR2003
YR2004
YR2005
YR2006
YR2007
YR2008
YR2009
YR2010
YR2011
YR2012
YR2013
YR2014
Val
ue
inB
illio
ns
of
$
Imperial County Total Agriculture Production(Livestock & Crops)

SCAG 12-043-C9-T06 Imperial County, CA 2016 Economic Forecast 12/18/15 Final Page 10
Exhibit K: Total Livestock Production (in millions of $) by Year
Field crop production within the region continues to be strong ($530.85 million in 2014), up about $60 million from 2013
but is down from their historic highs found in 2012 ($587.9 million). Leading the way for the region was production of
alfalfa hay, sudan and bermuda grass, between them accounting for the greatest amount of all field crops (in terms of
value). For the year 2014 some 322,589 acres were farmed for field crops (504 square miles) By comparison the City of
Los Angeles is 486 square miles. Exhibit L provides a historical chart of field crop production in Imperial County.
Exhibit L: Total Field Crop Production (in millions of $) by Year
Vegetables and melons accounted for $723.3 million of production value in 2014, down over $142 million from 2013.
Broccoli, carrots, cauliflower, onions and various lettuce varieties comprise much of the overall production for this
category. These crops are considered higher value and DMG Economics predicts will likely see increased production if
the water crisis in the balance of the state worsens as production moves toward regions that have a more stable water
supply. Exhibit M reflects the historic production values for Vegetable and Melon crops.
$250
$300
$350
$400
$450
$500
$550
$600
$650
YR2002
YR2003
YR2004
YR2005
YR2006
YR2007
YR2008
YR2009
YR2010
YR2011
YR2012
YR2013
YR2014
Val
ue
inM
illio
ns
of
$
Livestock Production Value
$250
$300
$350
$400
$450
$500
$550
$600
YR2002
YR2003
YR2004
YR2005
YR2006
YR2007
YR2008
YR2009
YR2010
YR2011
YR2012
YR2013
YR2014
Val
ue
inM
illio
ns
of
$
Field Crop Production Value

SCAG 12-043-C9-T06 Imperial County, CA 2016 Economic Forecast 12/18/15 Final Page 11
Exhibit M: Total Vegetable and Melon Crop Production (in millions of $) by Year
Imperial Valley produce is led by lemons and dates. In fact, the region is one of the largest producers of dates in the
world. In 2014, over $35.6 million of dates were produced in the region. Unfortunately, market pricing didn’t agree
with farm production as the market value for dates fell by over 55% between 2013 and 2014. Other fruit and nut
production within the region includes oranges and grapefruit. 2014 production for the entire category was $95 million a
decrease of about $5 million from 2013 when total production was $100 million. The reduction can be attributed to the
production value of dates that fell from $52 million in 2013 ($17 million in a single year). Even with the decrease seen in
2013, this category of agriculture has almost doubled in production in just four (4) years. Exhibit N below shows the
substantial increase in production in a short period.
Exhibit N: Total Fruit & Nut Production (in millions of $) by Year
Exhibit O shows the history of seed production in the region. Seed production is a vital component to the agriculture
economy. There are farming entities that specialize in the generation of seed that is used locally, domestically and
internationally. Further, primary research (interviews) with those in this segment of the industry shows that there is
significant technology and testing involved in creating seeds that provide for higher production, greater drought
tolerance and overall hardiness. In 2014, some $93.8 million of seeds were produced. This is down about 8% from 2013
but still, up from $67 million in 2012. Much of the production was specifically for alfalfa and bermuda grass (finished
crop in these categories is predominately used for animal feed).
$400
$450
$500
$550
$600
$650
$700
$750
$800
$850
$900
YR2002
YR2003
YR2004
YR2005
YR2006
YR2007
YR2008
YR2009
YR2010
YR2011
YR2012
YR2013
YR2014
Val
ue
inM
illio
ns
of
$
Vegetable and Melon Crop Production Value
$30
$40
$50
$60
$70
$80
$90
$100
YR2002
YR2003
YR2004
YR2005
YR2006
YR2007
YR2008
YR2009
YR2010
YR2011
YR2012
YR2013
YR2014
Val
ue
inM
illio
ns
of
$
Fruit & Nut Production Value
SCAG 12-043-C9-T06 Imperial County, CA 2016 Economic Forecast 12/18/15 Final Page 12
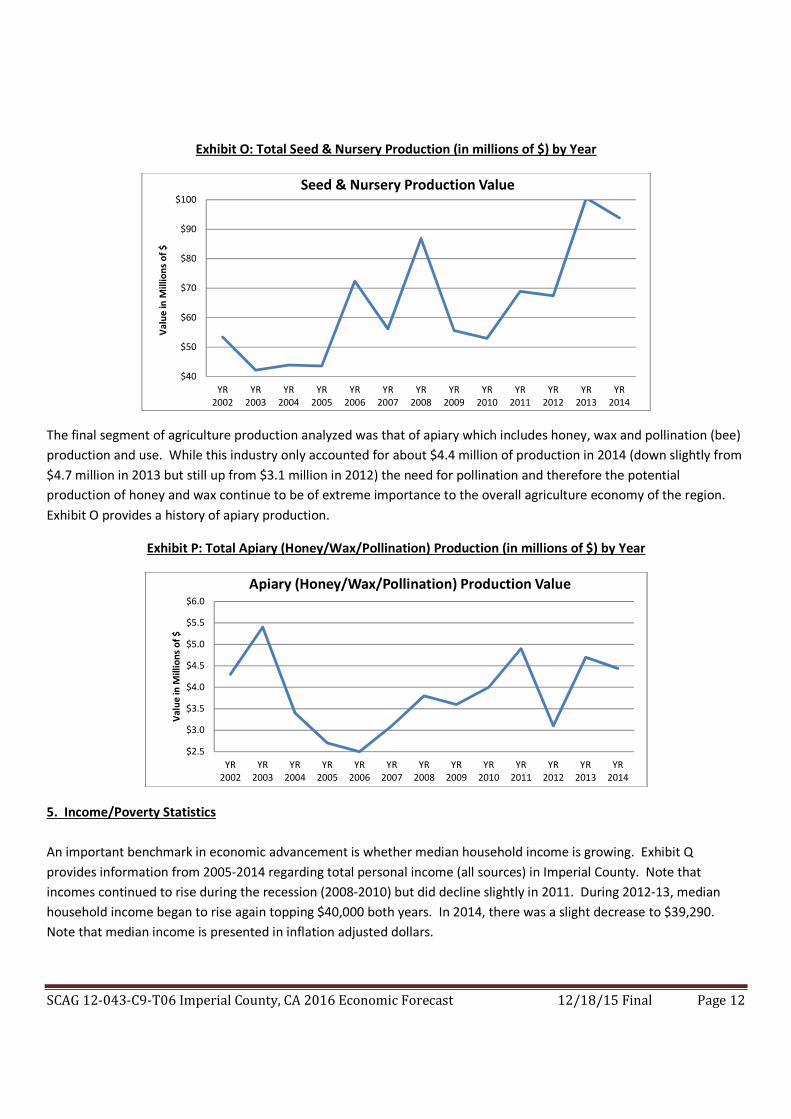
Exhibit O: Total Seed & Nursery Production (in millions of $) by Year
The final segment of agriculture production analyzed was that of apiary which includes honey, wax and pollination (bee)
production and use. While this industry only accounted for about $4.4 million of production in 2014 (down slightly from
$4.7 million in 2013 but still up from $3.1 million in 2012) the need for pollination and therefore the potential
production of honey and wax continue to be of extreme importance to the overall agriculture economy of the region.
Exhibit O provides a history of apiary production.
Exhibit P: Total Apiary (Honey/Wax/Pollination) Production (in millions of $) by Year
5. Income/Poverty Statistics
An important benchmark in economic advancement is whether median household income is growing. Exhibit Q
provides information from 2005-2014 regarding total personal income (all sources) in Imperial County. Note that
incomes continued to rise during the recession (2008-2010) but did decline slightly in 2011. During 2012-13, median
household income began to rise again topping $40,000 both years. In 2014, there was a slight decrease to $39,290.
Note that median income is presented in inflation adjusted dollars.
$40
$50
$60
$70
$80
$90
$100
YR2002
YR2003
YR2004
YR2005
YR2006
YR2007
YR2008
YR2009
YR2010
YR2011
YR2012
YR2013
YR2014
Val
ue
inM
illio
ns
of
$
Seed & Nursery Production Value
$2.5
$3.0
$3.5
$4.0
$4.5
$5.0
$5.5
$6.0
YR2002
YR2003
YR2004
YR2005
YR2006
YR2007
YR2008
YR2009
YR2010
YR2011
YR2012
YR2013
YR2014
Val
ue
inM
illio
ns
of
$
Apiary (Honey/Wax/Pollination) Production Value

SCAG 12-043-C9-T06 Imperial County, CA 2016 Economic Forecast 12/18/15 Final Page 13
Exhibit Q: Median Household Income
The Imperial Valley continues to be a region of the "have's and have-not's". As shown in Exhibit R, 46% of all households
exist on an annual income of less than $35,000 and 58% of households have an income of under $50,000 per year. At
the same time, about 17.6% of households have an income of over $100,000. This leaves a "middle class" of only about
24.6% of the households in the region (household income of between $50,000 and $100,000 per year).
Exhibit R: Household Income Distribution
Exhibit S provides recent data on per capita incomes. The purpose of this exhibit is to show that per capita incomes
from the period 2010-2014 are essentially flat. Meaning, that even as the United States economy is reportedly to have
recovered (and specific to the Imperial Valley that has MORE jobs today than during a previous peak in 2008), it is not
translating into higher per capita income.
$30,000
$32,000
$34,000
$36,000
$38,000
$40,000
$42,000
$44,000
YR 2005 YR 2006 YR 2007 YR 2008 YR 2009 YR 2010 YR 2011 YR 2012 YR 2013 YR 2014
An
nu
alD
olla
rs
Median Household Income
<$15,000$15,000-$24,999
$25,000-$34,999
$35,000-$49,999
$50,000-$74,999
$75,000-$99,999
$100k-$149,999
Over$150,000
2010 17.2 15.3 11.3 14.6 17.9 10.7 8 5.1
2011 20.7 14.4 13 11 16.1 9.6 9.8 5.3
2012 21.0 14.6 10.8 15.8 14.7 8.9 10.2 3.9
2013 17.0 12.1 12.2 13.4 18.1 12.0 10.3 5.0
2014 20.7 14.6 10.8 11.9 14.5 10.1 10.7 6.9
0
5
10
15
20
25
%o
fH
ou
seh
old
s
Household Income Distribution 2010-2015

SCAG 12-043-C9-T06 Imperial County, CA 2016 Economic Forecast 12/18/15 Final Page 14
Exhibit S: Per Capita Median Income 2005-2014
The greatest social issue in the region is poverty. In the United States the federal definition of poverty is a household
income for a family of four that is less than $24,250. Certainly there are additional families of all sizes that have incomes
just above the poverty line that have substantial issues providing for the most basic of family needs (housing, food,
medical care and transportation). Exhibit T shows that almost 1 in 4 persons of all ages and about 3 in 10 children under
18 within the region live in poverty.
Exhibit T: Percentage of All Residents and Children <18 Living in Poverty
Healthcare and Coverage
The Imperial Valley is seeing an increase in the amount of persons that are now covered in either a private or
government sponsored health insurance program. Exhibit U tracks the percentage of residents in Imperial County
without health insurance starting in 2010. In 2010 and 2011, about 22% of the population was without coverage. By
2014, this has been reduced to only 15%. The Federal Affordable Care Act and associated mandates are largely
responsible for this improving statistic.
$13,000
$13,500
$14,000
$14,500
$15,000
$15,500
$16,000
$16,500
$17,000
YR 2005 YR 2006 YR 2007 YR 2008 YR 2009 YR 2010 YR 2011 YR 2012 YR 2013 YR 2014
Median Per Capita Income (In Annual Dollars)
YR 1990Census
YR 2000Census
YR 2005-09 ACS
YR 2006-10 ACS
YR 2008-10 ACS
YR 2011ACS
YR 2012ACS
YR 2013ACS
YR 2014ACS
All Persons 23.8 22.6 21.2 19.6 22.6 22.7 23.2 23.3 23.7
Under 18 31.1 28.9 27.2 28.3 29.9 32.8 32.8 31.3 30.1
19
21
23
25
27
29
31
33
%o
fP
ers
on
s/C
hild
ren
Percentage of Residents Below Poverty Line

SCAG 12-043-C9-T06 Imperial County, CA 2016 Economic Forecast 12/18/15 Final Page 15
Exhibit U: Percentage of Residents without Health Insurance
6. Educational Attainment and Earnings
Economic opportunity in the United States has long been tied to education. The Imperial Valley has some of the lowest
levels of education attainment by adults 25+ in both California and nationwide. Exhibit V provides an understanding of
the highest level of education achieved by adults within the region. Thirty-five percent (35%) of adults lack a high school
diploma or equivalent. An additional 23% only have a high school diploma (or equivalent). Only about 13% of adults 25
and over have a bachelor’s degree or better. As the United States works to complete in a more global economy where
technology has been introduced and plays a role in almost every industry sector, the lack of education directly impacts
the employability of over one-half of adults within the region.
Exhibit V: Educational Attainment (Adults 25+)
14
15
16
17
18
19
20
21
22
ACS 2010 ACS 2011 ACS 2012 ACS 2013 ACS 2014
Pe
rce
nta
geo
fR
esi
de
nts
Percentage Imperial County Residentswithout Health Insurance
0.00% 5.00% 10.00% 15.00% 20.00% 25.00%
Less than 9th Grade
Some High School, No Diploma
High School Grad (or GED)
Some College, No Degree
Associate's Degree
Bachelor's Degree
Master's Degree
Professional School Degree
Doctorage Degree
Educational Attainment (Adults 25+)

SCAG 12-043-C9-T06 Imperial County, CA 2016 Economic Forecast 12/18/15 Final Page 16
Education impacts earnings. Exhibit W shows earnings of various levels of adults based on education for selected years
from 2005-2014. While almost all persons saw their income impacted (in average) by the economic downturn, it
remains that persons with a high school diploma make about twice as much as a person without. College graduates (on
average) make twice that of someone with only a high school diploma and three-times as much as someone that
dropped out of high school. This single chart, more than any other, points to the direct impact educational achievement
has upon the ability for a person to support themselves and their family.
Exhibit W: Median Earnings of Adults 25+ by Educational Attainment
7. Residential Real Estate & Assessed Valuation
Exhibit X shows the number of new home sales over a ten year period. Note that the region saw about 1,800 homes
sold in 2006. Scaling this figure to that of Los Angeles County for comparison purposes, it is tantamount to 100,000 new
homes being built and sold during the same time period. New home sales appear to be stabilized in the 175-200 homes
per year range from the period 2010-2014, though it appears that in 2015 the total number of new homes built will be
closer to about 120. Primary research shows that the “public” builders have largely left the region leaving home
construction to local/regional based builders. They report building what is termed as semi-custom or production-
custom homes whereas the buyer is often under contract before the home is actually built. This lessens the risk to the
builder (and their lender) while providing the buyer additional options for materials and interior customization.
YR 2005 YR 2006 YR 2007 YR 2008 YR 2009 YR 2011 YR 2013 YR 2014
<HS $15,959 $16,642 $16,201 $11,836 $15,047 $14,634 $13,259 $17,201
HS $23,643 $22,684 $24,936 $21,894 $22,678 $26,458 $26,688 $25,066
ALL $25,396 $27,048 $26,340 $26,638 $25,889 $27,987 $27,356 $26,546
Some College/ AA $35,093 $32,347 $31,889 $30,463 $27,809 $35,527 $31,497 $27,482
BA/BS $41,605 $46,930 $41,850 $42,414 $41,235 $50,982 $52,546 $46,414
Post Grad/Prof $61,543 $46,006 $70,161 $62,445 $61,494 $73,281 $69,498 $73,938
$5,000
$15,000
$25,000
$35,000
$45,000
$55,000
$65,000
$75,000
An
nu
alEa
rnin
gs
Median Earnings by Educational Attainment

SCAG 12-043-C9-T06 Imperial County, CA 2016 Economic Forecast 12/18/15 Final Page 17
Exhibit X: Imperial County, CA Total Home Sales by Year
Exhibit Y provides a representation of median home prices. Again, home prices began to stabilize in 2010 and have risen
over the last two (2) years. Thus far in 2015, the median home price is about $185,000. This represents an increase of
over 48% from the low in 2010. What is impactful about the rise of median price is that the sale price per square foot
(approximately $120) is at a number in which new home builders can deliver product to the marketplace, which will
generate addition economic investment and job opportunities to the region.
Exhibit Y: Median Home Prices (Residential Real Estate)
Exhibit Z further shows the decline in foreclosed homes from 2009 to current (2015). The region went from a high of
1,444 homes foreclosed in 2009 to a projected 123 in 2015 a decrease of over 90%.
100
300
500
700
900
1100
1300
1500
1700
Yr 2004 Yr 2005 Yr 2006 Yr 2007 Yr 2008 Yr 2009 Yr 2010 Yr 2011 Yr 2012 Yr 2013 Yr 2014 Yr 2015*
Tota
lNe
wH
om
es
Sold
New Home Sales 2004-2015*
$120,000
$140,000
$160,000
$180,000
$200,000
$220,000
$240,000
$260,000
$280,000
YR2002
YR2003
YR2004
YR2005
YR2006
YR2007
YR2008
YR2009
YR2010
YR2011
YR2012
YR2013
YR2014
YR2015*
Pri
cein
$
Imperial County, CA Median Home Price
SCAG 12-043-C9-T06 Imperial County, CA 2016 Economic Forecast 12/18/15 Final Page 18
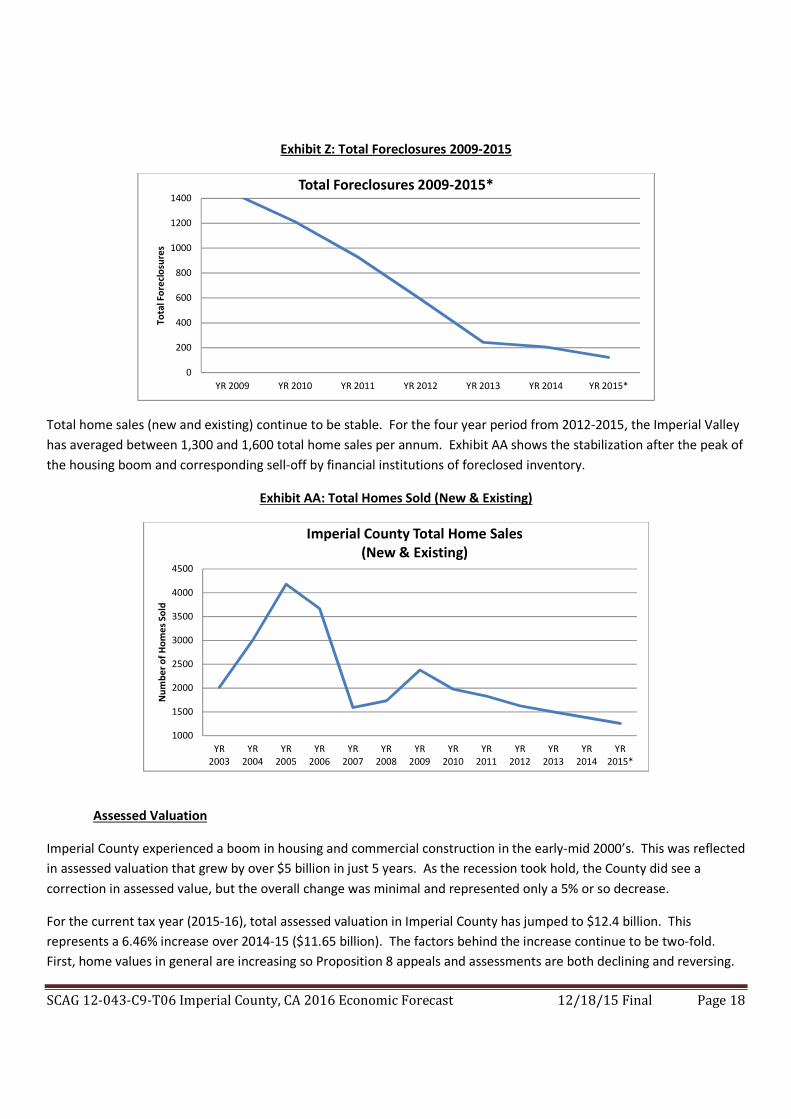
Exhibit Z: Total Foreclosures 2009-2015
Total home sales (new and existing) continue to be stable. For the four year period from 2012-2015, the Imperial Valley
has averaged between 1,300 and 1,600 total home sales per annum. Exhibit AA shows the stabilization after the peak of
the housing boom and corresponding sell-off by financial institutions of foreclosed inventory.
Exhibit AA: Total Homes Sold (New & Existing)
Assessed Valuation
Imperial County experienced a boom in housing and commercial construction in the early-mid 2000’s. This was reflected
in assessed valuation that grew by over $5 billion in just 5 years. As the recession took hold, the County did see a
correction in assessed value, but the overall change was minimal and represented only a 5% or so decrease.
For the current tax year (2015-16), total assessed valuation in Imperial County has jumped to $12.4 billion. This
represents a 6.46% increase over 2014-15 ($11.65 billion). The factors behind the increase continue to be two-fold.
First, home values in general are increasing so Proposition 8 appeals and assessments are both declining and reversing.
0
200
400
600
800
1000
1200
1400
YR 2009 YR 2010 YR 2011 YR 2012 YR 2013 YR 2014 YR 2015*
Tota
lFo
recl
osu
res
Total Foreclosures 2009-2015*
1000
1500
2000
2500
3000
3500
4000
4500
YR2003
YR2004
YR2005
YR2006
YR2007
YR2008
YR2009
YR2010
YR2011
YR2012
YR2013
YR2014
YR2015*
Nu
mb
er
of
Ho
me
sSo
ld
Imperial County Total Home Sales(New & Existing)

SCAG 12-043-C9-T06 Imperial County, CA 2016 Economic Forecast 12/18/15 Final Page 19
Second, there is some new construction (both residential and commercial) that is adding to the tax rolls. Second,
renewable energy projects and associated infrastructure are generating increases in overall valuation*. Exhibit BB below
shows historic trends regarding assessed valuation in Imperial County.
*Economist note: wind and geothermal energy production equipment is subject to property tax in its entirety. Solar does
have a State Revenue & Taxation Code Section 73 exemption for the panels and posts, but ancillary improvements are
subject to property tax (including transmission lines, substations, fencing, and interior roads).
Exhibit BB: Total Assessed Property Valuation
As the economy of Imperial County has improved, so have collection rates for property taxes. Exhibit CC provides a
dynamic model of property tax collection from 2005-06 thru 2013-14. The dynamic nature of this chart reflects that the
County of Imperial receives property tax payments not just for the current year but for previous years as well. As a
general rule, at such time as a property is delinquent on taxes for five (5) years, it is subject to seizure and auction.
Exibit CC shows that in the most recent year that property tax collection is more than 100%, this is because they are
receiving payments in the most current year for property taxes in arrears.
Exhibit CC: Property Tax Collection Rates
7
7.5
8
8.5
9
9.5
10
10.5
11
11.5
12
FY 2003-04
FY 2004-05
FY 2005-06
FY 2006-07
FY 2007-08
FY 2008-09
FY 2009-10
FY 2010-11
FY 2011-12
FY 2012-13
FY 2013-14
FY 2014-15
FY 2015-16
Val
uat
ion
inB
illio
ns
of
$
Imperial CountyTotal Assessed Valuation
94
95
96
97
98
99
100
101
102
FY 2005-06 FY 2006-07 FY 2007-08 FY 2008-09 FY 2009-10 FY 2010-11 FY 2011-12 FY 2012-13 FY 2013-14
%o
fP
rop
ert
yTa
xC
olle
cte
d
Property Tax Collection Rates

SCAG 12-043-C9-T06 Imperial County, CA 2016 Economic Forecast 12/18/15 Final Page 20
8. Consumer Confidence (Retail Spending)
Economists look to consumer spending as a key factor in understanding confidence in the economy. First, we look at the
number of Sales & Use Tax Permits held within a community or region. This shows the number of persons and
companies engaged in retail sales. During the economic downturn, the Imperial Valley saw a decrease of over 800
permit holders within a 1 year time period (about a 20% decline). For a three year period from late 2008 to late 2011,
the number of permit holders was stable. In more recent times, the number of retailers is beginning to increase
showing that there is renewed interest in the Imperial County economy. For the latest period available (2Q14) there
were about 80 additional Sales & Use Tax Permit holders than there were one year prior (Exhibit DD).
Exhibit DD: Sales & Use Tax Permits Held in Imperial County
Taxable sales in Imperial County were impacted by the “Great Recession”. Tracking overall recovery is made more
difficult because about the same time the economy began to recover, the region started to experience construction of
renewable energy (wind, solar and geothermal projects). Under State Board of Equalization Publication 28, Exhibit A,
the "Point of Sale" for construction materials associated with the construction of wind, solar and geothermal projects is
designated in Imperial County. This election provides for significant tax revenue to the County, but will also cause for
large swings in taxes collected as they are one-time events. For quarters in which projects are actively under
construction, taxable sales within the region almost double. Exhibit CC shows historic taxable sales from 2010 through
2Q2015.
(the balance of this page intentionally left blank)
3100
3300
3500
3700
3900
4100
1Q
08
2Q
08
3Q
08
4Q
08
1Q
09
2Q
09
3Q
09
4Q
09
1Q
10
2Q
10
3Q
10
4Q
10
1Q
11
2Q
11
3Q
11
4Q
11
1Q
12
2Q
12
3Q
12
4Q
12
1Q
13
2Q
13
3Q
13
4Q
13
1Q
14
2Q
14
#o
fP
erm
its
Imperial County, CATotal Number of Sales & Use Tax
Permits Held

SCAG 12-043-C9-T06 Imperial County, CA 2016 Economic Forecast 12/18/15 Final Page 21
Exhibit EE: Taxable Sales in Imperial County by Quarter
Exhibit FF shows the change in taxable sales from 2009 through the most current period (2Q15). This chart shows the
swings in sales tax generation year over year (same quarter/different year) created by whether there are active
renewable energy projects under construction. The County of Imperial is aware that local sales and use tax generated
under the Publication 28, Exhibit A election should be considered one-time revenue.
Exhibit FF: Change in Taxable Sales (Same Quarter/Different Year Comparison)
400
500
600
700
800
900
1000
1100
1Q
08
2Q
08
3Q
08
4Q
08
1Q
09
2Q
09
3Q
09
4Q
09
1Q
10
2Q
10
3Q
10
4Q
10
1Q
11
2Q
11
3Q
11
4Q
11
1Q
12
2Q
12
3Q
12
4Q
12
1Q
13
2Q
13
3Q
13
4Q
13
1Q
14
2Q
14
3Q
14
4Q
14
1Q
15
2Q
15
Mill
ion
so
f$
Imperial County, CA Taxable Sales(in millions of $)
-35
-15
5
25
45
65
1Q
08
2Q
08
3Q
08
4Q
08
1Q
09
2Q
09
3Q
09
4Q
09
1Q
10
2Q
10
3Q
10
4Q
10
1Q
11
2Q
11
3Q
11
4Q
11
1Q
12
2Q
12
3Q
12
4Q
12
1Q
13
2Q
13
3Q
13
4Q
13
1Q
14
2Q
14
3Q
14
4Q
14
1Q
15
2Q
15
%C
han
ge
Change in Taxable Sales (Same Quarter/Different Year Comparison)

SCAG 12-043-C9-T06 Imperial County, CA 2016 Economic Forecast 12/18/15 Final Page 22
9. Education Test Scores
Last year, DMG Economics introduced a new section in the annual economic forecast focused on academic achievement.
In 2015, we presented the STAR Test Results for Imperial County in comparison to other counties in Southern California.
The State of California discontinued use of the Standardized Testing and Reporting (STAR) exam and replaced it with the
California Assessment of Student Performance and Progress System (CAASPP). For this reason, we will simply present
the percentage of students in selected grades (3rd, 7th and 11th) and their achievement in English and Math. Test
achievement is measured in students that “Standard Exceeded”, “Standard Met”, “Standard Nearly Met” and “Standard
Not Met”.
Exhibit GG: CAASPP 3rd Grade Achievement English
Exhibit HH: CAASPP 3rd Grade Achievement Math
5
10
15
20
25
30
35
40
45
50
Imperial Los Angeles Orange Riverside SanBernardino
San Diego Statewide Ventura
2015 CAASP 3rd Grade English Test Results(Achievement Level by Percentage)
Standard EXCEEDED Standard MET Standard NEARLY Met Standard NOT Met
5
10
15
20
25
30
35
40
45
Imperial Los Angeles Orange Riverside SanBernardino
San Diego Statewide Ventura
2015 CAASP 3rd Grade Math Test Results(Achievement Level by Percentage)
Standard EXCEEDED Standard MET Standard NEARLY Met Standard NOT Met

SCAG 12-043-C9-T06 Imperial County, CA 2016 Economic Forecast 12/18/15 Final Page 23
Exhibit II: CAASPP 7th Grade Achievement English
Exhibit JJ: CAASPP 7th Grade Achievement Math
5
10
15
20
25
30
35
40
Imperial Los Angeles Orange Riverside SanBernardino
San Diego Statewide Ventura
2015 CAASP 7th Grade English Test Results(Achievement Level by Percentage)
Standard EXCEEDED Standard MET Standard NEARLY Met Standard NOT Met
5
10
15
20
25
30
35
40
45
50
Imperial Los Angeles Orange Riverside SanBernardino
San Diego Statewide Ventura
2015 CAASP 7th Grade Math Test Results(Achievement Level by Percentage)
Standard EXCEEDED Standard MET Standard NEARLY Met Standard NOT Met

SCAG 12-043-C9-T06 Imperial County, CA 2016 Economic Forecast 12/18/15 Final Page 24
Exhibit KK: CAASPP 11th Grade Achievement English
Exhibit LL: CAASPP 11th Grade Achievement Math
0
5
10
15
20
25
30
35
40
Imperial Los Angeles Orange Riverside SanBernardino
San Diego Statewide Ventura
2015 CAASP 11th Grade English Test Results (Achievement Level byPercentage)
Standard EXCEEDED Standard MET Standard NEARLY Met Standard NOT Met
5
10
15
20
25
30
35
40
45
50
55
Imperial Los Angeles Orange Riverside SanBernardino
San Diego Statewide Ventura
2015 CAASP 11th Grade Math Test Results(Achievement Level by Percentage)
Standard EXCEEDED Standard MET Standard NEARLY Met Standard NOT Met

SCAG 12-043-C9-T06 Imperial County, CA 2016 Economic Forecast 12/18/15 Final Page 25
10. Economic Outlook for 2016
The economy of the Imperial Valley continues to be stable. Most economic indicators show return to pre-recession
levels with some outperforming the highs of 2004-2005. The region has also successfully absorbed the loss of a key
industry (beef processing) and loss of jobs as a result of the opening of a modern Federal Detention Center that calls for
less labor. At current, there is about $996 million of projects under construction (renewable energy and industrial
based). As we look toward 2016 and beyond consider the following:
Agriculture: will continue to be the strength of the economy. Simply stated, the Imperial Valley literally feeds California
and produces crops for export in a number of nations around the world. The region has developed over 3,000 miles of
canals that distribute water to over 500,000 acres of active production land. It is anticipated that some higher value
crops found in the Central Valley will make their way into the production mix if water supply issues in that region are not
solved.
Housing: In general, housing in the Imperial Valley is affordable in comparison to the balance of Southern California with
the median home selling for about $185,000. New home construction has been fairly slow in recent years and is
expected to continue at a rate of about 150 homes a year for the time being. That said, there are approved specific plan
developments that may be game-changers for the region in the future if those are used to attract the baby boomer
generation to the region in the form of master-planned communities for those 55+. This strategy has worked to fuel
growth in parts of Arizona and the Coachella Valley in the past.
Renewable Energy Development: The region has received some $5.5 billion of new economic investment in the past five
to seven years. Much of this has been a result of renewable energy development (solar, wind, geothermal and biofuels).
At current, the region has about $5.2 billion of projects that are “under development” which is defined as entitled.
These projects will propel the regional economy for the next few years. Couple this with the Renewable Portfolio
Standard (RPS) in California moving from 33% (2020) to 50% (2030) and the region has the opportunity for another $6-8
billion of energy production investment over the next ten (10) to fifteen (15) years.
Retail Sales: Are projected to remain stable as the region will continue to provide retail goods and service opportunities
to both residents and those from a 1.1 million+ market in Mexicali, Mexico that do some shopping in the Imperial Valley.
The total sales tax generated within the region will likely continue to fluctuate greatly depending on the status of
construction of renewable energy projects (the County of Imperial requires that all energy projects with construction
material purchases of $5 million or more utilize the Publication 28, Exhibit A election under the California State Board of
Equalization designating the construction site as the point of sale for tax purposes).
EB-5 Investment: The region has made a concerted effort to attract foreign-direct investment as equity or total financing
for qualifying projects. Officials from throughout the region participate regularly in business trips to China and other
places to attract investors. This has resulted in capital flowing to a variety of hotel, office, light industrial and energy
projects.

SCAG 12-043-C9-T06 Imperial County, CA 2016 Economic Forecast 12/18/15 Final Page 26
Threats to the regional economy are as follows:
A. Government regulation specifically such items as mobile and stable source air quality that may impede the
growth and sustainability of the agriculture industry.
B. Availability and stabilization of supply of water supply.
C. Attracting new investment into the region that can effectively employ a semi-skilled blue collar workforce at a
wage $15 per hour or more (what is typically needed to support families).
D. Impact of increased minimum wage on the agriculture sector
While substantial progress has been made on the percentage of residents without health insurance (down to about
15%), largely as a result of the Affordable Care Act (ACA), poverty within the region continues to be high with 3 in 10
children and about 1 in 4 adults living in poverty. When looking at the statistical evidence in regards to educational
achievement and median earnings, it is clear that education is a path to economic sustainability. The region must
continue to push educational achievement as a path to prosperity.
11. References
A. American Community Survey
B. California Department of Transportation
C. California State Board of Equalization
D. County of Imperial Assessor
E. County of Imperial Agriculture Commission
F. Dataquick
G. Development Management Group, Inc.
H. Imperial Valley Economic Development Corporation
I. Nielsen/Claritas
J. State of California Department of Finance
K. State of California Employment Development Department
L. United States Census Bureau
M. Unnamed Agriculture Professionals (Primary Research) (Four)*
N. Unnamed Home Building Professional (Primary Research) (Two)*
*Often times business owners/operators will provide information for primary research under agreement that their
names are not specifically mentioned. Interview information is available for SCAG audit/verification purposes only.
(the balance of this page intentionally left blank)

SCAG 12-043-C9-T06 Imperial County, CA 201
12. Certification
I certify that my engagement to prepare this report was not contingent upon developing or reporting predeterminedresults. The statements of fact contained herein and the substance of this report are based on public records, dataprovided by the Southern California Association of Governmentsof this report. This report reflects my personal, unbiased professional analyses, opinions and conclusions.underlying assumptions related to this report change after the date of this report (undersigned reserves the professional privilege to modify the contents and/or conclusions of this report.
_______________________________
Michael J. Bracken, Managing PartnerDevelopment Management Group, Inc.41-625 Eclectic Street, Suite D-2Palm Desert, CA 92260(760) 346-8820 / (760) 346-8887 (fax)(760) 272-9136 (mobile)[email protected]
T06 Imperial County, CA 2016 Economic Forecast
I certify that my engagement to prepare this report was not contingent upon developing or reporting predeterminedThe statements of fact contained herein and the substance of this report are based on public records, data
California Association of Governments and other sources as described in the reference sectionof this report. This report reflects my personal, unbiased professional analyses, opinions and conclusions.
report change after the date of this report (December 18, 2015undersigned reserves the professional privilege to modify the contents and/or conclusions of this report.
12/18/15 Final Page 27
I certify that my engagement to prepare this report was not contingent upon developing or reporting predeterminedThe statements of fact contained herein and the substance of this report are based on public records, data
and other sources as described in the reference sectionof this report. This report reflects my personal, unbiased professional analyses, opinions and conclusions. If any of the
December 18, 2015), then theundersigned reserves the professional privilege to modify the contents and/or conclusions of this report.