development, growth, and electricity in east asia
TRANSCRIPT
Development, Growth, and Electricity in East Asia
A Thesis submitted to the Faculty of the
Graduate School of Arts and Sciences at Georgetown University in partial fulfillment of the requirements for the degree of
Master of Public Policy in the Georgetown Public Policy Institute
By
Bryan J Di Pietro, B.A.
Washington, DC April 18, 2007
ii
Development, Growth, and Electricity in East Asia
Bryan J Di Pietro, B.A.
Thesis Advisor: David Hunger, Ph.D.
ABSTRACT
This paper examines the relationship between electricity consumption growth and GDP growth using an endogenous growth model. The countries of East Asia have industrialized in a remarkably short time. Some countries in the region have surpassed advanced industrials such as Australia and New Zealand as well as several European states in the value of their economies measured in GDP per capita. These countries have been able to adopt and tailor policies, institutions, market structure, and technology to suit the individual needs of their state. Electricity is necessary to many aspects of modern development. Lack access to cheap, reliable electricity will limit growth. The sample compares three classes of countries in the Pacific Rim referenced against the United States for GDP per capita, Electricity Consumption per capita, and Gross Capital Formation. By applying these components to an endogenous growth model to isolate the effects or implications of increasing electricity generation on GDP growth, this study looks at policy ramifications for the countries still lagging economically in the region as well as extrapolating the results to other under-developed nations. The study addresses historical trends, colonial and cold war legacies, economic and political institutions as well as the role of corruption involved in economic growth. The development of distributed generation and rural electrification programs seem to support overall economic activity and lessen the effects of strongly centralized economic infrastructure. Lastly, the deployment of renewable energy does not positively affect GDP growth from the findings of this study although the amount of data was limited and/or did not measure the relevant aspect. Reducing resource costs should have a positive affect of economic development as well as reducing the fixed capital costs of large scale energy generation by transitioning to smaller decentralized systems.

iii
ACKNOWLEDGEMENT Grateful acknowledgement is made to David Hunger, Donna Morrison, Reed Cover, Faye Rosenbaum, and Kerry Pace, for their support and assistance in this endeavor. Additionally, I would like to thank the faculty and staff of GPPI for their general support and encouragement.
iv
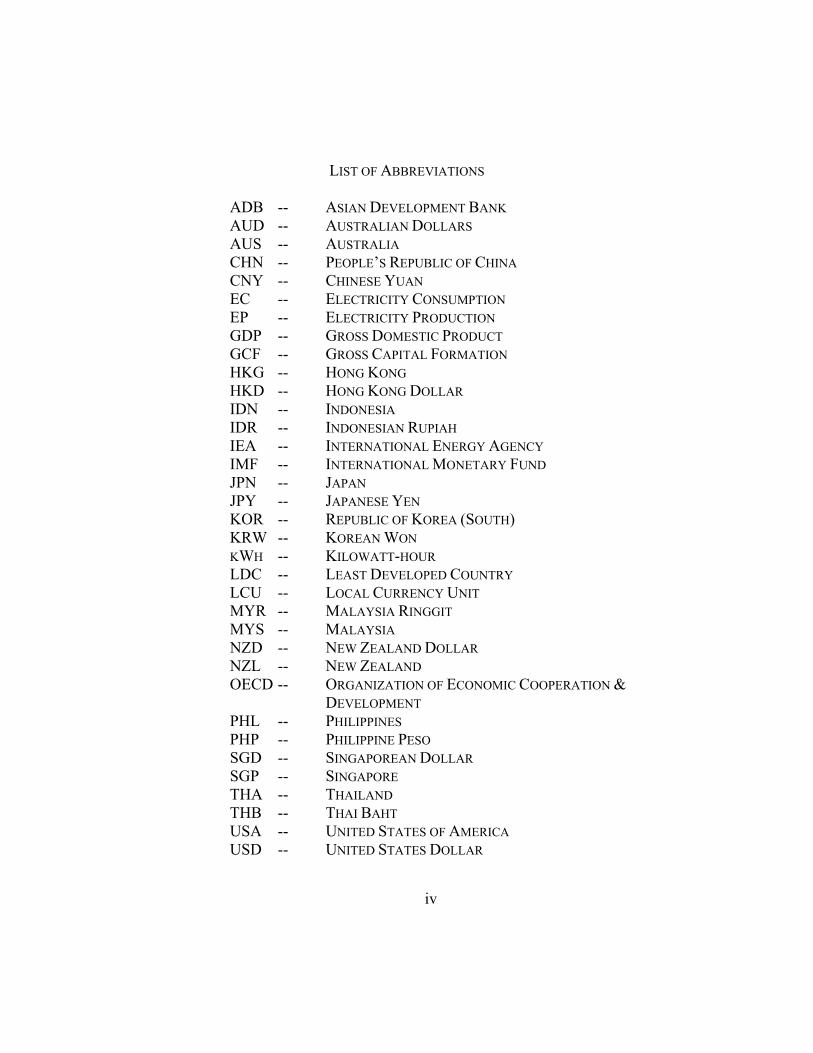
LIST OF ABBREVIATIONS
ADB -- ASIAN DEVELOPMENT BANK AUD -- AUSTRALIAN DOLLARS AUS -- AUSTRALIA CHN -- PEOPLE’S REPUBLIC OF CHINA CNY -- CHINESE YUAN EC -- ELECTRICITY CONSUMPTION EP -- ELECTRICITY PRODUCTION GDP -- GROSS DOMESTIC PRODUCT GCF -- GROSS CAPITAL FORMATION HKG -- HONG KONG HKD -- HONG KONG DOLLAR IDN -- INDONESIA IDR -- INDONESIAN RUPIAH IEA -- INTERNATIONAL ENERGY AGENCY IMF -- INTERNATIONAL MONETARY FUND JPN -- JAPAN JPY -- JAPANESE YEN KOR -- REPUBLIC OF KOREA (SOUTH) KRW -- KOREAN WON KWH -- KILOWATT-HOUR LDC -- LEAST DEVELOPED COUNTRY LCU -- LOCAL CURRENCY UNIT MYR -- MALAYSIA RINGGIT MYS -- MALAYSIA NZD -- NEW ZEALAND DOLLAR NZL -- NEW ZEALAND OECD -- ORGANIZATION OF ECONOMIC COOPERATION &
DEVELOPMENT PHL -- PHILIPPINES PHP -- PHILIPPINE PESO SGD -- SINGAPOREAN DOLLAR SGP -- SINGAPORE THA -- THAILAND THB -- THAI BAHT USA -- UNITED STATES OF AMERICA USD -- UNITED STATES DOLLAR
v
TABLE OF CONTENTS
Chapter 1. Introduction........................................................................................1 Chapter 2. Historical Context of Region Economic Development .....................8
Precursors to Robust Growth.............................................................8 Legacies of the Cold War ................................................................14
Chapter 3. Economic Indicators & Data ...........................................................21 Chapter 4. Methodology & Model ....................................................................34
Regression Results...........................................................................36 Chapter 5. Conclusion .......................................................................................40 References .............................................................................................................42

1
Chapter 1. Introduction
Electricity is often considered a prerequisite to industrialization and growth.
However, it is unclear whether electrification is a condition or a result of growth.
More than likely, growth in electrification and in overall electricity demand has a
bidirectional relationship with economic growth. It is likely that the shift from other
forms of energy (thermal heat, steam, human and animal labor, etc.) to electricity
results in freeing up resource inputs for other productive activity enhancing overall
growth. As the economy expands and more resources are available, financial assets are
directed at the energy sector, to eliminate the binding constraint presented by
insufficient energy generation capacity. Kim and Smith (1989) suggest that the energy
sector has become a favored instrument of development policy, since electricity
generation is viewed as a natural monopoly and therefore must be regulated.
Governments are able to influence growth in the overall economy by investing in the
energy sector or encouraging private investment by adjusting mechanisms such as
pricing and rate of return.
This study addresses the role of electricity demand in Gross Domestic Product
(GDP) growth. There is a strong correlation between growth in electricity demand and
GDP growth over much the period 1971 – 2003. Political and economic events affect
2
the countries in cross-section differently over the period. The oil embargo of 1973 –
74 has greater impact on heavily dependent oil importing nations such as Japan and
Hong Kong, rather than exporting nations such as Indonesia and Malaysia. By looking
at the mix of political and economic institutions and their role in expanding (or
retarding) electricity generation during the 32 years of this panel, one can formulate
sound policies for those countries in the region that are lagging behind. The challenges
presented by the rapid development of China and India must be addressed now while
there is time to amend the lessons learned and institutions borrowed from abroad.
The countries of East Asia offer interesting lessons in development as some
have transitioned into modern industrial states while others continue to languish. The
region as a whole has experienced GDP growth in the later half of the 20th century of
around 5% per annum (p.a.). This is significantly higher than the rates experienced in
the US and Western Europe. What factors contributed to the successful transition or
limited growth of the respective countries of the Pacific Rim? Countries such as Hong
Kong, Singapore, Republic of Korea (South Korea), and Republic of China (Taiwan)
have effectively transitioned to modern industrial nations with high GDP per capita,
have sustained growth rates of approximately 7% p.a. for the last 30 years, and have
stabilized population growth to approximately 1.7% p.a.. These countries have
managed the transition in an amazing 30 years, with low population and high economic
3
growth. Why did these countries develop when initial pre-conditions where similar for
most of the nations in the region? Why did Malaysia, Thailand, Indonesia and others
in the region lag so far behind?
The level of growth experienced in the region is much higher than elsewhere in
the world over this period. By comparing development in East Asia against advanced
industrials, it is possible to extract lessons for use in policy implementation for
developing nations. Technology, adapted policies, and borrowed institutions have
played a major role in the accelerated level of GDP growth. The countries of the
region, for the most part, underwent policies of population stabilization over the
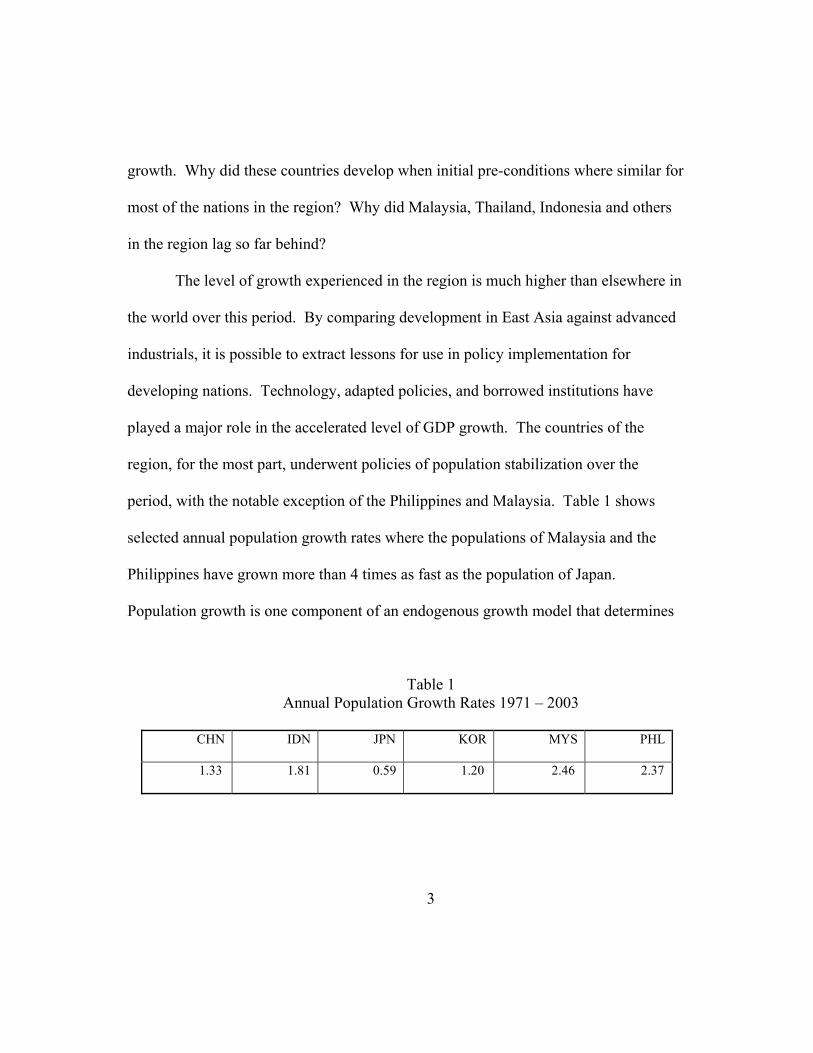
period, with the notable exception of the Philippines and Malaysia. Table 1 shows
selected annual population growth rates where the populations of Malaysia and the
Philippines have grown more than 4 times as fast as the population of Japan.
Population growth is one component of an endogenous growth model that determines
Table 1 Annual Population Growth Rates 1971 – 2003
CHN IDN JPN KOR MYS PHL
1.33 1.81 0.59 1.20 2.46 2.37
4
the rate of growth experienced the macro economy. Yet, Malaysia and the Philippines
have had very mixed results on grow, with Malaysia growing significantly better than
the Philippines. This study will use Paul Romer’s endogenous growth model as a
foundation for testing the role of electricity in overall GDP growth (Romer 1986).
By using electricity generation as a proxy for the technology variable, this
study attempts to isolate some of the factors that have lead to the sustained high level
of GDP growth and be able to extrapolate the findings and implications to development
policy for least developed countries (LDC). Modern industrialization is made possible
by increasing the level of productivity per unit of labor. By using substituting capital,
in the form of electricity, for human labor and by increasing the general knowledge
base, countries in the region have been able to increase productivity and expand
operations into higher-value outputs such as textiles, light manufacture, computers,
microchips, etc.. Is it possible for the economic development seen in East Asia to be
duplicated elsewhere or are the conditions unique to the region?
It is important to understand the mix of political and economic institutions in
each country, so that these elements can be controlled for and the effect of technology
on GDP growth can be teased out. Internal political instability, poor institutions,
corruption, and international interference alter the conditions for each country
involved. This study is primarily concerned with the uneven economic growth
5
performance of the capitalist nations in the region contrasted with the phenomenal
economic growth of mainland China. The lack of reliable data for the communist
countries of East Asia (Cambodia, Laos, Vietnam, and North Korea) has resulted in
their omission from this study.
Modern industrialization is dependant on energy generation, principally
electricity. Growth in electrification of the countryside and increased urbanization
seem to correlate to increased GDP growth. Programs carried out in Taiwan and South
Korea support the role of mass access to reliable energy as a precursor to reaching
developed status. Currently, countries in South and Southeast Asia are constrained by
their limited electricity infrastructure, depriving whole areas of India, Indonesia,
Vietnam, and others, from realizing the full potential of their economic reforms and
growth. Additionally, many of the smaller nations do not have access to internal
supplies of fuel stock (coal, natural gas, or petroleum) and therefore must import the
majority of their energy needs. Even in countries with fossil fuel resources (such as
China, Indonesia, Malaysia, etc.) large quantities of processed fuel is still imported due
to lack of local capacity to suitably refine the raw materials.
For the countries of this region that are still transitioning to developed status
(Cambodia, Laos, Indonesia, Malaysia, Philippines, Thailand, and Vietnam), would the
adoption of renewable energy generation enhance their economic growth? By
6
employing smaller, local systems these countries would be able to deploy new
generation capacity in a quicker, timelier, manner. Additionally, by using local
generation loss of electricity due to transmission and distribution would be reduced or
eliminated. Reducing the amount of imported feed stock would enable investment
decisions that add value to the domestic market by either the reduction of imports or
through the creation of higher value exports e.g. microchips instead of jute bags, or
both.
For both Indonesia and the Philippines, the large archipelagos over which they
control present unique challenges and opportunities. By decentralizing energy
generation capacity, the outer regions of these countries would be able to experience
some of the benefits currently enjoyed in the densely populated central regions of Java
in Indonesia and Luzon in the Philippines. In remote areas of Thailand, Malaysia,
Vietnam and elsewhere, renewable energy can be implemented in single or multi-
village systems taking advantage of local conditions and providing a platform for
development in these communities.
Electricity is a principal binding constraint for many developing countries. The
World Bank has consistently advocated for the use of coal in domestic markets. In
1982, the World Bank provide the Indonesian Government with USD 185 million to
build new coal thermal facilities with the expectation of Indonesia increasing oil

7
exports to support the world market (World Bank, 2001). Large scale infrastructure
projects, useful and necessary when large urban populations are present but due to the
cost and time involved in construction, are often not completed due to changes in
political climate or rampant corruption.
8
Chapter 2. Historical Context of Region Economic Development1
Growth in the region has been robust, but has produced uneven results across
and within various countries. A brief history and understanding of the economic and
political changes that have affected the region is necessary to comprehend the dramatic
and robust growth experienced in the later half of the 20th Century. The mix of
institutions, market structures, and colonial legacies set the foundation for individual
nations to adapt and transform themselves into modern industrial nation-states. The
Cold War alignment of nations in the region furthers the complexity of understanding
why East Asia grew so rapidly compared to other regions of the world. One element
this paper will look at the historic mix of institutions as well as the role of technology,
specifically electrification, in predicting GDP growth.
Precursors to Robust Growth
From the beginning of the 19th century the countries of the world have diverged
greatly in terms of material well-being, their abilities to seize the advantages of
development and expand the wealth of their citizens. The countries of Western Europe
1 For more information on the economic and political development of the countries in this study, please refer to the reference section found on page 42.
9
and its offshoots (notably the USA, Canada, Australia and New Zealand) accomplished
the transition from traditional subsistence societies to modern industrial nations by the
early part of the 20th century. The only non-European country to effectively modernize
was Japan, which was able to adopt western institutions and policies and effectively
reduce the time needed to industrialize to about 50 years.
Colonization up to the 1870s had been associated with the exploitation of a
material resource (gold, iron, furs, etc.), the resettlement of population (either dissent
or loyalist), and/or the expansion and monopolization of trading routes. This
colonization pattern left much of Africa, most of Asia, most of the Pacific, and parts of
southern South America unsettled or administratively incorporated into one of the
European empires or into either the Chinese or Japanese sphere of influence. For the
most part, the areas left unsettled where either heavily populated with limited trade
goods desired by the Europeans, unpopulated with limited resources for extraction, or
remote with highly adverse climatic conditions and diseases making them inaccessible
to the Europeans.
Changes in European politics created the conditions for rapid acquisition of
colonial territory for prestige rather than direct economic benefit. Vast swaths of
heavily populated areas were incorporated into the European empires through a
mixture of coercive economic and military means. At the same time, Japan began to
10
industrialize borrowing heavily from European and American institutions and
technologies. To fuel its burgeoning industries Japan began trading extensively with
the British, Dutch and French colonies of Southeast Asia. The changing world order
and the pressures exerted during World War I, allowed many of the dependant colonies
to agitate for more autonomy or even independence. Japanese industrialization was
scene as a model to emulate.
Japan began to resent its place in the world order, controlled and dictated by the
Europeans, and yet emulated European institutions by expanding its colonial holdings.
After the Spanish-American War of 1898, Spain sold its remaining Pacific colonies to
Germany. Japan fought wars of acquisition with China (1894-95) and Russia (1904-
05) gaining control of the Korean peninsula, Taiwan, and part of Manchuria. Japan
entered WWI on the side of the Allies and took possession of all German territory in
the Pacific region (Qingdao in China, Bismarck, Caroline, Marinas, Marshall, and
Bismarck Islands) and was formally granted a mandate by the League of Nations for
the territories. Japan extended its control over much of eastern Asia before its ultimate
defeat in 1945.
Japanese hegemony is, in part, responsible for the industrialization of the
region. Japan invested heavily in infrastructure, physical plant, and training,
principally in Korea and Taiwan. The post World War II period saw marked instability
11
in the region and the rise of Cold War Ideological lines. The Soviets seized control of
Outer Manchuria, Sakhalin, and Kuril Islands. Civil war developed in China between
the Communist Party under the leadership Mao Zedong and the Nationalist Party of
General Chiang Kai-shek. Mao defeated Kai-shek in 1949 establishing the People’s
Republic of China in 1949. Kai-shek fled to Taiwan and established the Nationalist
Party as the “true” government of the Republic of China.
French Indochina and Dutch East Indies erupted into wars of independence.
The Dutch East Indies declared independence in 1945 and fought a bloody guerrilla
war with the Dutch until 1949. Much of the infrastructure and physical plant built by
the Dutch and Japanese in the lead-up to WWII was now completely destroyed. In
September of 1945 Ho Chi Minh declared independence for the Democratic Republic
of Viet Nam; however, independence was short lived and crushed by British forces
after the Japanese surrender. Ho Chi Minh again fought French control declaring
independence in 1950 and decisively defeating the French in 1954. The country was
partitioned into a communist north and “free” south. Laos and Cambodia were both
granted independence in 1954 with the formal withdrawal of French claims to the
region.
The Korean peninsula was divided in 1945 to be held in trusteeship by the
United States and the Soviet Union. War erupted in 1950 when the communist north
12
supported by the victorious Chinese invaded the capitalist south. The conflict ended in
stalemate in 1953 with the creation of the Democratic People’s Republic of Korea and
The Republic of Korea. Similar to Indonesia, most of the Japanese infrastructure and
physical capital was destroyed during WWII and the subsequent Korean War.
Following the conclusion of Spanish-American War 1898, Philippine
revolutionaries engaged in guerilla warfare until 1913. The US formally granted the
Philippines commonwealth status in 1935 with an eye to devolving more autonomy
over time. The Japanese invasion of the islands in 1941 lead to massive destruction of
infrastructure and degraded the military capabilities of the islands. The Philippines
gained independence in 1946 continues to be undermined by ethnic and religious
tensions that threaten stability. The Philippines was an important and wealthy colony
under the Spanish and retains many of the institutions for control and extraction of
wealth. Like much of the region, the country became embroiled in the political
machinations of the two emergent superpowers.
The Kingdom of Siam (Thailand) adroitly played the British and French
colonial interests against on another preserving its independence, although it lost
territory to both France and Britain. Thailand adopted many European institutions
during this period and looked at the rise of Japan for inspiration for its own
development. Thailand sided with Japan during the war and came under US influence
13
in the emergent new order. The post-war period was marred by military intervention
and paternalistic rule supporting capitalist institutions.
The last area of interest for this paper is the British colonial sphere of Australia,
New Zealand, Malaya, British Borneo, and Hong Kong. Unlike the other colonial
powers in the region, the British colonies of Australia and New Zealand had been
granted commonwealth and dominion status respectively and were developing
similarly to other European countries. Britain’s Asian colonies were severely damaged
by the Japanese during WWII, for example, reducing Hong Kong’s population by an
estimated 1 million. Hong Kong benefited from the relocation of population and assets
from Shanghai and Guangzhou in the lead up to the Communist victory in 1949.
British Malaya was granted independence as the Malayan Union in 1946 within
the British Commonwealth. Singapore was excluded from this union and became a
crown colony. The terms of independence were unacceptable to the ethnic Malays and
resulted in violence and the eventual dissolution of the country. In 1948, The
Federation of Malaya was formed and included Singapore, Sabah, and Sarawak (the
later two are located on the north coast of Borneo.) The Sultanate of Brunei initially
intended joining the Federation but later withdrew due to concerns over oil revenue
and the political powers of the sultan himself. The Federation was plagued with
14
violence and ethnic strife well into the 1960s. The Federation adopted the name
Malaysia in 1963 and expelled Singapore from the union in 1965.
By the mid-1960s most of the colonial empires were dismantled, granting
autonomy and independence to the colonial states. However, the institutions and the
power elite in many instances were lacking in legitimacy resulting in weak state
capacity, corruption, and the institutionalization of neo-patrimonial rent-seeking
behaviors. Many of the resulting states were isolated, resource poor, and lacking in
adequate infrastructure and legitimate institutions. Within this framework certain
countries developed sound policies and institutions and have successfully managed the
transition to modern industrial nations, others have stagnated and even failed.
Legacies of the Cold War
Ideological disputes shaped resource flows for much of the 20th century. In the
first half of the century, economic development was geared towards resource extraction
and later prestige of owning a colony. However, World War II destroyed much of the
world’s capital stock and shattered many of the Jingo institutions imposed by the
colonial powers. The second half of the century is shaped by the ideologies of the two
great belligerents of the war: The United States and the Soviet Union. Reconstruction
15
efforts, independence movements, trade, and education were used to sway newly
emerging nation-states into one or the other political camp.
After the Communist victory in China, Mao isolated the nation from the world.
This ideology spread to neighboring countries as they looked to shake off the yoke of
colonial oppression. The United States supported with both economic and military aid
dictators that would ensure a suppression of communist ideology. The Soviet Union
and China supported regimes that espoused Marxist rhetoric, however
opportunistically, granting them technology, grants and subsidies, food, and military
aid. The two superpowers divided the world leaving little space for non-aligned states.
Growth in the 60s and early 70s is most robust in the former colonies of
Britain, Japan, and the United States. These states are strongly aligned to the US and
received vast levels of economic and military assistance during this period. Japan
dramatically rebuilt its economy under its new pacifist constitution, establishing new
trading arrangements and improving over-all relations with its neighbors during this
period. The region prospered under the robust growth of the Japanese economy;
adopting many of the Japanese economic models and institutions.

16
Japan expanded its zaibatsu2 (horizontal monopoly) system of corporations
(e.g. Mitsubishi, Sumitomo, etc.) by establishing joint-ventures and acquiring shares in
foreign operations complimentary to existing operations (Beasley 1995). The zaibatsu
model has been successfully exported to Korea, in such conglomerates as Samsung and
Hyundai, and Taiwan, in such groups as Formosa Plastics and China Trust. These
companies are able to internally smooth business cycles and are therefore more robust
to external changes. However, the model lacks sufficient transparency and can be used
to hide fiscal negligence or wrong doing.
In the British sphere of influence, large holding companies emerged in Hong
Kong as it became the sole point of contact with Mainland China. Companies, such as
Citic Pacific Ltd and Jardine Fleming,3 were able to capitalize on the dislocation of
financial services from Shanghai and Guangzhou. The use of British law established a
strong preference for private property and for transparent legal and judicial process to
ensure that right (Shang-Jin 2000). Singapore and Hong Kong further capitalized on
their size, location, and transparent legal process to attract investment and develop
financial services insulated from political vagaries of neighboring countries.
2 Zaibatsu literally refers to large family-controlled banking and industrial groups of the Edo- and Meiji periods. The Zaibatsu were broken up after the end of World War II and the term has come to be associated with a large corporation with diversified holdings. They are not a monopoly or trust in the traditional sense, but are able to control most or all of the inputs necessary from start to finish of a product within related corporations. In Korea, the term used is Chaebol, and in Taiwan, Guanxi Qiy. 3 Subsidiary of Jardine Matheson created when firm moved to Bermuda prior to Hong Kong reverting back to Chinese sovereignty.
17
Other legacies of the Cold War period include tolerance for local strongmen
and rampant corruption so long as the political ideology aligned with Western,
principally, US views. Dictatorships or paternal autocratic leaders flourished in most
of the region until the end of the 1980s and in some cases (Indonesia) the later 90s.
Strong, transparent democratic institutions are relatively new to the region, although
various forms and models have been employed throughout much of the 20th century. It
was not until the mid-70s that anti-corruption and police reform appeared as useful
tools to reduce leakages and rent-seeking activities. However, leaders in Indonesia, the
Philippines, and Thailand, were not deterred by the changes occurring in Hong Kong
and Singapore, which were viewed as fairly homogenous ethic Chinese populations
that have developed under British law. Strong military and/or single party rule allowed
many at the top to prosper, but diminished the overall growth of the country’s
economic development.
Leaders such as President Suharto of Indonesia and President Marcos of the
Philippines promoted pro-business development by normalizing rent-seeking activities
through effective enforcement and publicly acknowledged levels of acceptable bribes
(MacIntyre, 2003). As a result, Indonesia and the Philippines both experienced
extraordinary rates of economic growth during the late 60s and throughout the 1970s.
Investors were attracted to the security of knowing the true cost of business
18
opportunities in the respective countries. After Marcos was forced to resign in 1986,
the Philippines’ economy declined from its peak in 1982 of USD 1000 per capita and
did not again reach this level until 2002.
There are many reasons for the divergent results in the region. This study is
principally interested in the role of technology and the rate at which large scale
infrastructure is implemented and deployed. The type of corruption experienced in the
Philippines under Marcos or Indonesia under Suharto, allowed business development
to occur regardless of rent-seeking on the part of government officials. After the
removal of these leaders, the cost of corruption hinders the further growth. Political
and economic instability seem to inform both the investment decisions of private
individuals as well as governments. Establishing credible signals to investors seems to
be critical in leveraging the necessary capital to expand necessary infrastructure
(McLeod, 2004). Without credible signals or sound fundamentals capital will not be
available for use in development.
The use of official development assistance to offer private institutions the sense
of credibility is only useful in so much as local governments are able to demonstrate
their ability to exercise state capacity. As the fall of Suharto has illustrated, weak state
institutions are not able in and of themselves to demonstrate a credible investment
environment. The austerity of International Monetary Fund (IMF) programs coupled
19
with reforms implemented by the central bank have been insufficient to restore
Indonesia to pre-Asian Financial Crisis (1997-1998) levels of growth (Drakeley 2005).
State capacity and effective enforcement are necessary conditions for the deployment
of large-scale energy systems.
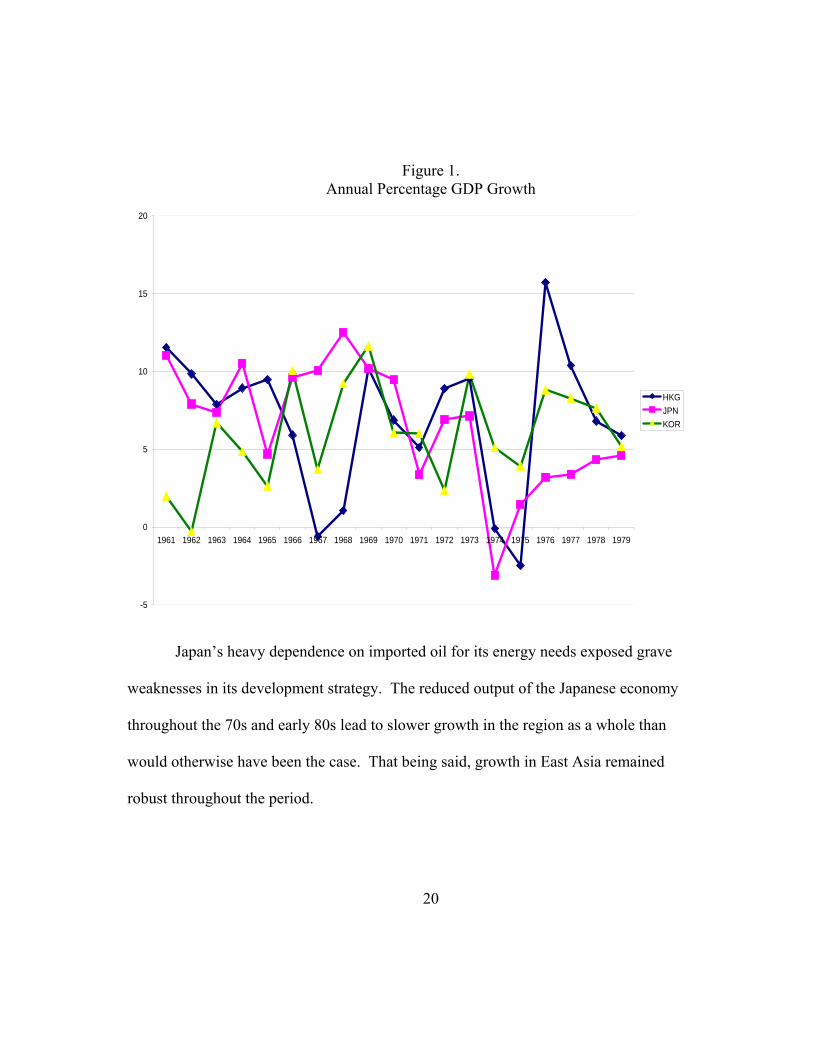
GDP per capita growth rates for Japan, Hong Kong, and South Korea over the
period 1961 – 1979 are shown in figure 1. The three countries exhibit very strong
annual growth over the period. Hong Kong experienced large scale rioting in 1966-67
in part due to pro-communist sentiment in support of China’s Cultural Revolution
leading to lower than expected growth. The Organization of Arab Petroleum
Exporting Countries’ oil embargo of 1973 resulted in a sharp cut in growth and
resulted in prolonged recovery for Japan throughout the rest of the decade. However,
average growth over the period was quite robust Hong Kong (HKG), Japan (JPN), and
South Korea (KOR) at 6.9%, 6.6%, 6.0% respectively.
20
Figure 1. Annual Percentage GDP Growth
-5
0
5
10
15
20
1961 1962 1963 1964 1965 1966 1967 1968 1969 1970 1971 1972 1973 1974 1975 1976 1977 1978 1979
HKGJPNKOR
Japan’s heavy dependence on imported oil for its energy needs exposed grave
weaknesses in its development strategy. The reduced output of the Japanese economy
throughout the 70s and early 80s lead to slower growth in the region as a whole than
would otherwise have been the case. That being said, growth in East Asia remained
robust throughout the period.
21
Chapter 3. Economic Indicators & Data
The East Asian region has experienced robust growth in both GDP and in
electricity demand over the last 40 plus years. I compiled data from Asian
Development Bank (ADB), Organization of Economic Cooperation and Development
(OECD), International Energy Agency (IEA), and/or World Bank on 12 countries
Australia, People’s Republic of China (China), Hong Kong, Japan, Indonesia,
Malaysia, New Zealand, the Philippines, Singapore, Thailand, and the USA] for the
period 1971 – 2003.4 Australia, New Zealand, and the United States are included due
to their strong presence in terms of aid, military presence, and trade with the region, as
well as providing a reference as to level of development of the other countries. The
data compare countries at various states of development. There are three main groups:
Advanced Industrials, Newly Industrialized, and Developing. Advanced Industrials
contain Australia, Japan, New Zealand, and the USA. Newly Industrialized contains
Hong Kong, Singapore, and South Korea. Developing Countries contain China,
Indonesia, Malaysia, the Philippines, and Thailand. Due to China’s size and unique
conditions it was removed from Developing Countries and given its own dummy
4 Additional data has been used where available for the period 1960 – 2005 to further elucidate trends or explain relationships.
22
variable. Lastly due to the size and magnitude of the US economy it was also
addressed separately in certain models and used as the reference group.
There are four broad groups of variables: Electricity, Capital, GDP, and
Population. The electricity variables measure production (actual output), consumption
(actual used), annual growth in both production and consumption, percent of
production by fuel source, renewable electricity production, tradition electricity
production (fossil fuels & nuclear), annual growth of both renewable and traditional
production, and transmission and distribution losses measured as a percent of output.
The capital variables measure gross capital formation as a percent of GDP, gross
capital formation in the local currency unit (constant 2000 LCU), and annual growth of
gross capital formation. The GDP variables measure GDP in Current US dollars,
Constant 2000 USD, and Constant 2000 local currency unit, annual growth, as well as
natural log transformation of GDP. Finally, the last group of variables, Population,
measure total population, annual population growth, urban population as a percent of
total population, and annual urban population growth. Population has additionally
been used to calculate electricity output and use per capita and GDP per capita. All
growth variables are either obtained directly from one of the above sources or are
constructed from previous year data.
23
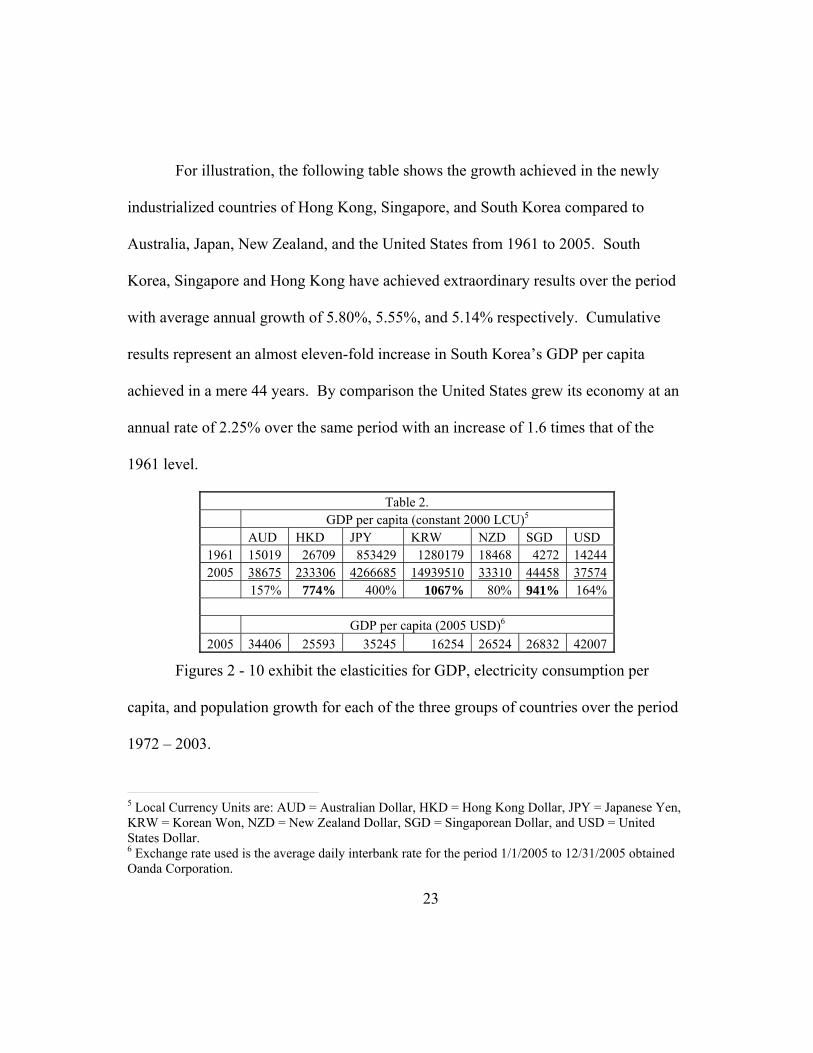
For illustration, the following table shows the growth achieved in the newly
industrialized countries of Hong Kong, Singapore, and South Korea compared to
Australia, Japan, New Zealand, and the United States from 1961 to 2005. South
Korea, Singapore and Hong Kong have achieved extraordinary results over the period
with average annual growth of 5.80%, 5.55%, and 5.14% respectively. Cumulative
results represent an almost eleven-fold increase in South Korea’s GDP per capita
achieved in a mere 44 years. By comparison the United States grew its economy at an
annual rate of 2.25% over the same period with an increase of 1.6 times that of the
1961 level.
Table 2. GDP per capita (constant 2000 LCU)5 AUD HKD JPY KRW NZD SGD USD 1961 15019 26709 853429 1280179 18468 4272 14244 2005 38675 233306 4266685 14939510 33310 44458 37574 157% 774% 400% 1067% 80% 941% 164% GDP per capita (2005 USD)6 2005 34406 25593 35245 16254 26524 26832 42007
Figures 2 - 10 exhibit the elasticities for GDP, electricity consumption per
capita, and population growth for each of the three groups of countries over the period
1972 – 2003.
5 Local Currency Units are: AUD = Australian Dollar, HKD = Hong Kong Dollar, JPY = Japanese Yen, KRW = Korean Won, NZD = New Zealand Dollar, SGD = Singaporean Dollar, and USD = United States Dollar. 6 Exchange rate used is the average daily interbank rate for the period 1/1/2005 to 12/31/2005 obtained Oanda Corporation.

24
0
20000000000
40000000000
60000000000
80000000000
100000000000
120000000000
140000000000
1972 1975 1978 1981 1984 1987 1990 1993 1996 1999 2002
10 AUD10000 JPYNZD100 USD
Advanced Industrials
Figure 2 – 4 shows the Advanced Industrials, where it is easy to see the limited
growth of Japan after the collapse of its financial markets in the early 1990s, where as
Australia and the United States have enjoyed fairly strong growth from the mid 80s to
the end of the period. New Zealand, on the other hand, has strong growth occurring in
the final third of the period. The following charts have been scaled to illustrate relative
slope although the unit of measure is not the same.
Figure 2. GDP LCU 2000 Constant

25
Figure 3. Electricity Consumption per capita (kWh)
0
2000
4000
6000
8000
10000
12000
14000
16000
1972 1975 1978 1981 1984 1987 1990 1993 1996 1999 2002
AUSJPNNZLUSA
26
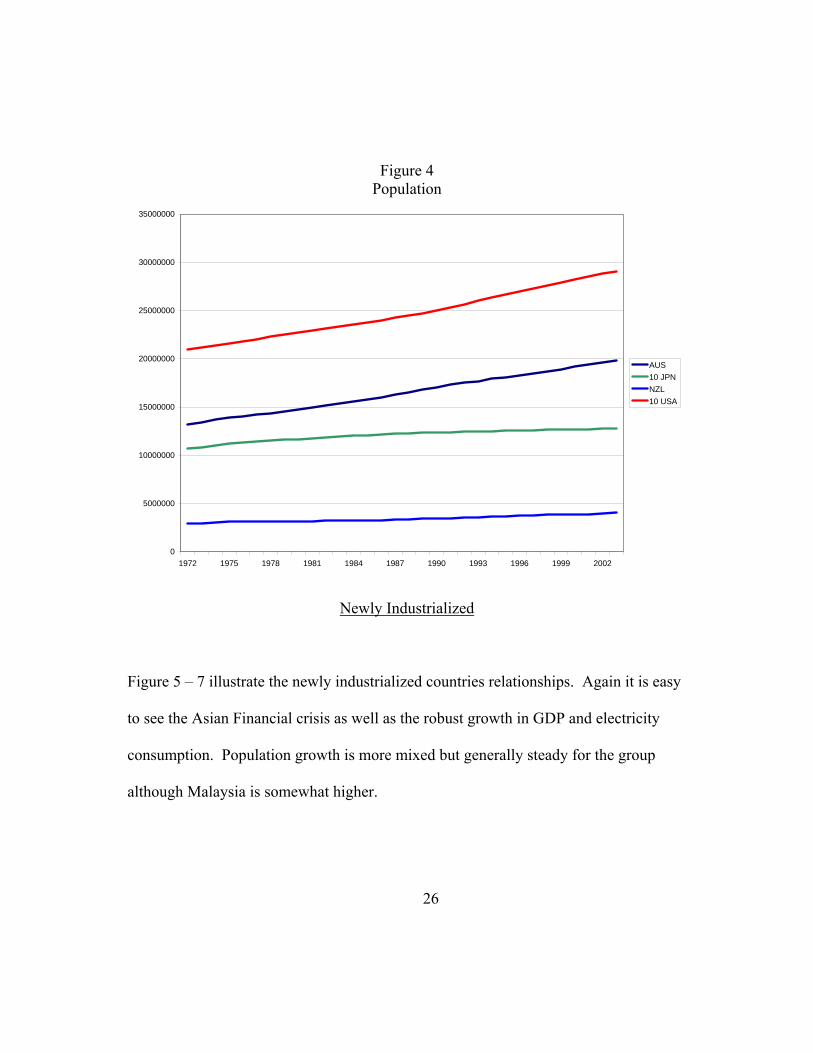
Figure 4 Population
0
5000000
10000000
15000000
20000000
25000000
30000000
35000000
1972 1975 1978 1981 1984 1987 1990 1993 1996 1999 2002
AUS10 JPNNZL10 USA
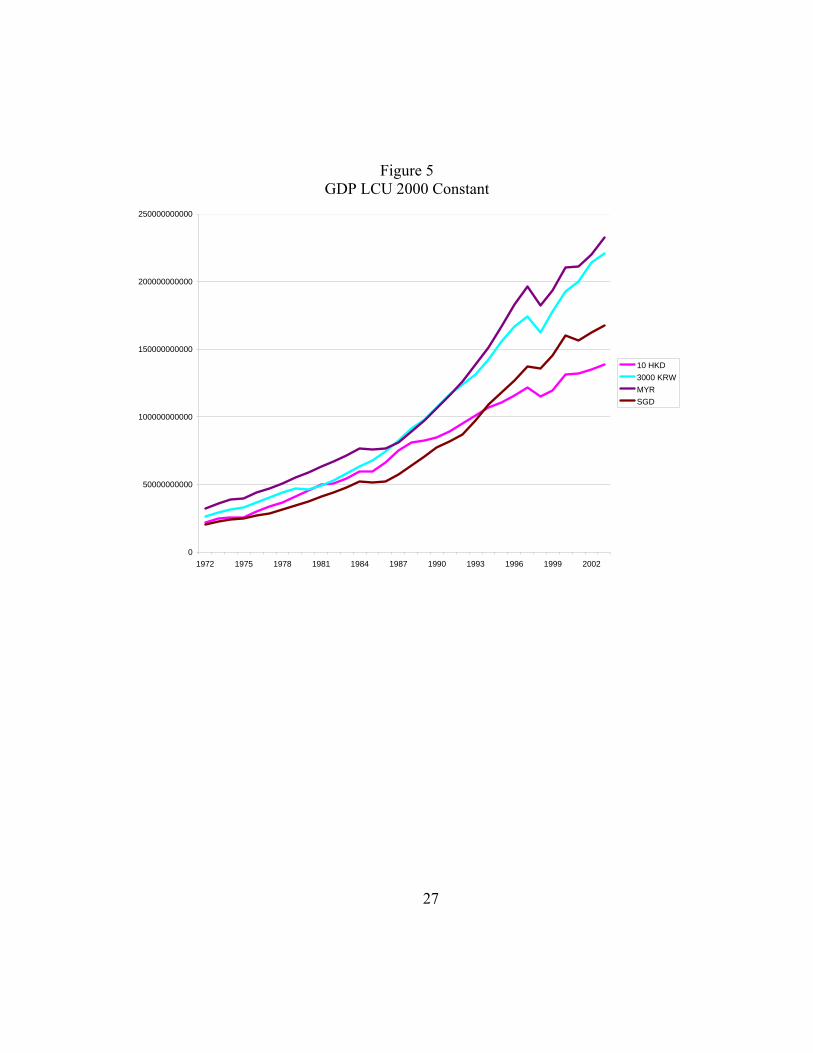
Newly Industrialized
Figure 5 – 7 illustrate the newly industrialized countries relationships. Again it is easy
to see the Asian Financial crisis as well as the robust growth in GDP and electricity
consumption. Population growth is more mixed but generally steady for the group
although Malaysia is somewhat higher.
27
Figure 5 GDP LCU 2000 Constant
0
50000000000
100000000000
150000000000
200000000000
250000000000
1972 1975 1978 1981 1984 1987 1990 1993 1996 1999 2002
10 HKD3000 KRWMYRSGD

28
Figure 6 Electricity Consumption per capita (kWh)
0
1000
2000
3000
4000
5000
6000
7000
8000
9000
1972 1975 1978 1981 1984 1987 1990 1993 1996 1999 2002
HKGKORMYSSGP
29
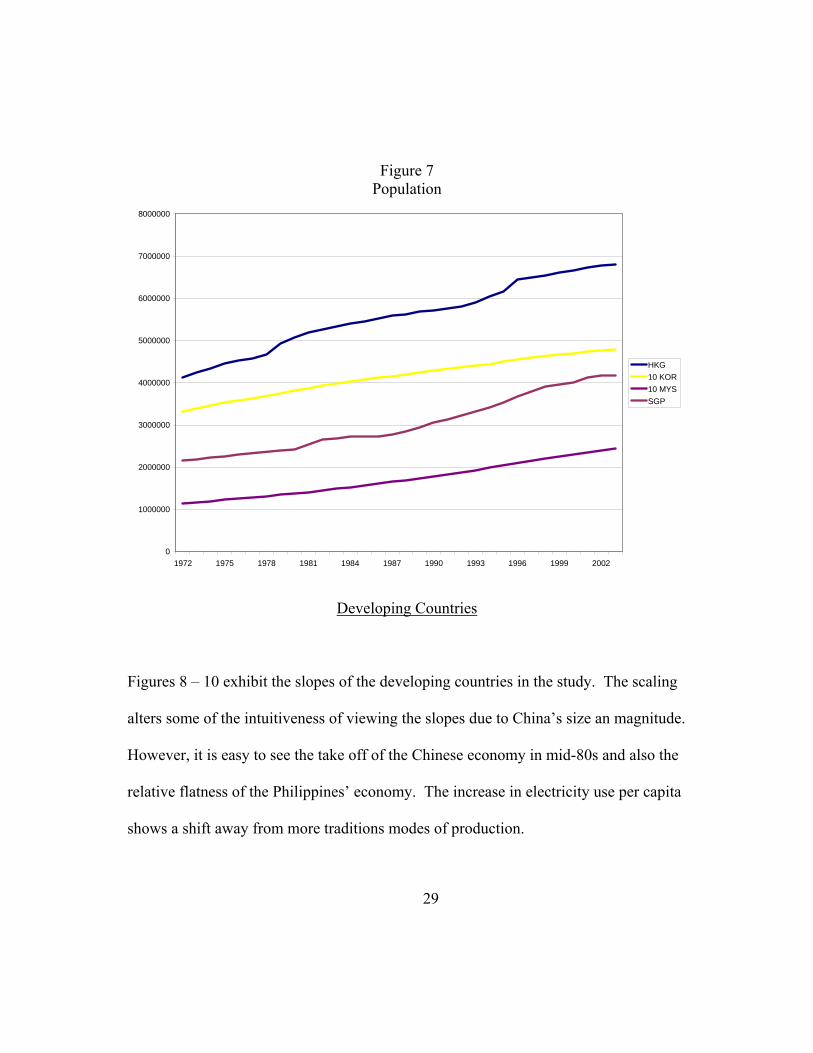
Figure 7 Population
0
1000000
2000000
3000000
4000000
5000000
6000000
7000000
8000000
1972 1975 1978 1981 1984 1987 1990 1993 1996 1999 2002
HKG10 KOR10 MYSSGP
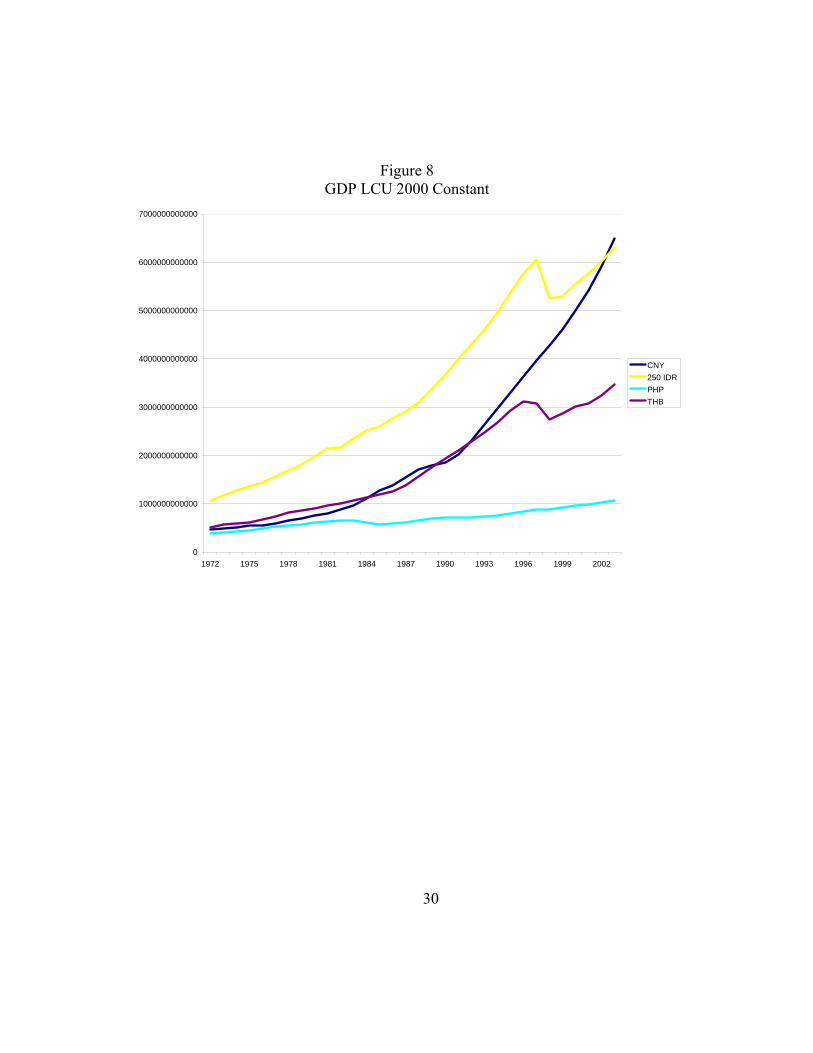
Developing Countries
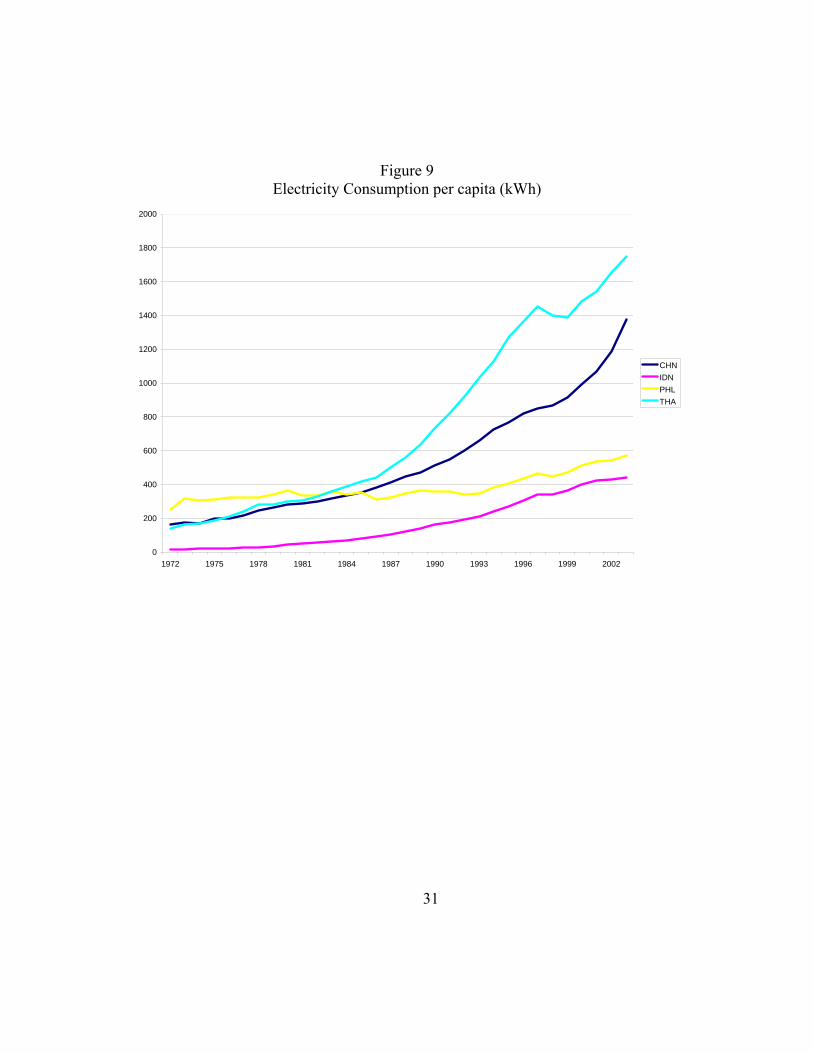
Figures 8 – 10 exhibit the slopes of the developing countries in the study. The scaling
alters some of the intuitiveness of viewing the slopes due to China’s size an magnitude.
However, it is easy to see the take off of the Chinese economy in mid-80s and also the
relative flatness of the Philippines’ economy. The increase in electricity use per capita
shows a shift away from more traditions modes of production.
30
Figure 8 GDP LCU 2000 Constant
0
1000000000000
2000000000000
3000000000000
4000000000000
5000000000000
6000000000000
7000000000000
1972 1975 1978 1981 1984 1987 1990 1993 1996 1999 2002
CNY250 IDRPHPTHB
31
Figure 9 Electricity Consumption per capita (kWh)
0
200
400
600
800
1000
1200
1400
1600
1800
2000
1972 1975 1978 1981 1984 1987 1990 1993 1996 1999 2002
CHNIDNPHLTHA

32
0
1000000
2000000
3000000
4000000
5000000
6000000
7000000
8000000
9000000
1972 1975 1978 1981 1984 1987 1990 1993 1996 1999 2002
1000 CHN100 IDN10 PHL10 THA
Figure 10 Population
Table 3 shows the average annual growth of each country for GDP, Population, and
Electricity Consumption.
Table 3. Average Annual Growth Rate (%) GDP POP Electricity UseAustralia 3.23 1.34 4.76Japan 2.97 0.59 6.56New Zealand 2.30 1.06 8.65United States 3.15 1.05 10.60Hong Kong 6.33 1.62 3.16South Korea 7.13 1.20 11.81Malaysia 6.74 2.46 8.59 Singapore 7.26 2.14 10.14China 8.79 1.33 3.28Indonesia 6.03 1.81 2.85Philippines 3.54 2.37 13.14Thailand 6.37 1.65 5.56
33
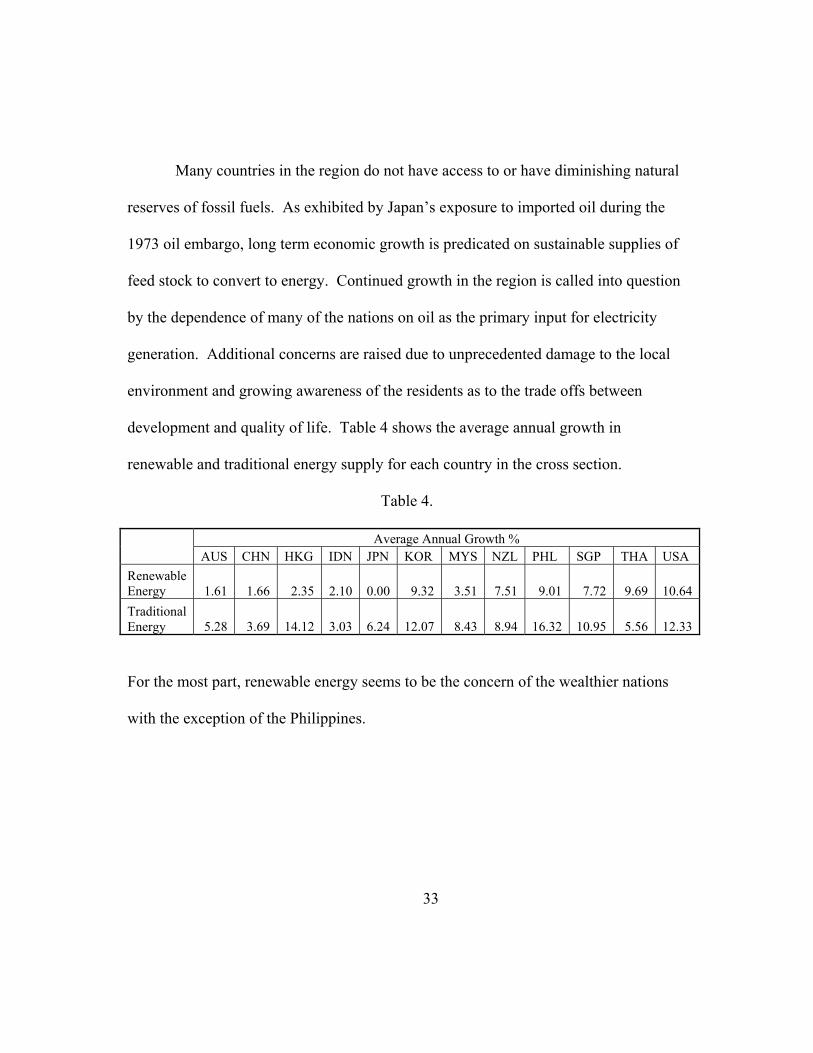
Many countries in the region do not have access to or have diminishing natural
reserves of fossil fuels. As exhibited by Japan’s exposure to imported oil during the
1973 oil embargo, long term economic growth is predicated on sustainable supplies of
feed stock to convert to energy. Continued growth in the region is called into question
by the dependence of many of the nations on oil as the primary input for electricity
generation. Additional concerns are raised due to unprecedented damage to the local
environment and growing awareness of the residents as to the trade offs between
development and quality of life. Table 4 shows the average annual growth in
renewable and traditional energy supply for each country in the cross section.
Table 4.
Average Annual Growth % AUS CHN HKG IDN JPN KOR MYS NZL PHL SGP THA USA Renewable Energy 1.61 1.66 2.35 2.10 0.00 9.32 3.51 7.51 9.01 7.72 9.69 10.64Traditional Energy 5.28 3.69 14.12 3.03 6.24 12.07 8.43 8.94 16.32 10.95 5.56 12.33
For the most part, renewable energy seems to be the concern of the wealthier nations
with the exception of the Philippines.
34
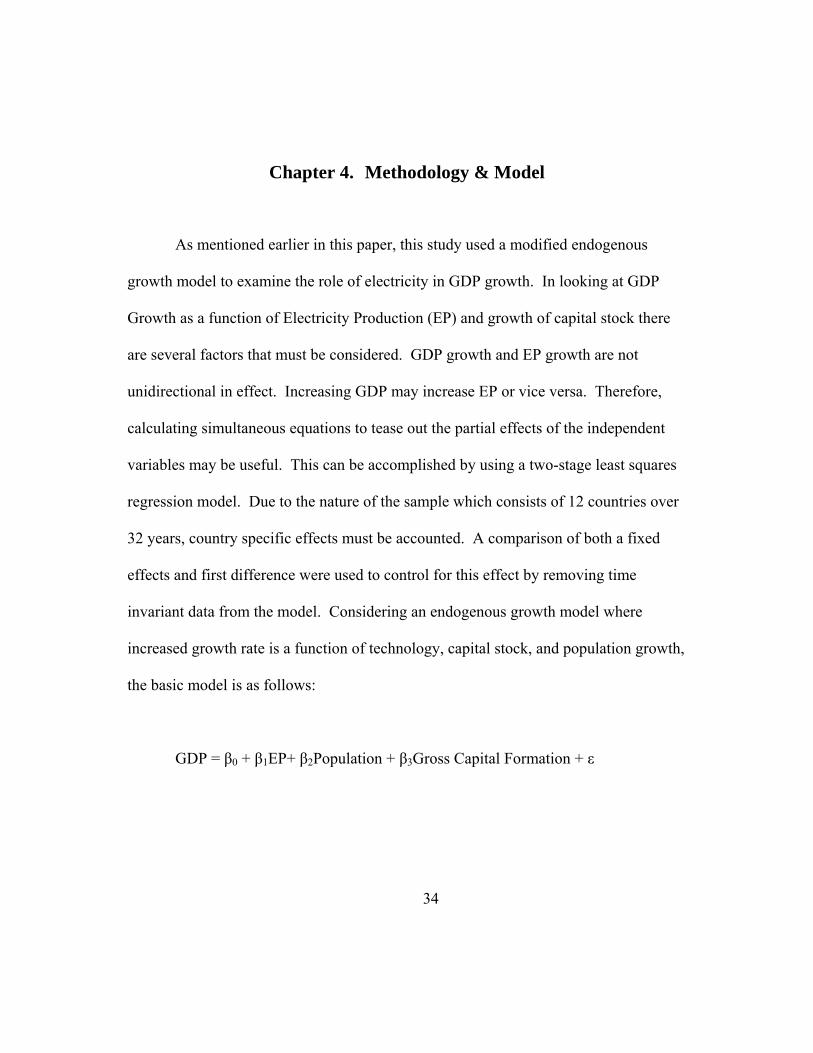
Chapter 4. Methodology & Model
As mentioned earlier in this paper, this study used a modified endogenous
growth model to examine the role of electricity in GDP growth. In looking at GDP
Growth as a function of Electricity Production (EP) and growth of capital stock there
are several factors that must be considered. GDP growth and EP growth are not
unidirectional in effect. Increasing GDP may increase EP or vice versa. Therefore,
calculating simultaneous equations to tease out the partial effects of the independent
variables may be useful. This can be accomplished by using a two-stage least squares
regression model. Due to the nature of the sample which consists of 12 countries over
32 years, country specific effects must be accounted. A comparison of both a fixed
effects and first difference were used to control for this effect by removing time
invariant data from the model. Considering an endogenous growth model where
increased growth rate is a function of technology, capital stock, and population growth,
the basic model is as follows:
GDP = β0 + β1EP+ β2Population + β3Gross Capital Formation + ε
35
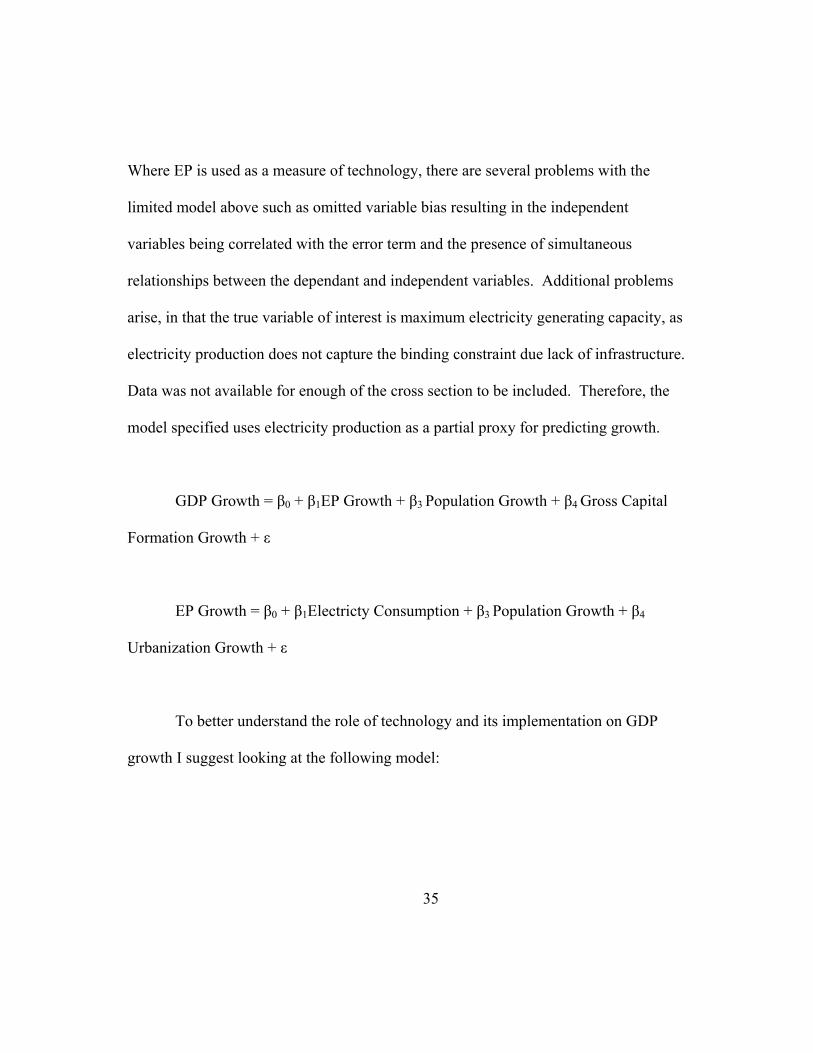
Where EP is used as a measure of technology, there are several problems with the
limited model above such as omitted variable bias resulting in the independent
variables being correlated with the error term and the presence of simultaneous
relationships between the dependant and independent variables. Additional problems
arise, in that the true variable of interest is maximum electricity generating capacity, as
electricity production does not capture the binding constraint due lack of infrastructure.
Data was not available for enough of the cross section to be included. Therefore, the
model specified uses electricity production as a partial proxy for predicting growth.
GDP Growth = β0 + β1EP Growth + β3 Population Growth + β4 Gross Capital
Formation Growth + ε
EP Growth = β0 + β1Electricty Consumption + β3 Population Growth + β4
Urbanization Growth + ε
To better understand the role of technology and its implementation on GDP
growth I suggest looking at the following model:
36
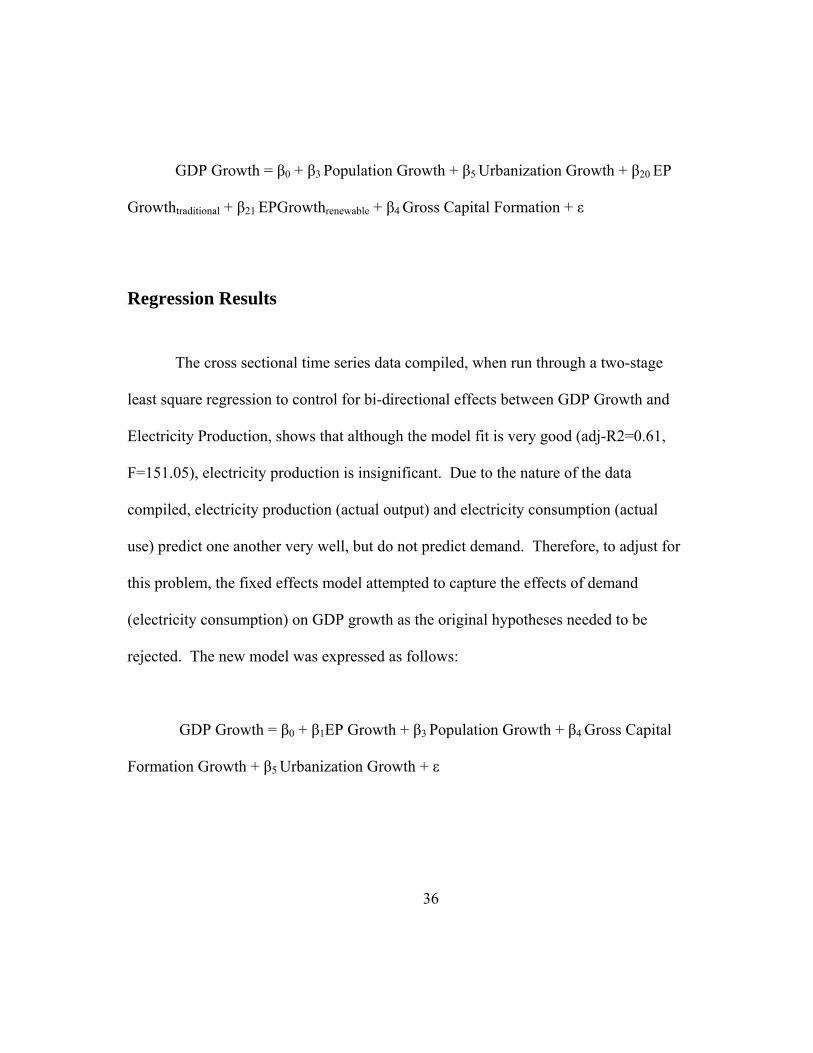
GDP Growth = β0 + β3 Population Growth + β5 Urbanization Growth + β20 EP
Growthtraditional + β21 EPGrowthrenewable + β4 Gross Capital Formation + ε
Regression Results
The cross sectional time series data compiled, when run through a two-stage
least square regression to control for bi-directional effects between GDP Growth and
Electricity Production, shows that although the model fit is very good (adj-R2=0.61,
F=151.05), electricity production is insignificant. Due to the nature of the data
compiled, electricity production (actual output) and electricity consumption (actual
use) predict one another very well, but do not predict demand. Therefore, to adjust for
this problem, the fixed effects model attempted to capture the effects of demand
(electricity consumption) on GDP growth as the original hypotheses needed to be
rejected. The new model was expressed as follows:
GDP Growth = β0 + β1EP Growth + β3 Population Growth + β4 Gross Capital
Formation Growth + β5 Urbanization Growth + ε

37
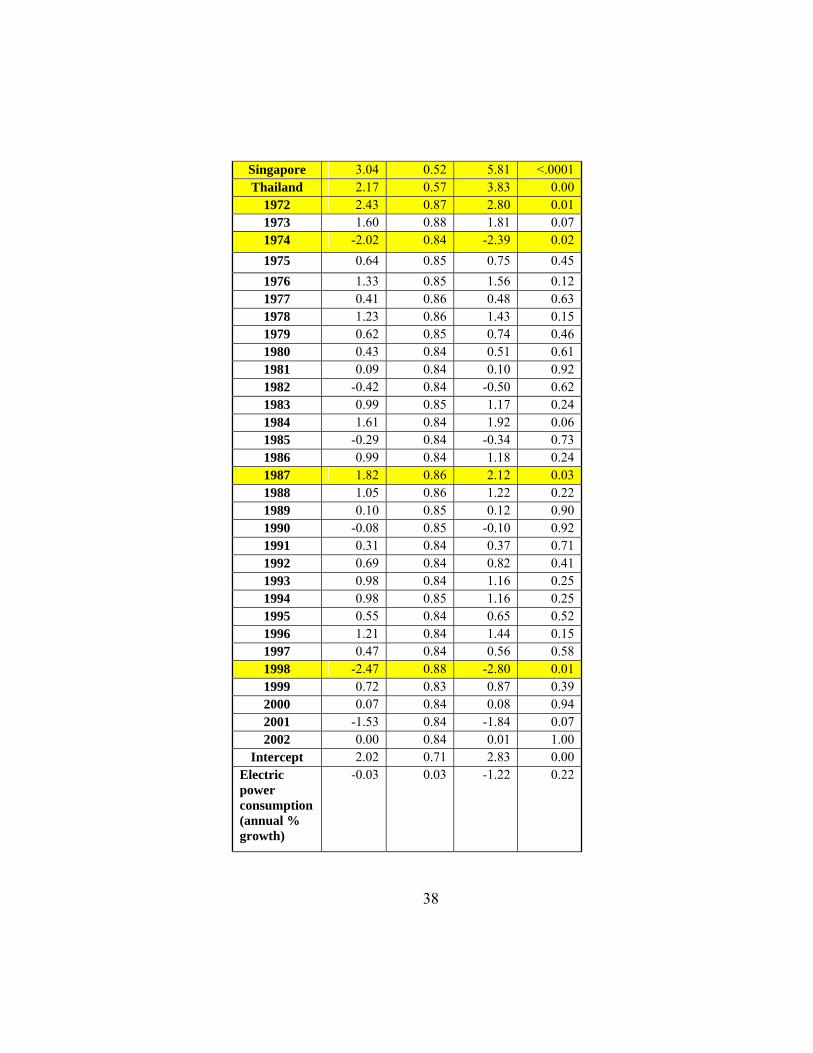
The Two-way fixed effect model produced stronger results yet the variable of
interest remains insignificant. This model produced highly significant results for the
following countries compared to the United States: China, Hong Kong, South Korea,
Malaysia, Singapore, and Thailand. The years 1973, 1987, and 1998 also produced
highly significant results compared with 2003. As to the variables contained in the
model, only Gross Capital Formation proved highly significant. As noted above, the
primary variable of interest is likely not different than zero. Table 5 shows the
parameter estimates for the regression.
Table 5. Fit Statistics
SSE 1406.716 DFE 337 MSE 4.1742 Root
MSE 2.0431
R-Square 0.7783
F Test for No Fixed Effects
Num DF Den DF F Value Pr > F 42 337 5.89 <.0001
Parameter Estimates
Variable Estimate Standard Error
t Value Pr > |t|
Australia -0.16 0.54 -0.31 0.76 China 3.63 0.70 5.16 <.0001
Hong Kong 2.29 0.56 4.11 <.0001 Indonesia 0.95 0.77 1.23 0.22
Japan 0.01 0.53 0.01 0.99 South Korea 2.34 0.61 3.83 0.00
Malaysia 1.86 0.62 2.99 0.00 New
Zealand -0.91 0.51 -1.76 0.08
Philippines -0.30 0.60 -0.49 0.62
38
Singapore 3.04 0.52 5.81 <.0001 Thailand 2.17 0.57 3.83 0.00
1972 2.43 0.87 2.80 0.01 1973 1.60 0.88 1.81 0.07 1974 -2.02 0.84 -2.39 0.02 1975 0.64 0.85 0.75 0.45 1976 1.33 0.85 1.56 0.12 1977 0.41 0.86 0.48 0.63 1978 1.23 0.86 1.43 0.15 1979 0.62 0.85 0.74 0.46 1980 0.43 0.84 0.51 0.61 1981 0.09 0.84 0.10 0.92 1982 -0.42 0.84 -0.50 0.62 1983 0.99 0.85 1.17 0.24 1984 1.61 0.84 1.92 0.06 1985 -0.29 0.84 -0.34 0.73 1986 0.99 0.84 1.18 0.24 1987 1.82 0.86 2.12 0.03 1988 1.05 0.86 1.22 0.22 1989 0.10 0.85 0.12 0.90 1990 -0.08 0.85 -0.10 0.92 1991 0.31 0.84 0.37 0.71 1992 0.69 0.84 0.82 0.41 1993 0.98 0.84 1.16 0.25 1994 0.98 0.85 1.16 0.25 1995 0.55 0.84 0.65 0.52 1996 1.21 0.84 1.44 0.15 1997 0.47 0.84 0.56 0.58 1998 -2.47 0.88 -2.80 0.01 1999 0.72 0.83 0.87 0.39 2000 0.07 0.84 0.08 0.94 2001 -1.53 0.84 -1.84 0.07 2002 0.00 0.84 0.01 1.00
Intercept 2.02 0.71 2.83 0.00 Electric power consumption (annual % growth)
-0.03 0.03 -1.22 0.22
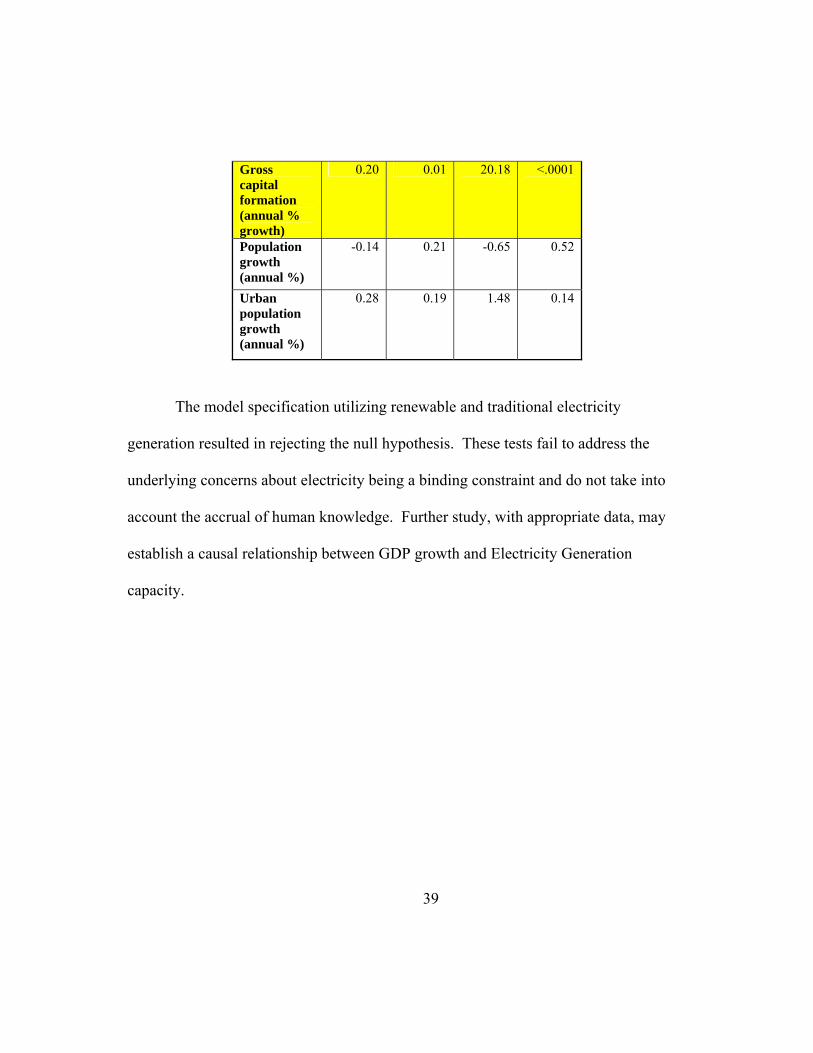
39
Gross capital formation (annual % growth)
0.20 0.01 20.18 <.0001
Population growth (annual %)
-0.14 0.21 -0.65 0.52
Urban population growth (annual %)
0.28 0.19 1.48 0.14
The model specification utilizing renewable and traditional electricity
generation resulted in rejecting the null hypothesis. These tests fail to address the
underlying concerns about electricity being a binding constraint and do not take into
account the accrual of human knowledge. Further study, with appropriate data, may
establish a causal relationship between GDP growth and Electricity Generation
capacity.
40
Chapter 5. Conclusion
This study failed to establish a causal link between electricity production (or
consumption) and GDP Growth in the Pacific Rim. However, the multiple regressions
did point to the high significance of gross capital formation in the role of GDP growth.
Capital formation, capital controls, access to financial markets, rent-seeking and
corruption are common themes in the development literature. By isolating specific
elements of economic growth, those in the development community or appropriate
governments can craft policies that enhance, stimulate, or curtail these specific actions.
The Asia-Pacific region offers many lessons in the role of institutions, transparency,
and strong state capacity. Much of the development in the region has occurred in spite
of intervention and show that there is a separation between political and economic
institutions.
The regression models do suggest that urbanization does play some role in
GPD growth. The more developed countries in the sample have high degrees of
urbanization. This allows them to develop infrastructure that would otherwise prove to
be cost-prohibitive. These countries have an opportunity to invest in necessary
infrastructure due to the large amount of foreign direct investment, official
development aid, and domestic investment provide to the region. The costs of late
41
development may be off-set by newer technologies resulting in more effective growth.
Such innovations as wireless phones, the internet, distributed generation, combined
heat and power, renewable energy, among others lessen the amount of initial capital
and/or operational expenses.
For island nations such as the Indonesia and the Philippines, where traditional
fixed line telephones and electricity distribution grids are costly to establish and
maintain, new technologies present vital opportunities to make capital more effective.
Future costs associated with climate change, development, environmental degradation,
among others, will impact decision by the power elite, while at the same time
facilitating greater material well-being. Lesson must be drawn from those countries
that were able to transition from traditional to modern economies in the post-colonial
world. Electrification allows for the substitution of human labor for mechanical labor,
or more specifically the substitution of capital for labor. It would seem that in
countries where labor is plenty and cheap the cost to employ capital will be high.
Additional barriers to capital utilization also exist in the form of small capital markets,
high rents, poorly define property rights, and corruption. However, the region as a
whole has high savings rates, high GDP growth and low population growth. Policies
need to be established that enhance domestic business opportunities and reduce the
barriers to effective capital utilization.
42
References
Asian Development Bank. 2006. Basic Statistics 2006: Developing Member Countries.
Manila, Philippines. Retrieved 15 January 2007
http://www.adb.org/Statistics/pdf/Basic-Statistics-2006-Web.pdf
Asian Development Bank. 2002. Country Economic Review: People’s Republic of
China. Manila, Philippines. Retrieved 10 February 2007
http://www.adb.org/Documents/CERs/PRC/CER_PRC_2002.pdf
Asian Development Bank. 2004. Country Economic Review: Indonesia. Manila,
Philippines. Retrieved 10 February 2007
http://www.adb.org/Documents/CERs/INO/2004/default.asp
Asian Development Bank. 2004. Country Economic Review: Philippines. Manila,
Philippines. Retrieved 10 February 2007
http://www.adb.org/Documents/CERs/PHI/2004/default.asp
43
Asian Development Bank. 2001. Country Economic Review: Thailand. Manila,
Philippines. Retrieved 10 February 2007
http://www.adb.org/Documents/CERs/THA/2001/default.asp
Asian Development Bank. 2000. Country Economic Review: Viet Nam. Manila,
Philippines. Retrieved 10 February 2007
http://www.adb.org/Documents/CERs/VIE/
Asian Development Bank. 1999. Key Indicators of Developing Asian and Pacific
Countries. Vol 30. Retrieved 10 February 2007
http://www.adb.org/Documents/Books/Key_Indicators/1999/default.asp
Asian Development Bank. 2000. Key Indicators of Developing Asian and Pacific
Countries. Vol 31. Retrieved 10 February 2007
http://www.adb.org/Documents/Books/Key_Indicators/2000/default.asp
Asian Development Bank. 2001. Key Indicators of Developing Asian and Pacific
Countries. Retrieved 10 February 2007
http://www.adb.org/Documents/Books/Key_Indicators/2001/default.asp
44
Asafu-Adjaye, Joseph. 2002. The relationship between energy consumption, energy
prices and economic growth: time series evidence from Asian developing
countries. Energy Economics 22: 615-625.
Barnhart, Michael A.. 1995. Japan and the World since 1868. New York: St. Martin’s
Press.
Beasley, W.G.. 1995. The Rise of Modern Japan: Political, Economic, and Social
Change Since 1850. New York: St. Martin’s Press.
Curtis, Gerald L., ed. 1994. The United States, Japan, and Asia: Challenges for U.S.
Policy. New York: W. W. Norton & Company.
Drakeley, Steven. 2005. The History of Indonesia. Westport, CT: Greenwood Press.
Djalal, Dini. 2001. Global Corruption Report, Regional Report Southeast Asia 2001.
United Nations Public Administration
45
Grindle, Merilee. 2004. Good Enough Governance: Poverty Reduction and Reform in
Developing Countries. Governance 17 (4): 525–548.
Kahin, George Mac Tuman. 1959. Governments and politics of Southeast Asia. Ithaca,
NY: Cornell University Press.
Kim, Y. H. and Smith, K. R.. 1989. Electricity in Northeast Asia: the Principal
Historical Trends. In Electricity in Economic Development: The Experience of
Northeast Asia. ed. Y.H. Kim and K.R. Smith, 1-19. Westport, CT: Greenwood
Press.
Kim, Y. H., Yu, O. S., and Nakamura, M.. 1989. Structure, Parameters, and Prediction
of Demand. In Electricity in Economic Development: The Experience of
Northeast Asia ed. Y.H. Kim and K.R. Smith. 21-64. Westport, CT:
Greenwood Press.

46
Kim, Y. H. and Smith, K. R.. 1989. Electric Power in Development: lessons from
Northeast Asia. In Electricity in Economic Development: The Experience of
Northeast Asia ed. Y.H. Kim and K.R. Smith. 225-249. Westport, CT:
Greenwood Press.
MacIntyre, Andrew. 2003. Institutions and Political Economy of Corruption in
Developing Countries. Asian Pacific School of Economics and Government,
Australian National University. Canberra, ACT.
McLeod, Ross. 2004. After Soeharto: Prospects for Reform and Recovery in Indonesia.
Indonesia Project, Economics Division, Australian National University.
Canberra, ACT.
McRae, Robert N.. 1992. Energy Demand inn Developing Asian Countries.
International Issues in Energy Policy, Development, and Economics. ed. James
P. Dorian and Fereidun Fesharaki. 7-23. Boulder, CO: Westview Press.
Miyan, M. Allmullah and Richards, John. 2004. Energy Policy for Bangladesh. CPR
Commentary No. 3. Simon Fraser University, Vancouver, BC, Canada.
47
Othman, M.Y., Yatim, B., and Sopian, K.. 1997. Status of Renewable Energy
Technology in Malaysia. Solar Energy Research Group, Universiti Kebangsaan
Malaysia, Bangi, Malaysia.
Oxley, Alan, and Macmillan, Steven. 2004. The Kyoto Protocol and the APEC
Economies. Australian APEC Study Centre, Melbourne, Australia.
Romer, Paul M. 1986. Increasing Returns and Long Run Growth. Journal of Political
Economy, Vol. 94, No. 5. 1002-1037.
Saha, Pranesh Chandra. 2003. Sustainable energy development: a challenge for Asia
and the Pacific region in the 21st century. Energy Policy 31: 1051-1059.
Shang-Jin Wei. 2000. How Taxing is Corruption on International Investors?. Review
of Economics and Statistics Vol. 82, No. 1.
48
Sugiyono, Agus. 2001. Renewable Energy Development Strategy in Indonesia: CDM
Funding Alternative. Proceeding of the 5th INAGA Annual Scientific
Conference & Exhibitions. Yogyakarta, Indonesia.
Timmer, C. Peter. 2006. How Countries Get Rich. Center for Global Development.
Transparency International. 2005. Corruption Perception Index. Berlin, Germany.
Transparency International. 2005. Global Corruption Barometer. Berlin, Germany.
von Albertini, Rudolf. 1982. European Colonial Rule, 1880-1940: The Impact of the
West on India, Southeast Asia, and Africa. Westport, CT: Greenwood Press.
World Bank. 2001. Independent Evaluation Group, Operation Evaluation Department,
Coal for Power Generation,
http://lnweb18.worldbank.org/oed/oeddoclib.nsf/DocUNIDViewForJavaSearch
/D03678CA7E15AA94852567F5005D8584

49
World Bank. 2004. World Development Report, Making Services work for Poor
People. Washington, D.C.