development co-operation report 2007 · development co-operation report 2007 ... of the volume and...
TRANSCRIPT

DEVELOPMENT CO-OPERATION REPORT 2007
Summary - January 2008
“I have been fortunate to chair the Development Assistance Committee over a period rich in change. International concern about poor countries has rightly had greater weight than often in the past. The scope for progress has been relatively high, and the development community has – gradually and still, as this chapter suggests, rather modestly – been shifting gears in response to the opportunities for more effective aid that the new environment provides. The DAC has played a role in encouraging this through its transparent reporting – a hallmark of OECD – of the volume and composition of ODA, through its many initiatives to improve aid effectiveness, and through its work in building common policies.”
– Richard Manning, OECD DAC Chair
DEVELOPMENT CO-OPERATION REPORT 2007
S ince 2003, official development assistance (ODA) has been on the rise in many of the countries where it is most needed: the least developed countries (LDCs), the other low-income countries (OLICs) and the lower middle-income countries (LMICs). In some of the stronger LMICs, nonetheless, there have been sharp falls in ODA. Yet as these
countries have strengthened their ability to sustain their own development, these drops almost always have been marginal in relation to the size of their economies.
In parallel, both donors and recipient countries have made considerable efforts to improve the quality and effectiveness of ODA; these measures are as important as – and perhaps more important than –the increases in the amount of assistance. Finally, there has been sharp growth in ODA in the health and basic education sectors.
The results are evident in several key development targets, among them, the annual number of infant and child deaths has finally fallen below 10 million.
Yet despite this progress, huge challenges remain. Gross inequality is still prevalent in the world and global problems – such as climate change – continue to grow. Donors still have to make a serious effort improve the amount and the effectiveness of their aid if they are to deliver on their promises.
a scorecard for results: 12 measures of progress
In his last Development Co-operation Report as Chair of the Development Assistance Committee, Richard Manning reflects on the evolution of ODA during his term of office (June 2003-January 2008)1 reviewing progress on a dozen measures proposed in 2003 to “score” the results of development co-operation.
1. The assessments in this Report are based on comparison with a baseline survey that assessed the state of affairs in 2002.

www.sourceoecd.org/developmentreport
The measures of progress for evaluating the success of development co-operation can be grouped into six areas: aid volume, aid allocation, fragile situations, aid effectiveness, efforts of recipient countries and achieving results. Of these measures, ten are essentially within the control of donors. The following analysis shows where the proposed targets have been achieved (three measures), where – despite signs of progress – the evidence is not yet clear enough to claim success (four measures), and where we have been unsuccessful (three measures).
The final indicator describes progress toward achieving the Millennium Goals. While there has been impressive global progress in reducing absolute poverty, there have been less notable advances in reaching other goals. In particular, there are still huge challenges to be met in sub-Saharan Africa and the Pacific.
Measure 1: Donors are delivering at least USD 75 billion in net disbursements (at 2002 prices and exchange rates). ACHIEVED
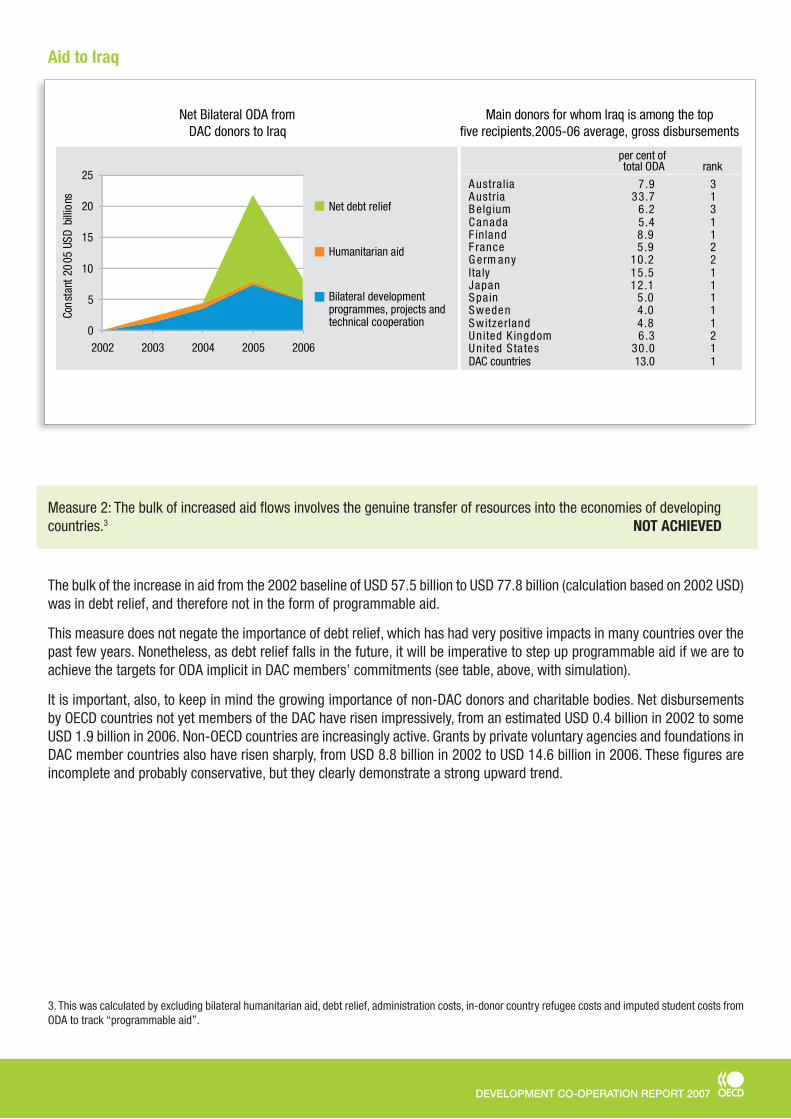
The target for 2006 for this measure was strictly quantitative: how much aid will donors deliver? While this headline commitment has been fulfilled by disbursements totalling USD 77.8 billion, it is important to keep in mind that if we exclude aid to Iraq,2 the amount is only USD 70.7 billion. Even so, this is an impressive result when one considers that ODA had oscillated around the USD 50 billion mark for many years.
2. In 2005/06 Iraq accounted for nearly USD 7 billion of ODA a year, even excluding debt relief. A large proportion of this aid was “additional”, in the sense that it would not have been given for other purposes. For this reason, several of the indicators are evaluated with and without aid to Iraq. Although the United States was by far the largest provider of ODA to Iraq over the period 2005-06, for no fewer than 9 members of the DAC Iraq was the largest recipient of ODA during this period and for 14 members it was among the top 3 recipients.
DAC members’ net ODA 1990-2006 and DAC Secretariat simulations of net ODA for 2007-2010
aid volume
DEVELOPMENT CO-OPERATION REPORT 2007
0
5
10
15
20
25
2002 2003 2004 2005 2006
Cons
tant
20
05 U
SD b
illio
ns
Net Bilateral ODA fromDAC donors to Iraq
Net debt relief
Humanitarian aid
Bilateral development programmes, projects and technical co - operation
Main donors for whom Iraq is among the topfive recipients 2005-06 average, gross disbursements
per cent of total ODA rank
Australia 7.9 3Austria 33.7 1Belg ium 6.2 3C anada 5.4 1F inland 8.9 1F rance 5.9 2G erm any 10.2 2Ita ly 15.5 1Japan 12.1 1Spain 5.0 1Sweden 4.0 1Switzerland 4.8 1U nited K ingdom 6.3 2U nited States 30.0 1DAC countries 13.0 1
Aid to Iraq
Measure 2: The bulk of increased aid flows involves the genuine transfer of resources into the economies of developing countries.3 NOT ACHIEVED
The bulk of the increase in aid from the 2002 baseline of USD 57.5 billion to USD 77.8 billion (calculation based on 2002 USD) was in debt relief, and therefore not in the form of programmable aid.
This measure does not negate the importance of debt relief, which has had very positive impacts in many countries over the past few years. Nonetheless, as debt relief falls in the future, it will be imperative to step up programmable aid if we are to achieve the targets for ODA implicit in DAC members’ commitments (see table, above, with simulation).
It is important, also, to keep in mind the growing importance of non-DAC donors and charitable bodies. Net disbursements by OECD countries not yet members of the DAC have risen impressively, from an estimated USD 0.4 billion in 2002 to some USD 1.9 billion in 2006. Non-OECD countries are increasingly active. Grants by private voluntary agencies and foundations in DAC member countries also have risen sharply, from USD 8.8 billion in 2002 to USD 14.6 billion in 2006. These figures are incomplete and probably conservative, but they clearly demonstrate a strong upward trend.
3. This was calculated by excluding bilateral humanitarian aid, debt relief, administration costs, in-donor country refugee costs and imputed student costs from ODA to track “programmable aid”.
.

www.sourceoecd.org/developmentreport
aid allocation
Measure 3: The proportion of ODA going to least-developed countries (LDCs) and other low-income countries (OLICs) has risen significantly. ACHIEVED
This measure scores high. Excluding Iraq, the proportion of ODA going to the poorest countries – the LDCs and OLICs – rose from 40% of net bilateral ODA in 2002 to 46% in 2006; for multilateral ODA, the increase was from 47% to 49%. Two exceptional factors in 2006 account for this increase: a large rise in ODA to Iraq (excluding Iraq, the figures are 52% for bilateral aid and 54% for total ODA), and the cancellation of large amounts of Nigeria’s commercial debt. Excluding this last factor, the proportion of net bilateral ODA going to LDCs and OLICs declined marginally, from 40% in 2002 to 39% in 2006. Nonetheless, the absolute increase is still important, as the next chart shows.the absolute increase is still important, as the next chart shows.
Total net ODA to LDCs and OLICs
0
10
20
30
40
50
60
2002 2003 2004 2005 2006
Cons
tant
20
05 U
SD b
illio
ns
Net debt forgiveness grants
Humanitarian aid
Development projects, programmes and technical co-operation
Net ODA flows by type
0
10
20
30
40
50
60
70
80
90
2002 2006 2002 (excludingIraq)
2006(excludingIraq)
Con
stan
t 2
00
2 U
SD
bill
ions
Other (*)
Debt forgiveness grants
Humanitarian aid
Programmable aid
(*) Comprises costs for administration, in-donor country refugees and imputed student costs.

DEVELOPMENT CO-OPERATION REPORT 2007
Sub-Saharan Africa South and Central Asia
Other Asia and Oceania Middle East and North Africa
Latin America and Caribbean Europe
0 5
10 15 20 25 30 35 40 45
2002 2003 2004 2005 2006
Cons
tant
20
05 U
SD b
illio
ns
Net debt forgiveness grants
Humanitarian aid
Development projects,programmes and technicalco-operation
0
2
4
6
8
10
12
2002 2003 2004 2005 2006
Cons
tant
20
05 U
SD b
illio
ns
0 1 2 3 4 5 6 7 8 9
10
2002 2003 2004 2005 2006
Cons
tant
20
05 U
SD b
illio
ns
0
5
10
15
20
25
30
2002 2003 2004 2005 2006
Cons
tant
20
05 U
SD b
illio
ns
0 1 2 3 4 5 6 7 8 9
2002 2003 2004 2005 2006
Cons
tant
20
05 U
SD b
illio
ns
0
1
2
3
4
5
6
7
2002 2003 2004 2005 2006
Cons
tant
20
05 U
SD b
illio
ns
Net debt forgiveness grants
Humanitarian aid
Development projects,programmes and technicalco-operation
Net debt forgiveness grants
Humanitarian aid
Development projects,programmes and technicalco-operation
Net debt forgiveness grants
Humanitarian aid
Development projects,programmes and technicalco-operation
Net debt forgiveness grants
Humanitarian aid
Development projects,programmes and technicalco-operation
Net debt forgiveness grants
Humanitarian aid
Development projects,programmes and technicalco-operation
Total net ODA by region
If we look at these figures at the regional level, we can see that there is a marked increase in Africa’s share of programmable aid, although there is still much to do to meet the pledge made at the G8 summit in 2007 to double ODA to Africa by 2010 (as compared to 2004 levels).
Measure 4: A higher share of ODA is going to countries with relatively large numbers of poor people and good performance. NOT ACHIEVED
Do donors reward good performance? If we are to judge by the proportion of net bilateral ODA going to the countries in the two upper quintiles of the World Bank’s IDA Resource Allocation Index (IRAI) – all of which are LDCs or OLICs – the answer is “no”. The proportion allocated to this group declined from 19% in 2002 to 17% in 2006. While there was a substantial increase in real terms, since ODA itself has increased, there was still a fall in the relative weight of funding allocated to good performers by bilateral donors. This calculation excludes Iraq. If we also exclude Nigeria, the proportion of net bilateral ODA going to the good performers would be virtually static (19% in 2002 and 20% in 2006).

www.sourceoecd.org/developmentreport
Measure 5: Emergency and humanitarian relief are on a downward trend, at least as a proportion of total aid. NOT ACHIEVED
This measure was based on the hope that the demand for emergency and humanitarian aid, in particular in response to man-made emergencies, would decrease. In practice, emergency and humanitarian assistance has risen slightly – from 5% of total ODA in 2002 to 6% in 2006. In real terms, the absolute figure rose by a substantial 90% between 2002 and 2006, probably reflecting the huge relief efforts made after the Indian Ocean tsunami of late 2004 and the Pakistan earthquake of late 2005.
fragile situations
Measure 6: Well thought-through interventions are being made in poor performing countries where effective transfers are possible. NOT CLEAR
In the future, a steadily rising proportion of the extremely poor and those in the worst social and environmental conditions are likely to be living in fragile situations of one kind or another. In these situations – for example in states emerging from conflict, those burdened by some form of “resource curse”, and states whose policies are not equitable – it is very important for donors to make well-considered interventions, taking into account human rights violations as well as violence against the vulnerable, notably women and girls.
While there is some evidence of progress at the field level – fuelled by good conceptual work, including by the DAC’s Fragile States Group – clearly, much more needs to be done to maximise the effectiveness of donor interventions in these challenging situations. This work must involve real progress in donor co-ordination and in helping to build competent and accountable local institutions.
aid effectiveness
Measure 7: A higher proportion of aid is untied.4 ACHIEVED
Progress has been made in untying aid – up to a point. A number of DAC members have either fully untied their aid (e.g. Australia, Ireland, Norway and the United Kingdom) or almost untied their bilateral aid programmes (e.g. Belgium, Denmark, Finland, Sweden and Switzerland).5 The European Community has also adopted regulations to untie aid, expertise (e.g. technical co-operation) and food aid financed from its budget. The US Millennium Challenge Corporation (MCC) also provides its aid in untied form.
The proportion of financial aid from DAC members recorded as untied increased from 42.5% in 2002 to 53.0% in 2006 and the proportion reported as tied fell from 7.3% to 3%. Yet the tying status of a large share of financial aid is not reported, notably that of the United States,6 making it impossible to say if the share of untied financial aid has really increased. The latest figures also suggest that a large proportion of contracts financed from untied aid are still going to donor country suppliers.
Measure 8: Much more aid is clearly aligned to local priorities, programmes and systems, and figures in recipients’ budgets. NOT CLEAR
4. Not conditioned to purchasing services from the country supplying the aid.
5. These countries contribute to various multilateral programmes which are substantially (but not fully) untied, such as the soft funds of the Regional Development Banks and the European Development Fund.
6. Although the United States does not report to the DAC statistical reporting systems, it does report to the Bulletin Board, which shows steady increases in untied reporting.

DEVELOPMENT CO-OPERATION REPORT 2007
This measure requires action by both donors and recipient countries. One measure of donor progress in aligning aid to recipient policies and systems is the proportion of aid to governments that is recorded in the national budget. While progress was made on many fronts, a survey in 2006 showed that performance varied greatly both among DAC members – from 24% to 87% – and among recipient countries – roughly 32% to 99%.
Measure 9: Indicators of harmonisation show a quantum leap from the 2002/2003 baseline. NOT CLEAR
Harmonisation refers to how donors work together to minimise unnecessary costs, to both recipients and themselves. One useful indicator of harmonisation is the proportion of analytical work that is done jointly by them. Among the DAC members represented in the chart below, the proportion of harmonised work varied from 12% to 80%.
Paris Declaration baseline survey 2006: Proportion of analytical work done jointly by donors
90%
80%
70%
60%
50%
40%
30%
20%
10%
0%
Note: Each vertical bar represents a donor that has reported data for at least 10 recipient countries.
Measure 10: Expenditure on technical co-operation is demonstrably more efficient and more effective. (This includes more co-ordinated support, greater use of country systems and increased use of local or other “southern skills”.) NOT CLEAR
One problem in assessing this measure – for both donors and recipients – is the variety of different types of assistance that is reported under the generic heading of “technical co-operation”. The DAC’s Working Party on Statistics is striving to make it easier to understand the various types of activity that are behind the figures. For the moment, however, progress on this front is not clear.

www.sourceoecd.org/developmentreport
efforts of recipient countries
Measure 11: Recipients expand the provision of services and raise domestic revenue by several percentage points to avoid unhealthy dependence on foreign aid. ACHIEVED
Aid is only a complement to the development efforts of individual countries. Public expenditure on health and education, and current revenue (both as percentages of GNP) are good indicators of progress toward building human capacity and becoming self-dependent. Gaps in international data on developing countries’ revenue and their education expenditure make it difficult to assess this measure accurately. Judging from the figures that are available, there seems to be progress in raising revenue (from around 15% in 2000 to 18% in 2004). Developing countries on the DAC List of ODA Recipients are also on average increasing their spending in health and education as a percentage of GNP, but only modestly.
Progress in raising revenue is particularly encouraging, however, in sub-Saharan Africa, where it has outpaced the rise in ODA over the period from 2001-2006. This is a striking tribute to greater African self-reliance and an important factor in addressing concerns about aid dependency.
Trends in government revenue and ODA disbursements in sub-Saharan Africa (USD billion)
0.0
50.0
100.0
150.0
200.0
2001
2002
2003
2004
2005
G overnm ent revenue
O D A d isbursem ents
2006
Source: Using data from IMF, Regional Economic Outlook: Sub-Saharan Africa, October 2007 and OECD-DAC database.
achieving results
Measure 12: Increased and more effective support is beginning to translate into more progress toward the harder-to-reach Millennium Development Goals (MDGs), not least in sub-Saharan Africa. PROGRESS, BUT STILL SHORT OF WHAT IS NEEDED
In many ways, this is the most important measure. Yet judging progress on it depends on three things:
Sufficiently reliable basic statistical information. This is still a problem for many indicators (for instance maternal mortality and HIV/AIDS). Nonetheless, data are now being compiled more effectively, and the comprehensiveness and reliability of some key indicators are improving. For example, the latest estimates on poverty draw on over 500 surveys of households from 100 developing countries, which represent 93% of the population of the developinghouseholds from 100 developing countries, which represent 93% of the population of the developing from 100 developing countries, which represent 93% of the population of the developing world.
•

DEVELOPMENT CO-OPERATION REPORT 2007
A clear sense of the rate of progress over time. Too often, commentary assumes that we are at some sort of “midpoint” between the base year of the MDGs and their achievement. In fact, the base year for the Goals is 1990 and most of them reflect the conclusions of UN summit meetings in the early 1990s. They were first packaged into a set of key goals by the DAC in 1996, and then in 2000 at the Millennium Summit. In most cases, we are therefore looking at performance over the first 15 years (since most figures become available only with a time lag) of a 25-year period.
Some plausible link between aid and its results. It is important to avoid giving exclusive credit to aid for results that stem largely from local efforts. It is more realistic to look at whether an aid intervention may be one of the probable causes of observed change, although this still requires a clear logical argument about whether the change would have occurred with the support of aid.
Reaching the poverty goal: The Millennium Development Goals Report 2007 shows that at the global level, if present trends continue the income poverty goal will be reached well before 2015. Early reports indicated that the number of people with incomes below USD 1 a day had at last fallen below 1 billion; these have been put in question, however, by recent revisions of the economic data, which seem to indicate that this barrier may not have been broken yet.
Progress on other fronts: Despite encouraging progress on the poverty goal, it is unlikely that we will achieve the remainder of the Goals by 2015 at the global level or in many regions, and we certainly will not in every country. Sub-Saharan Africa still stands out (with the Pacific) as the region where least progress is visible.
Nonetheless, there is evidence of recent rapid progress in many sectors and in many countries, including in Africa. For example:
The number of extremely poor people in sub-Saharan Africa has leveled off, and its poverty rate has declined by nearly six percentage points since 2000.
While enrolment in primary education grew from 80% in 1991 to 88% in 2005, most of the progress made in developing countries has taken place since 1999. For example, primary school enrolment increased by 36% in sub-Saharan Africa between 1999 and 2005. This shows an encouraging upward trend in these countries.
Globally, deaths from measles fell from 757,000 in 2000 to 242,000 in 2006, a drop of 68%. In Africa, the decline was nearly 91% over the same period, which is why we have seen marked declines in recent years in infant and child mortality in some sub-Saharan African countries.
In the so-called “transition countries” (south-east Europe and the Commonwealth of Independent States), the declines in poverty since the turn of the century have been at least as steep as the increases many of them experienced in the 1990s.
Can international aid claim to have been a contributing factor to this progress? Clearly, it is far from the only one. Increases in commercial flows and remittances, growth driven by rising prices of many commodities and a favourable international economic environment, particularly from 2002 onward, have all certainly contributed. Furthermore, in many of the “transition countries” ODA has probably been too small to be more than a very marginal factor.
Yet the sharp rise in ODA for health and (to a lesser extent) for basic education in many poor countries has surely made some contribution to results in these areas. For many countries in Africa, the commodity boom has helped to drive recent growth, and poverty is, at last, falling at a significant rate. Yet it seems unlikely that this reduction in poverty would have been possible without the multiple effects – over many years – of aid-supported policy reform, improvement in governance and investment. Proper research and analysis of ever-changing data is, as always, necessary for any definitive conclusion.
•
•
•
•
•
•
can aid take the credit?

www.sourceoecd.org/developmentreport
THE WAY FORWARD: AID FOR TRADE
In today’s globalised world, there is clear evidence that trade is a powerful engine for economic growth, which, in turn, is essential for poverty reduction. Nonetheless, many developing countries lack the basic capacity – in terms of policies, institutions or infrastructure – to take advantage of trade opportunities and a more interconnected world economy. There is, therefore, a need to ensure that multilateral trade liberalisation has an effective impact on pro-poor growth.
Almost two years after the 2005 Hong Kong WTO Ministerial Declaration, Aid for Trade has taken on growing importance in most donors’ programmes. This enhanced profile is likely to be maintained – and possibly even expanded – over the medium term. Most donors now have institutional remits, dedicated structures, professional teams and operational guidance specifically focused on delivering “more” and “better” aid for trade, reflecting the principles of the Paris Declaration on Aid Effectiveness.
learning from experience: twelve lessons from dac peer reviews
In 2006, the 23 members of the DAC disbursed over USD 100 billion of public funds for development. This represents an estimated 90% of total ODA spent worldwide. How effectively do they manage these funds?
DAC peer reviews are an important source of insight on the effectiveness of aid and on how bilateral development co-operation systems are managed. They look carefully at the aid practices of the country under review with a view to improving their efficiency and effectiveness.
DAC member governments continue to assign growing political priority to development co-operation. In parallel, they are embracing development co-operation concepts that centre more and more on the quality and impact of aid delivery in recipient countries. Peer reviews help DAC member countries to foster common understanding while providing regular feedback on innovations and achievements in support of more effective aid management.
Historically, the peer review process has brought many issues to the attention of the DAC. These have been synthesized into a series of twelve lessons – learned or reconfirmed – on how aid can be effectively managed to produce development results. These lessons can be grouped into three broad categories: strategy, organisational management and management of delivery.
Lesson 1. Finding the appropriate legal and political foundationHave a clear, top-level statement of the purpose of development co-operation, whether in legislation or another form, that has wide ownership and can remain relevant for a sufficient period.
Development co-operation generally operates in a complex political environment. Recent DAC peer reviews demonstrate the importance of obtaining clarity at the highest political level on the overall aim of the national aid programme. They also underline the value of anchoring development policy unambiguously in legislation, or at least having a policy statement that sets clear medium-term objectives. If not regularly updated, however, legislation can restrain system efficiency in the fast-evolving world of development co-operation, so too much detail can be counter-productive.
Lesson 2. Managing competing national interestsAvoid letting short-term pressures jeopardise the long-term common interest in effective development.
The DAC recognises that development policy does not operate in a vacuum and that all nations have widespread interests (such as trade, political relationships or security) that respond to national priority concerns. It is important to be clear on how development co-operation can best function within this context. In the long term, all DAC members (and indeed all countries)
strategy

DEVELOPMENT CO-OPERATION REPORT 2007
have a common interest in developing countries achieving sustainable and broad based development. For this reason, while national interests are legitimate, if they result in ineffective aid they will eventually be self-defeating.
Lesson 3. Achieving greater policy coherence for development Set a clear mandate and establish mechanisms to ensure that policies are assessed for their impact on poor countries.
Maintaining development policy at the heart of a national vision requires high-level political commitment. DAC members commonly agree that donors need to give greater attention to ensuring that their policies are coherent with the wider objectives of development. Yet peer peviews have demonstrated that it is often challenging to balance this concern with national policies, which may either promote or work against the needs of poor countries (in fields such as trade, migration or environment for example). While it is unrealistic to suppose that the interests of poor countries will always be given the greatest weight, national policy formulation should take fully into account the potential impact of policy decisions on the development of poor countries. Strategic alliances among national and international stakeholders can also help to promote policy coherence in priority development areas.
Lesson 4. Public awarenessInvest in delivering, measuring and communicating results of aid-financed activity.
Public awareness of, and support for, development co operation is fundamental. Peer reviews demonstrate that strong public support is the best guarantee of political and legislative support for strong and dynamic national development programmes.
Obtaining public engagement and public support is always a challenge, and it requires active and targeted public education and awareness building. The public usually recognises, for example, that the degree of poverty and inequality in the world is both a humanitarian issue and a risk to all our futures. Yet there is widespread scepticism about whether official aid is effective in tackling it and whether scarce public funds should be devoted on more than a token scale to purposes outside the country of origin. Promotion of public debates on aid effectiveness and reporting on the impact of aid in improving the lives of poor people can help to generate support.
Recent peer reviews have noted that organisational reforms seem increasingly linked to aid effectiveness.
Lesson 5. Identifying a leadership structure that works Task a sufficiently senior and publicly accountable figure with clear responsibility at the political level for the delivery of effective development co-operation.
DAC members have diverse governmental structures, which tend to reflect the political priority attributed to development. The national aid systems with the highest political priority tend to be led by a minister or deputy minister with a strong government position. The DAC favours systems that best strengthen delivery of effective support for development at the political level.
Lesson 6. Dealing with institutional dispersionRationalise bilateral aid structures to facilitate coherent action at the country level.
It is difficult to attribute inherent superiority to any of the various structures DAC donors use to manage their aid and peer reviews show that effectiveness may vary considerably among countries that operate under superficially similar models. At the same time, each structure operates in a local context that is unique. Nonetheless, clarity of responsibility, accountability, professionalism and effective co-ordination are essential to the proper functioning of any system. Several DAC members have embarked on initiatives to rationalise structures both at headquarters and in the field.
Lesson 7. Managing contributions to the multilateral institutionsPromote greater coherence among those responsible for different aspects of multilateral aid.
A recurring theme for many of the peer reviews is the need for stronger strategic and operational connections between the bilateral and multilateral sectors of the national aid system. DAC members contribute a fairly large percentage of their na-
organisational management

www.sourceoecd.org/developmentreport
tional ODA to multilateral institutions, particularly to the European Community, the World Bank and the UN family. In 2005, the DAC average was 23% (30% without debt relief), although the range was from 9% to 55% (10% to 83% without debt relief).
Different actors tend to manage these different types of contributions, as well as the relationships with the respective governments and agencies. They sometimes try to co-ordinate efforts, but are not always effective in doing so. DAC peer reviews increasingly call for improved linking of the various facets of the national system to promote more efficient world wide aid architecture, as well as more effective national and international aid impacts in the field.
Lesson 8. Decentralising management to the fieldDecentralisation of responsibility to the field level can be beneficial, but it needs high quality, streamlined supporting systems.
Almost all DAC members have country-level strategies with linkages to partner-country planning. A clear and strategic donor mandate at the country level provides a reliable basis for delegated decision making. At the same time, a decentralised approach permits the donor to be more adaptive and responsive to locally expressed needs and to co-ordinate more readily with other partners. Most members have increased the decentralisation of management authority to their field offices, with special attention being given to field delivery and poverty impact while respecting the need for local ownership.
Common challenges include higher field operational costs and the need for coherent and co-ordinated communications between headquarters and the field, as well as with partners at all levels. To avoid overlap of specialists at the country level, donors are also exploring joint strategic, implementation and evaluation approaches that will enable them to implement a better division of labour.
Lesson 9. Managing the scaling up of development aidRadical reforms in aid delivery will be vital as donors are forced to deliver more aid per head of agency staff, while increasing the effectiveness of this aid.
To meet the commitments they agreed to when they signed the Paris Declaration, donors face significant operational challenges. Although many peer reviews have underscored the need for well thought-out scaling up plans at the national level, most DAC members do not appear to have developed such plans. At the global level, there is a need for advance information on where agencies are planning to spend their increased budgets. Projections of future flows will help identify resource gaps as well as opportunities for scaling up in individual countries.
With a growing trend of downsizing staff in national government departments, a current preoccupation for most major donors is how to do “more with less”. National organisations will need to change their ways of working if they are to handle substantially greater resources and still use them effectively. Across DAC members, the scaling up debate appears to have stimulated a growing spirit of innovation.
Lesson 10. Maintaining a focused approach according to countries and sectorsMost DAC members should focus their assistance on fewer countries, fewer sectors and, in particular, fewer activities.
DAC members continue to put in place each year an extraordinary number of activities. This generates high transaction costs for aid agencies and governments alike. In general, DAC members understand and agree on the advantages of using a more focused approach, limiting the range of countries and sectors in which they work while paying attention to the comparative advantage of each donor. Putting this into practice is, however, a challenge. Many donors find that domestic interests work against rationalisation.
In its peer reviews, the DAC regularly encourages members to increase the focus of their bilateral geographic and sector contributions and to work collaboratively within broader donor frameworks to enhance complementarity.
management of delivery

DEVELOPMENT CO-OPERATION REPORT 2007
Lesson 11. Performance-based management, evaluation and quality controlDevelop a stronger culture of managing for results and align incentives accordingly, but in ways that promote, not weaken, local structures of accountability.
Peer reviews show that most donors are under increasing pressure from parliaments, government and civil society to improve efficiency and achieve greater aid effectiveness and accountability. Several DAC members have made notable advances in putting in place evaluation frameworks. More broadly, development agency accountability and reporting of results to the public, parliament and the media are fundamental.
Many DAC members are exploring new, independent evaluation and monitoring structures that will contribute to the broader evolution of learning and knowledge management in the development co-operation system. A common element shared by many of these approaches is the involvement of the recipient countries in the evaluation process, which will have the added advantage of building more self-sustaining national programmes.
Lesson 12. Human resource management prioritiesSecuring and developing well-qualified, well-motivated local and expatriate staff is essential for any agency to function effectively. The good news is that quality agencies attract quality staff.
Peer reviews often emphasise the critical importance of having appropriate numbers of skilled and experienced personnel for effective development co-operation. At the same time, they have identified a variety of common human resource management issues and constraints: downsizing of government personnel, inadequate staffing levels, retirement of significant numbers of senior officials, changing skill needs and rapid turnover in staff.
Peer reviews regularly offer advice on how to manage these issues. Recommendations include putting in place advance development resource planning to organise change over time and maintaining a reasonable level of core staff, recruited with the expectation that they will spend a large portion of their career working on development issues.
Donors recognise that using local expertise in field operations has much to offer. Local professional staff, with their cultural knowledge, technical skills and language abilities, can be vital partners in the design and implementation of operations. They also provide corporate memory and continuity against a background of regular expatriate staff turnover. The use of local expertise needs to be considered with care, however, so as not to deprive the local labour market of quality professionals, a particular concern in small countries with limited qualified staff.
increasing aid effectiveness: lessons from the health sector
In the health sector, several principles set out in the Paris Declaration on Aid Effectiveness have been successfully applied to promote increases in aid effectiveness and genuine scaling up. This provides a point of reference for tracking progress on the implementation of the Paris Declaration in the lead up to the third High Level Forum (HLF) on Aid Effectiveness, which will be held in Accra, Ghana in September 2008.
Since the Paris Declaration was endorsed in March 2005, many initiatives have worked to translate the five pillars of the Paris agenda (ownership, alignment, harmonisation, managing for development results and mutual accountability) into reality on the ground. These initiatives offer useful lessons on how to “put Paris into practice” and illustrate how better use of aid leads to quicker and more sustainable development impact in countries. This, in turn, helps to gain international support for more, and better, aid.
The health sector offers excellent examples of progress. Growing challenges in this sector have made health a major concern for many governments and brought many new actors on board. Between 1999 and 2005, development assistance for health increased from USD 6 billion to 13.4 billion. At the same time, serious bottlenecks that were blocking the achievement of the health MDGs became evident. This encouraged donors and partner countries to change their ways of doing business, and using the Paris Declaration as a framework, they were able to reach important agreements:
www.sourceoecd.org/developmentreport
There is a need for more predictable and sustainable financing for health.
This funding must be supported by increased co-ordination and harmonisation of aid within country-owned and country-led health plans.
The implementation of these plans must be based on mutual accountability mechanisms.
These agreements have helped to put in place many of the building blocks for improved aid effectiveness. Among these, 17 best-practice principles have been adopted to improve country-level alignment, and innovative funding mechanisms have been designed to make health aid more predictable and sustainable.
These developments have generated progress on many fronts. Investment in strengthening health systems has grown, with increasing alignment with national priories. Donors are harmonising and co-ordinating their contributions more effectively, and tracking results more carefully. They are supporting mutual accountability with effective monitoring and evaluation.
All of this has resulted in notable improvements in areas such as child mortality, control of malaria and tuberculosis, and HIV/AIDS treatment. Even so, to produce still-needed results on the ground improvements must continue:
Greater effort is required to make aid more efficient in improving the health status of the poorest.
Rapid and large-scale progress is needed to address key challenges in areas such as maternal mortality, child mortality, access to safe water and climate change.
More effort is needed to reduce the fragmentation of donor aid, avoid the distorting effects of earmarked funding, reduce transaction costs, and develop results-based country-led health strategies.
Recent initiatives in global health have been focused on the countries or regions that are most in need. It is important that these pilots be effectively monitored so that lessons can be learned and shared.
Countries must be more strongly involved in the design and implementation of initiatives, including the selection of pilot countries, and civil society must be more fully engaged in the discussion of aid effectiveness in health.
Countries in fragile situations receive, on average, 40% less aid per capita than other countries. It is important that new initiatives in health face up to this challenge and pay special attention to their needs.
Lessons from implementing the Paris Declaration in the health sector are helping us to move forward with greater impetus toward collective goals. At the same time, careful monitoring of progress is allowing us to see what is working, and to take action to improve what is not.
Some have expressed the view that more harmonised and aligned aid may weaken attention to vital cross-cutting areas such as human rights, gender equality and environmental sustainability, which are fundamental to achieving good development results. In fact, these dimensions of development can be effectively promoted through the partnership commitments and principles of the Paris Declaration (the five “pillars” mentioned at the beginning of this section). For example, helping to build real ownership of policies at the country level (with “ownership” being seen as the product of genuinely inclusive processes) and delivering aid more effectively, both to the government sector and to civil society actors, promotes more all-encompassing and equitable conditions. Managing for results provides ready entry points for integrating human rights, gender equality and sustainability. Strengthening domestic accountability through engagement with civil society is essential to democratic ownership, as is support for representative government, independent judiciaries and autonomous media. Equally, donors themselves need to be accountable for their undertakings and commitments, as embodied by the principle of mutual accountability, one of the key elements of the Paris Declaration.
•
•
•
•
•
•
•
•
•

DEVELOPMENT CO-OPERATION REPORT 2007
The Development Co-operation Report 2007 seeks to contribute to these processes by informing the public – in the transparent manner that characterises the DAC – on the progress of development co-operation. It includes a chapter on the performance of the individual donors that make up the DAC in 2007, as well as a section that describes the work undertaken by DAC during the year through its working parties, networks and its operational arm, the Development Co-operation Directorate.
The Statistical Annex to this 2007 report provides definitive, up-to-date information on the latest trends in international aid, from both DAC members and other donors. This data can help to measure the advances in development assistance – and highlight needs for continued improvement – with a view to making it increasingly effective in tackling the enormous challenges to equitable and sustainable development that we still face.

DEVELOPMENT CO-OPERATION REPORT 2007