development challenges for malaysia at middle …
TRANSCRIPT

DEVELOPMENT CHALLENGES FOR MALAYSIA AT MIDDLE INCOMEThe Role of Future Human Capital Development
MINISTRY OF HUMAN RESOURCES 23rd Oct 2018INTAN, Bukit Kiara
Dato’ Amir bin OmarSecretary General
INTAN HUMAN RESOURCES INSIGHTS SERIES 2/2018

01 Background Economic Landscape – Middle Income
02 Human Capital Development Policies Framework & Labour Market Issues
03 Future skills Future Outlook of the Job Market
04 Human resources Policy ReformsStrategic Area
Content
2
3
01 Background Economic landscape – middle income
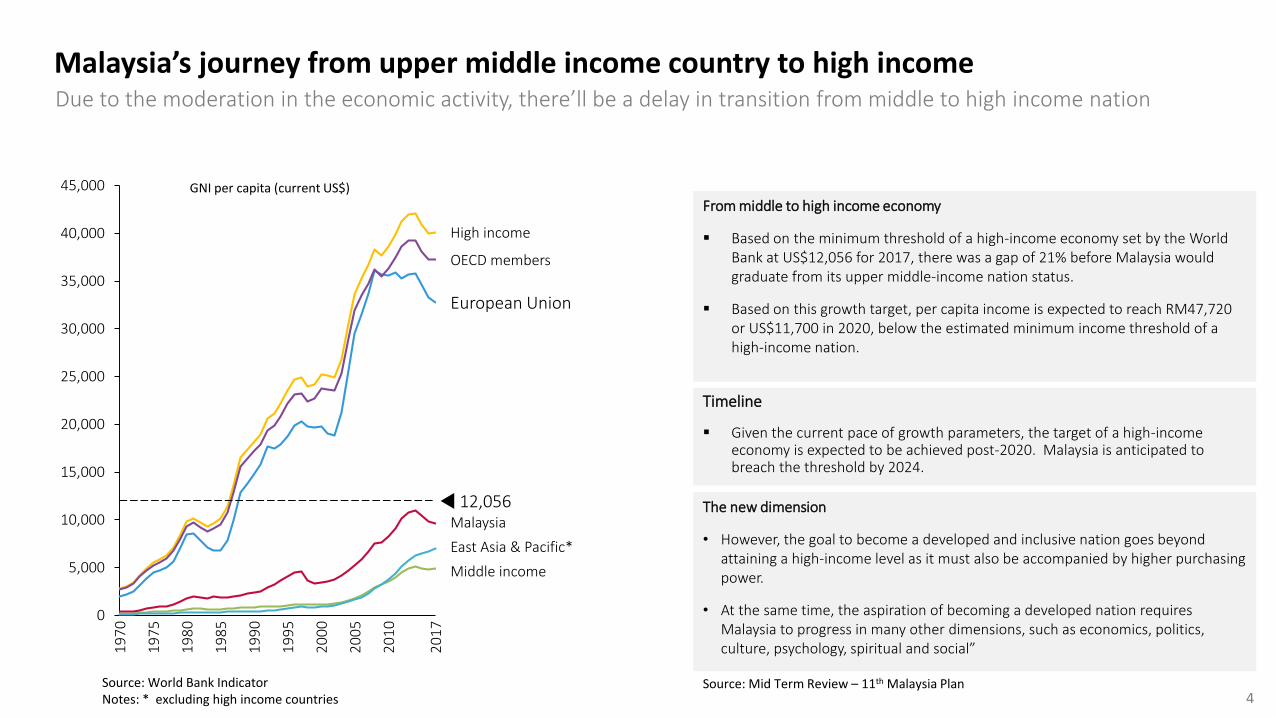
Malaysia’s journey from upper middle income country to high income
4
Due to the moderation in the economic activity, there’ll be a delay in transition from middle to high income nation
Source: Mid Term Review – 11th Malaysia Plan
0
5,000
10,000
15,000
20,000
25,000
30,000
35,000
40,000
45,000
19
95
19
70
19
75
19
90
19
85
19
80
20
10
20
00
20
05
East Asia & Pacific*
20
17
European Union
High income
Middle income
Malaysia
OECD members
12,056
From middle to high income economy
Based on the minimum threshold of a high-income economy set by the World Bank at US$12,056 for 2017, there was a gap of 21% before Malaysia would graduate from its upper middle-income nation status.
Based on this growth target, per capita income is expected to reach RM47,720 or US$11,700 in 2020, below the estimated minimum income threshold of a high-income nation.
Timeline
Given the current pace of growth parameters, the target of a high-income economy is expected to be achieved post-2020. Malaysia is anticipated to breach the threshold by 2024.
The new dimension
• However, the goal to become a developed and inclusive nation goes beyond attaining a high-income level as it must also be accompanied by higher purchasing power.
• At the same time, the aspiration of becoming a developed nation requires Malaysia to progress in many other dimensions, such as economics, politics, culture, psychology, spiritual and social”
Source: World Bank IndicatorNotes: * excluding high income countries
GNI per capita (current US$)

The Malaysia economic performance and transformation…past achievements
1970 1975 1980 1985 1990 1995 2000 2005 2010 2015
0
5
15
10
-5
20
%
Real GDP (% p.a)
CPI (% p.a)
Unemployment rate (%)
Transformed from an agro-based to manufacturing and services-based economy
Diversification of export products from agricultural to manufactured goods
6.2% Real GDP Growth
3.7% CPI
Full employment Unemployment below 4% since 1992
Average 1971-2015 (% per annum)
Sustainable real GDP growth with moderate inflation and full employment
GDP (RM) 1970 and 2015
2015
RM 1.1Trillion
1970
RM 71.1billion
US$23.1bnUS$272.1bn
4%
+25
+14-23
Construction
9% 9% 9%
23%
Services
54%
Agriculture
29%
2%
32%
25%
MiningManufacturing
2015
1970
Oil &
Gas
5%
Palm O
il
4%
10%
Tin
Man
ufactu
res
Forestry
16%
33%
Ru
bb
er
12%
20%
Oth
ers
1%
9%
0%
6%
1%
80%
3%
36% high
technology
manufactures
53% agri &
mining commodities
( In 2010 prices)
38% of GDP (1970)
68% of GDP
(2015)
( In current prices) 5

Demand component
Changes (% per annum)
Original target
Actual Revised target
2016-2020
2016-2017
2018-2020
2016-2020
Real GDP 5.0-6.0 5.1 4.5-5.5 5.0
Consumption 5.9 5.8 5.8 5.8
Private 6.4 6.5 7.0 6.8
Public 3.7 3.2 0.3 1.4
Investment 7.2 4.4 3.7 4.0
Private 9.4 6.8 5.7 6.1
Public 2.7 -0.2 -0.8 -0.6
Net Export 0.4 -0.1 1.7 1.0
Export 2.1 5.3 2.2 3.4
Import 2.3 6.0 2.3 3.7
Inflation 2.8 2.9 2.0-3.0 2.0-3.0
4.5-5.5
6.2
4.8
5.4
0.7
1.5
5.0
6.3
4.5
4.3
0.1
2.0
5.1
5.9
5.2
7.1
1.5
0.8
Sebenar2016-2017
Sasaran2018-2020
RMKe-11 (Dipinda)2016-2020
Changes (2010 price),
% per annum
Agriculture
Mining and Quarrying
Construction
Manufacturing
Services
GDP
… driven by domestic demand, particularly private demand…
… growth led by manufacturing and services sector …
The sources of GDP growth for the next two years (2018-2020)
Source: Economic Planning Unit, MEA 6

In retrospect
economic growth
record in Asia
Absolute poverty
rate, 2014
real GDP growth
per annum
Average household
income 2014
Home ownership
2014
have access to potable water
access to electricity
Malaysia has recorded rapid socio-economic development …
6.2%
95.1% 97.6%
AMONG
THE BEST
76.1%RM6,1410.6%
…But many challenges remain
increase in per capita
income
Most competitive nation 2015
25X
Ranking
18/140
External • Low world price of commodities • Depreciating value of Ringgit • China –US trade war
Home ownership 2014
• Low productivity level• Slow economic structural
transformation • Lack of high-income job and skilled
workers • Declining comparative advantage in
export• Limited fiscal space• Half of the household remain in the
lower middle income group
Internal
~RM~
7
Source: 11MP, EPU 7

02 Human Capital Development Policies framework & labour market issues

Potential growth sectors outlined in various national policy
documents
2015 -
2020
2006 -
2020
2016 -
2020
ELEVENTH MALAYSIA PLANProductivity driven growth
MALAYSIA PRODUCTIVITY BLUEPRINT9 priority subsectors are identified
INDUSTRIAL MASTER PLAN12 key sectors identified to boost manufacturing
Other sector based policies & Strategies
HCD policy at the national level need
to be supported by sectoral study
ELEVENTH MALAYSIA PLAN, 2015-2020•Mismatch in the labour market due to lack of
skilled job creation
MALAYSIA EDUCATION BLUEPRINT, 2013-2025 •Employability remains a challenge due to
skills mismatch
MALAYSIA EDUCATION BLUEPRINT (HIGHER EDUCATION) 2015-2025 •Developing industry led curriculum to solve
skills mismatch
TALENT ROADMAP, 2020•Mismatch of competencies
between skills of local graduates and industry needs
Human
Capital
Policy
Mismatches Oversupply Shortages
Critical needs to strategically integrate the industrial policy with the human capital and skills development strategies for future development.
9

Quality supply of human capital, efficient labour market that is linked to the industry
Human Capital Development as one of the pillar
Labour market efficiency
• Strong pipeline of relevant
workforce into the labour market
• High proportion of skilled
workers~ through up-skilling
existing workforce
• Key growth sectors for Malaysia either
through up-grading within existing sectors
or promoting new sources of growth
• Drive further investments in key growth
sectors identified
• Labour market that able to match demand
and supply
• Effective management of alternative
sources of labour (i.e., expats, foreign
labour, women)
• Effective of current wage system
Sector-driven demand will be aligned with this
Initiative
Supply of human capital
(quality & quantity)Sector-driven demand
Human Capital Initiative
To improve workforce quality, the Human Capital Initiative will tackle supply-
side as well as labour market efficiency issues
Good support system
Wages Job
creation
Industries role in development
Productivity
• States• Regional corridors• Industries
Education and training institutions :• Schools; university; ILKA/ILKS
10

HCD and labour market collaborative framework
The ecosystem of HCD
Labour market
Supply
Macro
Micro
Disequilibrium / imbalances
Businesses IndustryEducation
Skilled workers
Real wages
Foreign workers
Demand
Labour Productivity
• Domestic market supply semi and high-skilled workers• Malaysia diaspora – skilled living the country Business
competitiveness -globally
• Global economic condition (i.e. exchange rate/oil price; trade etc.)
• FDI inflow
2.9%Low unemployment rate
Quantity & quality• TVET supply• Graduate
employability
Economy
• Require more industry insight on – skills requirements, jobs opening from industry/firm to reduce imbalances
• Regular industry engagement – towards systematic approach/ platform / mode of engagement
Migration
• Impact of FTA to labour mobilityImpact of the global economy to HCD
Identify Industry/Occupation Engage employers/industries Review skills demand/shortages
HCD supply and demand
• The ecosystem of HCD that integrates demand & supply addressing issues on labour market imbalances
• Greater participation and collaboration with the private sector in policy matters needed
Environmental scan approachCritical occupation approach
ILMIAValidation from industries of skills shortages
Compile independent firm based data/survey/research
11

Several issues impact supply-side of human capital
Pipeline of human capital supply
School leavers (population 17+)
TVET
University
Direct entry
54%
36%
10%
Skilled
Semi-skilled
Skilled
Semi-skilled
Low-skilled
Semi-skilled
Workforce
Workforce
Workforce
Issues
• Skills and qualification mismatches
• Employability
• Skills shortages• Youth unemployment • Job competition
• Low wage premium • Skills recognition • Public perception
NOSS
NEC
Need job
3.0
2.1
2.0
2000
2010
2020f
Total Fertility Rate –reached replacement level,
contribute to slower population growth
School aged children is expected to register
marginal growth (0.5% p.a. 2000-2020)
Source: 11th MP (EPU, MEA) estimation on percentage of school leavers entering labour market and further education (2013)DOSM – Total Fertility Rate
12

43%
19%
13%
14%
30%
39%
6%
12%
5%13%
0%
20%
40%
60%
80%
100%
20
06
20
04
20
01
20
11
3%
20
00
20
05
20
02
Degree
20
03
20
07
20
14
20
08
20
09
20
10
20
17
20
12
20
13
20
15
20
16
3%
Diploma
STPM or equivalent
SPM or equivalent
PT3/PMR/SRP/LCE/SRA or equivalent
UPSR/UPSRA or equivalent
The supply side is characterised by improvement in the profile of education among the workforce
13

-8
-6
-4
-2
0
2
4
6
8
10
12
14
20001975 201019951980 19901985 2005 2015
%
Real GDP (% p.a)
Unemployment rate (%)
High unemployment period Low unemployment period
-7.4
-1.1 -1.5
Asian Financial Crisis 1997/98
Drop in E&E production 2001
Global Financial Crisis 2008/09
Commodity shock 1985
7.8
5.6
6.0
2.9
0.5
3.1
5.1
Low unemployment over the years even during recessions - robust labour market at aggregate economy seems to be able matching the labour supply-demand
14

However, the labour market mismatches seems on the rise
1,135
3,238
0
500
1,000
1,500
2,000
2,500
3,000
3,500
200820042000 2012 2016
‘000 person
1,5431,714
2,439 +2,102
+7.2%
1,098
3,106
0
500
1,000
1,500
2,000
2,500
3,000
3,500
2000 2004 2008 2012 2016
‘000 person
1,4791,660
2,363 +2,008
+7.2%
140
669
0
100
200
300
400
500
600
700
800
20082000 2004 2012 2016
289
‘000 person
239
490+529
+11.0%
Graduate Labour Force Graduate Employed Qualification Mismatch
• Graduate labour force and employment growing rapidly keeping the graduate unemployment relatively low• However, evidence of trend among graduates employed in semi-skilled/low-skilled jobs – growing faster
over the years (double digit growth)
15
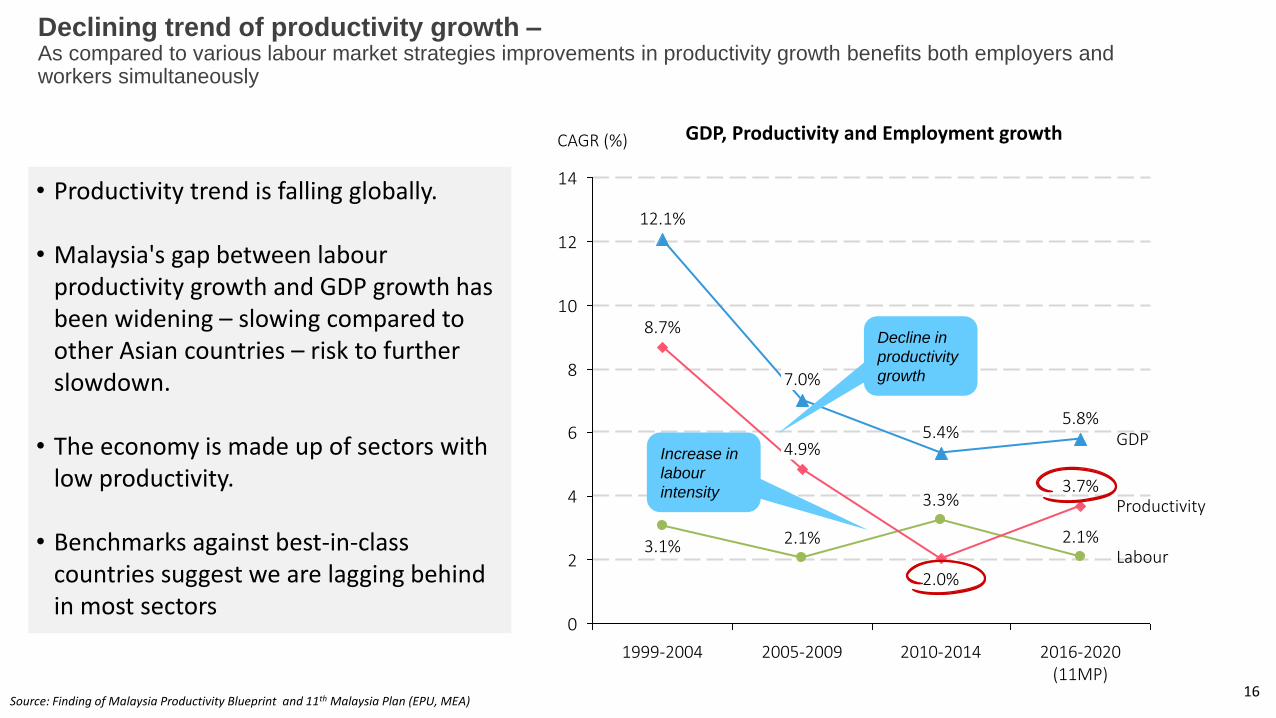
Declining trend of productivity growth –As compared to various labour market strategies improvements in productivity growth benefits both employers and workers simultaneously
• Productivity trend is falling globally.
• Malaysia's gap between labourproductivity growth and GDP growth has been widening – slowing compared to other Asian countries – risk to further slowdown.
• The economy is made up of sectors with low productivity.
• Benchmarks against best-in-class countries suggest we are lagging behind in most sectors
0
2
4
6
8
10
12
14
CAGR (%)
2005-2009
2.1%
3.7%
2.1%
2016-2020 (11MP)
GDP5.8%
2010-2014
2.0%
3.3%
4.9%5.4%
Productivity
Labour3.1%
1999-2004
7.0%
8.7%
12.1%
Decline in
productivity
growth
Increase in
labour
intensity
GDP, Productivity and Employment growth
Source: Finding of Malaysia Productivity Blueprint and 11th Malaysia Plan (EPU, MEA) 16
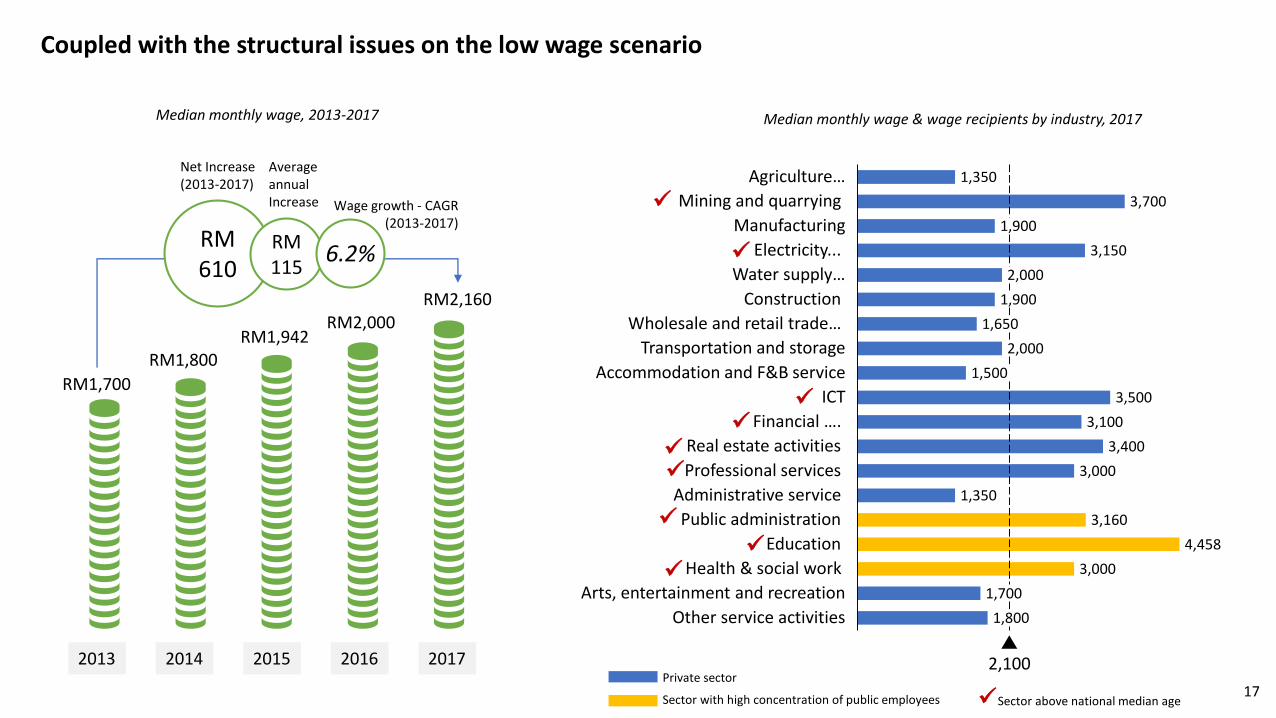
Coupled with the structural issues on the low wage scenario
2013 2014 2015 2016 2017
1,350
3,700
1,900
3,150
2,000
1,900
1,650
2,000
1,500
3,500
3,100
3,400
3,000
1,350
3,160
4,458
3,000
1,700
1,800
Agriculture…
Electricity...
Mining and quarrying
Wholesale and retail trade…
Manufacturing
Transportation and storage
Water supply…
Financial ….
Construction
Accommodation and F&B service
ICT
Real estate activities
Professional services
Administrative service
Public administration
Education
Health & social work
Arts, entertainment and recreation
Other service activities
2,100Private sector
Sector with high concentration of public employees
RM1,700
RM1,800RM1,942
RM2,000RM2,160
RM610
RM115
6.2%
Wage growth - CAGR (2013-2017)
Net Increase (2013-2017)
Average annual Increase
Median monthly wage, 2013-2017 Median monthly wage & wage recipients by industry, 2017
Sector above national median age
17

03 Future skills Future Outlook of the Job Market
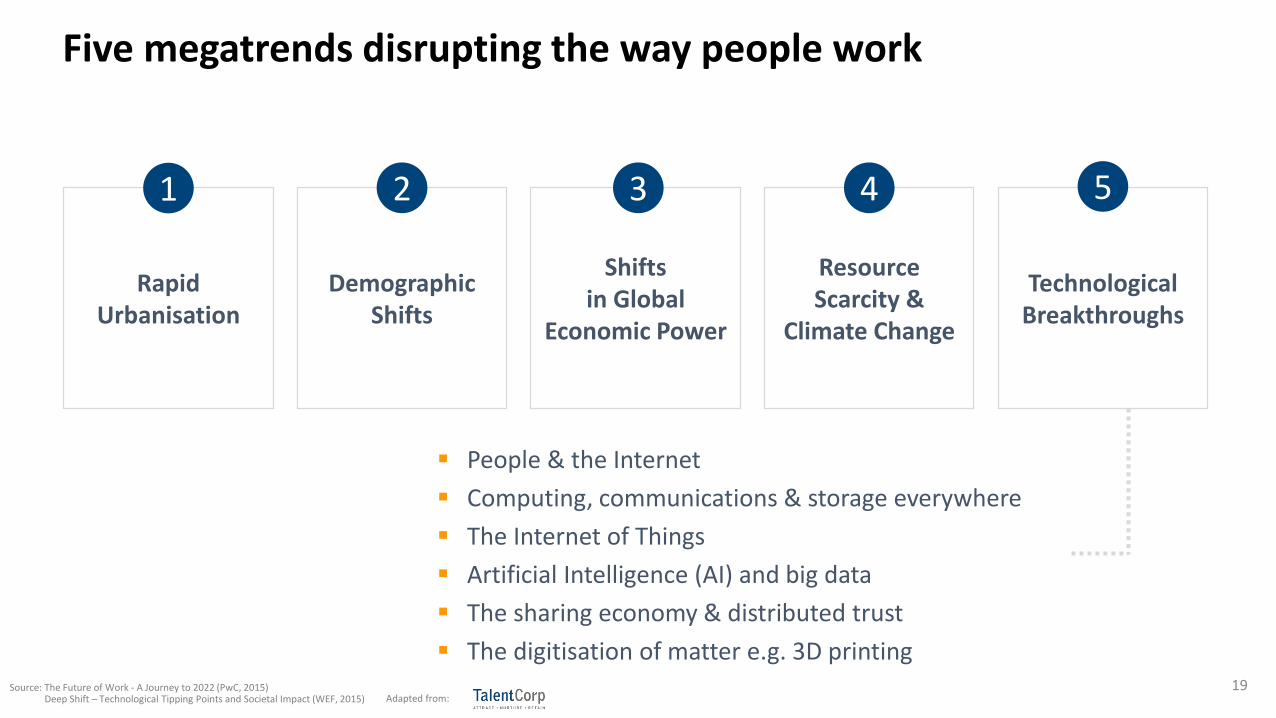
Five megatrends disrupting the way people work
Source: The Future of Work - A Journey to 2022 (PwC, 2015)Deep Shift – Technological Tipping Points and Societal Impact (WEF, 2015)
Rapid Urbanisation
Demographic Shifts
Shifts in Global
Economic Power
Resource Scarcity &
Climate Change
Technological Breakthroughs
1 2 3 4 5
People & the Internet
Computing, communications & storage everywhere
The Internet of Things
Artificial Intelligence (AI) and big data
The sharing economy & distributed trust
The digitisation of matter e.g. 3D printing19
Adapted from:

Comparing Skills Demand : 2018 vs 2022
Source: The Future of Jobs Report (World Economic Forum, 2018)
• Analytical thinking and
innovation
• Complex problem-solving
• Critical thinking and
analysis
• Active learning and
strategies
• Creativity and initiative
• Attention to detail,
trustworthiness
• Emotional intelligence
• Leadership and social
influence
• Analytical thinking and
innovation
• Creativity, originality and
initiative
• Emotional Intelligence
• Reasoning, problem-
solving and ideation
• System analysis and
evaluation
• Leadership and Social
Influence
• Technology design and
programming
• Memory, verbal, auditory and
spatial abilities
• Management of financial and
material resources
• Technology installation and
maintenance
• Reading, writing, math and
active listening
• Management of personnel
• Quality control and safety
awareness
• Coordination and time
management
• Visual, auditory and speech
abilities
Today, 2018 Trending, 2022 Declining, 2022
20Adapted from:

Occupations on the Rise
Source: The Future of Jobs Report (World Economic Forum, 2018)
Among the range of roles that are set to
experience increasing demand in the period
up to 2022 are established roles such as:
Data Analysts and Scientists
Software and Applications Developers
Also expected to grow are roles that
leverage distinctively ‘human’ skills such
as Customer Service Workers and Sales and
Marketing Professionals
Accelerating demand for a variety of wholly
new specialist roles related to
understanding and leveraging the latest
emerging technologies such as AI and
Machine Learning Specialists.
Data Analysts and Scientists
Software and Applications Developers
Ecommerce and Social Media Specialists
Customer Service Workers
Sales and Marketing Professionals
Training and Development
People and Culture
Organizational Development Specialists
Innovation Managers
AI and Machine Learning Specialists
Big Data Specialists
Process Automation Experts
Information Security Analysts
User Experience and Human-Machine Interaction Designers
Robotics Engineers
Blockchain Specialists
21

Malaysian Jobs at Risk of Automation
Source: The Times They Are A-Changin’: Technology, Employment, and the Malaysian Economy; Khazanah Research Institute, Apr 2017
4 out of 5 jobs at high risk of displacement by technology are semi-skilled
0
10
20
30
40
50
60
70
80
90
100
High risk Medium risk Low risk
Skilled Semi-skilled Low-skilled
Low risk,
16%
Medium risk,
30%
High risk,
54%
More than 70% of semi-skilled and
80% of low-skilled jobs – including
clerical support workers, sales
worker, and many semi-skilled and
elementary occupations in
manufacturing, construction and
agriculture
Managerial occupations
and high-skill
professionals
High-skill to low-skill occupations –
including technicians and associate
professionals, personal service workers,
E&E and ICT mechanics and repairers, and
cleaners and helpers
Semi-skilled,
80%
22Adapted from:

04 Human resources Policy ReformsStrategic Areas

…..
24
• Currently 1.8 mil foreign workers or 12% of Malaysia’s workforce
• Reduce reliance on foreign workers
• Multi-tier levi system
• Social Security for foreign workers
• Reviewing / amending policies and acts related
FOREIGN WORKERS

…..
25
• Implementation of Productivity Linked Wage System (PLWS)
• Implementation of RM1,050 as minimum wage beginning 1st Jan 2019
• Standardising minimum wage across Peninsular Malaysia with Sabah and Sarawak – inline with PakatanHarapan’s 100 day promise
• Gradual increase of minimum wage to RM1,500 in 5 years time – inline with Pakatan Harapan’s menifesto
SALARY / WAGES

…..
26
• HRDF fund for workers
• Reskilling & Upskilling – improve employability and marketability of workers
• Decreasing low skilled workers and increasing semi skilled & high skilled workers
• Encouraging senior citizens to continue participating in the workforce
LIFE LONG LEARNING
…..
27
• Assist Malaysians to find relevant jobs – decrease job mismatch ie: JobsMalaysia Portal
• A new portal www.specialjobs.com.my will be launched today by YB Minister of Human Resources. It’s a joint venture between MoHR and Brickfields Asia Collage
• Employee Insurance Scheme (EIS)
• Adherence to International Labour Organization (ILO)
PUBLIC EMPLOYMENT SERVICES

…..
28
• Career Comeback Programme (CCP)
• Increasing female participation in Skim Bantuan Latihan – HRDF
• Support for Housewives Programme (S4HW)
• Work-Life practices – flexi hours, work from home, longer maternity leaves, etc.
WORKPLACE FLEXIBILITY

…..
29
• Encouraging vocational skills to meet industry demands• Harmonizing education pathway for TVET stream and academic stream• Facing the challenge of IR4.0• Upgrading current syllabus and accreditations• Employability and marketability
TVET

www.mohr.gov.my
THANK YOU
www.facebook.com/pages/Kementerian-Sumber-Manusia
30