development and verification of a simulation model for ...caem.hcmuaf.edu.vn/data/paper 2018...
TRANSCRIPT

Full Terms & Conditions of access and use can be found athttp://www.tandfonline.com/action/journalInformation?journalCode=tpps20
Plant Production Science
ISSN: 1343-943X (Print) 1349-1008 (Online) Journal homepage: http://www.tandfonline.com/loi/tpps20
Development and verification of a simulationmodel for paddy drying with different flatbeddryers
Nguyen Van Hung, Romualdo Martinez, Tran Van Tuan & Martin Gummert
To cite this article: Nguyen Van Hung, Romualdo Martinez, Tran Van Tuan & Martin Gummert(2018): Development and verification of a simulation model for paddy drying with different flatbeddryers, Plant Production Science, DOI: 10.1080/1343943X.2018.1518723
To link to this article: https://doi.org/10.1080/1343943X.2018.1518723
© 2018 The Author(s). Published by InformaUK Limited, trading as Taylor & FrancisGroup.
Accepted author version posted online: 05Sep 2018.Published online: 01 Oct 2018.
Submit your article to this journal
Article views: 7
View Crossmark data

Development and verification of a simulation model for paddy drying withdifferent flatbed dryersNguyen Van Hung a, Romualdo Martinezb, Tran Van Tuanc and Martin Gummerta
aSustainable Impact Platform, International Rice Research Institute (IRRI), Los Baños, Luzon, Philippines; bBioprocess Engineering Division,Philippine Center for Postharvest Development and Mechanization, Munoz, Nueva Ecija, Philippines; cCenter for Agricultural Energy andMachinery, Nong Lam University, Ho Chi Minh City, Vietnam
ABSTRACTThis research developed a computer-based simulation model applicable for conventional andreversible airflow flatbed dryers, which can be used to predict the optimized time for mixingpaddy (for the conventional flatbed dryer) and reversing the drying air (for the reversible airflatbed dryer). The developed software has the ability of simulating the paddy moisture contentand temperature based on the input parameters of ambient (temperature and relative humidity)and drying air (temperature and airflow rate), dimensions of the dryers, and input grain proper-ties and weight. The model was verified based on data collected from actual paddy dryingpractices in Vietnam from 1994 to 2015. Relative errors between modeled and measuredmoisture content of paddy varied for different stages of the drying process and different dryercapacities. On average, the error was highest at the middle stage of the drying processes. Thiserror increased gradually during the early two-thirds stage of the drying process and reached19% and 14% for the conventional and reversible air flatbed dryers, respectively. On the otherhand, these errors decreased to less than 10% at the end of the drying process. Accurateprediction of optimized machine operating time determines the uniformity of the final moisturecontent of paddy between top and bottom layers, improving energy efficiency, and reducingpostharvest losses and drying cost.
ARTICLE HISTORYReceived 15 June 2018Revised 11 August 2018Accepted 28 August 2018
KEYWORDSRice; postharvest; drying;flatbed dryer; modeling;simulation
1. Introduction
About 500 million tonnes of milled rice are produced inthe world annually (Ricestat, 2017). Postharvest pro-cesses, including the operations from harvesting tomilling cause losses both in quantity and quality inthe range of 20–30% of rice grain produced (FAO,2013). Drying is a postharvest process in which themoisture content is reduced to a safe level for storage.Drying is considered to be the most important processof all postharvest activities (RKB, 2017). Delayed drying,incomplete drying, or inefficient drying leads to reduc-tion in rice quality and increase in postharvest losses(RKB, 2017; Xiao & Gao, 2008).
Drying technologies and many types of mechanicaldryers were developed for paddy drying from farmscales to industrial scales, and are covered in manypublications, such as Brooker et al., (1974) and RKB(2017). Among those dryer types, the flatbed dryer(FBD) is one of the most common types for cerealdryers in Asia (Lopez et al., 1998; Zare et al., 2009).This dryer type is widely used for paddy drying inSoutheast Asian countries as they are fixed with the
desired scales, have relatively low investment and cost,and low management capacity requirement (Phanet al., 1995; Gummert, 2013). Design layouts, perfor-mance, and adaptation of FBDs to different conditionsare presented in many publications, such as RKB(2017), Gummert (2013), Phan et al. (1995), and Tadoet al. (2015). The grain bulk is contained in a rectan-gular bed, on an elevated perforated floor, which is ontop of a plenum chamber. Drying air is heated bybeing mixed with flue gas from a furnace, whichusually uses rice husk as it is one of the lowest-costfuels for paddy drying (Nguyen et al., 2017; Nguyenet al., 2018). The heated drying air is then forced bythe blower through the grain bulk to generate a heatand mass transfer process consisting of the evapora-tion and removal of water from paddy grains. Thedrying process is continued until the average grainmass is dried to the desired MC for storage andmilling, usually 14% (RKB, 2017).
Drying is a process of heat and mass transfers (Chua,et al., 2002). Its performance to minimize grain quality lossneeds to be optimized for maximum energy efficiency; andits cost is affected by many factors, such as structure of the
CONTACT Nguyen Van Hung [email protected]
PLANT PRODUCTION SCIENCEhttps://doi.org/10.1080/1343943X.2018.1518723
© 2018 The Author(s). Published by Informa UK Limited, trading as Taylor & Francis Group.This is an Open Access article distributed under the terms of the Creative Commons Attribution License (http://creativecommons.org/licenses/by/4.0/), which permits unrestricteduse, distribution, and reproduction in any medium, provided the original work is properly cited.

dryers, environment, temperature and relative humidity ofambient and drying air, static pressure of drying air, graintemperature, initial moisture content of grain, etc.Developing simulation models for the drying process isvery important to understand how the related factorsinfluence drying, for optimizing dryer performancewithouthaving to run many costly and time consuming dryingtrials.
Deep-bed drying models are usually developed basedon thin-layer models. There were many thin-layer modelsdeveloped for paddy drying, such as in the works ofWongwises and Thongprasert (2000), ASAE (1999), Chen(1998), Abe and Afzal (1997), Chen and Shei (1996), Jindaland Siebenmorgen (1994), and Islam and Jindal (1981).More recently, based on the thin-layer models above,various computer-based simulation models for deep-beddrying were also presented in related researches byNguyen et al., (2016), Tajaddodi (2012), Zare and Chen(2009), Zare et al., (2006), Felipe and Barrozo (2003),Martinez (2001), and Sitompul et al., (2001).
However, there is no publication on a simulationmodel that covers both options of the conventionalflatbed dryers (FBDc) and the reversible air flow flatbeddryers (FBDr). To initiate the development of such adrying model, this research developed a computer-based combined simulation model that can be usedfor FBDc and FBDr. The model was then verified withdata measured from actual practices of drying long-grain paddy in Vietnam.
2. Methodology
2.1. Assessments of flat bed dryers
The modeling and verification were developed foroptimizing the management of the different typesof FBDs that were recently adopted in SoutheastAsia and are described in Phan et al. (1995),Gummert (2013), and Tado et al. (2015). These FBDs(Figure 1(a)) consist of three main components: (1) afurnace to generate heat, (2) a blower to generatedrying air with the required airflow rate and staticpressure, and (3) a drying chamber. A FBD with thedrying air moving in one direction (by defaultupwards) is called FBDc, whereas when its drying aircan move in two directions either upward or down-ward as shown in Figure 1(b), it is called FBDr. Thedrying material is loaded into the drying bin on topof a perforated floor with a depth of 25–40 cm or 50–60 cm for the FBDc or FBDr, respectively; and thedrying air temperatures are in the ranges of 42–45°Cfor grain and 40–43°C for seed production (Gummert,2013; Phan et al., 2003).
2.2. Mathematical modeling of the deep-beddrying process
The general approach to mathematically describing thedrying process in a grain bed is to divide the processinto small sub-processes. The drying process is consid-ered to occur in thin layers over a series of discrete timeintervals. Starting from the first layer at the air inletportion, the drying air passes through each layer asshown in Figure 2. Heat and moisture balance equa-tions describe the condition of the air and the grainlayer after each time interval, with the exhaust air con-dition from one layer used as the inlet air condition tothe next layer. The layer-by-layer calculations are donethrough the entire bed over a series of time intervaluntil drying is completed. For reversed airflow, thesame layer by layer calculations are followed, exceptthat the drying air enters the bed in the opposite down-ward direction, starting from the last (top most) layerand exiting from the first (bottom most) layer.
The near-equilibrium model developed by Thompsonet al., (1968) and Thompson (1972) was adopted in thisstudy. Figure 3 shows the basic input and output para-meters of the model. The inlet air with temperature, To,humidity ratio, Ho, and superficial air velocity, v, passesthrough the thin layer for a drying time interval, Δt. Thethin layer has a current moisture content, Mo, and graintemperature, θo. Moisture is evaporated into the drying airresulting in a reduction in moisture content, Mf, andincrease in humidity ratio, Hf, of the exhaust air. Thetemperature of the exhaust air, Tf, is reduced in proportionto the increase in grain temperature, θf, through theevaporative cooling that occurs during moisture evapora-tion. The amount of moisture removed per unit of time isdetermined by the thin-layer drying equation. The finalheat balance equation determines the final air and graintemperatures.
Thompson et al. (1968) model was applied to determinethe equilibrium drying air temperature and equilibriummoisture content based on the following procedure:
● First, a sensible heat balance is performed todetermine the equilibrium drying air temperature(Te). All the heat and mass balances are presentedin kg−1 dry air basis.
caT0 þ H0 hv0 þ cvT0ð Þ þ Cgθ0¼ caTe þ H0 hv0 þ cvTeð Þ þ Cgθe (1)
Cg ¼ cg R (2)
R ¼ ρg Δx 1�Mowb=100ð Þ60 v Δt ρa
(3)
2 N. V. HUNG ET AL.

where
To = inlet air temperature, °CTe = equilibrium drying air temperature, °Cθo = initial grain temperature, °Cθe = equilibrium grain temperature, °C, equal to TeHo = inlet air humidity ratio, kg kg−1
ca = specific heat of dry air, 1.005 kJ kg−1 °C−1
cv = specific heat of water vapor, 1.850 kJ kg−1 °C−1
hvo = latent heat of vaporization of free water atreference, 2500.8 kJ kg−1
Cg = specific heat of grain, converted to kJ kg−1 air °C−1
cg = specific heat of grain, kJ kg−1 °C−1 (see Table 1)R = dry matter to dry air ratio for each layer and time
interval, kg kg−1
Mowb = initial moisture content of the grain bed, %wet basis (w.b.)
ρg = bulk density of grain, kg m−3 (see Table 1)ρa = density of air, kg m−3 (ASAE, 1997)Δx = depth of thin layer, mΔt = time interval, minv = superficial air velocity, m s−1
● Next, the equilibrium moisture content, Me, ofthe thin-layer is determined by first calculatingthe relative humidity, RHe, which correspondsto Te and, Ho and then using the RHe and Tevalues in the equilibrium moisture contentequation,
Me ¼ 1100
ln ð1� RHe=100Þ�0:000035502 ðTe þ 27:396Þ
� � 1=2:31
(4)
whereMe = equilibrium moisture content, % dry basic (d.b.)RHe = equilibrium relative humidity, %The Te in all thin-layer changes as drying progresses. A
new drying curve is specified when the Te changes andthe amount of drying in the previous curve has to betransformed to the current curve. This transformation
Figure 1. Flatbed dryer (FBD) showing the schematic diagram (a) and principle schema of drying airflow directions moving up- anddown-ward (b).
Figure 2. Simulation of grain drying in a deep bed as series ofthin-layer drying processes.
Figure 3. Input and output parameters of the near-equilibrium model.
PLANT PRODUCTION SCIENCE 3
was made by calculating the equivalent drying time, te.Based from the thin-layer drying equation,
te ¼ � 1kln
M0o �Me
Mo �Me
� �� �1=n(5)
whereMo = current moisture content of the thin-layer, % d.b.M0
o = initial moisture content of the grain bed, % d.b.MR = moisture ratio, dimensionlesste = equivalent drying time, mink, n = drying/rewetting constants (see Table 1) eval-
uated at Te, He, M0o
The te is the equivalent drying time needed for thedrying curve to reach the current moisture content. Thefinal moisture content, Mf, at the end of the currenttime interval,Δt, is then calculated from the thin-layerdrying equation using the time, te þ Δt,
MR ¼ Mf �Me
Mo �Me¼ exp �k ð te þ ΔtÞn½ � (6)
whereMf = final moisture content, % d.b.The amount of moisture removed from the grain, equal
to Mo �Mf percentage points, is evaporated to the air,thereby increasing the humidity ratio by the amount,ΔH,
ΔH ¼ ðMo �Mf Þ100
R (7)
and the final humidity ratio is calculated as,
Hf ¼ Ho þ ΔH (8)
whereHf = final humidity ratio, kg kg−1
ΔH = change in humidity ratio, kg kg−1
The final temperature is determined from the finalheat balance,
caTe þ H0 hv0 þ cvTeð Þ þ Cgθe þ cw Hf � H0ð Þθe¼ caTf þ Hf hv0 þ cvTfð Þ þ Cgθf þ ΔL Hf � H0ð Þ (9)
whereTf = final air temperature, °Cθe = equilibrium grain temperature equal to Te, °Cθf = final grain temperature equal to Tf, °Ccw = specific heat of water, Eqn. 186 kJ kg−1 °C−1
ΔL = difference between latent heat of vaporizationof water in grain and free water, kJ kg−1
The Thompson (1972) model, simplification of theThompson et al. (1968) model, was then applied in thesimulation. This later model assumes moisture equili-brium between the air and the thin-layer of grain duringeach time interval. No thin-layer drying or rewetting equa-tion is required to determine the amount of moistureremoved or added. The following balances are solved todetermine the equilibrium conditions between the air anda particular grain layer during each time interval. All heatand mass balances are in kg−1 dry air basis.
Heat balance between the air and the grain,
caT0 þ H0 hv0 þ cvT0ð Þ þ Cgθ0 þ cw Hf � H0ð Þθ0¼ caTf þ Hf hv0 þ cvTfð Þ þ Cgθf (10)
Mass balance between the air and the grain,
Hf � Ho ¼ ðMo �Mf Þ100
R (11)
Equivalence between the relative humidity of the airand equilibrium relative humidity of the grain asdescribed by ERH equation,
ERHf ¼ 100 1� exp ð�0:000035502 ðTf þ 27:396ÞM 2:31f Þ� �(12)
The air relative humidity, RH, which corresponds to thegiven air temperature, T, and humidity ratio, H, is calcu-lated from the properties of moist air from ASAE (1997).
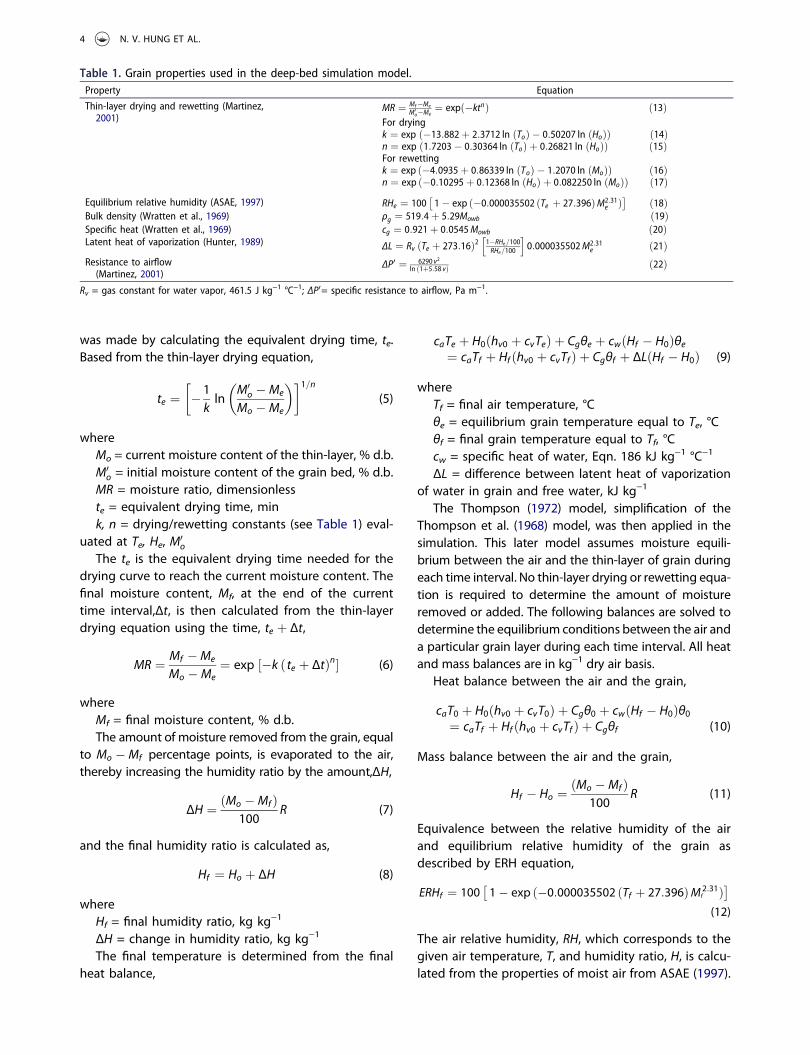
Table 1. Grain properties used in the deep-bed simulation model.Property Equation
Thin-layer drying and rewetting (Martinez,2001)
MR ¼ Mf�MeM0
o�Me¼ expð�ktnÞ ð13Þ
For dryingk ¼ exp ð�13:882þ 2:3712 ln ðToÞ � 0:50207 ln ðHoÞÞ ð14Þn ¼ exp ð1:7203� 0:30364 ln ðToÞ þ 0:26821 ln ðHoÞÞ ð15ÞFor rewettingk ¼ exp ð�4:0935þ 0:86339 ln ðToÞ � 1:2070 ln ðMoÞÞ ð16Þn ¼ exp ð�0:10295þ 0:12368 ln ðHoÞ þ 0:082250 ln ðMoÞÞ ð17Þ
Equilibrium relative humidity (ASAE, 1997) RHe ¼ 100 1� exp ð�0:000035502 ðTe þ 27:396ÞM2:31e Þ� � ð18Þ
Bulk density (Wratten et al., 1969) ρg ¼ 519:4þ 5:29Mowb ð19ÞSpecific heat (Wratten et al., 1969) cg ¼ 0:921þ 0:0545Mowb ð20ÞLatent heat of vaporization (Hunter, 1989) ΔL ¼ Rv ðTe þ 273:16Þ2 1�RHe=100
RHe=100
h i0:000035502M2:31
e ð21ÞResistance to airflow(Martinez, 2001)
ΔP0 ¼ 6290 v2ln ð1þ5:58 vÞ ð22Þ
Rv = gas constant for water vapor, 461.5 J kg−1 °C−1; ΔP0= specific resistance to airflow, Pa m−1.
4 N. V. HUNG ET AL.

The grain properties used in the mathematical mod-els are summarized in Table 1. The moist air propertieswere adopted from ASAE (1997).
Within this study, the model was applied for FBDwith drying temperature lower than 45°C. However,this model can also be used for higher drying tempera-ture situations:
● The original Thompson et al. (1968) model wasused for simulating high temperature corn drying
● The thin-layer drying equation of Martinez (2001)used in this study can be used for low and hightemperature drying. It was based on laboratoryexperiments with the range of drying temperaturebetween 30 and 90°C.
2.3. Methodology of verifying the model
The developed model was verified through compara-tive assessments of the drying processes from themodeled results with measured data. Measurementswere conducted in-situ by sampling paddy duringactual drying practices in Vietnam. Figure 4 showsthe schematic top-view of a FBD with six samplingpositions (1, 2, 3, 4, 5, and 6). At each position,paddy samples were collected at the two layers, topand bottom. For the small FBDs with their capacitylower than 1.5 t batch−1 with a small drying bin, thesamples were just collected at 4 points of 1, 2, 5, and 6as shown in Figure 4.
Table 2 shows the data collected from the simula-tions and from experiments of actual dryers for paddydrying using different sizes of FBDc and FBDr. Thesedata were synthesized into the average values of:
● Dimension of drying chambers shown in theirLength*Width (m*m)
● Ambient air properties: temperature (°C) and rela-tive humidity (RH %)
● Drying air properties: temperature (°C), velocitymeasured at the surface of grain bulk (m s−1)
● Paddy: Initial weight in a drying batch (kg),Moisture content MC (%) at input and during dry-ing process (the interval was 1–2 h).
2.4. Software and data analysis
A simualtion program was created based on the math-ematical modeling for FBDc and FBDr. This program,called FBD Drying Simulation Beta (FBD-Simulation), hasits interface as shown in Figure 5. We then use FBD-Simulation to estimate the paddy drying process andrecord the data for MC reduction of the top and bottomlayers and drying time to obtain the required MC ofgrain.
Grain MCs during drying processes simulated fromFBD-Simulation were then compared with that mea-sured from actual practices for evaluation and verifica-tion. Comparison between the modeled MC (MCmodeled)and measured MC (MCmeasured) is presented through theindex, so called error (ERR), calculated based onEquation (23).
ERRð%Þ ¼ MCmodeled �MCmeasuredj jMCmodeled
� 100 (23)
Where:MCmodeled : estimated (modeled) moisture content of
grain resulted from the FBD-Simulation.MCmeasured : moisture content of grain measured dur-
ing the experiments or actual practices.
3. Results
3.1. Conventional flatbed dryers (FBDc)
Comparisons of paddy MC between measured and mod-eled data for the experimental FBDc 0.5 t batch−1
(FBDc0.5) and actual operation FBDc6 t batch−1 (FBDc6)are shown in Figure 6. As the results, for both practices ofFBDc0.5 and FBDc6, reduction rate of grain MC in the earlytwo-thirds (2/3) of drying time was lower from actualmeasurements, than that generated from modeling. Itmeans that the actual process was slower than the mod-eled process in the early drying stage. However, the dry-ing time to attain the required final grain MC is not muchdifferent between the measured andmodeled results. Forthe FBDc0.5, drying times to reduce grain MC from 20%down to 14%were about 7.5 h and 7.0 h for the actual andmodeled scenarios, respectively. For the FBDc6, drying
Figure 4. Schematic diagram of sampling positions (top-view ofthe FBD). L = Lenght of a dryer’s side; W = Width of a dryer’sside.
PLANT PRODUCTION SCIENCE 5

time for reducing grain MC from 26% down to 14% wasabout 9 h for both actual and modeled scenarios.
Comparisons of actual and modeled drying pro-cesses for various FBDc with different capacities from0.5 to 6 t batch−1 are shown in Figure 7. Paddy MCsmeasured during actual drying at both the top layer(Measured-top) and bottom layer (Measured-bottom)fluctuated much more than those resulting from mod-eling. On average, the MC reduction of Modeled-bot-tom was faster than that of Measured-bottom duringthe early stage of drying time (ranging from 0 to 5 h ofthe drying process). Drying rate (MC reduction by time)of the bottom layer from modeling was about 20–30%higher than that of actual drying. In the middle stage ofdrying process (Figures 6 and 7), grain moisture content
in the model was lower than that of the actual measurebecause of the following possible reasons:
● The actual MC was the average from measuring indifferent drying batch and different points in eachbatch, whereas the modeled MC was just esti-mated from one input MC.
● In the actual practices, the density of the wet grainbulk may also cause a reduction of the drying rate.
The relative errors (%) between modeled and measuredMCs during the drying processes for different FBDc arealso shown in Figure 7. The error of the bottom layerreached 19%, while that of the top layer was less than10%. Highest errors happened in the early stage of
Table 2. Data of paddy drying assessed with different flatbed dryers.Dryingchamber
Ambientair Drying air Paddy
# DryersLength*width
(m*m) °CRH(%) °C
Velocity(m s−1)
Initialweight (kg)
Thickness of grainlayer (cm)
InitialMCwb (%)
FinalMCwb (%) Source of data
1 FBDc0.5 2*1 27.9 88 40.7 0.19 549 48 19.9 13.3 Le, 20112 FBDc4 5*3 30.0 75 38.7 0.20 3526 41 22.5 14.3 Phan, Nguyen, Nguyen, Le, &
Truong, 20003 FBDc6 5*4 24.8 85 41.6 0.19 5107 44 26.2 13.0 Le, 20116 FBDr0.1 0.3*0.3 27.0 75 43.0 0.20 36 69 25.2 13.3 Lam, 20048 FBDr1.5 2*2 31.5 75 43.3 0.21 1620 70 28.5 15.0 Phan et al., 20039 FBDr4 4*3 26.4 75 35.5 0.22 3716 53 20.6 14.0 Nguyen, Nguyen, Le, & Phan,
200910 FBDr8 7*4 24.9 85 36.7 0.22 7500 46 23.0 13.3 Le, 201111 FBDr10 7*5 32.6 75 40.9 0.27 9000 44 25.1 14.1 Tran, Tran, Nguyen, & Nguyen,
2015
FBDc = conventional flatbed dryer; FBDr = reversible air flow flatbed dryer; The number (no.) after FBD(c or r) is its capacity (t batch−1); MCwb = Moisture contentin wet basis.
Figure 5. Interface of the beta version for FBD simulation.
6 N. V. HUNG ET AL.

drying, at the time interval from 2 to 5 h. However, afterabout two-thirds of the drying time (after mixing thepaddy), the errors of both bottom and top layers arealmost the same; decreasing to less than 10% when thedrying process is finished. Possible causes of the errorare described in the discussion section.
3.2. Reversible air flow flatbed dryers (FBDr)
Similarly, comparisons between measured and modeledpaddy MC for the experimental FBDr with 0.1 t batch−1
(FBDr0.1), and the actual operation FBDr with 10 t
batch−1 (FBDr10) are shown in Figure 8. For FBDr0.1,the difference between the actual and modeled paddyMC of the bottom layer was very low, whereas that ofthe top layer was much higher. On the other hand,these differences were not significant for FBDr10. Theerror between the modeled and measured paddy MCfor the experimental dryer (FBDr0.1) was higher thanthat for the actual dryer (FBDr10). This was because themodel used was already adapted for actual paddy dry-ing with adjusted coefficients.
In addition to the comparison between actual andmodeled drying processes of FBDr, an investigation of
Figure 6. Moisture content reduction in paddy drying with FBDc0.5 (a) and FBDc6 (b). Markers in the graphs represent for the datameasured at different points of the paddy bulk.
Figure 7. Comparisons of actual and modeled drying processes for different FBDc. Measured-top and measured-bottom = measuredMC at the top and bottom layers of drying paddy; Modeled-top and modeled-bottom: Modeled (estimated) MC at the top and bottomlayers of drying paddy; FBDc(x) = Conventional flatbed dryer with (x) t batch−1; Markers in the graph represent for data of the differentFBDc from 0.5 to 6 t batch−1.
PLANT PRODUCTION SCIENCE 7

the paddy MC reductions for various FBDr with differentcapacities resulted in the drying curves shown inFigure 9. Paddy MCs measured during the actual dryingat both the top layer (Measured-top), and bottom layer(Measured-bottom) with FBDr fluctuated more com-pared to those from the modeled paddy MC. On aver-age, the drying time from modeling of drying paddywith MC from 24% down to 14% was 12 h, or 10%longer than that of the actual drying process. This10% or 1 h over-estimation of time required for dryingmay affect the operation plan or scheduling of thesystem. Then again, for batch drying systems, the total
operation time usually fluctuated more than 10%depending on many other factors, such as labors, load-ing and unloading, etc.
To attain the final MC of 14%, the average MCreduction lines of bottom and top layers intersectedat earlier points (about 15% MC in this case) andthen the gap was re-expanded at the end point of14% MC. These less optimized processes should beaffected by many related drying factors, such aspaddy bulk, drying air properties, mixing time, etc.
The relative errors (%) between modeled and mea-sured MCs during drying processes for the researched
Figure 8. Moisture content reduction of paddy drying with FBDr0.1 (a) and FBDr10 (b). Markers in the graphs represent for the datameasured at different points of the paddy bulk.
Figure 9. Comparisons of actual and modeled drying process for different FBDr. Measured-top and measured-bottom = measured MCat the top and bottom layers of drying paddy; Modeled-top and modeled-bottom: Modeled (estimated) MC at the top and bottom layersof drying paddy; FBDr(x) = Conventional flatbed dryer with (x) t batch−1; Markers in the graphs represent for data of the different FBDrfrom 0.1 to 10 t batch−1.
8 N. V. HUNG ET AL.

FBDrs also varied much for different FBDrs with differ-ent capacities. These errors were in the range of 0–14%.The errors between modeled and measured MCsincreased gradually to the highest points of about10–14% at the middle of drying process and thenreduced to less than 10% after that. However, theerror of the top layer slightly increased again at theend of the drying process for about 2%. This might bebecause of improper selection of the air reversing time.This illustrates an advantage of the model to estimatethe optimized reversal point of airflow, to reach theoptimized drying process and obtain the uniform finalmoisture content of paddy.
3.3. Timing for mixing grain and reversing dryingair
Table 3 shows the timing for mixing grain (for FBDc)and reversing drying air (for FBDr) applied for theresearch dryers. Time from starting the drying processto mixing grain for FBDc ranged from 67 to 80% of thetotal drying process, while that to reversing drying airfor FBDr ranged from 63 to 75%. Fluctuation of thisparameter depends on many factors, such as propertiesof grain, ambient and drying air, and the capacity ofdryers. However, the model established can estimatethe optimized value for this parameter.
4. Discussion
This computer-based simulation model was developedusing the near-equilibrium models of Thompson et al.(1968) and Thompson (1972). The Thompson (1972)model assumes both thermal and moisture equilibriumbetween the air and the grain over each layer during eachtime interval. On the other hand, the Thompson et al.(1968) model also assumes thermal equilibrium, but themoisture transfer rate is governed by the characteristicthin-layer drying or rewetting equation. For this reason,the twomodels would give different estimates of the final
air and grain condition for each layer during each timeinterval. In this study, these values were compared andthe better estimates were chosen for the next calculationsteps.
Every drying model is developed for some specificdrying condition which is determined by the type ofmachine, paddy variety, weather condition, dryingparameters, etc. Accuracy of the simulation modelsare affected by not only specific drying materials andconditions but also the thin-layer based models. Thisaccuracy is usually represented by the relative error inpercentage between the drying parameters predictedfrom modeling and measured from experiments.Verification of this simulation model indicated thelower accuracy for the early two-thirds stage of dry-ing process. The relative errors (%) between modeledand measured moisture content of paddy during theearly two-thirds stage of drying process reached upto 19% and 14% for FBDc and FBDr, respectively.However, at the end of drying process, these errorsdecreased to less than 10% for both conventional andreversible air FBDs.
Generally, the relative error of this simulation modelis higher than the range of 10–15% error reported inother publications, such as Sitompul et al. (2001),Madhiyanon et al., (2001), Dimitriadis and Akritidis(2004), Kalbasi (2003), and Tang et al., (2004).Verification of the model in this research indicated ahigher error than that of the others. This would bemainly caused by that the verification resulted in thisresearch was based on the actual practices whereasthat of other researches were conducted throughlaboratory experiments. For instance, ambient para-meters (i.e. temperature and relative humidity) are con-trolled during the laboratory experiments but not forthe actual practices.
This computer-based simulation model can be usedto predict the optimized time for mixing paddy (forFBDc) and reversing air (for FBDr). Drying process thuswould be improved to obtain the uniformity of final MC
Table 3. Timing of mixing grain and reversing airflow.
DryerInitial weight
(kg)Initial MCwb
(%)Final MCwb
(%)
Drying tempera-ture(°C)
Timing for mixing grain or reversing dryingair (h)
Dryingtime(h)
Percentage ofdrying
process (%)
FBDc0.5 549 19.9 13.3 40.7 6 7.5 80FBDc4 3526 22.5 14.3 38.7 6 8 75FBDc6 5107 26.2 13.0 41.6 6 9 67FBDr0.1 36 25.2 13.3 43.0 7 10 70FBDr1.5 1620 28.5 15.0 43.3 6 8 75FBDr4 3716 20.6 14.0 35.5 4 6 67FBDr8 7500 23.0 13.3 36.7 7.5 12 63FBDr10 9000 25.1 14.1 40.9 6 9.5 63
FBDc = conventional flatbed dryer; FBDr = reversible air flow flatbed dryer; The number (no.) after FBD(c or r) is its capacity (t batch−1); MCwb = Moisture contentin wet basis.
PLANT PRODUCTION SCIENCE 9

of paddy (i.e. 14%) between top and bottom layers in aminimum drying time. This would result in increasingdrying efficiency and reducing drying cost.
The model established could also be applied forFBDs without limitation in capacity. It has high potentialfor application to higher capacity FBDs (30–50 t batch-−1) that are popularly used in Vietnam.
However, there are still large gaps between themodeled and actual results; thus, this model wouldneed improvement to minimize the relative errorswith the actual practices. Further research should beconducted to have a simulation comparing the gradientof the final moisture contents of the top and bottomlayers for dryers with air reversal, as well as without airreversal. Optimized drying process and airflow reversalbased on simulation would result in minimizing themoisture gradient among different layers of paddy ina FBD, and would minimize grain brokenness in thenext milling process.
5. Conclusion
This research resulted in a computer-based simula-tion model and its verification for conventional andreversible air FBDs. The developed software has theability of simulating the paddy moisture content andtemperature over time based on the input para-meters of ambient and drying air, dimensions ofthe dryers, and input grain properties and weight.This study resulted in a tool that would significantlyhelp predict and optimize the paddy drying pro-cesses using FBDs.
A verification of this simulation model was con-ducted based on the comparison of grain MC reductionbetween predicted data from modeling and measureddata from samples taken from actual dryers. As theresults, actual measured data fluctuated much morethan those gained from modeling. Relative errorsbetween modeled and measured MCs during the dry-ing processes for the researched FBDs varied for thedifferent stages of the drying process, different dryertypes (i.e. FBDc and FBDr), and different dryer capaci-ties. Generally, the error was highest at the middlestage of the drying processes. This increased graduallyduring the early two-thirds stage of the drying processand reached to 19% and 14% for FBDc and FBDr,respectively. On the other hand, these errors typicallydecreased to less than 10% at the end of the dryingprocess.
One of the biggest potentials of this computer-based simulation model is the prediction of the opti-mized time for mixing paddy (for FBDc) and reversingair (for FBDr), by evaluating which timing leads to the
most uniformly dried paddy at the end of the dryingprocess. The results from the simulation can be usedto increase the uniformity of the final MC of paddybetween the top and bottom layers, thus improvingenergy efficiency and reducing postharvest losses anddrying cost.
Nomenclature and units
% w.b. % moisture content in wet basis% d.b. % moisture content in dry basisθo initial grain temperature, °Cθe equilibrium grain temperature, °Cθf final grain temperature equal to Tf, °Cca specific heat of dry air, kJ kg−1 °C−1
Cg specific heat of grain, kJ kg−1 air °C−1
cv specific heat of water vapor, kJ kg−1 °C−1
Eqn EquationFBD Flatbed dryerFBDc Conventional flatbed dryerFBDr Reversible airflow flatbed dryerhvo latent heat of vaporization of free water at
reference, kJ kg−1
Hf final humidity ratio, kg kg−1
Ho inlet air humidity ratio, kg kg−1
MC moisture content in wet basis (%)Me equilibrium moisture content, % d.b.Mf final moisture content, % d.b.Mo current moisture content of the thin-layer, %
d.b.Mowb initial moisture content of the grain bed, %w.
b.MR moisture ratio, dimensionlessR dry matter to dry air ratio for each layer and
time interval, kg kg−1
Rv gas constant for water vapor, J kg−1 °C−1
RH relative humidity (%)RHe equilibrium relative humidity, %RKB Rice Knowledge Bankte equivalent drying time, minTo inlet air temperature, °CTe equilibrium drying air temperature, °CTf final air temperature, °Ct tonnev superficial air velocity, m s−1
ρg bulk density of grain, kg m−3
ρa density of air, kg m−3
ΔH change in humidity ratio, kg kg−1
ΔL difference between latent heat of vaporizationof water in grain and free water, kJ kg−1
Δt time interval, minΔx depth of thin layer, m
10 N. V. HUNG ET AL.

Highlights
● Modeling paddy drying processes for conventionaland reversible airflow FBDs
● Simulating grain moisture content and tempera-ture profiles for different drying conditions
● Predicting timing for mixing grain and timing forreversing air affects drying performance foroptimization
● Investigating relative errors between results frommodeled and actual drying processes
● The error was highest at the early two-thirds stageof drying process, maximum at 19%
● the error was least at 10% at the end of dryingprocesses.
Acknowledgments
This research was partially funded by Flagship Program 2,Upgrading Rice Value Chains, of the Consultative Group onInternational Agricultural Research (CGIAR) Research Programon RICE.
The authors acknowledge the valuable support of the teamof Mechanization and Postharvest Cluster, Sustainable ImpactPlatform, the International Rice Research Institute.
The authors also acknowledge the colleagues from theNong Lam University in Vietnam: Dr. Phan Hieu Hien, Mr.Nguyen Van Xuan, Dr. Nguyen Thanh Nghi, and Mr. LeQuang Vinh for their sharing the valuable related publications.
Disclosure statement
No potential conflict of interest was reported by the authors.
Funding
This work was supported by the RICE Flagship project 2:Upgrading rice value chains (http://ricecrp.org/wp-content/uploads/2017/01/Flagship-project-2.pdf).
ORCID
Nguyen Van Hung http://orcid.org/0000-0001-7668-6940
References
Abe, T., & Afzal, T. M. (1997). Thin-layer infrared radiationdrying of rough rice. Journal of Agricultural EngineeringResearch, 67, 289–297.
ASAE. (1997). ASAE standards. St. Joseph, Michigan: AmericanSociety of Agricultural Engineers.
ASAE. (1999). Thin-Layer drying of grains and crops(pp. 581–583). St. Joseph, Michigan: ASAE standardsS448.
Brooker, D. B., Bakker-Arkema, F. W., & Hall, C. W. (1974).Drying cereal grains. Westport, Connecticut, USA: The AVIPublishing Co.
Chen, Y. L. (1998). A new thin-layer equation for intermittentdrying of rough rice. Journal of Agricultural Machinery, 6(2),81–89.
Chen, Y. L., & Shei, H. J. (1996). Development of thin-layerequation for rough rice drying at beginning period.Memorial College of Agriculture, 36(4), 321–328.
Chua, K. J., Chou, S. K., Hawlader, N. A., Mujumdar, A. S., & Ho, J.C. (2002). Modeling the moisture and temperature distribu-tion within an agricultural product undergoing time-varyingdrying schemes. Biosystems Engineering, 81(1), 99–111.
Dimitriadis, N. A., & Akritidis, C. B. (2004). A model to simulatechopped alfalfa drying in a fixed deep bed. DryingTechnology, 22(3), 479–490.
FAO (2013). Postharvest food losses estimation. Retrievedfrom http://www.fao.org/fileadmin/templates/ess/documents/meet ings_and_workshops/GS_SAC_2013/Improving_methods_for_estimating_post_harvest_losses/Final_PHLs_Estimation_6-13-13.pdf
Felipe, C. A. A., & Barrozo, M. A. S. (2003). Drying of soybeanseeds in a concurrent moving bed: Heat and mass trans-fer and quality analysis. Drying Technology, 21(3), 439–456.
Gummert, M. (2013). Improved postharvest technologies andmanagement for reducing postharvest losses in rice. ActaHorticulturae, 1011(2013), 63–70.
Hunter, A. (1989). On the heat of sorption of Australianpaddy rice. Journal of Agricultural Engineering Research,44(3), 237–239.
Islam, M., & Jindal, V. K. (1981). Simulation of paddy dryingunder tropical conditions. Ama, 12(3), 37–41.
Jindal, V. K., & Siebenmorgen, T. J. (1994). Simulation of low-temperature paddy and rewetting in shallow beds.Transaction of ASAE, 37(5), 224–228.
Kalbasi, M. (2003). Heat and moisture transfer model for oniondrying. Drying Technology, 21(8), 1575–1584.
Lam, T. H. (2004). Investigation of reversible air flatbed dryer(MSc. thesis in Agricultural Engineering). Nong LamUniversity, Vietnam.
Le, Q. V. (2011). Comparative study of the performance of thereversible airflow dryer and the conventional flatbed dryer (M.Sc. thesis in Agricultural Engineering). CLSU, Philippines.
Lopez, A., Pique, M. T., & Romero, A. (1998). Simulation ondeep bed drying of hazelnuts. Drying Technology, 16, 651–665.
Madhiyanon, T., Soponronnarit, S., & Tia, W. (2001). A two-region mathematical model for batch drying of grains in atwo-dimensional spouted bed. Drying Technology, 19(6),1045–1064.
Martinez, R. C. (2001). Modelling and simulation of the two-stage rice drying system in the Philippines. ForschungsberichtPschungsbericht Agrartechnik des Arbeitskreises Forschungund Lehre der Max-Eyth-Gesellschaft Agrartechnik im VDI(VDI-MEG) 379. Stuttgart: Universitaet Hohenheim. pp. 165.
Nguyen, T. N., Nguyen, V. X., Le, V. B., & Phan, H. H. (2009).Results of research on the 25-kg/h semi-automatic rice huskfurnace. Journal of Agricultural Science and Technology, 2(2009), 50–56.
Nguyen, V. H., Duong, T. H., & Gummert, M. (2016). Building amodel for the paddy columnar dryer and analyzing a
PLANT PRODUCTION SCIENCE 11

reverse-airflow approach to achieve uniform grain tem-perature. International Agricultural Engineering Journal, 25(1), 64–73.
Nguyen, V. H., Carlito, B., Quilty, J., Bojern, S., Demont, M., &Gummert, M. (2017). Processing rice straw and rice husk asco-products. In T. Sasaki (Ed.), Achieving sustainable cultiva-tion of rice (Vol. 2, pp. 121–148): Burleigh Dodds SciencePublishing, Series No. AS04. http://bdspublishing.com/_webedit/uploaded-files/All%20Files/Leaflets/Rice%20A4%202pp.pdf
Nguyen, V. H., Quilloy, R., & Gummert, M. (2018). Improvingenergy efficiency and developing an air-cooled grate forthe downdraft rice husk furnace. Renewable Energy, 115,969–977.
Phan, H. H., Nguyen, H. T., Truong, V., & Nguyen, Q. L. (1995).Grain drying in Vietnam: Problems and priorities. Grain dry-ing in Asia. Proceedings of an International Conference heldat the FAO Regional Office for Asia and the Pacific. (pp. 57–67) http://ageconsearch.umn.edu/bitstream/134747/2/PR071.pdf.
Phan, H. H., Nguyen, V. X., & Nguyen, H. T. (2003, December11–12). Study on the reversal timing for the SRA reversibledryer. In: Proceeding on Agricultural Engineering and Agro-products Processing towards Mechanization andModernization in Rural Areas at Nong Lam University. HoChi Minh City.
Phan, H. H., Nguyen, V. X., Nguyen, H. T., Le, V. B., & Truong, V.(2000). Grain dryers in Vietnam. Vietnam ((in Vietnamese)) :Agricultural Publisher. pp. 250p.
Ricestat (2017). World rice. Retrieved from http://ricestat.irri.org/mistig/demos/php/global.php.
RKB (2017). Paddy drying. Retrieved from http://rkb.irri.org/step-by-step-production/postharvest/drying
Sitompul, J. P., Istadi, I., & Widiasa, I. N. (2001). Modelingand simulation of deep-bed grain drying. DryingTechnology, 19(2), 269–280.
Tado, C. J., Ona, D. P., Abon, J. E. O., Gagelonia, E., Nguyen, T.N., & Le, Q. V. (2015). Development and promotion of thereversible airflow flatbed dryer in the Philippines. Annals ofTropical Research, 37(1), 97–109.
Tajaddodi, K. (2012). Fixed Bed Drying of Rice with Air Flow Reversalfor Product Quality and Drying Performance (PhD Thesis).Malaysia: Universiti Putra Malaysia (UPM). pp. 200–205
Tang, Z., Cenkowski, S., & Muir, W. E. (2004). Modelling thesuperheated-steam drying of a fixed bed of brewers’ spentgrain. Biosystems Engineering, 87(1), 67–77.
Thompson, T. L. (1972). Temporary storage of high-.moistureshelled corn using continuous aeration. Transactions of theASAE, 15(2), 333–337.
Thompson, T. L., Peart, R. M., & Foster, G. H. (1968).Mathematical modelling of corn drying – A new model.Transactions of the ASAE, 11(4), 582–586.
Tran, V. T., Tran, C. T., Nguyen, T. N., & Nguyen, V. X. (2015). Resultsof researching and application on automatic-fed rice husk fur-nace. In: Proceedings of 4th national science and technologyseminar on engineering (pp.739–749), Ho Chi Minh City.
Wongwises, S., & Thongprasert, M. (2000). Thin layer and deepbed drying of long grain rough rice. Drying Technology, 18(7), 1583–1599.
Wratten, F. D., Poole, W. D., Chesness, J. L., Bal, S., & Ramarao,V. (1969). Physical and thermal properties of rough rice.Transactions of the ASAE, 12(6), 801–803.
Xiao, H. W., & Gao, Z. J. (2008). Research progress in the effectsof drying on feeding maize and processing quality.Transactions of the Chinese Society of AgriculturalEngineering, 24(7), 290–295.
Zare, D., & Chen, G. (2009). Evaluation of a simulation model inpredicting the drying parameters for deep-bed paddy dry-ing. Computers and Electronics in Agriculture, 68(2009), 78–87.
Zare, D., Minaei, S., Zadeh, M. M., & Khoshtaghaza, M. H. (2006).Computer simulation of rough rice drying in a batch dryer.Energy Conversion and Management, 47(18–19), 3241–3254.
12 N. V. HUNG ET AL.