development and validation of bioaccumulation models for ... · development and validation of...
TRANSCRIPT

ES/ER/TM-219
Development and Validation of Bioaccumulation Models
for Small Mammals
This document has been approvedby the East Tennessee Technology ParkTechnical Information Officefor release to the public. Date: 2/17/98

ES/ER/TM-219
Development and Validation of Bioaccumulation Models
for Small Mammals
B. E. SampleJ. J. BeauchampR. A. EfroymsonG. W. Suter, II
Date Issued—February 1998
Prepared for theU.S. Department of Energy
Office of Environmental Managementunder budget and reporting code EW 20
LOCKHEED MARTIN ENERGY SYSTEMS, INC.managing the
Environmental Management Activities at theOak Ridge East Tennessee Technology Park
Oak Ridge Y-12 Plant Oak Ridge National LaboratoryPaducah Gaseous Diffusion Plant Portsmouth Gaseous Diffusion Plant
under contract DE-AC05-84OR21400for the
U.S. DEPARTMENT OF ENERGY

iii
ACKNOWLEDGMENTS
The authors would like to thank Ron Mellot and Rob Pastorok of PTI Environmental Servicesfor their assistance in providing unpublished validation data. In addition, this report has benefittedfrom the review and comments of Sylvia Talmage and Chris Welsh.

v
PREFACE
While considerable data are available concerning chemical concentrations in small mammaltissues in relation to environmental contamination, models relating soil concentrations to whole-bodyconcentrations have not been developed. The purpose of this document, then, was to develop adatabase of soil and whole-body small mammal concentrations for 9 inorganic chemicals, based ondata from 22 studies from 4 countries and 9 states. This information will be used to evaluate risks topredatory wildlife on the Oak Ridge Reservation. Plant and earthworm data and models are presentedin companion reports ES/ER/TM-218 and ES/ER/TM-220, respectively.
This work was performed under Work Breakdown Structure 1.4.12.2.3.04.05.02, Activity DataSheet 8300 (CCADS-8323).

vii
CONTENTS
ACKNOWLEDGMENTS . . . . . . . . . . . . . . . . . . . . . . . . . . . . . . . . . . . . . . . . . . . . . . . . . . . . iii
PREFACE . . . . . . . . . . . . . . . . . . . . . . . . . . . . . . . . . . . . . . . . . . . . . . . . . . . . . . . . . . . . . . . . . v
TABLES . . . . . . . . . . . . . . . . . . . . . . . . . . . . . . . . . . . . . . . . . . . . . . . . . . . . . . . . . . . . . . . . . ix
FIGURES . . . . . . . . . . . . . . . . . . . . . . . . . . . . . . . . . . . . . . . . . . . . . . . . . . . . . . . . . . . . . . . . xi
ABBREVIATIONS . . . . . . . . . . . . . . . . . . . . . . . . . . . . . . . . . . . . . . . . . . . . . . . . . . . . . . . . xiii
EXECUTIVE SUMMARY . . . . . . . . . . . . . . . . . . . . . . . . . . . . . . . . . . . . . . . . . . . . . . . . . . . xv
1. INTRODUCTION . . . . . . . . . . . . . . . . . . . . . . . . . . . . . . . . . . . . . . . . . . . . . . . . . . . . . . . 1
2. MATERIALS AND METHODS . . . . . . . . . . . . . . . . . . . . . . . . . . . . . . . . . . . . . . . . . . . . . 32.1 DATABASE DEVELOPMENT . . . . . . . . . . . . . . . . . . . . . . . . . . . . . . . . . . . . . . . . . 32.2 MODEL DEVELOPMENT AND VALIDATION . . . . . . . . . . . . . . . . . . . . . . . . . . . . 4
3. RESULTS . . . . . . . . . . . . . . . . . . . . . . . . . . . . . . . . . . . . . . . . . . . . . . . . . . . . . . . . . . . . . . 73.1 MODELING RESULTS . . . . . . . . . . . . . . . . . . . . . . . . . . . . . . . . . . . . . . . . . . . . . . . 73.2 VALIDATION RESULTS . . . . . . . . . . . . . . . . . . . . . . . . . . . . . . . . . . . . . . . . . . . . 123.3 FINAL UFs AND MODELS . . . . . . . . . . . . . . . . . . . . . . . . . . . . . . . . . . . . . . . . . . . 27
4. DISCUSSION . . . . . . . . . . . . . . . . . . . . . . . . . . . . . . . . . . . . . . . . . . . . . . . . . . . . . . . . . . 33
5. RECOMMENDATIONS . . . . . . . . . . . . . . . . . . . . . . . . . . . . . . . . . . . . . . . . . . . . . . . . . 35
6. REFERENCES . . . . . . . . . . . . . . . . . . . . . . . . . . . . . . . . . . . . . . . . . . . . . . . . . . . . . . . . . 39
APPENDIX A. SUMMARY OF STUDIES INCLUDED IN THE SMALL MAMMAL BIOACCUMULATION DATABASE . . . . . . . . . . . . . . . . . . . . A-1
APPENDIX B. SMALL MAMMAL BIOACCUMULATION DATABASE . . . . . . . . . . . . . B-1
APPENDIX C. SUPPLEMENTAL SMALL MAMMAL BIOACCUMULATION DATAFROM THE VALIDATION STUDIES . . . . . . . . . . . . . . . . . . . . . . . . . . . . C-1
APPENDIX D. PROCEDURE FOR CALCULATING PREDICTION LIMITSFOR ESTIMATES GENERATED BY THE SIMPLE REGRESSION MODELS . . . . . . . . . . . . . . . . . . . . . . . . . . . . . . . . . . . . . . . . . . . . . . . . . . . D-1

ix
TABLES
1. Summary of small mammal species and trophic groups included in bioaccumulation database . . . . . . . . . . . . . . . . . . . . . . . . . . . . . . . . . . . . . . . . . 3
2. Summary statistics for literature-derived soil-small mammal UFs . . . . . . . . . . . . . . . . . . . . . . . . . . . . . . . . . . . . . . . . . . . . . . . . . . . . . . . . . . . . . . . . . . 8
3. Results of regression of ln whole-body small mammal on ln soil . . . . . . . . . . . . . . . . . . . . 114. Results of F-tests comparing regression models based on
validation data and literature-derived dataset . . . . . . . . . . . . . . . . . . . . . . . . . . . . . . . . . . . 215. Comparison of quality of general estimation methods as determined by
the proportional deviation (PD) of the estimated values from measured values . . . . . . . . . . 226. Comparison of quality of conservative estimation methods as determined by
the proportional deviation (PD) of the estimated values from measured values . . . . . . . . . . 247. Summary statistics for final soil-small mammal UFs following inclusion
of validation data . . . . . . . . . . . . . . . . . . . . . . . . . . . . . . . . . . . . . . . . . . . . . . . . . . . . . . . 288. Results of regression of ln whole-body small mammal concentration
on ln soil concentration following inclusion of validation data . . . . . . . . . . . . . . . . . . . . . . 319. Recommended application of bioaccumulation models . . . . . . . . . . . . . . . . . . . . . . . . . . . 35

xi
FIGURES
1. Scatterplot of model and validation data for As (A) and Ba (B) by trophic group . . . . . . . . 132. Scatterplot of model and validation data for Cd (A) and Co (B) by trophic group . . . . . . . 143. Scatterplot of model and validation data for Cr (A) and Cu (B) by trophic group . . . . . . . . 154. Scatterplot of model and validation data for F (A) and Fe (B) by trophic group . . . . . . . . . 165. Scatterplot of model and validation data for Hg (A) and Ni (B) by trophic group . . . . . . . . 176. Scatterplot of model and validation data for Pb (A) and Se (B) by trophic group . . . . . . . . 187. Scatterplot of model and validation data for Zn by trophic group . . . . . . . . . . . . . . . . . . . . 198. Scatterplot of model and validation data for TCDD (A) and TCDF (B) by trophic group . . 20

xiii
ABBREVIATIONS
CEC cation exchange capacityDTPA diethylenetriaminepentaacetic acid GI gastrointestinalPD proportional deviationTCDD tetrachlorodibenzo-p-dioxinTCDF tetrachlorodibenzo-furan UFs uptake factorsUPL upper prediction limit
xv
EXECUTIVE SUMMARY
Whole-body contaminant concentrations in small mammals are needed to evaluate risks topredatory wildlife. Because these data are lacking for most contaminated sites, predators of smallmammals are frequently not considered in ecological risk assessments. While considerable data areavailable concerning chemical concentrations in small mammal tissues in relation to environmentalcontamination, models relating soil concentrations to whole-body concentrations have not beendeveloped. We developed a database of chemical concentrations in soil and whole bodies of smallmammals for 14 inorganic (As, Ba, Cd, Co, Cr, Cu, F, Fe, Hg, Ni, Pb, Se, Tl, and Zn) and 2 organicchemicals [tetrachlorodibenzo-p-dioxin (TCDD) and tetrachlorodibenzo-furan (TCDF)] based on datafrom 20 studies from 4 countries and 8 U.S. states.
Small mammal species were segregated into insectivore, herbivore, and omnivore trophic groupsbased on diet. Uptake factors (UFs)—whole-body concentration/soil concentration and regressionmodels of natural-log-transformed soil and whole-body concentrations— were developed for eachanalyte for all small mammals (e.g., generalized models) and for each trophic group. Models weredeveloped using data from 18 studies and then were applied to data from the remaining two studies forvalidation purposes. Estimated and observed concentrations in small mammals from the validationdataset were compared using nonparametric Wilcoxon signed-rank tests. Relative accuracy and qualityof different estimation methods were evaluated by calculating the proportional deviation (PD)—(measured - estimate)/measured — of the estimate from the measured value and the percentage ofestimates that exceeded measured values.
Insufficient data (n<4) were available in the model dataset to fit regression models for Ba, Co,Fe, and Tl. With the exception of F and Hg, significant general regression models were fit for eachanalyte for which adequate data were available. For Cr, Se, tetrachlorodibenzo-p-dioxin (TCDD), andtetrachlorodibenzo-furan (TCDF), sufficient data were available to fit only one trophic-group- specificmodel; in all cases, this was for omnivores. Data sufficient to fit >1 trophic-group-specific model wereavailable for As, Cd, Cu, Ni, Pb, and Zn. Significant differences among trophic-group models wereobserved for each analyte, except Ni. Data for model validation were available for both herbivores andomnivores for 11 inorganic chemicals (As, Ba, Cd, Co, Cr, Cu, Fe, Ni, Pb, Se, and Zn). No validationdata were available for the insectivore trophic group or for F, Hg, TCDD, or TCDF.
Best (e.g., smallest median and range PD, % overestimates closest to 50%) general estimates weregenerated by regression models for 3 of 9 analytes for herbivores and 7 of 11 analytes for omnivores.Seventy percent (14 of 20) of the best general estimates did not differ significantly from measuredvalues. The 90th percentile UF and the upper 95% prediction interval on the regressions were of equalutility for generating conservative estimates of bioaccumulation in small mammals.

1
1. INTRODUCTION
Whole-body contaminant concentrations in small mammals are needed to evaluate risks topredatory wildlife. In most assessments where risks to predators are a concern, small mammals arecollected from the site and tissue residues determined. In the absence of site-specific data, risks topredators are frequently not considered.
While considerable data are available concerning chemical concentrations in small mammaltissues in relation to environmental contamination (Talmage and Walton 1991), models relatingcontaminant concentrations in soil to whole-body concentrations in small mammals have not beendeveloped. In the only comparable research, Shore (1995) used data from published studies to developmodels to predict concentrations of Cd and Pb in liver and kidneys of small mammals from soilconcentrations. Because these models considered only organ concentrations and not whole-bodyconcentrations, and consumers of small mammals generally consume their prey whole, they are oflimited use in estimating potential exposure to predators of small mammals. However, becausesignificant, linear relationships were identified for Cd and Pb in both liver and kidneys, the potentialutility of predicting tissue concentrations from soil concentrations is indicated.
The purpose of this report was to assemble a database of soil and small mammal contaminantconcentration data from published literature for a wide range of contaminants, develop uptake factors(UFs) and other bioaccumulation models from these data, and then evaluate the accuracy of theestimates using independent data that were not included in the model development. The validation stepallows the reliability of the models to be determined. In this report, both UFs and regression modelswere developed and tested, because, while regression models are most likely to consistently providethe best estimate of small mammal body burdens, the use of UFs is required by some regulatoryagencies. In addition, when no regression model fits the uptake data well, a conservative UF may beemployed in screening assessments to determine if site-specific studies are needed. The modelspresented in this report will facilitate the more accurate estimation of contaminant exposureexperienced by predatory wildlife on the Oak Ridge Reservation (ORR) and at other contaminatedsites. Additional models for estimating contaminant bioaccumulation by sediment biota, plants, andearthworms are presented in Jones et al. (1997), Efroymson et al. (1997), and Sample et al. (1998).

3
2. MATERIALS AND METHODS
2.1 DATABASE DEVELOPMENT
A literature search was performed for studies that reported chemical concentrations in co-locatedsmall mammal and soil samples. Data were restricted to only studies that reported whole-body orcarcass (whole body minus selected organs or other tissues) concentrations. To ensure relevancy ofUFs and models to field situations, only field studies in which resident small mammals were collectedwere considered. All small mammal tissue burdens were therefore assumed to be at equilibrium withsoil concentrations.
To ensure comparability of data, only “total” chemical analyses of both soil and small mammals(i.e., resulting from extractions of metals using concentrated acids) were included. Data resulting fromdiethylenetriaminepentaacetic acid (DTPA), acetic acid, and other mild extraction methods wereexcluded. The mean (or composite) chemical concentration in soil and small mammals reported foreach sampling location evaluated in each study was considered an observation. If data for multiplesmall mammal species were reported at a site, each was considered a separate observation. Soil andsmall mammal data in the database were reported as mg/kg dry weight. If studies reported smallmammal concentrations in terms of wet weight, dry weight concentrations were estimated assuminga 68% water content (EPA 1993). Data concerning soil characteristics [e.g., soil pH, % organicmatter, cation exchange capacity (CEC), soil texture, etc.] were rarely reported and therefore do notappear in the database.
Because chemical uptake was expected to vary according to small mammal diet preferences, eachspecies was assigned to one of the three trophic groups: insectivore (diet consisting primarily ofinsects and other invertebrates), herbivore (diet consisting primarily of plant material), and omnivore(diet consisting of both animal and plant material). A summary of the small mammal species includedin the database and the trophic groups to which they were assigned is presented in Table 1.
To validate the models developed from the literature-derived data, soil and small mammal datacollected as part of Comprehensive Environmental Response, Compensation, and Liability Act(CERCLA) remedial investigations at sites in Oklahoma (PTI 1995) and Montana (LaTier et al. 1995)were acquired as a validation dataset. Small mammal species in this validation dataset, however,represented only the herbivore and omnivore trophic groups. Validation data for insectivores wereunavailable. Summaries of the analytical methods, data presented, and assumptions made for eachstudy included in the database are presented in Appendix A. The small mammal bioaccumulationdatabase is presented in Appendix B.
Table 1. Summary of small mammal species and trophicgroups included in bioaccumulation database
Species Trophic Group
Blarina brevicauda Insectivore
Cryptotis parva Insectivore
Parascalops breweri Insectivore
Sorex araneus Insectivore

Table 1 (continued)
4
Species Trophic Group
Sorex cinereus Insectivore
Sorex minutus Insectivore
Apodemus sylvaticus Herbivore
Clethrionomys glareolus Herbivore
Microtus agrestis Herbivore
Microtus arvalis Herbivore
Microtus pennsylvanicus Herbivore
Microtus pinetorum Herbivore
Oryzomys palustris Herbivore
Sigmodon hispidus Herbivore
Glaucomys volans Omnivore
Mus musculus Omnivore
Peromyscus leucopus Omnivore
Peromyscus maniculatus Omnivore
Reithrodontomys spp. Omnivore
Rattus norvegicus Omnivore
Zapus hudsonius Omnivore
2.2. MODEL DEVELOPMENT AND VALIDATION
UFs— contaminant concentration in small mammals/contaminant concentration in soil— werecalculated for each observation and analyte in the literature-derived bioaccumulation dataset. Summarystatistics were generated for each UF by analyte for all small mammals combined (i.e., general smallmammal UF) and for each trophic group. The Shapiro-Wilk test (PROC UNIVARIATE; SAS Inst.Inc. 1988a) was applied to the untransformed and natural-log transformed UFs for each analyte todetermine if the distribution of the UFs was normal or log-normal, respectively.
To evaluate the relationship between the contaminant concentration in soil and that in wholebodies of small mammals, simple linear regressions were performed using SAS PROC REG (SASInst. Inc. 1988b) for each analyte/trophic group combination with n$4. Contaminant concentrationsin both soil and small mammals were natural-log transformed prior to regression analyses. Becausedata concerning the number of individuals included in composites or means were not available for allobservations, no weighting of observations was applied. Simple linear regression models of ln-smallmammal concentration on ln-soil concentration were developed for each analyte for all speciescombined (i.e., general small mammal model) and for each trophic group. Regressions of the log-transformed data correspond to a non-linear model, the power model. That is, the untransformedrelationship of concentrations in small mammals (y) to that in soil (x) is y = a(x)b.
UFs and regression models were applied to the soil concentration data from the validation studies,and estimated contaminant concentrations in small mammals were generated. To evaluate the

5
appropriateness and accuracy of various methods for calculating general estimates, estimates weregenerated using the median UFs and simple regression models based on all the data (e.g, the generalmodel) or only on trophic-level-specific data. Because conservative estimates are needed for somepurposes (e.g., screening assessments), estimates were also generated using the 90th percentile UF andthe upper 95% prediction limit (95% UPL) for the simple regression model for the general and trophic-level-specific data. The 95% UPL was calculated according to Dowdy and Wearden (1983).
For each analyte and estimation method (i.e., UF or model, general or trophic-level-specific),differences between estimated and measured concentrations in small mammals from the validationdataset were evaluated using Wilcoxon signed-rank tests (PROC UNIVARIATE; SAS Inst. Inc.1988a). Differences were considered significant if p(H0=0)#0.05. Relative accuracy and quality ofdifferent estimation methods were evaluated by calculating the proportional deviation (PD) of theestimate from the measured value:
PD = (Mi - Ei) / Mi
wherePD = proportional deviationMi = measured concentration for chemical in small mammal at soil concentration (I)Ei = estimated concentration for chemical in small mammal at soil concentration (I)
Negative values for PD indicate overestimation while positive PD values indicate underestimation. Thepercentage of estimated values that exceeded their corresponding measured value was also tabulatedfor each chemical and estimation method. Relative quality of general estimation methods was evaluatedby the following criteria:
1. median PD closest to 0 (indicates estimates center around measured values);2. PD with narrowest range (indicates relative accuracy of method); 3. percentage overestimation closest to 50% (indicates estimates center around measured
values);4. difference between estimated and measured values not significantly different as determined
by Wilcoxon signed-rank tests.
Relative quality of conservative estimation methods was evaluated by
1. smallest, negative median PD value (indicates method overestimates while to minimizing thedegree of overestimation);
2. PD with narrowest range (to minimize the degree of overestimation);
In addition to evaluation of PD values, a graphical evaluation was performed by plotting measured andestimated concentrations in earthworms vs. the corresponding measured soil concentration.
Comparisons of trophic-level-specific linear regression models were performed for each analyteusing the F-test procedure for comparing regression lines outlined in Draper and Smith (1981). If F-test results were significant (p#0.05), pair-wise Z-tests (Dowdy and Wearden 1983) for differencesin slopes and intercepts between trophic groups were performed. Differences were consideredsignificant if p#0.05.
Both general and trophic-level-specific linear regression models were also developed for thenatural-log transformed small mammal and soil data from the validation studies. These models were

6
compared to the corresponding models developed from the literature-derived bioaccumulation datasetusing F-tests (Draper and Smith 1981). Differences were considered significant if p#0.05.
Following these validation analyses, all data were pooled, and UFs and regression models wererecalculated. These results were reported as the final UF or model.
Data for additional analytes were present in the validation studies that were unrepresented in theliterature-derived dataset. UFs were generated and summary statistics and distributions weredetermined for these analytes. Because these data represented few locations, regression models werenot fit to these data. These data are presented in Appendix C.

7
3. RESULTS
3.1 MODELING RESULTS
A total of 20 studies were identified that contained data suitable for inclusion in the smallmammal bioaccumulation database (Appendix A). These studies represented four countries andeight U.S. states.
General UFs were developed for 14 inorganic and 2 organic chemicals (Table 2). Fewer data wereavailable for trophic-group-specific UFs. For most analytes for which sufficient observations wereavailable, the distribution of UFs was best described by a log-normal distribution. With fewexceptions, median UFs were <1 for all chemicals and all groups, indicating no bioconcentration(Table 2). Exceptions included the general UF for tetrachlorodibenzo-p-dioxin (TCDD), the insectivoreUF for Cd, and the omnivore UF for Zn. [Note: the mean and standard deviation of the natural-log-transformed UFs are presented as parameters for describing the UF distributions for those analytesbest fit by a log-normal distribution. While the untransformed UFs are best fit by a log-normaldistribution, the natural-log-transformed UFs are normally distributed. These parameters may be usedin two ways. They may be applied to normal distribution functions in Monte Carlo simulationsoftware; however, the output from the sampling from this distribution must be back-transformed (i.e.,ey, where y=sampling result). Alternatively, they may be incorporated directly into appropriatelognormal functions such as the LOGNORM2 function in the @RISK Monte Carlo simulationsoftware (Palisades Corp. 1994b). Use of the LOGNORM2 function requires no back-transformation.Comparable results are obtained using either approach.]
Data sufficient for regression analyses (i.e., n$4) were available for 12 chemicals (Table 3).General models (i.e., models that included data for 2 or more trophic groups) were generated for 11chemicals. Significant, general model fits were obtained for all analytes except F and Hg (Table 3).Slopes for all significant, general regression models were positive (Table 3; Figs. 1–8). Intercepts didnot differ significantly from 0 for Cd, Ni, Pb, or TCDD; in all other general models, interceptsdiffering from 0 were observed (Table 3). r2 values for the significant, general regression modelsranged from 0.2 (Cu) to 0.92 (TCDD).
For Cr, Hg, Se, TCDD, and TCDF, sufficient data were available to fit only one trophic-group-specific model; in all cases, this was for omnivores. In general, the omnivore model was very similarto the general model (Figs. 3a, 6b, and 8a); however, significant fits were obtained only for Cr andSe (Table 3).
Data sufficient to fit >1 trophic-group-specific model were available for As, Cd, Cu, Ni, Pb, andZn. F-test results indicated significant differences (p<0.001) among trophic-group models for eachanalyte, except Ni (p=0.54; Fig. 5b). While significant model fits for As were obtained for bothherbivores and omnivores (Table 3), intercepts and slopes for these models differed significantly(p<0.05; Fig. 1a). For Cd and Zn, significant model fits were obtained for all three trophic groups.While slopes of the insectivore and herbivore models differed significantly for both chemicals (p<0.05), slopes for insectivore and omnivore, and omnivore and herbivore did not (Table 3, Figs. 2a and 7).Intercepts differed significantly among all three models for Cd while only among herbivores andomnivores for Zn. A significant trophic-group regression model for Cu was obtained only forinsectivores; no linear relationship was observed for either herbivores or omnivores

8
Table 2. Summary statistics for literature-derived soil-small mammal UFs
AnalyteTrophicGroup
N(Studies)
N(Observations) Mean
StandardDeviation Minimum Median
90thPercentile Maximum
Mean ofNatural
Log-transformed
values
StandardDeviation of
NaturalLog-
transformedvalues Distribution
As General 4 46 0.0060 0.0061 0.0003 0.0038 0.0154 0.0217 -5.7047 1.19868 lognormal
Ba General 1 2 0.0168 0.0024 0.0144 0.0168 0.0187 0.0192 uniform
Cd General 7 73 2.6492 8.3023 0.0166 0.7568 4.0933 69.5606 -0.40852 1.66803 lognormal
Co General 1 3 0.1089 0.0548 0.0466 0.1000 0.1640 0.1800 normal
Cr General 2 26 0.1285 0.1877 0.0314 0.0605 0.2284 0.8000 -2.53972 0.83081 lognormala
Cu General 6 50 0.5482 0.4134 0.0044 0.5999 1.1123 1.3978 -1.22629 1.47424 lognormala
F General 1 4 0.1200 0.1470 0.0021 0.0579 0.2875 0.3620 normal
Fe General 1 3 0.0186 0.0091 0.0105 0.0141 0.0278 0.0313 normal
Hg General 1 18 0.1244 0.2277 0.0183 0.0543 0.1484 1.0457 -2.70075 0.94709 lognormal
Ni General 3 31 0.3655 0.2606 0.0213 0.3524 0.6750 1.1429 -1.37501 1.02531 lognormala
Pb General 11 112 0.1920 0.3154 0.0031 0.1233 0.3032 2.6585 -2.27519 1.2067 lognormal
Se General 2 24 0.3584 0.3330 0.0346 0.2107 0.7648 1.2632 -1.42642 0.93924 lognormal
TCDD General 2 5 1.0552 0.6199 0.3680 1.0323 1.7714 2.0952 normal
TCDF General 1 4 0.1214 0.0293 0.0804 0.1229 0.1522 0.1594 normal
Tl General 1 2 0.1124 0.0104 0.1020 0.1124 0.1207 0.1227 -2.19019 0.13067
Zn General 8 77 1.5149 2.2003 0.0051 0.8984 2.7255 16.3636 -0.39458 1.56089 lognormal
As Insectivore 1 1 0.0013
Cd Insectivore 5 38 4.8127 11.0702 0.2086 2.1050 6.8860 69.5606 0.79402 1.11395 lognormal
Cr Insectivore 2 2 0.0815 0.0140 0.0675 0.0815 0.0927 0.0955 uniform
Cu Insectivore 4 30 0.6857 0.3549 0.0121 0.7714 1.1123 1.1758 -0.6897 1.05494 lognormala

9
Table 2 (continued)
AnalyteTrophicGroup
N(Studies)
N(Observations) Mean
StandardDeviation Minimum Median
90thPercentile Maximum
Mean ofNatural
Log-transformed
values
StandardDeviation of
NaturalLog-
transformedvalues Distribution
F Insectivore 1 2 0.1821 0.1800 0.0021 0.1821 0.3261 0.3620 uniform
Hg Insectivore 1 1 1.0457
Ni Insectivore 2 9 0.3487 0.1347 0.0667 0.3643 0.4722 0.5782 normal
Pb Insectivore 9 54 0.2541 0.4140 0.0042 0.1601 0.3319 2.6585 -1.91202 1.03533 lognormala
Se Insectivore 2 2 0.7241 0.0892 0.6349 0.7241 0.7955 0.8133 uniform
Zn Insectivore 5 37 1.4672 1.6063 0.0894 0.8328 2.7563 6.9610 -0.14855 1.11972 lognormal
As Herbivore 3 23 0.0046 0.0056 0.0003 0.0020 0.0130 0.0194 -5.21855 0.94223 lognormal
Cd Herbivore 4 21 0.2507 0.2402 0.0166 0.2059 0.3871 1.0000 -1.85937 1.09428 lognormal
Co Herbivore 1 3 0.1089 0.0548 0.0466 0.1000 0.1640 0.1800 normal
Cr Herbivore 2 2 0.0774 0.0461 0.0314 0.0774 0.1143 0.1235 uniform
Cu Herbivore 4 11 0.3389 0.4914 0.0044 0.0525 1.2903 1.3978 -2.44521 1.93173 lognormal
F Herbivore 1 2 0.0579 0.0557 0.0021 0.0579 0.1024 0.1136 uniform
Fe Herbivore 1 3 0.0186 0.0091 0.0105 0.0141 0.0278 0.0313 normal
Hg Herbivore 1 1 0.0239
Ni Herbivore 3 8 0.4666 0.3827 0.0307 0.3924 0.9716 1.1429 -1.3282 1.33763 lognormala
Pb Herbivore 9 33 0.0864 0.0780 0.0031 0.0750 0.1967 0.2867 -3.04376 1.30969 lognormala
Se Herbivore 1 1 0.1550
TCDD Herbivore 1 1 1.2857
Zn Herbivore 6 23 1.6527 3.3311 0.0051 0.8984 2.4829 16.3636 -0.98103 2.16623 lognormal

10
Table 2 (continued)
AnalyteTrophicGroup
N(Studies)
N(Observations) Mean
StandardDeviation Minimum Median
90thPercentile Maximum
Mean ofNatural
Log-transformed
values
StandardDeviation of
NaturalLog-
transformedvalues Distribution
As Omnivore 3 22 0.0078 0.0061 0.0007 0.0062 0.0159 0.0217 -6.12951 1.27579 lognormal
Cd Omnivore 4 14 0.3745 0.4241 0.0321 0.2583 0.7200 1.7053 -1.4963 1.06492 lognormal
Cr Omnivore 2 22 0.1374 0.2023 0.0323 0.0563 0.3105 0.8000 -2.51976 0.87656 lognormala
Cu Omnivore 3 9 0.3455 0.2767 0.0200 0.2113 0.7147 0.8667 -1.52513 1.17905 lognormala
Hg Omnivore 1 16 0.0731 0.0450 0.0183 0.0543 0.1225 0.1920 -2.8078 0.65634 lognormal
Ni Omnivore 2 14 0.3186 0.2164 0.0213 0.3418 0.5518 0.8000 normal
Pb Omnivore 6 25 0.1974 0.2108 0.0149 0.1274 0.3763 0.9949 -2.04511 0.95721 lognormal
Se Omnivore 2 21 0.3333 0.3326 0.0346 0.2082 0.6515 1.2632 -1.50996 0.93593 lognormala
TCDD Omnivore 1 4 0.9976 0.6810 0.3680 0.7636 1.7763 2.0952 normal
TCDF Omnivore 1 4 0.1214 0.0293 0.0804 0.1229 0.1522 0.1594 normal
Tl Omnivore 1 2 0.1124 0.0104 0.1020 0.1124 0.1207 0.1227 -2.19019 0.13067
Zn Omnivore 4 17 1.4323 1.1236 0.0483 1.2027 2.7255 4.2967 normal
a Data not fit well by either normal or lognormal distributions, however, closest fit provided by lognormal.

11
Table 3. Results of regression of ln whole-body small mammal on ln soil
Analyte Group N B0±SE B1±SE r2 P model fit
As General 46 -4.5480±0.4627c 0.6725±0.1223c 0.41 0.0001
As Herbivore 22 -5.6531±0.5333c 1.1382±0.1570c 0.72 0.0001
As Omnivore 23 -3.8362±0.6428c 0.4031±0.1581a 0.23 0.019
Cd General 73 -0.1811±0.2082NS 0.6409±0.1406c 0.23 0.0001
Cd Insectivore 38 0.8150±0.2031c 0.9638±0.1516c 0.53 0.0001
Cd Herbivore 21 -1.2112±0.1746c 0.4075±0.0950c 0.49 0.0004
Cd Omnivore 14 -1.4557±0.2482c 0.5380±0.2030a 0.37 0.02
Cr General 26 -1.7457±0.5454b 0.7670±0.1531c 0.51 0.0001
Cr Omnivore 22 -1.6518±0.6963a 0.7380±0.2027b 0.40 0.0016
Cu General 50 2.3393±0.0969c 0.0793±0.0232c 0.20 0.0013
Cu Insectivore 30 2.1042±0.0550c 0.1783±0.0152c 0.83 0.0001
Cu Herbivore 11 2.4311±0.2611c 0.0296±0.0487NS 0.04 0.56
Cu Omnivore 9 1.9400±0.3359b 0.1422±0.0794NS 0.31 0.11
F General 4 1.7549±0.7730NS 0.3129±0.0875NS 0.86 0.07
Hg General 18 -4.8666±1.7959a -2.2764±2.6962NS 0.04 0.41
Hg Omnivore 16 -4.0341±1.4366a -0.8965±2.2069NS 0.01 0.69
Ni General 31 -0.2553±0.2104NS 0.4830±0.0799c 0.56 0.0001
Ni Insectivore 9 -0.4266±0.1505a 0.5444±0.0738c 0.89 0.0002
Ni Herbivore 8 0.3519±0.3781NS 0.3741±0.1166a 0.63 0.018
Ni Omnivore 14 -0.4354±0.4343NS 0.5035±0.1680a 0.43 0.01
Pb General 112 0.3420±0.1995NS 0.4518±0.0392c 0.55 0.0001
Pb Insectivore 54 0.4819±0.3099NS 0.4869±0.0633c 0.53 0.0001
Pb Herbivore 33 -0.1228±0.2547NS 0.4696±0.0429c 0.79 0.0001
Pb Omnivore 25 0.1155±0.5913NS 0.4655±0.1413b 0.32 0.0032
Se General 24 -0.5827±0.2479a 0.4420±0.1326b 0.34 0.003
Se Omnivore 21 -0.6392±0.2830a 0.4618±0.1446b 0.35 0.005

Table 3 (continued)
12
Analyte Group N B0±SE B1±SE r2 P model fit
TCDD General 5 0.8113±1.8493NS 1.0993±0.1852b 0.92 0.0096
TCDD Omnivore 4 0.7044±12.7713NS 1.0894±1.1826NS 0.29 0.45
TCDF Omnivore 4 3.8673±11.4833NS 1.6191±1.1794NS 0.49 0.31
Zn General 77 4.3843±0.0902c 0.0786±0.0166c 0.23 0.0001
Zn Insectivore 37 4.2479±0.1191c 0.1324±0.0228c 0.49 0.0001
Zn Herbivore 23 4.4459±0.1080c 0.0502±0.0176b 0.28 0.0096
Zn Omnivore 17 4.1220±0.2235c 0.1001±0.0455a 0.24 0.04
model: ln(whole body)=B0+B1(ln[soil])
NS Not Significant: p>0.05. a p<0.05. b p<0.01. c p<0.001.
(Table 3, Fig. 3b). Despite obtaining a significant F-test value for Pb (p=0.0003) indicating significantdifferences among trophic-group regression models, pair-wise Z-test comparisons indicated nodifferences between slopes or intercepts for any group (p>0.05 for all tests). Visual comparison of theslopes and intercepts (Table 3, Fig. 6a) supports the similarity of models among trophic groups.
3.2 VALIDATION RESULTS
Data for model validation were available for both herbivores and omnivores for 11 inorganicchemicals (As, Ba, Cd, Co, Cr, Cu, Fe, Ni, Pb, Se, and Zn). No validation data were available for theinsectivore trophic group or for F, Hg, TCDD, or TCDF.
General regression models fit to the validation data differed significantly from those fit to themodel dataset for all analytes except Ni (Table 4). F-tests indicated no significant differences amongtrophic-level-specific models fit to validation data and those fit to the model data for 8 of 13comparisons; both herbivores and omnivores for Cd and Cr; omnivores only for Cu, Ni, and Se, andherbivores only for Zn (Table 4). Significant differences between model and validation regressionswere observed for As and Zn among omnivores, for Cu among herbivores, and for Pb among bothherbivores and omnivores (Table 4).
Arsenic was not detected in any sample of herbivores from the validation dataset. Consequently,all general and conservative estimation methods significantly overestimated As in herbivores (Tables5 and 6). Because the concentrations of As in herbivores from the validation dataset are undefined, theaccuracy of the various estimation methods cannot be determined, and therefore the models cannot bevalidated.
Among general estimation methods for As in omnivores, the median general UF generated the bestestimates. While the range of PDs for the median general UF was larger than that for the other threeestimation methods, the median general UF generated estimates that did not significantly differ

13
A
1 10 100 1000
Wh
ole
bo
dy
con
cen
trat
ion
(m
g/k
g d
ry w
t.)
0.001
0.01
0.1
1
10
95% Prediction intervalGeneral model
Insectivore: ModelHerbivore: ModelOmnivore: ModelHerbivore: ValidationOmnivore: Validation
B
Concentration in soil (mg/kg dry wt.)
80 100 120 140 160 180 200 220 240
Wh
ole
bo
dy
con
cen
trat
ion
(m
g/k
g d
ry w
t.)
0
5
10
15
20
25
30
General Model
Herbivore Model
Omnivore Model
Fig. 1. Scatterplot of model and validation data for As (A) and Ba (B) by trophic group. Lines representsimple linear regression models of natural-log-transformed data from the model dataset for each trophic groupand for all groups combined (e.g., General model). Only models for which significant fits were obtained arepresented. Dotted lines represent 95% prediction interval for General model. Regression lines not presentedfor Ba (B) due to insufficient number of observations.

14
B
Concentration in soil (mg/kg dry wt.)
0 10 20 30 40 50 60
Wh
ole
bo
dy
con
cen
trat
ion
(m
g/k
g d
ry w
t.)
0
1
2
3
95% Prediction intervalGeneral model
Insectivore: ModelHerbivore: ModelOmnivore: ModelHerbivore: ValidationOmnivore: Validation
A
0.1 1 10 100
Wh
ole
bo
dy
con
cen
trat
ion
(m
g/k
g d
ry w
t.)
0.01
0.1
1
10
100
1000
General Model
Herbivore Model
Omnivore Model
Insectivore Model
Fig. 2. Scatterplot of model and validation data for Cd (A) and Co (B) by trophic group. Lines representsimple linear regression models of natural-log-transformed data from the model dataset for each trophic groupand for all groups combined (e.g., General model). Only models for which significant fits were obtained arepresented. Dotted lines represent 95% prediction interval for General model. Regression lines not presentedfor Co (B) due to insufficient number of observations.

15
A
10 100 1000
Wh
ole
bo
dy
con
cen
trat
ion
(m
g/k
g d
ry w
t.)
0.1
1
10
100
95% Prediction intervalGeneral model
Insectivore: ModelHerbivore: ModelOmnivore: ModelHerbivore: ValidationOmnivore: Validation
General ModelOmnivore Model
B
Concentration in soil (mg/kg dry wt.)
10 100 1000 10000
Wh
ole
bo
dy
con
cen
trat
ion
(m
g/k
g d
ry w
t.)
10
100
General Model
Insectivore Model
Fig. 3. Scatterplot of model and validation data for Cr (A) and Cu (B) by trophic group. Lines representsimple linear regression models of natural-log-transformed data from the model dataset for each trophic groupand for all groups combined (e.g., General model). Only models for which significant fits were obtained arepresented. Dotted lines represent 95% prediction interval for General model.

16
A
Concentration in soil (mg/kg dry wt.)
100x100 1x10³ 10x103 100x103
Wh
ole
bo
dy
con
cen
trat
ion
(m
g/k
g d
ry w
t.)
10
100
95% Prediction intervalGeneral model
Insectivore: ModelHerbivore: ModelOmnivore: ModelHerbivore: ValidationOmnivore: Validation
General Model
B
Concentration in soil (mg/kg dry wt.)
0 20x103 40x103 60x103 80x103 100x103 120x103
Wh
ole
bo
dy
con
cen
trat
ion
(m
g/k
g d
ry w
t.)
0
200
400
600
800
1000
1200
Fig. 4. Scatterplot of model and validation data for F (A) and Fe (B) by trophic group. Lines representsimple linear regression models of natural-log-transformed data from the model dataset for each trophic groupand for all groups combined (e.g., General model). Only models for which significant fits were obtained arepresented. Dotted lines represent 95% prediction interval for General model. Regression lines not presentedfor Fe (B) due to insufficient number of observations.

17
A
0.44 0.46 0.48 0.50 0.52 0.54 0.56
Wh
ole
bo
dy
con
cen
trat
ion
(m
g/k
g d
ry w
t.)
0.0
0.1
0.2
0.3
0.4
0.5
0.6
95% Prediction intervalGeneral model
Insectivore: ModelHerbivore: ModelOmnivore: ModelHerbivore: ValidationOmnivore: Validation
B
Concentration in soil (mg/kg dry wt.)
1 10 100 1000
Wh
ole
bo
dy
con
cen
trat
ion
(m
g/k
g d
ry w
t.)
0.1
1
10
100
General Model
Herbivore Model
Omnivore Model
Insectivore Model
Fig. 5. Scatterplot of model and validation data for Hg (A) and Ni (B) by trophic group. Lines representsimple linear regression models of natural-log-transformed data from the model dataset for each trophic groupand for all groups combined (e.g., General model). Only models for which significant fits were obtained arepresented. Dotted lines represent 95% prediction interval for General model. Regression lines not presentedfor Hg (A) due to lack of significant model fit.

18
B
Concentration in soil (mg/kg dry wt.)
0.1 1 10
Wh
ole
bo
dy
con
cen
trat
ion
(m
g/k
g d
ry w
t.)
0.1
1
10
A
10 100 1000 10000
Wh
ole
bo
dy
con
cen
trat
ion
(m
g/k
g d
ry w
t.)
0.1
1
10
100
1000
95% Prediction intervalGeneral model
Insectivore: ModelHerbivore: ModelOmnivore: ModelHerbivore: ValidationOmnivore: Validation
General Model
Herbivore Model
Omnivore Model
Insectivore Model
Omnivore Model
General Model
Fig. 6. Scatterplot of model and validation data for Pb (A) and Se (B) by trophic group. Lines representsimple linear regression models of natural-log-transformed data from the model dataset for each trophic groupand for all groups combined (e.g., General model). Only models for which significant fits were obtained arepresented. Dotted lines represent 95% prediction interval for General model.

19
Concentration in soil (mg/kg dry wt.)
10x100 100x100 1x10³ 10x103 100x103
Wh
ole
bo
dy
con
cen
trat
ion
(m
g/k
g d
ry w
t.)
100
1000
General Model
Herbivore Model
Omnivore Model
Insectivore Model
95% Prediction intervalGeneral model
Insectivore: ModelHerbivore: ModelOmnivore: ModelHerbivore: ValidationOmnivore: Validation
Fig. 7. Scatterplot of model and validation data for Zn by trophic group. Lines represent simple linearregression models of natural-log-transformed data from the model dataset for each trophic group and for allgroups combined (e.g., General model). Only models for which significant fits were obtained are presented.Dotted lines represent 95% prediction interval for General model.

20
A
Concentration in soil (mg/kg dry wt.)
10x10-6 100x10-6 1x10⁻³ 10x10-3
Wh
ole
bo
dy
con
cen
trat
ion
(m
g/k
g d
ry w
t.)
1x10⁻⁶
10x10-6
100x10-6
1x10⁻³
10x10-3
100x10-3
95% Prediction intervalGeneral model
Insectivore: ModelHerbivore: ModelOmnivore: ModelHerbivore: ValidationOmnivore: Validation
General Model
B
Concentration in soil (mg/kg dry wt.)
0 20x10-6 40x10-6 60x10-6 80x10-6
Wh
ole
bo
dy
con
cen
trat
ion
(m
g/k
g d
ry w
t.)
0
2x10⁻⁶
4x10⁻⁶
6x10⁻⁶
8x10⁻⁶
10x10-6
12x10-6
Fig. 8. Scatterplot of model and validation data for TCDD (A) and TCDF (B) by trophic group. Linesrepresent simple linear regression models of natural-log-transformed data from the model dataset for eachtrophic group and for all groups combined (e.g., General model). Only models for which significant fits wereobtained are presented. Dotted lines represent 95% prediction interval for General model. Regression linesnot presented for TCDF (B) due to lack of significant model fit.

21
from measured values, produced the lowest median PD values, and the percentage of overestimatesthat was closest to 50% (Table 5). For conservative estimation of As in omnivores, while the 95%UPL of the trophic-group regression produced the smallest median and range of PD values andgenerated estimates that did not significantly differ from measured values, the percent overestimationwas only 58% (Table 6). Because the 90th percentile trophic-group UF generated the narrowest rangeof PD values and the highest percent of overestimates (tied with the 90th percentile general UF), thebest conservative estimates were generated by this method (Table 6).
Table 4. Results of F-tests comparing regression models based onvalidation data and literature-derived dataset
AnalyteModels
Compared df F p
As General 2,56 4.854 0.01
Cd General 2,95 9.426 0.0002
Cr General 2,34 3.479 0.04
Cu General 2,72 9.952 0.0002
Ni General 2,32 0.462 0.63
Pb General 2,134 54.98 <0.0001
Zn General 2,99 12.39 <0.0001
Cd Herbivore 2,24 0.569 0.57
Cr Herbivore 2,5 1.237 0.37
Cu Herbivore 2,14 10.11 0.002
Pb Herbivore 2,36 15.74 <0.0001
Zn Herbivore 2,26 0.312 0.06
As Omnivore 2,33 10.5 0.0003
Cd Omnivore 2,29 0.276 0.76
Cr Omnivore 2,23 2.307 0.12
Cu Omnivore 2,24 0.714 0.5
Ni Omnivore 2,14 0.127 0.88
Se Omnivore 2,20 1.231 0.31
Pb Omnivore 2,40 17.99 <0.0001
Zn Omnivore 2,32 15.08 <0.0001
Ba in both herbivores and omnivores was underestimated by all methods; for herbivores, alldifferences were significant, while for omnivores, no differences were significant (Tables 5 and 6).Estimates generated by both general and trophic group UFs were comparable (Tables 5 and 6).
Trophic-group regression models generated the best general estimates of Cd in both herbivoresand omnivores (Table 5). Estimates from these regression models did not significantly differ from

Table 5. Comparison of quality of general estimation methods as determined by the proportional deviation (PD)of the estimated values from measured values
PD = (measured-estimate)/measured. Negative PD values indicate overestimates while positive PD values indicate underestimates.
Median UF: General Median UF: Trophic Group Regression :General Regression: Trophic Group
Analyte TrophicGroup
N Median PD (range)
% OverEstimated
Median PD (range)
% OverEstimated
Median PD (range)
% OverEstimated
Median PD (range)
% OverEstimate
d
As Herbivore 7 d . . .a 100 . . .a 100 . . .a 100 . . .a 100
As Omnivore 19 d 0.35 NS
(-1.94 to 0.95)47 0.66b
(-0.53 to 0.97)37 0.72b
(-0.75 to 0.96)37 0.85 b
(-0.30 to 0.97)32
Ba Herbivore 7 0.74 a
(0.65 to 0.93)0 0.70a
(0.60 to 0.92)0
Ba Omnivore 5 0.67 NS
(0.51 to 0.76)0 0.72 NS
(0.58 to 0.79)0
Cd Herbivore 7 -6.95 a
(-48.53 to -0.69)100 -1.16NS
(-12.48 to 0.54)86 -3.02 a
(-8.17 to -0.70)100 0.33NS
(-1.68 to 0.54)43
Cd Omnivore 19 -6.33c
(-26.10 to -0.10)100 -1.50 c
(-8.25 to 0.62)89 -3.17 c
(-11.59 to -0.83)100 0.04 NS
(-1.75 to 0.60)47
Co Herbivore 7 -4.41a
(-6.45 to -1.60)100 -4.41a
(-6.45 to -1.60)100
Co Omnivore 5 -5.34NS
(-8.93 to -3.00)100
Cr Herbivore 7 0.32a
(0.08 to 0.80)0 0.12 NS
(-0.17 to 0.75)14
Cr Omnivore 5 0.65NS
(0.13 to 0.83)0 0.68 NS
(0.19 to 0.84)0 0.53 NS
(-0.04 to 0.76)20 0.53 NS
(-0.02 to 0.76)20
Cu Herbivore 7 -3.26a
(-15.61 to 0.20)86 0.63NS
(-0.45 to 0.93)29 -1.10a
(-1.41 to -0.33)100
Cu Omnivore 19 -5.72c
(-72.55 to -0.08)100 -1.37b
(-24.90 to 0.62)84 -0.12 NS
(-0.52 to 0.78)63
Fe Herbivore 7 -0.15NS
(-0.40 to 0.17)71 -0.15 NS
(-0.40 to 0.17)71
Fe Omnivore 5 -0.13NS
(-0.50 to 0.04)60
22

Table 5 (cont.)
Median UF: General Median UF: Trophic Group Regression :General Regression: Trophic Group
Analyte TrophicGroup
N Median PD (range)
% OverEstimated
Median PD (range)
% OverEstimated
Median PD (range)
% OverEstimated
Median PD (range)
% OverEstimate
d
Ni Herbivore 7 d -0.42a
(-0.42 to -0.42)100 -0.58 a
(-0.58 to -0.58)100 0.09 a
(0.09 to 0.09)86 -0.28 a
(-0.28 to -0.28)100
Ni Omnivore 5 d -2.58NS
(-3.54 to -1.09)100 -2.48 NS
(-3.41 to -1.03)100 -0.39 NS
(-0.76 to 0.03)80 -0.24 NS
(-0.57 to 0.14)80
Pb Herbivore 7 -6.77a
(-12.99 to -0.62)100 -3.73 a
(-7.51 to 0.02)86 -5.58 a
(-16.27 to -0.63)100 -3.45a
(-10.55 to -0.11)100
Pb Omnivore 19 -8.03c
(-34.14 to 0.31)95 -8.32c
(-35.29 to 0.29)95 -2.98 c
(-23.67 to -1.31)100 -2.39 c
(-19.64 to -0.95)100
Se Herbivore 6 d . . .a 100 . . .a 100 . . .a 100
Se Omnivore 5 d 0.87NS
(-0.35 to 0.88)60 0.87 NS
(-0.33 to 0.88)60 0.55 NS
(0.31 to 0.56)40 0.58 NS
(0.31 to 0.59)40
Zn Herbivore 7 -9.11a
(-45.01 to -0.60)100 -9.11a
(-45.01 to -0.60)100 -0.05 NS
(-0.37 to 0.46)57 0.09NS
(-0.25 to 0.55)29
Zn Omnivore 19 -2.29b
(-49.32 to 0.85)68 -3.41 b
(-66.37 to 0.79)74 0.23 a
(-0.43 to 0.76)32 0.31 b
(-0.30 to 0.80)21
NS Estimate not significantly different from measured as determined by Wilcoxon signed-rank test.a Estimate significantly different from measured as determined by Wilcoxon signed-rank test; p <0.05.b Estimate significantly different from measured as determined by Wilcoxon signed-rank test; p<0.01.c Estimate significantly different from measured as determined by Wilcoxon signed-rank test; p<0.001.d Analyte below detection limits for some observations in validation dataset. PD values could therefore not be calculated for these observations. Number of nondetects by analyte
and trophic group were: As in herbivores: 7; As in omnivores: 5; Ni in herbivores: 6; Ni in omnivores: 1; Se in herbivores: 6; and Se in omnivores: 2.
23

Table 6. Comparison of quality of conservative estimation methods as determined by the proportional deviation (PD)of the estimated values from measured values
PD = (measured-estimate)/measured. Negative PD values indicate overestimates while positive PD values indicate underestimates.
90th Percentile UF: General 90th Percentile UF: TrophicGroup
Regression :General95% UPL
Regression: Trophic Group95% UPL
Analyte TrophicGroup
N Median PD (range)
% OverEstimated
Median PD (range)
% OverEstimated
Median PD (range)
% OverEstimated
Median PD (range)
% OverEstimated
As Herbivore 7d . . .a 100 . . .a 100 . . .a 100 . . .a 100
As Omnivore 19d -1.77 b
(-11.44 to 0.77)89 -1.42 a
(-9.88 to 0.80)89 -0.90a
(-10.80 to 0.74)84 0.12 NS
(-6.65 to 0.85)58
Ba Herbivore 7 0.70 a
(0.60 to 0.92)0 0.70 a
(0.60 to 0.92)0
Ba Omnivore 5 0.63 NS
(0.44 to 0.72)0 0.72 NS
(0.58 to 0.79)0
Cd Herbivore 7 -42.05 a
(-267.36 to -8.15)100 -3.06 a
(-24.34 to 0.14)86 -40.23 a
(-91.65 to -24.02)100 -0.83a
(-6.97 to -0.13)100
Cd Omnivore 19 -38.72 c
(-145.81 to -4.96)100 -7.05 c
(-28.75 to -0.21)100 -55.50 c
(-158.34 to -18.79)100 -12.69 c
(-910.01 to -4.69)100
Co Herbivore 7 -8.74 a
(-12.41 to -3.69)100 -8.74 a
(-12.41 to -3.69)100
Co Omnivore 5 -10.42 NS
(-16.88 to -6.20)100
Cr Herbivore 7 -2.77 a
(-4.06 to -0.08)100 -0.40 NS
(-0.87 to 0.60)57
Cr Omnivore 5 -0.92NS
(-3.77 to 0.05)80 -0.92 NS
(-3.77 to 0.05)80 -0.92 NS
(-3.26 to 0.03)80 -1.14 NS
(-3.69 to -0.08)100
Cu Herbivore 7 -6.93 a
(-29.93 to -0.50)100 -8.17 a
(-34.73 to -0.73)100 -2.24 a
(-2.72 to -1.05)100
Cu Omnivore 19 -11.51 c
(-135.92 to -1.02)100 -8.71 c
(-105.26 to -0.56)100 -0.72 NS
(-1.34 to -0.66)79
Fe Herbivore 7 -1.54 a
(-2.11 to -0.83)100 -1.54 a
(-2.11 to -0.83)100
Fe Omnivore 5 -1.52 NS
(-2.32 to -1.13)100
Ni Herbivore 7d -1.71 a
(-1.71 to -1.71)100 -3.59 a
(-3.59 to -3.59)100 -1.86 a
(-1.86 to -1.86)100 -3.42a
(-3.42 to -3.42)100
24

Table 6 (continued)
90th Percentile UF: General 90th Percentile UF: TrophicGroup
Regression :General95% UPL
Regression: Trophic Group95% UPL
Analyte TrophicGroup
N Median PD (range)
% OverEstimated
Median PD (range)
% OverEstimated
Median PD (range)
% OverEstimated
Median PD (range)
% OverEstimated
Ni Omnivore 5d -5.87 NS
(-7.70 to -3.01)100 -4.99 NS
(-6.59 to -2.50)100 -3.36 NS
(-4.53 to -2.07)100 -4.91 NS
(-6.50 to -3.16)100
Pb Herbivore 7 -18.22 a
(-33.62 to -3.00)100 -11.79 a
(-22.05 to -1.66)100 -21.12 a
(-57.03 to -4.47)100 -10.39a
(-28.52 to -1.83)100
Pb Omnivore 19 -21.33 c
(-85.93 to -0.70)100 -29.35 c
(-117.15 to -1.31)100 -12.38 c
(-81.90 to -6.77)100 -11.95c
(-77.91 to -6.46)100
Se Herbivore 6d . . .a 100 a
100
Se Omnivore 5d 0.50 NS
(-4.21 to 0.54)40 0.60NS
(-3.17 to 0.63)60 -0.51 NS
(-1.35 to -0.45)100 -0.46NS
(-1.45 to -0.40)100
Zn Herbivore 7 -30.30a
(-141.49 to -3.94)100 -28.18 a
(-131.83 to -3.61)100 -0.57 a
(-1.05 to 0.20)86 -0.26NS
(-0.75 to 0.37)86
Zn Omnivore 19 -9.20 c
(-154.85 to 0.52)89 -9.20 c
(-154.85 to 0.52)89 -0.16 NS
(-1.14 to 0.64)68 -0.08NS
(-1.03 to 0.68)63
NS Estimate not significantly different from measured as determined by Wilcoxon signed-rank test.a Estimate significantly different from measured as determined by Wilcoxon signed-rank test; p <0.05.b Estimate significantly different from measured as determined by Wilcoxon signed-rank test; p<0.01.c Estimate significantly different from measured as determined by Wilcoxon signed-rank test; p<0.001.d Analyte below detection limits for some observations in validation dataset. PD values could therefore not be calculated for these observations. Number of nondetects by analyteand trophic group were: As in herbivores: 7; As in omnivores: 5; Ni in herbivores: 6; Ni in omnivores: 1; Se in herbivores: 6; and Se in omnivores: 2.
25

26
measured values. In addition, the trophic-group regressions produced the smallest median and rangePD and the percent overestimation closest to 50% of all general estimation methods (Table 5). Amongconservative methods, while the 95% UPL for the trophic group regression produced the bestconservative estimates for herbivores, the 90th percentile trophic-group UF generated the bestestimates for omnivores (Table 6).
All methods overestimated Co in both herbivores and omnivores, with all differences beingsignificant for herbivores and none significant for omnivores (Table 5). The closest estimates wereobtained from the median general UF.
The best general estimates of Cr in herbivorous small mammals were generated by the mediantrophic-group UF. While these estimates were more accurate than those generated by the mediangeneral UF, they were less than measured values 86% of the time (Table 5). Both regression modelsproduced equivalent and better general estimates of Cr in omnivores as compared to either general UF(Table 5). Among conservative estimation methods, the 90th percentile general UF produced the bestconservative estimates of Cr in herbivores, while the trophic-group regression model produced the bestconservative estimates of Cr in omnivores (Table 6). Both conservative methods overestimated allvalidation observations.
For general estimation of Cu in small mammals, the median trophic-group UF and the generalregression model generated the best estimates for herbivores and omnivores respectively (Table 5).Both methods produced estimates that did not differ from measured values, and generated the smallestmedian and range PD values of all general methods. Among conservative methods, the 95% UPL ofthe general regression model generated the best estimates for both trophic groups, overestimating 100%and 80% of observations for herbivores and omnivores, respectively (Table 6).
Only one estimation method, the general UF, was available for Fe. Estimates using the medianUF, while generally exceeding measured values, did not differ significantly from measured values foreither herbivores or omnivores (Table 5). Estimates using the 90th percentile UF exceeded allmeasured values for both trophic groups, with estimates differing from measured values for herbivoreswhile not differing for omnivores (Table 6).
Validation data for Ni in herbivores was limited; Ni was detected in only 1 of 7 samples. Basedon this single sample, the best general estimate was produced by the general regression model (Table5), and the best conservative estimate was generated by the 90th percentile general UF (Table 6).Among omnivores, Ni was detected in 4 of 5 validation samples. No general or conservative estimate,generated by any method, differed significantly from measured values (Tables 5 and 6). The bestgeneral estimates for omnivores were generated by the trophic group regression (Table 5), while thebest conservative estimates were generated by the 95% UPL for the general regression model (Table6).
All general and conservative estimation methods significantly overestimated Pb in both herbivoresand omnivores, with the percent of validation observations that were overestimated being $86% forall methods (Table 5 and 6). The best general and conservative estimates for herbivores and omnivoreswere generated by the trophic-group UFs and trophic-group regression models, respectively (Table 5and 6).
Similar to As, because Se was not detected in any herbivore sample from the validation dataset(Tables 5 and 6), general and conservative estimation methods cannot be validated. For omnivores,

27
Se was detected in 3 of 5 validation samples; based on these limited data, the best general andconservative estimates were generated by the regression models, with the general model producingestimates that were marginally better than the trophic-group models (Tables 5 and 6).
Compared to UFs, the regression models clearly produced the best general and conservativeestimates of Zn in small mammals (Tables 5 and 6). For general estimates, the general regressionmodel generated better estimates for both herbivores and omnivores than did the trophic group models(Table 5). For conservative estimates, both the general and trophic-group regression models generatedcomparable estimates for both herbivores and omnivores (Table 6).
3.3 FINAL UFs AND MODELS
Final UFs and regression models incorporating data from the validation studies were calculatedfor all analytes (Tables 7 and 8). UFs based on the combined dataset were, in general, similar to thosebased only on the original dataset. Distributions for most UFs were best fit by a lognormal distribution.Median UFs for all analytes and trophic groups were <1 except the general UF for TCDD, theinsectivore UF for Cd and Hg, and the herbivore UF for TCDD (Table 7).
Similar to the UFs, regression models fit to the combined data were, in general, similar to thosebased only on the original dataset (Table 8). Inclusion of the additional data resulted in changes tosome models. For example, sufficient data were available to fit general, herbivore, and omnivoremodels for Ba, Co, and Fe, and a model for Cr accumulation by herbivores. Significant model fits werenot obtained for any group for Ba, for omnivores for Co and Fe, or for herbivores for Cr (Table 8).While significant general and herbivore models were fit for Co (Table 8), because the model andvalidation data have distinct and separate distributions (Fig. 2b), these models are unlikely to be valid.Significant general and herbivore model fits were also obtained for Fe (Table 8). In contrast to Co, themodel and validation Fe data have overlapping distributions (Fig. 4b), suggesting the validity of themodel. Other changes resulting from the inclusion of the validation data included obtaining asignificant model fit for Cu in omnivores and losing significant linear relationships for the uptake ofPb and Zn by omnivores (Table 8). Inclusion of the validation data resulted in increased r2 values forthe general models for As and Cu; for the herbivore models for Cd, Cu, and Zn; and for the omnivoremodels for As and Cu (Table 8). r2 values decreased following inclusion of the validation data for thegeneral models for Cd, Cr, Pb, and Zn; for the herbivore model for Pb; and for the omnivore modelsfor Cr, Pb, and Zn (Table 8).
In addition to the analytes represented in both the original and validation datasets, another8 analytes were represented only in the validation dataset. Summary statistics for UFs for theseanalytes are presented in Appendix C, Table C-1. Scatterplots of concentrations of chemicals in smallmammals versus those in soil are presented for chemicals with five or more observations in Figs. C-1and C-2.

Table 7. Summary statistics for final soil-small mammal UFs following inclusion of validation data
AnalyteTrophicGroup N Mean
StandardDeviation Minimum Median
90thPercentile Maximum
Mean of NaturalLog-transformed
values
StandardDeviation ofNatural Log-
transformed values Distribution
As General 72 0.0063 0.0105 0 0.0025 0.0149 0.071 -5.55414 1.2009 lognormal
Ba General 14 0.0696 0.0588 0.0144 0.0566 0.1121 0.253 -2.90415 0.70504 lognormal
Cd General 99 1.9902 7.2513 0.0153 0.3333 3.9905 69.561 -0.90973 1.71361 lognormal
Co General 15 0.0371 0.0455 0.0101 0.0205 0.1 0.18 -3.68549 0.79542 lognormala
Cr General 38 0.1382 0.1661 0.0314 0.0846 0.3333 0.8 -2.36584 0.79454 lognormala
Cu General 76 0.42 0.3978 0.0044 0.1963 1.045 1.398 -1.60802 1.47025 lognormala
F General 4 0.12 0.1697 0.0021 0.0579 0.362 0.362 -3.87154 2.67022 normalb
Fe General 15 0.0137 0.0053 0.0094 0.0124 0.0171 0.031 -4.34004 0.29831 lognormala
Hg General 18 0.1244 0.2343 0.0183 0.0543 0.192 1.046 -2.70075 0.94709 lognormal
Ni General 43 0.2799 0.2672 0 0.2488 0.5891 1.143 -1.47029 0.99379 lognormal
Pb General 138 0.1615 0.2927 0.0031 0.1054 0.2864 2.659 -2.60246 1.34442 lognormal
Se General 35 0.3464 0.4617 0 0.1619 1.1867 1.754 -1.29816 1.03053 lognormal
TCDD General 5 1.0698 0.7488 0.3067 1.0667 2.2 2.2 -0.15821 0.78578 normalb
TCDF General 4 0.1204 0.0384 0.074 0.1251 0.1571 0.157 -2.15976 0.34561 normalb
Tl General 2 0.1124 0.0146 0.102 0.1124 0.1227 0.123 -2.19019 0.13067 normalb
Zn General 103 1.3352 2.0537 0.0051 0.7717 2.6878 16.364 -0.64685 1.62191 lognormala
As Insectivore 1 0.0013 . 0.0013 0.0013 0.001 0.001 -6.62945 .
Cd Insectivore 38 4.8127 11.2188 0.2086 2.105 7.017 69.561 0.79402 1.11395 lognormal
Cr Insectivore 2 0.0815 0.0197 0.0675 0.0815 0.095 0.095 -2.52205 0.24458 uniform
Cu Insectivore 30 0.6857 0.361 0.0121 0.7714 1.117 1.176 -0.6897 1.05494 lognormala
F Insectivore 2 0.1821 0.2545 0.0021 0.1821 0.362 0.362 -3.58288 3.63012 uniform
Hg Insectivore 1 1.0457 . 1.0457 1.0457 1.046 1.046 0.04464 .
28

Table 7 (continued)
AnalyteTrophicGroup N Mean
StandardDeviation Minimum Median
90thPercentile Maximum
Mean of NaturalLog-transformed
values
StandardDeviation ofNatural Log-
transformed values Distribution
Ni Insectivore 9 0.3487 0.1429 0.0667 0.3643 0.578 0.578 -1.18015 0.62741 normal
Pb Insectivore 54 0.2541 0.4179 0.0042 0.1601 0.339 2.659 -1.91202 1.03533 lognormala
Se Insectivore 2 0.7241 0.1262 0.6349 0.7241 0.813 0.813 -0.33047 0.17516 uniform
Zn Insectivore 37 1.46716 1.62847 0.089351 0.83277 2.90106 6.961 -0.14855 1.11972 lognormal
As Herbivore 29 0.0059 0.0064 0 0.0042 0.016 0.022 -5.21855 0.94223 lognormal
Ba Herbivore 8 0.088 0.0725 0.0192 0.0615 0.253 0.253 -2.67578 0.74561 lognormal
Cd Herbivore 28 0.221 0.2287 0.0153 0.1258 0.448 1 -2.00975 1.09269 lognormal
Co Herbivore 10 0.0472 0.0534 0.0134 0.021 0.14 0.18 -3.45664 0.86467 lognormal
Cr Herbivore 9 0.1249 0.0846 0.0314 0.0884 0.309 0.309 -2.27201 0.66518 normalb
Cu Herbivore 18 0.3116 0.4279 0.0044 0.1086 1.29 1.398 -2.21637 1.67145 lognormal
F Herbivore 2 0.0579 0.0788 0.0021 0.0579 0.114 0.114 -4.1602 2.80698 uniform
Fe Herbivore 10 0.0145 0.0063 0.01 0.0126 0.024 0.031 -4.29297 0.33165 lognormala
Hg Herbivore 1 0.0239 . 0.0239 0.0239 0.024 0.024 -3.73333 .
Ni Herbivore 15 0.2654 0.3702 0 0.0513 0.898 1.143 -1.33517 1.25141 lognormal
Pb Herbivore 40 0.0756 0.0761 0.0031 0.0522 0.187 0.287 -3.20343 1.26692 lognormal
Se Herbivore 7 0.0221 0.0586 0 0 0.155 0.155 -1.86407 . normal
TCDD Herbivore 1 1.2857 . 1.2857 1.2857 1.286 1.286 0.25131 .
Zn Herbivore 30 1.32102 3.03062 0.00511 0.50429 2.31681 16.3636 -1.22783 2.02508 lognormal
As Omnivore 42 0.0067 0.0127 0 0.0025 0.014 0.071 -5.72462 1.30952 lognormal
Ba Omnivore 6 0.0451 0.0196 0.0144 0.0463 0.069 0.069 -3.20865 0.56515 normalb
29

Table 7 (continued)
AnalyteTrophicGroup N Mean
StandardDeviation Minimum Median
90thPercentile Maximum
Mean of NaturalLog-transformed
values
StandardDeviation ofNatural Log-
transformed values Distribution
Cd Omnivore 33 0.2412 0.3232 0.0279 0.1217 0.462 1.705 -1.93828 0.97669 lognormal
Co Omnivore 5 0.0168 0.0061 0.0101 0.0158 0.025 0.025 -4.14321 0.37334 normalb
Cr Omnivore 27 0.1468 0.1914 0.0323 0.0699 0.349 0.8 -2.38555 0.86868 lognormala
Cu Omnivore 28 0.2051 0.2241 0.0082 0.1272 0.554 0.867 -2.20087 1.22553 lognormal
Fe Omnivore 5 0.0121 0.0026 0.0094 0.0124 0.015 0.015 -4.43416 0.21765 normalb
Hg Omnivore 16 0.0731 0.0465 0.0183 0.0543 0.13 0.192 -2.8078 0.65634 normalb
Ni Omnivore 19 0.2587 0.2189 0 0.1683 0.589 0.8 -1.68292 1.00451 normalb
Pb Omnivore 44 0.1258 0.183 0.0035 0.0659 0.286 0.995 -2.90347 1.39799 lognormal
Se Omnivore 26 0.4047 0.494 0 0.2062 1.263 1.754 -1.35522 1.04902 lognormal
TCDD Omnivore 4 1.0158 0.8533 0.3067 0.7783 2.2 2.2 -0.26059 0.86798 normalb
TCDF Omnivore 4 0.1204 0.0384 0.074 0.1251 0.157 0.157 -2.15976 0.34561 normalb
Tl Omnivore 2 0.1124 0.0146 0.102 0.1124 0.123 0.123 -2.19019 0.13067 uniform
Zn Omnivore 36 1.2113 1.38532 0.017852 0.55772 2.78218 5.85 -0.67485 1.55762 lognormala Data not fit by either normal or lognormal distributions, however, closest fit provided by lognormal.b Data fit acceptably by both normal and lognormal distributions; closest fit provided by normal.
30

31
Table 8. Results of regression of ln whole-body small mammal concentration on ln soil concentration following inclusion of validation data
Analyte Group N B0±SE B1±SE r2 P model fit
As General 60 -4.8471±0.4347c 0.8188±0.1043c 0.52 0.0001
As Herbivore 22 -5.6531±0.5333c 1.1382±0.1570c 0.72 0.0001
As Omnivore 37 -4.5796±0.6845c 0.7354±0.1506c 0.41 0.0001
Ba General 14 -1.4120±3.6196NS 0.7000±0.7266NS 0.07 0.35
Ba Herbivore 8 0.3361±4.8292NS 0.3859±0.9831NS 0.025 0.71
Ba Omnivore 6 -10.0552±4.9417NS 2.3511±0.9743NS 0.59 0.07
Cd General 99 -0.4306±0.1809a 0.4865±0.1016c 0.19 0.0001
Cd Insectivore 38 0.8150±0.2031c 0.9638±0.1516c 0.53 0.0001
Cd Herbivore 28 -1.2571±0.1541c 0.4723±0.0698c 0.64 0.0001
Cd Omnivore 33 -1.5383±0.1418c 0.5660±0.0780c 0.63 0.0001
Co General 15 -4.4669±1.1308b 1.3070±0.4367a 0.41 0.01
Co Herbivore 10 -4.2614±1.3393b 1.3096±0.5035b 0.46 0.03
Co Omnivore 5 -0.2028±0.8884NS -0.6179±0.3636NS 0.49 0.19
Cr General 38 -1.4599±0.5053b 0.7338±0.1439c 0.42 0.0001
Cr Herbivore 9 -0.1347±0.7556NS 0.3887±0.2112NS 0.33 0.11
Cr Omnivore 27 -1.4945±0.6846b 0.7326±0.1994b 0.35 0.001
Cu General 76 2.0420±0.1301c 0.1444±0.0285c 0.26 0.0001
Cu Insectivore 30 2.1042±0.0550c 0.1783±0.0152c 0.83 0.0001
Cu Herbivore 18 2.0423±0.2538c 0.0675±0.0521NS 0.1 0.21
Cu Omnivore 28 1.4592±0.2861c 0.2681±0.0547c 0.48 0.0001
F General 4 1.7549±0.7730NS 0.3129±0.0875NS 0.87 0.07
Fe General 15 -0.2879±1.1312NS 0.5969±0.1124c 0.68 0.0001
Fe Herbivore 10 -0.4758±1.2717NS 0.6207±0.1261b 0.75 0.0012
Fe Omnivore 5 6.2403±1.4278a -0.0643±0.1423NS 0.06 0.68
Hg General 18 -4.8666±1.7959a -2.2764±2.6962NS 0.04 0.41
Hg Omnivore 16 -4.0341±1.4366a -0.8965±2.2069NS 0.01 0.69
Ni General 36 -0.2462±0.1970NS 0.4658±0.0729c 0.55 0.0001
Ni Insectivore 9 -0.4266±0.1505a 0.5444±0.0738c 0.89 0.0002
Ni Herbivore 9 0.3174±0.3449NS 0.3766±0.1092a 0.63 0.01
Ni Omnivore 18 -0.4140±0.3797NS 0.4780±0.1381b 0.43 0.003
Pb General 138 0.0761±0.2524NS 0.4422±0.0497c 0.37 0.0001

Table 8 (continued)32
Analyte Group N B0±SE B1±SE r2 P model fit
Pb Insectivore 54 0.4819±0.3099NS 0.4869±0.0633c 0.53 0.0001
Pb Herbivore 40 -0.6114±0.3356NS 0.5181±0.0582c 0.68 0.0001
Pb Omnivore 44 0.5669±0.5550NS 0.2194±0.1202NS 0.07 0.07
Se General 27 -0.4158±0.2090NS 0.3764±0.1125b 0.31 0.0026
Se Omnivore 24 -0.4260±0.2315NS 0.3786±0.1197b 0.31 0.0045
TCDD General 5 0.8113±1.8493NS 1.0993±0.1852b 0.92 0.0096
TCDD Omnivore 4 0.7044±12.7713NS 1.0894±1.1826NS 0.29 0.45
TCDF General 4 3.8673±11.4833NS 1.6191±1.1794NS 0.49 0.3
Zn General 103 4.4713±0.1122c 0.0738±0.0194c 0.13 0.0002
Zn Insectivore 37 4.2479±0.1191c 0.1324±0.0228c 0.49 0.0001
Zn Herbivore 30 4.3632±0.1261c 0.0706±0.0198b 0.31 0.0013
Zn Omnivore 36 4.4987±0.2955c 0.0745±0.0509NS 0.06 0.15
model: ln(whole body)=B0+B1(ln[soil]) NS Not Significant: p>0.05. a p<0.05. b p<0.01. c p<0.001
33
4. DISCUSSION
Like Shore (1995), we found significant ln-ln linear relationships between chemical concentrationsin soils and those in the tissues of small mammals. In the current study, we fit significant regressionmodels of ln whole-body concentration on ln soil concentration for all small mammals (9 of 12chemicals), insectivores (5 of 5 chemicals), herbivores (5 of 6 chemicals), and omnivores (7 of 11chemicals).
Our regression models indicate that bioaccumulation for many chemicals varies according to thetrophic level, with accumulation based on the soil concentration greatest for insectivores and least forherbivores. Similar observations have been made by other researchers (Hunter, Johnson, andThompson 1987; Ma, Denneman, and Faber 1991; Talmage and Walton 1991). Talmage and Waltonattribute the higher accumulation seen in insectivores to food chain accumulation (consumption ofherbivorous and predatory invertebrates). Higher accumulation by some insectivores may also berelated to greater soil ingestion. For example, Talmage and Walton (1993) report soil consumption forshort-tailed shrews (Blarina brevicauda) to be 13% of food consumption. In contrast, soilconsumption for the omnivorous white-footed mouse (Peromyscus leucopus) was 1% offood ingestion.
The UFs and regression methods developed in this study, while useful for estimation purposes,do not accurately reflect the exposure pathways experienced by small mammals. Conceptually, themodel for uptake by small mammals is: soil-food-small mammal. While incidental ingestion of soil bysmall mammals does occur (Garten 1980; Beyer, Conner, and Gerould 1994), the volume of soilconsumed is small relative to the volume of food consumed. Our models bypass this intermediate, diet-mediated step in bioaccumulation. It is possible that improved models could be developed byconsidering diet–small mammal relationships. While significant model fits may be obtained fordiet-based models, their predictive utility may be limited because of the temporal and spatial variabilityin diets consumed both by individual small mammals and within species of small mammals.
Because soil parameters such as soil pH and soil Ca concentration are known to influencechemical uptake in earthworms (Beyer, Hensler, and Moore 1987; Ma 1982; Morgan and Morgan1991), soil chemistry may also influence bioavailability and uptake of contaminants by smallmammals. It has been suggested that uptake of contaminants by small mammals may be affected byantagonism between co-occurring contaminants in the soil, such as Cd and Zn (Hunter, Johnson, andThompson 1987; Talmage and Walton 1991). Additional parameters that may influence uptake ofcontaminants by small mammals include age, sex, and season of year (Talmage and Walton 1991).For example, Hunter, Johnson, and Thompson (1989) observed that Cd accumulation in commonshrews (Sorex araneus) increased with age. Inclusion of these parameters in future analyses mayfurther reduce the uncertainty associated with these models and increase their accuracy for generatingsite-specific estimates.
An additional source of uncertainty with our UFs and models is the preparation of small mammalsamples prior to analysis. Whole-body concentrations may be biased due to chemicals retained in thestomach contents or by soil retained externally in the hair. While stomach contents were removed insome studies (Scanlon 1987) and some samples were washed (DOE 1995) or skinned (Beyer et al.1985), most data included in models consisted of whole, unwashed specimens with stomach contentsintact. The influence of these biases on the final analyses is not known.

35
5. RECOMMENDATIONS
In an ecological risk assessment context, the best data to estimate bioaccumulation ofcontaminants in soil by small mammals will always be site-specific data. Ideally, small mammalsshould be collected from multiple areas within the contaminated site and from reference areas(preferable at locations where soil samples are also collected) and analyses for contaminants ofconcern in whole-body or carcass tissue should be performed. In the absence of site-specific data, UFsor models should be used.
Because the available data indicate that bioaccumulation by small mammals is generally non-linear, decreasing as soil concentration increases, and UFs implicitly assume that accumulation islinear and constant across all soil concentrations, the use of log-linear regression models to estimatebioaccumulation by small mammals is recommended. For applications where conservative estimatesare desired, such as screening ecological risk assessments, the 95% UPL for the trophic-groupregression models are recommended (methods and parameters for calculating the 95% UPL arepresented in Appendix D). If trophic-group models are not available, the general models should beused. In general, because they are based on a larger, more robust dataset, the regression models andUFs from the combined datasets (Tables 7 and 8) should be used. Due to the uncertainties associatedwith the models, it is highly recommended that users perform uncertainty analyses. It should be notedthat because the models incorporate data from multiple sites and species, as well as multiple studies,these calculated uncertainties would represent variances among combinations of species and sites andnot simply lack of knowledge (i.e., true uncertainty). Contaminant-specific recommendations andjustifications are outlined in Table 9.
Table 9. Recommended application of bioaccumulation models(all recommendations are from the combined validation dataset unless otherwise noted)
Analyte TrophicGroup
For General Estimates For Conservative Estimates
As Insectivore general regressiona 95% UPL for generalregressiona
Herbivore trophic-group regression 95% UPL for trophic-groupregression
Omnivore trophic-group regressionb 95% UPL for trophic-groupregressionb
Ba All median general UFc 90th percentile general UFc
Cd All trophic-group regression 95% UPL for trophic-groupregression
Co All median general UFd 90th percentile general UFd
Cr Insectivore general regressiona 95% UPL for generalregressiona
Herbivore median trophic group UF 90th percentile general UF

Table 9 (continued)36
Analyte TrophicGroup
For General Estimates For Conservative Estimates
Omnivore general or trophic-groupregression
95% UPL for trophic-groupregression
Cu Insectivore trophic-group regression 95% UPL for trophic-groupregression
Herbivore median trophic-group UF 95% UPL for trophic-groupregression
Omnivore trophic-group regressionb 95% UPL for trophic-groupregression
F All median general UF 90th percentile general UF
Fe Insectivore general regressiona 95% UPL for generalregressiona
Herbivore trophic-group regressione 95% UPL for trophic-groupregressione
Omnivore general regressionf 95% UPL for generalregressionf
Hg All median general UFg 90th percentile general UFg
Ni All general regressionh 95% UPL for generalregressionh
Pb Insectivore trophic-group regression 95% UPL for trophic-groupregression
Herbivore trophic-group regressioni 95% UPL for trophic-groupregressioni
Omnivore general regressionj 95% UPL for generalregressionj
Se Insectivore general regressiona 95% UPL for generalregressiona
Herbivore general regression 95% UPL for generalregression
Omnivore general regression 95% UPL for generalregression
Tl All median general UF 90th percentile general UF
Zn All general regression 95% UPL for generalregression
TCDD All general regression 95% UPL for generalregression

Table 9 (continued)37
Analyte TrophicGroup
For General Estimates For Conservative Estimates
TCDF All median general UF 90th percentile general UF
Analytes inAppendix C
All median trophic-group UF d 90th percentile trophic-groupUFd
a Recommended because data not available for trophic-group model.b Recommended because addition of validation data resulted in better regression model fit (greater r2, lowerp- value).c Recommended because significant regression model fits were not obtained and because trophic-group UFs
were similar (Table 7).d Recommended because despite significant regression model fits (Table 8), distributions of model and
validation data were disjoint (Fig. 2b) and because trophic-group UFs were similar (Table 7).e Recommended because addition of validation data resulted in significant regression model fit.f Recommended because addition of validation data resulted in significant general regression model fit but
not trophic group model fit (Table 8).g Recommended because significant regression model fits were not obtained and because data for insectivore
and omnivore UFs were limited (Table 7).h Recommended because trophic-group regression models were not significantly different.I Recommended because while addition of validation data reduced r2, the combined dataset is more robust than
the model data alone.j Recommended because addition of validation data resulted in non-significant trophic-group model.

39
6. REFERENCES
Andrews, S. M., M. S. Johnson, and J. A. Cooke. 1984. “Cadmium in small mammals from grasslandestablished on metalliferous mine waste,” Environ. Poll. (Series A) 33, 153–62.
Andrews, S. M., M. S. Johnson, and J. A. Cooke. 1989a. “Distribution of trace element pollutants ina contaminated grassland ecosystem established on metalliferous fluorspar tailings, 1: Lead,”Environ. Poll. 58, 73-85.
Andrews, S. M., M. S. Johnson, and J. A. Cooke. 1989b. “Distribution of trace element pollutants ina contaminated grassland ecosystem established on metalliferous fluorspar tailings, 2: Zinc,”Environ. Poll. 59, 241–52.
Andrews, S. M., M. S. Johnson, and J. A. Cooke. 1989c. “Distribution of trace element pollutants ina contaminated grassland ecosystem established on metalliferous fluorspar tailings, 3: Fluoride,”Environ. Poll. 60, 165–79.
Beyer, W. N., et al. 1985. “Metal contamination in wildlife living near two zinc smelters,” Environ.Pollut. (Series A) 38, 63–86.
Beyer, W. N., G. Hensler, and J. Moore. 1987. “Relation of pH and other soil variables toconcentrations of Pb, Cu, Zn, and Se in earthworms,” Pedobiologia 30, 167–72.
Beyer, W. N., G. Miller, and J. W. Simmers. 1990. “Trace elements in soil and biota in confineddisposal facilities for dredged materials,” Environ. Poll. 65, 19–32.
Beyer, W. N., E. Conner, and S. Gerould. 1994. “Estimates of soil ingestion by wildlife,” J. Wildl.Mgmt. 58, 375–82.
Cloutier, N. R., et al. 1985. “Metal (Cu, Ni, Fe, Co, Zn, Pb) and Ra-226 levels in meadow volesMicrotus pennsylvanicus living on nickel and uranium tailings in Ontario, Canada: environmentaland tissue levels,” Environ. Poll. (Ser. B). 10, 19–46.
DOE (U.S. Department of Energy). 1995. Remedial Investigation Report on the Chestnut RidgeOperable Unit 2 (Filled Coal Ash Pond/Upper McCoy Branch) at the Oak Ridge Y-12 Plant,Oak Ridge, Tennessee, Volume I—Main Text, DOE/OR/01-1268/V1&D2, Lockheed MartinEnergy Systems, Inc., Oak Ridge, Tenn.
Dowdy, S., and S. Wearden. 1983. Statistics for Research, John Wiley and Sons, New York.
Draper, N., and H. Smith. 1981. Applied Regression Analysis, second edition, John Wiley and Sons,New York, p. 709.
Efroymson, R., et al. 1997. Soil-Plant Contaminant Uptake Factors: Review and Recommendationsfor the Oak Ridge Reservation, ES/ER/TM-198, Oak Ridge Natl. Lab., Oak Ridge, Tenn.
Elfving, D.C., et al. 1979. “Arsenic content of small mammals indigenous to old orchard soils,” Bull.Environ. Contam. Toxicol. 21, 62–4.
EPA (U.S. Environmental Protection Agency). 1993. Wildlife Exposure Factors Handbook, Volume I,EPA/600/R-93/187a, Office of Research and Development, Washington, D.C.
ERT. 1987. “Land treatment effects on wildlife populations in red pine plantations: final report,prepared for Nekoosa Papers, Inc., p. 160.

40
Fanelli, R., et al. 1980. “Presence of 2,3,7,8-Tetrachloro dibenzo-p-dioxin in wildlife living nearSeveso, Italy: a preliminary study,” Bull. Environ. Contam. Toxicol. 24, 460–2.
Garten, C.T., Jr. 1980. “Ingestion of soil by Hispid cotton rats, white-footed mice, and easternchipmunks,” J. Mammal. 6, 136–7.
Goldsmith, C. D., Jr., and P. F. Scanlon. 1977. “Lead levels in small mammals and selectedinvertebrates associated with highways of different traffic densities,” Bull. Environ. Contam.Toxicol. 17, 311–7.
Goldsmith, C. D., Jr., P. F. Scanlon, and W. R. Pirie. 1976. “Lead concentrations in soil andvegetation associated with highways of different traffic densities,” Bull. Environ. Contam.Toxicol. 16, 66–70.
Hope, B., C. Loy, and P. Miller. 1996. “Uptake and trophic transfer of barium in a terrestrialecosystem,” Bull. Environ. Contam. Toxicol. 56, 683–9.
Hunter, B. A., and M. S. Johnson. 1982. “Food chain relationships of copper and cadmium incontaminated grassland ecosystems,” Oikos. 38, 108–17.
Hunter, B. A., M. S. Johnson, and D. J. Thompson. 1987. “Ecotoxicology of copper and cadmium ina contaminated grassland ecosystem, III—Small mammals, J. Appl. Ecol. 24, 601–14.
Hunter, B. A., M. S. Johnson, and D. J. Thompson. 1989. “Ecotoxicology of copper and cadmium ina contaminated grassland ecosystem, III—Tissue distribution and age accumulation in smallmammals, J. Appl. Ecol. 26, 89–99.
Johnson, M. S., et al. 1978. “Distribution of lead, zinc, and cadmium in small mammals from pollutedenvironments,” Oikos. 30, 153–9.
Jones, D. S., B. E. Sample, and G. W. Suter, II. 1997. Biota-Sediment Accumulation Factors forInvertebrates: Review and Recommendations for the Oak Ridge Reservation, ES/ER/TM-214,Oak Ridge Natl. Lab., Oak Ridge, Tenn.
La Tier, A. J., et al. 1995. “Bioaccumulation of trace elements and reproductive effects in deer mice(Peromyscus maniculatus),” pp. 3–14 in Proceedings of the Twelfth Annual National Meetingof the Amer. Soc. for Surface Mining and Reclamation, Gillette, Wyoming.
Ma, W.-C. 1982. “The influence of soil properties and worm-related factors on the concentration ofheavy metals in earthworms,” Pedobiologia 24, 109–19.
Ma, W.-C., W. Denneman, and J. Faber. 1991. “Hazardous exposure of ground-living small mammalsto cadmium and lead in contaminated terrestrial ecosystems,” Arch. Environ. Contam. Toxicol.20, 266–70.
McKim. J. M. 1977. “Evaluation of tests with early life stages of fish for predicting long-termtoxicity,” J. Fish. Res. Board Canada, 34, 1148–54.
Morgan, J. E., and A. J. Morgan. 1991. “Differences in the accumulated metal concentrations in twoepigeic earthworm species (Lumbricus rubellus and Dendrodrilus rubidus) living incontaminated soils,” Bull. Environ. Contam. Toxicol. 47, 296–301.
Norberg-King, T. J. 1989. “Predicting chronic toxicity with fathead minnows,” Environ. Toxicol.Chem. 8, 1075–89.

41
Palisade Corp. 1994a. BestFit: Distribution Fitting Software for Windows, Palisade Corporation,Newfield, N.Y., p. 156.
Palisade Corp. 1994b. @Risk: Risk Analysis for Spreadsheets, Palisade Corporation, Newfield, N.Y.,p. 302.
Pascoe, G. A., R. J. Blanchet, and G. Linder. 1994. “Bioavailability of metals and arsenic to smallmammals at a mining waste-contaminated wetland,” Arch. Environ. Contam. Toxicol. 27, 44–50.
Pascoe, G. A., R. J. Blanchet, and G. Linder. 1996. “Food chain analysis of exposures and risks towildlife at a metals-contaminated wetland,” Arch. Environ. Contam. Toxicol. 30, 306–18.
PTI. 1995. Remedial Investigation and Feasibility Study at the National Zinc Site, Volume IV:Ecological Risk Assessment—Operable Unit 2, PTI Environmental Services, Bellevue, Wash.
Quarles, H. D., III, R. B. Hanawalt, and W. E. Odum. 1974. “Lead in small mammals, plants, andsoil at varying distances from a highway,” J. Appl. Ecol. 11, 937–69.
Read, H. J., and M. H. Martin. 1993. “The effect of heavy metals on populations of small mammalsfrom woodlands in Avon (England): with particular emphasis on metal concentrations in Sorexaraneus L. and Sorex minutus L.,” Chemosphere. 27, 2197–2211.
Roberts, R. D., M. S. Johnson, and M. Hutton. 1978. “Lead contamination of small mammals fromabandoned metalliferous mines,” Environ. Poll. 15, 61–9.
Sample, B.E., et al. 1997. Development and Validation of Bioaccumulation Models for Earthworms,ES/ER/TM-220, Oak Ridge Natl. Lab, Oak Ridge, Tenn.
SAS Inst. Inc. 1988a. SAS Procedures Guide, Release 6.03 Edition, SAS Institute Inc., Cary, N.C.,p. 441.
SAS Inst. Inc. 1988b. SAS/STAT User’s Guide, Release 6.03 Edition, SAS Institute Inc., Cary, N.C.,p. 1028.
Scanlon, P. F. 1987. “Heavy metals in small mammals in roadside environments: implications for foodchains,” Sci. Total Environ. 59, 317–23.
Scanlon, P. F. 1991. “Effects of highway pollutants upon terrestrial ecosystems,” pp. 281–338 inR. S. Hamilton and R. M. Harrison (eds.), Highway Pollution, Studies in EnvironmentalPollution 44, Elsevier Science Publ. Co., Amsterdam.
Shore, R. F. 1995. “Predicting cadmium, lead and fluoride levels in small mammals from soil residuesand by species-species extrapolation,” Environ. Poll. 88, 333–40.
Talmage, S. S., and B. T. Walton. 1991. “Small mammals as monitors of environmentalcontaminants,” Rev. Environ. Contam. Toxicol. 119, 47–145.
Talmage, S. S., and B. T. Walton. 1993. “Food chain transfer and potential renal toxicity of mercuryto small mammals at a contaminated terrestrial field site,” Ecotoxicology 2, 243–56.

APPENDIX A
SUMMARY OF STUDIESINCLUDED IN THE SMALL MAMMAL
BIOACCUMULATION DATABASE

A-3
A. MODEL DATA
Reference: Andrews et al. 1984Analytes Considered: CdSpecies: Microtus, SorexGeographic Location of Study: Great BritainExposure Duration: residentType of Tissue Analyzed: liver, kidney, bone, whole bodyType of Source Media Analyzed: diet (plants, macro invertebrates)Analytical Method: AA spectrometrySoil Extraction Method: nitric acidSoil Characteristics (pH, CEC, % OM, % Clay, etc.) Presented: noPurpose of Study: To evaluate food chain transfer of Cd metals at an abandoned mineNotes:
Reference: Andrews et al. 1989aAnalytes Considered: PbSpecies: Sorex, MicrotusGeographic Location of Study: Great BritainExposure Duration: ResidentType of Tissue Analyzed: whole body, liver, kidney, and other tissuesType of Source Media Analyzed: soil, plants, insects, earthwormsAnalytical Method: AA spectrometrySoil Extraction Method: nitric perchloric acidSoil Characteristics (pH, CEC, % OM, % Clay, etc.): noPurpose of Study: To evaluate uptake of Pb in association with a mine tailings siteNotes: used mean plant and insect concentrations in analyses.
Reference: Andrews et al. 1989bAnalytes Considered: ZnSpecies: Sorex, MicrotusGeographic Location of Study: Great BritainExposure Duration: ResidentType of Tissue Analyzed: whole body, liver, kidney, and other tissuesType of Source Media Analyzed: soil, plants, insects, earthwormsAnalytical Method: AA spectrometrySoil Extraction Method: nitric perchloric acidSoil Characteristics (pH, CEC, % OM, % Clay, etc.) Presented: noPurpose of Study: To evaluate uptake of metals in association with a mine tailings siteNotes: used mean plant and insect concentrations in analyses.
Reference: Andrews et al. 1989cAnalytes Considered: FSpecies: Sorex, MicrotusGeographic Location of Study: Great BritainExposure Duration: ResidentType of Tissue Analyzed: whole body, liver, kidney, and other tissuesType of Source Media Analyzed: soil, plants, insects, earthworms

A-4
Analytical Method: Fluoride ion-selective electrodeSoil Extraction Method: nitric perchloric acidSoil Characteristics (pH, CEC, % OM, % Clay, etc.) Presented: noPurpose of Study: To evaluate uptake of F in association with a mine tailings siteNotes: used mean plant and insect concentrations in analyses.
Reference: Beyer et al. 1985Analytes Considered: Pb, Zn, Cd, CuSpecies: Blarina, PeromyscusGeographic Location of Study: PennsylvaniaExposure Duration: ResidentType of Tissue Analyzed: carcass (skin, feet, tails, GI tract removed)Type of Source Media Analyzed: soil (a1 horizon), earthworms (mean of 2 species), insects (gypsymoth larvae), plants (acorns and fruit)Analytical Method: AA spectrometrySoil Extraction Method: acidSoil Characteristics (pH, CEC, % OM, % Clay, etc.) Presented: yesPurpose of Study: To evaluate uptake of metals in association with a smelting siteNotes: The authors note that carcass concentrations were comparable to that in the carcass andexternal parts combined.
Reference: Beyer et al. 1990Analytes Considered: Pb, Cu, Zn, Ni, Cd, Cr, As, SeSpecies: Mus, Blarina, Peromyscus, MicrotusGeographic Location of Study: Maryland, Pennsylvania, New JerseyExposure Duration: residentType of Tissue Analyzed: carcass (tail and skin removed)Type of Source Media Analyzed: dredged sedimentAnalytical Method: AA spectrometrySoil Extraction Method: acidSoil Characteristics (pH, CEC, % OM, % Clay, etc.) Presented: yesPurpose of Study: To evaluate heavy metal transfer to biota using dredge spoil sitesNotes:
Reference: Cloutier et al. 1985Analytes Considered: Cu, Ni, Fe, Co, Zn, Pb, and Ra-226Species: MicrotusGeographic Location of Study: OntarioExposure Duration: ResidentType of Tissue Analyzed: GI tract, skin, muscle, bone, liver, kidney; weighted sum to whole bodyType of Source Media Analyzed: soil, ground-level vegetationAnalytical Method: AA spectroscopySoil Extraction Method: acidSoil Characteristics (pH, CEC, % OM, % Clay, etc.) Presented: noPurpose of Study: To evaluate uptake of heavy metals at nickel and uranium mine-tailings siteNotes: All data values extracted from histograms of summary statistics

A-5
Reference: DOE 1995Analytes Considered: As, Cd, Cr, Pb, Hg, Se, and TlSpecies: Microtus, Peromyscus, Blarina, ReithrodontomysGeographic Location of Study: TennesseeExposure Duration: ResidentType of Tissue Analyzed: whole body with including stomach contentsAnalytical Method: AA spectroscopySoil Extraction Method: nitric and perchloric acidSoil Characteristics (pH, CEC, % OM, % Clay, etc.) Presented: noPurpose of Study: To evaluate uptake of heavy metals at a coal ash disposal site.Notes:
Reference: Elfving et al. 1979Analytes Considered: AsSpecies: Peromyscus, MicrotusGeographic Location of Study: New YorkExposure Duration: ResidentType of Tissue Analyzed: Whole bodyType of Source Media Analyzed: soilAnalytical Method: spectrometry using silver diethyldithiocarbamate procedureSoil Extraction Method: hydrochloric acidSoil Characteristics (pH, CEC, % OM, % Clay, etc.) Presented: noPurpose of Study: To evaluate uptake of As in old orchardsNotes:
Reference: ERT 1987Analytes Considered: 2,3,7,8 TCDD and 2,3,7,8 TCDFSpecies: PeromyscusGeographic Location of Study: WisconsinExposure Duration: ResidentType of Tissue Analyzed: whole bodyType of Source Media Analyzed: soilAnalytical Method: Mass spectroscopySoil Extraction Method:Soil Characteristics (pH, CEC, % OM, % Clay, etc.) Presented: noPurpose of Study: To evaluate the uptake of TCDD by small mammals in forests treated with papermill sludge.Notes:
Reference: Fanelli et al. 1980Analytes Considered: TCDDSpecies: MicrotusGeographic Location of Study: ItalyExposure Duration: ResidentType of Tissue Analyzed: whole bodyType of Source Media Analyzed: soilAnalytical Method: GC MSSoil Extraction Method:Soil Characteristics (pH, CEC, % OM, % Clay, etc.) Presented: noPurpose of Study: To evaluate uptake of TCDD in vicinity of SevesoNotes:

A-6
Reference: Goldsmith and Scanlon 1977Analytes Considered: PbSpecies: Blarina, Microtus, Peromyscus, Cryptotis, Glaucomys, Sorex, Tamias, Zapus, ParascalopsGeographic Location of Study: VirginiaExposure Duration: ResidentType of Tissue Analyzed: Whole bodyType of Source Media Analyzed: soil, earthworms, plantsAnalytical Method: AA spectrometrySoil Extraction Method: nitric acidSoil Characteristics (pH, CEC, % OM, % Clay, etc.) Presented: noPurpose of Study: To evaluate uptake of metals in association with highway trafficNotes: soil and plant data reported in Goldsmith et al. 1976. Plant concentrations represent mean ongrass, forb, herb, and shrub measurements to 0-18 m from road. Soil value represents meanconcentration 0-18 m from roads.
Reference: Hope et al. 1996Analytes Considered: BaSpecies: Peromyscus, SigmodonGeographic Location of Study: VirginiaExposure Duration: ResidentType of Tissue Analyzed: Whole bodyType of Source Media Analyzed: soil, ground-dwelling invertebrates, vegetationAnalytical Method: not statedSoil Extraction Method: not statedSoil Characteristics (pH, CEC, % OM, % Clay, etc.) Presented: noPurpose of Study: To evaluate uptake of barium at a contaminated siteNotes:
Reference: Hunter and Johnson 1982Analytes Considered: Cd, CuSpecies: Microtus, Sorex, ApodemusGeographic Location of Study: Great BritainExposure Duration: residentType of Tissue Analyzed: liver, kidney, bone, whole bodyType of Source Media Analyzed: soil, plants, invertebratesAnalytical Method: AA spectrometrySoil Extraction Method: nitric acidSoil Characteristics (pH, CEC, % OM, % Clay, etc.) Presented: noPurpose of Study: To evaluate food chain transfer of Cd and Cu at a smelting siteNotes: Whole-body concentrations interpolated from figures; organ, soil, plant, and invertebrateconcentrations reported in tables. Concentrations in detritivore invertebrates used as earthworms.Insect concentration represented by mean for carnivore and herbivore invertebrates. Plantconcentrations represented by mean of grass and ground cover.
Reference: Johnson et al. 1978Analytes Considered: Cd, Pb, ZnSpecies: Apodemus, Microtus, ClethrionomysGeographic Location of Study: Wales, Great Britain

A-7
Exposure Duration: ResidentType of Tissue Analyzed: Whole body, bone, liver, kidney, brain, muscleType of Source Media Analyzed: soilAnalytical Method: AA spectrometrySoil Extraction Method: nitric and perchloric acidSoil Characteristics (pH, CEC, % OM, % Clay, etc.) Presented: noPurpose of Study: To evaluate uptake of metals associated with mining and smelting sitesNotes:
Reference: Pascoe et al. 1994, Pascoe et al. 1996Analytes Considered: As, Cd, Cu, Pb, ZnSpecies: Peromyscus, MicrotusGeographic Location of Study: MontanaExposure Duration: ResidentType of Tissue Analyzed: liver, kidney, testes, carcassType of Source Media Analyzed: soil, vegetation, earthworms, grasshoppersAnalytical Method: not statedSoil Extraction Method: not statedSoil Characteristics (pH, CEC, % OM, % Clay, etc.) Presented: noPurpose of Study: To evaluate uptake of metals at a contaminated siteNotes: small mammals were skinned and dissected before analyses. Plant data represents mean ofabove ground grasses and forbs. Small mammal concentrations reported in wet weight; dry weightestimated by assuming a water content of 68% (EPA 1993).
Reference: Quarles et al. 1974Analytes Considered: PbSpecies: Peromyscus, Microtus, BlarinaGeographic Location of Study: VirginiaExposure Duration: ResidentType of Tissue Analyzed: Whole bodyType of Source Media Analyzed: soil, ground-level vegetationAnalytical Method: AA spectrometrySoil Extraction Method: nitric and perchloric acidSoil Characteristics (pH, CEC, % OM, % Clay, etc.) Presented: yes, pH and soil typePurpose of Study: To evaluate uptake of lead adjacent to highwaysNotes:
Reference: Read and Martin 1993Analytes Considered: Cd, Cu, Pb, ZnSpecies: Sorex araneus, Sorex minutusGeographic Location of Study: Great BritainExposure Duration: residentType of Tissue Analyzed: liver, kidney, carcass, whole bodyType of Source Media Analyzed: surface litterAnalytical Method: AA spectrometrySoil Extraction Method: nitric acidSoil Characteristics (pH, CEC, % OM, % Clay, etc.) Presented: noPurpose of Study: To evaluate uptake and transfer of metals in the vicinity of a smelting site

A-8
Notes: Surface litter concentration assumed representative of surface soil
Reference: Roberts et al. 1978Analytes Considered: PbSpecies: Sorex, Apodemus, Microtus, ClethrionomysGeographic Location of Study: Great BritainExposure Duration: ResidentType of Tissue Analyzed: whole body, liver, kidneyType of Source Media Analyzed: soil, plants, insects, earthwormsAnalytical Method: AA spectrometrySoil Extraction Method: nitric perchloric acidSoil Characteristics (pH, CEC, % OM, % Clay, etc.) Presented: noPurpose of Study: To evaluate uptake of Pb in association with a mine tailings siteNotes: Body burdens reported in wet weight. Dry weight concentrations estimated assuming a 68%water content for small mammals (EPA 1993).
Reference: Scanlon 1987Analytes Considered: Cd, Pb, Ni, and ZnSpecies: Microtus, Peromyscus, Blarina, Mus, Cryptotis, Rattus, SorexGeographic Location of Study: VirginiaExposure Duration: ResidentType of Tissue Analyzed: whole body with stomach contents removedType of Source Media Analyzed: soil, earthworms (depurated, data only for Pb and Zn)Analytical Method: AA spectroscopySoil Extraction Method: nitric and hydrochloric acidSoil Characteristics (pH, CEC, % OM, % Clay, etc.) Presented: noPurpose of Study: To evaluate uptake of heavy metals along roadways in relation to traffic density.Notes: Soil data not reported in study. Contacted P.F. Scanlon and was directed to another publication(Scanlon 1991) in which soil data were reported.
B. Validation Data
Reference: LaTier et al. 1995Analytes Considered: As, Cd, Cu, Pb, and ZnSpecies: PeromyscusGeographic Location of Study: Clark Fork River Superfund Site, MontanaExposure Duration: ResidentType of Tissue Analyzed: whole bodyType of Source Media Analyzed: soil, arthropods, plantsAnalytical Method: ICP/MSSoil Extraction Method: nitric acidSoil Characteristics (pH, CEC, % OM, % Clay, etc.) Presented: yesPurpose of Study: To evaluate uptake of contaminants associated with a contaminated watershed.Notes: Small mammal analyzed as composites of 3 individuals/sampling location
Reference: PTI 1995.Analytes Considered: 24 inorganics

A-9
Species: Peromyscus, SigmodonGeographic Location of Study: Bartlesville, OklahomaExposure Duration: ResidentType of Tissue Analyzed: whole bodyType of Source Media Analyzed: soil, earthworms, plantsAnalytical Method: not specifically report; AA assumedSoil Extraction Method: not specifically report; strong acids assumedSoil Characteristics (pH, CEC, % OM, % Clay, etc.) Presented: yesPurpose of Study: To evaluate uptake of contaminants associated with National Zinc Site.Notes: Small mammal analyzed as composites of up to 12 individuals/sampling location

APPENDIX B
SMALL MAMMAL BIOACCUMULATION DATABASE

B-3
Table B.1. Small mammal bioaccumulation database.
Analyte Study Location SpeciesTrophicGroup
TissueConcentration mg/kg dry wt.
SoilConcentration mg/kg dry wt.
UptakeFactor
Portion ofDataset Reference
As Tennessee Blarina brevicauda Carnivore 0.177 134 0.00132 model DOE 1995
As Tennessee Microtus pinetorum Herbivore 0.093 134 0.00069 model DOE 1995
As Montana Microtus pennsylvanicus Herbivore 0.781 52.5 0.01488 model Pascoe et al. 1994, 1996
As MD,PA,NJ Mus musculus Omnivore 0.64 33 0.01939 model Beyer et al. 1990
As Tennessee Peromyscus leucopus Omnivore 0.047 134 0.00035 model DOE 1995
As MD,PA,NJ Mus musculus Omnivore 0.14 10 0.01400 model Beyer et al. 1990
As Tennessee Reithrodontomys Omnivore 0.144 110 0.00131 model DOE 1995
As Tennessee Reithrodontomys Omnivore 0.056 110 0.00051 model DOE 1995
As Tennessee Reithrodontomys Omnivore 0.216 110 0.00196 model DOE 1995
As Tennessee Reithrodontomys Omnivore 0.137 110 0.00125 model DOE 1995
As Tennessee Peromyscus leucopus Omnivore 0.232 110 0.00211 model DOE 1995
As Tennessee Peromyscus leucopus Omnivore 0.042 110 0.00038 model DOE 1995
As Tennessee Peromyscus leucopus Omnivore 0.434 110 0.00395 model DOE 1995
As Tennessee Peromyscus leucopus Omnivore 0.039 134 0.00029 model DOE 1995
As Tennessee Peromyscus leucopus Omnivore 0.106 110 0.00096 model DOE 1995
As Tennessee Peromyscus leucopus Omnivore 0.211 110 0.00192 model DOE 1995
As Tennessee Peromyscus leucopus Omnivore 0.084 110 0.00076 model DOE 1995
As Tennessee Peromyscus leucopus Omnivore 0.085 110 0.00077 model DOE 1995
As Tennessee Peromyscus leucopus Omnivore 0.122 110 0.00111 model DOE 1995
As NewYork Microtus pinetorum Herbivore 0.712 94 0.00758 model Elfving et al. 1979
As NewYork Microtus pinetorum Herbivore 0.544 34 0.01600 model Elfving et al. 1979
As NewYork Microtus pinetorum Herbivore 0.16 34 0.00471 model Elfving et al. 1979
As NewYork Microtus pinetorum Herbivore 0.876 44 0.01991 model Elfving et al. 1979
As NewYork Microtus pinetorum Herbivore 0.340 94 0.00362 model Elfving et al. 1979
As NewYork Microtus pinetorum Herbivore 0.004 2.4 0.00158 model Elfving et al. 1979
As NewYork Microtus pinetorum Herbivore 0.028 2.4 0.01170 model Elfving et al. 1979
As NewYork Microtus pinetorum Herbivore 0.211 34 0.00619 model Elfving et al. 1979
As NewYork Microtus pinetorum Herbivore 0.183 34 0.00538 model Elfving et al. 1979
As NewYork Microtus pennsylvanicus Herbivore 0.005 2.4 0.00216 model Elfving et al. 1979

B-4
Table B.1 (cont.)
Analyte Study Location SpeciesTrophicGroup
TissueConcentration mg/kg dry wt.
SoilConcentration mg/kg dry wt.
UptakeFactor
Portion ofDataset Reference
As NewYork Microtus pinetorum Herbivore 0.016 2.4 0.00664 model Elfving et al. 1979
As NewYork Microtus pinetorum Herbivore 0.507 44 0.01153 model Elfving et al. 1979
As NewYork Microtus pennsylvanicus Herbivore 0.004 2.4 0.00179 model Elfving et al. 1979
As NewYork Microtus pennsylvanicus Herbivore 0.062 31 0.00199 model Elfving et al. 1979
As NewYork Microtus pennsylvanicus Herbivore 0.293 44 0.00666 model Elfving et al. 1979
As NewYork Microtus pinetorum Herbivore 0.956 44 0.02172 model Elfving et al. 1979
As NewYork Microtus pennsylvanicus Herbivore 0.129 31 0.00416 model Elfving et al. 1979
As NewYork Microtus pennsylvanicus Herbivore 0.214 34 0.00630 model Elfving et al. 1979
As NewYork Microtus pennsylvanicus Herbivore 0.051 31 0.00166 model Elfving et al. 1979
As NewYork Microtus pennsylvanicus Herbivore 0.630 44 0.01433 model Elfving et al. 1979
As NewYork Peromyscus leucopus Omnivore 0.257 31 0.00829 model Elfving et al. 1979
As NewYork Peromyscus leucopus Omnivore 0.589 31 0.01900 model Elfving et al. 1979
As NewYork Peromyscus leucopus Omnivore 0.019 2.4 0.00772 model Elfving et al. 1979
As NewYork Peromyscus leucopus Omnivore 0.021 2.4 0.00887 model Elfving et al. 1979
As NewYork Peromyscus leucopus Omnivore 0.006 2.4 0.00248 model Elfving et al. 1979
As NewYork Peromyscus leucopus Omnivore 0.156 31 0.00503 model Elfving et al. 1979
As NewYork Peromyscus leucopus Omnivore 0.079 31 0.00255 model Elfving et al. 1979
Ba Virginia Sigmodon hispidus Herbivore 2 104.2 0.01919 model Hope et al. 1996
Ba Virginia Peromyscus leucopus Omnivore 1.5 104.2 0.01440 model Hope et al. 1996
Cd Virginia Blarina brevicauda Carnivore 0.29 0.48 0.60417 model Scanlon 1987
Cd GreatBritain Sorex minutus (immature) Carnivore 5.06 3.3 1.53333 model Read and Martin 1993
Cd GreatBritain Sorex minutus (immature) Carnivore 1.79 2 0.89500 model Read and Martin 1993
Cd Pennsylvania Blarina brevicauda Carnivore 4.8 2.7 1.77778 model Beyer et al. 1985
Cd GreatBritain Sorex minutus (adult) Carnivore 4.21 0.6 7.01667 model Read and Martin 1993
Cd GreatBritain Sorex minutus (immature) Carnivore 2.46 0.6 4.10000 model Read and Martin 1993
Cd Pennsylvania Blarina brevicauda Carnivore 7.3 35 0.20857 model Beyer et al. 1985
Cd GreatBritain Sorex minutus (adult) Carnivore 9.03 3.3 2.73636 model Read and Martin 1993
Cd GreatBritain Sorex araneus (adult) Carnivore 330.67 19.9 16.61658 model Read and Martin 1993
Cd GreatBritain Sorex minutus (immature) Carnivore 1.08 1 1.08000 model Read and Martin 1993
Cd GreatBritain Sorex minutus (adult) Carnivore 15.06 19.9 0.75678 model Read and Martin 1993

B-5
Table B.1 (cont.)
Analyte Study Location SpeciesTrophicGroup
TissueConcentration mg/kg dry wt.
SoilConcentration mg/kg dry wt.
UptakeFactor
Portion ofDataset Reference
Cd GreatBritain Sorex araneus (adult) Carnivore 5.2 0.6 8.66667 model Read and Martin 1993
Cd GreatBritain Sorex araneus (adult) Carnivore 4.92 2 2.46000 model Read and Martin 1993
Cd GreatBritain Sorex minutus (immature) Carnivore 5.66 19.9 0.28442 model Read and Martin 1993
Cd GreatBritain Sorex minutus (immature) Carnivore 3.09 1.7 1.81765 model Read and Martin 1993
Cd GreatBritain Sorex araneus (immature) Carnivore 1.93 1 1.93000 model Read and Martin 1993
Cd GreatBritain Sorex araneus (immature) Carnivore 5.05 1.7 2.97059 model Read and Martin 1993
Cd Virginia Blarina brevicauda Carnivore 0.47 0.6 0.78333 model Scanlon 1987
Cd GreatBritain Sorex araneus (adult) Carnivore 10.92 1.7 6.42353 model Read and Martin 1993
Cd GreatBritain Sorex minutus (adult) Carnivore 3.62 2 1.81000 model Read and Martin 1993
Cd GreatBritain Sorex minutus (adult) Carnivore 2.28 1 2.28000 model Read and Martin 1993
Cd GreatBritain Sorex araneus (adult) Carnivore 6.83 1 6.83000 model Read and Martin 1993
Cd GreatBritain Sorex araneus (immature) Carnivore 9.78 3.3 2.96364 model Read and Martin 1993
Cd Virginia Cryptotis parva Carnivore 0.2 0.48 0.41667 model Scanlon 1987
Cd Virginia Cryptotis parva Carnivore 0.52 0.65 0.80000 model Scanlon 1987
Cd MD,PA,NJ Blarina brevicauda Carnivore 1 0.62 1.61290 model Beyer et al. 1990
Cd Virginia Cryptotis parva Carnivore 0.8 0.6 1.33333 model Scanlon 1987
Cd Virginia Sorex cinereus Carnivore 1.09 0.6 1.81667 model Scanlon 1987
Cd GreatBritain Sorex minutus (adult) Carnivore 6.66 1.7 3.91765 model Read and Martin 1993
Cd GreatBritain Sorex araneus Carnivore 2.2 0.75 2.93333 model Hunter and Johnson 1982
Cd GreatBritain Sorex araneus (adult) Carnivore 229.55 3.3 69.56061 model Read and Martin 1993
Cd Virginia Blarina brevicauda Carnivore 0.46 0.65 0.70769 model Scanlon 1987
Cd GreatBritain Sorex araneus Carnivore 21 3.1 6.77419 model Hunter and Johnson 1982
Cd GreatBritain Sorex araneus (immature) Carnivore 79.41 19.9 3.99045 model Read and Martin 1993
Cd GreatBritain Sorex araneus (immature) Carnivore 2.44 0.6 4.06667 model Read and Martin 1993
Cd GreatBritain Sorex araneus Carnivore 28 8.5 3.29412 model Hunter and Johnson 1982
Cd GreatBritain Sorex araneus (immature) Carnivore 3.03 2 1.51500 model Read and Martin 1993
Cd Virginia Blarina brevicauda Carnivore 1.71 0.475 3.60000 model Scanlon 1987
Cd GreatBritain Clethrionomys glareolus Herbivore 0.87 11.2 0.07768 model Johnson et al. 1978
Cd GreatBritain Microtus agrestis Herbivore 0.62 11.2 0.05536 model Johnson et al. 1978
Cd GreatBritain Microtus agrestis Herbivore 0.13 1.55 0.08387 model Johnson et al. 1978

B-6
Table B.1 (cont.)
Analyte Study Location SpeciesTrophicGroup
TissueConcentration mg/kg dry wt.
SoilConcentration mg/kg dry wt.
UptakeFactor
Portion ofDataset Reference
Cd GreatBritain Clethrionomys glareolus Herbivore 0.17 1.55 0.10968 model Johnson et al. 1978
Cd GreatBritain Apodemus sylvaticus Herbivore 0.96 11.2 0.08571 model Johnson et al. 1978
Cd GreatBritain Microtus agrestis Herbivore 1.2 3.1 0.38710 model Hunter and Johnson 1982
Cd GreatBritain Apodemus sylvaticus Herbivore 0.76 45.9 0.01656 model Johnson et al. 1978
Cd Virginia Microtus pennsylvanicus Herbivore 0.22 0.6 0.36667 model Scanlon 1987
Cd GreatBritain Apodemus sylvaticus Herbivore 0.75 0.75 1.00000 model Hunter and Johnson 1982
Cd GreatBritain Apodemus sylvaticus Herbivore 1 3.1 0.32258 model Hunter and Johnson 1982
Cd GreatBritain Apodemus sylvaticus Herbivore 1 8.5 0.11765 model Hunter and Johnson 1982
Cd GreatBritain Microtus agrestis Herbivore 0.25 0.75 0.33333 model Hunter and Johnson 1982
Cd GreatBritain Microtus agrestis Herbivore 1.75 8.5 0.20588 model Hunter and Johnson 1982
Cd Montana Microtus pennsylvanicus Herbivore 0.1875 7.8 0.02404 model Pascoe et al. 1994, 1996
Cd GreatBritain Apodemus sylvaticus Herbivore 0.29 1.44 0.20139 model Johnson et al. 1978
Cd GreatBritain Apodemus sylvaticus Herbivore 2.64 92.2 0.02863 model Johnson et al. 1978
Cd GreatBritain Apodemus sylvaticus Herbivore 0.34 1.55 0.21935 model Johnson et al. 1978
Cd GreatBritain Apodemus sylvaticus Herbivore 0.27 1.1 0.24545 model Johnson et al. 1978
Cd Virginia Microtus pennsylvanicus Herbivore 0.19 0.65 0.29231 model Scanlon 1987
Cd Virginia Microtus pennsylvanicus Herbivore 0.37 0.475 0.77895 model Scanlon 1987
Cd Virginia Microtus pennsylvanicus Herbivore 0.15 0.48 0.31250 model Scanlon 1987
Cd Virginia Mus musculus Omnivore 0.11 0.6 0.18333 model Scanlon 1987
Cd Virginia Mus musculus Omnivore 0.06 0.65 0.09231 model Scanlon 1987
Cd Virginia Peromyscus leucopus Omnivore 0.81 0.475 1.70526 model Scanlon 1987
Cd Virginia Mus musculus Omnivore 0.16 0.475 0.33684 model Scanlon 1987
Cd Virginia Peromyscus leucopus Omnivore 0.3 0.65 0.46154 model Scanlon 1987
Cd Virginia Peromyscus leucopus Omnivore 0.19 0.48 0.39583 model Scanlon 1987
Cd Virginia Peromyscus leucopus Omnivore 0.2 0.6 0.33333 model Scanlon 1987
Cd Pennsylvania Peromyscus leucopus Omnivore 2.6 35 0.07429 model Beyer et al. 1985
Cd Pennsylvania Peromyscus leucopus Omnivore 1.2 2.7 0.44444 model Beyer et al. 1985
Cd Virginia Rattus norvegicus Omnivore 0.54 0.65 0.83077 model Scanlon 1987
Cd MD,PA,NJ Mus musculus Omnivore 0.077 0.7 0.11000 model Beyer et al. 1990
Cd MD,PA,NJ Mus musculus Omnivore 0.093 0.62 0.15000 model Beyer et al. 1990

B-7
Table B.1 (cont.)
Analyte Study Location SpeciesTrophicGroup
TissueConcentration mg/kg dry wt.
SoilConcentration mg/kg dry wt.
UptakeFactor
Portion ofDataset Reference
Cd Montana Peromyscus maniculatus Omnivore 0.25 7.8 0.03205 model Pascoe et al. 1994, 1996
Cd MD,PA,NJ Mus musculus Omnivore 0.093 1 0.09300 model Beyer et al. 1990
Co Ontario Microtus pennsylvanicus Herbivore 2.33 50 0.04660 model Cloutier et al. 1985
Co Ontario Microtus pennsylvanicus Herbivore 1.8 10 0.18000 model Cloutier et al. 1985
Co Ontario Microtus pennsylvanicus Herbivore 2.5 25 0.10000 model Cloutier et al. 1985
Cr MD,PA,NJ Blarina brevicauda Carnivore 21 220 0.09545 model Beyer et al. 1990
Cr Tennessee Blarina brevicauda Carnivore 0.797 11.8 0.06754 model DOE 1995
Cr MD,PA,NJ Microtus pennsylvanicus Herbivore 6.9 220 0.03136 model Beyer et al. 1990
Cr Tennessee Microtus pinetorum Herbivore 1.457 11.8 0.12347 model DOE 1995
Cr Tennessee Reithrodontomys Omnivore 0.778 21.4 0.03636 model DOE 1995
Cr MD,PA,NJ Mus musculus Omnivore 11 33 0.33333 model Beyer et al. 1990
Cr MD,PA,NJ Mus musculus Omnivore 11 300 0.03667 model Beyer et al. 1990
Cr Tennessee Reithrodontomys Omnivore 1.004 21.4 0.04692 model DOE 1995
Cr Tennessee Peromyscus leucopus Omnivore 1.363 21.4 0.06369 model DOE 1995
Cr Tennessee Reithrodontomys Omnivore 1.227 21.4 0.05734 model DOE 1995
Cr MD,PA,NJ Peromyscus leucopus Omnivore 7.1 220 0.03227 model Beyer et al. 1990
Cr Tennessee Peromyscus leucopus Omnivore 2.253 21.4 0.10528 model DOE 1995
Cr Tennessee Reithrodontomys Omnivore 1.082 21.4 0.05056 model DOE 1995
Cr Tennessee Peromyscus leucopus Omnivore 2.013 21.4 0.09407 model DOE 1995
Cr Tennessee Peromyscus leucopus Omnivore 0.987 21.4 0.04612 model DOE 1995
Cr Tennessee Peromyscus leucopus Omnivore 1.092 21.4 0.05103 model DOE 1995
Cr MD,PA,NJ Mus musculus Omnivore 18 26 0.69231 model Beyer et al. 1990
Cr Tennessee Peromyscus leucopus Omnivore 1.11 11.8 0.09407 model DOE 1995
Cr Tennessee Peromyscus leucopus Omnivore 1.184 21.4 0.05533 model DOE 1995
Cr MD,PA,NJ Mus musculus Omnivore 11 220 0.05000 model Beyer et al. 1990
Cr MD,PA,NJ Mus musculus Omnivore 16 20 0.80000 model Beyer et al. 1990
Cr Tennessee Peromyscus leucopus Omnivore 1.051 21.4 0.04911 model DOE 1995
Cr Tennessee Peromyscus leucopus Omnivore 1.07 11.8 0.09068 model DOE 1995
Cr Tennessee Peromyscus leucopus Omnivore 1.117 11.8 0.09466 model DOE 1995
Cr Tennessee Peromyscus leucopus Omnivore 1.167 21.4 0.05453 model DOE 1995

B-8
Table B.1 (cont.)
Analyte Study Location SpeciesTrophicGroup
TissueConcentration mg/kg dry wt.
SoilConcentration mg/kg dry wt.
UptakeFactor
Portion ofDataset Reference
Cr Tennessee Peromyscus leucopus Omnivore 1.035 11.8 0.08771 model DOE 1995
Cu GreatBritain Sorex araneus (immature) Carnivore 21.66 151 0.14344 model Read and Martin 1993
Cu GreatBritain Sorex araneus (adult) Carnivore 13.47 12 1.12250 model Read and Martin 1993
Cu GreatBritain Sorex araneus Carnivore 20 246 0.08130 model Hunter and Johnson 1982
Cu GreatBritain Sorex araneus Carnivore 30 2480 0.01210 model Hunter and Johnson 1982
Cu GreatBritain Sorex araneus (immature) Carnivore 13.57 24 0.56542 model Read and Martin 1993
Cu GreatBritain Sorex araneus (adult) Carnivore 11.18 18 0.62111 model Read and Martin 1993
Cu GreatBritain Sorex araneus (immature) Carnivore 12.12 14 0.86571 model Read and Martin 1993
Cu GreatBritain Sorex araneus (immature) Carnivore 13.61 18 0.75611 model Read and Martin 1993
Cu GreatBritain Sorex araneus Carnivore 10 9.3 1.07527 model Hunter and Johnson 1982
Cu MD,PA,NJ Blarina brevicauda Carnivore 20 130 0.15385 model Beyer et al. 1990
Cu GreatBritain Sorex araneus (immature) Carnivore 12.54 12 1.04500 model Read and Martin 1993
Cu GreatBritain Sorex minutus (immature) Carnivore 15.75 18 0.87500 model Read and Martin 1993
Cu GreatBritain Sorex araneus (adult) Carnivore 12.84 14 0.91714 model Read and Martin 1993
Cu GreatBritain Sorex araneus (immature) Carnivore 13.93 18 0.77389 model Read and Martin 1993
Cu GreatBritain Sorex minutus (immature) Carnivore 14.13 24 0.58875 model Read and Martin 1993
Cu GreatBritain Sorex minutus (immature) Carnivore 13.99 12 1.16583 model Read and Martin 1993
Cu GreatBritain Sorex araneus (adult) Carnivore 15.96 24 0.66500 model Read and Martin 1993
Cu GreatBritain Sorex minutus (adult) Carnivore 15.51 18 0.86167 model Read and Martin 1993
Cu Pennsylvania Blarina brevicauda Carnivore 11 18 0.61111 model Beyer et al. 1985
Cu GreatBritain Sorex minutus (adult) Carnivore 16.22 18 0.90111 model Read and Martin 1993
Cu GreatBritain Sorex minutus (immature) Carnivore 13.84 18 0.76889 model Read and Martin 1993
Cu GreatBritain Sorex minutus (adult) Carnivore 20.73 151 0.13728 model Read and Martin 1993
Cu GreatBritain Sorex araneus (adult) Carnivore 14.61 18 0.81167 model Read and Martin 1993
Cu GreatBritain Sorex minutus (immature) Carnivore 20.72 151 0.13722 model Read and Martin 1993
Cu GreatBritain Sorex minutus (adult) Carnivore 13.07 14 0.93357 model Read and Martin 1993
Cu Pennsylvania Blarina brevicauda Carnivore 11 9.9 1.11111 model Beyer et al. 1985
Cu GreatBritain Sorex minutus (immature) Carnivore 12.2 14 0.87143 model Read and Martin 1993
Cu GreatBritain Sorex minutus (adult) Carnivore 14.11 12 1.17583 model Read and Martin 1993
Cu GreatBritain Sorex araneus (adult) Carnivore 21.71 151 0.14377 model Read and Martin 1993

B-9
Table B.1 (cont.)
Analyte Study Location SpeciesTrophicGroup
TissueConcentration mg/kg dry wt.
SoilConcentration mg/kg dry wt.
UptakeFactor
Portion ofDataset Reference
Cu GreatBritain Sorex minutus (adult) Carnivore 16.3 24 0.67917 model Read and Martin 1993
Cu Ontario Microtus pennsylvanicus Herbivore 15 38 0.39474 model Cloutier et al. 1985
Cu Montana Microtus pennsylvanicus Herbivore 8.75 532.2 0.01644 model Pascoe et al. 1994, 1996
Cu Ontario Microtus pennsylvanicus Herbivore 10.5 30 0.35000 model Cloutier et al. 1985
Cu Ontario Microtus pennsylvanicus Herbivore 21 400 0.05250 model Cloutier et al. 1985
Cu MD,PA,NJ Microtus pennsylvanicus Herbivore 16 130 0.12308 model Beyer et al. 1990
Cu GreatBritain Microtus agrestis Herbivore 11 246 0.04472 model Hunter and Johnson 1982
Cu GreatBritain Microtus agrestis Herbivore 22 2480 0.00887 model Hunter and Johnson 1982
Cu GreatBritain Apodemus sylvaticus Herbivore 12 9.3 1.29032 model Hunter and Johnson 1982
Cu GreatBritain Apodemus sylvaticus Herbivore 11 2480 0.00444 model Hunter and Johnson 1982
Cu GreatBritain Apodemus sylvaticus Herbivore 11 246 0.04472 model Hunter and Johnson 1982
Cu GreatBritain Microtus agrestis Herbivore 13 9.3 1.39785 model Hunter and Johnson 1982
Cu MD,PA,NJ Mus musculus Omnivore 18 130 0.13846 model Beyer et al. 1990
Cu MD,PA,NJ Peromyscus leucopus Omnivore 15 130 0.11538 model Beyer et al. 1990
Cu Pennsylvania Peromyscus leucopus Omnivore 8.3 18 0.46111 model Beyer et al. 1985
Cu MD,PA,NJ Mus musculus Omnivore 12 24 0.50000 model Beyer et al. 1990
Cu MD,PA,NJ Mus musculus Omnivore 18 150 0.12000 model Beyer et al. 1990
Cu MD,PA,NJ Mus musculus Omnivore 15 71 0.21127 model Beyer et al. 1990
Cu Montana Peromyscus maniculatus Omnivore 10.625 532.2 0.01996 model Pascoe et al. 1994, 1996
Cu Pennsylvania Peromyscus leucopus Omnivore 6.7 9.9 0.67677 model Beyer et al. 1985
Cu MD,PA,NJ Mus musculus Omnivore 13 15 0.86667 model Beyer et al. 1990
F GreatBritain Sorex araneus Carnivore 47.5 131.2 0.36204 model Andrews et al. 1989c
F GreatBritain Sorex araneus Carnivore 211 98876 0.00213 model Andrews et al. 1989c
F GreatBritain Microtus agrestis Herbivore 14.9 131.2 0.11357 model Andrews et al. 1989c
F GreatBritain Microtus agrestis Herbivore 212 98876 0.00214 model Andrews et al. 1989c
Fe Ontario Microtus pennsylvanicus Herbivore 1050 100000 0.01050 model Cloutier et al. 1985
Fe Ontario Microtus pennsylvanicus Herbivore 250 8000 0.03125 model Cloutier et al. 1985
Fe Ontario Microtus pennsylvanicus Herbivore 310 22000 0.01409 model Cloutier et al. 1985
Hg Tennessee Blarina brevicauda Carnivore 0.481 0.46 1.04565 model DOE 1995
Hg Tennessee Microtus pinetorum Herbivore 0.011 0.46 0.02391 model DOE 1995

B-10
Table B.1 (cont.)
Analyte Study Location SpeciesTrophicGroup
TissueConcentration mg/kg dry wt.
SoilConcentration mg/kg dry wt.
UptakeFactor
Portion ofDataset Reference
Hg Tennessee Peromyscus leucopus Omnivore 0.027 0.547 0.04936 model DOE 1995
Hg Tennessee Peromyscus leucopus Omnivore 0.016 0.547 0.02925 model DOE 1995
Hg Tennessee Peromyscus leucopus Omnivore 0.053 0.46 0.11522 model DOE 1995
Hg Tennessee Reithrodontomys Omnivore 0.071 0.547 0.12980 model DOE 1995
Hg Tennessee Peromyscus leucopus Omnivore 0.021 0.547 0.03839 model DOE 1995
Hg Tennessee Peromyscus leucopus Omnivore 0.04 0.547 0.07313 model DOE 1995
Hg Tennessee Peromyscus leucopus Omnivore 0.025 0.46 0.05435 model DOE 1995
Hg Tennessee Peromyscus leucopus Omnivore 0.025 0.46 0.05435 model DOE 1995
Hg Tennessee Peromyscus leucopus Omnivore 0.056 0.547 0.10238 model DOE 1995
Hg Tennessee Peromyscus leucopus Omnivore 0.025 0.547 0.04570 model DOE 1995
Hg Tennessee Peromyscus leucopus Omnivore 0.049 0.547 0.08958 model DOE 1995
Hg Tennessee Reithrodontomys Omnivore 0.012 0.547 0.02194 model DOE 1995
Hg Tennessee Peromyscus leucopus Omnivore 0.048 0.46 0.10435 model DOE 1995
Hg Tennessee Peromyscus leucopus Omnivore 0.028 0.547 0.05119 model DOE 1995
Hg Tennessee Reithrodontomys Omnivore 0.105 0.547 0.19196 model DOE 1995
Hg Tennessee Reithrodontomys Omnivore 0.01 0.547 0.01828 model DOE 1995
Ni Virginia Blarina brevicauda Carnivore 1.59 2.75 0.57818 model Scanlon 1987
Ni Virginia Sorex cinereus Carnivore 0.72 3.2 0.22500 model Scanlon 1987
Ni Virginia Cryptotis parva Carnivore 1.38 3.5 0.39429 model Scanlon 1987
Ni MD,PA,NJ Blarina brevicauda Carnivore 10 150 0.06667 model Beyer et al. 1990
Ni Virginia Cryptotis parva Carnivore 1.29 3.2 0.40312 model Scanlon 1987
Ni Virginia Blarina brevicauda Carnivore 1.01 3.2 0.31562 model Scanlon 1987
Ni Virginia Blarina brevicauda Carnivore 1.56 3.5 0.44571 model Scanlon 1987
Ni Virginia Blarina brevicauda Carnivore 1.53 4.2 0.36429 model Scanlon 1987
Ni Virginia Cryptotis parva Carnivore 1.45 4.2 0.34524 model Scanlon 1987
Ni Ontario Microtus pennsylvanicus Herbivore 6 40 0.15000 model Cloutier et al. 1985
Ni Virginia Microtus pennsylvanicus Herbivore 2.16 3.2 0.67500 model Scanlon 1987
Ni Virginia Microtus pennsylvanicus Herbivore 1.63 3.5 0.46571 model Scanlon 1987
Ni Virginia Microtus pennsylvanicus Herbivore 1.34 4.2 0.31905 model Scanlon 1987
Ni MD,PA,NJ Microtus pennsylvanicus Herbivore 4.6 150 0.03067 model Beyer et al. 1990

B-11
Table B.1 (cont.)
Analyte Study Location SpeciesTrophicGroup
TissueConcentration mg/kg dry wt.
SoilConcentration mg/kg dry wt.
UptakeFactor
Portion ofDataset Reference
Ni Ontario Microtus pennsylvanicus Herbivore 20 390 0.05128 model Cloutier et al. 1985
Ni Ontario Microtus pennsylvanicus Herbivore 8 7 1.14286 model Cloutier et al. 1985
Ni Virginia Microtus pennsylvanicus Herbivore 2.47 2.75 0.89818 model Scanlon 1987
Ni Virginia Peromyscus leucopus Omnivore 1.06 3.2 0.33125 model Scanlon 1987
Ni Virginia Peromyscus leucopus Omnivore 1.06 3.5 0.30286 model Scanlon 1987
Ni Virginia Mus musculus Omnivore 0.23 3.2 0.07187 model Scanlon 1987
Ni Virginia Mus musculus Omnivore 1.62 2.75 0.58909 model Scanlon 1987
Ni Virginia Peromyscus leucopus Omnivore 1 2.75 0.36364 model Scanlon 1987
Ni Virginia Peromyscus leucopus Omnivore 1.48 4.2 0.35238 model Scanlon 1987
Ni Virginia Mus musculus Omnivore 0.45 3.5 0.12857 model Scanlon 1987
Ni Virginia Rattus norvegicus Omnivore 1.6 3.5 0.45714 model Scanlon 1987
Ni MD,PA,NJ Mus musculus Omnivore 7.9 17 0.46471 model Beyer et al. 1990
Ni MD,PA,NJ Mus musculus Omnivore 5.3 13 0.40769 model Beyer et al. 1990
Ni MD,PA,NJ Peromyscus leucopus Omnivore 3.2 150 0.02133 model Beyer et al. 1990
Ni MD,PA,NJ Mus musculus Omnivore 9.6 12 0.80000 model Beyer et al. 1990
Ni MD,PA,NJ Mus musculus Omnivore 3.7 28 0.13214 model Beyer et al. 1990
Ni MD,PA,NJ Mus musculus Omnivore 5.7 150 0.03800 model Beyer et al. 1990
Pb GreatBritain Sorex araneus (immature) Carnivore 10.3 98 0.10510 model Read and Martin 1993
Pb GreatBritain Sorex araneus (adult) Carnivore 2.48 98 0.02531 model Read and Martin 1993
Pb Virginia Blarina brevicauda Carnivore 35.13 137 0.25642 model Scanlon 1987
Pb Virginia Blarina brevicauda Carnivore 5.2 27.4 0.18978 model Quarles et al. 1974
Pb GreatBritain Sorex araneus (adult) Carnivore 6.37 33 0.19303 model Read and Martin 1993
Pb Virginia Blarina brevicauda Carnivore 72.56 307.5 0.23597 model Scanlon 1987
Pb GreatBritain Sorex araneus (immature) Carnivore 16.62 125 0.13296 model Read and Martin 1993
Pb Virginia Blarina brevicauda Carnivore 5.4 17.7 0.30508 model Quarles et al. 1974
Pb Virginia Blarina brevicauda Carnivore 22.7 143.4 0.15830 model Quarles et al. 1974
Pb GreatBritain Sorex araneus (immature) Carnivore 4.46 33 0.13515 model Read and Martin 1993
Pb Virginia Blarina brevicauda Carnivore 12.03 35.5 0.33887 model Scanlon 1987
Pb GreatBritain Sorex minutus (adult) Carnivore 9.21 33 0.27909 model Read and Martin 1993
Pb GreatBritain Sorex minutus (adult) Carnivore 8.44 50 0.16880 model Read and Martin 1993

B-12
Table B.1 (cont.)
Analyte Study Location SpeciesTrophicGroup
TissueConcentration mg/kg dry wt.
SoilConcentration mg/kg dry wt.
UptakeFactor
Portion ofDataset Reference
Pb GreatBritain Sorex minutus (adult) Carnivore 30.39 138 0.22022 model Read and Martin 1993
Pb GreatBritain Sorex araneus (immature) Carnivore 19.3 138 0.13986 model Read and Martin 1993
Pb GreatBritain Sorex araneus (adult) Carnivore 90 1142 0.07881 model Read and Martin 1993
Pb GreatBritain Sorex minutus (adult) Carnivore 97.41 1142 0.08530 model Read and Martin 1993
Pb GreatBritain Sorex minutus (adult) Carnivore 19.86 125 0.15888 model Read and Martin 1993
Pb GreatBritain Sorex minutus (immature) Carnivore 85.45 1142 0.07482 model Read and Martin 1993
Pb GreatBritain Sorex minutus (immature) Carnivore 8.07 50 0.16140 model Read and Martin 1993
Pb GreatBritain Sorex minutus (immature) Carnivore 25.53 138 0.18500 model Read and Martin 1993
Pb GreatBritain Sorex minutus (immature) Carnivore 10.68 98 0.10898 model Read and Martin 1993
Pb GreatBritain Sorex araneus Carnivore 35 8430 0.00415 model Roberts et al. 1978
Pb GreatBritain Sorex araneus (immature) Carnivore 5.9 50 0.11800 model Read and Martin 1993
Pb GreatBritain Sorex minutus (immature) Carnivore 15.02 125 0.12016 model Read and Martin 1993
Pb Virginia Sorex cinereus Carnivore 9.65 35.5 0.27183 model Scanlon 1987
Pb GreatBritain Sorex araneus Carnivore 2.75 96.3 0.02856 model Roberts et al. 1978
Pb Virginia Cryptotis parva Carnivore 6.66 35.5 0.18761 model Scanlon 1987
Pb GreatBritain Sorex minutus (immature) Carnivore 7.54 33 0.22848 model Read and Martin 1993
Pb GreatBritain Sorex araneus (adult) Carnivore 19.69 125 0.15752 model Read and Martin 1993
Pb Virginia Cryptotis parva Carnivore 3.44 20.75 0.16578 model Scanlon 1987
Pb Virginia Cryptotis parva Carnivore 17.16 137 0.12526 model Scanlon 1987
Pb GreatBritain Sorex minutus (adult) Carnivore 12.91 98 0.13173 model Read and Martin 1993
Pb Virginia Blarina brevicauda Carnivore 4.4 20.75 0.21205 model Scanlon 1987
Pb GreatBritain Sorex araneus (adult) Carnivore 7.06 50 0.14120 model Read and Martin 1993
Pb GreatBritain Sorex araneus (adult) Carnivore 33.4 138 0.24203 model Read and Martin 1993
Pb GreatBritain Sorex araneus (immature) Carnivore 63.43 1142 0.05554 model Read and Martin 1993
Pb GreatBritain Sorex araneus Carnivore 90.9 4413 0.02060 model Andrews et al. 1989a
Pb Virginia Sorex cinereus Carnivore 13.7 50.07 0.27362 model Goldsmith and Scanlon 1977
Pb Virginia Cryptotis parva Carnivore 10.4 50.07 0.20771 model Goldsmith and Scanlon 1977
Pb Virginia Blarina brevicauda Carnivore 15.8 50.07 0.31556 model Goldsmith and Scanlon 1977
Pb Virginia Cryptotis parva Carnivore 6.5 24.07 0.27005 model Goldsmith and Scanlon 1977
Pb Pennsylvania Blarina brevicauda Carnivore 109 41 2.65854 model Beyer et al. 1985

B-13
Table B.1 (cont.)
Analyte Study Location SpeciesTrophicGroup
TissueConcentration mg/kg dry wt.
SoilConcentration mg/kg dry wt.
UptakeFactor
Portion ofDataset Reference
Pb Virginia Parascalops breweri Carnivore 15.8 24.07 0.65642 model Goldsmith and Scanlon 1977
Pb Virginia Blarina brevicauda Carnivore 14.1 7.84 1.79847 model Goldsmith and Scanlon 1977
Pb Pennsylvania Blarina brevicauda Carnivore 18 150 0.12000 model Beyer et al. 1985
Pb MD,PA,NJ Blarina brevicauda Carnivore 5.7 92 0.06196 model Beyer et al. 1990
Pb Virginia Blarina brevicauda Carnivore 34.8 71.45 0.48705 model Goldsmith and Scanlon 1977
Pb GreatBritain Sorex araneus Carnivore 11.4 119.6 0.09532 model Andrews et al. 1989a
Pb Virginia Blarina brevicauda Carnivore 11.6 24.07 0.48193 model Goldsmith and Scanlon 1977
Pb GreatBritain Sorex araneus Carnivore 86.7 3960 0.02189 model Andrews et al. 1989a
Pb GreatBritain Sorex araneus Carnivore 23.1 108.9 0.21212 model Andrews et al. 1989a
Pb Tennessee Blarina brevicauda Carnivore 0.677 15.3 0.04425 model DOE 1995
Pb GreatBritain Sorex araneus Carnivore 7.2 94.3 0.07635 model Andrews et al. 1989a
Pb GreatBritain Sorex araneus Carnivore 120 3411 0.03518 model Andrews et al. 1989a
Pb Tennessee Microtus pinetorum Herbivore 0.476 15.3 0.03111 model DOE 1995
Pb Virginia Microtus pennsylvanicus Herbivore 7.21 35.5 0.20310 model Scanlon 1987
Pb GreatBritain Microtus agrestis Herbivore 8.625 78 0.11058 model Roberts et al. 1978
Pb GreatBritain Microtus agrestis Herbivore 8.625 96.3 0.08956 model Roberts et al. 1978
Pb Virginia Microtus pennsylvanicus Herbivore 6.9 24.07 0.28666 model Goldsmith and Scanlon 1977
Pb GreatBritain Microtus agrestis Herbivore 133.75 14010 0.00955 model Roberts et al. 1978
Pb Virginia Microtus pennsylvanicus Herbivore 12.1 50.07 0.24166 model Goldsmith and Scanlon 1977
Pb Ontario Microtus pennsylvanicus Herbivore 4 30 0.13333 model Cloutier et al. 1985
Pb GreatBritain Microtus agrestis Herbivore 141.563 8430 0.01679 model Roberts et al. 1978
Pb GreatBritain Clethrionomys glareolus Herbivore 50.938 8430 0.00604 model Roberts et al. 1978
Pb Ontario Microtus pennsylvanicus Herbivore 5 60 0.08333 model Cloutier et al. 1985
Pb Ontario Microtus pennsylvanicus Herbivore 5 200 0.02500 model Cloutier et al. 1985
Pb MD,PA,NJ Microtus pennsylvanicus Herbivore 4.6 92 0.05000 model Beyer et al. 1990
Pb Virginia Microtus pennsylvanicus Herbivore 23.07 307.5 0.07502 model Scanlon 1987
Pb GreatBritain Clethrionomys glareolus Herbivore 8.25 78 0.10577 model Roberts et al. 1978
Pb GreatBritain Apodemus sylvaticus Herbivore 3.625 78 0.04647 model Roberts et al. 1978
Pb GreatBritain Microtus agrestis Herbivore 11.1 108.9 0.10193 model Andrews et al. 1989a
Pb GreatBritain Microtus agrestis Herbivore 96.7 3960 0.02442 model Andrews et al. 1989a

B-14
Table B.1 (cont.)
Analyte Study Location SpeciesTrophicGroup
TissueConcentration mg/kg dry wt.
SoilConcentration mg/kg dry wt.
UptakeFactor
Portion ofDataset Reference
Pb Virginia Microtus pennsylvanicus Herbivore 16.3 143.4 0.11367 model Quarles et al. 1974
Pb Virginia Microtus pennsylvanicus Herbivore 3.8 22.2 0.17117 model Quarles et al. 1974
Pb Virginia Microtus pennsylvanicus Herbivore 4.9 17.7 0.27684 model Quarles et al. 1974
Pb Virginia Microtus pennsylvanicus Herbivore 5.8 36 0.16111 model Quarles et al. 1974
Pb GreatBritain Apodemus sylvaticus Herbivore 43.4375 14010 0.00310 model Roberts et al. 1978
Pb GreatBritain Apodemus sylvaticus Herbivore 2.875 96.3 0.02985 model Roberts et al. 1978
Pb Montana Microtus pennsylvanicus Herbivore 1.875 65.7 0.02854 model Pascoe et al. 1994, 1996
Pb GreatBritain Microtus agrestis Herbivore 40.3 4413 0.00913 model Andrews et al. 1989a
Pb GreatBritain Microtus agrestis Herbivore 6.5 119.6 0.05435 model Andrews et al. 1989a
Pb Virginia Microtus pennsylvanicus Herbivore 16.63 137 0.12139 model Scanlon 1987
Pb GreatBritain Clethrionomys glareolus Herbivore 7.375 96.3 0.07658 model Roberts et al. 1978
Pb GreatBritain Clethrionomys glareolus Herbivore 64.6875 14010 0.00462 model Roberts et al. 1978
Pb GreatBritain Microtus agrestis Herbivore 41.2 3411 0.01208 model Andrews et al. 1989a
Pb GreatBritain Apodemus sylvaticus Herbivore 26.875 8430 0.00319 model Roberts et al. 1978
Pb Virginia Microtus pennsylvanicus Herbivore 2.29 20.75 0.11036 model Scanlon 1987
Pb GreatBritain Microtus agrestis Herbivore 6.3 94.3 0.06681 model Andrews et al. 1989a
Pb Tennessee Peromyscus leucopus Omnivore 0.271 15.3 0.01771 model DOE 1995
Pb Virginia Peromyscus leucopus Omnivore 13.38 137 0.09766 model Scanlon 1987
Pb Tennessee Peromyscus leucopus Omnivore 0.139 16 0.00869 model DOE 1995
Pb Tennessee Peromyscus leucopus Omnivore 0.967 16 0.06044 model DOE 1995
Pb Tennessee Peromyscus leucopus Omnivore 0.172 16 0.01075 model DOE 1995
Pb Tennessee Peromyscus leucopus Omnivore 0.338 16 0.02112 model DOE 1995
Pb Tennessee Peromyscus leucopus Omnivore 1.453 16 0.09081 model DOE 1995
Pb Virginia Peromyscus leucopus Omnivore 1.85 20.75 0.08916 model Scanlon 1987
Pb Tennessee Peromyscus leucopus Omnivore 0.821 15.3 0.05366 model DOE 1995
Pb MD,PA,NJ Mus musculus Omnivore 5.4 92 0.05870 model Beyer et al. 1990
Pb Virginia Peromyscus leucopus Omnivore 3.9 35.1 0.11111 model Quarles et al. 1974
Pb Virginia Peromyscus leucopus Omnivore 2.6 22.3 0.11659 model Quarles et al. 1974
Pb Virginia Peromyscus leucopus Omnivore 2.6 17.7 0.14689 model Quarles et al. 1974
Pb Virginia Peromyscus leucopus Omnivore 6.8 143.4 0.04742 model Quarles et al. 1974

B-15
Table B.1 (cont.)
Analyte Study Location SpeciesTrophicGroup
TissueConcentration mg/kg dry wt.
SoilConcentration mg/kg dry wt.
UptakeFactor
Portion ofDataset Reference
Pb Pennsylvania Peromyscus leucopus Omnivore 7.4 150 0.04933 model Beyer et al. 1985
Pb Pennsylvania Peromyscus leucopus Omnivore 17 41 0.41463 model Beyer et al. 1985
Pb Virginia Rattus norvegicus Omnivore 27.95 137 0.20401 model Scanlon 1987
Pb MD,PA,NJ Mus musculus Omnivore 2.1 22 0.09545 model Beyer et al. 1990
Pb MD,PA,NJ Mus musculus Omnivore 7.9 530 0.01491 model Beyer et al. 1990
Pb Tennessee Peromyscus leucopus Omnivore 0.285 16 0.01781 model DOE 1995
Pb MD,PA,NJ Mus musculus Omnivore 6.3 22 0.28636 model Beyer et al. 1990
Pb Tennessee Reithrodontomys Omnivore 10.267 16 0.64169 model DOE 1995
Pb MD,PA,NJ Mus musculus Omnivore 3.1 29 0.10690 model Beyer et al. 1990
Pb MD,PA,NJ Peromyscus leucopus Omnivore 1.8 92 0.01957 model Beyer et al. 1990
Pb Tennessee Peromyscus leucopus Omnivore 0.492 15.3 0.03216 model DOE 1995
Pb Tennessee Peromyscus leucopus Omnivore 0.195 16 0.01219 model DOE 1995
Pb Tennessee Peromyscus leucopus Omnivore 0.647 15.3 0.04229 model DOE 1995
Pb Tennessee Peromyscus leucopus Omnivore 0.611 16 0.03819 model DOE 1995
Pb Virginia Peromyscus leucopus Omnivore 9.7 50.07 0.19373 model Goldsmith and Scanlon 1977
Pb Tennessee Reithrodontomys Omnivore 0.151 16 0.00944 model DOE 1995
Pb Tennessee Reithrodontomys Omnivore 0.056 16 0.00350 model DOE 1995
Pb Virginia Peromyscus leucopus Omnivore 5.24 35.5 0.14761 model Scanlon 1987
Pb Virginia Zapus hudsonius Omnivore 9.1 71.45 0.12736 model Goldsmith and Scanlon 1977
Pb Virginia Peromyscus leucopus Omnivore 21.96 307.5 0.07141 model Scanlon 1987
Pb Tennessee Reithrodontomys Omnivore 0.137 16 0.00856 model DOE 1995
Pb Virginia Peromyscus leucopus Omnivore 15.6 71.45 0.21833 model Goldsmith and Scanlon 1977
Pb Virginia Peromyscus leucopus Omnivore 5 7.84 0.63776 model Goldsmith and Scanlon 1977
Pb Virginia Mus musculus Omnivore 64.25 307.5 0.20894 model Scanlon 1987
Pb Virginia Mus musculus Omnivore 11.32 35.5 0.31887 model Scanlon 1987
Pb Virginia Mus musculus Omnivore 21.73 137 0.15861 model Scanlon 1987
Pb Virginia Glaucomys volans Omnivore 7.8 7.84 0.99490 model Goldsmith and Scanlon 1977
Se MD,PA,NJ Blarina brevicauda Carnivore 0.61 0.75 0.81333 model Beyer et al. 1990
Se Tennessee Blarina brevicauda Carnivore 2.33 3.67 0.63488 model DOE 1995
Se Tennessee Microtus pinetorum Herbivore 0.569 3.67 0.15504 model DOE 1995

B-16
Table B.1 (cont.)
Analyte Study Location SpeciesTrophicGroup
TissueConcentration mg/kg dry wt.
SoilConcentration mg/kg dry wt.
UptakeFactor
Portion ofDataset Reference
Se Tennessee Peromyscus leucopus Omnivore 1.722 11.2 0.15375 model DOE 1995
Se Tennessee Peromyscus leucopus Omnivore 1.813 11.2 0.16188 model DOE 1995
Se MD,PA,NJ Mus musculus Omnivore 0.89 0.75 1.18667 model Beyer et al. 1990
Se MD,PA,NJ Mus musculus Omnivore 0.98 4.8 0.20417 model Beyer et al. 1990
Se MD,PA,NJ Mus musculus Omnivore 0.48 0.38 1.26316 model Beyer et al. 1990
Se MD,PA,NJ Mus musculus Omnivore 0.55 0.89 0.61798 model Beyer et al. 1990
Se Tennessee Reithrodontomys Omnivore 1.4 11.2 0.12500 model DOE 1995
Se Tennessee Peromyscus leucopus Omnivore 0.329 3.67 0.08965 model DOE 1995
Se Tennessee Peromyscus leucopus Omnivore 2.583 11.2 0.23062 model DOE 1995
Se Tennessee Peromyscus leucopus Omnivore 0.764 3.67 0.20817 model DOE 1995
Se Tennessee Peromyscus leucopus Omnivore 0.446 11.2 0.03982 model DOE 1995
Se Tennessee Peromyscus leucopus Omnivore 3.937 11.2 0.35152 model DOE 1995
Se Tennessee Peromyscus leucopus Omnivore 0.455 3.67 0.12398 model DOE 1995
Se Tennessee Peromyscus leucopus Omnivore 5.64 11.2 0.50357 model DOE 1995
Se Tennessee Reithrodontomys Omnivore 0.387 11.2 0.03455 model DOE 1995
Se Tennessee Peromyscus leucopus Omnivore 1.973 11.2 0.17616 model DOE 1995
Se Tennessee Peromyscus leucopus Omnivore 0.474 3.67 0.12916 model DOE 1995
Se Tennessee Reithrodontomys Omnivore 3.387 11.2 0.30241 model DOE 1995
Se Tennessee Reithrodontomys Omnivore 2.597 11.2 0.23188 model DOE 1995
Se Tennessee Peromyscus leucopus Omnivore 2.387 11.2 0.21312 model DOE 1995
Se MD,PA,NJ Mus musculus Omnivore 0.43 0.66 0.65152 model Beyer et al. 1990
TCDD Italy Microtus arvalis Herbivore 0.0045 0.0035 1.28571 model Fanelli et al. 1980
TCDD Wisconsin Peromyscus maniculatus Omnivore 0.000009 0.000025 0.36800 model ERT 1987
TCDD Wisconsin Peromyscus maniculatus Omnivore 0.000044 0.000021 2.09524 model ERT 1987
TCDD Wisconsin Peromyscus maniculatus Omnivore 0.000005 0.00001 0.49495 model ERT 1987
TCDD Wisconsin Peromyscus maniculatus Omnivore 0.000032 0.000031 1.03226 model ERT 1987
TCDF Wisconsin Peromyscus maniculatus Omnivore 0.000011 0.000069 0.15942 model ERT 1987
TCDF Wisconsin Peromyscus maniculatus Omnivore 0.000004 0.000046 0.08043 model ERT 1987
TCDF Wisconsin Peromyscus maniculatus Omnivore 0.000007 0.000066 0.11061 model ERT 1987
TCDF Wisconsin Peromyscus maniculatus Omnivore 0.000007 0.000054 0.13519 model ERT 1987

B-17
Table B.1 (cont.)
Analyte Study Location SpeciesTrophicGroup
TissueConcentration mg/kg dry wt.
SoilConcentration mg/kg dry wt.
UptakeFactor
Portion ofDataset Reference
Tl Tennessee Peromyscus leucopus Omnivore 0.243 1.98 0.12273 model DOE 1995
Tl Tennessee Reithrodontomys Omnivore 0.202 1.98 0.10202 model DOE 1995
Zn GreatBritain Sorex araneus (adult) Carnivore 129.92 74 1.75568 model Read and Martin 1993
Zn GreatBritain Sorex araneus (adult) Carnivore 184.26 1389 0.13266 model Read and Martin 1993
Zn GreatBritain Sorex araneus (adult) Carnivore 117.46 159 0.73874 model Read and Martin 1993
Zn Virginia Sorex cinereus Carnivore 146.18 21 6.96095 model Scanlon 1987
Zn GreatBritain Sorex araneus (adult) Carnivore 140.8 112 1.25714 model Read and Martin 1993
Zn MD,PA,NJ Blarina brevicauda Carnivore 110 240 0.45833 model Beyer et al. 1990
Zn GreatBritain Sorex araneus (immature) Carnivore 182.47 1389 0.13137 model Read and Martin 1993
Zn GreatBritain Sorex araneus (adult) Carnivore 149.99 193 0.77715 model Read and Martin 1993
Zn GreatBritain Sorex araneus Carnivore 129 61.9 2.08401 model Andrews et al. 1989b
Zn Pennsylvania Blarina brevicauda Carnivore 377 2900 0.13000 model Beyer et al. 1985
Zn GreatBritain Sorex araneus (adult) Carnivore 162.54 257 0.63245 model Read and Martin 1993
Zn Pennsylvania Blarina brevicauda Carnivore 201 230 0.87391 model Beyer et al. 1985
Zn GreatBritain Sorex araneus Carnivore 172 1925 0.08935 model Andrews et al. 1989b
Zn GreatBritain Sorex araneus (immature) Carnivore 147.34 193 0.76342 model Read and Martin 1993
Zn GreatBritain Sorex araneus (immature) Carnivore 134.96 257 0.52514 model Read and Martin 1993
Zn GreatBritain Sorex minutus (adult) Carnivore 134.34 257 0.52272 model Read and Martin 1993
Zn GreatBritain Sorex minutus (adult) Carnivore 122.47 193 0.63456 model Read and Martin 1993
Zn GreatBritain Sorex minutus (adult) Carnivore 187.15 1389 0.13474 model Read and Martin 1993
Zn Virginia Blarina brevicauda Carnivore 122.45 50.25 2.43682 model Scanlon 1987
Zn GreatBritain Sorex minutus (adult) Carnivore 117.51 112 1.04920 model Read and Martin 1993
Zn GreatBritain Sorex minutus (adult) Carnivore 122.7 159 0.77170 model Read and Martin 1993
Zn GreatBritain Sorex minutus (immature) Carnivore 127.84 257 0.49743 model Read and Martin 1993
Zn Virginia Blarina brevicauda Carnivore 100.01 37.6 2.65984 model Scanlon 1987
Zn GreatBritain Sorex minutus (immature) Carnivore 127.36 193 0.65990 model Read and Martin 1993
Zn GreatBritain Sorex minutus (immature) Carnivore 131.08 74 1.77135 model Read and Martin 1993
Zn GreatBritain Sorex minutus (immature) Carnivore 111.81 112 0.99830 model Read and Martin 1993
Zn GreatBritain Sorex minutus (immature) Carnivore 125.19 159 0.78736 model Read and Martin 1993
Zn Virginia Blarina brevicauda Carnivore 139.2 61.75 2.25425 model Scanlon 1987

B-18
Table B.1 (cont.)
Analyte Study Location SpeciesTrophicGroup
TissueConcentration mg/kg dry wt.
SoilConcentration mg/kg dry wt.
UptakeFactor
Portion ofDataset Reference
Zn Virginia Blarina brevicauda Carnivore 122.88 21 5.85143 model Scanlon 1987
Zn GreatBritain Sorex minutus (adult) Carnivore 103.14 74 1.39378 model Read and Martin 1993
Zn GreatBritain Sorex minutus (immature) Carnivore 146.02 1389 0.10513 model Read and Martin 1993
Zn GreatBritain Sorex araneus (immature) Carnivore 120.92 112 1.07964 model Read and Martin 1993
Zn GreatBritain Sorex araneus (immature) Carnivore 114.74 74 1.55054 model Read and Martin 1993
Zn GreatBritain Sorex araneus (immature) Carnivore 132.41 159 0.83277 model Read and Martin 1993
Zn Virginia Cryptotis parva Carnivore 110.71 50.25 2.20318 model Scanlon 1987
Zn Virginia Cryptotis parva Carnivore 123.46 21 5.87905 model Scanlon 1987
Zn Virginia Cryptotis parva Carnivore 109.08 37.6 2.90106 model Scanlon 1987
Zn GreatBritain Clethrionomys glareolus Herbivore 102.6 131 0.78321 model Johnson et al. 1978
Zn GreatBritain Clethrionomys glareolus Herbivore 142.7 125 1.14160 model Johnson et al. 1978
Zn GreatBritain Microtus agrestis Herbivore 121.2 131 0.92519 model Johnson et al. 1978
Zn GreatBritain Microtus agrestis Herbivore 191.6 21000 0.00912 model Johnson et al. 1978
Zn Virginia Microtus pennsylvanicus Herbivore 97.52 37.6 2.59362 model Scanlon 1987
Zn GreatBritain Microtus agrestis Herbivore 121.2 125 0.96960 model Johnson et al. 1978
Zn GreatBritain Microtus agrestis Herbivore 169.3 1766 0.09587 model Johnson et al. 1978
Zn Montana Microtus pennsylvanicus Herbivore 85.9375 1908.9 0.04502 model Pascoe et al. 1994, 1996
Zn GreatBritain Clethrionomys glareolus Herbivore 123.4 21000 0.00588 model Johnson et al. 1978
Zn GreatBritain Clethrionomys glareolus Herbivore 142.9 1766 0.08092 model Johnson et al. 1978
Zn GreatBritain Apodemus sylvaticus Herbivore 112.3 125 0.89840 model Johnson et al. 1978
Zn GreatBritain Apodemus sylvaticus Herbivore 95.8 131 0.73130 model Johnson et al. 1978
Zn Virginia Microtus pennsylvanicus Herbivore 119.03 61.75 1.92761 model Scanlon 1987
Zn Ontario Microtus pennsylvanicus Herbivore 100 80 1.25000 model Cloutier et al. 1985
Zn GreatBritain Apodemus sylvaticus Herbivore 114.6 1766 0.06489 model Johnson et al. 1978
Zn Ontario Microtus pennsylvanicus Herbivore 90 5.5 16.36364 model Cloutier et al. 1985
Zn GreatBritain Apodemus sylvaticus Herbivore 107.3 21000 0.00511 model Johnson et al. 1978
Zn Ontario Microtus pennsylvanicus Herbivore 85 90 0.94444 model Cloutier et al. 1985
Zn MD,PA,NJ Microtus pennsylvanicus Herbivore 89 240 0.37083 model Beyer et al. 1990
Zn Virginia Microtus pennsylvanicus Herbivore 105.46 21 5.02190 model Scanlon 1987
Zn GreatBritain Microtus agrestis Herbivore 103 61.9 1.66397 model Andrews et al. 1989b

B-19
Table B.1 (cont.)
Analyte Study Location SpeciesTrophicGroup
TissueConcentration mg/kg dry wt.
SoilConcentration mg/kg dry wt.
UptakeFactor
Portion ofDataset Reference
Zn GreatBritain Microtus agrestis Herbivore 153 1925 0.07948 model Andrews et al. 1989b
Zn Virginia Microtus pennsylvanicus Herbivore 102.51 50.25 2.04000 model Scanlon 1987
Zn Virginia Mus musculus Omnivore 50.94 21 2.42571 model Scanlon 1987
Zn Montana Peromyscus maniculatus Omnivore 92.1875 1908.9 0.04829 model Pascoe et al. 1994, 1996
Zn Virginia Mus musculus Omnivore 84.98 50.25 1.69114 model Scanlon 1987
Zn Virginia Peromyscus leucopus Omnivore 109.99 61.75 1.78121 model Scanlon 1987
Zn Virginia Mus musculus Omnivore 99.26 61.75 1.60745 model Scanlon 1987
Zn Virginia Peromyscus leucopus Omnivore 104.61 37.6 2.78218 model Scanlon 1987
Zn Virginia Peromyscus leucopus Omnivore 90.23 21 4.29667 model Scanlon 1987
Zn Virginia Peromyscus leucopus Omnivore 104.12 50.25 2.07204 model Scanlon 1987
Zn Virginia Rattus norvegicus Omnivore 135.06 50.25 2.68776 model Scanlon 1987
Zn Pennsylvania Peromyscus leucopus Omnivore 145 230 0.63043 model Beyer et al. 1985
Zn MD,PA,NJ Mus musculus Omnivore 89 74 1.20270 model Beyer et al. 1990
Zn MD,PA,NJ Mus musculus Omnivore 90 83 1.08434 model Beyer et al. 1990
Zn MD,PA,NJ Mus musculus Omnivore 97 200 0.48500 model Beyer et al. 1990
Zn MD,PA,NJ Mus musculus Omnivore 87 240 0.36250 model Beyer et al. 1990
Zn Pennsylvania Peromyscus leucopus Omnivore 192 2900 0.06621 model Beyer et al. 1985
Zn MD,PA,NJ Mus musculus Omnivore 93 120 0.77500 model Beyer et al. 1990
Zn MD,PA,NJ Peromyscus leucopus Omnivore 84 240 0.35000 model Beyer et al. 1990
Ag Oklahoma Sigmodon hispidus Herbivore 0 0 ERR validation PTI 1995
Ag Oklahoma Sigmodon hispidus Herbivore 0 0.445 0.00000 validation PTI 1995
Ag Oklahoma Sigmodon hispidus Herbivore 0 1 0.00000 validation PTI 1995
Ag Oklahoma Sigmodon hispidus Herbivore 0 0.76 0.00000 validation PTI 1995
Ag Oklahoma Sigmodon hispidus Herbivore 0.04 5.4 0.00741 validation PTI 1995
Ag Oklahoma Sigmodon hispidus Herbivore 0.03 6.9 0.00435 validation PTI 1995
Ag Oklahoma Sigmodon hispidus Herbivore 0 3 0.00000 validation PTI 1995
Ag Oklahoma Peromyscus leucopus Omnivore 1.7 2.1 0.80952 validation PTI 1995
Ag Oklahoma Peromyscus leucopus Omnivore 0.56 2.9 0.19310 validation PTI 1995
Ag Oklahoma Peromyscus leucopus Omnivore 0 0 ERR validation PTI 1995
Ag Oklahoma Peromyscus leucopus Omnivore 0.02 5.4 0.00370 validation PTI 1995

B-20
Table B.1 (cont.)
Analyte Study Location SpeciesTrophicGroup
TissueConcentration mg/kg dry wt.
SoilConcentration mg/kg dry wt.
UptakeFactor
Portion ofDataset Reference
Ag Oklahoma Peromyscus leucopus Omnivore 0.23 2.1 0.10952 validation PTI 1995
Al Oklahoma Sigmodon hispidus Herbivore 93.6 14700 0.00637 validation PTI 1995
Al Oklahoma Sigmodon hispidus Herbivore 300 13750 0.02182 validation PTI 1995
Al Oklahoma Sigmodon hispidus Herbivore 138 12200 0.01131 validation PTI 1995
Al Oklahoma Sigmodon hispidus Herbivore 280 16400 0.01707 validation PTI 1995
Al Oklahoma Sigmodon hispidus Herbivore 508 16500 0.03079 validation PTI 1995
Al Oklahoma Sigmodon hispidus Herbivore 279 16100 0.01733 validation PTI 1995
Al Oklahoma Sigmodon hispidus Herbivore 327 21050 0.01553 validation PTI 1995
Al Oklahoma Peromyscus leucopus Omnivore 1540 21050 0.07316 validation PTI 1995
Al Oklahoma Peromyscus leucopus Omnivore 1260 13600 0.09265 validation PTI 1995
Al Oklahoma Peromyscus leucopus Omnivore 840 13600 0.06176 validation PTI 1995
Al Oklahoma Peromyscus leucopus Omnivore 694 14550 0.04770 validation PTI 1995
Al Oklahoma Peromyscus leucopus Omnivore 688 16100 0.04273 validation PTI 1995
As Oklahoma Sigmodon hispidus Herbivore 0 15.4 0.00000 validation PTI 1995
As Oklahoma Sigmodon hispidus Herbivore 0 20.8 0.00000 validation PTI 1995
As Oklahoma Sigmodon hispidus Herbivore 0 38.8 0.00000 validation PTI 1995
As Oklahoma Sigmodon hispidus Herbivore 0 7.55 0.00000 validation PTI 1995
As Oklahoma Sigmodon hispidus Herbivore 0 6.2 0.00000 validation PTI 1995
As Oklahoma Sigmodon hispidus Herbivore 0 4.9 0.00000 validation PTI 1995
As Oklahoma Sigmodon hispidus Herbivore 0 5.7 0.00000 validation PTI 1995
As Montana Peromyscus maniculatus Omnivore 1.3 178 0.00730 validation LaTier et al. 1995
As Montana Peromyscus maniculatus Omnivore 0.37 30 0.01233 validation LaTier et al. 1995
As Montana Peromyscus maniculatus Omnivore 1.7 278 0.00612 validation LaTier et al. 1995
As Montana Peromyscus maniculatus Omnivore 0.44 154 0.00286 validation LaTier et al. 1995
As Montana Peromyscus maniculatus Omnivore 1.1 201 0.00547 validation LaTier et al. 1995
As Montana Peromyscus maniculatus Omnivore 0.44 342 0.00129 validation LaTier et al. 1995
As Montana Peromyscus maniculatus Omnivore 4.5 63.7 0.07064 validation LaTier et al. 1995
As Montana Peromyscus maniculatus Omnivore 11 1400 0.00786 validation LaTier et al. 1995
As Oklahoma Peromyscus leucopus Omnivore 0 7.9 0.00000 validation PTI 1995
As Montana Peromyscus maniculatus Omnivore 3.2 586 0.00546 validation LaTier et al. 1995
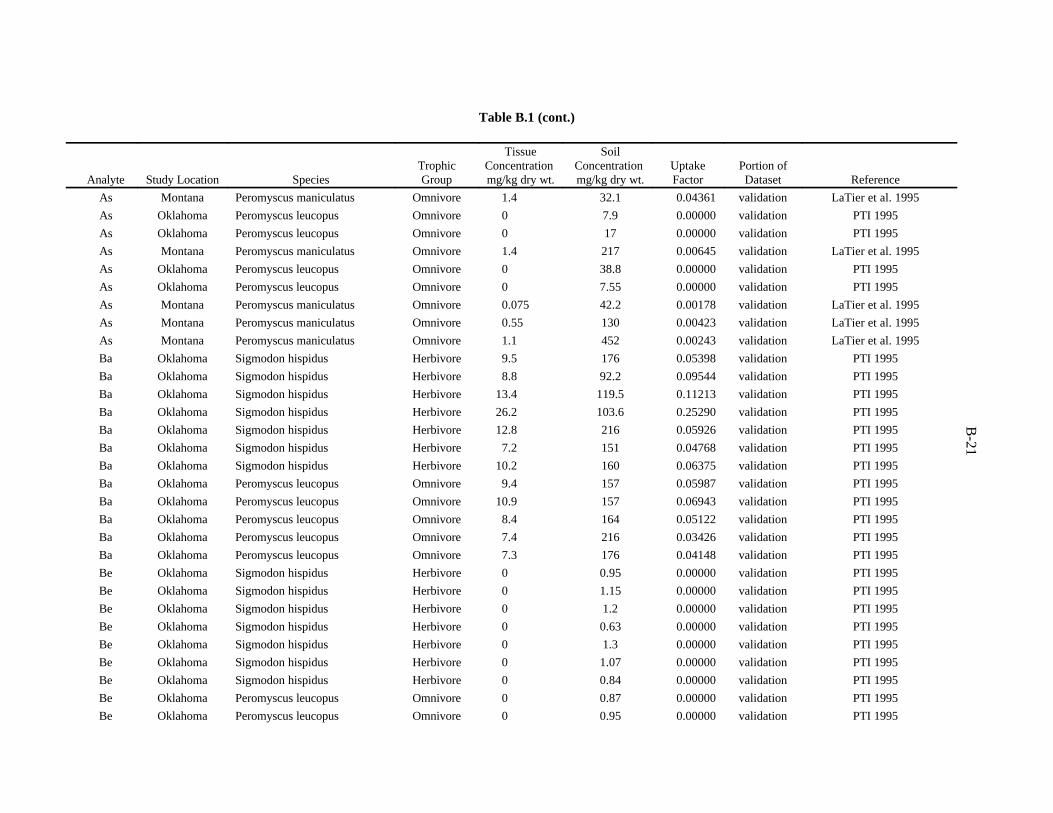
B-21
Table B.1 (cont.)
Analyte Study Location SpeciesTrophicGroup
TissueConcentration mg/kg dry wt.
SoilConcentration mg/kg dry wt.
UptakeFactor
Portion ofDataset Reference
As Montana Peromyscus maniculatus Omnivore 1.4 32.1 0.04361 validation LaTier et al. 1995
As Oklahoma Peromyscus leucopus Omnivore 0 7.9 0.00000 validation PTI 1995
As Oklahoma Peromyscus leucopus Omnivore 0 17 0.00000 validation PTI 1995
As Montana Peromyscus maniculatus Omnivore 1.4 217 0.00645 validation LaTier et al. 1995
As Oklahoma Peromyscus leucopus Omnivore 0 38.8 0.00000 validation PTI 1995
As Oklahoma Peromyscus leucopus Omnivore 0 7.55 0.00000 validation PTI 1995
As Montana Peromyscus maniculatus Omnivore 0.075 42.2 0.00178 validation LaTier et al. 1995
As Montana Peromyscus maniculatus Omnivore 0.55 130 0.00423 validation LaTier et al. 1995
As Montana Peromyscus maniculatus Omnivore 1.1 452 0.00243 validation LaTier et al. 1995
Ba Oklahoma Sigmodon hispidus Herbivore 9.5 176 0.05398 validation PTI 1995
Ba Oklahoma Sigmodon hispidus Herbivore 8.8 92.2 0.09544 validation PTI 1995
Ba Oklahoma Sigmodon hispidus Herbivore 13.4 119.5 0.11213 validation PTI 1995
Ba Oklahoma Sigmodon hispidus Herbivore 26.2 103.6 0.25290 validation PTI 1995
Ba Oklahoma Sigmodon hispidus Herbivore 12.8 216 0.05926 validation PTI 1995
Ba Oklahoma Sigmodon hispidus Herbivore 7.2 151 0.04768 validation PTI 1995
Ba Oklahoma Sigmodon hispidus Herbivore 10.2 160 0.06375 validation PTI 1995
Ba Oklahoma Peromyscus leucopus Omnivore 9.4 157 0.05987 validation PTI 1995
Ba Oklahoma Peromyscus leucopus Omnivore 10.9 157 0.06943 validation PTI 1995
Ba Oklahoma Peromyscus leucopus Omnivore 8.4 164 0.05122 validation PTI 1995
Ba Oklahoma Peromyscus leucopus Omnivore 7.4 216 0.03426 validation PTI 1995
Ba Oklahoma Peromyscus leucopus Omnivore 7.3 176 0.04148 validation PTI 1995
Be Oklahoma Sigmodon hispidus Herbivore 0 0.95 0.00000 validation PTI 1995
Be Oklahoma Sigmodon hispidus Herbivore 0 1.15 0.00000 validation PTI 1995
Be Oklahoma Sigmodon hispidus Herbivore 0 1.2 0.00000 validation PTI 1995
Be Oklahoma Sigmodon hispidus Herbivore 0 0.63 0.00000 validation PTI 1995
Be Oklahoma Sigmodon hispidus Herbivore 0 1.3 0.00000 validation PTI 1995
Be Oklahoma Sigmodon hispidus Herbivore 0 1.07 0.00000 validation PTI 1995
Be Oklahoma Sigmodon hispidus Herbivore 0 0.84 0.00000 validation PTI 1995
Be Oklahoma Peromyscus leucopus Omnivore 0 0.87 0.00000 validation PTI 1995
Be Oklahoma Peromyscus leucopus Omnivore 0 0.95 0.00000 validation PTI 1995

B-22
Table B.1 (cont.)
Analyte Study Location SpeciesTrophicGroup
TissueConcentration mg/kg dry wt.
SoilConcentration mg/kg dry wt.
UptakeFactor
Portion ofDataset Reference
Be Oklahoma Peromyscus leucopus Omnivore 0 0.87 0.00000 validation PTI 1995
Be Oklahoma Peromyscus leucopus Omnivore 0 1.15 0.00000 validation PTI 1995
Be Oklahoma Peromyscus leucopus Omnivore 0 1.3 0.00000 validation PTI 1995
Ca Oklahoma Sigmodon hispidus Herbivore 32200 8380 3.84248 validation PTI 1995
Ca Oklahoma Sigmodon hispidus Herbivore 33800 1950 17.33333 validation PTI 1995
Ca Oklahoma Sigmodon hispidus Herbivore 29600 2195 13.48519 validation PTI 1995
Ca Oklahoma Sigmodon hispidus Herbivore 39000 35770 1.09030 validation PTI 1995
Ca Oklahoma Sigmodon hispidus Herbivore 27800 2500 11.12000 validation PTI 1995
Ca Oklahoma Sigmodon hispidus Herbivore 27800 1790 15.53073 validation PTI 1995
Ca Oklahoma Sigmodon hispidus Herbivore 39200 13000 3.01538 validation PTI 1995
Ca Oklahoma Peromyscus leucopus Omnivore 39300 4110 9.56204 validation PTI 1995
Ca Oklahoma Peromyscus leucopus Omnivore 31900 35770 0.89181 validation PTI 1995
Ca Oklahoma Peromyscus leucopus Omnivore 35000 8380 4.17661 validation PTI 1995
Ca Oklahoma Peromyscus leucopus Omnivore 35000 4110 8.51582 validation PTI 1995
Ca Oklahoma Peromyscus leucopus Omnivore 36100 3715 9.71736 validation PTI 1995
Cd Oklahoma Sigmodon hispidus Herbivore 0.42 3.45 0.12174 validation PTI 1995
Cd Oklahoma Sigmodon hispidus Herbivore 2.4 25.2 0.09524 validation PTI 1995
Cd Oklahoma Sigmodon hispidus Herbivore 1.7 26.6 0.06391 validation PTI 1995
Cd Oklahoma Sigmodon hispidus Herbivore 0.58 1.295 0.44788 validation PTI 1995
Cd Oklahoma Sigmodon hispidus Herbivore 2.2 144 0.01528 validation PTI 1995
Cd Oklahoma Sigmodon hispidus Herbivore 0.1 0.77 0.12987 validation PTI 1995
Cd Oklahoma Sigmodon hispidus Herbivore 3.5 69.8 0.05014 validation PTI 1995
Cd Montana Peromyscus maniculatus Omnivore 0.22 0.32 0.68750 validation LaTier et al. 1995
Cd Montana Peromyscus maniculatus Omnivore 0.57 4 0.14250 validation LaTier et al. 1995
Cd Montana Peromyscus maniculatus Omnivore 0.13 1.58 0.08228 validation LaTier et al. 1995
Cd Montana Peromyscus maniculatus Omnivore 0.37 2.2 0.16818 validation LaTier et al. 1995
Cd Montana Peromyscus maniculatus Omnivore 0.513 2.8 0.18321 validation LaTier et al. 1995
Cd Montana Peromyscus maniculatus Omnivore 0.24 5.5 0.04364 validation LaTier et al. 1995
Cd Montana Peromyscus maniculatus Omnivore 0.32 3.1 0.10323 validation LaTier et al. 1995
Cd Oklahoma Peromyscus leucopus Omnivore 3.8 33.1 0.11480 validation PTI 1995

B-23
Table B.1 (cont.)
Analyte Study Location SpeciesTrophicGroup
TissueConcentration mg/kg dry wt.
SoilConcentration mg/kg dry wt.
UptakeFactor
Portion ofDataset Reference
Cd Montana Peromyscus maniculatus Omnivore 0.28 5.1 0.05490 validation LaTier et al. 1995
Cd Montana Peromyscus maniculatus Omnivore 0.31 11.1 0.02793 validation LaTier et al. 1995
Cd Oklahoma Peromyscus leucopus Omnivore 2.6 36 0.07222 validation PTI 1995
Cd Montana Peromyscus maniculatus Omnivore 0.57 6.6 0.08636 validation LaTier et al. 1995
Cd Montana Peromyscus maniculatus Omnivore 0.56 4.6 0.12174 validation LaTier et al. 1995
Cd Oklahoma Peromyscus leucopus Omnivore 0.14 0.77 0.18182 validation PTI 1995
Cd Montana Peromyscus maniculatus Omnivore 0.2 1 0.20000 validation LaTier et al. 1995
Cd Oklahoma Peromyscus leucopus Omnivore 4.3 144 0.02986 validation PTI 1995
Cd Montana Peromyscus maniculatus Omnivore 0.27 3.6 0.07500 validation LaTier et al. 1995
Cd Montana Peromyscus maniculatus Omnivore 0.21 0.75 0.28000 validation LaTier et al. 1995
Cd Oklahoma Peromyscus leucopus Omnivore 2.2 36 0.06111 validation PTI 1995
Co Oklahoma Sigmodon hispidus Herbivore 0.25 15.6 0.01603 validation PTI 1995
Co Oklahoma Sigmodon hispidus Herbivore 0.24 13.95 0.01720 validation PTI 1995
Co Oklahoma Sigmodon hispidus Herbivore 0.2 14.9 0.01342 validation PTI 1995
Co Oklahoma Sigmodon hispidus Herbivore 0.17 8.3 0.02048 validation PTI 1995
Co Oklahoma Sigmodon hispidus Herbivore 0.29 7.55 0.03841 validation PTI 1995
Co Oklahoma Sigmodon hispidus Herbivore 0.18 8.35 0.02156 validation PTI 1995
Co Oklahoma Sigmodon hispidus Herbivore 0.17 9.2 0.01848 validation PTI 1995
Co Oklahoma Peromyscus leucopus Omnivore 0.17 13.95 0.01219 validation PTI 1995
Co Oklahoma Peromyscus leucopus Omnivore 0.16 10.15 0.01576 validation PTI 1995
Co Oklahoma Peromyscus leucopus Omnivore 0.24 9.6 0.02500 validation PTI 1995
Co Oklahoma Peromyscus leucopus Omnivore 0.15 14.9 0.01007 validation PTI 1995
Co Oklahoma Peromyscus leucopus Omnivore 0.2 9.6 0.02083 validation PTI 1995
Cr Oklahoma Sigmodon hispidus Herbivore 3.1 21.4 0.14486 validation PTI 1995
Cr Oklahoma Sigmodon hispidus Herbivore 7.3 23.6 0.30932 validation PTI 1995
Cr Oklahoma Sigmodon hispidus Herbivore 2.9 32.8 0.08841 validation PTI 1995
Cr Oklahoma Sigmodon hispidus Herbivore 3.5 42.9 0.08159 validation PTI 1995
Cr Oklahoma Sigmodon hispidus Herbivore 1.8 27.3 0.06593 validation PTI 1995
Cr Oklahoma Sigmodon hispidus Herbivore 3 37.3 0.08043 validation PTI 1995
Cr Oklahoma Sigmodon hispidus Herbivore 4.9 24.7 0.19838 validation PTI 1995

B-24
Table B.1 (cont.)
Analyte Study Location SpeciesTrophicGroup
TissueConcentration mg/kg dry wt.
SoilConcentration mg/kg dry wt.
UptakeFactor
Portion ofDataset Reference
Cr Oklahoma Peromyscus leucopus Omnivore 5.6 37.3 0.15013 validation PTI 1995
Cr Oklahoma Peromyscus leucopus Omnivore 8.8 25.2 0.34921 validation PTI 1995
Cr Oklahoma Peromyscus leucopus Omnivore 4.6 26.45 0.17391 validation PTI 1995
Cr Oklahoma Peromyscus leucopus Omnivore 3 42.9 0.06993 validation PTI 1995
Cr Oklahoma Peromyscus leucopus Omnivore 5 25.2 0.19841 validation PTI 1995
Cu Oklahoma Sigmodon hispidus Herbivore 6.9 20.75 0.33253 validation PTI 1995
Cu Oklahoma Sigmodon hispidus Herbivore 8.2 11 0.74545 validation PTI 1995
Cu Oklahoma Sigmodon hispidus Herbivore 6.5 180 0.03611 validation PTI 1995
Cu Oklahoma Sigmodon hispidus Herbivore 6.4 68 0.09412 validation PTI 1995
Cu Oklahoma Sigmodon hispidus Herbivore 9.9 20.05 0.49377 validation PTI 1995
Cu Oklahoma Sigmodon hispidus Herbivore 6.7 47.6 0.14076 validation PTI 1995
Cu Oklahoma Sigmodon hispidus Herbivore 7.2 186 0.03871 validation PTI 1995
Cu Montana Peromyscus maniculatus Omnivore 75.6 2329 0.03246 validation LaTier et al. 1995
Cu Montana Peromyscus maniculatus Omnivore 22.8 817 0.02791 validation LaTier et al. 1995
Cu Montana Peromyscus maniculatus Omnivore 19.8 73.1 0.27086 validation LaTier et al. 1995
Cu Montana Peromyscus maniculatus Omnivore 14.1 193 0.07306 validation LaTier et al. 1995
Cu Montana Peromyscus maniculatus Omnivore 12.7 27 0.47037 validation LaTier et al. 1995
Cu Montana Peromyscus maniculatus Omnivore 54.6 1730 0.03156 validation LaTier et al. 1995
Cu Oklahoma Peromyscus leucopus Omnivore 10.4 77.4 0.13437 validation PTI 1995
Cu Oklahoma Peromyscus leucopus Omnivore 9.5 63.7 0.14914 validation PTI 1995
Cu Montana Peromyscus maniculatus Omnivore 13.8 529 0.02609 validation LaTier et al. 1995
Cu Montana Peromyscus maniculatus Omnivore 12.7 70 0.18143 validation LaTier et al. 1995
Cu Montana Peromyscus maniculatus Omnivore 35.8 199 0.17990 validation LaTier et al. 1995
Cu Montana Peromyscus maniculatus Omnivore 13.5 118 0.11441 validation LaTier et al. 1995
Cu Montana Peromyscus maniculatus Omnivore 14.6 1790 0.00816 validation LaTier et al. 1995
Cu Montana Peromyscus maniculatus Omnivore 13.9 311 0.04469 validation LaTier et al. 1995
Cu Montana Peromyscus maniculatus Omnivore 18.1 1190 0.01521 validation LaTier et al. 1995
Cu Oklahoma Peromyscus leucopus Omnivore 10.3 63.7 0.16170 validation PTI 1995
Cu Montana Peromyscus maniculatus Omnivore 82.2 1200 0.06850 validation LaTier et al. 1995
Cu Oklahoma Peromyscus leucopus Omnivore 11.5 20.75 0.55422 validation PTI 1995

B-25
Table B.1 (cont.)
Analyte Study Location SpeciesTrophicGroup
TissueConcentration mg/kg dry wt.
SoilConcentration mg/kg dry wt.
UptakeFactor
Portion ofDataset Reference
Cu Oklahoma Peromyscus leucopus Omnivore 16.6 186 0.08925 validation PTI 1995
Fe Oklahoma Sigmodon hispidus Herbivore 305 26600 0.01147 validation PTI 1995
Fe Oklahoma Sigmodon hispidus Herbivore 294 29300 0.01003 validation PTI 1995
Fe Oklahoma Sigmodon hispidus Herbivore 370 26100 0.01418 validation PTI 1995
Fe Oklahoma Sigmodon hispidus Herbivore 296 17350 0.01706 validation PTI 1995
Fe Oklahoma Sigmodon hispidus Herbivore 219 19800 0.01106 validation PTI 1995
Fe Oklahoma Sigmodon hispidus Herbivore 332 27000 0.01230 validation PTI 1995
Fe Oklahoma Sigmodon hispidus Herbivore 201 15500 0.01297 validation PTI 1995
Fe Oklahoma Peromyscus leucopus Omnivore 276 29300 0.00942 validation PTI 1995
Fe Oklahoma Peromyscus leucopus Omnivore 256 27000 0.00948 validation PTI 1995
Fe Oklahoma Peromyscus leucopus Omnivore 254 20450 0.01242 validation PTI 1995
Fe Oklahoma Peromyscus leucopus Omnivore 279 19300 0.01446 validation PTI 1995
Fe Oklahoma Peromyscus leucopus Omnivore 283 19300 0.01466 validation PTI 1995
K Oklahoma Sigmodon hispidus Herbivore 11700 1845 6.34146 validation PTI 1995
K Oklahoma Sigmodon hispidus Herbivore 11300 1980 5.70707 validation PTI 1995
K Oklahoma Sigmodon hispidus Herbivore 11300 1850 6.10811 validation PTI 1995
K Oklahoma Sigmodon hispidus Herbivore 11400 3735 3.05221 validation PTI 1995
K Oklahoma Sigmodon hispidus Herbivore 10600 1560 6.79487 validation PTI 1995
K Oklahoma Sigmodon hispidus Herbivore 10800 1400 7.71429 validation PTI 1995
K Oklahoma Sigmodon hispidus Herbivore 10900 1410 7.73050 validation PTI 1995
K Oklahoma Peromyscus leucopus Omnivore 10400 2320 4.48276 validation PTI 1995
K Oklahoma Peromyscus leucopus Omnivore 10500 3735 2.81124 validation PTI 1995
K Oklahoma Peromyscus leucopus Omnivore 10300 2320 4.43966 validation PTI 1995
K Oklahoma Peromyscus leucopus Omnivore 11000 2325 4.73118 validation PTI 1995
K Oklahoma Peromyscus leucopus Omnivore 10400 1980 5.25253 validation PTI 1995
Mg Oklahoma Sigmodon hispidus Herbivore 1570 2530 0.62055 validation PTI 1995
Mg Oklahoma Sigmodon hispidus Herbivore 1330 1340 0.99254 validation PTI 1995
Mg Oklahoma Sigmodon hispidus Herbivore 1680 3505 0.47932 validation PTI 1995
Mg Oklahoma Sigmodon hispidus Herbivore 1640 2850 0.57544 validation PTI 1995
Mg Oklahoma Sigmodon hispidus Herbivore 1630 1420 1.14789 validation PTI 1995

B-26
Table B.1 (cont.)
Analyte Study Location SpeciesTrophicGroup
TissueConcentration mg/kg dry wt.
SoilConcentration mg/kg dry wt.
UptakeFactor
Portion ofDataset Reference
Mg Oklahoma Sigmodon hispidus Herbivore 1540 1750 0.88000 validation PTI 1995
Mg Oklahoma Sigmodon hispidus Herbivore 1500 1950 0.76923 validation PTI 1995
Mg Oklahoma Peromyscus leucopus Omnivore 1290 3505 0.36805 validation PTI 1995
Mg Oklahoma Peromyscus leucopus Omnivore 1400 2530 0.55336 validation PTI 1995
Mg Oklahoma Peromyscus leucopus Omnivore 1590 2140 0.74299 validation PTI 1995
Mg Oklahoma Peromyscus leucopus Omnivore 1400 2140 0.65421 validation PTI 1995
Mg Oklahoma Peromyscus leucopus Omnivore 1500 2120 0.70755 validation PTI 1995
Mn Oklahoma Sigmodon hispidus Herbivore 9.6 615 0.01561 validation PTI 1995
Mn Oklahoma Sigmodon hispidus Herbivore 7.5 455 0.01648 validation PTI 1995
Mn Oklahoma Sigmodon hispidus Herbivore 14.9 254 0.05866 validation PTI 1995
Mn Oklahoma Sigmodon hispidus Herbivore 8.6 578 0.01488 validation PTI 1995
Mn Oklahoma Sigmodon hispidus Herbivore 13.1 1145 0.01144 validation PTI 1995
Mn Oklahoma Sigmodon hispidus Herbivore 6.9 486 0.01420 validation PTI 1995
Mn Oklahoma Sigmodon hispidus Herbivore 17.4 219.5 0.07927 validation PTI 1995
Mn Oklahoma Peromyscus leucopus Omnivore 19 615 0.03089 validation PTI 1995
Mn Oklahoma Peromyscus leucopus Omnivore 12.6 583 0.02161 validation PTI 1995
Mn Oklahoma Peromyscus leucopus Omnivore 16.5 524 0.03149 validation PTI 1995
Mn Oklahoma Peromyscus leucopus Omnivore 19.4 524 0.03702 validation PTI 1995
Mn Oklahoma Peromyscus leucopus Omnivore 22.3 1145 0.01948 validation PTI 1995
Na Oklahoma Sigmodon hispidus Herbivore 4230 69.05 61.25996 validation PTI 1995
Na Oklahoma Sigmodon hispidus Herbivore 4040 49.3 81.94726 validation PTI 1995
Na Oklahoma Sigmodon hispidus Herbivore 4140 148 27.97297 validation PTI 1995
Na Oklahoma Sigmodon hispidus Herbivore 4490 395 11.36709 validation PTI 1995
Na Oklahoma Sigmodon hispidus Herbivore 4170 41.6 100.24038 validation PTI 1995
Na Oklahoma Sigmodon hispidus Herbivore 4450 71.8 61.97772 validation PTI 1995
Na Oklahoma Sigmodon hispidus Herbivore 4280 86.2 49.65197 validation PTI 1995
Na Oklahoma Peromyscus leucopus Omnivore 4670 61.4 76.05863 validation PTI 1995
Na Oklahoma Peromyscus leucopus Omnivore 4340 57.3 75.74171 validation PTI 1995
Na Oklahoma Peromyscus leucopus Omnivore 4370 395 11.06329 validation PTI 1995
Na Oklahoma Peromyscus leucopus Omnivore 4430 71.8 61.69916 validation PTI 1995

B-27
Table B.1 (cont.)
Analyte Study Location SpeciesTrophicGroup
TissueConcentration mg/kg dry wt.
SoilConcentration mg/kg dry wt.
UptakeFactor
Portion ofDataset Reference
Na Oklahoma Peromyscus leucopus Omnivore 4590 57.3 80.10471 validation PTI 1995
Ni Oklahoma Sigmodon hispidus Herbivore 0 39.95 0.00000 validation PTI 1995
Ni Oklahoma Sigmodon hispidus Herbivore 0 26 0.00000 validation PTI 1995
Ni Oklahoma Sigmodon hispidus Herbivore 0 10.2 0.00000 validation PTI 1995
Ni Oklahoma Sigmodon hispidus Herbivore 2.7 10.85 0.24885 validation PTI 1995
Ni Oklahoma Sigmodon hispidus Herbivore 0 27.9 0.00000 validation PTI 1995
Ni Oklahoma Sigmodon hispidus Herbivore 0 14.1 0.00000 validation PTI 1995
Ni Oklahoma Sigmodon hispidus Herbivore 0 17.5 0.00000 validation PTI 1995
Ni Oklahoma Peromyscus leucopus Omnivore 2.5 19.15 0.13055 validation PTI 1995
Ni Oklahoma Peromyscus leucopus Omnivore 3.4 20.2 0.16832 validation PTI 1995
Ni Oklahoma Peromyscus leucopus Omnivore 3.1 39.95 0.07760 validation PTI 1995
Ni Oklahoma Peromyscus leucopus Omnivore 2.2 27.9 0.07885 validation PTI 1995
Ni Oklahoma Peromyscus leucopus Omnivore 0 20.2 0.00000 validation PTI 1995
Pb Oklahoma Sigmodon hispidus Herbivore 1.4 63.9 0.02191 validation PTI 1995
Pb Oklahoma Sigmodon hispidus Herbivore 0.4 33.8 0.01183 validation PTI 1995
Pb Oklahoma Sigmodon hispidus Herbivore 2.3 261 0.00881 validation PTI 1995
Pb Oklahoma Sigmodon hispidus Herbivore 0.74 32.05 0.02309 validation PTI 1995
Pb Oklahoma Sigmodon hispidus Herbivore 6.4 83.9 0.07628 validation PTI 1995
Pb Oklahoma Sigmodon hispidus Herbivore 7.7 485 0.01588 validation PTI 1995
Pb Oklahoma Sigmodon hispidus Herbivore 6.4 435 0.01471 validation PTI 1995
Pb Montana Peromyscus maniculatus Omnivore 6.3 481 0.01310 validation LaTier et al. 1995
Pb Montana Peromyscus maniculatus Omnivore 3.1 122 0.02541 validation LaTier et al. 1995
Pb Oklahoma Peromyscus leucopus Omnivore 3.7 485 0.00763 validation PTI 1995
Pb Oklahoma Peromyscus leucopus Omnivore 1.5 179 0.00838 validation PTI 1995
Pb Montana Peromyscus maniculatus Omnivore 3.7 167 0.02216 validation LaTier et al. 1995
Pb Montana Peromyscus maniculatus Omnivore 5.6 326 0.01718 validation LaTier et al. 1995
Pb Oklahoma Peromyscus leucopus Omnivore 1.4 179 0.00782 validation PTI 1995
Pb Montana Peromyscus maniculatus Omnivore 5.2 577 0.00901 validation LaTier et al. 1995
Pb Montana Peromyscus maniculatus Omnivore 4.13 399 0.01035 validation LaTier et al. 1995
Pb Montana Peromyscus maniculatus Omnivore 1.4 7.8 0.17949 validation LaTier et al. 1995

B-28
Table B.1 (cont.)
Analyte Study Location SpeciesTrophicGroup
TissueConcentration mg/kg dry wt.
SoilConcentration mg/kg dry wt.
UptakeFactor
Portion ofDataset Reference
Pb Oklahoma Peromyscus leucopus Omnivore 0.28 33.8 0.00828 validation PTI 1995
Pb Montana Peromyscus maniculatus Omnivore 6.8 386 0.01762 validation LaTier et al. 1995
Pb Montana Peromyscus maniculatus Omnivore 1.8 30 0.06000 validation LaTier et al. 1995
Pb Montana Peromyscus maniculatus Omnivore 2.1 22.9 0.09170 validation LaTier et al. 1995
Pb Montana Peromyscus maniculatus Omnivore 1.5 37.3 0.04021 validation LaTier et al. 1995
Pb Montana Peromyscus maniculatus Omnivore 10.6 776 0.01366 validation LaTier et al. 1995
Pb Montana Peromyscus maniculatus Omnivore 0.93 265 0.00351 validation LaTier et al. 1995
Pb Oklahoma Peromyscus leucopus Omnivore 1.5 281.5 0.00533 validation PTI 1995
Pb Montana Peromyscus maniculatus Omnivore 4.1 68 0.06029 validation LaTier et al. 1995
Sb Oklahoma Sigmodon hispidus Herbivore 0 0 ERR validation PTI 1995
Sb Oklahoma Sigmodon hispidus Herbivore 0 4.4 0.00000 validation PTI 1995
Sb Oklahoma Sigmodon hispidus Herbivore 0 3.25 0.00000 validation PTI 1995
Sb Oklahoma Sigmodon hispidus Herbivore 0.04 0 ERR validation PTI 1995
Sb Oklahoma Sigmodon hispidus Herbivore 0.03 0 ERR validation PTI 1995
Sb Oklahoma Sigmodon hispidus Herbivore 0 3.3 0.00000 validation PTI 1995
Sb Oklahoma Sigmodon hispidus Herbivore 0.04 0 ERR validation PTI 1995
Sb Oklahoma Peromyscus leucopus Omnivore 0 0 ERR validation PTI 1995
Sb Oklahoma Peromyscus leucopus Omnivore 0 3.25 0.00000 validation PTI 1995
Sb Oklahoma Peromyscus leucopus Omnivore 0.02 0 ERR validation PTI 1995
Sb Oklahoma Peromyscus leucopus Omnivore 0 0 ERR validation PTI 1995
Sb Oklahoma Peromyscus leucopus Omnivore 0.07 0 ERR validation PTI 1995
Se Oklahoma Sigmodon hispidus Herbivore 0 0.265 0.00000 validation PTI 1995
Se Oklahoma Sigmodon hispidus Herbivore 0 0 ERR validation PTI 1995
Se Oklahoma Sigmodon hispidus Herbivore 0 0.94 0.00000 validation PTI 1995
Se Oklahoma Sigmodon hispidus Herbivore 0 0.27 0.00000 validation PTI 1995
Se Oklahoma Sigmodon hispidus Herbivore 0 0.53 0.00000 validation PTI 1995
Se Oklahoma Sigmodon hispidus Herbivore 0 0.25 0.00000 validation PTI 1995
Se Oklahoma Sigmodon hispidus Herbivore 0 19.2 0.00000 validation PTI 1995
Se Oklahoma Peromyscus leucopus Omnivore 0 0.265 0.00000 validation PTI 1995
Se Oklahoma Peromyscus leucopus Omnivore 1 0.57 1.75439 validation PTI 1995

B-29
Table B.1 (cont.)
Analyte Study Location SpeciesTrophicGroup
TissueConcentration mg/kg dry wt.
SoilConcentration mg/kg dry wt.
UptakeFactor
Portion ofDataset Reference
Se Oklahoma Peromyscus leucopus Omnivore 0 0.57 0.00000 validation PTI 1995
Se Oklahoma Peromyscus leucopus Omnivore 3 19.2 0.15625 validation PTI 1995
Se Oklahoma Peromyscus leucopus Omnivore 1 0.62 1.61290 validation PTI 1995
V Oklahoma Sigmodon hispidus Herbivore 0.37 28.6 0.01294 validation PTI 1995
V Oklahoma Sigmodon hispidus Herbivore 0.48 57.9 0.00829 validation PTI 1995
V Oklahoma Sigmodon hispidus Herbivore 0.36 30.4 0.01184 validation PTI 1995
V Oklahoma Sigmodon hispidus Herbivore 0.55 28.25 0.01947 validation PTI 1995
V Oklahoma Sigmodon hispidus Herbivore 0.55 30.7 0.01792 validation PTI 1995
V Oklahoma Sigmodon hispidus Herbivore 0.56 39.65 0.01412 validation PTI 1995
V Oklahoma Sigmodon hispidus Herbivore 0.46 41.2 0.01117 validation PTI 1995
V Oklahoma Peromyscus leucopus Omnivore 0.36 28.4 0.01268 validation PTI 1995
V Oklahoma Peromyscus leucopus Omnivore 0.52 39.65 0.01311 validation PTI 1995
V Oklahoma Peromyscus leucopus Omnivore 0.2 28.4 0.00704 validation PTI 1995
V Oklahoma Peromyscus leucopus Omnivore 0.3 57.9 0.00518 validation PTI 1995
V Oklahoma Peromyscus leucopus Omnivore 0.32 30.85 0.01037 validation PTI 1995
Zn Oklahoma Sigmodon hispidus Herbivore 285 3750 0.07600 validation PTI 1995
Zn Oklahoma Sigmodon hispidus Herbivore 88.7 199 0.44573 validation PTI 1995
Zn Oklahoma Sigmodon hispidus Herbivore 164 3210 0.05109 validation PTI 1995
Zn Oklahoma Sigmodon hispidus Herbivore 140 7170 0.01953 validation PTI 1995
Zn Oklahoma Sigmodon hispidus Herbivore 103 183 0.56284 validation PTI 1995
Zn Oklahoma Sigmodon hispidus Herbivore 156 416 0.37500 validation PTI 1995
Zn Oklahoma Sigmodon hispidus Herbivore 136 1530 0.08889 validation PTI 1995
Zn Montana Peromyscus maniculatus Omnivore 322 1180 0.27288 validation LaTier et al. 1995
Zn Montana Peromyscus maniculatus Omnivore 311 82.2 3.78345 validation LaTier et al. 1995
Zn Montana Peromyscus maniculatus Omnivore 176 817 0.21542 validation LaTier et al. 1995
Zn Montana Peromyscus maniculatus Omnivore 397 158 2.51266 validation LaTier et al. 1995
Zn Montana Peromyscus maniculatus Omnivore 148 322 0.45963 validation LaTier et al. 1995
Zn Montana Peromyscus maniculatus Omnivore 187 1659 0.11272 validation LaTier et al. 1995
Zn Montana Peromyscus maniculatus Omnivore 468 80 5.85000 validation LaTier et al. 1995
Zn Montana Peromyscus maniculatus Omnivore 153 1370 0.11168 validation LaTier et al. 1995

B-30
Table B.1 (cont.)
Analyte Study Location SpeciesTrophicGroup
TissueConcentration mg/kg dry wt.
SoilConcentration mg/kg dry wt.
UptakeFactor
Portion ofDataset Reference
Zn Montana Peromyscus maniculatus Omnivore 143 65.1 2.19662 validation LaTier et al. 1995
Zn Oklahoma Peromyscus leucopus Omnivore 128 7170 0.01785 validation PTI 1995
Zn Oklahoma Peromyscus leucopus Omnivore 87 199 0.43719 validation PTI 1995
Zn Oklahoma Peromyscus leucopus Omnivore 143 2135 0.06698 validation PTI 1995
Zn Montana Peromyscus maniculatus Omnivore 280 788 0.35533 validation LaTier et al. 1995
Zn Montana Peromyscus maniculatus Omnivore 167 142 1.17606 validation LaTier et al. 1995
Zn Montana Peromyscus maniculatus Omnivore 203 148 1.37162 validation LaTier et al. 1995
Zn Montana Peromyscus maniculatus Omnivore 181 1164 0.15550 validation LaTier et al. 1995
Zn Montana Peromyscus maniculatus Omnivore 142 1992 0.07129 validation LaTier et al. 1995
Zn Oklahoma Peromyscus leucopus Omnivore 104 2270 0.04581 validation PTI 1995
Zn Oklahoma Peromyscus leucopus Omnivore 103 2270 0.04537 validation PTI 1995

APPENDIX C
SUPPLEMENTAL SMALL MAMMAL BIOACCUMULATIONDATA FROM THE VALIDATION STUDIES

Table C.1. Summary statistics for soil-small mammal UFs derived from validation data
AnalyteTrophicGroup N Mean
StandardDeviation Minimum Median
90thPercentile Maximum
Mean of NaturalLog-transformed
values
StandardDeviation ofNatural Log-transformed
values Distribution
Ag General 10 0.1128 0.2533 0 0.004 0.5013 0.81 -3.33487 2.27547 lognormal
Al General 12 0.0365 0.0274 0.0064 0.0263 0.0732 0.093 -3.59239 0.81728 normalb
Ca General 12 8.1901 5.5913 0.8918 9.0389 15.5307 17.333 1.76089 0.99875 normalb
K General 12 5.4305 1.6139 2.8112 5.4798 7.7143 7.73 1.64634 0.32703 normalb
Mg General 12 0.7076 0.2193 0.368 0.6809 0.9925 1.148 -0.3903 0.31441 normalb
Mn General 12 0.0293 0.0206 0.0114 0.0205 0.0587 0.079 -3.71448 0.60173 lognormal
Na General 12 58.2571 28.4054 11.0633 61.8384 81.9473 100.24 3.87422 0.75195 normal
V General 12 0.012 0.0041 0.0052 0.0123 0.0179 0.019 -4.48179 0.37525 normalb
Ag Herbivore 6 0.002 0.0032 0 0 0.007 0.007 -5.17168 0.37675 lognormal
Al Herbivore 7 0.0172 0.0078 0.0064 0.0171 0.031 0.031 -4.16207 0.50004 normalb
Ca Herbivore 7 9.3453 6.5936 1.0903 11.12 17.333 17.333 1.87744 1.04842 normalb
K Herbivore 7 6.2069 1.59 3.0522 6.3415 7.73 7.73 1.78839 0.31767 normal
Mg Herbivore 7 0.7807 0.2409 0.4793 0.7692 1.148 1.148 -0.28928 0.31421 normalb
Mn Herbivore 7 0.0301 0.0273 0.0114 0.0156 0.079 0.079 -3.79559 0.77192 lognormala
Na Herbivore 7 56.3453 30.3066 11.3671 61.26 100.24 100.24 3.84608 0.74346 normalb
V Herbivore 7 0.0137 0.0039 0.0083 0.0129 0.019 0.019 -4.32748 0.29025 normalb
Ag Omnivore 4 0.279 0.3621 0.0037 0.1513 0.81 0.81 -2.41647 2.28221 normalb
Al Omnivore 5 0.0636 0.0202 0.0427 0.0618 0.093 0.093 -2.79483 0.31425 normalb
Ca Omnivore 5 6.5727 3.8928 0.8918 8.5158 9.717 9.717 1.59773 1.01847 normal
K Omnivore 5 4.3435 0.9156 2.8112 4.4828 5.253 5.253 1.44747 0.24079 normal
Mg Omnivore 5 0.6052 0.1507 0.368 0.6542 0.743 0.743 -0.53173 0.28442 normal
Mn Omnivore 5 0.0281 0.0073 0.0195 0.0309 0.037 0.037 -3.60092 0.27254 normalb
Na Omnivore 5 60.9335 28.7368 11.0633 75.7417 80.105 80.105 3.91361 0.85 lognormala
V Omnivore 5 0.00968 0.00348 0.005181 0.01037 0.01311 0.0131 -4.69783 0.40108 normalb
C-3

SILVER
Concentration in soil (mg/kg dry wt.)
0 2 4 6 8
Wh
ole
bo
dy
con
cen
trat
ion
(m
g/k
g d
ry w
t.)
0
1
2
ALUMINUM
Concentration in soil (mg/kg dry wt.)
10000 12000 14000 16000 18000 20000 22000
Wh
ole
bo
dy
con
cen
trat
ion
(m
g/k
g d
ry w
t.)
0
200
400
600
800
1000
1200
1400
1600
1800
CALCIUM
Concentration in soil (mg/kg dry wt.)
0 5000 10000 15000 20000 25000 30000 35000 40000
Wh
ole
bo
dy
con
cen
trat
ion
(m
g/k
g d
ry w
t.)
26000
28000
30000
32000
34000
36000
38000
40000
42000
44000
POTASSIUM
Concentration in soil (mg/kg dry wt.)
1000 1500 2000 2500 3000 3500 4000
Wh
ole
bo
dy
con
cen
trat
ion
(m
g/k
g d
ry w
t.)
10200
10400
10600
10800
11000
11200
11400
11600
11800
12000
HerbivoreOmnivore
HerbivoreOmnivore
HerbivoreOmnivore
HerbivoreOmnivore
Fig. C.1. Scatterplot of concentration of Ag, Al, Ca, and K in small mammals vs that in soil reported in PTI (1995).
C-4

MAGNESIUM
Concentration in soil (mg/kg dry wt.)
1000 1500 2000 2500 3000 3500 4000
Wh
ole
bo
dy
con
cen
trat
ion
(m
g/k
g d
ry w
t.)
1200
1300
1400
1500
1600
1700
1800
HerbivoreOmnivore MANGANESE
Concentration in soil (mg/kg dry wt.)
0 200 400 600 800 1000 1200
Wh
ole
bo
dy
con
cen
trat
ion
(m
g/k
g d
ry w
t.)
6
8
10
12
14
16
18
20
22
24
SODIUM
Concentration in soil (mg/kg dry wt.)
0 100 200 300 400 500
Wh
ole
bo
dy
con
cen
trat
ion
(m
g/k
g d
ry w
t.)
4000
4100
4200
4300
4400
4500
4600
4700
4800
VANADIUM
Concentration in soil (mg/kg dry wt.)
25 30 35 40 45 50 55 60
Wh
ole
bo
dy
con
cen
trat
ion
(m
g/k
g d
ry w
t.)
0.1
0.2
0.3
0.4
0.5
0.6
0.7
0.8
HerbivoreOmnivore
HerbivoreOmnivore
HerbivoreOmnivore
Fig. C.2. Scatterplot of concentration of Mg, Mn, Na, and V in small mammals vs that in soil reported in PTI (1995).
C-5

APPENDIX D
PROCEDURE FOR CALCULATING PREDICTION LIMITS FORESTIMATES GENERATED BY THE SIMPLE REGRESSION
MODELS

D-3
Prediction Limit ' í ± t"'0.05, df'n&2 ( RMSE( 1% 1n%
(x ( & 0 )2
Sxx
Prediction limits for estimates generated by the regression models presented in Table 8 may becalculated using the following equation (Dowdy and Wearden 1983):
í = ln-transformed concentration of analyte in earthworm tissue estimated using regression models from Table 8.
t" = 0.05, df=n-2 = t-statistic for 95% one-tailed limits or 90% two-tailed intervals withn-2 degrees of freedom. (Presented in Table D-1).
n = Sample size for regression model. (Presented in Table D-1).RMSE = Root mean square error for regression model. (Presented in Table D-1).x* = ln-transformed soil concentration for which earthworm concentrations are being
estimated. (Site specific).0 = Mean soil concentration from regression model. (Presented in Table D-1).Sxx = Variance of soil concentrations from regression model. Sxx = 3 x2 - 3 x /n.
(Presented in Table D-1).
The procedure for calculating an upper 95% prediction limit for an estimate (íUPL) is as follows:
1. Use regression model from Table 8 and estimate the ln-transformed concentration of analytein earthworm tissue (í) from the ln-transformed soil concentration of the analyte of concern(x*).
2. Obtain values for t, n, RMSE, 0, and Sxx from Table D-1. 3. Apply the values from step 2 along with x* to the equation outlined above and add the
product to í to generate the upper 95% prediction limit for í (íUPL).4. íUPL as calculated by the above equation is ln-transformed and must be back-transformed.
Back-transform íUPL as follows: e íUPL, where e = 2.7182818.
A lower 95% prediction limit (íLPL) can be calculated by subtracting the product from step 3 from í,then back transforming the result. The 90% prediction interval (PI) is calculated if both the UPL andLPL are calculated. In application, 95% of all estimates are expected to fall below or above the UPLand LPL, respectively, and 90% of all estimates are expected to fall between the UPL and LPL.

D-4
Table D.1. Values for estimating upper and lower prediction limits for estimatesgenerated by simple regression models.
All models based on the combined model and validation datasets (Table 8).
AnalyteTrophicGroup n 3 x 0 3 x2
Root MeanSquare Error
(RMSE) Sxx
t statistic (" = 0.05, df = n-2)
As all 60 234.1678 3.9028 1042.0794 1.18089 -896.5413 1.6716
As Herbivore 22 69.1773 3.1444 253.9455 0.94732 -205.9797 1.7247
As Omnivore 37 160.0927 4.3268 764.1451 1.27314 -672.0413 1.6896
Cd all 99 92.9788 0.9392 313.6895 1.53246 -84.1552 1.6607
Cd Insectivore 38 22.0383 0.5800 68.1551 1.12842 -10.9877 1.6883
Cd Herbivore 28 39.9333 1.4262 136.5506 0.62238 -52.0756 1.7056
Cd Omnivore 33 30.4073 0.9214 108.9838 0.70189 -24.7158 1.6955
Cr all 38 129.3113 3.4029 468.6595 0.76973 -427.7040 1.6883
Cr Omnivore 27 89.9813 3.3326 318.2877 0.85565 -288.0869 1.7081
Cu all 76 324.2293 4.2662 1587.9345 0.40722 -1362.3251 1.6657
Cu Insectivore 30 102.0019 3.4001 394.1586 0.10431 -333.6743 1.7011
Cu Omnivore 28 140.0202 5.0007 766.3043 0.44466 -672.8340 1.7056
Fe all 15 150.7999 10.0533 1519.8568 0.21947 -1414.7169 1.7709
Fe Herbivore 10 100.6496 10.0650 1016.6856 0.24102 -911.3656 1.8595
Ni all 36 82.4994 2.2917 263.2776 0.62756 -181.7465 1.6909
Ni Insectivore 9 14.8874 1.6542 37.4463 0.2641 -20.4654 1.8946
Ni Herbivore 9 23.8583 2.6509 89.7852 0.56246 -53.2704 1.8946
Ni Omnivore 18 43.7537 2.4308 136.0461 0.75261 -98.7967 1.7459
Pb all 138 662.6961 4.8021 3565.3320 0.97193 -3156.5275 1.6561
Pb Insectivore 54 251.9468 4.6657 1296.0365 0.69447 -1151.5028 1.6747
Pb Herbivore 40 215.1331 5.3783 1330.4867 0.76632 -1123.7941 1.6860
Se all 27 38.2005 1.4148 93.2072 0.70378 -50.5952 1.7081
Se Omnivore 21 33.973 1.6178 80.4674 0.73017 -51.1284 1.7291
TCDD all 5 -48.8163 -9.7633 498.5098 0.86676 -376.9043 2.3534
Zn all 103 569.1873 5.5261 3444.9022 0.33578 -3111.9348 1.6601
Zn Insectivore 37 187.4824 5.0671 1008.5309 0.17453 -922.7330 1.6896
Zn Herbivore 30 180.4658 6.0155 1221.5471 0.23049 -1044.8786 1.7011

Please do not forward or discard this document.
If this address is not correct for the designatedaddressee, please return this document to the
EMEF Document Management CenterBuilding K-1002, MS 7243
Lockheed Martin Energy Systems, Inc.P.O. Box 2003
Oak Ridge, TN 37831