development and performance assessment of … · development and performance assessment of a frp...
TRANSCRIPT

DEVELOPMENT AND PERFORMANCE ASSESSMENT OF A FRP STRENGTHENED BALSA-WOOD BRIDGE DECK FOR ACCELERATED
CONSTRUCTION
C.S. Cai1, Archana Nair2, Miao Xia3 and Shuang Hou4 Abstract
Fiber reinforced polymers (FRP) have become more popular construction materials in the last decade due to the reduced material cost. The installation and performance evaluation of the first FRP-wrapped balsa wood bridge in Louisiana is described in this document. The selected bridge structure in this demonstration project will potentially provide a new approach to enhancing the transportation infrastructure in Louisiana. The instrumentation consisted of regular strain gauges, fiber optic strain and temperature sensors, accelerometers and acoustic emission sensors. The measured results from each of the gauges are summarized, and comparisons are made between the finite element models of the bridge structure and the field test results. Before placing the instrumentation on the field bridge, extensive laboratory explorations and numerical analysis were conducted.
Introduction
Conventionally, highway bridge decks in the US are predominantly made of steel-
reinforced concrete. However, repair and maintenance costs of these bridges incurred at the federal and state levels are overwhelming. As a result, for many years there has been pressure on transportation agencies to find new cost-effective and reliable construction materials (Ehlen 1999). A very promising alternative is the Fiber Reinforced Polymer (FRP) bridge deck system. FRP composites have found increasing applications in bridge design and construction. Light weight, high strength and stiffness, durability and ease of construction are major advantages of this material that makes its application in civil infrastructures viable (Murton 2001, Zureick et al. 1995). Meanwhile issues such as high initial construction cost, lack of design guidelines or standards and the materials sensitivity to ultraviolet radiation, etc do still stand against its widespread application (Scott, and Wheeler 2001).
1 Edwin B. and Norma S. McNeil Distinguished Professor, Dept. of Civil and Environmental Engineering, Louisiana State University, Baton Rouge, LA 70803 2 Research Assistant, Dept. of Civil and Environmental Engineering, Louisiana State University, Baton Rouge, LA 70803 3 Research Assistant, Dept. of Civil and Environmental Engineering, Louisiana State University, Baton Rouge, LA 70803 4 Former Post-doctorate Research Assistant, Dept. of Civil and Environmental Engineering, Louisiana State University, Baton Rouge, LA 70803
33

Similar to the condition in any other state of the United States, a large number of existing bridges in Louisiana are weight restricted. There is an urgent need to repair and upgrade the state’s bridge system. Applications of new materials such as Fiber Reinforced Polymers (FRP) are new explorations in dealing with the state’s infrastructure problems. A FRP-wrapped Balsa wood bridge deck system has been developed and installed in Louisiana. In this study, the bridge performance has been evaluated by using live load testing and its long-term performance is monitored using fiber optic sensors. Fiber optic sensors have the advantages of small dimensions, good resolution and accuracy, as well as excellent ability to transmit signal at long distances. They are also immune to electromagnetic and radio frequency interference, and may incorporate a series of interrogated sensors multiplexed along a single fiber. These advantages make fiber optic sensors an ideal tool for structural performance monitoring (Deng and Cai 2007). Preliminary results from acoustic emission, traditional strain sensors, and fiber optic sensors are analyzed to assess the bridge performance. Taking advantage of the new development in FRP materials and fiber optic sensors, this demonstration project will potentially provide a new approach to enhancing the transportation infrastructure in Louisiana and setting up long-term FRP bridge monitoring guidelines.
The objectives of this research are to develop a FRP-wrapped balsa wood bridge
deck system suitable for replacing a damaged steel grid deck in the bridge chosen for this project, assess the options for long-term monitoring and develop long-term monitoring guidelines. These objectives were achieved by focusing on detailed literature review, planning and design to opt for the best FRP deck configuration and developing comprehensive plans to provide performance evaluation and continuous monitoring of the new structural system developed in this project. The ultimate objective is to take advantage of the promising characteristics of FRP materials to develop a more durable, less maintenance intensive bridge system to save the limited budget for more urgent needs in the transportation infrastructure system.
Bridge Description
The bridge selected for this study is the CORIBM Bridge on route LA 70 in District
61, Assumption Parish, Louisiana. The bridge was built in 1988, with a design load of HS20-44 and ADT about 6000. The bridge, with a total length of 145 ft (44.2m) and a roadway width of 46 ft (14m), consists of six 20 ft (6.1m) spans and a 25 ft (7.6m) span. The 20 ft (6.1m) spans are concrete structures and the 25 ft (7.6m) span consists of a steel grid deck supported on steel girders. The height of the superstructure from the top of concrete pedestal to the top of roadway is about 20in (0.51m). The 25 ft (7.6m) steel span is designed for being lifted for river navigation when needed. Error! Reference source not found. shows the damaged grid deck that needs to be replaced in the 25 ft (7.6m) span. The requirement of being movable, the appropriate span length, and the existing height of the superstructure 20 inches (508mm) makes this steel span a good candidate to be replaced with a FRP slab system.
34

The span to be replaced has eight 300×70.86 in (7600×1800 mm) deck panels across the traffic direction. The FRP deck panels which will be bonded on the I girders have the same dimensions as the steel grid deck panels. In this project, the issues of interest for the bridge’s long-term performance monitoring are: (1) Integrity of the FRP-wrapped Balsa wood bridge deck system; (2) the strains in the transverse direction of the deck and the longitudinal direction of the individual girders and (3) Bridge deck–girder interface bond integrity.
Figure 1 CORIBM bridge
To achieve the research objectives stated earlier, the research work is divided into three parts. The first part involves developing a numerical prediction procedure whose results will be compared to available laboratory or field testing results to calibrate the finite element models. The second part is to use the predicted bridge performance to design instrumentation and monitoring systems and the final part involves field installation and testing.
Design of Monitoring System
The instrumentation plan was designed to measure the live load response behavior of the superstructure. The central four composite panels and supporting girders were instrumented with sensors. Both internally and externally attached fiber optic FBG and OTDR sensors were used in this project. These sensors enable both short-term and long term monitoring of strains, slips and temperature in both deck and girder members. Sixteen traditional strain transducers, six accelerometers and eight Acoustic Emission (AE) sensors were also mounted during the live load testing conducted immediately after construction, working as a reference for cross checking the fiber optic sensor (FOS) instrumentation system. FBG Sensors: Although FBG sensors are available commercially, using them as gauges
Figure 2 Composite deck mountable packaged sensor
35
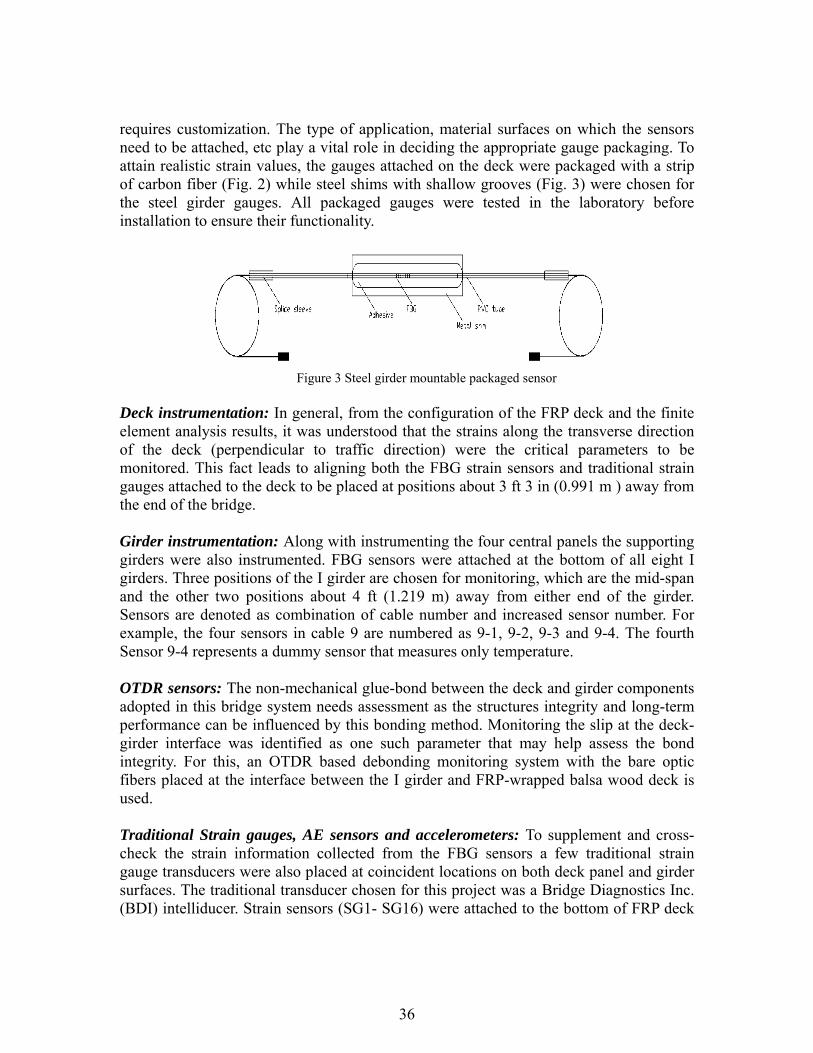
requires customization. The type of application, material surfaces on which the sensors need to be attached, etc play a vital role in deciding the appropriate gauge packaging. To attain realistic strain values, the gauges attached on the deck were packaged with a strip of carbon fiber (Fig. 2) while steel shims with shallow grooves (Fig. 3) were chosen for the steel girder gauges. All packaged gauges were tested in the laboratory before installation to ensure their functionality.
Deck instrumentation: In general, from the configuration of the FRP deck and the finite element analysis results, it was understood that the strains along the transverse direction of the deck (perpendicular to traffic direction) were the critical parameters to be monitored. This fact leads to aligning both the FBG strain sensors and traditional strain gauges attached to the deck to be placed at positions about 3 ft 3 in (0.991 m ) away from the end of the bridge. Girder instrumentation: Along with instrumenting the four central panels the supporting girders were also instrumented. FBG sensors were attached at the bottom of all eight I girders. Three positions of the I girder are chosen for monitoring, which are the mid-span and the other two positions about 4 ft (1.219 m) away from either end of the girder. Sensors are denoted as combination of cable number and increased sensor number. For example, the four sensors in cable 9 are numbered as 9-1, 9-2, 9-3 and 9-4. The fourth Sensor 9-4 represents a dummy sensor that measures only temperature. OTDR sensors: The non-mechanical glue-bond between the deck and girder components adopted in this bridge system needs assessment as the structures integrity and long-term performance can be influenced by this bonding method. Monitoring the slip at the deck-girder interface was identified as one such parameter that may help assess the bond integrity. For this, an OTDR based debonding monitoring system with the bare optic fibers placed at the interface between the I girder and FRP-wrapped balsa wood deck is used. Traditional Strain gauges, AE sensors and accelerometers: To supplement and cross-check the strain information collected from the FBG sensors a few traditional strain gauge transducers were also placed at coincident locations on both deck panel and girder surfaces. The traditional transducer chosen for this project was a Bridge Diagnostics Inc. (BDI) intelliducer. Strain sensors (SG1- SG16) were attached to the bottom of FRP deck
Figure 3 Steel girder mountable packaged sensor
36

assembly along the centerline between two girders, while sensors attached to the steel girders were located at the mid-span. Sensors on the girders are attached to both the bottom flange and top flange to identify extent of composite action between the deck and girder.
The AE sensors used in this project were the resonant type R15I manufactured by Physical Acoustics Corporation (PAC). Eight AE sensors were included in the instrumentation plan. These are located on the two central panels of the bridge along the centerline of the deck between two supporting girders. Since the deck is glued to the girder in this span of the bridge the interface cannot be inspected visually to confirm bond integrity. The AE sensors used in this test plan are intended to be used as a tool to help assess the integrity of this interface. Additionally, six accelerometers were also affixed to the decks and girders during live load testing to capture the modal characteristics of the bridge during dynamic loading.
FRP deck manufacture and final installation
(a) (b)
(c) (d) Figure 4 FRP-wrapped Balsa wood bridge deck installation: a) Balsa wood beam wrapped with FRP material b) FRP deck assembly c) Application of bonding agent on girder d) Finished FRP deck attached to steel girder.
The new bridge deck consists of pre-fabricated FRP-wrapped balsa wood units.
The fabrication sequence of the bridge deck units and final installation are illustrated in Fig. 4(a) that shows the balsa wood beam being wrapped with GFRP sheet. In Fig. 4(b) a single panel is being assembled using several of the wrapped balsa wood beams and hardwire layers. The deck was adhesively bonded to the steel girder using customized
37

epoxy (Fig. 4(c)) and a bonded panel is shown in Fig. 4 (d).
Live load testing plan
After the construction phase, live load tests were conducted in October 2009 to evaluate the performance of the newly installed deck system. A total of 6 loading tests were performed, which comprised of four static and two dynamic load cases for each traffic lane. The static tests involved both static stopping and static rolling tests while dynamic tests involved varied speed levels. The vehicle configuration used for all bridge tests is represented in Fig. 5. Prior to the testing, the vehicles were weighed and measured. The vehicle was loaded with bags of crushed asphalt, in the back.
Figure 5 Test truck axle configuration
For the static stopping tests the trucks were stopped for a few seconds at three locations on the bridge. While in all static rolling tests the test truck travelled at a constant speed of about 3-5 mph (1.34-2.23 m/s). For the dynamic tests, the trucks passed by each traffic lane twice at an approximate speed of 30 mph (13.41m/s) followed by the permitted lane speed of 55 mph (24.58m/s).
To facilitate easy identification of data collected for the same load case in different acquisition systems a typical naming convention was developed. The traffic lane is identified as North and South bound using letters ‘N’ and ‘S’. Static Stopping load case is identified as ‘SS’ and Static Rolling is ‘SR’. Each load pass is identified with numerals 1, 2, etc. Since the Static stopping load case has three data collection points these are named sequentially as a, b, c, etc. The numbers 30/55 after the dynamic load case name signify the speed of the truck adopted for that load case.
The data collected from FBG Interrogators for each load case is in the form of
wavelength shifts and are externally processed using MATLAB and MS EXCEL to convert the values to meaningful strain/temperature data using appropriate calibration factors. The equation used to convert wavelength shifts in FBG strain and temperature
38

gauges is represented as:
TGG Tεb
b Δ+Δ=Δ
ελλ
(1) where, Gε is the strain gauge factor, Gε =1.2×10⁻⁶µε GT is the temperature gauge factor, GT =10×10-6/oC [4]
Data from the BDI strain transducers do not need any external processing, as they directly provide the real time measured strain values. Post-processing of data to generate meaningful plots to better understand the structural performance under service loads is required for data acquired from all acquisition systems and are presented and discussed in detail in the next section.
Field Data analysis
Figure 6 Plan view of all functional strain sensors attached to decks and girders during short-term test (E-L:
Girders; D1 – D4: Deck panels; SG: Traditional Strain Gauge; X-1, 2, 3, 4- FBG sensors)
Traditional strain data analysis: The measured static live load strain changes in micro strain (με) at each of the 16 gauge locations were plotted versus time/position along the bridge for all load cases. Fig. 6 is a sensor layout plan for all functional strain gauges installed on the central four panels of the bridge during the live load test. The observations made from only the south bound-lane testing will be discussed in this section. The general trends observed from Fig. 7 to Fig. 8 are: (i) Maximum strains of up to 350 µε are observed from the gauges located on the deck for most static rolling load cases. Strain peaks were generally seen to decrease under dynamic test cases from
39

sensors attached on the deck; and (ii) The maximum recorded strains on the girders for all load cases fall in the range of 150-200 µε. Differences are observed in strain readings at the same location from the top and bottom flanges of the girder implying the presence of composite action between the girder and deck.
(a) BDI deck strain plot for load case S_SR1 (b) BDI girder strain plot for load case S_SR1
Figure 7 Strain plots of sensors on deck panels (a) and girders (b) for static rolling load cases
(a) BDI deck strain plot for load case S_D1-30 (b)BDI girder strain plot for load case S_D1-30
Figure 8 Strain plots of sensors on deck panels (a) and girders(b) for dynamic load cases
FBG strain data analysis: The strain plots for girders (Fig. 9) and decks (Fig. 10)
are separately presented here. Again, only south bound lane results are discussed here. Although maximum girder strains range from 150-200 µε (Fig. 9) and strain profile indicates load sensitivity, they do not match up exactly with strain readings from the traditional gauge (Fig. 11). This could be attributed to the lack of direct adhesion of the gauges on the structural surface and thus influence of sensor backing material behavior. Strains from the deck sensors are shown in Fig. 10. Compared to the traditional strain gauge records, the data peaks collected from the FBG sensors for similar load cases seem to show a 25% decrease on average.
40

(a) FBG strain plot for load case S_SR1 (b) FBG strain plot for load case S_SR2
Figure 9 Strain plots of girder sensors
(a) FBG strain plot for load case S_SR1 (b) FBG strain plot for load case S_SR2
(c)FBG Strain plot for load case S_D1-30 (d) FBG Strain plot for load case S_D2-30
41

(e) FBG Strain plot for load case S_D1-55 Figure 10 Strain plots of deck panel sensors for all load cases
(a) Deck 1(north end) for load case S_SR3 (b) Deck 1(north end) for load case S_D2-30
Figure 11 SG and FBG strain comparison for deck
AE data analysis: Each composite deck of this bridge is glued using epoxy to a
pair of steel girders. Although this unique configuration speeds up construction the visual inspection at the deck-girder interface is not possible. Thus to assess the behavior of the structural components under service loads, Acoustic Emission (AE) sensors were used. Here, results of AE monitoring at the composite deck are discussed. AE parameters were recorded at a 45dB threshold using an AE 8-channel DiSP system. All eight sensors used in this test were R15I, with resonant frequency of 150kHz and 40dB integral amplifier. The AE sensors were attached along the centerline of each deck, with four sensors placed at 1.829 m (6ft) intervals on each deck. The sensors were arranged such that for each lane tested a set of four sensors will correspond to the travel of the left-side wheels of the truck.
42
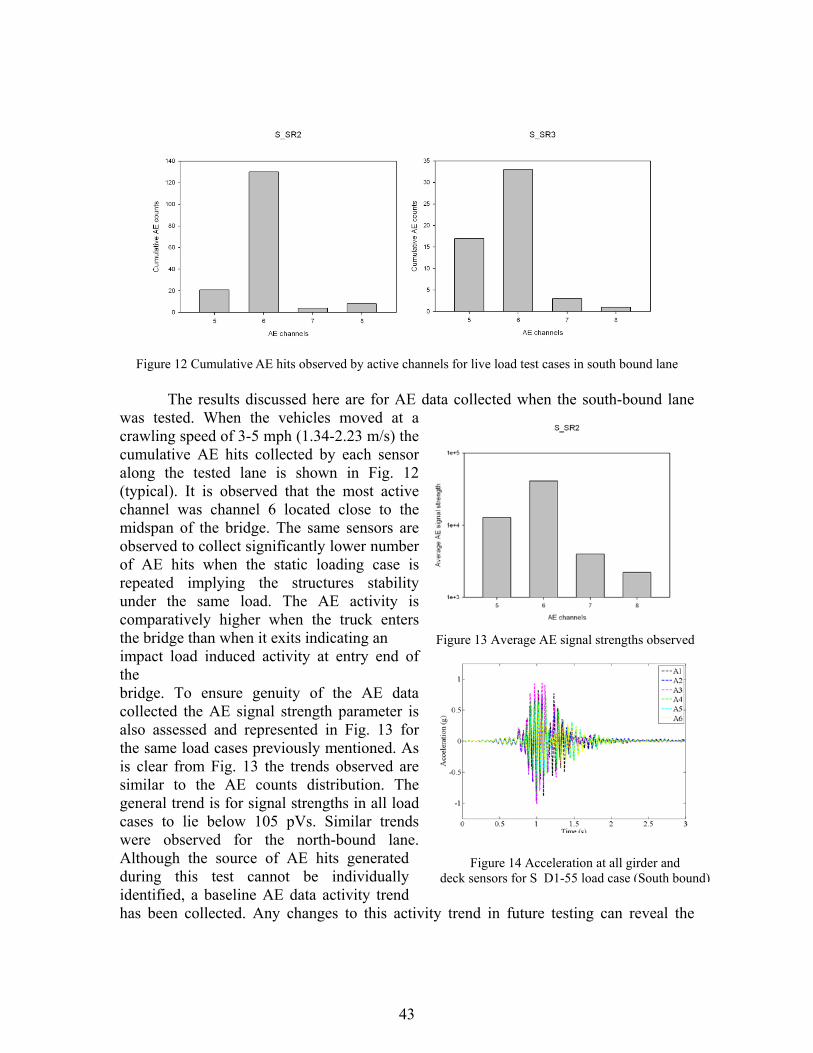
Figure 12 Cumulative AE hits observed by active channels for live load test cases in south bound lane
The results discussed here are for AE data collected when the south-bound lane
was tested. When the vehicles moved at a crawling speed of 3-5 mph (1.34-2.23 m/s) the cumulative AE hits collected by each sensor along the tested lane is shown in Fig. 12 (typical). It is observed that the most active channel was channel 6 located close to the midspan of the bridge. The same sensors are observed to collect significantly lower number of AE hits when the static loading case is repeated implying the structures stability under the same load. The AE activity is comparatively higher when the truck enters the bridge than when it exits indicating an impact load induced activity at entry end of the bridge. To ensure genuity of the AE data collected the AE signal strength parameter is also assessed and represented in Fig. 13 for the same load cases previously mentioned. As is clear from Fig. 13 the trends observed are similar to the AE counts distribution. The general trend is for signal strengths in all load cases to lie below 105 pVs. Similar trends were observed for the north-bound lane. Although the source of AE hits generated during this test cannot be individually identified, a baseline AE data activity trend has been collected. Any changes to this activity trend in future testing can reveal the
Figure 13 Average AE signal strengths observed
Figure 14 Acceleration at all girder and deck sensors for S D1-55 load case (South bound)
43
changes in the monitored bridge component behavior over time.
Accelerometer data analysis: Typical acceleration information obtained from dynamic load test cases is plotted in Fig. 14. Gauges A2 and A5 were located on the midspan of the deck while all other sensors were on the bottom flange girder midspan.
Finite Element Analysis
The slight discrepancies in the strain data collected from FBG and BDI strain transducers required the analytical modeling of the bridge structure to better understand the strain values that actually reflects the structural behavior of the monitored bridge. A Finite Element Model (FEM) is developed for one lane of the tested bridge in ANSYS for both fully composite and non-composite conditions. After an initial comparison of the fully composite model strain values with field data it was observed that although the girder strains were close, the deck strains were considerably lower than the live load test data. Thus, the non-composite model was generated to see if improvements could be achieved in the deck strain values. The measured strains from the static stopping test were compared to calculated ones from the FE model.
In this model the components of the bridge are modeled using shell elements. The slab was modeled using eight-node Shell 99 elements which have six degrees of freedom at each node. Beams and diaphragms were modeled using the four-node Shell 63 elements which also has six degrees of freedom. For the non-composite representation the deck and girder were separated by a 1 inch gap and coupled along the centerline nodes of the girder to the corresponding nodes on the deck. The global coordinate system adopted for this model was with the X axis taken along the transverse direction of the bridge, the Y axis along the depth and the Z axis along the length of the bridge.
In this study, the truck loading used in the model was of the actual truck used
during live load testing (see Fig. 5). To make a close comparison with the field strain data, the strain data from the FE model was collected from nodes that were located approximately at the same location as the field measurement points. Since strain data comparisons includes data collected from both deck and girder, the FE strain results were correspondingly collected in both the transverse (X) and longitudinal directions (Z).
Generally the measured and FEM strains are observed to be the largest on the
members right under the load. Strain values predicted for all girders were almost always higher than the measured value by 10-15% in this model as will be further discussed in Table 1. The strains predicted on members away from the load are relatively small in the model and thus not comparable with field measured values at those locations. The lesser strain values predicted by the model along the X-direction (deck) lead to the need to construct another model where the deck and girder act as non-composite sections as discussed earlier. It is noted that the deck consists of balsa wood, high strength wires, and
44

multi-layered FRP materials, which makes the accurate modeling of the deck system very difficult. A direct comparison of all strain values collected from BDI strain gauges and FE models is summarized in Table 1.
Table 1 Strain (µε) comparisons
Girder Deck SG9 SG 10 SG11 SG 12 SG3 SG4 SG15 SG16
S_SS1-a G1_Top G1_Bott G2_Top G2_Bott D_1(S) D_2(S) D_1(N) D_2(N) BDI -42.45 101.55 -57.5 86.1 241.5 223.5 131.5 91.1
FEM (C)* -52.2 123.44 -51.36 120.36 172.19 168.92 38.8 31.2 FEM(N_C)** -144.47 144.5 -125.97 127.6 198.75 201.58 45 43.5
S_SS1-b BDI -55.5 164.5 -76.7 134 50.5 34.65 30.4 47.3
FEM (C) -91.07 179.6 -66.01 176.55 6.4 7.96 27.8 22.4 FEM N_C) -227.7 224.87 -185.73 194.16 7.242 7.72 34.5 41.1
S_SS1-c BDI -41.3 83.6 -53.2 69.65 18.25 2.9725 216.5 263.5
FEM (C) -48.7 96.45 -39.64 93.21 1.78 2.34 163.58 168.5 FEM(N_C) -118.6 118.6 -104.35 104.6 1.995 2.33 202.12 200.9
Notes: S_SS1-a, S_SS1-b and S_SS1-c represent truck stopping locations a, b, and c, respectively
FEM (C) – results from the composite model FEM (N_C) – results from the non-composite model Strain units - µε
Conclusions A pilot demonstration project of a FRP-wrapped Balsa wood bridge deck system was developed and has been installed in Louisiana. Extensive monitoring strategies are implemented to evaluate both the short and long-term performance of this bridge using conventional gauges along with the new generation fiber optic sensors. After installation, a live load test scheme was conducted to study the initial performance of the new bridge system. The analysis of the data collected from various gauges used during this test lead us to arrive at these preliminary conclusions:
• The maximum tensile strain measured at both deck and girder members remained well below the original design limit, thus assuring the structural integrity of the new deck girder system.
• The strain data collected from both BDI and FBG strain gauges enabled neutral axis estimation and revealed that partial-composite action was pertinent between the epoxy glued FRP deck and steel girder.
• Although the tensile strain profiles of the steel girders from field data were similar to those from finite-element analysis of the composite model of the bridge superstructure, only a non-composite model could generate strain profiles similar
45
to those collected from the deck. Uncertainties in the overall material property estimations used as inputs in the FEM model may have influenced the discrepancies visible in field and analytical data comparisons.
• The acoustic sensors used during this load test helped to establish a baseline AE data trend to assess the integrity of glued FRP bridge deck - steel girder bond. Any change in this trend in a future test can help to reveal any discontinuities in this bond line over time.
• The existence of partial composite action between the superstructure components was also ascertained from the accelerometer readings.
• The similarities obtained by comparing strain profiles gathered at the same locations by both BDI and FBG sensors allows for the continued use of the permanently installed FBG sensors on the bridge for long-term bridge performance monitoring.
Acknowledgement
The investigators are thankful to Federal Highway Administration and Louisiana Transportation Research Center (LTRC) for funding this project. The contents presented reflect only the views of the writers who are responsible for the facts and the accuracy of the data presented herein. We would like to also express thankfulness to those who provided help during the development of these initial tasks of this research program. Special thanks go to the project manager Mr. Walid Alaywan, La DOTD crew, and graduate students at LSU for their hard work during the installation and bridge testing process. The bridge deck was manufactured by Alcan Baltek Corporation and Dr. Kurt Feichtinger’s effort for this project is greatly appreciated.
References
Deng, L., Cai, C.S., (2007), “Applications of fiber optic sensors in civil engineering”, Structural Engineering and Mechanics, Vol. 25, No. 5, pp 577-596.
Ehlen, M. A. (1999). “Life-Cycle Costs of Fiber-Reinforced-Polymer Bridge Decks”, Journal of Material in Civil Engineering, vol. 11, No. 3, pp 224-230.
Murton, M. C. (2001), "Commercialization of FRP Bridge Decks: Lessons and Challenges for Ohio's 'Project 100'."International SAMPE Symposium and Exhibition: [Proceedings], vol.46 I, pp 943-951.
Scott, I. and Wheeler, K. (2001). “Application of Fibre Reinforced Polymer Composites in Bridge Construction”, The Second IPWEA Conference, October 28 2001, Port Macquarie, NSW, Australia.
Zureick, A., Shih, B and Munley, E (1995),"Fiber-Reinforced Polymeric Bridge Decks." Structural Engineering Review, Vol.7, No.3, pp 257-266.
46