development and formative evaluation of a motorcycle rider...
TRANSCRIPT
Development and Formative Evaluation of a Motorcycle Rider Training
Intervention to Address Risk Taking
Peter Rowden
Bachelor of Psychology (Hons)
A thesis submitted in fulfilment for the degree of Doctor of Philosophy
Centre for Accident Research and Road Safety – Queensland
Institute of Health and Biomedical Innovation
School of Psychology and Counselling
Faculty of Health
Queensland University of Technology
December 2012


i
Keywords
Motorcycle, Powered-Two-Wheeler, Rider Training, Rider Education, Driver
Training, Driver Education, Brief Intervention, Risk Taking, Risky Riding,
Formative Evaluation, Road Safety

ii
iii
Abstract
The need to address on-road motorcycle safety in Australia is important due to
the disproportionately high percentage of riders and pillions killed and injured each
year. One approach to preventing motorcycle-related injury is through training and
education. However, motorcycle rider training lacks empirical support as an effective
road safety countermeasure to reduce crash involvement. Previous reviews have
highlighted that risk-taking is a contributing factor in many motorcycle crashes,
rather than merely a lack of vehicle-control skills (Haworth & Mulvihill, 2005;
Jonah, Dawson & Bragg, 1982; Watson et al, 1996). Hence, though the basic
vehicle-handling skills and knowledge of road rules that are taught in most
traditional motorcycle licence training programs may be seen as an essential
condition of safe riding, they do not appear to be sufficient in terms of crash
reduction. With this in mind there is considerable scope for the improvement of
program focus and content for rider training and education. This program of research
examined an existing traditional pre-licence motorcycle rider training program and
formatively evaluated the addition of a new classroom-based module to address risky
riding; the Three Steps to Safer Riding program. The pilot program was delivered in
the real world context of the Q-Ride motorcycle licensing system in the state of
Queensland, Australia. Three studies were conducted as part of the program of
research: Study 1, a qualitative investigation of delivery practices and student
learning needs in an existing rider training course; Study 2, an investigation of the
extent to which an existing motorcycle rider training course addressed risky riding
attitudes and motives; and Study 3, a formative evaluation of the new program.
A literature review as well as the investigation of learning needs for
motorcyclists in Study 1 aimed to inform the initial planning and development of the
Three Steps to Safer Riding program. Findings from Study 1 suggested that the
training delivery protocols used by the industry partner training organisation were
consistent with a learner-centred approach and largely met the learning needs of
trainee riders. However, it also found that information from the course needs to be
reinforced by on-road experiences for some riders once licensed and that personal
meaning for training information was not fully gained until some riding experience
had been obtained. While this research informed the planning and development of
iv
the new program, a project team of academics and industry experts were responsible
for the formulation of the final program. Study 2 and Study 3 were conducted for the
purpose of formative evaluation and program refinement.
Study 2 served primarily as a trial to test research protocols and data collection
methods with the industry partner organisation and, importantly, also served to
gather comparison data for the pilot program which was implemented with the same
rider training organisation. Findings from Study 2 suggested that the existing training
program of the partner organisation generally had a positive (albeit small) effect on
safety in terms of influencing attitudes to risk taking, the propensity for thrill
seeking, and intentions to engage in future risky riding. However, maintenance of
these effects over time and the effects on riding behaviour remain unclear due to a
low response rate upon follow-up 24 months after licensing.
Study 3 was a formative evaluation of the new pilot program to establish
program effects and possible areas for improvement. Study 3a examined the short
term effects of the intervention pilot on psychosocial factors underpinning risky
riding compared to the effects of the standard traditional training program (examined
in Study 2). It showed that the course which included the Three Steps to Safer Riding
program elicited significantly greater positive attitude change towards road safety
than the existing standard licensing course. This effect was found immediately
following training, and mean scores for attitudes towards safety were also maintained
at the 12 month follow-up. The pilot program also had an immediate effect on other
key variables such as risky riding intentions and the propensity for thrill seeking,
although not significantly greater than the traditional standard training. A low
response rate at the 12 month follow-up unfortunately prevented any firm
conclusions being drawn regarding the impact of the pilot program on self-reported
risky riding once licensed.
Study 3a further showed that the use of intermediate outcomes such as self-
reported attitudes and intentions for evaluation purposes provides insights into the
mechanisms underpinning risky riding that can be changed by education and
training. A multifaceted process evaluation conducted in Study 3b confirmed that the
intervention pilot was largely delivered as designed, with course participants also
rating most aspects of training delivery highly.
v
The complete program of research contributed to the overall body of
knowledge relating to motorcycle rider training, with some potential implications for
policy in the area of motorcycle rider licensing. A key finding of the research was
that psychosocial influences on risky riding can be shaped by structured education
that focuses on awareness raising at a personal level and provides strategies to
manage future riding situations. However, the formative evaluation was mainly
designed to identify areas of improvement for the Three Steps to Safer Riding
program and found several areas of potential refinement to improve future efficacy
of the program. This included aspects of program content, program delivery,
resource development, and measurement tools. The planned future follow-up of
program participants’ official crash and traffic offence records over time may lend
further support for the application of the program within licensing systems. The
findings reported in this thesis offer an initial indication that the Three Steps to Safer
Riding is a useful resource to accompany skills-based training programs.

vi
vii
Table of Contents
Keywords .................................................................................................................................. i
Abstract ................................................................................................................................... iii
List of Figures ....................................................................................................................... xiii
List of Tables ......................................................................................................................... xv
List of Abbreviations ........................................................................................................... xvii
Statement of Original Authorship ......................................................................................... xix
Acknowledgments ................................................................................................................ xxi
CHAPTER 1: INTRODUCTION .......................................................................................... 1
1.1 Introductory Comments ............................................................................................. 1
1.2 Defining Rider Training and Education ..................................................................... 2
1.3 Rationale for the Research: Why Persist with Rider Training?.................................. 2
1.4 Broad Research Aims, Scope, and Context ................................................................ 4
1.5 Theoretical Perspectives to Guide Program Design and Evaluation .......................... 7
1.6 Thesis outline ............................................................................................................. 8
1.7 Chapter Summary .................................................................................................... 10
CHAPTER 2: LITERATURE REVIEW ........................................................................... 11
2.1 Introductory Comments ........................................................................................... 11
2.2 The Prevalence of Motorcycle Crashes and Risk of Injury ...................................... 11
2.3 The Characteristics of Road Crashes Involving Motorcycles .................................. 12
2.4 Risk Taking and Motorcycling Injury ...................................................................... 14
2.4.1 Speeding ....................................................................................................... 15
2.4.2 Alcohol and Drug Impairment ...................................................................... 17
2.4.3 Fatigue .......................................................................................................... 19
2.4.4 Non-usage of Helmets and Protective Clothing ............................................ 21
2.4.4.1 Helmets ............................................................................................ 21
2.4.4.2 Protective Clothing .......................................................................... 22
2.4.5 Unlicensed Riding ........................................................................................ 23
2.4.6 Psychosocial Influences on Risk Taking by Motorcyclists ........................... 25
2.4.6.1 Riding Motives ................................................................................ 25
2.4.6.2 Overconfidence ................................................................................ 27
2.4.6.3 Personality ....................................................................................... 28
2.4.6.4 Social Norms ................................................................................... 29

viii
2.4.6.5 Attitudes and Beliefs ...................................................................... 30
2.5 Rider Training and Education ................................................................................... 31
2.5.1 Addressing Attitudes and Risk-Taking Motives for Motorcyclists
through Training and Education ............................................................................... 32
2.5.1.1 Norwegian Licensing and Training Initiatives ................................ 32
2.5.1.2 The Initial Rider Training Project (IRT) .......................................... 35
2.5.1.3 Rider Education Program in Thailand ............................................ 37
2.5.1.4 Bikesafe Scotland ............................................................................ 38
2.5.1.5 Rider Risk Reduction (RRR) Course ............................................... 39
2.5.1.6 Riders Helping Riders – Drink Riding Intervention ........................ 40
2.5.1.7 Summary of Programs Addressing Risk Taking by Motorcyclists .. 42
2.5.2 What Can be Learnt from Attitudinal and Behavioural Interventions
for Car Drivers? ........................................................................................................ 42
2.5.2.1 South Australian Driver Intervention Program (Driver
Improvement) .................................................................................. 43
2.5.2.2 Thames Valley Speeding Awareness Scheme for Speeding
Offenders 45
2.5.2.3 Optimism Bias Training .................................................................. 47
2.5.2.4 Insight Training for Young Drivers – Senserrick ............................ 48
2.5.2.5 Computer Based Risk Assessment Software Application ............... 49
2.5.3 Training Delivery .......................................................................................... 50
2.5.3.1 Deep and Surface Approaches to Learning ..................................... 51
2.5.3.2 Learning Orientation/Motivation ..................................................... 52
2.5.3.3 Student Perceptions of Teaching and Learning Environment.......... 53
2.5.3.4 Other Issues for Adult Learners ....................................................... 53
2.5.4 The Influence of the Licensing System on Training ...................................... 54
2.5.5 Rider Training Evaluation ............................................................................. 56
2.5.5.1 Formative Evaluation ........................................................................ 57
2.6 The Feasibility of Brief Interventions for Rider Training and Education ................. 59
2.7 Theoretical Perspectives on Rider Education to Address Risk Taking ..................... 60
2.7.1 The Theory of Planned Behaviour (TPB) ...................................................... 61
2.7.2 The Transtheoretical Model of Behaviour Change ........................................ 64
2.8 Desirable Components of a Rider Education Program to Address Risky Riding ..... 67
2.9 Research Questions ................................................................................................... 70
2.10 Chapter Summary ..................................................................................................... 75
CHAPTER 3: STUDY 1 - A QUALITATIVE EXPLORATION OF MOTORCYCLE
RIDER LEARNING PROCESSES, TRAINING DELIVERY PRACTICES, AND
PERCEIVED SAFETY ........................................................................................................ 77
ix
3.1 Introductory Comments ........................................................................................... 77
3.2 Study Aims, Scope, and Research Questions ........................................................... 78
3.3 Method ..................................................................................................................... 79
3.3.1 Participants ................................................................................................... 79
3.3.2 Measures ....................................................................................................... 80
3.3.3 Procedure ...................................................................................................... 80
3.4 Results ...................................................................................................................... 81
3.4.1 Theme 1 ........................................................................................................ 81
3.4.1.1 Learning Motivation ........................................................................ 81
3.4.1.2 The Influence of Past Experience on Learning ................................ 82
3.4.1.3 Learning Styles ................................................................................ 83
3.4.1.4 Rapport Building ............................................................................. 84
3.4.2 Theme 2 ........................................................................................................ 84
3.4.2.1 Information Retained From Training ............................................... 84
3.4.2.2 Learning from Experience ............................................................... 86
3.4.3 Theme 3 ........................................................................................................ 87
3.4.3.1 Initial Stages of Motorcycle Licensure ............................................ 87
3.4.3.2 The Adequacy of Licence Competencies for Safe Riding ............... 88
3.4.3.3 Licensing Incentives and Safety ...................................................... 89
3.4.3.4 Summary of Results ......................................................................... 90
3.5 Discussion ................................................................................................................ 90
3.5.1 How Congruent are Existing Training Practices with Adult Learning
Principles? ................................................................................................................ 90
3.5.2 How Does the Licensing Context Influence Delivery Practice for
Training and Student Expectations of the Course? .................................................. 92
3.5.3 How Can Rider Training be Informed by Student Perceptions and
Experiences to Improve Safety Outcomes?.............................................................. 94
3.5.4 Limitations .................................................................................................... 95
3.5.5 Implications for the Three Steps to Safer Riding Intervention ..................... 96
3.6 Chapter Summary .................................................................................................... 97
CHAPTER 4: STUDY 2 – AN EMPIRICAL INVESTIGATION OF THE EFFECTS
OF AN EXISTING MOTORCYCLE RIDER TRAINING PROGRAM ON
PSYCHOSOCIAL INFLUENCES ON RISKY RIDING ................................................. 99
4.1 Introductory Comments ........................................................................................... 99
4.2 Development of an Evaluation Strategy and Research Design .............................. 100
4.2.1 Evaluation Strategy for Program Effect on Factors Underpinning Risk
Taking .................................................................................................................... 100
4.2.1.1 The TPB as an Evaluation Framework ............................................ 103
4.3 Study Aims & Research Questions ........................................................................ 103
4.3.1 Research Questions ..................................................................................... 104
x
4.4 Method ................................................................................................................... 105
4.4.1 Participants .................................................................................................. 105
4.4.2 Materials ...................................................................................................... 106
4.4.2.1 Questionnaires ............................................................................... 106
4.4.2.2 Consent Forms and Information Sheets ......................................... 108
4.4.2.3 Introduction to Training Video ...................................................... 108
4.4.3 Procedure ..................................................................................................... 109
4.4.3.1 Partner Organisation Preparation ................................................... 109
4.4.3.2 Data Collection .............................................................................. 110
4.4.4 Data Analysis and Data Cleaning ................................................................ 111
4.5 Results ..................................................................................................................... 112
4.5.1 Scale Reliability .......................................................................................... 112
4.5.2 Start of Training (T1) Descriptive Data ....................................................... 113
4.5.3 End of Training (T2) .................................................................................... 118
4.5.3.1 Descriptive Data ............................................................................ 118
4.5.3.2 Comparing T2 Respondents with Non-respondents ...................... 120
4.5.3.3 Start and End of Training Data Comparisons (T1 vs T2) .............. 121
4.5.3.4 Statistical Comparisons between Riding Subgroups from
T1 to T2 ......................................................................................... 124
4.5.4 Self-report Post Licence Follow-up (T3) ..................................................... 126
4.6 Discussion ............................................................................................................... 127
4.6.1 Does the Existing Training have an Immediate Positive or Negative
Effect on Self-reported Attitudinal and Motivational Factors that may
Influence Risky riding? ........................................................................................... 128
4.6.1.1 Immediate Positive Effects ............................................................ 128
4.6.1.2 Immediate Potential Negative Effects ........................................... 129
4.6.2 Does the Existing Standard Training Have Differential Positive or
Negative Effects on Different Types of Riders? ..................................................... 131
4.6.3 Are any Immediate Effects of Training Maintained Over Time and do
They Transpose to Riding Behaviour at 24 months Post Licence? ......................... 133
4.6.4 How Findings Informed Intervention Development .................................... 135
4.6.5 Limitations ................................................................................................... 136
4.7 Summary and Conclusions ..................................................................................... 137
CHAPTER 5: STUDY 3 – FORMATIVE EVALUATION OF THE EFFECTS OF A
RIDER EDUCATION PROGRAM TO ADDRESS ATTITUDINAL AND
MOTIVATIONAL INFLUENCES ON RISKY RIDING. .............................................. 139
5.1 Introductory Comments .......................................................................................... 139
5.2 Study 3a: Evaluation of the Effects of the Three Steps to Safer Riding Program on
Psychosocial Influences on Risky Riding ............................................................... 140
5.2.1 Aims & Hypotheses ..................................................................................... 140
xi
5.2.2 Method ........................................................................................................ 141
5.2.2.1 Participants .................................................................................... 141
5.2.2.2 Materials ........................................................................................ 143
5.2.2.3 Procedure ....................................................................................... 143
5.2.2.4 Data Analysis and Data Cleaning .................................................. 145
5.2.3 Results ........................................................................................................ 146
5.2.3.1 Scale Reliability ............................................................................. 146
5.2.3.2 Start of Training (T1) Descriptive Data ......................................... 147
5.2.3.3 End of Training (T2) ..................................................................... 155
5.2.3.4 Start and End of Training Data Comparisons (T1 vs T2) .............. 156
5.2.3.5 Statistical Comparisons for Riding Subgroups from T1 to T2....... 159
5.2.3.6 Self-report Post Licence Follow-up (T3) ....................................... 160
5.2.3.7 Comparing Program Effects for the Treatment and Comparison
groups ............................................................................................ 166
5.2.4 Discussion – Interim Outcome Evaluation ................................................. 171
5.2.4.1 Hypothesis 1 .................................................................................. 172
5.2.4.2 Hypothesis 2 ................................................................................. 176
5.2.4.3 Hypothesis 3 .................................................................................. 177
5.2.4.4 Hypothesis 4 .................................................................................. 178
5.2.4.5 Hypothesis 5 .................................................................................. 179
5.2.4.6 Effects for Motorcycling Subgroups .............................................. 180
5.2.4.7 Implications ................................................................................... 180
5.2.4.8 Strengths and Weaknesses of the Study ......................................... 184
5.2.4.9 Conclusions ................................................................................... 186
5.3 Study 3b: Process Evaluation ................................................................................. 186
5.3.1 Background ................................................................................................. 186
5.3.2 Research Aims ............................................................................................ 187
5.3.3 Interview and Focus Group Methods ......................................................... 188
5.3.3.1 Participants .................................................................................... 188
5.3.3.2 Materials and Procedure ................................................................ 189
5.3.4 Training Delivery Observation Methods .................................................... 190
5.3.4.1 Participants .................................................................................... 190
5.3.4.2 Materials and procedure................................................................. 190
5.3.5 Process Evaluation Results ......................................................................... 191
5.3.5.1 Findings from Instructor Interviews .............................................. 191
5.3.5.2 Focus Groups and Interview Findings for Intervention Participants193
5.3.5.3 Training Delivery Observation Findings ....................................... 198
5.3.5.4 Process Evaluation Findings from Questionnaire Items ............... 199
5.3.6 Discussion - Process Evaluation ................................................................. 201
5.3.6.1 Conclusions ................................................................................... 203
xii
5.4 Chapter Summary ................................................................................................... 204
CHAPTER 6: DISCUSSION ............................................................................................. 207
6.1 Introductory Comments .......................................................................................... 207
6.2 Review of Findings ................................................................................................. 208
6.2.1 What are the desirable components of a classroom-based educational
program to address risky riding by motorcyclists (RQ1)? ...................................... 208
6.2.2 What specific learning needs do motorcycle riders have and how do
student perceptions and program context influence what is learnt (RQ2)? ............. 210
6.2.2.1 The Hidden Curriculum and Student Perceptions ......................... 212
6.2.3 What effect (if any) does the Three Steps to Safer Riding pilot
program have on attitudinal and motivational factors that underpin risky
riding, and is this more specific to particular subgroups of riders (RQ3)? ............. 213
6.2.3.1 Riding subgroups ........................................................................... 214
6.2.3.2 Differences between the treatment group and comparison group .. 215
6.2.4 What effect (if any) does the Three Steps to Safer Riding pilot
program have on risky riding behaviour (RQ4)? .................................................... 215
6.2.5 What improvements can be made to enhance the Three Steps to Safer
Riding pilot program, its practical utility and potential safety efficacy (RQ5)? ..... 217
6.2.6 Summary of Research Findings ................................................................... 220
6.3 Broad Implications for Rider Training and Licensing ............................................ 220
6.4 Strengths and Limitations ....................................................................................... 225
6.4.1 Strengths of the Research ............................................................................ 225
6.4.2 Limitations of the Research ......................................................................... 226
6.5 Future Research Directions ..................................................................................... 228
6.5.1 Establishing the Crash Reduction Benefits of the Three Steps to Safer
Riding Program ....................................................................................................... 228
6.5.2 Electronic Delivery of Education to Address Attitudinal and
Motivational Factors ............................................................................................... 229
6.5.3 Other issues for future research for rider training ........................................ 230
6.6 Concluding Remarks ............................................................................................... 231
xiii
List of Figures
2.1 The GADGET (GDE) Matrix applied to motorcycling. Source
Lund (2006)
33
2.2 Norwegian Motorcycle Licensing System Components: Source
Norwegian Public Roads Administration Handbook 251E
3
35
2.3 Components of the Initial Rider Training Project. Source:
European Commission, 2007
3
36
2.4 A Modified Conceptualisation of the Theory of Planned
Behaviour
63
2.5 Progression of studies undertaken by the candidate to address the
research questions
74
6.1 Multiple learning opportunities to reduce risk taking by
motorcyclists
223

xiv

xv
List of Tables
1.1 Research objectives for the development and evaluation of the
Three Steps to Safer Riding program 6
2.1 Desirable components for a rider training/education program to
address risky riding. 68
2.2 Research questions and alignment with studies undertaken 71
4.1 Proportion of T1 respondents in each age category 105
4.2 Scale reliability at T1, T2, and T3 113
4.3 Mean scores and standard deviations for motives for attending
training and motives for riding 115
4.4 Number of self-reported on-road crashes within the three years
prior to training (N=438) 116
4.5 Number and percentage of cases with one or more self-reported
traffic offences within the three years prior to training (N=438) 117
4.6 Mean item scores and standard deviations for psychosocial
influences on risky riding scales at T1 117
4.7 Bivariate correlations between items 119
4.8 Mean item scores and standard deviations for risk scales at T1 (for
end of training respondents and non-respondents) and at T2 120
4.9 Self-rated skill and self-rated safe riding at T1 and T2 by gender 123
4.10 Percentage of respondents in each stage of change at T1 and T2 124
5.1 Proportion of T1 respondents in each age category for intervention
and comparison cohorts
142
5.2 Scale reliability at T1, T2, and T3 for the pilot intervention cohort 146
5.3
Mean scores and standard deviations for motives for attending
training and motives for riding for the treatment and comparison
cohorts
149
5.4 Start of training percentage of comparison and treatment cohort
participants in each stage of change
150
5.5 Number of self-reported on-road crashes within the three years
prior to training (N=518)
150
xvi
5.6
Number and percentage of participants with one or more self-
reported traffic offences within the three years prior to training
(N=518)
151
5.7 Mean item scores and standard deviations for psychosocial
influences on risky riding scales at T1
152
5.8 Bivariate correlations between items at T1 154
5.9 Mean item scores and standard deviations for risk scales at T1 (for
end of training respondents and non-respondents) and at T2
1
155
5.10 Self-rated skill and self-rated safe riding at T1 and T2 by gender 1
157
5.11 Proportion of T3 respondents in each age category 160
5.12 Treatment group scale mean scores and standard deviations across
all time periods
163
5.13 Bivariate correlations between age, risk scales, T2 intentions, and
riding behaviour at T3
164
5.14 Comparison of difference scores (T2 minus T1) for treatment and
comparison cohorts
167
5.15 Comparison of behavioural scores at follow-up for treatment and
comparison cohorts
170
5.16 Comparisons of scores for key training messages at follow-up for
treatment and comparison cohorts
171
5.17 Treatment and comparison cohort program delivery and learning
objectives
200
5.18 Participant ratings of learning outcomes at T2 201
A1 Proportion of T3 respondents in each age category 275
A2 Percentage of T3 respondents in each stage of change at each time 277
A3 Mean item scores and standard deviations for risk scales and
behavioural scales at each time
279
A4 T3 bivariate correlations between age, risk scales, riding
behaviour and T2 intentions for risky riding
281

xvii
List of Abbreviations
ABS Australian Bureau of Statistics
ACEM Association des Constructeurs Européens de Motocycles
(Association of European motorcycle manufacturers)
ARC Australian Research Council
CARRS-Q Centre for Accident Research and Road Safety - Queensland
CBTA Competency based training and assessment
CIECA International Commission for Driver Testing
GADGET/GDE Goals for Driver Education matrix
MAIDS Motorcycle Accidents In Depth Study
MSF Motorcycle Safety Foundation

xviii

XIX
Statement of Original Authorship
The work contained in this thesis has not been previously submitted to meet
requirements for an award at this or any other higher education institution. To the
best of my knowledge and belief, the thesis contains no material previously
published or w1itten by another person except where due reference is made.
Signature:
Date: 10111 December 2012
QUT Verified Signature

xx

xxi
Acknowledgments
There are many people I would like to thank for their support and friendship during
this journey. Without them, this thesis would not have been possible.
For their financial and instrumental support of the project I would like to thank
Morgan and Wacker Motorcycle Rider Training Centre and staff, Queensland
Transport and Main Roads, and the Australian Research Council. Particular thanks
go to Fred Davies from Morgan and Wacker Motorcycle Rider Training Centre for
his commitment, drive, enthusiasm, and friendship. For their guidance and patience, I
would like to thank my supervisors Barry Watson and Narelle Haworth. To project
co-investigators Cynthia Schonfeld and Darren Wishart, I am indebted for your
assistance and support.
Special thanks also go to Nerida Leal, Kev O’Connor, Angela Watson, Dale
Steinhardt, Kristi Greig, and Veronica Baldwin for their assistance during the
research process and their friendship. To all my other close friends, thanks for
keeping me going. Finally, I would like to thank my family for their love, support,
and understanding.


1
Chapter 1: Introduction
1.1 Introductory Comments
The need to address on-road motorcycle safety is becoming increasingly
paramount due to the disproportionately high percentage of riders and pillions killed
and injured in recent years. Motorcyclists have been found to be 30 times more likely
to be killed per kilometre travelled than car occupants and 40 times more likely to be
seriously injured (Johnston, Brooks & Savage, 2008). One approach to preventing
motorcycle-related injury is through training and education. Unfortunately, whilst
training is commonly perceived by the public as a panacea to many road safety
problems, past research suggests little or no benefit from formal rider training and
education programs in terms of crash reduction (Haworth & Mulvihill, 2005;
Mayhew, Simpson, & Robinson, 2002; Simpson & Mayhew, 1990).
There are a range of potential shortcomings that may account for the apparent
lack of efficacy of motorcycle rider training programs. These include issues such as
program content, delivery methods, the influence of the licensing system (where
applicable), the overconfidence of riders following training, and evaluation
deficiencies such as self-selection bias, lack of statistical power, and exposure
differences (e.g. distance travelled). It has been argued that new approaches to rider
training and education need to be developed in an endeavour to overcome some of
these deficiencies and improve the overall efficacy of rider training as a road safety
countermeasure (Elliott et al., 2003; Savolainen & Mannering, 2007; Watson, 2003).
Whilst there is a focus on developing riding skills during training for
motorcyclists, there is also a need for training to foster safe riding attitudes and
address motivational factors that influence risk taking. However, a review by
Haworth, Smith, and Kowadlo (2000) found that the vast majority of rider training
focused on vehicle-handling skills, with little attention to psychosocial factors that
may also influence rider safety. The strong emphasis on rider skills during training
may fail to develop attitudes towards riding that are consistent with road safety and
injury prevention. Accordingly, this thesis documents a program of research that
examines a traditional licence training program for on-road motorcyclists, and
formatively evaluates the addition of a new rider education module specifically
designed to address the psychosocial influences on risky riding. Formative evaluation
2
of the implementation of the pilot program with an industry partner organisation
aims to identify strengths and weaknesses of the program and its delivery, to inform
continuous improvement both in a conceptual and practical manner.
1.2 Defining Rider Training and Education
Initially, it must be highlighted that while rider training may be subsumed
within the broader concept of rider education, these terms are often used
interchangeably within the road safety literature (Christie, 2001). While training
usually refers to skills-based programs, rider education commonly includes
knowledge/awareness based programs implemented at the individual level or via
mass media campaigns; programs that target introspective self-awareness such as
insight training; behaviour modification programs for traffic offenders; and
computer-based educational programs. The ambiguity of terms extends to the
development of hazard perception skills (PC-based, simulator-based, or on-road)
which, while in its infancy, is predominantly referred to in the literature as training
regardless of the mode of delivery.
The vast majority of rider training is conducted within Government regulated
licensing systems for motorcyclists (e.g. to obtain a learner, restricted/provisional, or
unrestricted/open licence). In some jurisdictions within Australia and abroad,
motorcycle rider training is mandatory for licensing purposes, while other
jurisdictions offer voluntary training within licensing systems. Post-licence training
is also commonly conducted throughout most developed countries with the aim of
developing advanced vehicle handling skills. Both the standard motorcycle rider
training course and the Three Steps to Safer Riding pilot education package that this
thesis will focus on are implemented within the “Q-Ride” voluntary rider training
and licensing system (see Appendix 3.1 for details) for obtaining a provisional or full
motorcycle licence in the state of Queensland, Australia.
1.3 Rationale for the Research: Why Persist with Rider Training?
The continued widespread use of motorcycle rider training by governments as
a road safety countermeasure appears to be mainly based on the perception within the
community that novices have not yet developed sufficient vehicle-control skills to
safely function within the traffic environment, and that by enhancing these skills
there would be less likelihood of crashing (Gregersen, 1996; Watson et al., 1996).
3
Results from crash studies partially support this notion, showing that vehicle
handling errors contribute to many novice rider crashes (ACEM, 2004; Hurt, Oullet
& Thom, 1981; Elliott, Baughan, & Sexton, 2007). As motorcyclists are far more
vulnerable to injury than car drivers in the event of a crash, the potential
consequences of riding error can be considerable. However, riding techniques such
as countersteering and emergency braking that are commonly learnt during rider
training may be lost unless practised regularly. As emergency situations are not
encountered very often, riders may unfortunately not possess the requisite skills at
the time of need, even if they have learnt these during training. The validity and
reliability of many motorcycle licence assessment practices is unfortunately
questionable in terms of predicting actual crash involvement (Christie, Harrison &
Johnson, 2006; Haworth & Mulvihill, 2005). This may, in part, account for the lack
of effectiveness of rider training found in previous studies as the licence assessment
criteria guides what is included in licence training content.
Previous reviews have highlighted that risk-taking is also a contributing
factor in many motorcycle crashes (Haworth & Mulvihill, 2005; Jonah, Dawson &
Bragg, 1982; Watson et al, 1996). Hence, though the basic vehicle-handling skills
and knowledge of road rules that are taught in most motorcycle licence training
programs may be seen as an essential part of road riding, they are unfortunately not
sufficient in terms of crash reduction. With this in mind there is considerable scope
for the improvement of program content for rider training and education. An
international workshop for motorcycle safety (OECD, 2008, p4) came to the
following conclusions regarding motorcycle rider training:
“Countries have different training needs, based on their vehicle fleet and
riding environment. Motorcycle training should therefore build on existing
standards, focus on risk awareness and risk avoidance, and develop an
understanding of the rider/motorcycle capacities and limitations.”
A study conducted as a precursor to the candidate’s research provided some
evidence of how riders define risky riding in their own terms and, furthermore, what
psychosocial factors influence these behaviours. Watson, Tunnicliff, White,
Schonfeld, & Wishart (2007) established that personality and motivational influences
on riding such as sensation seeking, peer influence, and aggression are key issues
that underpin risky riding behaviours such as pushing limits, bending road rules,
4
extreme speeds and stunts, and impaired riding. The researchers examined these
issues within the theoretical framework of the Theory of Planned Behaviour (TPB,
Ajzen, 1991). Throughout this dissertation psychosocial influences on risky riding
will primarily refer to issues of a psychological or social nature (e.g. as examined in
the Watson et al., 2007 study and examined in the literature later in Section 2.4.6)
that may influence motorcyclists to take risks. These include attitudes/beliefs, social
norms (e.g. peer influence), personality (e.g. thrill seeking and aggressive
personality), behavioural intentions, overconfidence, and riding motives.
Rider training and education in Australia and similar developed countries
may benefit from attention to psychosocial influences on risky riding using
techniques that are aimed at providing personal meaning and insight to participants
regarding their own individual risk behaviours. Development of new innovative rider
training and education programs based on the abovementioned factors may increase
the overall effectiveness of motorcycle rider training as a road safety
countermeasure.
1.4 Broad Research Aims, Scope, and Context
The overall program of research was undertaken in the context of a real
world, industry-based program with a partner organisation delivering motorcycle
training as its core business. A new classroom-based module to address risky riding,
the Three Steps to Safer Riding program, was developed by a project team including
academic researchers and rider trainers. The program was designed to be applied as
an adjunct to the existing skills-based training and was therefore piloted and
evaluated in comparison to the effects of the existing program already being
delivered by the industry partner organisation. The project team decided to trial the
Three Steps to Safer Riding program in a real world applied setting to maximise its
ecological validity. This included classroom delivery by actual motorcycle riding
instructors rather than trialling the program in an experimental setting delivered by
researchers. Adoption of this approach allowed for meaningful comparisons to be
made with the ‘standard’ existing training program because the Three Steps to Safer
Riding module was an addition to the existing program. Hence, any difference in
effects could be more robustly attributed to the new module. Although applied in a
quasi-experimental setting, experimental control was strengthened by inclusion of
the partner organisations Chief Instructor on the project team as he could advise on
5
logistical issues and practical implementation issues that could possibly affect the
validity of outcomes.
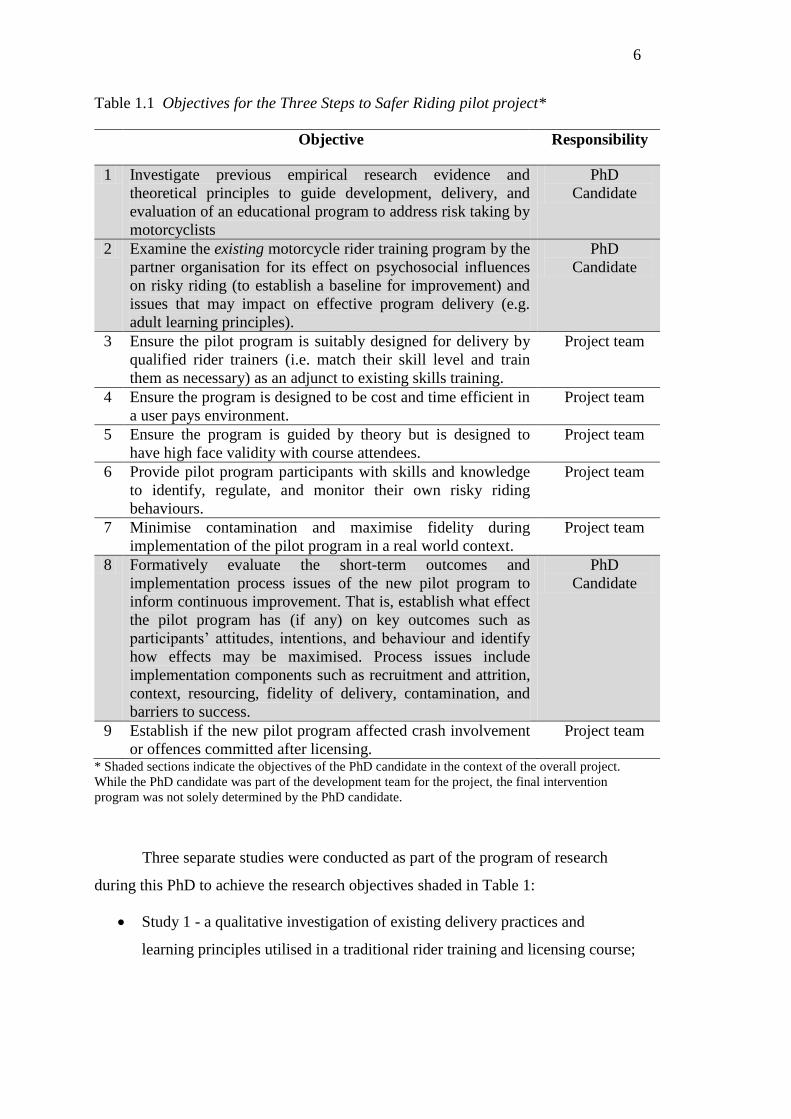
As the PhD candidate was part of a broader project team, it is important to
frame the candidate’s role within the overall project. The objectives of the broader
Australian Research Council (ARC) project are shown in Table 1.1, with the specific
aims of the candidate’s research relating to Objectives 1, 2, and 8 as shaded in the
table. Objective 1 relates to examination of the existing literature while Objectives 2
and 8 relate to the empirical studies undertaken.
Demarcation of the scope of the PhD within the context of the broader
research project is important as this thesis does not aim to justify the specific content
of the final Three Steps to Safer Riding pilot. The reasons for this are twofold: 1) the
final program is not the intellectual property of the candidate (as the project team
decided the final content), and 2) information provided by the candidate for desirable
program components based on a review of the literature was not always incorporated
into the program. The Three Steps to Safer Riding lesson plan is attached in
Appendix 1.1 to provide an overview of the final program for the reader but does not
form part of this thesis. This is provided in commercial confidence only.
This thesis ultimately aims to examine if the Three Steps to Safer Riding pilot
program could be improved to achieve what it was designed to do (i.e. to affect
change in psychosocial factors that underpin risky riding for participants). This
formative approach incorporates implementation issues and barriers to the intended
application of the program that potentially compromise program effect. Baranowski
and Stables (2000) noted that for any educational intervention to achieve its goals it
must have strong implementation fidelity; that is, be implemented and delivered in
the intended manner. Hence, a key focus of the research undertaken by the candidate
was to validate if the broader project team objectives were met effectively.
6
Table 1.1 Objectives for the Three Steps to Safer Riding pilot project*
Objective Responsibility
1 Investigate previous empirical research evidence and
theoretical principles to guide development, delivery, and
evaluation of an educational program to address risk taking by
motorcyclists
PhD
Candidate
2 Examine the existing motorcycle rider training program by the
partner organisation for its effect on psychosocial influences
on risky riding (to establish a baseline for improvement) and
issues that may impact on effective program delivery (e.g.
adult learning principles).
PhD
Candidate
3 Ensure the pilot program is suitably designed for delivery by
qualified rider trainers (i.e. match their skill level and train
them as necessary) as an adjunct to existing skills training.
Project team
4 Ensure the program is designed to be cost and time efficient in
a user pays environment.
Project team
5 Ensure the program is guided by theory but is designed to
have high face validity with course attendees.
Project team
6 Provide pilot program participants with skills and knowledge
to identify, regulate, and monitor their own risky riding
behaviours.
Project team
7 Minimise contamination and maximise fidelity during
implementation of the pilot program in a real world context.
Project team
8 Formatively evaluate the short-term outcomes and
implementation process issues of the new pilot program to
inform continuous improvement. That is, establish what effect
the pilot program has (if any) on key outcomes such as
participants’ attitudes, intentions, and behaviour and identify
how effects may be maximised. Process issues include
implementation components such as recruitment and attrition,
context, resourcing, fidelity of delivery, contamination, and
barriers to success.
PhD
Candidate
9 Establish if the new pilot program affected crash involvement
or offences committed after licensing.
Project team
* Shaded sections indicate the objectives of the PhD candidate in the context of the overall project.
While the PhD candidate was part of the development team for the project, the final intervention
program was not solely determined by the PhD candidate.
Three separate studies were conducted as part of the program of research
during this PhD to achieve the research objectives shaded in Table 1:
Study 1 - a qualitative investigation of existing delivery practices and
learning principles utilised in a traditional rider training and licensing course;
7
Study 2 - an investigation of the effect of a traditional rider training and
licensing course on attitudinal and motivational influences on risky riding;
and
Study 3 - a formative evaluation of the effects of a new rider education pilot
program to address attitudinal and motivational influences on risky riding.
A long-term outcome evaluation of police reported crashes and offences for
participants is planned as part of the broader ARC project to meet Objective 9. Due
to time constraints this was beyond the scope of the PhD. However, the evaluation
strategy developed as part of the PhD was required to lay foundation for this long-
term evaluation.
1.5 Theoretical Perspectives to Guide Program Design and Evaluation
One aim of the overall program of research is that the Three Steps to Safer
Riding should be based on sound theoretical principles. However, it must be stated
that the application of an attitudinal and motivational intervention for motorcyclists
is not an exercise in theory testing; rather the utilisation of accepted theories that
offer sound principles to guide program content, delivery, and evaluation. The
current research was principally governed by two theoretical standpoints. Firstly, the
Theory of Planned Behaviour (TPB) (Ajzen, 1985; 1991) was utilised for guiding
program content and evaluating change following completion of the Three Steps to
Safer Riding program. Secondly, to guide delivery of the program an eclectic
combination of principles from the Transtheoretical Model (Prochaska &
DiClemente, 1983) were utilised. A brief discussion of each of these theories is
provided here to establish the rationale for their utilisation in the overall program of
current research.
The TPB is a behavioural change model that has been successfully applied in
traffic psychology to many different road user behaviours. For example, the
Manchester Driver Behaviour Research Group in Britain have utilised the theory to
examine speeding, drink driving, tailgating, overtaking, cutting across lanes in
traffic, flashing headlights in traffic, and running red lights (Stradling and Parker,
1997). For motorcycling, Watson et al. (2007) used the TPB to examine risk taking
behaviour. They found that the basic model accounted for a substantial amount of
variance in six risky riding behavioural scales, however the addition of several
8
further variables to the model such as Specific Subjective Norm (influence of riding
peers), sensation seeking, and riding aggression were found to enhance the models
predictive value. The Watson et al. study was conducted as a precursor to this current
program of research and, as such, the TPB was deemed most useful for the
implementation of the intervention to address risky riding.
The Transtheoretical Model of behaviour change, otherwise known as the
“Stages of Change” model, offers a blend of principles and behaviour change
techniques espoused by other prominent theorists (e.g. Skinner, Bandura, Freud). A
central tenet of the model is that behaviour change is not an “all or nothing”
phenomenon and that people progress through various stages during the course of
behaviour change (Prochaska, Johnson, & Lee, 1998). This rationale is congruent
with the general aims of education and training: that is, to progressively internalise
newly learnt information. The model has been applied extensively in the context of
cessation of common dysfunctional behaviours (e.g. cigarette smoking and substance
abuse) and the adoption of desired behaviours (e.g. healthy diet and physical
exercise). Additionally, it has been found to provide a useful framework for
addressing transport related behaviours such as drink driving recidivism (Freeman et
al, 2005) and the wearing of seatbelts (Nigg et al., 1999). The utility of the
Transtheoretical Model to guide delivery of the Three Steps to Safer Riding program
mainly rests with the models processes of change rather than the stages of change
per se. For rider risk taking, processes such as consciousness raising and self re-
evaluation have particular value in raising issues of risk for individual riders and
encouraging the self-assessment of such behaviours.
A more complete discussion and elaboration of the theoretical perspectives
influencing this program of research is included in the following chapter of this
document. Additionally, a discussion of established adult learning principles that also
informed delivery of the Three Steps to Safer Riding program is included in the next
chapter.
1.6 Thesis outline
This section serves to provide a brief overview of the structure of the
following chapters in this document. Chapter 2 provides a literature review of the
key issues relevant to the safety of motorcyclists, with particular emphasis on rider
9
training. This focuses on past empirical evaluations of rider training as well areas of
potential improvement such as training content, delivery protocols, and how the
licensing system may influence training objectives and outcomes. The primary
purpose of the review was to inform the development and implementation of an
attitudinal intervention/rider education package. Additionally, the overarching
research questions for the program of research are outlined in Chapter 2. A
conference abstract and presentation entitled Theoretical Perspectives on Motorcycle
Rider Training was produced based on an earlier version of Chapter 2. This was
presented at the 4th
International Conference of Transport and Traffic Psychology in
Washington, D.C., 2008.
Chapter 3 documents Study 1, a qualitative study undertaken to investigate
delivery protocols and learning outcomes in accordance with established adult
learning principles such as learning styles, learning motives, and how past
experiences affect learning within the rider training context. An earlier version of
some of the research reported in Chapter 3 was presented in a peer reviewed
conference paper entitled What Can Riders Tell Us About Motorcycle Rider
Training: A View From The Other Side Of The Fence, in proceedings of the
Australasian Road Safety Research, Policing, and Education Conference, Melbourne,
2007.
Chapter 4 documents the two stages of Study 2, a comprehensive quantitative
study examining: 1) self-reported rider attitudes, motives for risk taking, and future
riding intentions within the existing standard rider training course of the project
industry partner organisation and; 2) self-reported riding behaviour following
licensing. The research design and specific research questions for this study are
articulated in Chapter 4. An earlier version of some of the research reported in
Chapter 4 was presented in a peer reviewed conference paper entitled Motorcycle
Rider Training and Perceptions of Skill, in proceedings of the Australasian Road
Safety Research, Policing, and Education Conference, Adelaide, 2008. A further
conference abstract and presentation at the 27th
International Congress of Applied
Psychology, Melbourne, 2010, also resulted from the research undertaken in the
chapter. It was titled Measuring the Effect of Motorcycle Rider Training On
Psychosocial Influences for Risk Taking.

10
Chapter 5 documents Study 3, a formative evaluation of a brief intervention
to address risk taking by motorcyclists; the Three Steps to Safer Riding pilot
program. The chapter reports on two distinct stages of Study 3. Firstly, changes in
self-reported attitudes and motives for risk taking and future riding intentions
gathered from quantitative questionnaires are examined and discussed. Secondly,
qualitative interviews with riding instructors involved in the delivery of the
intervention and, additionally, focus groups with intervention participants are
presented and discussed. An earlier version of some of the research reported in
Chapter 5 was presented in a peer reviewed conference paper entitled Changing
Motorcycle Rider Safety Attitudes and Motives for Risk Taking: Process Evaluation
of a Rider Training Intervention at the Australasian Road Safety Research, Policing,
and Education Conference: Sydney, 2009.
An overall discussion of the implications of the program of research
undertaken for this PhD and future direction for research in this field is provided in
Chapter 6. The chapter then provides concluding remarks.
1.7 Chapter Summary
This chapter has provided a brief overview of the road safety problem
associated with motorcycle crashes, discussed the potential deficiencies of traditional
motorcycle rider training, and established a rationale for the need to trial improved
rider training programs to address risk taking. Additionally, this chapter has outlined
the broad objectives of the program of research undertaken. This includes
investigation of the past research regarding motorcycle rider training, how theory
may assist in the development and delivery of the intervention, as well as formative
evaluation of the intervention pilot.
Overall, this program of research aims to examine existing rider training and
investigate the potential value of a new innovative rider education program and how
the potential of the new program may be maximised through future refinement.
While the new program is piloted as a brief intervention, its potential utility in the
motorcycle licensing context will be examined. The following chapters will provide
a comprehensive review of issues pertaining to motorcycle safety, motorcycle rider
training, and document the three studies undertaken as part of this research.
11
Chapter 2: Literature Review
2.1 Introductory Comments
The chapter reviews the relevant literature pertaining to the injury of
motorcyclists and the role that rider training and education can potentially play in
reducing such injury. This aims to identify factors for the successful development,
delivery, and formative evaluation of a brief rider education intervention as outlined
in Objective 1 in the previous chapter. Hence, this chapter is integral to the initial
planning of the Three Steps to Safer Riding program and the development by the
project team of the final program.
Among issues investigated in this chapter is the prevalence of motorcycle
crashes, crash types, contributing factors, and risk taking issues for motorcyclists.
Examination of such issues provides important background for the identification of
factors that would be beneficial for rider training and education to address.
In addition, this chapter also endeavours to outline other factors that may
inhibit or facilitate rider training efficacy as a road safety countermeasure. Issues
such as effective adult learning principles, the influence of the licensing system on
training outcomes, and common evaluation deficiencies are examined. Whilst the
majority of the chapter focuses on the evidence provided from empirical studies
regarding risks for motorcyclists and rider training efficacy, the importance of theory
in guiding interventions is also discussed with a view to establishing a framework for
rider education implementation and evaluation. The literature review undertaken here
is to ultimately inform the planning and development of the Three Steps to Safer
Riding pilot program.
2.2 The Prevalence of Motorcycle Crashes and Risk of Injury
Motorcycling has historically been acknowledged as a high risk activity. A
document released by the Australian Department of Infrastructure, Transport,
Regional Development and Local Government (Johnston et al., 2008) highlighted the
magnitude of crash risk for motorcyclists compared to other road users. It found that
motorcyclists in Australia were 30 times more likely than other vehicle controllers to
be killed per kilometre travelled and over 40 times more likely to be seriously
injured. Nationally there were 2224 motorcyclists killed in the 10 year period 2001-
12
2010, with a slight downward trend since 2008 (BITRE, 2011). In 2010, 224
motorcyclists were killed in Australia and while motorcyclists accounted for 4.6% of
registered vehicles and 1.1% of vehicle kilometres travelled, they comprised 15% of
all road fatalities (IRTAD, 2011).
In Queensland there has been considerable concern regarding the increase in
motorcycle crash counts during the past decade (Queensland Parliamentary
Travelsafe Committee, 2007; Queensland Government, 2009). There was a 56%
increase in fatalities among motorcyclists in Queensland during 2005 compared to
the previous five year average (Queensland Transport, 2006). The increasing trend in
fatalities for motorcyclists continued until the fatality count peaked at 73 in 2007, a
250% increase since 2001. In 2008, motorcyclists accounted for 22% of all road
fatalities in Queensland although only accounted for 4% of registered vehicles (QLD
TMR, 2009). Since 2007 there has been a steady decrease in the road toll for
motorcyclists, with a total of 50 fatalities in 2010 (QLD TMR, 2011).
Concern over the increasing number of motorcycle crashes and casualties
during the past decade is not unique to Australia. For example, in Michigan (U.S.)
there was a 30% increase in motorcycle fatalities between 2001 and 2005, whilst
fatalities for all other road users decreased by 15% (Kostyniuk & Nation, 2006). For
the whole of the United States there was an 89% increase in motorcycle related
fatalities between 1997 and 2004 (Shankar & Varghese, 2006).
2.3 The Characteristics of Road Crashes Involving Motorcycles
It is commonly asserted by riders that the majority of motorcycle crashes are
the fault of other road users (Tunnicliff, 2005). However, reviews of crash statistics
are mixed in this regard. An inquiry into motorcycle safety by the Parliament of
Victoria (1993) found that 65% of all motorcycle casualty crashes were multi-
vehicle. Of these, fault was assigned to the drivers of other vehicles in 75% of cases
(predominantly failing to give way to motorcyclist), presenting a strong argument
that other road users need to be made more aware of motorcyclists in the traffic
environment. However, when single-vehicle crashes were factored in, approximately
half of all casualty crashes were the fault of the rider. The MAIDS in-depth crash
study across Europe found that rider error was the main contributing factor in 37% of
all motorcycle crashes (ACEM, 2004). Unfortunately there were no figures stated in

13
the MAIDS study for instances where riders may have been considered at least partly
at fault. In contrast, in Queensland 82% of all fatal crashes involving motorcycles
(single-vehicle and multi-vehicle inclusive) have been found to be contributed to by
the rider (QLD TMR, 2011). When motorcycle crashes of all severity in Queensland
were examined by Haworth, Greig and Nielson (2009), the rider was found to be at
fault in 57% of crashes, suggesting that rider risk taking and error may be more
predominant in more severe crashes. This notion is supported by statistics that show
motorcyclists were at fault in 67% of hospitalisation crashes in Queensland between
July 2004 and June 2009 (QLD TMR, 2011).
Unfortunately there is no consistent method for categorising major
characteristics of motorcycle crashes across jurisdictions within developed countries
or within the research community. Preusser, Williams, and Ulmer (1995) proposed a
typology for motorcycle crashes after examining data from 2074 fatal crashes in the
United States. They found that five main categories accounted for 86% of crashes:
ran off road; ran traffic control; oncoming or head-on; left turn oncoming; and
motorcyclist down. Within their sample “ran off road” accounted for 83% of single-
vehicle crashes while for multi-vehicle crashes “ran traffic control” was the major
category, accounting for 35%. Consistent with this, the United States National
Highway Traffic Safety Administration (NHTSA, 2002) reported that half of all
single-vehicle motorcycling fatalities from 1990 to 1999 occurred whilst the rider
was negotiating a curve. For single-vehicle motorcycle crashes the Parliament of
Victoria (1993) reported the major characteristic as “out of control on straight”,
accounting for 33% of crashes followed by “off carriageway on curve” accounting
for 20% (half of these hit an object). For multi-vehicle crashes involving a
motorcycle, 26% were classified as “intersection adjacent approach” with a further
17% classified as “opposing vehicles turning”. Johnson et al. (2008) reported similar
crash patterns for single-vehicle and multi-vehicle crashes involving motorcycles in
Australia.
Collectively the above information suggests that many single-vehicle
motorcycle crashes are primarily due to rider errors in judgement or deliberate
excessive speed, resulting in running off the road or loss of control. Alternately,
many multi-vehicle crashes may involve deliberate breaches of road rules by other
road users, difficulties perceiving motorcyclists, or poor emergency responding by
14
motorcyclists, resulting in collisions. This general pattern of motorcycle crashes is
also consistent with the findings of Hurt et al. (1981).
2.4 Risk Taking and Motorcycling Injury
Males constituted 94% of all motorcycle fatalities in Australia for the years
2001 to 2010 (BITRE, 2011) and consistently show motorcycle-related injury counts
more than 12 times that of females (ATSB, 2004). Young male riders (aged 17-25)
have been consistently shown to be the highest risk group for motorcycle crashes per
kilometre travelled (Haworth, Mulvihill and Rowden, 2006). The higher propensity
for risk taking amongst young male riders has been shown to be a key factor for
crash involvement (Rutter & Quine, 1996). However, concern has also been raised in
regard to the increasing number of mature-aged riders (aged 40yrs +) involved in
crashes in recent years in Australia and abroad (ATSB, 2002; Baughan, Sexton, &
Elliot, 2004; Broadley & Hawkins, 2011; Haworth, Mulvihill, & Rowden, 2006;
Marottoli, 2002). Unlike younger riders, the increasing crash prevalence for older
riders is a product of the escalation in the number of riders in this age group rather
than crash risk based on distance travelled (Broadley & Hawkins, 2011).
When considering broad risk taking issues for all motorcyclists there are
several factors that consistently appear in injury statistics in Australia. Stella, Cooke,
and Spivulis (2002) investigated 39 motorcycle fatalities in Western Australia and
found that the majority could be attributed to unsafe rider behaviours. These included
alcohol consumption (31%), drugs (28%), speeding (31%), and lack of safety
equipment (13%). Similarly, for riders involved in fatal crashes in the state of New
South Wales for the period 1998 to 2002 the main contributing factors were: speed
(54%), alcohol (20%), fatigue (7%), and the non-wearing of helmets (9%) (RTA,
2004). Johnston et al. (2008) found the main contributing factors to fatal motorcycle
crashes in Australia for the period 1999-2003 were excessive speed (70%), alcohol
and/or drugs (46%), learner rider (8%), hit animal (5%), skylarking/racing (2%), and
road infrastructure (2%). Queensland Transport and Main Roads (2011) note that for
all motorcycling fatalities during 2006-2010, 39% of riders were speeding, 30% were
alcohol or drug affected, 12% were performing illegal manoeuvres, and 7% were not
wearing a helmet. It is important to note that, unlike some jurisdictions abroad, all
Australian jurisdictions require motorcyclists to wear an approved helmet by law.

15
Therefore any death or injury related to not wearing a helmet can be regarded as
deliberate risk taking. Whilst some disparity exists between the above studies, a
consistent pattern of risk taking by motorcycle riders is apparent.
Haworth, Smith, Brumen, and Pronk (1997) conducted a case-control study
examining motorcycle casualties and fatalities in Melbourne and reported that the
most significant contributing factors for riders who crashed compared to those who
did not (i.e. controls) were: being aged under 25 years; never being married;
unlicensed; off-road riding experience before being licensed; having limited
experience on-road; having rode less than three days a week; having attended a
beginner rider course as opposed to an advanced course; having consumed alcohol;
and not wearing a helmet.
Overall, the abovementioned findings show several consistent factors that
reflect deliberate risk taking by motorcyclists. However, motorcyclists also expose
themselves to the risk of more serious injury through the failure to perform certain
behaviours (e.g. not wearing helmets and protective clothing). There can also be
some debate as to whether a lack of awareness of the risk associated with these
behaviours constitutes risk taking or not as this is not deliberate. The following
sections provide further detail and discussion of key behaviours that in Australia and
many developed countries general awareness exists among motorcyclists that some
degree of risk is related to such behaviours and is often ignored (Tunnicliff, 2005).
Therefore, these may be beneficial for attitudinal and motivational interventions to
address.
2.4.1 Speeding
Speeding for motorcyclists is perhaps a product of the performance
characteristics of the vehicle and the nature of many people that are attracted to
motorcycling (i.e. personality and motivation). Watson et al. (2007) found that many
riders “bend” the road rules to suit their journey purpose. They found that riding
above the posted speed limit was not considered to be breaking the law; rather
bending it as speeding was often considered necessary by motorcyclists to keep
ahead of traffic. Hence, a culture of speeding is often accepted by motorcyclists and
deemed somewhat justified by riders to maintain their safety. Unfortunately the
injury statistics do not support this notion, as excessive speed is the predominant
contributing factor in motorcycle fatalities in Australia (Johnston et al., 2008) and,
16
furthermore, speed has been found to be twice as likely to contribute to fatal crashes
for motorcyclists than other road users (RTA, 2004).
Noordzij et al. (2001) highlighted that most motorcycle casualties actually
occur in lower speed zones (e.g. <60kmh). This was affirmed in the MAIDS study of
921 motorcycle casualty crashes, with 70% occurring at less then 50kmh. However,
the actual vehicle speeds when they crashed within these speed zones are unknown.
Increasing speed results in more severe injuries (Kraus, Peek-Asa, & Cryer, 2002).
Hence, speed is implicated in a far higher proportion of fatal crashes than minor
injury crashes. This is more pronounced for motorcyclists than for car drivers due to
the lack of protection offered by the vehicle.
Elliot et al. (2003) surveyed 8666 British motorcyclists regarding a range of
specific riding behaviours and their crash involvement over the previous 12 months.
When factoring in all variables they found that riding errors were the main predictor
of at-fault crash involvement, however speeding was also shown to be a significant
predictor. Hence, even when relying on self-report which has potential for riders to
cast themselves in a more socially desirable light, speeding is a major factor for
motorcyclists’ safety. However, as Elliott et al. (2003) also noted, errors other than
volitional risk taking do contribute to many motorcycle crashes. For example, errors
in judgement performing, or attempting to perform, a particular manoeuvre in traffic
can have serious consequences. There is a potential problem though, particularly for
novice motorcyclists, in determining when a crash may have occurred due to both
errors (e.g. inexperience) and risk taking (e.g. speed), both of which may be the focus
of future rider training interventions. This issue requires more specific examination
through in-depth crash studies.
Ormston, Dudleston, Pearson and Stradling (2003) evaluated the Bikesafe
assisted ride program in Scotland and expressed concern that whilst the proportion of
riders indicating they would ride below the speed limit in built up areas increased
following the program, there was also an increase in the proportion of riders that
indicated they would ride at higher speeds on the open road. Therefore, it appears
that riders became more vigilant about riding in traffic, however as they perceived
their skills to increase as a result of the course they also increased their open road
speed, leaving them more susceptible to single vehicle loss-of-control type crashes.
The increase in risky behaviours such as speeding as a result of training is a major
17
concern that has been previously discussed at length (see Hendersen, 1991). This
represents a type of risk compensation where, as performance (what a rider is
capable of) increases, risk behaviour (what a rider chooses to do) may also
unfortunately increase. A related discussion on overconfidence can be found in
Section 2.4.6.2 of this document.
Despite the overwhelming abundance of evidence that speeding is a risk
factor for motorcyclists, riders commonly ignore statistical information and rely on
their own prior personal experiences as a measure of risk (Bellaby & Lawrenson,
2001). Hence, the behaviour is reinforced each time it is successfully performed
without penalty, and the dysfunctional belief strengthened. Effective speed
enforcement is then paramount to reduce the road trauma to motorcyclists. The
difficulty for educational interventions is challenging riders’ dysfunctional beliefs
about speeding when riders are likely to reject expert opinion.
2.4.2 Alcohol and Drug Impairment
Alcohol and/or drug impairment are potentially more risky for motorcyclists
than for car drivers due to the balance and awareness required to ride in the traffic
environment. In 2007, alcohol and drugs contributed to 23% of fatal motorcycle
crashes (QLD TMR, 2009). Similarly, in New South Wales between 1998 and 2002,
alcohol at illegal blood alcohol concentrations (BACs) was implicated in 20% of
rider and pillion fatalities compared to 11% for other motor vehicle controllers
(RTA, 2004). Johnston et al. (2008) reported that alcohol and drugs were involved in
46% of all motorcycle rider and pillion fatalities in Australia for the period 1999-
2003. While reporting criteria often differ across publications in terms of any alcohol
involvement in crashes versus those including illegal BACs only, it is apparent that
alcohol is a major contributor to rider and pillion casualties. Haworth et al. (1997)
reported on a case-control study of motorcycle crashes, finding that a positive BAC
for crashed riders was associated with: greater riding experience; unlicensed riding;
riding a borrowed motorcycle; carrying a pillion passenger; illicit drug use; excessive
speed; and single-vehicle crashes.
In the United States there is considerable concern in regard to alcohol-related
motorcycle crashes, particularly for riders aged between 30 and 49 who were riding
large capacity machines (Poulozzi & Patel, 2004; Shankar & Varghese, 2006). In
2007, 23% of motorcycle-related fatalities in the United States involved alcohol at
18
illegal BACs (<.08) (Insurance Institute for Highway Safety, 2008). This figure
escalated to 41% for single-vehicle crashes. Furthermore, deleterious effects of
alcohol at legal BACs have been found for obstacle avoidance for motorcyclists
(NHTSA, 2008).
Akin to speeding, alcohol is involved in a higher percentage of fatal crashes
than lower severity casualty crashes. For example, Hurt et al. (1981) reported 11.5%
alcohol involvement amongst a sample of 900 motorcycling casualties, and 40.9%
amongst fatalities. Alcohol is also often associated with other risky behaviours which
may in part explain increased severity. Peek-Asa and Kraus (1996) examined 3000
fatality and casualty cases for motorcyclists and noted that 42% tested positive for
alcohol. Importantly, they also noted that riders who tested positive for alcohol were
more likely to also be speeding and not wearing a helmet than riders testing negative.
In New South Wales from 1998-2002 42% of unlicensed rider fatalities exceeded the
legal BAC compared to 17% of legally licensed riders (RTA, 2004). The relationship
between alcohol and other forms of risk taking is not necessarily causal as it may
merely be indicative of the type of person who is prepared to take risks in general;
however the clustering of such behaviours is of considerable concern for the safety of
motorcyclists.
A higher likelihood of alcohol-related motorcycle crashes on weekends
compared to weekdays has been found in previous research (Kasantikul, Ouellet,
Smith, Sirathranont & Panichabhongse, 1995). This perhaps reflects recreational
riding and requires more localised research to ascertain the specific patterns of
impaired riding in particular countries.
Specific drug involvement for motorcyclists is less frequently reported in the
literature. Drummer (2003) found that motorcyclists were over-represented in fatal
crashes involving cannabis, however a similar proportion of motorcycle riders and
car drivers were found for alcohol-related fatalities. In the Melbourne Case-Control
Motorcycle Study, Haworth et al. (1997) found that crashed riders were more likely
than those who did not crash (controls) to have taken illicit and prescription drugs.
Cannabis was the most frequently used illicit drug. Additionally, the combination of
alcohol and drugs was found to be more likely for crash involved riders than
controls. Rowden, Mazurski, Withaneachi, & Stevens (2011) investigated the profile
of drug driving offenders detected in roadside oral fluid testing in the state of New
19
South Wales from 2007-2010 and found a very low proportion of motorcyclists
involved (1% of the entire sample). However, this is likely to reflect the nature of
those selected to be tested and the low rates of motorcycles in traffic (i.e. exposure).
While only 17 riders were detected, all involved cannabis.
Overall, alcohol is more likely to be implicated in severe, single-vehicle
motorcycle crashes (potentially recreational riders on the weekend). However, less is
commonly reported in regard to drug impairment for riders.
2.4.3 Fatigue
Very little published research exists in relation to motorcycle rider fatigue.
This is highlighted in a review by Haworth and Rowden (2006) for VicRoads and a
further review by Horberry, Hutchins and Tong (2008) for the British Department of
Transport. Notwithstanding the paucity of empirical evidence for rider fatigue,
motorcyclists commonly note fatigue as a safety risk. Anecdotal accounts of rider
fatigue are posted on the internet along with prescribed countermeasures such as
ensuring the motorcycle is correctly set-up for long rides and wearing ear plugs to
avoid the effects of constant noise (see http://www.ride4ever.org/news/fatigue.php).
The importance of wearing appropriate clothing for the conditions and maintaining
hydration is also commonly asserted. For recreational riding, any subjective
symptoms of fatigue such as drowsiness may potentially be addressed by stopping
and resting / sleeping or not commencing a ride if the rider is aware of the symptoms
prior to a ride. Hence, riding while fatigued is frequently regarded as a largely
avoidable behaviour that places the rider at risk and can therefore be construed as
risk-taking if the rider is aware of subjective symptoms or fails to sufficiently plan
for a trip to avoid becoming fatigued.
One weakness in interpreting the actual contribution of fatigue to motorcycle
crashes is the use of surrogate fatigue definitions by transport agencies (including
Queensland Transport and Main Roads). Many crashes that are noted as fatigue-
related in reporting systems may be more an artefact of the surrogate measures rather
than an accurate indication of actual rider fatigue. For instance, the Australian
Department of Infrastructure and Transport surrogate measure:
includes single vehicle crashes that occurred during ‘critical times’
(midnight-6am and 2pm-4pm);
20
includes head-on collisions where neither vehicle was overtaking at
the time; and
excludes crashes that
o occurred on roads with speed limits under 80 km/h
o involved pedestrians
o involved unlicensed drivers
o involved drivers with BAC over 0.05%.
Hence, whilst such measures may provide a consistent benchmark to monitor
trends over time, crash statistics based on surrogate fatigue measures must be
interpreted with extreme caution for motorcyclists. Motorcycling is far less likely at
night time compared to car or truck driving. Since surrogate measures are based
primarily on night time crashes (e.g. midnight to 6am) the question of over-
representation of fatigue in motorcycle crashes remains largely unanswered.
The only empirical study found for rider fatigue was by Ma, Williamson and
Friswell (2003) who conducted a day ride, testing riders before and after the 5hr ride
using reaction time measures and subjective reports of fatigue symptoms. They
found 40% of riders reported experiencing fatigue on at least half of their long
journeys. This subjective measure was defined as feeling drowsy, sleepy, tired,
lethargic, bored, unable to concentrate, unable to sustain attention, and/or being
mentally slowed. However, reaction time tests found no significant impairment on
performance compared to a comparison condition where no riding was undertaken.
This raises an important issue in relation to risk taking; that is, should ignoring
subjective symptoms of rider fatigue be classified as deliberate risk taking?
Additionally, should insufficient trip planning be classified as deliberate risk taking?
These are questions that at the time of writing this dissertation there is insufficient
empirical evidence to answer. However, there are important implications: should a
rider stop and rest regularly on a trip (e.g. about every two hours or when getting
fuel) as part of their trip planning or apply the intuitive countermeasure of stopping
and resting when feeling tired, or both? More research is required to address this
question.
Tunnicliff (2005) conducted interviews and focus groups with riders in
Brisbane and found that some riders described how the exhilaration from riding
overrode any fatigue effects even following a long day at work. They felt that riding

21
rejuvenated them rather than fatigued them. This finding must be interpreted with
caution however, as subjective ratings of fatigue can be somewhat unreliable and the
riders may therefore unknowingly be at risk as previously mentioned. In summary,
the review of rider fatigue by Haworth and Rowden (2006, p9) concluded that:
“Currently, we do not have the information needed to draw reliable
conclusions regarding the magnitude of the effects of factors that potentially
contribute to motorcycle fatigue or to assess the real contribution of fatigue to
motorcycle crashes or the crash risk associated with riding while fatigued.
However, the limited research suggests that fatigue is likely to be an issue in
motorcycling, and therefore more knowledge of the phenomenon is needed to
allow countermeasures to be developed.”
A more recent literature review on the topic by Haworth and Blackman
(2011) for the New South Wales Roads and Traffic Authority drew similar
conclusions and noted that little had changed for knowledge on the topic since 2006.
2.4.4 Non-usage of Helmets and Protective Clothing
2.4.4.1 Helmets
The wearing of approved helmets for motorcyclists is compulsory in
Australia with high compliance rates, however many jurisdictions including some
states of the United States and many developing countries face a continued challenge
regarding the non-wearing of helmets. Motorcycle crash trauma in Australia has been
shown to include upper and lower limbs (more than half of all injuries), head (10%),
chest (8%), hip and thighs (7%), neck (2%), and abdomen, back, and pelvic injuries
(collectively approximately 9%) (ATSB, 2004). In other countries where helmet
wearing is not mandated a different pattern of injury predominantly occurs, with far
greater likelihood of head injury causing death (Kraus, Peek-Asa, & Cryer, 2002;
NHTSA, 2002; Swaddiwudhipong, Boonmak, Nguntra, & Mahasakpan, 1998).
Hence, there is much scope internationally for the improvement in motorcycle safety
by increasing helmet usage. Whilst not wearing a helmet in the Australian context
(where it has been mandated for several decades) is clearly a volitional act, it is
perhaps more difficult to label the same act as risk taking in developing countries as
there is generally reduced awareness of the associated risk.

22
Extensive research has been conducted regarding the effectiveness of
motorcycle helmets in preventing or reducing injury. Consistently those who do not
wear a helmet have been shown to be at greater risk of fatal injury (see Coben,
Steiner & Miller, 2006; Dee, 2008; Houston, 2007; Mertz & Weiss, 2008; NHTSA,
2008).
Elliot et al (2003b) reviewed the effectiveness of helmets and noted that
helmet wearing reduced the risk of death by approximately 50%, however they
concluded that more research into helmet design was needed to improve energy
absorption and minimise rotational motion in the event of a crash. Comfort and the
reduction of rider stress and fatigue due to heat is another issue that impacts on the
likelihood of wearing a helmet and the type of helmet worn (Hung, Stevenson &
Ivers, 2008). However, different factors may influence the wearing of motorcycle
helmets for different populations. In the United States there is continued concern
regarding the repeal of mandatory helmet laws for motorcyclists. Objection to
compulsory wearing appears to be predominantly on the grounds of individual
freedom of choice in the United States, however in other countries non-wearing may
be more likely related to normative influences or financial constraints (Germini,
Lionis, Davou & Th Petridou, 2009; Pham, Le Thi, Petrie, Adams & Doran, 2008).
Noordzij et al. (2001) also noted that the choice of the type of helmet worn
impacts on the safety of riders. That is, full-face helmets have distinct safety
advantages for riders in terms of chin and eye protection and, as such, continued
research is required to ascertain factors that may increase the likelihood of
motorcyclists wearing a full-face helmet.
2.4.4.2 Protective Clothing
There can be some debate regarding whether or not the non-adoption of
voluntary safety measures such as protective clothing for motorcyclists actually
represents risk-taking behaviour. Not covering hands, limbs, feet, or the torso at all
whilst riding a motorcycle can be interpreted as volitional risk-taking behaviour in
Australia as people are largely aware of potential injury. However, some riders may
be under the mistaken assumption that they are sufficiently protected by garments
such as jeans and sandshoes in the event of a crash. Therefore, it is difficult to
broadly define the non-wearing of protective clothing as volitional risk taking.
23
Nonetheless, a brief overview of the issues relating to motorcyclists not wearing
protective clothing is provided.
Whilst the use of other protective clothing is not mandatory, rider specific
protective clothing such as jackets, pants, boots, and gloves can reduce injury (for a
review see Haworth, de Rome, Varnsverry, & Rowden, 2007). The MAIDS in-depth
motorcycle crash study in Europe found that 90% of minor injuries could be either
prevented or reduced by wearing protective clothing (ACEM, 2004). It has been
found that leg protection (e.g. leather pants or Kevlar lined jeans) are far less likely
to be worn than other protective clothing (de Rome, 2006; Reeder, Chalmers, &
Langley, 1996; Wishart, Tunnicliff, Watson, & Schonfeld, 2005). Additionally,
particular at-risk groups who are less likely to wear appropriate protective clothing
are pillion passengers (ACEM, 2004) and unlicensed young riders (Reeder et al.,
1996).
Unfortunately motorcycle riders are commonly unwilling to invest in their
own safety. The cost of protective clothing may therefore over-ride their motivation
to protect themselves in the event of a crash. However, whilst Europe has adopted a
quality standard for motorcycle apparel that endeavours to provide some level of
informed choice for riders regarding cost and potential safety benefits, Australian
motorcyclists remain comparatively uninformed as to the actual likelihood of any
particular garment (irrespective of cost) protecting them in the event of a crash.
Regardless of whether riders make an informed decision not to use protective
clothing or whether they are ignorant to the benefits, interventions to target the
increase in protective apparel usage have great potential to reduce road trauma if
combined with a certified standard or quality rating for such products.
2.4.5 Unlicensed Riding
Whilst unlicensed riding does not explicitly represent risk-taking behaviour
per se, unlicensed riders have been shown to be over-represented in crash statistics
and are commonly associated with an assortment of risky riding behaviours (Watson
& Steinhardt, 2006). Fatal crash involvement for unlicensed motorcyclists has been
shown to be more prevalent than for unlicensed car drivers (FORS, 1997; Watson &
Steinhardt, 2006). Furthermore, unlicensed riders are more likely to be involved in a
crash than licensed riders and, additionally in more severe crashes (Haworth et al.,

24
1997; Watson, 2004). In New South Wales for the period 1998-2002, unlicensed
riders were more likely than licensed riders to be involved in fatal crashes involving
speed, drink riding, and not wearing a helmet (RTA, 2004).
Motorcycling is unique compared to other modes of road transport in that a
substantial proportion of overall riding occurs off-road using unregistered machines.
This presents a challenge to road safety in that such machines may often be used on-
road in transit between off-road destinations (Blackman, 2008). Whilst many off-
road dirt bike riders may hold valid licenses to ride on-road, many do not. Riding on
the road has been shown to be a particular problem during adolescence prior to being
eligible for a licence (Haworth et al., 1997; Reeder, Chalmers, Marshall & Langley,
1997; Watson & Steinhardt, 2006).
Borrowing a friend’s motorcycle has also been shown to put riders at risk,
with Haworth et al. (1997) finding that, of the 11 crashed riders that were unlicensed
in the Melbourne Case Control Study, seven did not own the motorcycle. Other
issues for unlicensed riding include:
inappropriate licence class (e.g. riding a 1000cc machine on restricted
licence);
a higher likelihood of being involved in “hit fixed object” crashes
(indicating poorer control skills);
being involved in crashes on the weekend;
being involved in crashes at night (Watson & Steinhardt, 2006).
Overall, unlicensed riders appear to be less skilled, more likely to take risks,
and often on an unfamiliar machine compared to licensed riders. This poses a
considerable risk for riders, pillions, and other road users.
Collectively, the findings presented in this section to this point show that risk
taking by riders contributes to a substantial proportion of motorcycle-related injury
and death. However, whilst the above findings provide valuable information to
inform countermeasures to improve motorcycle safety, they rarely account for the
underlying factors that may motivate unsafe rider behaviour. Such influences need to
be addressed by interventions if behaviour change is likely to occur. These issues are
reviewed in the following section.
25
2.4.6 Psychosocial Influences on Risk Taking by Motorcyclists
While a range of aforementioned risk taking factors have been associated
with motorcycle crashes, it is important to identify individual differences that
underpin such risky riding. Behaviours such as speeding and drink riding are
commonly highlighted by in road safety statistics as contributing factors in
motorcycle crashes, however little attention has been directed by governments at
addressing the underlying psychosocial influences for such behaviour. Such
influences are often central to the reasons people choose to ride motorcycles or an
inherent characteristic of the rider and, as such, may be difficult to change.
2.4.6.1 Riding Motives
It has been posited that people with an increased propensity for risk taking
may be attracted to motorcycling (Horswill & Helman, 2003). Indeed, people are
attracted to motorcycling for a variety of reasons including image, the thrill of riding,
the feeling of freedom, and to impress others (Watson et al., 2003). In addition to the
practical motives for riding such as convenience and economy, Schulz et al. (1991,
as cited in Elliott et al., 2003a) noted three main classifications for rider motives:
1) biking for pleasure;
2) biking as a fast competitive sport; and
3) control over the motorbike.
Broughton and Stradling (2005) found that risk taking is an inherent part of
enjoyment during riding for some participants (accordingly labelled ‘risk seekers’
and ‘risk acceptors’) whilst for others (labelled ‘risk averse’) the enjoyment of riding
came from a sense of freedom rather than risk. This highlights the importance of
considering fundamental rider motives when attempting to change their behaviour
and the understated role of emotions in riding in terms of hedonic motives. Noordzij
et al. (2001) reviewed previous research into riding motives and categorised findings
under eight overarching themes:
positive experiences (e.g. joy, fun, please, escapism)
dynamic aspects of riding (e.g. acceleration, manoeuvrability)
performance aspects (limits of oneself and machine)
social aspects
26
control beliefs
identification with the motorcycle
flow effects (a state of perfection)
sensation seeking.
Christmas, Young, Cookson & Cuerden (2009) examined the riding motives
of 1019 motorcyclists in the United Kingdom and found that the vast majority could
be classified as one of the following:
look-at-me enthusiasts
car aspirants
car rejecters
performance disciples
performance hobbyists
riding disciples
riding hobbyists.
Look-at-me enthusiasts rode to impress others and did not have a wealth of
riding experience. They were found to have the highest crash involvement.
The 2BeSafe project in Europe comprehensively reviewed motives for riding,
highlighting the heterogeneous nature of the motorcycling population and how
different reasons for riding influence the type of motorcycle chosen and, in turn
result in many varied riding styles (ICCS, 2010). Collectively, the above information
suggests that recreational riding particularly is often underpinned by motivational
influences that are not necessarily consistent with road safety objectives. Reasons for
riding and motorcyclists’ subjective views of risk often do not readily reconcile with
expert perceptions of risk (Bellaby & Lawrenson, 2001). An unrealistic optimism is
sometimes held about their own riding skills and their ability to control outcomes
(Rutter, Quine, & Albery, 1998) which may also link to individual motives for riding
(ICCS, 2010). Tunnicliff (2005) found two distinct groups of riders; those who had a
realistic view and acceptance of the risks associated with riding (often learned from
experience) and those who were supremely confident in their own riding skills and
did not want to consider that their riding styles might place them at risk. The
following section elaborates further in regard to overconfidence.
27
2.4.6.2 Overconfidence
Concern has been expressed regarding the possible negative effects of
overconfidence, particularly for novice drivers following training. For example, the
Queensland Parliamentary Travelsafe Committee (2003) argued that the resultant
acquisition of vehicle handling skills during training may instil a sense of
overconfidence in novice drivers, thereby fostering riskier behaviours on the road
once unsupervised. Such overconfidence has been posited to contribute to increased
crash rates found for young drivers following driver skid-pan training focussing on
advanced driving skills (Gregersen, 1996; Katila, Keskinen, Hatakka & Laapotti,
2004). Similarly, motorcyclists may be at risk from overconfidence.
The psychological construct of Unrealistic Optimism is related to
overconfidence and refers to the inherent tendency for humans to over-rate their own
abilities and chances of positive outcomes compared to those of other people. That is,
the majority of people generally tend to rate themselves as ‘above average’ compared
to their peers. Unrealistic optimism is often found when measuring self-reported
driving skill, with a general overconfidence existing in many Western cultures,
particularly for young males (Harré & Sibley, 2007; Sűmer, Özkan, & Lujunen,
2006).
In their study of optimism bias for the Australian Transport Safety Bureau,
Hatfield and Job (2001) asserted that increased confidence is likely to result from
traditional driver training programs, increasing potential crash risk. The paradox
exists between increased skills (performance) and how this may motivate active risk
taking (behaviour) (see Hendersen, 1991). If a rider is tempted to push the limits of
their riding ability because they falsely believe their newly acquired skills are
superior, then this places them in an increasingly vulnerable situation. Hence, whilst
skill development is undeniably a necessary part of safe motorcycling, it is not
sufficient in its own right to protect riders against injury unless accompanied by a
realistic appreciation of the associated risks.
Whilst limited research has been conducted regarding unrealistic optimism or
overconfidence for motorcyclists, the available evidence suggests that there is a
consistent effect not necessarily confined to inexperienced riders. For example,
Sexton, Hamilton, Baughan, Stradling and Broughton (2006) found that two thirds of
riders in a British study rated themselves as “less likely” or “far less likely” than
28
other riders of the same age and experience to be involved in a crash in the next 12
months.
Symmons, Mulvihill and Haworth (2007) conducted a study of riders over the
age of 25 and similarly found that the majority of all riders sampled (two thirds)
rated themselves as “much less likely” to crash in the next 12 months than other
riders of similar age and gender. Symmons et al. also reported that riders who
admitted to crashing in the past five years rated themselves as significantly better at
handling a motorcycle and significantly better at getting out of hazardous situations
than those riders who had not crashed. Unfortunately, it is impossible to assign crash
causation to the over-optimistic attitudes of crashed riders in the study due to the
temporal order of sampling. That is, riders’ attitudes may have been developed as a
result of crashing rather than being a factor that contributed to them crashing.
A further question that remains unanswered for novice motorcyclists is what
level of confidence is needed to safely operate within the traffic environment and at
what point does this become overconfidence that may represent a risk? In regard to
rider training it is logical that training would perhaps increase confidence in one’s
riding skills. Anecdotally, many rider trainers may promote confidence by
reinforcing skills that have been learnt and well performed. Longitudinal studies that
track participants’ subsequent crash involvement and link this to earlier self-rated
confidence levels are required to provide insight into this issue for motorcyclists.
Overall, the available evidence suggests overconfidence is an issue of
concern regarding motorcyclists, however further research is required. Additionally,
for those riders who are found to be overconfident it is important for future research
to investigate any other possible characteristics that may be common amongst this
group.
2.4.6.3 Personality
Several personality characteristics have been linked to risky riding by
motorcyclists. Further to the discussion in Section 2.4.6.1 regarding the motives that
people have for riding motorcycles, a certain type of personality may also be
attracted to motorcycling consistent with motives such as thrill seeking (Miles et al.,
2001; Horswill & Helman, 2001; Watson et al, 2007). From a sociological
perspective it is recognised that a motorcycling culture exists which, at least in part,
29
reflects the “rebel without a cause” type of character as depicted in some early
Hollywood movies. Such personalities may be attracted to motorcycling for the
image and potentially have a low regard for safety as dictated by authorities. No
research was found regarding specific personality types being attracted to specific
types of motorcycles however anecdotal evidence from discussions between the
author and rider trainers suggests that motorcyclists commonly identify with a
particular style of motorcycle which to a large degree reflects their riding motives
and their subsequent patterns of riding. For example, sensation seeking personalities
may be attracted to the performance capabilities of a sports bike and therefore be
prone to speeding and other forms of risky riding such as racing others. Importantly,
the interaction between personality, the type of motorcycle, and the potential for risk
taking may impact on rider safety in terms of where, when, why and how certain
motorcyclists ride.
Watson et al. (2007) found that participants that rated highly for sensation
seeking and aggressive personalities were more likely to perform risky riding
behaviours and express intentions to do so in the future than riders that were low in
these personality characteristics. For example, sensation seeking was found to
contribute to riders’ pushing their individual limits. As personality is a relatively
stable construct, this finding may reflect broader lifestyle issues also (i.e. a general
propensity for risk taking). The 2BeSafe review (ICCS, 2010) noted that stable
personality traits such as a lack of emotional stability, social responsibility, and self
control may underlie risk taking in general. The review also discussed several
characteristics relating to risk taking on a motorcycle such as sensation seeking,
antisocial attitudes (normlessness), aggression and anger, frustration, impatience, and
impulsiveness. Such characteristics of risky riding may relate back to stable
personality traits but it is also possible that these are components of a ‘riding
personality’ that individuals adopt when they get on a motorcycle. More research is
required to determine such issues.
2.4.6.4 Social Norms
Risk taking for motorcyclists may reflect high levels of normlessness or
general antisocial behaviour (ICCS, 2010). However, social norms for motorcyclists
may be more specific to those they ride with, rather than broader society in general.
Riding is largely a social event for many motorcyclists. Hence, there is potential for

30
risky riding attitudes and behaviours to be influenced by others. It is a well
established psychological phenomenon that behaviour is influenced by others that
have a significant role in the lives of people (see Ajzen, 1991). Significant others
may instil basic beliefs (e.g. we may adopt the beliefs of our parents) and,
importantly, also model appropriate or inappropriate behaviour. Whilst significant
others may be represented in the form of close friends and family, Watson et al.
(2007) found that risk taking by motorcyclists was influenced more by immediate
riding companions. As there is considerable camaraderie amongst many riders, the
impact of peer influence on risky riding styles is not a surprising finding.
Peer influence has been recognised as an issue for many types of risky
behaviour and interventions often target this factor in an endeavour to modify
behaviour (e.g. cigarette smoking by adolescents). Therefore, there is also much
potential for interventions to target peer influence in motorcycling.
2.4.6.5 Attitudes and Beliefs
While the causal relationship between attitudes and driver behaviour is
somewhat contentious (Hendersen, 1991), several modern theories assert that
behaviour is, at least in part, underpinned by attitudes (e.g. Social Cognitive Theory,
the Theory of Planned Behaviour, and the Theory of Reasoned Action). For
motorcyclists, Watson et al. (2007) reported that attitudes were a significant predictor
of intentions, which in turn predicted risky riding behaviour. In the RIDE program in
the United Kingdom for motorcycle traffic offenders, ‘deviant beliefs’ were a key
focus to underpin behaviour change (Broughton, Burgess, Fylan, and Stradling,
2009). The Q-Ride motorcycle licensing scheme in Queensland also includes attitude
as a construct underpinning licence competencies as attitude is commonly
acknowledged as an influence on risk taking behaviour.
However, a possible alternate view is that attitudes may merely be a
rationalisation for behaviour. For example, if a rider takes risks often and does not
crash he/she may form an attitude that performing behaviours that broader society
deems as unsafe is indeed safe. Such a notion requires longitudinal data to untangle
the temporal relationship for how risky riding may contribute to poor attitudes to
safety or vice-versa. However, no evidence was found to suggest that adopting a
more positive attitude to safety can result in a subsequent increase in risky behaviour.

31
This has particular relevance for rider training and education programs that attempt
to influence individuals to adopt better attitudes to safety.
2.5 Rider Training and Education
Rider training is one approach to preventing motorcycle-related injury.
However, numerous reviews of empirical evaluations suggest little or no benefit
from either formal pre-licence, or post-licence training and educational programs in
terms of risk reduction for drivers or motorcyclists (Christie, 2001; Daniello, Gabler,
& Mehta, 2009; Haworth & Mulvihill, 2005; Kardamanidis, Martiniuk, Ivers,
Stevenson, & Thistlewaite, 2010; Mayhew, Simpson, & Robinson, 2002; Nairn,
1992; Sudlow, 2003; Watson et al., 1996). In light of the well documented findings
regarding the effectiveness of rider training in previous reviews, an examination of
all individual evaluations is not undertaken here however when adjusting for possible
influences Savolainen and Mannering (2007) also recently found that formally
trained riders had a higher crash risk than informally trained riders. Such a finding is
not unusual regarding rider training (Nairn, 1991). Where crash reductions have been
found from motorcycle rider training and licensing, this has mainly been attributed to
reductions in exposure (Hawarth & Mulvihill, 2005; Kardamanidis et al., 2010).
However, French, Gumus, and Homer (2009) recently undertook a study of
public policy influences on the safety of motorcyclists in the United States and
concluded that states that imposed mandatory licence training for all or at least some
riders (e.g. age specific) did reduce non-fatal injuries compared to states without
such requirements. The study appeared to be methodologically sound, adjusting for
many possible extraneous variables such as demographics. A more complete
discussion of evaluation methodology for motorcycle rider training is provided in
Section 2.5.6.
While traditional rider training and education has focused on providing
students with sufficient knowledge and skills to operate within the traffic
environment there are a range of issues that may impact on the efficacy of programs
regarding safety outcomes. These include not only program content and delivery, but
the influence of the licensing and testing systems upon training, and motives for
riding. Additionally, evaluations of driver and rider training programs have been
notably fraught with a range of methodological shortcomings (Mayhew, 2006; Nairn,
32
1992; Peck, 2006). Hence, the above issues will be examined in detail in the
following sections. Furthermore, there are many commonalities between rider and
driver training, but it can be argued that there are several important differences
including age and gender that should be considered for the populations undertaking
driver and rider training (Haworth & Rowden, 2010). These issues will be discussed
throughout this document where they arise.
2.5.1 Addressing Attitudes and Risk-Taking Motives for Motorcyclists through
Training and Education
The previous sections within this chapter regarding risky riding have
established a need for rider training to address attitudes to safety and the factors that
motivate risky riding. Several different educational interventions targeting
knowledge, attitudes, or behaviour change have been trialled for motorcyclists.
However, few of these have been evaluated and few applied within an existing
licensing system. All of the interventions reviewed in this section involve face-to-
face training programs, however scope for development of computer-based programs
should not be discounted.
2.5.1.1 Norwegian Licensing and Training Initiatives
One tool that has been developed to guide rider training programs is the GDE
matrix (Hatakka, Keskinen, Gregersen, Glad, & Hernetkoski, 2002) as shown in
Figure 1. This framework has been used as the basis of several pre-licence and post-
licence motorcycle training programs in Scandinavia including Norway (CIECA,
2002; Lund, 2006). It aims to improve the safety of motorcyclists by taking a holistic
approach to riding, including the targeting of higher-order cognitive factors relating
to psychosocial influences and lifestyle influences. Norway introduced new licensing
and training initiatives based on the GDE matrix in 2005 for novice car drivers and
motorcyclists.
The matrix provides a hierarchical framework to guide training development
and focuses on driver/rider goals (motivations). Importantly, it asserts that goals
should be considered at four hierarchical levels:
goals for life and skills for living (highest level);
goals and context of driving;
mastery of traffic situations; and
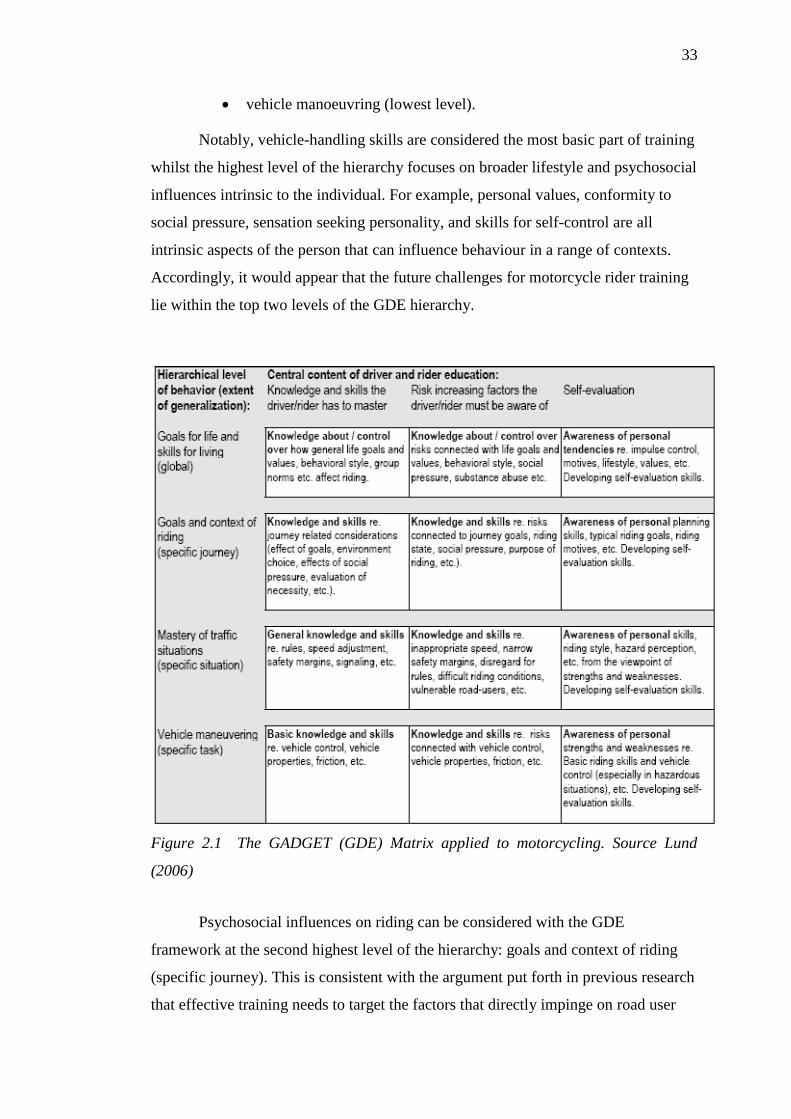
33
vehicle manoeuvring (lowest level).
Notably, vehicle-handling skills are considered the most basic part of training
whilst the highest level of the hierarchy focuses on broader lifestyle and psychosocial
influences intrinsic to the individual. For example, personal values, conformity to
social pressure, sensation seeking personality, and skills for self-control are all
intrinsic aspects of the person that can influence behaviour in a range of contexts.
Accordingly, it would appear that the future challenges for motorcycle rider training
lie within the top two levels of the GDE hierarchy.
Figure 2.1 The GADGET (GDE) Matrix applied to motorcycling. Source Lund
(2006)
Psychosocial influences on riding can be considered with the GDE
framework at the second highest level of the hierarchy: goals and context of riding
(specific journey). This is consistent with the argument put forth in previous research
that effective training needs to target the factors that directly impinge on road user
34
behaviour and crash risk for specific target groups (Mayhew et al., 2002; Watson,
2003). Factors such as motives for riding, peer influence, and rider state
(impairment) are among key considerations at this level.
Central to each level of the GDE matrix is self-evaluation as shown in Figure
2.1. Self-evaluation promotes self-awareness of riding abilities, goal planning, and
lifestyle influences on riding. This is analogous to the concept of self-monitoring
which has been used extensively in behaviour modification programs by
psychologists. Bailey (2003) argued that driver training needs to address what he
refers to as ‘metacognitive’ factors of which he asserted self-monitoring is a key
component.
While the Norwegian motorcycle licensing system incorporates the GDE
model into training, to date there is unfortunately no evidence of its effectiveness in
reducing motorcycle crashes, injury to motorcyclists, or attitudes to safe riding. A
diagrammatic representation of the Norwegian motorcycle licensing requirements is
shown in Figure 2.2. This includes two different licence classes: A1 for light
motorcycles (completion of steps 1, 2, and 4, then testing) and Class A for larger
motorcycles (completion of steps 1, 2, 3 and 4, then testing). Licence applicants for
both classes of motorcycle licence must complete the same basic road traffic
knowledge lessons (step 1) and the environment, safety and training lessons (step 2).
However, to upgrade from Class A1 to Class A, completion of steps 3 and 4 of the
Class A licence are all that are required as indicated by the arrow on the bottom line
of Figure 2.2. This progression is also highlighted by the double headed arrows
between classes in the diagram. Due to the extreme cold of the Northern winter,
motorcycling is not undertaken year round in Norway. Hence, training and licensing
are spread over an extended period, usually 18months, to obtain a provisional
licence. Mandatory training periods are specified with competencies to be met at
several stages during the learning phase. The system also encourages voluntary
practice to consolidate riding skills.

35
Figure 2.2. Norwegian Motorcycle Licensing System Components: Source
Norwegian Public Roads Administration Handbook 251E
A key issue regarding the Norwegian motorcycle licensing system is the step-
by-step incremental training blocks. The comprehensive licensing model not only
requires multiple training sessions, it also aims to build rider knowledge and skills as
they progress through the system. This is based on the rationale of spaced learning
and incremental learning to allow consolidation of previous learning and prevent
information overload that may be associated with accelerated licensing and training
systems (such as Q-Ride in Queensland).
2.5.1.2 The Initial Rider Training Project (IRT)
The Initial Rider Training (IRT) project in Europe also adopted the GDE
matrix as a guide. The project, which is a collaborative effort between several
motorcycling stakeholders in Europe (e.g. FEMA, ACEM, the Swedish Road Traffic
Authority) and the European Commission, aimed to address risk-taking attitudes and
motives during training similar to the aims of the Norwegian system. The IRT was
under development for several years, however the actual level of implementation
amongst European nations remains clouded. A report by the European Commission
(2007) regarding the development of the IRT outlines the inclusion of attitude and

36
behaviour as one of the theoretical components in the training package as shown in
Figure 2.3, however no further details are provided as to how this is addressed.
Figure 2.3 Components of the Initial Rider Training Project. Source: European
Commission, 2007.
Importantly, the IRT program also promotes an electronic training resource
‘e-coaching’ which has potential for enhancing rider safety through computer-based
technology. To date it appears that IRT partners have merely scoped the development
of e-coaching tools and have not yet developed the required technology. However,
Ranta, Maki and Huikkola (2007) have provided an overview of the intricacies and
likely cost involved in developing a broad-based e-coaching tool to address risk
taking and hazard perception in novice riders. Such a tool has the potential to
facilitate standardised self-paced learning anywhere that has computer availability. In
addition to emphasising the potential application of such a tool, Ranta et al. (2007,
p12) note the following:
“The road-safety research literature of the last two decades indicates a shift
from training maneuvering skills to training higher-order skills, i.e. hazard
perception and anticipation skills, risk perception, as well as self-
assessment. It appeared that combining practical exercises, theory and self-
evaluation of one's own behaviour may increase safety of novice drivers. A
promising way to train cognitive skills are multimedia PCs and driving
37
simulators. The main advantage of using these devices, instead of real-car
and/or theoretical training, is that trainees can experience the consequences
of their own decisions and actions in risk-inducing and hazardous scenarios,
which is impossible on the real road. Trainees can develop these skills even
before they have fully automated their maneuvering and vehicle control
skills.”
2.5.1.3 Rider Education Program in Thailand
Motorcycling in developing countries is considerably different to Western
societies in terms of the proportion of motorcycles within the traffic mix, the types of
motorcycles ridden (predominantly <250cc), the traffic infrastructure, and
enforcement to deter risky riding. However, whilst the scope for risk taking may be
somewhat different in relation to engine size and top-end speed, other behaviours
such as riding under the influence of alcohol and riding without a helmet are
common (Swaddiwudhipong, Boonmak, Nguntra, & Mahasakpan, 1998).
Swaddiwudhipong et al. (1998) implemented and evaluated a motorcycle
rider education intervention in rural Thailand that endeavoured to reduce risk taking.
The program was delivered free in rural villages across three subdistricts, with
follow-up interviews conducted two years after the intervention (N=1141). Data from
the intervention sites were compared to data gathered from ‘control’ villages across a
further three subdistricts where the intervention had not taken place (N=1297). The
researchers asserted that broad-based road safety campaigns delivered during the
intervention period were consistent across all villages and therefore any change in
safety outcomes between districts could be assigned primarily to the intervention
(however this lacked any measure of exposure).
The researchers found that several risk-taking behaviours were significantly
reduced at the intervention sites compared to control sites after two years. Whilst the
proportion of riders that reported always wearing a helmet was 46% at the
intervention sites, it was only 20.5% at control sites. Similarly, at the intervention
sites 69.7% of motorcyclists were found to be appropriately licensed whilst this
figure was 46.5% at control sites. This result is not surprising as the education
intervention was delivered in conjunction with a licensing and training package
delivered by the Department of Land Transport. Nonetheless, given the context of
the intervention in rural areas where direct road safety initiatives are rare, the

38
program can be seen to have largely achieved its goals through direct contact with
the target population. The incidence of drink riding was not however reduced when
compared to the control sites. In addition to the interview data, the researchers also
examined motorcycle-related injury hospitalisation data and found substantial
reductions in the intervention subdistricts compared to the control subdistricts in the
year following the intervention. It appears this assertion was not based on rigorous
examination of possible extraneous variables however.
2.5.1.4 Bikesafe Scotland
Bikesafe is an assisted ride program implemented in Scotland aimed at
reducing motorcycle injury. Licensed riders are accompanied on group day rides by
police motorcyclists who model correct riding techniques and road position. They
often offer commentary during the ride with the use of communications equipment.
However, some ambiguity exists regarding the level of feedback provided to
participants about individual deficiencies in skill during the ride. Ormston,
Dudleston, Pearson and Stradling (2003) noted that there are some issues with
insurance if the program is perceived as training. However, each rider receives an
assessment of their ride at the finish of the on-bike session. Rides vary in duration
between one and a half hours and three hours depending on location and police
region.
Theory sessions are delivered in addition to the practical rides (some on the
same day, some on separate evenings) and often address issues such as cornering,
road positioning, hazard awareness, and overtaking (Ormston et al., 2003). However,
as Bikesafe is a co-operative initiative between various police forces, there appears to
be no standardised approach to theory training. In their evaluation of Bikesafe,
Ormston et al. (2003) state that the theory sessions only sometimes specifically
address risk-taking. The program website (http://www.bikesafe.co.uk/) provides very
minimal coverage of risk-taking issues, however does highlight other higher order
factors such as anticipation of hazards (e.g. other road user movements at
intersections) and the importance of planning each ride.
Ormston et al. (2003) found significantly lower self-reported speed in built up
areas. However, this positive finding was countered with the alarming finding that
self-reported speed on the open road increased significantly. A marginal increase in
the use of protective clothing was found, however there was little or no change in pre

39
and post course self-reported risky riding behaviours such as lane splitting, racing
other road users, and dangerous overtaking (although a ceiling effect appears to have
been present for these).
Several assisted rides programs currently exist in Australia, however to date
no evaluations of their effectiveness have been published. One example is a program
overseen by the Gold Coast City Council, with day rides conducted by Honda
Australia Rider Training through the Gold Coast Hinterland. Costs for the day ride
are partly met by the council in an endeavour to reduce motorcycle-related trauma in
the area. A similar program is conducted in the Yarra Ranges in Victoria (McGuire,
2004). Recently Vicroads commenced a trial of assisted rides program in Victoria.
Data for an evaluation of the program is currently being collected. While the
effectiveness of such programs for improving riders’ skills and attitudes is unknown,
they have high face validity with riders.
2.5.1.5 Rider Risk Reduction (RRR) Course
The RRR course commenced in 2004 and is delivered by the Devon County
Council in England with the aim of modifying motorcyclists’ risk taking behaviour.
It was developed based on a meld of accepted psychological theories of behaviour
change (Burgess, 2004). The RRR course is a post-licence diversion program for
existing riders who have committed serious breaches of traffic laws (on machines
>500cc capacity). Hence, it is delivered to a known population of risky riders. Riders
are recommended by Devon and Cornwall Police to attend the course rather than pay
a fine or lose their licence, with a 65% uptake rate.
The course does not aim to discourage riding; rather it aims to provide insight
into the risks of motorcycling and addresses optimism bias. The program was
developed in conjunction with riding groups and endeavours to maintain face validity
with riders. It does not use “shock” tactics such as images of injured riders, rather it
highlights the often hedonic (positive emotion) nature of riding, human limitations,
and realistic risk assessment. The course comprises eight modules delivered by
trained facilitators in a one day classroom session. The Devon County website shows
the following components of the course:

40
Session 1 Facts of life
Session 2 Why am I here?
Session 3 Human limits
Session 4 Hazard perception
Session 5 I'm in control
Session 6 Bad habits and emotional baggage
Session 7 Video scenarios
Session 8 Ride safe, keep riding.
A national motorcycle offender program “RIDE” has been developed based
on the RRR course. Whilst both the RRR course and the RIDE course are aimed at
recidivist offender populations, the content of such courses may hold value for
application within a broad training and licensing system, however would require
tailoring to suit all riders.
2.5.1.6 Riders Helping Riders – Drink Riding Intervention
Peer to peer programs for motorcyclists are commonly promoted within the
United States to address behaviours such as drink riding. For example, the Riders
Helping Riders program aims to reduce alcohol-related motorcycle crashes by
empowering riders to intervene when they believe another rider may be alcohol
impaired (McKnight, Becker & Hohn, 2009). Such peer to peer programs operate on
the rationale that riders need to accept some responsibility for fellow riders whose
judgement may be impaired, and that the influence of another rider may have
comparatively more impact than other sanctions or general deterrence measures due
to the camaraderie that exists within the motorcycling community.
The Riders Helping Riders program was originally developed and piloted in
Maryland US then applied in a limited sense in South Carolina and state wide in
Georgia (McKnight et al., 2009). The 35min program is independent of the US
Motorcycle Safety Foundation (MSF). The course curriculum includes the following
key issues for discussion:
highlighting the importance of intervention to reduce injury
41
the appropriateness of peer intervention
separating drinking from riding (e.g. planning group rides to avoid
premises that serve alcohol)
discouraging riders from becoming impaired
recognising impairment (e.g. observing riders who are drinking –
count drinks)
the signs of impairment
discouraging impaired riders from riding
preventing impaired riders from riding
pledging to intervene
optional role plays (McKnight, 2009).
Evaluation of the Riders Helping Riders program (N=5252) found significant
positive effects on rider attitudes towards intervening when another rider has been
drinking as well as a significant increase in the willingness to intervene. However, no
significant difference was found when comparing actual alcohol-related motorcycle
crashes to alcohol-related car crashes in the state of Georgia during the intervention
period (McKnight, 2009). Unfortunately, this result may be an artefact of the study
design whereby crash data represented all alcohol-related crashes in the state, whilst
a comparatively low proportion of active riders within the state actually took part in
the program. Hence, far more participants are required before any significant
findings are likely, based on the present methodology. Additionally, no adjustment
for exposure was noted by McKnight in his analysis. This may potentially bias
results if the popularity of motorcycling (or car driving) results in comparatively
more riders being on the road over the study period or comparatively more distance
travelled by either group.
NHTSA (2008) noted that in the United States there is concerted effort to
address drink riding through peer to peer programs such as Riders Helping Riders
and other educational programs such as the Motorcycle Safety Foundation (MSF)
rider training, however the effectiveness of such programs is largely unknown.
42
2.5.1.7 Summary of Programs Addressing Risk Taking by Motorcyclists
Where interventions have been applied for motorcyclists to address risk
taking attitudes and motives, evaluations have not been extensive enough to
determine effects on rider safety. Whilst conceptual models such as the GDE matrix
provide a sound framework for intervention programs, more broad scale research and
evaluation is required to determine its utility. It is also acknowledged that other
motorcycle rider training programs, such as those produced by the MSF in the United
States do address risk taking behaviour, however evaluation studies may not have
been undertaken or published.
Crash reduction is considered the ultimate outcome measure in road safety,
however the logistics and cost of obtaining the extremely large number of
participants required to show any effect on crash involvement (because crashes are
rare events) hinders such evaluations. Hence, other measures of risk-taking such as
self-reported behaviour, attitudes, intentions to engage in risk-taking, thrill seeking,
and official offence data provide a more immediate indication of the success of
interventions aiming to address the attitudes and motivations for risky riding for
motorcyclists. These measures also provide a more direct way of assessing the
behaviour change mechanisms underpinning effective (and non-effective) programs.
2.5.2 What Can be Learnt from Attitudinal and Behavioural Interventions for Car
Drivers?
Unlike motorcycling, a range of interventions addressing attitudinal and
higher-order cognitive factors have been trialled for car drivers. Whilst a complete
review of all programs applicable to car drivers is beyond the scope of this review,
several interventions will be briefly reviewed in this section with a view to their
potential application for motorcycling. Attitudinal/behavioural driver improvement
programs usually target recidivist traffic offenders with the aim of addressing
specific dysfunctional behaviours such as drink driving or speeding. In a
comprehensive review of driver improvement interventions Masten and Peck (2004)
found that programs of this nature have a small effect in terms of crash reduction and
violation reduction. This section will review several programs and, additionally,
assess the utility of several other interventions that are commonly aimed at young
drivers, such as insight training and optimism bias training.

43
2.5.2.1 South Australian Driver Intervention Program (Driver
Improvement)
The state implemented deferral program for young traffic offenders in South
Australia aims to reduce risk-taking behaviour by car drivers who have been
disqualified from driving for breaches of their learner permit or provisional licence.
The objective of this driver improvement program is to modify behaviour through
classroom training sessions where group discussion is facilitated to assist participants
to identify their own risk issues and plan how they might effectively address these
(Hutchinson, Kloeden & Wundersitz, 2007).
The 90 minute program is delivered by trained facilitators to groups of no
larger than 16 participants. To allow for effective group discussion the overall class
is separated into smaller groups of no larger than eight participants. Wundersitz and
Hutchinson (2006) reported that whilst participants have committed traffic offences
early in their driving careers, they possess personality characteristics similar to the
broader population of comparable age with the exception of elevated scores on
aggression scales for young male participants. Attitudes to safety were also found to
be lower in the intervention group, however Wundersitz and Hutchinson asserted that
the personality characteristics of the sample suggest they are not a socially ‘deviant’
group.
Wundersitz & Hutchinson (2006) reviewed other driver improvement
programs with similar aims during the process of developing the South Australian
program, with a view to establishing best practice. They noted the following:
the general quality of empirical evidence about the effectiveness or
otherwise of these programs is quite poor;
no exemplar driver improvement programs exist that convincingly
establish best practice;
it is unlikely that any program will have a large effect on crashes;
such programs are cheap (compared with the costs of deaths and
injuries), and even if of low effectiveness are nevertheless sometimes
worthwhile; and
several ideas have been proposed in recent years that offer some hope
for better programs in the future.

44
While Wundersitz & Hutchinson (2006) acknowledged that it was unlikely
that the program would have a large effect on crashes, they highlight the cost to
society of young driver crashes and traffic offences is high and therefore even a
small effect would result in the program being cost effective. One key limitation to
the likely success of the program is the limited time for delivery (90 mins), however
this appears to be a requisite trade-off for the cost-effectiveness of the course.
As the allocated time for delivery of the program is limited, the content of the
program is not exhaustive in terms of risk taking. Even if more time were available it
is questionable how much participants are likely to cognitively process and retain.
The program content is structured around five key areas of concern:
characterising risk-taking behaviour and crash involvement;
social norms and behaviour rationalisations;
lifestyle issues;
consequences of crashing; and
the reinforcement of vulnerability.
Examples of driving topics within these categories that are discussed are
drink and drug driving, fatigue, speeding, inexperience, and peer pressure
(Wundersitz & Hutchinson, 2006). The structure of the program appears to be
consistent with the rationale of the GDE Matrix and further addresses optimism bias
in terms of perceived vulnerability.
A follow-up of crash and offence involvement compared course participants
to those who were directed to attend the course but instead elected to pay an
expiation fee. It was found that the intervention group did not differ from the
comparison group in terms of crash involvement after six months. However, traffic
offending was found to be significantly lower in the intervention group (Kloeden &
Hutchinson, 2007). Whilst this result somewhat affirms the objectives of the
program, it must be considered with caution due to the lack of any measure of
exposure such as distance travelled for each group and the possibility of self-
selection bias (i.e. there may be some underlying difference between those who
chose to complete the program and those that chose to pay the expiation fee).
45
In reviewing the overall effectiveness of the intervention process Wundersitz
& Hutchinson (2006) concluded the following:
“If it were desired to make DIP a stronger intervention without changing its
general approach, it would be possible to reduce the size of the groups, make
the program more therapeutic, and make it longer.”
2.5.2.2 Thames Valley Speeding Awareness Scheme for Speeding
Offenders
The Thames Valley Speeding Awareness Scheme was implemented in Britain
to address speeding for two specific target audiences: low-speed offenders (those
who had only marginally exceeded the speed limit) and high-speed offenders (those
who had been detected exceeding the speed limit by a ‘considerable’ margin)
(McKenna, 2004). Unfortunately, no details of exact cut-offs for exceeding the speed
limit were provided by McKenna for either group of drivers. The participants were
not necessarily recidivist offenders; rather they were drivers from the general
population who had been detected speeding by police on any occasion during the
trial. McKenna noted that as speeding is largely a socially acceptable behaviour and
the majority of the general population engage in regular speeding, there is a need to
address the attitudes of ‘normal’ drivers in addition to recidivist groups that are
usually the target of other driver improvement programs. Four hundred and ten
drivers participated in the intervention for high-speed offenders, while 4678
participated in the intervention for low-speed offenders.
For the low-speed offender group the intervention consisted of completing a
40-50 minute on-line driving behaviour inventory from which they then received a
printed feedback form and engaged in discussion with a trainer regarding their
individual driving risk behaviours that were identified in the inventory. They also
completed on-line interactive video tasks that assessed close following, speed choice,
and hazard perception. The high-speed offender group completed the same on-line
inventory and video tasks as the low-speed offenders and discussed the results with a
trainer; however they also participated in an on-road driving task with feedback from
the trainer. Additionally, the high-speed offenders also received a reward in the form
of a refund of demerit points to their licence.
The course was designed to challenge drivers’ attitudes to risk-taking and
speed enforcement. The inventory for driving behaviours included a range of

46
common risk-taking behaviours so, whilst participant recruitment was based on
speeding behaviour, the intervention aimed to change overall driving behaviour.
Personalised safety messages tailored to each individual’s inventory results were
incorporated into the course with the aim of motivating responsible road user
behaviour.
Unfortunately, McKenna (2004) did not report any follow-up of subsequent
speeding offences or crashes for course participants. However, some interesting
comparisons between the two offender groups were provided. McKenna compared
the high-speed offender group characteristics to those of the low-speed group and
found that the high-speed group:
was younger;
was more likely to be male;
displayed higher speed choice on the interactive driving task;
reported more previous driving offences;
reported more previous crashes; and
rated the usefulness of the course as lower, indicating resistance to the
program.
These results suggest that the high-speed offender group were significantly
more deviant/dysfunctional than the low-speed group. However, whilst both groups
reported intentions to slow down in the future, the high-speed group actually reported
intentions to drive slower than the low-speed group. Based on these findings,
McKenna (2004) asserted that the education of speeding drivers, rather than purely
adopting punitive measures, was a useful method of addressing speeding behaviour.
Further review of the Thames Valley Speed Awareness program found that
the project is ongoing with several subsequent publications (McKenna, 2005, 2006).
However, none of these publications revealed any actual outcomes of the program in
terms of subsequent crash involvement or traffic offending. Therefore, it is
impossible to assert the actual effectiveness of this intervention as a road safety
countermeasure.
47
2.5.2.3 Optimism Bias Training
Optimism bias (or unrealistic optimism) is a psychological construct that can
be linked to overconfidence in motorcyclists as previously described in this review.
Interventions that endeavour to address optimism bias aim to align participants’
subjective perceptions of risk with objective reality.
Hatfield and Job (2001) reported lower optimism bias regarding road-related
events for participants in a driver training intervention compared to a waiting list
control group. The intervention explicitly provided information regarding the risk of
optimism bias then involved participants in personal reflection on past events and the
possibility of their involvement in future negative events. They found that by
eliciting a more realistic view of past events, optimism bias for future events was
reduced.
McKenna and Myers (1997) found that unrealistic optimism in regard to
driving risk could be reduced by manipulating young drivers’ perceptions of personal
accountability. For the experimental group this was achieved by stipulating that their
driving skills would be assessed in a simulator following their self-ratings and
comparisons made. Therefore, the awareness of being objectively assessed resulted
in reduced illusory self-perceptions of driving skill compared to a control group
without the threat of objective assessment.
The implications of the above studies for motorcycling is perhaps that:
1. licence training may benefit from reflections on personal experiences
of risk; and
2. the feedback provided from regular assessment of skill (e.g. at various
stages during GDL) may assist in identifying realistic strengths and
weaknesses and result in a more realistic self-appreciation of abilities
and exposure to risk for riders.
Accordingly, optimism bias may potentially be reduced from a combination
of such measures however more research in this area is required before firm
conclusions can be drawn. The alignment of riders’ subjective perceptions of skill
and risk with realistic indicators of each may be useful in addressing overconfidence.

48
2.5.2.4 Insight Training for Young Drivers – Senserrick
‘Insight’ training is another related method that has been found to have a
positive influence on young driver attitudes, behaviours, perceptions towards risk,
and overconfidence (Gregersen, 1996; Senserrick & Swinburne, 2001). Rather than
teaching drivers how to control a vehicle in difficult driving situations, insight
training focuses on calibrating participants’ perceptions of their own skill and risk
with objective reality (i.e. increasing self-awareness of one’s own driving abilities
and limitations). Overall, it aims to create a more realistic perception among
participants of risky behaviours in the driving environment and is akin to the process
of reducing unrealistic optimism, dependent on the specific application.
Senserrick and Swinburne (2001) evaluated the AAMI Skilled Drivers post-
licence insight training program for young drivers in Australia. The primary aim of
the course was to allow young drivers to experience the anxiety associated with a
loss of control rather than to teach them advanced driving skills. The single day
program incorporated both a classroom-based theory session and a practical driving
session. The classroom session utilised a variety of presentation/teaching modes such
as video, audio, overhead slides, and face-to-face group discussion facilitated by the
instructor (Senserrick & Swinburne, 2001). Issues covered in the theory session were
the factors contributing to road crashes with a focus on the human element.
Information learnt from the theory sessions regarding driver behaviour was
reinforced in the practical driving sessions on a custom built closed facility.
Intervention participants completed questionnaires at the commencement of
training (Time 1) and shortly following completion of the course (Time 2). These
results were compared to a similar group of drivers that were allocated to a waiting
list and completed identical questionnaires, except at Time 2 the control group had
not yet undertaken training. All participants, including the control group, eventually
completed the training, and follow-up questionnaires were completed eight to nine
weeks following the course (Time 3). Notably, Senserrick and Swinburne (2001)
found that the intervention participants showed a greater change in attitude regarding
close following of another car than comparison group participants between Time 1
and Time 2 and a greater reduction in their self-reported undesirable driving
behaviours (mistakes, violations, and lapses). The difference in scores for

49
perceptions of intervention participants for their ability to avoid hazards was also
significantly greater than controls between Time 1 and Time 2.
Whilst Senserrick and Swinburne (2001) found that insight training had some
positive influence on driver road safety attitudes, behaviours, and risk perceptions
there was no attempt to assess its efficacy in terms of crash reduction due to the
relatively small number of course participants (N=220). As such, whilst more
evidence is required regarding the possible crash benefits of insight training, it offers
promise for future training for young drivers.
2.5.2.5 Computer Based Risk Assessment Software Application
Software applications are perhaps the most standardised way to deliver
educational road safety interventions to broad-based, geographically diverse
audiences. The Attitude Advisor (see Johnson, 2009) is an application that was
developed to address risk taking for young drivers, however it could be equally
applied to motorcyclists with some modifications. The web-based PC program
presents drivers with traffic scenarios from a car drivers’ perspective and a risk
inventory of 100 items based on the Theory of Planned Behaviour concepts.
Responses to the inventory generate an individual profile where protective risk
management messages are subsequently presented as feedback, similar to the
previously mentioned Thames Valley Speeding Awareness Program.
Several concepts are represented in the Attitude Advisor: social responsibility
(endangering others and thoughtlessness), individual risk taking, and compliance.
Validation of the Attitude Advisor items was undertaken using an eclectic sample (N
= 331) of students, prisoners, personnel from the UK armed forces and commercial
organisations. It was found that young drivers scored highly on most of the risk
indicator categories, consistent with the known facts that young drivers are a high
risk group of road users. It was also found that drivers with traffic convictions scored
higher on the risk indicators than others. The program is being further refined and
shortened for future applications (Johnson, 2009). Therefore, this program appears to
offer much promise for addressing risk taking in drivers.
A similar PC-based product named Driver Profiler 2 has been developed by
RoSPA for application to fleet drivers, however no information was found to be

50
readily available regarding program specifics or any evaluation of its effectiveness.
The RoSPA website states the following in regard to Driver Profiler 2:
“This online assessment takes around 20 minutes to complete and consists of
two sections, firstly identifying information personal to the driver such as
accident history, mileage and they type of driving they do. The second section
consists of a series of 98 statements regarding driving attitudes whereby
employees have to decide the extent that each statement applies to them. At
the end of the assessment, employees will receive an individual report which
allows them to see 'at risk' areas of their driving and provides tips and advice
to improve these areas. The traits measured by the risk assessment are:
aggression, alertness, stress, dislike of driving, anticipation, attention,
violation, and error.”
http://www.rospa.com/drivertraining/managementinfo/driverprofiler.htm
http://www.rospa.com/drivertraining/driverprofiler/default.aspx
Integral to the accuracy of such software applications (or indeed any self-
report risk assessment measure) is the honesty and accuracy of respondents when
reporting their behaviours. Therefore, respondents must be motivated to respond
honestly and not misrepresent their true risk taking disposition. This represents
challenges for the application of such software within licensing systems where
applicants are motivated to respond in any way that they feel will assist them obtain
their licence.
2.5.3 Training Delivery
Another possible reason why many rider training programs have been found
to be ineffective is that training practices have not been adequately informed by
sound, contemporary teaching principles. It is posited that for the desired outcome
(learning) to be achieved from any training program it must rely not only on
comprehensive, relevant content but also on effective delivery methods that consider
and attend to student perspectives of the learning experience. That is, at present
trainers may tend to attempt to impart knowledge to students without acknowledging
each student’s personal frame of reference. The questions of why people are
motivated to participate in training and how people learn have been largely neglected
in road safety. The failings of past approaches to training delivery are best

51
highlighted in the following quote from the EU Advance project: “It is not the
message which is delivered, but the message which is received by the participants
that counts” (CIECA, 2002, p3).
Effective learning outcomes in adult education have been found to be
dependent upon a complex array of factors related to student learning-focused
activities and their perceptions of the teaching environment (Biggs, 2003). These
factors include conceptually different student processes in learning such as deep,
surface, and strategic approaches (Entwhistle, 1997), student orientations to learning
(Beaty, Gibbs, & Morgan, 1997), students’ prior experiences (Prosser & Trigwell,
1999), and their perceptions of teaching and assessment methods (Ramsden, 1997).
Whilst much of this evidence has been gathered in the context of higher education
learning, the same basic principles can be expected to underpin adult learning in a
range of contexts.
The contribution of student related factors and learning environment factors
has been conceptualized in the 3P (presage, process, product) model of teaching and
learning (Biggs, 2003). The main focus of the model is how presage factors (i.e.
student attributes/experiences and teaching context) may each influence the learning
process resulting in the final product (learning outcomes). Biggs (2003) asserted that
constructive alignment between all factors in the system is required to produce the
desired learning outcome – deep understanding. That is, teaching methods must
accommodate individual differences in learning orientation and support processes of
student learning that have been associated with deeper levels of understanding of
subject matter. A brief description of some of the key concepts is required here to
clarify the potential influence they may have on learning outcomes.
2.5.3.1 Deep and Surface Approaches to Learning
Student approaches to learning and studying were originally categorized by
Marton and Saljo (1997) as deep and surface, based on qualitative interviews that
they conducted with students. They found underlying themes throughout the
interviews that separated students who sought deeper understanding and meaning
(deep approach) from those who tried to simply memorize learning material (surface
approach). Furthermore, these were identified as dichotomous variables rather than
extremes of the same continuum. A deep approach to learning has been described by
Entwhistle (1998) as involving an intention to understand ideas by relating new
52
information to existing knowledge, looking for underlying principles and patterns,
critically assessing information, and developing a genuine interest in the subject.
This approach has been consistently shown to result in higher quality learning
outcomes (Prosser & Trigwell, 1999).
Contrary to the deep approach, a surface approach to learning is associated
with poorer learning outcomes (Marton & Saljo, 1997). Students using this approach
may attempt to rote learn course material, however, are only engaged at a low
cognitive level (Biggs, 2003). Entwhistle (1998) defined this as an intention to cope
with course requirements rather than to develop any real understanding. He
associated this with memorizing facts, studying without reflection, treating the
course as unrelated pieces of information, lacking understanding of new material,
and feeling undue pressure. The implications of this approach in terms of driver/rider
training is that whilst a student may do enough to pass the license test, they may have
never fully understood how basic concepts in training relate to their safety or the
possible consequences of their behaviour.
2.5.3.2 Learning Orientation/Motivation
It is important to acknowledge that adults undertake study/training with a
range of aims that may impact upon the way that they learn, and subsequent
outcomes. Beaty et al. (1997) outlined the academic, vocational, social, and personal
motives that may influence the manner in which a student approaches learning.
These influences may be composed of intrinsic and extrinsic components. For
instance, one student may view their course as a means to obtaining sufficient
training and skills to ride safely within the on-road environment (intrinsic), whilst
another may view it merely as a means to an end (i.e. to get their license, hence
extrinsic). As such, these motives influence the depth of learning that an individual
will engage in. Therefore it is imperative that trainers aim to ensure that student
goals/motives are congruent with that of the course by clearly stating learning
objectives and assessment from the outset. As such, the validity of learning
objectives in regard to safety outcomes (rather than just licensing competencies) is
paramount. The possible influence of the licensing system is further specifically
discussed in a later section of this paper.
53
2.5.3.3 Student Perceptions of Teaching and Learning Environment
Another factor that is pertinent to learning outcomes is the perceptions that
students hold of the learning environment and teaching (Ramsden, 1997). Prossner
and Trigwell elaborated on the 3P model of teaching and learning, incorporating
student perceptions in the process. Entwhistle, McCune, and Hounsell (2002) also
included this in a conceptual representation of factors relevant to the quality of
learning. They specifically noted that it is the students’ subjective perceptions rather
than the objective reality of the learning environment that is important when
considering outcomes. That is, if the student does not perceive something as
worthwhile then they will disengage from the learning situation regardless of how
valuable the content may be in objective terms.
2.5.3.4 Other Issues for Adult Learners
In a related view of adult learning, Delahaye (2005) highlighted the notion of
pedagogical approaches to teaching in contrast to andragogical approaches. Whereas,
pedagogical approaches have a traditional structured approach to teaching, aimed at
imparting knowledge to a relatively naïve learner, androgogical approaches
acknowledge that adults bring a range of life experiences, to the learning situation.
As such, an andragogical approach adopts a more self-directed focus. Within the
context of motorcycle training this has relevance for self-reflection upon riding
experiences subsequent to training and the continued quest for knowledge. Hence, in
particular the top two levels of the GDE hierarchy may be addressed utilising an
androgogical approach to encourage long-term, continued learning.
Within motorcycle training programs it is tentatively suggested here that
some aspects such as initial skills training (i.e. of an instrumental nature) will require
a highly structured pedagogical approach whereas higher-order cognitive aspects
such as self-reflecting on beliefs, attitudes and motivations may require a more semi-
structured, facilitative approach. This raises an important question as to whether
motorcycle rider trainers posses the requisite skills to effectively deliver programs of
this nature to achieve the desired outcomes or whether such programs may be best
delivered in conjunction with qualified psychologists or teachers.
To date, no published studies have investigated the above issues in regard to
rider training. Whilst Bailey (2003) interviewed Australian driver trainers to
ascertain whether student-focused approaches were adopted, the scope of the study

54
unfortunately did not extend to the examination of student perspectives to ascertain if
various approaches were indeed effective. However, it was found that many driver
trainers were informally adopting student-focussed approaches in some regard. This
highlights the need for standardised accreditation for instructors that focuses on
current teaching principles and the further need for regular retraining of instructors to
ensure best practice within licensing systems (Baldi, Baer, & Cook, 2005).
2.5.4 The Influence of the Licensing System on Training
It is important to acknowledge that the vast majority of rider training and
education is undertaken at the pre-licence stage. Indeed, it can be strongly argued
that the licensing process itself has significant influence over what is learned in
training and subsequent outcomes. For instance, Hirsch et al. (2006) found higher
violation and crash rates for adolescent drivers in Quebec who perceived an incentive
(i.e. able to obtain licence at an earlier age) as their major motivator to attend a driver
education course. That is, the students’ main focus during the course was to do
whatever they perceived would contribute to getting their licence earlier. This
represents a problem not only due to the known negative association between age
and crash risk, but also in terms of information learnt during training due to how the
students approach the learning situation (as discussed in the previous section). Other
possible influences of the licensing system on training are:
whether training is mandatory or voluntary may influence trainees’
approaches to learning and motivation to learn;
the testing/assessment method used may influence trainee goals and
the level of training provided (i.e. to meet assessment requirements
only);
the timeframe for training may be restricted, hence resulting in
suboptimal learning opportunities;
the cost of training may be prohibitive, hence resulting in shorter
training periods; and
the curriculum for different jurisdictions may vary, with the
possibility of many being suboptimal.

55
The role of graduated licensing is also paramount for governing how and
when training should be implemented (Baldi et al., 2005; Hedlund & Compton,
2005; Mayhew et al., 2002; Mayhew, Simpson, Williams, & Ferguson, 1998). As
graduated licensing has the potential to extend the learner phase, it also has potential
to extend both formal and informal training during this time. The relative mix of each
may be influenced by licensing requirements such as learner licence periods and the
availability of training services.
However, it must be stated that substantial differences exist between car
drivers and motorcycle riders when considering supervision (i.e. the supervisor can
provide immediate feedback and guidance in a car, though riders will generally be on
separate machines). Such differences between car drivers and motorcyclists are
reflected in crash statistics during the learner phase. Whilst the learner stage has been
consistently shown to be the safest phase for drivers, the same cannot be said for
motorcyclists. For example, in Queensland for the period 2001 to 2005 (inclusive)
2.2 % of casualty crashes for car drivers involved learner drivers whilst provisional
drivers contributed to 16.8%. In contrast, 7.8% of motorcycle casualty crashes
involved learner riders whilst 7.4% involved provisional licensees (Queensland
Transport, 2006). Whilst these figures do not account for distance travelled or the
percentage of licences held in each category, they do provide an indication of the
disparity between car drivers and motorcyclists in the learner phase. Accordingly, the
challenge for licensing systems is to provide learner riders the opportunity for
practise in a safe environment before venturing into the on-road traffic environment.
Mayhew et al. (1998) highlighted the need to incorporate valid testing at
various stages for progression through the graduated licensing system in order to
motivate novices to undertake training and practise specific skills to pass to the next
phase. This is also important as learners may be more able to integrate information
learnt from training once they have had some riding experience as opposed to the
pre-license stage where there is potential for ‘information overload’ due to the
cognitive resources required in initial skill acquisition (Christie et al., 2004).
Additionally, there is more potential that the information will be personally relevant
to them once some experience has been gained. In summary, the manner in which
government agencies integrate licensing and training can have both positive and
56
negative effects on outcomes and careful consideration needs to be given to how this
delicate balance can be best achieved.
2.5.5 Rider Training Evaluation
Whilst an apparent lack of effectiveness of rider training has been found in
past studies this may, in part, be due to methodological flaws in program and
evaluation design (Mayhew, 2006; Watson et al., 1996). Several limitations appear to
consistently impact upon the validity of findings. Self-selection bias is perhaps the
most prevalent of these as rider training is commonly voluntary and quasi-
experimental designs are used for evaluation purposes (Nairn, 1991). Therefore, it is
impossible to disentangle the effects of the training program from pre-existing
differences between those who choose to undertake training and those who do not.
Even when accounting for factors such as age, gender, and sociodemographic profile,
other pre-existing differences (e.g. personality, risk acceptance, and safety
motivation) may impact on subsequent crash involvement. Theoretically, random
assignment of participants to experimental groups or comparison groups will
alleviate these systematic biases, however the applied nature of motorcycle training
often precludes this research design. Other key methodological issues for
consideration in training program outcome evaluations are:
exposure (distance travelled since training);
type of riding (e.g. commuting vs recreational);
previous riding experience;
motives for riding;
external influences that can act as confounds (such as seasonal
influences and other countermeasures where comparison groups are
not assessed concurrently);
type of comparison group/level of treatment (e.g. no training, skills
training only, informal training only, adjunct to existing training);
existing trends in outcome data (e.g. crash trends by severity);
retention/attrition of participants; and
57
partitioning of effects (i.e. identifying successful components of the
course from unsuccessful components).
Another important issue that may result in non-significant findings in
outcome evaluation studies is the lack of sufficient statistical power to detect crash
reductions (Peck, 2006). As road crashes are relatively rare events, extremely large
sample sizes are required to detect small effect sizes. Therefore, it is possible that
training does actually have a meaningful effect on road crashes, however at a level
that is beneath that which is statistically significant using accepted techniques. This
also highlights the need for research to place less reliance on crash involvement as a
sole outcome measure.
Intermediate measures such as offence rates, rider behaviour, attitudes,
intentions to engage in risky behaviours, risk acceptance, and confidence may all
reflect trainees potential for risk-taking and serve as short-term post-training
outcomes. Similarly, measures such as visual search and scanning, critical cue
perception, and general hazard recognition may be valid indicators of potential crash
risk (Peck, 2006). There is also an additional need for process variables to be
evaluated for training programs to indicate whether effects (or lack thereof) may be
attributable to the standard of delivery or other implementation issues.
2.5.5.1 Formative Evaluation
Formative evaluation is undertaken to inform the further development and
refinement of programs or products. In the case of the development of a new
motorcycle rider education program, formative evaluation is a valuable tool to
identify if the program is meeting its short-term objectives during the early stages
(e.g. a pilot program) and to establish the strengths and weaknesses of the program
for future refinement. Formative evaluation can also assist to establish how delivery
procedures or the implementation context may possibly be improved in order to
achieve optimal results. Hence, formative evaluation and process evaluation share
commonalities (Dehar, Casswell & Duignan, 1993) but formative evaluation is
broader in the sense that it examines not only processes but also examines indicators
of whether the program is meeting the desired outcomes in order to refine the
program design (i.e concepts and information to be delivered). Evan, Raines and
Owen (1989, p230) conceptualise formative evaluation for research projects as
follows:

58
“Formative evaluation is an ongoing process that is integrated into the
development and implementation of a research project. It provides
assessment information within a feedback loop. This assessment identifies the
strengths and weaknesses of the project as it progresses. Data obtained from
evaluations may be used to modify and redevelop the measurement
instruments, the research design and the intervention program during the
course of implementing a project”.
Dehar et al. (1993, p213) note that the role of the evaluator in formative
evaluations is also different to the role of those conducting traditional outcome or
process evaluations. Rather than being independent from the program being
appraised, the evaluator in formative evaluations is more explicitly part of the
process of ongoing program development:
“In contrast to traditional conceptions of the evaluator as a neutral, detached
observer, formative evaluation requires that the evaluator work closely with
program personnel involved in decisions about the planning, development,
and implementation of the program”.
Dehar et al. (1993) further note that common components of formative
evaluation are:
developing and refining the program model, objectives, and strategies
reviewing the research literature
conducting needs assessment surveys and other exploratory research
pretesting program materials
piloting of interventions
obtaining feedback from program participants
assessing initial program effects
development of program evaluation systems.
No formative evaluations of rider training or rider education programs
examining both intermediate outcomes and implementation processes were found by
the author in reviewing the literature. This is perhaps because previous evaluations
have been conducted after programs have been implemented rather than being
incorporated into the development of the program. As such, rider training programs
may potentially be discontinued if an outcome evaluation finds them ineffective. A

59
formative evaluation allows refinement of a program in order to become effective.
For rider training and education this may involve intermediate measures as discussed
in the previous section as indicators of the potential for a program to meet the desired
goal (i.e. crash reduction). Longer term follow-up of the crash involvement can be
undertaken, but in the first instance the formative evaluation allows the program
design to be reviewed in order to best achieve this outcome. As such, formative
evaluation is a critical tool to guide program development.
2.6 The Feasibility of Brief Interventions for Rider Training and Education
Rider training interventions may also be well served by examining the
properties of successful brief interventions as, unfortunately, many rider training
programs are restricted to short face-to-face sessions due to economic constraints.
Haworth & Mulvihill (2005) argued that many existing rider training programs were
of insufficient duration to achieve any long-term effect. Brief interventions to
address risk taking as part of rider education programs face the same difficulties.
However, whilst a restricted timeframe for delivery is in opposition to the principles
of adult learning, it does not necessarily mean that brief education programs cannot
be effective, especially if some aspects of brief interventions from other domains can
be transferred to the training setting.
A meta-analysis by Moyer, Finney, Swearingen, & Vergun (2002) of brief
interventions regarding alcohol consumption found small to medium effect sizes for
non-treatment seeking populations (i.e. non-clinical). Similarly, an extensive review
by Bien, Miller, and Tonigan (1993) found that efficacy for brief interventions for
alcohol problems were quite often comparable to more extensive treatments.
Particular ingredients for brief interventions include: feedback of risk;
encouraging responsibility for change; providing advice (options); therapeutic
empathy and; enhancing self-efficacy for change (Moyer et al., 2002). Whilst
therapeutic empathy may not have a role in rider education, the other features appear
very applicable. These processes are consistent with the Transtheoretical Model of
Behaviour Change (Prochaska & DiClemente, 1983) in that feedback of risk reflects
the notion of consciousness raising, providing advice and options for change reflects
the concept of pros and cons of change, and enhancing self-efficacy for change is
central to the idea of moving people through the stages of change. In addition, Bien
60
et al. (1993) noted that ongoing follow-up has been found to assist in the
maintenance of desired behaviours in some studies.
While interventions targeted at reducing a range of risky riding behaviours
are conceivably different to interventions targeting problem levels of alcohol
consumption, the suggestion of applying the aforementioned principles to rider
education potentially has merit. Accordingly, while the discussion of these
techniques here is brief, the concept of motivating participants to limit harmful
behaviours is linked across both domains and the potential effect of a brief
intervention to address risky riding warrants attention given the limited timeframe
generally available for classroom oriented training in the commercial training setting.
2.7 Theoretical Perspectives on Rider Education to Address Risk Taking
Two fundamental perspectives can be adopted when considering how an
attitudinal and motivational motorcycle training intervention should be conceived at
a theoretical level. Firstly, it can be considered in terms of behaviour change, and
secondly in terms of adult learning/education. Each of these perspectives can be
argued on varying theoretical grounds as being applicable to a program that seeks to
address risk-taking behaviour through training.
Perhaps a key issue in considering which perspective is most pertinent is the
target group in question. For post-licence motorcycle training where participants
have existing patterns of riding behaviour, an intervention can be conceived in terms
of behaviour change. A behavioural intervention generally assumes some existing
level of dysfunctional behaviour and, as such, training is directed at addressing the
dysfunctional behaviour and promoting alternate (more favourable) behaviours.
Unfortunately, riders may reject expert opinion because it does not readily reconcile
with their own learnt experiences whilst riding (Natalier, 2001). For example, whilst
they may acknowledge that road crash statistics show that speeding heightens crash
risk and severity, they may have learnt through experience that they can commonly
perform the behaviour without being hurt. Continued experiences of this nature over
time may condition the rider to believe that they are not vulnerable. Hence, a
challenge for post-licence rider training is to initially get students to acknowledge
that their behaviour is potentially harmful before any call to action can be made.

61
Conversely, for pre-licence training it can be argued that it is at least partly a
case of teaching the correct behaviours from the outset for many new riders. Hence,
an adult learning perspective may hold credence. This does not assume the stance
that dysfunctional behaviour is necessarily already present, however potential exists
for such to develop if the correct (safe) behaviours are not learnt. The differences in
perspective between these two target groups also conceptually align with the notions
of prevention (new riders) and intervention (existing riders) for risky riding
behaviours. Whilst it is convenient to conceive motorcycle training in such a
parsimonious manner, a synthesis of both perspectives may prove more useful to
guide rider training.
A range of established theories may potentially prove useful as a foundation
for behaviour change programs for motorcyclists such as the Health Belief Model,
Social Cognitive Learning Theory, Cognitive Behavioural Therapy, the Theory of
Reasoned Action, and Attribution Theory. However as outlined in Chapter 1, this
review focuses on the Theory of Planned Behaviour and the Transtheoretical Model
of Behaviour Change since these were the two perspectives that the research team
considered provided the strongest foundation for the overall development,
implementation, and evaluation of the new program. In part this was based on the
utility of the TPB found by Watson et al. (2007) when examining risky riding by
motorcyclists. More generally, the choice of the TPB and the Transtheoretical model
was based on their demonstrated utility in the fields of traffic psychology and health
psychology. These two behaviour change theories are further supported from an
educational point of view by the broad principles that guide adult learning that were
reviewed earlier in this chapter.
2.7.1 The Theory of Planned Behaviour (TPB)
The Theory of Planned Behaviour (TPB: Ajzen, 1991) is a behavioural
change model that has been successfully applied in traffic psychology as briefly
discussed in Chapter 1. The theory asserts that an individual’s intention to engage in
a particular behaviour will be predicted by three key variables:
1. attitude (based on core beliefs about the behaviour and past
experience);
2. subjective norm (influence of significant others); and

62
3. perceived behavioural control (self-efficacy to perform the behaviour,
and external constraints).
In turn, the person’s intentions are the strongest predictor of behaviour
(Ajzen, 1991). However, the theory also posits that perceived behavioural control
(PBC), whilst having an indirect influence on behaviour via intentions, may also
assert a direct influence on behaviour.
In a meta-analysis of the TPB, the lack of ability for the subjective norm
variable to predict behavioural intentions was identified as a particular weakness of
the theory in its original form (Armitage & Conner, 2001). Hence, several other
variables have been added to the TPB in various studies in an endeavour to increase
its predictive ability. For example, Stradling and Parker (1997) extended the theory
to include personal norms (anticipated regret and moral norm), affective beliefs
(feelings toward performing the behaviour), habit, and personal identity when
examining speeding. They found that these additional variables accounted for
additional variance in relation to participants’ behavioural intentions.
Watson et al. (2007) extended the TPB when endeavouring to predict
intentions to engage in risky motorcycle riding. It was found that a range of variables
increased the predictive power of the TPB in regard to risky riding intentions.
Significant predictors over and above attitude, subjective norm, and perceived
behavioural control included: sensation seeking; aggression; specific subjective norm
(“the people I ride with would want me to…”); group norm (“the people I ride with
would….”); self identity (as a risky rider or safe rider); age; and hours riding per
week. Six behavioural scales, which were composites of risky riding styles, were
then compiled: handling errors; awareness and concentration errors; bending road
rules; riding impaired; pushing the limits; and extreme speed and stunts. Importantly,
over and above intentions and perceived behavioural control (predictors of behaviour
in the TPB), sensation seeking and aggression were found to be strong predictors of
risky riding behaviour for each of the six scales. Additionally, group norm
significantly predicted impaired riding and the bending of road rules, whilst the
specific subjective norm significantly predicted the bending of road rules.
However, Summala (2005) highlighted the fact that driving is a dynamic
experience and that theories need to account for the momentary influences on

63
behaviour. The TPB does not account for impulsive “unplanned” behaviour that may
be contrary to a person’s core beliefs and intentions. Examples of such instances for
road safety may be where the person’s judgement is impaired by alcohol, drugs,
fatigue, or emotion. Alcohol “myopia” is a term often used to describe such
impairment of judgement caused by alcohol. The negative impact of emotion on
cognitive performance is also well documented (Dolan, 2002; Gray, 2001; Lane,
Nadel, Allen, & Kaszniak, 2000; Ohman, Flykt, & Lundqvist, 2000). This may have
implications for hedonic motives for risk taking such as sensation seeking. Each of
the above factors influences cognitive performance in the driving context but
arguably do not influence conscious intentions. Hence, whilst the model provides a
sound framework to predict behavioural intentions, its ability to predict actual
behaviour is not as robust (Armitage & Conner, 2001) and may benefit from
incorporation of further variables.
Therefore, a modified version of the TPB is used as the foundation for
evaluation of the rider education program as part of the program of research in this
thesis. The modified model is shown in Figure 2.4 incorporating variables found to
predict variance in risky riding behaviours and behavioural intentions in the Watson
et al. (2007) study that was a precursor to the current program of research.
Figure 2.4 A Modified Conceptualisation of the Theory of Planned Behaviour
Attitudes
Subjective Norm
Specific Subjective
Norm
(riding peers)
Riding
Aggression
Intentions
Thrill Seeking
Behaviour
Perceived Behavioural
Control
64
2.7.2 The Transtheoretical Model of Behaviour Change
The Transtheoretical Model of behaviour change (Prochaska & DiClemente,
1983), otherwise known as the “Stages of Change” model, asserts that behaviour
change is incremental in nature. Many interventions based on other theoretical
perspectives are commonly only seen as successful if the target behaviour change is
complete, with no incremental measure of change. This has particular relevance to
driver and rider training interventions in that crashes and offences have traditionally
been the predominant outcome measures, with limited focus on intermediate
measures.
The model has been applied extensively in the context of cessation of
dysfunctional behaviours such as cigarette smoking (Chang, 2006; Nigg et al., 1999;
Prochaska & DiClemente, 1983), drink driving recidivism (Freeman et al., 2005),
substance abuse (Chang, 2006: Migneault, Adams, & Read, 2005), and stress (Evers
et al., 2006; Nigg et al., 1999). It has also been applied in the context of acquisition
of desired behaviours such as sunscreen use (Nigg et al., 1999), cancer screening
(Spencer, Pagell, & Adams, 2005), the wearing of seatbelts (Nigg et al., 1999),
healthy diet (Chang, 2006; Nigg et al., 1999), and physical exercise (Chang, 2006;
Nigg et al., 1999; Rhodes & Plotnikoff, 2006). Importantly, the model has also been
successfully applied in a preventative context for participants that have not yet
adopted harmful levels of dysfunctional behaviour (Kidd, Reed, Weaver, Westneat,
& Rayens, 2003). For motorcycling, Broughton, Burgess, Fylan, and Stradling
(2009) used the Transtheoretical Model as a framework for intervention design and
evaluation of the RIDE program in Great Britain. The RIDE program addressed risky
riding styles for motorcyclists that had been apprehended for traffic violations and
were referred by police to attend training rather than lose their licence. The
evaluation found that riders that attended the RIDE program reported moving
through the stages of change to adopt safe riding styles more so than the comparison
group. As such, Broughton et al. found that the stages provided a useful framework
for intervention design and evaluation.
There are six stages of change and 10 processes included in the model. The
stages of change are: precontemplation (no intention to change); contemplation
(considering change in next 6 months); preparation (ready to change); action
(commenced change); maintenance (relapse prevention); and termination (Prochaska,

65
Johnson, & Lee, 1998). Importantly, the model asserts that individuals do not have to
progress through all the stages for an effective change in behaviour to take place.
Very few people actually progress through to the termination stage where they feel
no further temptation to engage in the dysfunctional behaviour.
The 10 processes included in the model are: consciousness raising; dramatic
relief; self-reevaluation; environmental reevaluation; self-liberation; social liberation;
counterconditioning; stimulus control; contingency management; and helping
relationships (Prochaska et al., 1998). Certain processes have been shown to be most
useful at different stages to assist individuals to move to the next stage. For example,
during the precontemplation and contemplation stages awareness raising is a key
process, whilst during the action stage stimulus control and counterconditioning have
been shown to prove more beneficial (Prochaska & DiClemente, 1983).
Importantly, the model acknowledges the maintenance stage of the behaviour
change. Many other models focus purely on the cessation or adoption of target
behaviours without considering the maintenance of the behaviour over time and the
potential that different skills and processes may be required during that maintenance
period to prevent relapse compared to the initial change. This is quite relevant to road
safety, where on-going behaviours are influenced (and reinforced) by the rider’s
interaction with other road users and the environment.
In addition to the stages and processes in the model there are three other core
constructs that underpin behaviour change in the model:
1. decisional balance (the pros and cons of changing);
2. self-efficacy; and
3. temptation (Prochaska et al., 1998).
These factors may impact on and individual’s behaviour at any stage.
However, to move from contemplation to action, for example, an increase in the pros
of changing and a decrease in the cons would be expected to apply. For the
maintenance and termination stages to be effective, high self-efficacy and low
temptation are characteristic. Unfortunately, there is no pictorial representation of the
model that shows the relationships between all variables. This is perhaps because
different behaviours may require very different relationships between all variables.
Indeed, Prochaska et al. (1998) state that the utility of any of the 10 processes for
66
change is dependent upon the target behaviour. Hence, interventions that wish to
apply the Transtheoretical Model (rather than test the model) do not necessarily need
to operationalise all variables to instigate change.
Armitage (2009) noted that the processes of change have been generally
neglected in research in comparison to examination of the stages of change and that
further attention to the processes is warranted for interventions. The process of
consciousness raising logically aligns with the aims of rider training to ensure that
each person becomes aware of risk issues and their personal propensity for these. As
such, this would be a suitable issue to address in targeted interventions for risk taking
by motorcyclists. However, it is important to acknowledge that educational
interventions are not limited to focusing solely on consciousness raising. For
example, where the goal of an intervention is to provide participants with self-
monitoring skills to enable continued behaviour modification over time then the
process of stimulus control may be ideal to identify antecedents to risky riding and
manage them. That is, for the rider to remove the antecedent stimuli from their
environment or avoid situations where the stimuli is present. Furthermore, the
process of self-reevaluation (reflection on self-image) may assist students to
critically examine their beliefs about risk and accept new information. Hence, the
processes included in the Transtheoretical Model are potentially a useful tool for new
innovative training and education programs for motorcyclists.
West (2006) argued that The Transtheoretical Model lacks focus on the key
objective of many interventions; that is, complete behaviour change. However, if the
objective is to establish the more discreet mechanisms of behaviour change then the
model may provide insight into incremental change that would otherwise not be
identified. Armitage (2009) reviewed the utility of the Transtheoretical Model and
noted the growing body of evidence to support a two-stage conceptualisation where
the pre-contemplation, contemplation, and preparation stages form a ‘motivational’
(i.e. intentions) component of the model and the action and maintenance stages form
a ‘volitional’ component. In the context of licence training this conceptualisation
makes sense, as active riding does not commence until after training for many
licence applicants. Essentially, training can motivate the adoption of safe riding
practices for new riders and provide self-management strategies, but it is once
students finish training that they need to volitionally put such things into practice.

67
Hence, the Transtheoretical Model is potentially a useful tool to guide new
innovative training and education programs for motorcyclists.
2.8 Desirable Components of a Rider Education Program to Address Risky Riding
This section integrates the information from the literature review undertaken
in this chapter regarding program design to address risky riding. A brief summary of
desirable components identified in the literature is provided to inform the Three
Steps to Safer Riding project team for initial concepts and processes that may be
useful to apply with the industry partner organisation. Table 2.1 notes several
desirable components from the literature for inclusion in a classroom-based
educational program to address risky riding by motorcyclists. Identification of such
components is in consideration of what is suitable to address in the context of a
licensing course.
The specification of components in Table 2.1 is not exhaustive, is not
intended to be a curriculum for training per se, and does not represent the final Three
Steps to Safer Riding program. Rather these components were primarily meant to
inform the Three Steps to Safer Riding project team about suitable topics, learning
processes, and delivery options for a face-to-face program to be delivered by rider
trainers to learner motorcyclists at the time of licensing and Table 2.1 provides a
guiding framework for such. Ideally the content components would be delivered over
several sessions that ‘chunk’ relevant concepts together and are spaced to allow for
consolidation of learnt information. However, brief interventions have been shown to
be effective to address dysfunctional behaviour (e.g. see Moyer et al., 2002) so an
abbreviated module incorporating the desirable content components may be viable if
the context demands such. For example, it is likely that Q-Ride requires a brief
intervention format.

68
Table 2.1 Desirable components for a rider training/education program to address risky riding
Stages/steps Rationale Content Options Delivery Options
Step 1.
Orient students
to learning about
safety (not just
learning vehicle
control).
Students are likely to have different
learning motives and different course
expectations (e.g. maybe just to get a
licence and not interested in learning
about safety).
Goal – to engage students in the
learning process by eliciting personal
meaning from course content and
aligning course expectations and
motives for training with safe riding
objectives.
List of learning objectives:
raise awareness of personal
risky riding influences
raise awareness of how riding
motives may influence
behaviour
provide self management
strategies for risky riding
provide tools for self-
monitoring and review
Handout upon arrival to include several
questions about motives for undertaking the
course. Students to complete before first
session.
Students to state their motives for training
and expectations then the trainer can discuss
the learning objectives.
Step 2.
Raise awareness
of individual
attitudes to risky
riding and other
underlying
influences on
behaviour and
injury.
Motorcyclists have different individual
influences on risky riding (e.g. see
Watson et al., 2007). They are not
likely to respond to being merely told
about dangerous behaviours.
This step is consistent with the need for
‘feedback for risk’ for brief
interventions (Moyer et al., 2002), the
concept of self-evaluation in the GDE
matrix, and the process of
‘consciousness raising’ in the
Transtheoretical model.
Goal - to identify students’ specific
risk propensity and engage them in
thinking about potential consequences
and how injuries can be prevented.
1. Particular focus on peer influence
and normative behaviour, sensation
seeking, and aggressive riding that
underpin behaviours such as pushing
limits, bending road rules, impaired
riding (alcohol, drugs, fatigue), riding
at extreme speeds, performing stunts,
and non wearing of helmets and
protective clothing.
2. Overestimation of skill
Complete modified Rider Risk Assessment
Measure (RRAM). Group discussion of
individual risks identified in RRAM
facilitated by a riding instructor.
Present possible scenarios where risky riding
behaviour may take place (e.g. riding
videos).
Talking head’ commentary from
experienced riders giving examples of how
specific influences (e.g. sensation seeking or
overconfidence) contributed to their crash or
general risk.
Discuss benefits of protective clothing and
potential barriers to wearing protective gear.
Visual aids required for examples.
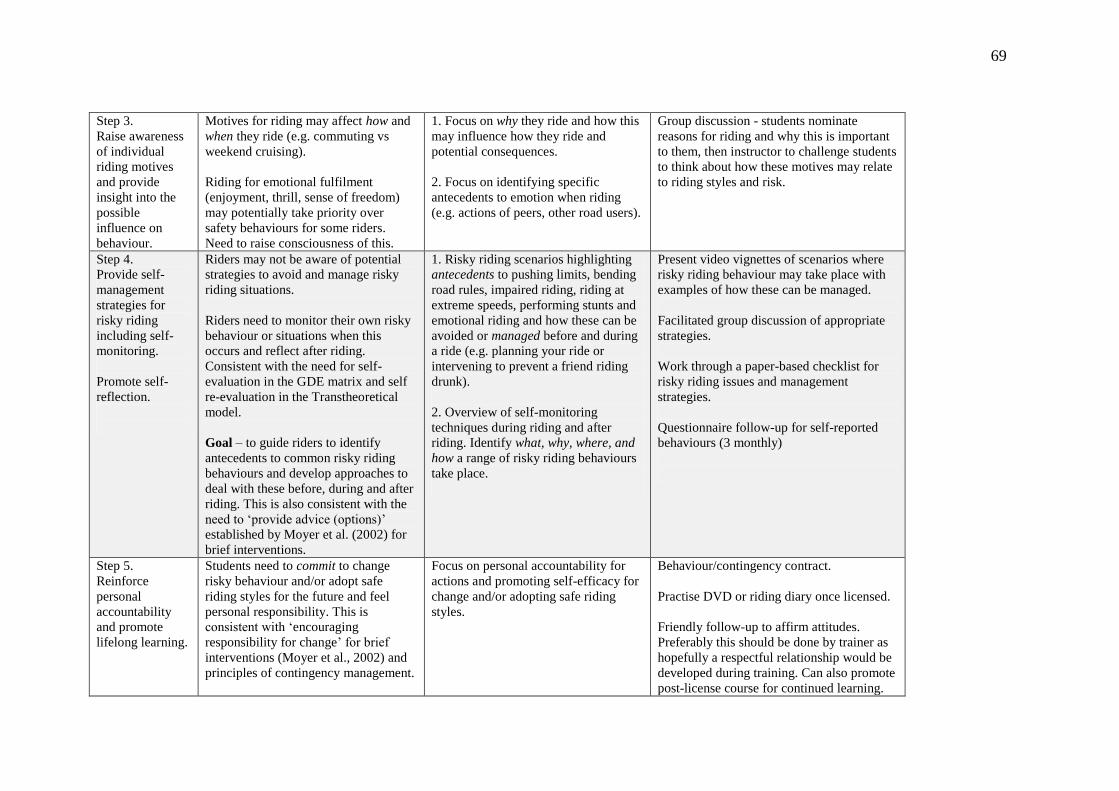
69
Step 3.
Raise awareness
of individual
riding motives
and provide
insight into the
possible
influence on
behaviour.
Motives for riding may affect how and
when they ride (e.g. commuting vs
weekend cruising).
Riding for emotional fulfilment
(enjoyment, thrill, sense of freedom)
may potentially take priority over
safety behaviours for some riders.
Need to raise consciousness of this.
1. Focus on why they ride and how this
may influence how they ride and
potential consequences.
2. Focus on identifying specific
antecedents to emotion when riding
(e.g. actions of peers, other road users).
Group discussion - students nominate
reasons for riding and why this is important
to them, then instructor to challenge students
to think about how these motives may relate
to riding styles and risk.
Step 4.
Provide self-
management
strategies for
risky riding
including self-
monitoring.
Promote self-
reflection.
Riders may not be aware of potential
strategies to avoid and manage risky
riding situations.
Riders need to monitor their own risky
behaviour or situations when this
occurs and reflect after riding.
Consistent with the need for self-
evaluation in the GDE matrix and self
re-evaluation in the Transtheoretical
model.
Goal – to guide riders to identify
antecedents to common risky riding
behaviours and develop approaches to
deal with these before, during and after
riding. This is also consistent with the
need to ‘provide advice (options)’
established by Moyer et al. (2002) for
brief interventions.
1. Risky riding scenarios highlighting
antecedents to pushing limits, bending
road rules, impaired riding, riding at
extreme speeds, performing stunts and
emotional riding and how these can be
avoided or managed before and during
a ride (e.g. planning your ride or
intervening to prevent a friend riding
drunk).
2. Overview of self-monitoring
techniques during riding and after
riding. Identify what, why, where, and
how a range of risky riding behaviours
take place.
Present video vignettes of scenarios where
risky riding behaviour may take place with
examples of how these can be managed.
Facilitated group discussion of appropriate
strategies.
Work through a paper-based checklist for
risky riding issues and management
strategies.
Questionnaire follow-up for self-reported
behaviours (3 monthly)
Step 5.
Reinforce
personal
accountability
and promote
lifelong learning.
Students need to commit to change
risky behaviour and/or adopt safe
riding styles for the future and feel
personal responsibility. This is
consistent with ‘encouraging
responsibility for change’ for brief
interventions (Moyer et al., 2002) and
principles of contingency management.
Focus on personal accountability for
actions and promoting self-efficacy for
change and/or adopting safe riding
styles.
Behaviour/contingency contract.
Practise DVD or riding diary once licensed.
Friendly follow-up to affirm attitudes.
Preferably this should be done by trainer as
hopefully a respectful relationship would be
developed during training. Can also promote
post-license course for continued learning.
70
2.9 Research Questions
The literature reviewed in this chapter suggests that road safety may benefit
from a well structured, formal rider education program at the time of licensing to
address risk taking. However, the potential benefits of such a program remain
unknown as no published evaluations were found of interventions that aimed to
address rider attitudes and motives for risk taking in the initial licensing context.
There are several overarching research questions for this program of research that
aim to answer this gap in current knowledge. While each of the research questions is
to some degree independent in nature, together they are intended to guide the
development and formative evaluation of the pilot program. Table 2.2 shows the
overarching research questions and how they align with each of the research studies
reported in subsequent chapters. A brief rationale for why each research question is
included is provided in text at the end of this section to show how current knowledge
gaps for addressing risk taking by motorcyclists through training and education are to
be investigated during this program of research. The overarching research questions
in Table 2.2 are further broken down into sub-questions in each study to explore and
comment on specific issues that help to inform each study. The breakdown of
research questions is documented in the relevant chapters for each study.
Figure 2.5 shows a diagrammatical representation of the progression of
research studies undertaken by the candidate. This aims to assist in framing how the
research was staged over time to explore the range of research questions.
.
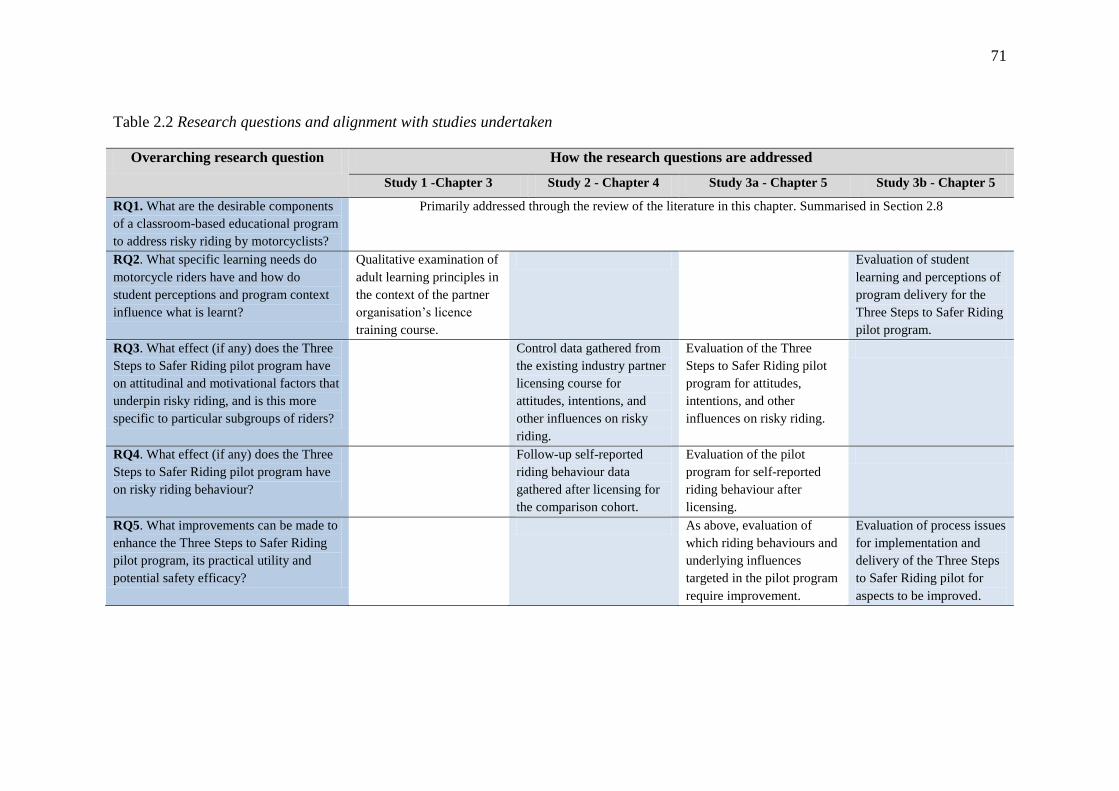
71
Table 2.2 Research questions and alignment with studies undertaken
Overarching research question How the research questions are addressed
Study 1 -Chapter 3 Study 2 - Chapter 4 Study 3a - Chapter 5 Study 3b - Chapter 5
RQ1. What are the desirable components
of a classroom-based educational program
to address risky riding by motorcyclists?
Primarily addressed through the review of the literature in this chapter. Summarised in Section 2.8
RQ2. What specific learning needs do
motorcycle riders have and how do
student perceptions and program context
influence what is learnt?
Qualitative examination of
adult learning principles in
the context of the partner
organisation’s licence
training course.
Evaluation of student
learning and perceptions of
program delivery for the
Three Steps to Safer Riding
pilot program.
RQ3. What effect (if any) does the Three
Steps to Safer Riding pilot program have
on attitudinal and motivational factors that
underpin risky riding, and is this more
specific to particular subgroups of riders?
Control data gathered from
the existing industry partner
licensing course for
attitudes, intentions, and
other influences on risky
riding.
Evaluation of the Three
Steps to Safer Riding pilot
program for attitudes,
intentions, and other
influences on risky riding.
RQ4. What effect (if any) does the Three
Steps to Safer Riding pilot program have
on risky riding behaviour?
Follow-up self-reported
riding behaviour data
gathered after licensing for
the comparison cohort.
Evaluation of the pilot
program for self-reported
riding behaviour after
licensing.
RQ5. What improvements can be made to
enhance the Three Steps to Safer Riding
pilot program, its practical utility and
potential safety efficacy?
As above, evaluation of
which riding behaviours and
underlying influences
targeted in the pilot program
require improvement.
Evaluation of process issues
for implementation and
delivery of the Three Steps
to Safer Riding pilot for
aspects to be improved.
72
RQ1 - What are the desirable components of a classroom-based educational
program to address risky riding by motorcyclists?
For a rider training/education program to address risk taking behaviours and
the underlying influences on behaviour, examination of what are the most desirable
components is required. The literature review has identified that specific risk taking
behaviours by motorcyclists contribute to crashes and injury. Previous research has
also established that there are a range of underlying psychosocial influences on such
behaviour. Accordingly, it is vital to establish which behaviours and underlying
influences are most appropriate to address for the Three Steps to Safer Riding
program. Desirable aspects of such a program also include the processes that may be
applicable to program delivery. Without attention to essential delivery mechanisms it
is unlikely that messages regarding the program content will be received and
internalised by students. As such, this research question aims to synthesise current
knowledge to identify which content and delivery components are most desirable to
include in programs of this nature.
RQ2 - What specific learning needs do motorcycle riders have and how do student
perceptions and program context influence what is learnt?
To effectively deliver a program to address risk taking by motorcyclists, the
research must first establish the specific learning needs of riders so that these may be
addressed. Given the paucity of research to establish possible influences on learning
for motorcyclists during training, it is important to establish issues that affect the
engagement of riders in the learning process and how established principles of adult
learning are best applied to the training situation. More generally, research into adult
learning has established that learning motives, prior experience, approaches to the
learning situation, and perceptions of the learning environment all contribute to
learning outcomes. As this project primarily aims to develop, trial, and evaluate a
program for the industry partner organisation, it is imperative that all of these issues
are explored in the context in which the new program will be applied to establish
possible contextual influences on learning. Issues such as the teaching techniques
employed by the industry partner riding instructors and student perceptions of the
instructors, their teaching skills, and the licence training situation generally may
possibly all contribute to how much information is absorbed during training and the
level to which students are prepared to utilise such information once licensed.

73
RQ3 - What effect (if any) does the Three Steps to Safer Riding pilot program have
on attitudinal and motivational factors that underpin risky riding, and is this more
specific to particular subgroups of riders?
Prominent theories such as the Theory of Planned Behaviour espouse that
behaviour is influenced by a range of underlying factors. Formative evaluation is
important to establish if any new program is achieving its immediate goals and to
establish areas for refinement. Hence, exploring the effect of the pilot program on
intermediate variables such as attitudinal and motivational influences on risky riding
behaviour can assist to inform in the short term if the program is indeed likely to
produce safety benefits for riders and can identify the finer mechanisms that are
useful to achieve the desired behaviours.
RQ4 - What effect (if any) does the Three Steps to Safer Riding pilot program have
on risky riding behaviour?
The literature has established that risky riding contributes to crashes and,
hence, it is important to explore possible avenues to address such behaviour.
Training/education programs at the time of licensing offer the potential to address
risky riding through direct contact with riders early in their riding career. Formative
evaluation of the Three Steps to Safer Riding pilot program to establish possible
effects on rider behaviour will assist to establish if the pilot program is achieving this
aim. This will assist with refinement of the future program and, more broadly, may
identify which behaviours are amenable to influence by training and education.
RQ5 - What improvements can be made to enhance the Three Steps to Safer Riding
pilot program, its practical utility and potential safety efficacy?
From a pragmatic point of view, formative evaluation is crucial to establish
how programs can be improved and best utilised. Piloting of the Three Steps to Safer
Riding program and investigating how the program can be improved is essential to
maximise the potential efficacy of the program.

74
Figure 2.5 Progression of studies undertaken by the candidate to address the research questions.
Study 1
Focus Groups
Study 2
Comparison group
Standard Training
Pre & Post
Questionnaires
Study 3a
Intervention Group
3 Steps pilot program added to
Standard Training
Pre & Post Questionnaires
Study 3b
Process Evaluation of
3 Steps pilot program.
Observations
Focus Groups
Instructor Interviews
Questionnaire data
Follow-up data
collected for
Study 2 & Study 3a
Time
Literature Review
to inform
intervention
development
Note: Data for the control and intervention groups could not be collected concurrently due
to closure of one planned research site by the industry partner

75
2.10 Chapter Summary
This literature review was undertaken primarily to inform the planning and
development of the Three Steps to Safer Riding intervention. This chapter has
provided an outline for what factors may be beneficial to address in educational
interventions for risk taking, how to ideally approach training delivery and,
additionally, how risk factors may be evaluated within a theoretical framework to
inform further refinement. This Chapter has also laid foundation for further chapters
that outline specific studies undertaken to address the stated research questions.
There is considerable scope for improvement of rider training by addressing
influences on risky riding as well as training delivery techniques and methodological
deficiencies in evaluations as discussed in this chapter. Rider behaviour contributes
to a substantial proportion of serious crashes for motorcyclists and therefore an
educational program focussing on rider behaviour and the underlying influences
could possibly improve rider safety. Furthermore, by developing training programs
based on theory there is more structure for program development and evaluation and
less reliance on ad hoc notions of what is presumed to work best.
Adult learning principles suggest that an educational program to address risky
riding would be best spaced over several sessions to avoid information overload and
allow for the consolidation of information. However, brief interventions have also
been shown to be effective in other behavioural domains. As such, program
specifications could be developed dependent upon contextual demands. As a
program applied at the time of licensing to accompany existing training would
provide the maximum potential ‘reach’ to novice riders, licensing systems such as
the Norwegian motorcycle licensing system reviewed in this chapter could provide a
framework within which a program could be applied over time, incorporating several
sessions. However other licensing systems may require brief programs to fit with
their structure.
Finally, this chapter briefly reviewed the nature of rider training evaluations. A
focus on short-term program effects on intermediate variables and implementation
process issues rather than only crash involvement or crash severity may add to the
understanding of rider training and education programs. For new programs,

76
formative evaluation to identify program strengths and weaknesses could ensure that
programs are refined and improved for maximum effect.

77
Chapter 3: Study 1 - A Qualitative Exploration of Motorcycle Rider Learning
processes, Training Delivery Practices, and Perceived Safety
3.1 Introductory Comments
This chapter documents the first study undertaken within the program of
research. As the Three Steps to Safer Riding pilot program was planned to be
delivered as an adjunct to skills based training within a partner organisation, it was
considered imperative to initially examine the existing “state of affairs” in regard to
training delivery and student learning in order to inform delivery protocols for the
latter pilot intervention.
There is a growing consensus in the broader training and education literature
that student-focused (learner-centred) learning results in enhanced learning
outcomes. Smith and Blake (2005, p1) summarised this approach as “moving away
from a focus on learning technical skills towards a focus on the whole person and
learning to learn”. Whilst learning technical skills remains imperative for rider
training, the manner in which these skills and classroom information are learnt may
be enhanced by recognising individual learning needs. This challenges traditional
didactic approaches to teaching where it is often assumed that the student learns what
is taught regardless of individual differences in factors such as learning ability,
learning motives, or learning style. The learner-centred approach offers much
promise within the context of rider training, with the potential to engage students in
the learning experience to extract personal meaning from training sessions and retain
vital safety information, particularly in the classroom learning environment.
Training delivery issues identified in Chapter 2 provided a background for the
learner-centred (student-focussed) teaching approach that was ideally required for
delivery of rider training and education programs and, in addition, identified
potential learning barriers that needed to be overcome (e.g. unlearning bad habits
from prior riding experiences, and external learning motives). Unfortunately, there
has been a lack of systematic application and evaluation of such principles within the
driver/rider training industry (Bailey, 2005; Jerrim, 2003). The questions of why
78
people are motivated to participate in training and what may influence the way
people learn have been largely neglected in road safety education.
Whilst a learner-centred approach to training delivery has been advocated by
the European Nations (e.g. the EU ADVANCED project), a comprehensive review
of the rider training literature found no published studies that specifically
investigated the strengths and/or weaknesses of this approach. Bailey (2003) studied
Australian driver trainers to ascertain whether they adopted a learner-centred
approach and found that many driver trainers were informally integrating this
approach to some degree. However, the scope of Bailey’s study did not extend to the
examination of student perspectives of such training.
Considering the heterogeneous nature of the learner motorcycle rider
population in Queensland (Watson et al., 2003), examining individual learning needs
and those of specific subgroups of rider trainees was considered important in an
endeavour to ascertain how established principles of adult learning reviewed in
Chapter 2 aligned with the population of rider trainees of interest (i.e. those who
attended licence training with the partner organisation).
3.2 Study Aims, Scope, and Research Questions
This qualitative study aimed to investigate the factors that influenced student
learning during a motorcycle licence training course within the context of Q-Ride1
and how information learnt during training was reflected in participant safety during
subsequent riding. A key notion underpinning this study is that student perceptions of
training and individual learning styles may affect their engagement in the learning
process thereby influencing learning outcomes. Therefore, their perceptions and
opinions are valuable in informing how training may be improved to enhance
learning of the requisite knowledge. Exploration of these issues was undertaken to
address Objective 2 (p6) and the overarching research question RQ2 outlined in
Chapter 2 (p70): What specific learning needs do motorcycle riders have and how do
student perceptions and program context influence what is learnt?
1 A description of Q-Ride is provided in Appendix 3.1
79
Three study-specific issues were examined in the breakdown of RQ2 for this
study as follows:
1. How congruent are existing training practices by the industry partner
organisation with established adult learning principles?
2. How does the licensing context influence delivery practice for training (as
perceived by students) and student expectations of the course?
3. How can rider training be informed by student perceptions and experiences to
improve road safety outcomes?
The primary objective was to establish if the current delivery protocols by the
partner organisation were suitable for delivery of the planned rider education
intervention pilot. The study was exploratory in nature and there was no prior
assumption of any particular approach to teaching or learning being applied in the
existing program. Hence, no specific hypotheses were established. In terms of scope,
the study did not aim to examine the theoretical concept of learning transfer. Rather,
the premise of whether established adult learning principles applied to the
motorcycle rider training context was examined. The qualitative method was deemed
most appropriate to obtain a richness of data that could not be suitably attained using
quantitative methods.
3.3 Method
3.3.1 Participants
Participants were recruited from the existing client base of the industry
partner organisation, Queensland’s largest motorcycle training provider at the time.
A mail-out to 600 past trainees was conducted asking them to contact the industry
partner organisation directly if they were interested in attending a focus group
session. Booking participants into focus group sessions was managed by the partner
organisation due to potential information privacy issues associated with the release of
personal information (e.g. addresses and contact numbers) by the partner
organisation to the researcher. Additionally, this approach was considered to
potentially have greater credibility with riders due to their existing connection with
the partner organisation. Care was however taken in the project information sheet to
highlight that the research was being conducted for academic purposes that were
independent of the partner organisation.

80
All participants had completed the industry partner’s standard rider training
program to obtain either a restricted class (RE) motorcycle licence or an open class
(R) licence in the previous 12 months. The final sample consisted of 40 participants
(32 males, 8 females) across 10 focus groups. Participation was voluntary and
anonymous. To ensure the anonymity of the participants, no further personal details
were recorded. Ages appeared to range from early adulthood (approximately 18
years) to late adulthood (approximately 60 years).
Participants were compensated for their time with a $50 cash payment each.
Ethical approval for the study was obtained from the Queensland University of
Technology Human Research Ethics Committee and the confidentiality of
individuals assured in data reporting.
3.3.2 Measures
The focus groups were semi-structured in nature. The same nine standardised
open-ended questions were utilised in each focus group (see Appendix 3.2). Prompts
were employed by the facilitator in some instances to further explore key concepts
that arose during discussion. The questions were primarily based on existing
concepts from the adult learning literature. However, on-road riding experiences
were also discussed in order to explore how information learnt during training
transposed to the ‘real world’ riding environment, for example, in the question “what
things have happened on the road since you’ve been licensed that make you think of
important things you learned in the classroom and practical sessions of your
training”. The focus groups also explored how training could be enhanced in terms of
addressing attitudes to risk in order to improve safety outcomes in the question “how
was your attitude/belief towards safety challenged or changed during training (or
from being out on the road since then)”.
3.3.3 Procedure
The 10 focus groups were conducted between September 2006 and February
2007. Focus group discussions ranged from between one and two hours in duration
dependent upon the degree of discussion by each group. Conceptual content analysis
was undertaken to identify key themes in the data based on frequency and/or
intensity (Krueger, 1998). Focus groups were conducted until saturation of the data
was achieved (i.e. until no new/unique information was forthcoming). Auditory

81
recording of each session was undertaken for review by the researcher. Additionally,
notes were taken by two researchers (the facilitator and an observer) to enhance the
reliability of the data and identify key issues.
3.4 Results
Three key overarching themes emerged from the data as below.
1. that a range of individual differences in learning exist for motorcyclists
during training and a variety of teaching methods are required to address
these;
2. that much information from training does transpose to actual on-road riding
following licensing, however the most salient information is that which is
personally encountered and reinforced in the on-road environment; and
3. the motorcycle licensing system requirements were not always perceived by
trainees as sufficient for their subsequent riding safety.
Pertinent information from the focus group discussions relating to each of the
themes is presented in the following sections.
3.4.1 Theme 1
The first theme from the data was that a range of individual learning needs
exist for motorcyclists during training and a variety of teaching methods are
required to address these. That is, whilst a didactic, regimented approach to teaching
may perhaps have been traditionally adopted by rider trainers, the data suggests that
a flexible approach to teaching is required that acknowledges that not all individuals
learn and retain information and/or skills in the same manner. Furthermore, this
suggests that rider trainers also need the skills to identify individual learning needs
where students may have difficulty completing certain tasks or understanding
particular principles. There were several conceptually different reported influences
upon learning during training as described in the following sub-sections.
3.4.1.1 Learning Motivation
Student motivations for attending the course appeared to initially influence
whether trainees were receptive to information presented in training. Four main
categories of motives were found: purely to obtain a licence; to learn about safety
aspects of riding; to learn or improve riding skills; and to increase confidence. Whilst
82
it would be expected that those participants who were purely extrinsically motivated
(i.e. just to obtain their licence) may be less oriented towards learning, it was
apparent in the data that the instructors did actually engage at least some of these
trainees as shown in the following quotes. Approximate ages are shown for some
quotes where noted at the time of data collection.
“I came here and I just wanted a motorbike licence……..but once I got into
the courses it was really enjoyable and it gave me a thirst to keep learning”
(40+male).
“(I wanted) to be street legal in the eyes of the Government. But this course
taught me so much more than that. How to be a safe rider and an alert rider”
(male).
3.4.1.2 The Influence of Past Experience on Learning
The concept of past experiences influencing learning also revealed individual
differences that needed to be accommodated during training. It was perceived by
participants that some experiences had a positive influence on their learning whilst
others had a detrimental effect. Perceived positive influences were previous exposure
to workplace competency-based training, driving a truck, riding a pushbike
(knowledge of vulnerability directed attention to safety aspects), previous driving
experience, and previous motorcycle riding experience (more fine motor skills as
well as easier to understand training information and visualise concepts). However,
previous experience was also perceived as a negative influence by other participants
due to the need to unlearn bad habits. Hence, past learning experiences appear to
have mixed effects on learning during rider training.
“I think having the past practical experience of riding a (motor)bike I could
take on board straight away exactly what they were talking about a lot
easier” (male).
“An under 30 person, that’s how you did things. You just get in and do
things. You didn’t have any preconceived way of doing things. But as you get
older that all changes and we learn things. So I have to go through a lot of
unlearning” (40+male).
83
3.4.1.3 Learning Styles
Additionally, participants mentioned a number of different styles of learning
which needed to be recognised and accommodated. Participants generally viewed the
instructors as particularly proficient at recognising individual ways of learning and
addressing these needs. Several participants mentioned modes of presentation that
best suited their learning such as visual aids, verbal description, and kinaesthetic
“hands-on” experience. Some of the key teaching techniques mentioned were:
continual feedback; positive reinforcement; facilitating involvement and interaction
in group situations; personal anecdotes/stories; modelling of correct techniques;
repetition; and the grouping (chunking) of information into smaller manageable
steps.
“The way they did it was very effective because they kept adding bits to
it……..it was habit forming I guess” (male).
“It was very interactive. It wasn’t just sit there and watch the video. Sort of
go through lots of questions. So from a learning perspective that was quite
good because it actually enabled you to ask questions, get feedback from the
instructors, and draw upon their experiences as well” (male).
“Repetition, getting it right. Doing it the right way and doing it until you got
it right……they knew what they wanted and they kept you going until they got
what they wanted” (female).
“I’m a cerebral learner. I’ve got to understand the theory before I can do the
practical shit, that’s just me……..so they’d take me aside and talk to me and
work me through it and explain the physics of the bike” (40+male).
“I don’t like sitting there and talking for ages. I’m kind of like let me know
what I need to do then let me try to do it” (male).
“The trainers went and did what they were telling us to do before we had to
do it. I like to see something done and then do it myself. It doesn’t matter if I
think about it or read about it. I think showing you, doing it, works fine”
(young female).
84
“They spent a lot of time with me as an individual rider……..that individual
attention was good” (young female).
3.4.1.4 Rapport Building
Beyond the teaching techniques utilised, a particular sub-theme that was
apparent was that learning for students is enhanced by their perceptions of credibility
of the instructors and the level of rapport that is developed. Students appear to regard
the riding instructors as experts and generally embrace any information that they
present. Discussion from some participants implies that this may be quite different
from their previous learning experiences (e.g. car driver training). The importance of
establishing rapport to enhance how receptive students may be to new information is
evident in the following quote:
“It’s wisdom coming from someone that you’ve spent the morning bonding
with and understanding. They’re on the same page as you. They’re not a
bunch of smug arseholes that think they know everything and they’re not a
bunch of old farts that have been there and done that and are going off at you
for not being perfect” (young male).
3.4.2 Theme 2
The second theme to emanate from the data was that much information from
training does transpose to actual on-road riding following licensing, however the
most salient information is that which was personally encountered and reinforced in
the on-road environment. Collectively participants recalled an abundance of
information and skills taught in the course. However, particular aspects were recalled
by some participants but not others. It was apparent that although each person had
completed the same training course and met the same competencies, actual learning
varied from person to person.
3.4.2.1 Information Retained From Training
Overall, information recalled could be summarised under the following
categories: vehicle checks; safety apparel, basic vehicle operation (gears, indicators,
brakes); riding techniques and crash avoidance (e.g. countersteering); road
conditions; awareness of potential injury; and on-road scanning and riding strategies
85
(roadcraft). A combination of practical and classroom sessions appeared to foster
greater understanding and retention as shown in the following quotes:
“They taught us down there (practical sessions) and showed us examples and
then made us do it until we got it right. But I think they introduced it in the
video” (referring to countersteering; young male).
“When you’re here (in the classroom) and they say something to you, you
mightn’t have much of a grasp of how important it is until you’re out there on
the road” (40+male).
The usefulness of training information and skills in real-world riding
situations experienced subsequent to licensing is of particular importance. Riders
who had no previous riding experience prior to training commonly reported that
“everything” they learned in training was beneficial for on-road riding following
licensing. Elaboration of these experiences revealed behaviours such as basic vehicle
control, changing gears, wearing appropriate protective clothing, keeping their eyes
up, and breathing calmly when stressed. More experienced participants largely
reported the benefit of learning roadcraft during training as shown in the following
quotes.
“Preparation for worst case scenarios……just before nine o’clock in the
morning when the mum’s dropping the kids off at school and she’s reversing
out of the driveway” (male).
“There were these two 4WDs speeding, one behind the other and I was in the
next lane. And one decided to stop and the other one veered into my lane
without looking. But because I hung back (I avoided a crash). I think they
taught that........you need to see things ahead” (female).
“Avoiding an accident……I could see it coming before it happened” (male).
“Once again the training, they said to you ‘just treat everyone out there as if
they’re out to kill you’. And they are, unintentionally they are. A woman
pulled out of a sidestreet and once again everything they (the instructors)
taught me, they helped” (male).

86
3.4.2.2 Learning from Experience
However, it was also evident that sometimes information taught in training
was not utilised in subsequent on-road riding. It was only when an incident happened
that training knowledge sometimes became salient. Therefore, in these cases training
information only gained personal relevance for the riders through experience and did
not prevent them from actually committing errors or taking unnecessary risks as
shown in the following quotes.
“If I’m just a bit too relaxed and overshoot the corner, do something
stupid………you have to think back specifically to what you were supposed to
be doing and what you learned here and why you weren’t doing it and try to
remember it for next time” (male).
“The only time I’ve gone up the left hand side of someone (i.e. the shoulder of
the road in Australia), someone tried to take me straight off the road......I
haven’t even tried to do it again (male).
“We had an accident at Easter on the Harley………I didn’t have leather
pants. I had a vest, I didn’t have gloves………….we wear full leathers now,
we won’t get on the bike without them. We learnt from our mistake”
(female).2
Sometimes participants acknowledged that the training provided a sound
foundation for them to reflect upon when errors or near misses occurred during their
rides in subsequent months, however other participants appeared not to link concepts
learnt in training with their subsequent on-road errors. Two participants were
involved in crashes and both appeared to externalise blame for the incident rather
than acknowledge that they were actually trained not to undertake the particular
behaviours that resulted in their injuries (following too closely and not wearing
protective clothing).
2 Further elaboration revealed that the benefits of protective clothing had been stated to the participant
during training yet she chose not to wear protective clothing at the time of the crash because her
husband didn’t wear any.

87
3.4.3 Theme 3
The third theme that became evident from the data was that the motorcycle
licensing system requirements were not always perceived by trainees as sufficient for
their subsequent riding safety. These sentiments were expressed in regard to the
requirements to gain a learner permit, the assessment competencies for licensing
(either provisional or open), and the capacity of the motorcycle that was allowed to
be ridden once licensed for some novice riders. This theme relates to the context in
which training is delivered and highlights the importance of consideration of
contextual influences on learning.
3.4.3.1 Initial Stages of Motorcycle Licensure
Learner permit requirements for motorcyclists in the state of Queensland at
the time the study was undertaken included only a brief multiple choice knowledge
test and an eyesight test. Applicants could potentially obtain their learner permit from
Queensland Transport then complete the Q-Ride licence training course with a
registered rider training organisation in the same day (often qualifying them to ride
unrestricted capacity machines). The lack of any requirement for pre-learner
motorcycle training to obtain a learner permit was an issue that arose during
discussion of how training and licensing could be improved as highlighted in the
following quote.
“I think if you go for your learners permit (practical test) that would be the
ideal thing. It would raise the bar for getting your learners” (male).
Furthermore, some participants commented about the need for training to be
integrated at several stages early in the licensing process to maximise learning for
novices. The reasoning for this was twofold: to reinforce previously learnt
information and skills and; to gradually build on their skills (e.g. riding with a pillion
which many Q-Ride graduates were automatically allowed to do under the legislation
if they had held a drivers licence for at least three years). For instance, several riders
felt they would benefit from follow-up training within three to six months of their
initial training as shown in the following quotes.
“Maybe on completion of the course it should be compulsory to have a
refresher after three or six months just to sit in the class and maybe have a bit
of a practical session too” (male).
88
“Maybe if you had the people who had done the course before, do a refresher
after three months for like three hours or something” (male).
“I’d like to see something on pillioning but it’s not the right time when you’re
getting your licence because you’re too green. If there was a three month or
six month thing where you come back to cover pillioning and that sort of
thing then that would be beneficial” (male).
3.4.3.2 The Adequacy of Licence Competencies for Safe Riding
Additionally, participants felt that training could be enhanced in a number of
ways including: more on-road riding; longer duration of training; how to handle
specific situations (e.g. wet weather, wind, night, dirt, pillions, and overtaking);
training at highway speeds; provision of mechanical knowledge; presentation of
crash statistics; presentation of ‘stupid’ behaviours and their consequences; a
thorough debrief at the end of training; and the provision of more resources (such as
reading material, a take home instructional video, and links to websites for continued
learning). As training was essentially undertaken to meet the competencies dictated
by the licensing authority, this again reflects the importance of the specific context in
which rider training is conducted. Comments by participants implied a perceived
need for expansion of the competencies within the Q-Ride system or, alternately, that
the training organisation was not sufficiently addressing existing competencies
(which would imply insufficient auditing by the licensing authority). The key sub-
theme that was generated from this discussion was that some riders felt unprepared
for unaccompanied riding following licensing even though they had met the
competency standards. This sentiment is reflected in the following quotes.
“I felt that the Q-Ride course, even though I was given a certificate of
competency, I honestly didn’t feel confident……..when I went out and got my
first bike and went for the test ride I was pissing my pants” (young male).
“For a beginner like myself I think there should have been either more
frequency of that on the road practising or for a longer period of time”
(male).
“More on-road stuff before you get your licence would have been good
because until you’re out there you don’t realise just how intimidating some of
the traffic can be” (female).
89
“I was found competent riding but I felt if I had of been made to come back
for more hours just to get that confidence so they can take me on the road
and I can build that up………because I didn’t feel comfortable quite yet going
out on my own with my licence on a bike” (female).
I came out of it and they’re saying yeah you can do everything. Yeah I can do
everything but I still feel sketchy” (male).
“I was absolutely terrified leaving because it’s like now it’s D-Day, you’re
going out onto the road while you’re still learning” (male).
While there were many suggestions for enhancement of the training course
there was also acknowledgement of the practical constraints in providing this. That
is, it is not practical for course providers to focus on aspects of training beyond those
aimed at meeting the minimum requirements to address the licensing competencies
because many trainee riders would not be prepared to pay for the additional training.
While the industry partner training organisation also offered several post-licence
courses for motorcyclists, it appeared that the majority of riders were only prepared
to pay for the bare minimum of training required under the licensing system. This is
reflected in the following quote:
“Ideally I think everyone should have to do a three day course but that’s just
not practical because cost comes into it a lot too” (male).
3.4.3.3 Licensing Incentives and Safety
Another key concern for some participants was that an open class motorcycle
licence could be obtained under Q-Ride if the applicant had held a car driver licence
for three years or more within the last five years. This incentive within the Q-Ride
system meant that novice riders (often with no previous riding experience) could
complete the course then ride any capacity motorcycle they chose once licensed. This
point arose during discussions as some participants felt that it was too dangerous for
novice riders to be in control of large capacity machines.
“Maybe we do need to look at the process of legislating a certain cc (cubic
centimetre) size, depending on your experience and age because it’s too easy
to get your open licence and go out and buy a 900 or 1000cc bike” (male).

90
3.4.3.4 Summary of Results
In summary, the data from the focus groups generally indicated that past
trainees valued their training and that the riding instructors used a number of
teaching techniques where required to facilitate individual learning. Whilst most past
trainees felt the training they received transposed to the ‘real world’ traffic
environment and was useful for their safe riding subsequent to licensing, there was
still much scope for improvement. That is, the course was perhaps not delivered over
a sufficient duration nor did it sufficiently cover all the aspects of motorcycling that
the participants felt they needed to ride safely. As such, it could be stated that whilst
the training was delivered well, at least for some participants the course was
perceived as minimalistic in regard to what was encountered on-road subsequent to
licensing.
3.5 Discussion
This study examined RQ2 (p70) which relates to the specific learning needs
of motorcycle riders and how student perceptions and program context influence
what is learnt. More particularly, it was designed to explore three issues in the
breakdown of RQ2: how congruent are existing training delivery practices were with
adult learning principles; how does the licensing context potentially influence rider
training; and how can rider training be informed by student perceptions and
experiences to improve road safety outcomes. The study was conducted with
reference to established adult learning principles as a starting point, however was
otherwise exploratory in nature. The results section therefore documented themes
that resonated from the data as they emerged in accordance with the three key issues
explored in the study relating to RQ2. The discussion that follows endeavours to
reflect on the findings to specifically address each of the three issues in turn.
Limitations of the study as well as implications for the Three Steps to Safer Riding
are also discussed.
3.5.1 How Congruent are Existing Training Practices with Adult Learning
Principles?
Consistent with established adult learning principles across other domains it
was found that motorcyclists have a range of individual learning needs. It appears
that participants’ individual learning needs were predominantly met in the sample
91
and the information and skills taught during the course were conveyed well to
trainees to facilitate their learning. It is apparent that the instructors identified
individual learning needs well and employed a range of teaching techniques to
address these. Central to this process was rapport building with trainees which
appeared to have established the required positive perception of the learning
environment as prescribed by Ramsden (1997). In comparison to Bailey’s (2003)
study where driving instructors reported incidental use of the learner-centred
approach, riding instructors in the current study appeared to have a more systematic
and dedicated commitment to the learner-centred approach according to students.
Whilst this approach to teaching is not formally stated by the particular training
organisation, the organisation does have a strong focus on identifying and addressing
individual learning difficulties and is flexible in its approach to teaching to meet
individual needs.
The implication of this is that training should have been an engaging and
fulfilling experience for trainees. This generally appears to be the case in this current
sample. However, some trainees expressed concern that they did not feel ready to
ride unaccompanied at the end of their training although they had been deemed to
have met all the licensing competencies. It appears that for these riders there was
often not sufficient transition from the off-road training to on-road riding. Over-
learning is a well established principle of adult learning that is required for the
mastery of new concepts or skills (for a review see Delahaye, 2005). Essentially
learners develop expertise on particular tasks from repeated practise beyond mere
initial performance of the task. Unfortunately it appears that the concept of over-
learning was sometimes not applied in regard to the on-road component of training.
Trainees expressed different learning motives regarding why they attended
the course. Such learning motives potentially influenced how they engaged in
training and whether information was likely to be processed at a deep or surface level
(Beaty et al., 1997). This is of particular concern where participants expressed that
they initially attended training simply with the goal of obtaining their licence.
However, in contrast with what might be expected from previous adult learning
research it appears that the course contained enough information of interest to
sufficiently engage some students with extrinsic motives in the learning process.
92
Unfortunately, the qualitative method could not gauge to what extent participants
actually processed training information.
A range of learning styles were expressed by the trainees and it appears that
these were generally accommodated by the use of different presentation modes and
the explicit linking of classroom information to practical riding sessions. Therefore,
for some riders the classroom sessions were valuable in developing their theoretical
understanding of some of the basic concepts (e.g. braking distance and
countersteering) prior to actually engaging in the practical riding sessions, while
others learnt more from the tactile ‘hands on” approach during practical sessions or
from modelling of appropriate techniques by the instructors. This is consistent with
the existing body of literature regarding different styles of learning for adults in other
domains (Delahaye, 2005).
In summary, the findings suggest that learning for adults in the context of
motorcycle rider training is consistent with established principles of adult learning in
other domains with the exception of how extrinsic motives for learning may have
influenced engagement in the learning process. The riding instructors in this
particular study appear to have predominantly addressed individual needs and
appropriately applied teaching techniques to facilitate effective learning. The
exception to this was on-road riding for some participants, which may potentially be
a product of the licensing competency requirements as discussed in the following
section.
3.5.2 How Does the Licensing Context Influence Delivery Practice for Training
and Student Expectations of the Course?
One of the findings of the study was that participants perceived several
aspects of the existing Q-Ride licensing system in Queensland at the time as not
being ideal for maximising the learning potential of rider training. Some participants
thought training may be more effective if there was a requirement for either training
at an earlier stage to obtain a learner permit or for follow-up training three to six
months after initial licensing. While a variety of rider training courses are actually
available for voluntary enrolment through training organisations at any stage of the
riding career, participants seemed to inherently link training with licensing during
discussions. It appears that some riders are unlikely to be willing to invest in their
93
safety by undertaking post-licence training, however may be motivated to do so if
this was a legal requirement as part of the licensing within a graduated system.
A requirement for mandatory rider training at several stages within the
licensing system reconciles both with graduated licensing principles and the Hurt et
al. (1981) study that asserted that skills may decay if not otherwise utilised or
reinforced. It also allows for incremental learning in terms of progression from basic
riding skills during initial training to more advanced skills and concepts in
subsequent training and, additionally, may decrease the potential for information
overload that some participants appear to have experienced during Q-Ride. All other
Australian states with the exception of Western Australia have a requirement for pre-
learner training, with further training options at the provisional (restricted) licence
stage. The perceptions of trainee riders in the study suggest that such a licensing
system may be more beneficial to their learning. This lends support for the notions of
spaced learning and over-learning via a second “dose” of training. Further support
for second phase training for motorcyclists has been found in Austria (KfV, 2007:
Gatscha, Brandstaetter, Kaltenegger, & Pripfl, 2008).
The incentive within the Q-Ride licensing system of allowing applicants who
held a car driver licence for at least three years was also of concern to participants in
this study. This incentive is against the principles of graduated licensing and
intuitively a progression from smaller capacity machines (with a power to weight
limit) may provide a novice riders an opportunity to master riding skills before
progression to larger machines. A limit on engine capacity and power for novice
riders may also result in less people initially commencing riding that may otherwise
be attracted to take risks on more powerful machines. Since completion of this study
the Queensland Government has actually introduced such a limit in the form of the
Learner Approved Motorcycle Scheme (LAMS).
Another aspect of concern expressed by participants was that they thought
further issues should have been addressed during training, and that the on-road riding
component was not comprehensive enough. This is perhaps a reflection of the
licensing competencies. As the training course is designed to equip trainee riders
with the skills and information to pass the licence assessment, then this suggests
scope for expansion of the existing licence competencies within the Q-Ride
competencies. Rider trainees’ initial expectations of the course were varied with

94
many not knowing exactly what Q-Ride contained, however it is evident from the
data that many riders did expect more on-road riding particularly. The data implied
that this is perceived as more beneficial for safe riding in the initial stages of
unaccompanied riding. Such safety concerns are discussed further in the following
section.
3.5.3 How Can Rider Training be Informed by Student Perceptions and
Experiences to Improve Safety Outcomes?
While participants reported that effective learning took place, it is important
to consider the validity of knowledge and skills learnt during training in terms of
how it relates to actual post-licence on-road riding. That is, what safety outcomes
were achieved from training? Evaluations of rider training have generally not found
support for it in terms of crash reduction (see review by Haworth & Mulvihill, 2005).
This current study reported mixed results for actual riding following licensing. Many
participants indicated that training was useful for avoiding potential crashes (by
applying roadcraft). Knowledge and skills from the course were applied once
licensed and participants overwhelmingly found these of value for their safety.
However, in contrast there were several reports of crashes and near misses where
training was perhaps not of value in an applied sense regarding the prevention of
these incidents. This suggests either a lack of learning transfer, a decay over time of
information learnt, or that other factors not addressed in training (e.g. of an
attitudinal or motivational nature) influenced rider behaviour once licensed. Single
dose training is therefore arguably not enough to always keep riders safe in the traffic
environment unless skills are practised, honed and tempered with self-control.
The second theme generated from this study suggested that the most salient
information from training is that which has been subsequently experienced on-road.
There is an unfortunate paradox that exists in relation to learning to ride a motorcycle
and the risks that the on-road traffic environment presents. It is important for all road
users to gradually gain experience in a range of road environments and conditions so
that appropriate driving or riding schemas are developed over time. A lack of
experience has been shown to be one of the key issues to impact on novice rider
safety (Rutter & Quine, 1996; Mullin et al, 2000). Whilst the learner stage has
consistently been shown to be the safest phase for car drivers compared to
subsequent provisional stage driving, the same cannot be said for motorcyclists. For
95
example, in New South Wales during 2007 learner motorcyclists were involved in
8.8% of all motorcycle injury crashes compared to 8% of provisional motorcycle
licence holders (RTA, 2008). Hence, there is little difference in the safety of riders in
both licensing phases. In contrast, learner car drivers were involved in 1.1% of all car
driver injury crashes compared to 18.2% of provisional car licence holders.
Training endeavours to provide riders with some experience prior to licensing
in order to decrease riders’ likelihood of crash involvement, however in the current
study participants indicated a general lack of on-road riding during training. Hence,
to improve the safety of novice riders, the Q-Ride training program ideally needs to
be far longer in overall duration for some riders, with a particular focus on extending
the on-road component. Whilst learning roadcraft was acknowledged as a valuable
aspect of training for riders with some previous experience, it may be that absolute
novices require far more training than they currently receive to confidently apply
roadcraft when unaccompanied. Haworth and Smith (1999) asserted that a duration
of four complete days training was required for novice riders. Discussions with the
industry partner training organisation indicate that the majority of riders with no
previous experience take 15hrs to meet all the licensing competencies within Q-Ride.
Whilst this timeframe is consistent with other novice motorcycle rider training
programs (e.g. the MSF BasicRider course) it remains questionable whether in fact
this is sufficient to learn and retain all relevant riding information to protect riders
once licensed. In contrast, the Initial Rider Training project in Europe appears to
have a far greater focus on progressively introducing riders to the on-road
environment.
Having examined the data in this study it is also important to note that student
perceptions of safe riding are largely based on their own personal experiences which
may not necessarily constitute actual safe riding. However, it is the subjective
experiences of riders that may ultimately shape their style of riding and on-road
behaviour in the future. Hence, it is imperative to address such issues.
3.5.4 Limitations
This study had several limitations that must be considered when interpreting
the findings. Firstly, because participation was voluntary it is possible that sampling
bias existed and only people who viewed their training more favourably or were
interested in the topic attended. However, when recruiting participants it was

96
stipulated that participants would be reimbursed $50 for their time and that all
information was confidential and anonymous. This may have potentially attracted
some people to participate in the study who otherwise may not have been motivated
to do so. This measure was incorporated to combat the abovementioned limitation
and increase the representativeness of the sample in regard to the overall potential
pool of riders who had completed the training course. Secondly, participants were
sampled from only one training organisation (albeit with a large and diverse client
base). The study was undertaken to inform development of the Three Steps to Safer
Riding intervention and therefore caution must be employed regarding generalisation
of the findings to all motorcycle rider training programs. Thirdly, although
participants shared their perceptions of training, the qualitative method cannot
measure actual levels of learning (i.e. participants can only report what they have
learnt, not what they don’t know or have not learnt). With these limitations in mind
there were several implications for the development of the Three Steps to Safer
Riding intervention.
3.5.5 Implications for the Three Steps to Safer Riding Intervention
The findings suggest some implications for motorcycle training and licensing
in general which must be interpreted with respect to the possible sampling issues as
discussed in previous sections. However, the study was central to the development of
the Three Steps to Safer Riding intervention with the primary aim of investigating
the existing training delivered by the industry partner organisation and informing
future program delivery protocols within the specific context of Q-Ride.
To this end, the study found that the riding instructors generally possessed the
requisite skills to deliver the proposed intervention. It appears that the instructors
were already utilising a range of teaching techniques and presentation modes that
were determined by the project team to be required for effective delivery of the
intervention. Facilitating group discussions and accommodating a range of learning
styles within a learner-centred approach were central to the delivery strategy for the
Three Steps to Safer Riding program and, as such, the findings indicated that training
of the instructors could focus predominantly on content issues to ensure a sound
understanding of the proposed intervention concepts.
Another implication for the future intervention was that due to the disparity in
the information retained from training across individual riders the program could not
97
be too exhaustive as some riders would be unlikely to be able to process and retain
the volume of information presented in addition to the existing training information.
This also gave credence to another dimension of the intervention delivery strategy in
the form of the need to extend learning beyond the actual face-to-face intervention
program (via a take-home information booklet and/or DVD). Overall, this initial
study confirmed the viability of delivery of the intervention program by riding
instructors (rather than behavioural scientists) and also highlighted some of the
potential barriers for the success of the program, such as the ‘single dose’ exposure
to the new form of training within the constraints of Q-ride.
3.6 Chapter Summary
Motorcycle training, like other learning situations for adults, must
accommodate a range of individual needs. A flexible learner-centred approach is
well received by trainees and appears to foster genuine understanding. However,
much can still be done to improve learning opportunities for motorcyclists by
reinforcing and extending their learning beyond the initial licensing stage. For
example, at a broader level, second phase training at three to six months following
licensing was perceived of value by the participants and has been found beneficial to
safety in another licensing system.
In regard to the specific development of the Three Steps to Safer Riding
intervention, the study confirmed that a structured program could likely be suitably
delivered by the existing motorcycle riding instructors. A range of teaching
techniques consistent with a learner-centred approach appear to have been employed
by instructors. This study provided a valuable platform for understanding the
learning needs of motorcyclists and from which implementation of the Three Steps to
Safer Riding could progress.

98

99
Chapter 4: Study 2 – An empirical investigation of the effects of an existing
motorcycle rider training program on psychosocial influences on risky riding
4.1 Introductory Comments
This chapter documents the second study undertaken within the overall
program of research reported in this thesis. As with Study 1, this study was
undertaken to investigate aspects of the existing motorcycle rider training program
delivered by the industry partner organisation prior to the implementation of the pilot
intervention. This study employed a quantitative method via self-report
questionnaires to measure psychosocial and socio-demographic influences on risky
riding for motorcyclists attending the licence training course. As such, it established
a baseline comparison cohort for evaluation of the planned Three Steps to Safer
Riding pilot program (examined in Chapter 5) and highlighted aspects of the existing
training that could be improved by the proposed pilot intervention program.
To frame Study 2 within the overall project aims, this current chapter initially
outlines the evaluation strategy and practical concerns associated with conducting the
evaluation. Three stages of data collection for Study 2 participants are then examined
involving: self-report data gathered immediately prior to training (T1); immediately
following training (T2); and at approximately 24 months post training (T3).
While most evaluation studies do not devote a chapter to the findings of the
comparison group, this is done in this instance as an examination of attitudinal and
motivational factors within traditional rider training programs has not been
previously reported in the literature. Hence, as a standalone study there are important
implications for rider training generally, as well as the data from this study being
used to form a comparison group for evaluation purposes. Additionally, as the Three
Steps to Safer Riding program is an adjunct to (i.e. added onto) the standard training
program examined here, it was important to comprehensively document the effects
of the baseline condition to which the new program was to be added. The following
section provides an overview of the role the comparison group had in the overall
evaluation strategy and provides detail of how data collection and research protocols

100
for the comparison group needed to be carefully considered for the future application
of the Three Steps to Safer Riding program (intervention/treatment group).
4.2 Development of an Evaluation Strategy and Research Design
The formative evaluation had two main components: 1) to determine the
magnitude of effect of the Three Steps to Safer Riding pilot on attitudinal and
motivational variables and; 2) to determine if this effect could be likely improved by
refining aspects of implementation and delivery. Therefore it was important to design
a framework to support these aims by establishing a treatment group and comparison
group to determine the effect of the program and, additionally, to incorporate an
examination of process issues.
Developing research methodology in applied settings such as driver and rider
education is perhaps one of the greatest challenges in terms of scientific rigour and
the subsequent value that can be assigned to any findings. Whilst random selection
and random allocation to experimental groups represents best practice for
experimental research, this is rarely achieved in such applied settings. It is not
possible to deny training to those who wish to undertake it for licensing purposes,
nor force others to undertake training within a licensing system that does not
mandate training. Hence, the evaluation of program effect did not endeavour to
compare riders who chose to train with those who chose not to (as this would be
subject to self-selection bias). Rather, it employed an experimental ‘temporal block’
design to compare treatment and comparison group cohorts of riders who had all
voluntarily chosen to undertake training. Whilst participants could not be randomly
assigned to experimental groups, they were blind as to which training they received
(standard program or intervention). Each cohort was further tracked through
longitudinal follow-up. Specific details of the research design are further elaborated
in the following section.
4.2.1 Evaluation Strategy for Program Effect on Factors Underpinning Risk
Taking
The main considerations and challenges when developing this strategy were:
1) to incorporate a comparison group, yet avoid self-selection bias; 2) to obtain a
suitable sample size for the required analyses; 3) to incorporate a suitable theoretical
framework to guide evaluation and; 4) to measure riding exposure and self-reported

101
behaviour over time in addition to the attitudinal measures administered immediately
before and after training.
In consideration of selecting a suitable comparison group, self-selection bias
would normally be associated with comparing the proposed intervention to a group
that received no training in a naturalistic setting using the quasiexperimental method.
Such bias could compromise the validity of any findings since many differences
could exist between those who volunteer for training and those who do not. Indeed, a
range of demographic and motivational differences have been found between such
groups of motorcyclists in Queensland, Australia, in previous research (Watson et al.,
2003). This research therefore utilised only riders who had already elected to
undertake training and applied the intervention/treatment to one group, while leaving
the comparison group to receive the ‘standard training’ that was already being
delivered by the industry partner organisation. Therefore, a mixed mode design was
required to track participants over time and also facilitate between-group
comparisons for evaluation.
Several designs were considered for this purpose as part of the evaluation
strategy for quantitative data to determine preliminary short-term effects of the
program. For example, Senserrick and Swinburne (2001) used a waiting list design to
evaluate a driver education program. This design included measurement at baseline
for the control and treatment group then training was conducted for half of the
participants while the other half were put on a waiting list, thereby serving as
controls. Questionnaires were administered to the treatment group and waiting list
group to determine the immediate effects of the intervention. The waiting list group
then also received training and further data was gathered. Unfortunately, while this
type of design serves to compare attitudinal variables in relation to risk taking at the
time of training, it precludes effective comparisons of the groups at follow-up as all
participants eventually receive training. As research for this project aimed to follow
up participants over an extended time period to determine actual riding behaviour
and measure riding exposure, such a design was prohibitive.
Alternatively, the strategy that was initially considered most appropriate for
the evaluation involved using two different training sites of the same industry partner
organisation to form concurrent experimental and comparison sites. Baseline
comparisons across sites for the variables of interest could determine any pre-
102
existing differences between participant populations at each site to ensure suitable
comparisons following training. Such a design could limit potential seasonal and
other extraneous temporal influences as data would be gathered concurrently across
conditions. This would allow for the use of selected training instructors to
exclusively deliver the training program specific to their site. This methodology was
initially trialled for this study until commercial difficulties forced the closure of one
of the two sites. That is, insufficient enrolment numbers were experienced at one of
the sites, which impacted on the financial viability of continuing training at the site.
This was an unfortunate setback, highlighting the difficulties associated with applied
research in commercial settings.
Therefore, a revised strategy for evaluation of program effects resulted in two
different training programs (standard and intervention) being delivered at different
times (i.e. temporal blocks) at the same training site to form two groups; the
treatment and comparison cohorts. As the number of enrolments at the training
facility were steady and provided sufficient sample size for the research, this
appeared to meet one of the evaluation concerns previously outlined. Study 2
reported in this chapter includes data gathered from the first block of training
(comparison cohort). Study 3a, outlined in Chapter 5, includes data from the second
block of training (treatment cohort) and compares results across experimental
cohorts.
The design had the benefit of minimising potential self-selection biases as all
participants were motivated to choose training of their own accord at the same site.
This satisfied another of the initial evaluation concerns. Additionally, whilst all
participants consented to be part of the research, they were unaware of the
experimental condition to which they were assigned (i.e. single blind design).
As the research design prescribed training in temporal blocks to the different
conditions there was potential for seasonal effects and the influence of other
extraneous variables that may impact at different points in time. Control measures for
this limitation are outlined in Section 4.6.5 in this chapter. Upon consideration of all
of the aforementioned issues this outcome evaluation strategy was deemed most
appropriate (when considering the applied constraints) for commencement of the
quantitative stage of research as it allowed for all of the evaluation concerns outlined
at the start of this section to be satisfied.
103
4.2.1.1 The TPB as an Evaluation Framework
The Theory of Planned Behaviour provided a basic starting point for the
theoretical underpinning of the evaluation for program effect. Watson et al. (2007)
had previously utilised the TPB to investigate the psychosocial influences on risky
riding by motorcyclists and established which TPB variables along with other
influences would be most useful to guide a rider education program focussing on
reducing risk taking as previously shown previously in Figure 2.4. Accordingly, such
variables formed the basis for evaluation measures for this study and the subsequent
pilot intervention study.
However, it must be noted that the evaluation was not planned as a program
of research to test the TPB constructs per se, but rather for those variables identified
as most useful in previous research to provide a framework for the evaluation of
program effect. With this in mind, the TPB construct of perceived behavioural
control was not shown to be a strong predictor of the actual risky riding behaviours
of interest in the Watson et al. (2007) study, and therefore did not form a central
focal point for the intervention or evaluation of this current research. However, the
constructs of thrill seeking (sensation seeking) and aggression were found to be
significant predictors of riding behaviours in the Watson et al. (2007) study and
therefore were added to the TPB model for evaluation purposes.
One strength of the application of the TPB in this current context is that it
was planned to collect data at three points of time for each participant. Using this
strategy, self-report data collected at the start of training (T1) from each participant
could be compared to data collected at the end of training (T2) to ascertain changes
in attitudes, openness to social influence, perceived behavioural control, propensity
for thrill seeking, and intentions to engage in future risky riding as a function of
training. Data collected upon follow up 24 months post training (T3) could provide
the longitudinal behavioural link to ascertain if intentions expressed at T2 transposed
to actual riding behaviour maintained over time.
4.3 Study Aims & Research Questions
In accordance with Objective 2 as outlined in Chapter 1, this study aimed to
investigate the effect of an existing motorcycle rider training program by the industry
partner organisation on attitudinal and motivational influences on risk taking. This
104
aimed to inform development of the Three Steps to Safer Riding pilot program by
establishing how the existing industry partner program could be further developed to
address risky riding. Data from the participating cohort of riders in this study would
also be used to form a historical comparison group which could be compared to the
later pilot program cohort (i.e. treatment group).
Additionally, a further pragmatic aim of this stage of the research was to
ascertain the suitability of the proposed self-report measures for application within a
commercial setting. This required consideration of issues such as completion time for
questionnaires and face validity of questionnaire items for participants. The
development of an evaluation strategy and consideration of specific measures to be
used was an integral facet of the scientific rigour of the overall project. As such,
establishing suitable research protocols in this study had significant implications for
the proposed intervention pilot.
4.3.1 Research Questions
Previous research regarding the efficacy of rider training has primarily
focussed on the potential effects on crash involvement and traffic violations. This
current study assesses a range of intermediate variables relating to risk taking such as
attitudinal and motivational variables and, as these have not been previously used in
the context of rider training, the study was largely exploratory in nature. As the
cohort of participants in this study received no specific experimental treatment in
regard to addressing risk taking, expectations of the potential effects on attitudinal
and motivational variables were difficult to specify. Hence, this study was not driven
by hypotheses with specific predicted outcomes, but rather by an open exploration of
the study-specific research issues. These related to overarching research questions
RQ3 and RQ4 stated in Chapter 2 (Table 2.2). They form the basis for comparison to
the Three Steps to Safer Riding pilot program examined in Chapter 5. However, the
research questions noted below also have value for this standalone study as research
into rider training programs are relatively rare and the knowledge gained from such a
study can contribute to the collective knowledge about the effects of rider training
programs. Three specific issues were examined:
1. To inform RQ3 - does the existing training have an immediate positive or
negative effect on self-reported attitudinal and motivational factors that may
influence risky riding?
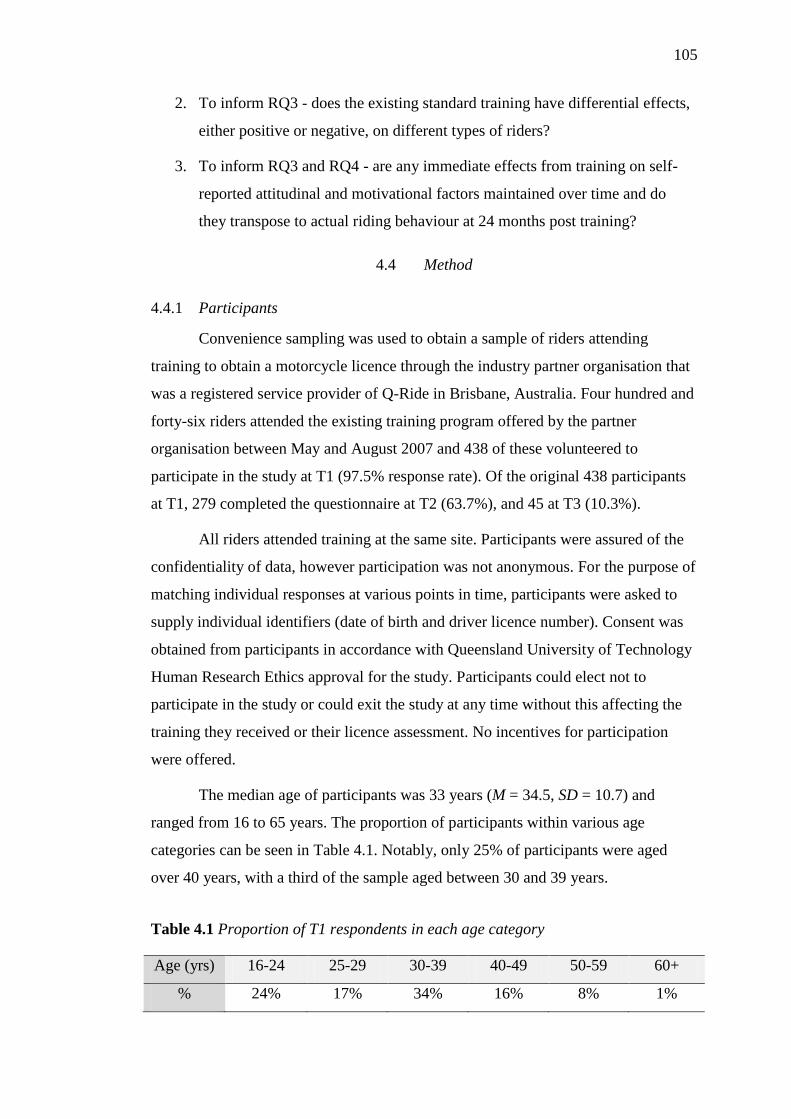
105
2. To inform RQ3 - does the existing standard training have differential effects,
either positive or negative, on different types of riders?
3. To inform RQ3 and RQ4 - are any immediate effects from training on self-
reported attitudinal and motivational factors maintained over time and do
they transpose to actual riding behaviour at 24 months post training?
4.4 Method
4.4.1 Participants
Convenience sampling was used to obtain a sample of riders attending
training to obtain a motorcycle licence through the industry partner organisation that
was a registered service provider of Q-Ride in Brisbane, Australia. Four hundred and
forty-six riders attended the existing training program offered by the partner
organisation between May and August 2007 and 438 of these volunteered to
participate in the study at T1 (97.5% response rate). Of the original 438 participants
at T1, 279 completed the questionnaire at T2 (63.7%), and 45 at T3 (10.3%).
All riders attended training at the same site. Participants were assured of the
confidentiality of data, however participation was not anonymous. For the purpose of
matching individual responses at various points in time, participants were asked to
supply individual identifiers (date of birth and driver licence number). Consent was
obtained from participants in accordance with Queensland University of Technology
Human Research Ethics approval for the study. Participants could elect not to
participate in the study or could exit the study at any time without this affecting the
training they received or their licence assessment. No incentives for participation
were offered.
The median age of participants was 33 years (M = 34.5, SD = 10.7) and
ranged from 16 to 65 years. The proportion of participants within various age
categories can be seen in Table 4.1. Notably, only 25% of participants were aged
over 40 years, with a third of the sample aged between 30 and 39 years.
Table 4.1 Proportion of T1 respondents in each age category
Age (yrs) 16-24 25-29 30-39 40-49 50-59 60+
% 24% 17% 34% 16% 8% 1%
106
The vast majority of all participants were male (78.7%) which is
representative of Q-Ride licence applicants in general (Haworth, Rowden, &
Schramm, 2010). The proportion of males is somewhat lower than that found in most
motorcycle licensing generally, perhaps because of the voluntary nature of Q-Ride
(i.e. females more likely to choose Q-Ride training than Q-Safe licence testing). This
is consistent with findings by Watson et al. (2003).
4.4.2 Materials
4.4.2.1 Questionnaires
Several self-report questionnaires were developed for the study. Two
marginally different paper-based questionnaires were utilised at the commencement
of training: 1) the Start of Training New Rider Questionnaire and; 2) the Start of
Training Existing Rider Questionnaire (refer Appendix 4.1) The two questionnaires
predominantly measured psychosocial influences on risky riding, demographic
information, and driving and riding history, with the exception of some items relating
to previous riding experiences being excluded from the new rider version as these
participants were yet to gain any actual riding experience. Scales common to both
instruments were: thrill seeking while driving a car; attitudes to risky riding; the
perceived influence of family and friends; the perceived influence of riding peers;
and intentions for future risky riding.
A third paper-based measure, the End of Training All Riders Questionnaire
measured the same psychosocial concepts of interest as the questionnaires
administered at the start of training, however without the need to once again gather
demographic or traffic history information. A fourth measure, the Motorcycle Rider
Training Questionnaire (refer Appendix 4.2) was applied online at follow-up 24
months post training and aligned with the core concepts in the start and end of
training questionnaires, however included additional items to assess self-reported
risky riding behaviour. This web-based measure was hosted on the Queensland
University of Technology server to avoid privacy issues relating to the confidential
nature of information that might arise if hosted on external servers.
Many questionnaire items employed in this study were derived from the
Rider Risk Assessment Measure (RRAM) developed by Watson et al. (2007) which
107
was originally based on TPB concepts and utilised some items from the Driver
Behaviour Questionnaire (DBQ; Reason, Manstead, Stradling, Baxter & Campbell,
1990) modified for motorcycling. Scales included in this program of research that
were derived from the RRAM (although sometimes labelled differently) were:
Intentions to Engage in Risky Riding, Motorcycle Thrill Seeking, Rider Aggression,
Family and Friends Influence, Riding Peer Influence, Group Riding, Impaired
Riding, Extreme Speeds and Stunts, Pushing Limits, and Bending Road Rules. The
RRAM has been shown to have sound subscale reliability for the aforementioned
concepts relating to risky riding. However, development of the RRAM remains in its
infancy and whilst core concepts have been shown to predict risky riding behaviour
in the Watson et al. study, it has yet to be shown to predict crash involvement for
motorcyclists. This is due to the limited amount of cases used to standardise the
instrument to date and the relatively large amount of cases required to provide
sufficient statistical power for the prediction of crash involvement. Whilst the
Motorcycle Rider Behaviour Questionnaire developed by Elliott et al. (2007) was
considered for use in this study, the RRAM was developed using an Australian
sample and, hence, was considered most appropriate. Further details regarding the
development and validation of the RRAM can be found in the Watson et al. (2007)
report to the Australian Transport Safety Bureau.
Several specific scales used in this research do however require further
clarification. The construct of thrill seeking was measured using the Thrill Seeking
subscale of the Driver Stress Inventory (Matthews, 1997) which has been validated
for car drivers as a predictor of crash involvement (Matthews, 1997) and self-
reported aberrant driving (Rowden, Matthews, Watson, and Biggs, 2011). An 8-item
version of the scale was modified by Tunnicliff (2005) for use with motorcyclists and
labelled as ‘Sensation Seeking’. Tunnicliff found it to be a strong predictor of
intentions to engage in risky riding. Subsequently, Watson et al. (2007) found the
scale to be a strong predictor of a range of risky riding behaviours. The title of the
scale used in the current program of research (Motorcycle Thrill Seeking) defined it
as a propensity for thrill seeking which may be influenced by situational factors as
well as personality factors (consistent with the view of Matthews) rather than solely a
personality construct of sensation seeking.

108
In addition to items used in the RRAM, the Safety Attitudes scale used in this
program of research was primarily derived from an earlier study examining
attitudinal and motivational issues for risk taking by motorcycle riders (Watson et al,
2003). Watson et al. found this scale provided a sound holistic measure of rider
attitudes to road safety issues. Younger riders, those with previous off-road riding
experience, and those that chose not to attend voluntary pre-licence training were
found to have poorer attitudes to safety in the research by Watson et al. (2003).
However, the scale has not been validated in terms of crash involvement.
Other items relating to theoretical points of interest (e.g. stages of change)
and proposed intervention concepts (e.g. feelings and emotions) were specifically
created for the questionnaires in this program of research to investigate the utility of
such concepts in this applied setting. For the stages of change, a single item to
measure each level (e.g. contemplation and action) was created due to the length of
the overall questionnaire and concerns regarding completion time. The stages of
change were not a key focus of the research, however previous researchers (see. Nigg
et al., 1999; Cook & Perri, 2004) have successfully used single items at each level
for the stages of change component of the Transtheoretical Model across a range of
behaviours.
Additionally, several other items to assess motives for riding and motives for
attending training were included in the start of training questionnaires. These were
informed by research by Watson et al. (2003). Items assessing participants
perceptions of what was learnt from training and aspects of training delivery were
included in the end of training questionnaire.
4.4.2.2 Consent Forms and Information Sheets
In addition to the self-report questionnaires information and consent forms
were required to outline details of the study to participants and obtain their formal
consent for participation. Foolscap size envelopes were also required for participants
to place their completed questionnaires in at the start and conclusion of training.
4.4.2.3 Introduction to Training Video
To avoid potential demand characteristics of the licensing situation and to aid
in the provision of information regarding the nature of the study, a video was also
produced jointly featuring the Chief Instructor from the partner organisation and the

109
Chief Investigator of the research project. The video also outlined the nature of the
proposed follow-up of official crash and offence data through Queensland Transport
(which was not specifically part of this study, rather part of the broader project).
4.4.3 Procedure
4.4.3.1 Partner Organisation Preparation
Initially, the questionnaires were piloted by the researcher with 14 students of
the partner organisation over two separate days during training. Informal feedback
regarding the understanding of questionnaire items was sought from the students
immediately upon completion of the questionnaires. Time for completion was also
measured to assure the feasibility of their application on a daily basis within the
training context.
Bundles of blank questionnaires were then delivered to the partner
organisation to facilitate data collection each day. However, as the study progressed
and procedures were streamlined, electronic copies of the study materials were
provided to the partner organisation for on-site production of the questionnaires, with
envelopes delivered periodically by the researcher.
As the study involved data collection at the training facility both at the start
and finish of training it was decided in consultation with the industry partner that the
riding instructors would administer the paper-based questionnaires on a daily basis to
those course participants who volunteered to be part of the study. The Chief
Instructor, who had been integrally involved in all stages of project development,
informed his staff of the nature of the research and their involvement in data
collection.
As understanding and support for the project by the riding instructors was
imperative, a ‘train the trainer’ session was conducted by the researcher with all
instructors, whereby a typical start of training scenario was role-played with the
instructors acting as students. They were each required to complete the Start of
Training Existing Rider Questionnaire in full in order to familiarise themselves with
the content and to raise any questions they had regarding questionnaire items or any
potential issues they thought may arise for students.

110
4.4.3.2 Data Collection
The study included data collection at three points of time: the start of training;
the end of training (once licence competencies were met); and at follow up,
approximately 24 months after licensing (this ranged depending on the exact month
each rider finished the course).
The collection of data was facilitated by the riding instructors at the start (T1)
and end (T2) of training. Data was gathered on a daily basis in concert with the
provision of training from May 2007 to August 2007. At the commencement of
training the riding instructor would play the information video to students then ask
them to read the information sheet and complete the consent form and questionnaire
if they wished to participate. Training was scheduled in a manner whereby new
riders and existing riders were identified based on their previous riding experience at
the time of booking into the course and each group trained separately on consecutive
days. This enabled the correct questionnaires to be administered to the relative group
in isolation to avoid potential data contamination (e.g. where a rider with some
previous experience may be given a ‘new rider’ questionnaire).
Instructors were directed not to bias participant responses and leave the room
when possible while participants were completing the questionnaires, although
occasionally instructors were required to clarify questionnaire items or assist
participants with literacy issues. Instructors also verbally reminded participants (in
accordance with the information sheet and video) to be as honest as possible with
their responses, that their responses would not affect their chance of obtaining a
licence, and to seal their completed questionnaires in the envelopes provided to
ensure confidentiality.
Training is competency based within the Q-Ride motorcycle licensing system
in the state of Queensland therefore, whilst participants completed practical training
in groups of two to five for the first day, some riders required further training to meet
the assessment competencies. The End of Training questionnaires were therefore
individually administered to participants by the riding instructors once all licence
competencies had been met by that individual. All completed paper-based
questionnaires were collected from the industry partner by the researcher fortnightly
for data entry.
111
Web-based data collection
Follow up data (T3) for this cohort was collected using a web-based survey.
The survey went ‘live’ for two months during June and July 2009. All participants
from T1 were contacted using both email and mobile phone text (SMS) to inform
them of the follow up study. The messages also included the web-link to the survey.
Reminder texts and emails were then sent to all prospective participants one month
after the original contact. Data gathered from the study was then linked to data at T1
and T2 through individual licence numbers provided at the time of responding.
4.4.4 Data Analysis and Data Cleaning
All data analyses were performed using the SPSS statistical software
package. This section outlines procedures that were undertaken to clean the data
prior to analyses then further highlights the specific statistical methods employed for
the various analyses that were conducted.
Missing data was replaced where appropriate (e.g. for continuous variables
but not for categorical data). As the majority of data analysis for the study involved
scale scores for the key concepts of interest (e.g. attitudes, thrill seeking, intentions)
scale scores were computed and missing values for each scale were replaced with the
individual case mean score per item for the respective scale. For example, if a
participant responded to a minimum of five items in an eight item scale then the
remaining three missing values were replaced with the individual case mean from the
five valid items. Where participants responded to less than 60% of scale items,
missing data was not replaced.
The distribution of scores for each scale was examined to identify outliers
and skew that may be problematic for data analysis. Non-parametric analyses were
performed where highly skewed distributions where found and the assumption of
normality was breached. Outliers beyond three standard deviations were examined
on a case by case basis and excluded from the analyses where appropriate.
As this chapter examines only the comparison cohort that were exposed to the
industry partner’s standard rider training program, data analysis was undertaken
mainly with a view to inform development of the proposed intervention rather than to
examine all possible relationships between all variables. This is reflected in the study
research questions. Data analyses were primarily undertaken using repeated-

112
measures t-tests to compare variable scores for each participant at different points in
time. Independent means t-tests were used to compare scores in key variables
between subgroups (e.g. new riders vs existing riders; male vs female). For the
purpose of statistical testing an alpha level of .05 was assumed unless otherwise
stated. Statistical power was considered when determining sample size for the study
and the requisite analyses undertaken. The issue of statistical power in relation to
analyses undertaken for the follow up component of the study at T3 is further
discussed in Section 4.5.4 as a low response rate was encountered.
When reporting findings there is a predominant focus on reporting probability
scores, test values, and effect sizes for statistically significant results due to the
considerable amount of analyses undertaken. Non-significant findings are noted as
such, however where these are many, specific values for probability scores, test
values, and effect sizes for non-significant findings are not reported.
4.5 Results
4.5.1 Scale Reliability
As the key variables of interest for analysis were composite scales, it was
important to examine the reliability of each scale to ensure that items within each
scale were conceptually related. The Cronbach’s alpha of each scale is shown in
Table 4.2 as measured at T1, T2, and T3. All scales at T1 showed acceptable
reliability upon original analyses with the exception of Safety Attitudes where one
item was subsequently removed to improve reliability. This resulted in a 19-item
scale with Cronbach’s alpha of 0.74 which was considered acceptable. Accordingly,
the 19-item Safety Attitudes scale was used for all analyses at T1, and T2. All scales
showed acceptable Cronbach’s alpha at T2. A 10-item version of the Safety
Attitudes scale was used at T3 for pragmatic reasons relating to questionnaire
completion time. The 10 items were derived from the original version using
confirmatory factor analysis and subsequent reliability analysis.
While the scales applied at T1 and T2 related to psychosocial influences on
risky riding, scales at T3 primarily measured self-reported riding behaviour. Poor
internal consistency was found for the Extreme Speeds and Stunts, Impairment, and
Group Riding behavioural scales at T3, limiting their utility for further analyses. It is
likely that internal consistency would have been improved with increased sample
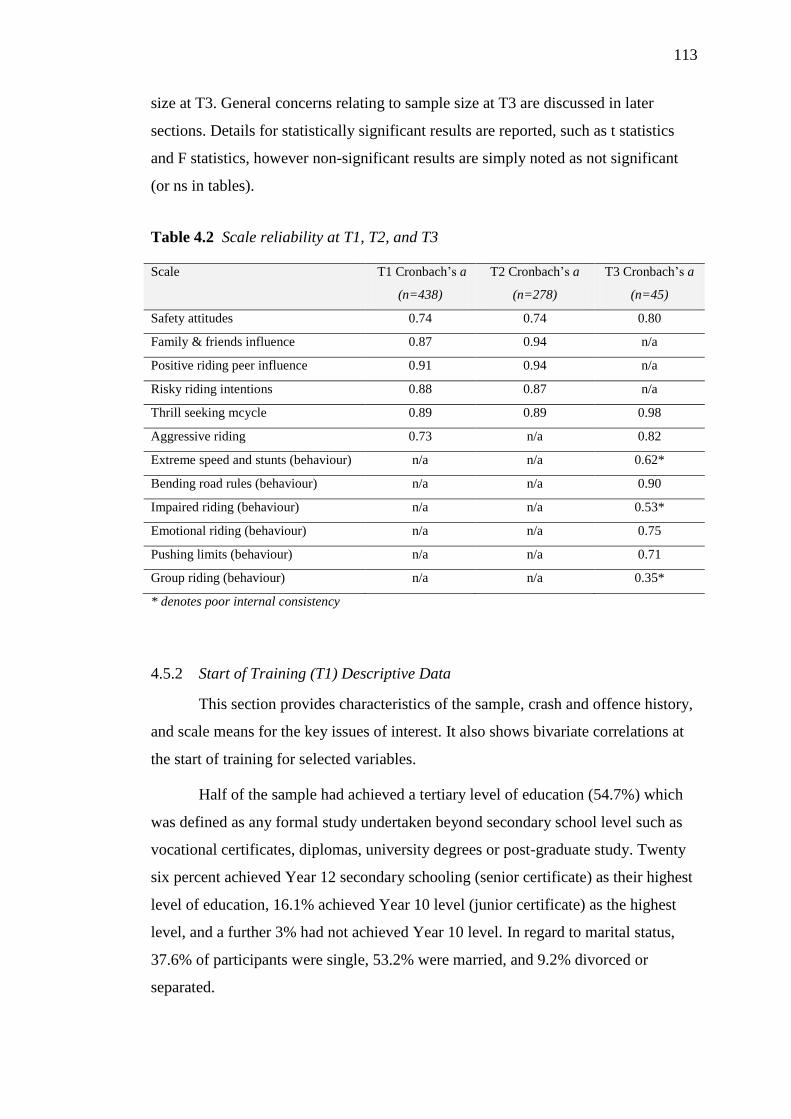
113
size at T3. General concerns relating to sample size at T3 are discussed in later
sections. Details for statistically significant results are reported, such as t statistics
and F statistics, however non-significant results are simply noted as not significant
(or ns in tables).
Table 4.2 Scale reliability at T1, T2, and T3
Scale T1 Cronbach’s a
(n=438)
T2 Cronbach’s a
(n=278)
T3 Cronbach’s a
(n=45)
Safety attitudes 0.74 0.74 0.80
Family & friends influence 0.87 0.94 n/a
Positive riding peer influence 0.91 0.94 n/a
Risky riding intentions 0.88 0.87 n/a
Thrill seeking mcycle 0.89 0.89 0.98
Aggressive riding 0.73 n/a 0.82
Extreme speed and stunts (behaviour) n/a n/a 0.62*
Bending road rules (behaviour) n/a n/a 0.90
Impaired riding (behaviour) n/a n/a 0.53*
Emotional riding (behaviour) n/a n/a 0.75
Pushing limits (behaviour) n/a n/a 0.71
Group riding (behaviour) n/a n/a 0.35*
* denotes poor internal consistency
4.5.2 Start of Training (T1) Descriptive Data
This section provides characteristics of the sample, crash and offence history,
and scale means for the key issues of interest. It also shows bivariate correlations at
the start of training for selected variables.
Half of the sample had achieved a tertiary level of education (54.7%) which
was defined as any formal study undertaken beyond secondary school level such as
vocational certificates, diplomas, university degrees or post-graduate study. Twenty
six percent achieved Year 12 secondary schooling (senior certificate) as their highest
level of education, 16.1% achieved Year 10 level (junior certificate) as the highest
level, and a further 3% had not achieved Year 10 level. In regard to marital status,
37.6% of participants were single, 53.2% were married, and 9.2% divorced or
separated.
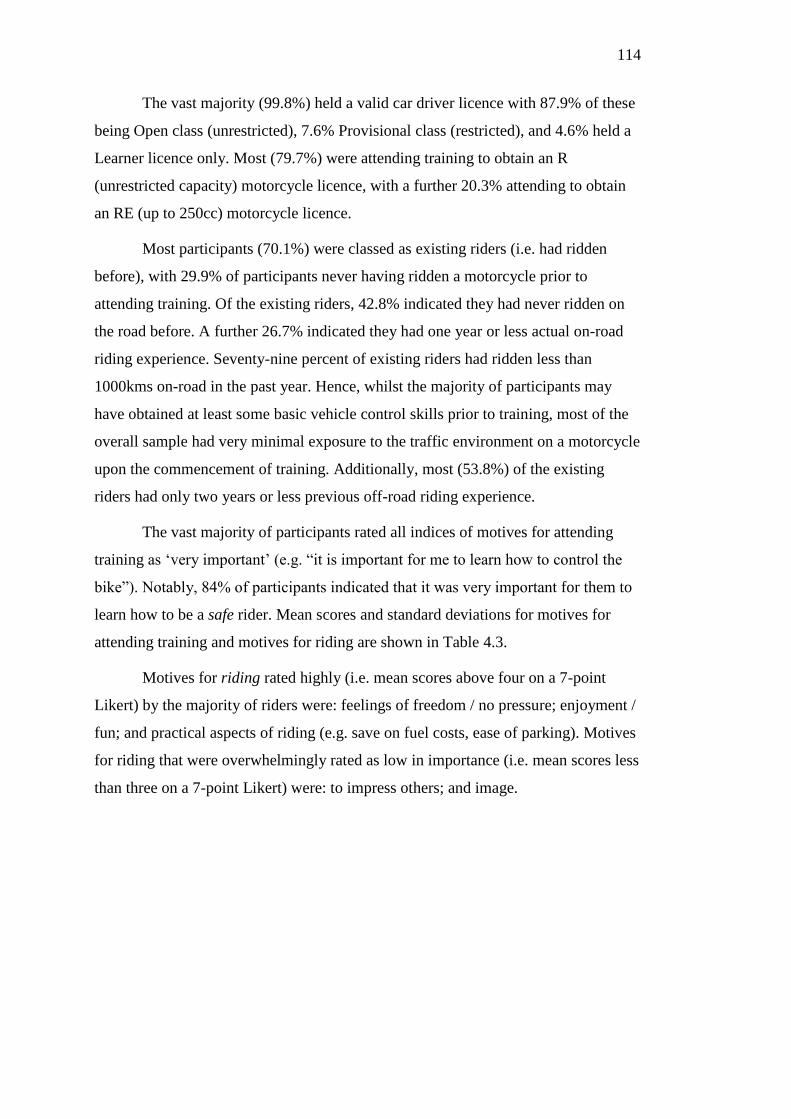
114
The vast majority (99.8%) held a valid car driver licence with 87.9% of these
being Open class (unrestricted), 7.6% Provisional class (restricted), and 4.6% held a
Learner licence only. Most (79.7%) were attending training to obtain an R
(unrestricted capacity) motorcycle licence, with a further 20.3% attending to obtain
an RE (up to 250cc) motorcycle licence.
Most participants (70.1%) were classed as existing riders (i.e. had ridden
before), with 29.9% of participants never having ridden a motorcycle prior to
attending training. Of the existing riders, 42.8% indicated they had never ridden on
the road before. A further 26.7% indicated they had one year or less actual on-road
riding experience. Seventy-nine percent of existing riders had ridden less than
1000kms on-road in the past year. Hence, whilst the majority of participants may
have obtained at least some basic vehicle control skills prior to training, most of the
overall sample had very minimal exposure to the traffic environment on a motorcycle
upon the commencement of training. Additionally, most (53.8%) of the existing
riders had only two years or less previous off-road riding experience.
The vast majority of participants rated all indices of motives for attending
training as ‘very important’ (e.g. “it is important for me to learn how to control the
bike”). Notably, 84% of participants indicated that it was very important for them to
learn how to be a safe rider. Mean scores and standard deviations for motives for
attending training and motives for riding are shown in Table 4.3.
Motives for riding rated highly (i.e. mean scores above four on a 7-point
Likert) by the majority of riders were: feelings of freedom / no pressure; enjoyment /
fun; and practical aspects of riding (e.g. save on fuel costs, ease of parking). Motives
for riding that were overwhelmingly rated as low in importance (i.e. mean scores less
than three on a 7-point Likert) were: to impress others; and image.
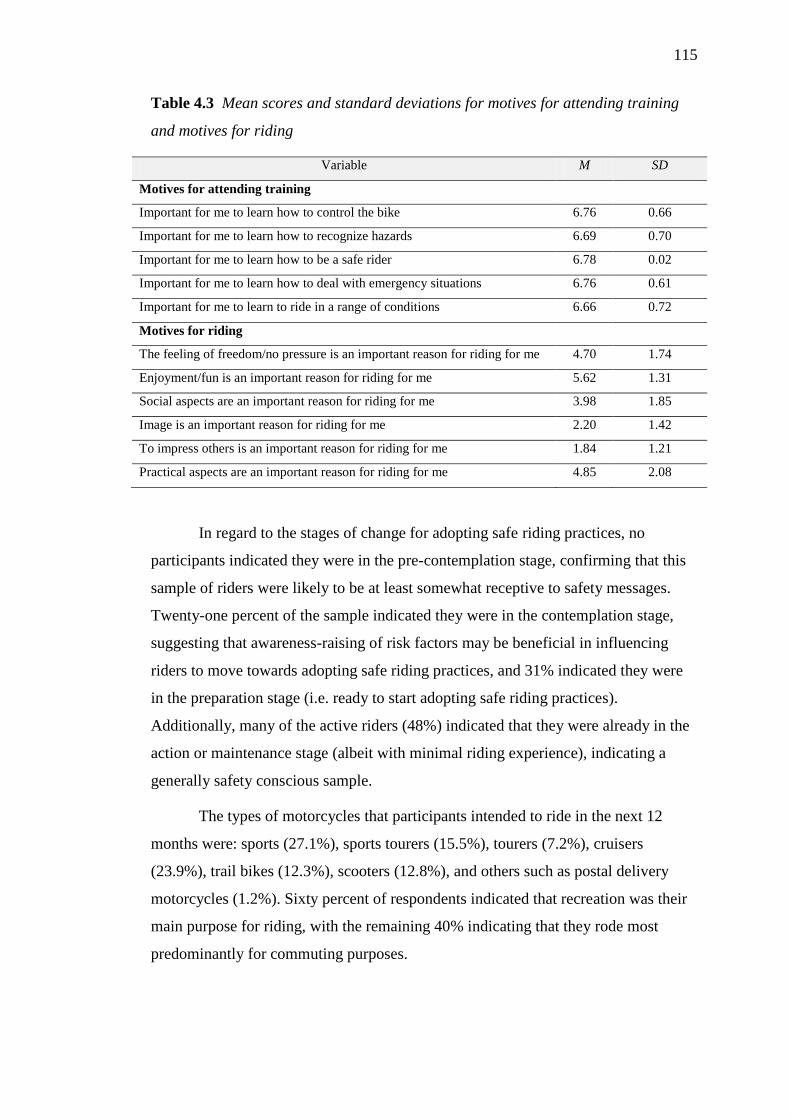
115
Table 4.3 Mean scores and standard deviations for motives for attending training
and motives for riding
Variable M SD
Motives for attending training
Important for me to learn how to control the bike 6.76 0.66
Important for me to learn how to recognize hazards 6.69 0.70
Important for me to learn how to be a safe rider 6.78 0.02
Important for me to learn how to deal with emergency situations 6.76 0.61
Important for me to learn to ride in a range of conditions 6.66 0.72
Motives for riding
The feeling of freedom/no pressure is an important reason for riding for me 4.70 1.74
Enjoyment/fun is an important reason for riding for me 5.62 1.31
Social aspects are an important reason for riding for me 3.98 1.85
Image is an important reason for riding for me 2.20 1.42
To impress others is an important reason for riding for me 1.84 1.21
Practical aspects are an important reason for riding for me 4.85 2.08
In regard to the stages of change for adopting safe riding practices, no
participants indicated they were in the pre-contemplation stage, confirming that this
sample of riders were likely to be at least somewhat receptive to safety messages.
Twenty-one percent of the sample indicated they were in the contemplation stage,
suggesting that awareness-raising of risk factors may be beneficial in influencing
riders to move towards adopting safe riding practices, and 31% indicated they were
in the preparation stage (i.e. ready to start adopting safe riding practices).
Additionally, many of the active riders (48%) indicated that they were already in the
action or maintenance stage (albeit with minimal riding experience), indicating a
generally safety conscious sample.
The types of motorcycles that participants intended to ride in the next 12
months were: sports (27.1%), sports tourers (15.5%), tourers (7.2%), cruisers
(23.9%), trail bikes (12.3%), scooters (12.8%), and others such as postal delivery
motorcycles (1.2%). Sixty percent of respondents indicated that recreation was their
main purpose for riding, with the remaining 40% indicating that they rode most
predominantly for commuting purposes.

116
In regard to self-rated skill levels at the commencement of training, 56% of
existing riders rated themselves as ‘average’, with 12% rating themselves as either
‘above average’ or ‘well above average’, and a further 32% rating themselves as
‘below average’ or ‘well below average’. In addition, 47% of existing riders rated
themselves as ‘average’ in terms of safe riding, 46% rated themselves as ‘above
average’ or ‘well above average’, and 7% rated themselves as ‘below average’ or
‘well below average’. Whilst few riders rated themselves as having better than
average riding skills, a far greater proportion rated themselves as better than average
at riding safely.
Self-reported road crashes and traffic offences over the past three years were
also measured at the start of training. Several different crash types are shown in
Table 4.4 whilst riding a motorcycle, driving a car, or controlling any other vehicle.
As expected, few motorcycle crashes were recorded as most riders had limited
exposure to on-road riding during this period. Also as expected, there were
considerably more minor crashes (not involving injury to persons) than injury
crashes (where medical treatment was required). There were a similar proportion of
single-vehicle and multi-vehicle crashes reported.
Table 4.4 Number of self-reported on-road crashes within the three years prior to
training (N=438).
Crash types Motorcycle Car Other Total
Single vehicle minor 9 52 5 66
Single vehicle injury 3 4 1 8
Multi vehicle minor 6 55 1 62
Multi vehicle injury 2 7 0 9
Total 20 118 7 145
Additionally, self-reported offences where participants were fined by police
are shown in Table 4.5. The number of overall offences for each case ranged
between zero and 10. As expected, speeding was much more frequent than any other
traffic offence. The proportion of participants reporting a drink driving offence was
minimal, additionally with few recidivist offenders. Some participants did not report
offences, although the amount of missing data was not high. Overall, the sample did
not appear to be particularly deviant in terms of self-reported traffic offences.
117
Table 4.5 Number and percentage of participants with one or more self-reported
traffic offences within the three years prior to training (N=438)
Offence types Number and percent* of participants within each category
Nil offences 1 offence 2 offences >2 offences Missing
Speeding 228 (53) 127 (30) 37 (9) 35 (8) 11
Drink driving 405 (96) 16 (4) 2 0 15
Unlicensed 417 (99) 4 (1) 1 0 16
Running a red light 390 (92) 32 (8) 0 0 16
Other 401 (95) 19 (5) 1 0 17
All Offences 200 (48) 127 (30) 52 (12) 42 (10) 17
*percentages in brackets
Descriptive data for the key scales of interest at T1 (start of training) are
shown in Table 4.6. As a modified TPB framework was used to guide the evaluation,
the scales were primarily composed of items representing theoretical concepts linked
to the theory. Scores on the Safety Attitudes scale were generally high, indicating
positive attitudes to safety. Similarly, scores on the Family and Friends Influence
scale and Riding Peer Influence scale were high, indicating that participants felt that
significant others did not support risky riding. Scores on the Risky Riding Intentions
scale were on average low, as were scores for Aggressive Riding. Scores on the
Thrill Seeking scale indicated a marginal propensity for thrill seeking on a
motorcycle. Perceived behavioural control was calculated as the mean of two
questionnaire items (rather than a complete scale) and scores on this variable were
found to be moderate, indicating that participants did not view their safety being
absolutely as a result of their own behaviour.
Table 4.6 Mean item scores and standard deviations for psychosocial influences on
risky riding scales at T1*
n M SD
Safety attitudes 437 5.87 0.61
Family & friends influence 438 6.46 1.12
Riding peer influence 429 6.25 1.25
PBC 437 4.87 1.03
Risky riding intentions 436 2.03 1.09
Thrill seeking mcycle 296 2.72 1.23
Aggressive riding 261 1.86 0.87
*measured on 7-point Likert scales
118
Bivariate correlations between scales and items of interest are shown in an
intercorrelation matrix in Table 4.7. Whilst many of the relationships are statistically
significant, the correlation coefficients were generally not high. For example, a
moderate positive association between the Motorcycle Thrill Seeking scale and the
Risky Riding Intention scale can be seen in Table 4.7. As expected, a moderate
negative relationship also exists between both Safety Attitudes and Risky Riding
intentions and Safety Attitudes and Motorcycle Thrill Seeking. A strong positive
correlation between the two measures of normative influence, Family and Friends
Influence and Riding Peer Influence, is evident.
Age was not found to have a strong association with any of the risk scales
(although some of those associations were statistically significant). Previous off-road
riding experience showed a moderate positive association with self-rated riding skill.
4.5.3 End of Training (T2)
4.5.3.1 Descriptive Data
As previously mentioned, some attrition in data was evident at T2.
Descriptive statistics separating the subset of participants that responded at T2 (n =
279) from those who did not (n = 160) are shown in Table 4.8 for all major scales
used in the study. As Aggressive Riding was a self-report measure of riding
behaviour, this variable was not measured at T2 as insufficient time for actual riding
or driving had elapsed since measurement at the start of training (T1) for this
distinction to be meaningful. That is, riders were not yet licensed and, hence, unable
to ride unaccompanied on the road until after T2. Also, it must be noted that only
existing riders could respond to the aggressive riding and thrill seeking items as new
riders by definition had no previous riding experience.
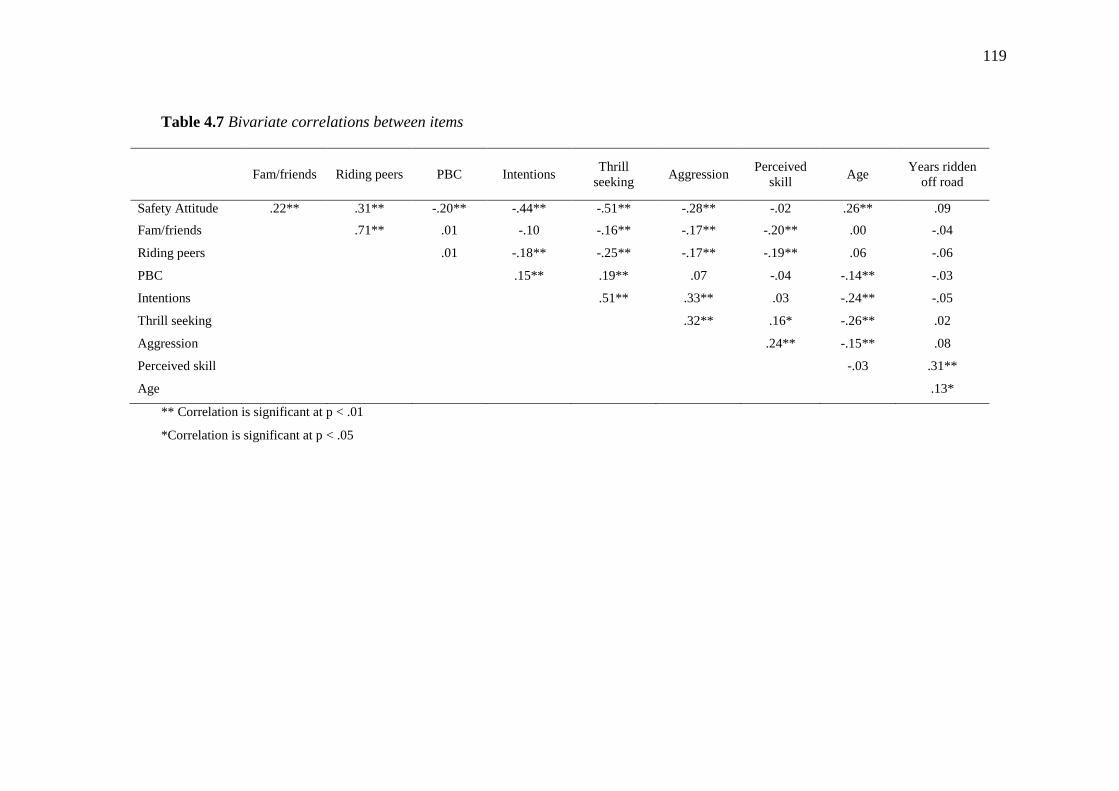
119
Table 4.7 Bivariate correlations between items
Fam/friends Riding peers PBC Intentions Thrill
seeking Aggression
Perceived
skill Age
Years ridden
off road
Safety Attitude .22** .31** -.20** -.44** -.51** -.28** -.02 .26** .09
Fam/friends .71** .01 -.10 -.16** -.17** -.20** .00 -.04
Riding peers .01 -.18** -.25** -.17** -.19** .06 -.06
PBC .15** .19** .07 -.04 -.14** -.03
Intentions .51** .33** .03 -.24** -.05
Thrill seeking .32** .16* -.26** .02
Aggression .24** -.15** .08
Perceived skill -.03 .31**
Age .13*
** Correlation is significant at p < .01
*Correlation is significant at p < .05
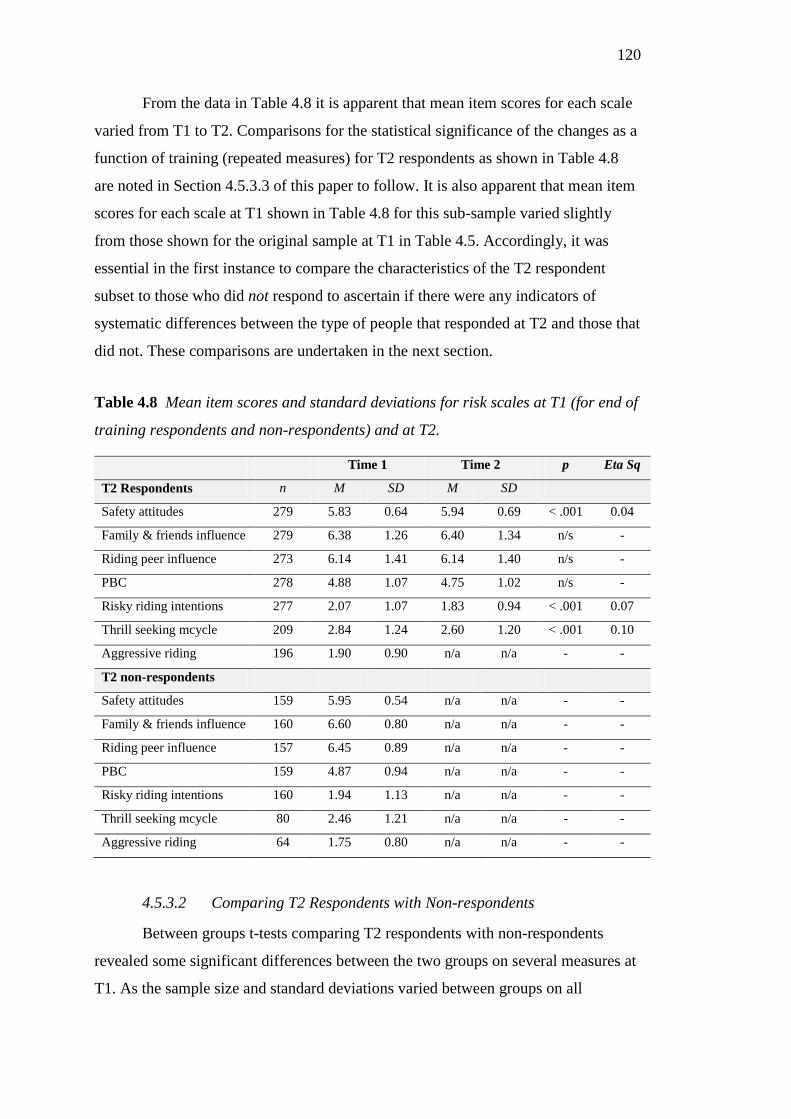
120
From the data in Table 4.8 it is apparent that mean item scores for each scale
varied from T1 to T2. Comparisons for the statistical significance of the changes as a
function of training (repeated measures) for T2 respondents as shown in Table 4.8
are noted in Section 4.5.3.3 of this paper to follow. It is also apparent that mean item
scores for each scale at T1 shown in Table 4.8 for this sub-sample varied slightly
from those shown for the original sample at T1 in Table 4.5. Accordingly, it was
essential in the first instance to compare the characteristics of the T2 respondent
subset to those who did not respond to ascertain if there were any indicators of
systematic differences between the type of people that responded at T2 and those that
did not. These comparisons are undertaken in the next section.
Table 4.8 Mean item scores and standard deviations for risk scales at T1 (for end of
training respondents and non-respondents) and at T2.
Time 1 Time 2 p Eta Sq
T2 Respondents n M SD M SD
Safety attitudes 279 5.83 0.64 5.94 0.69 < .001 0.04
Family & friends influence 279 6.38 1.26 6.40 1.34 n/s -
Riding peer influence 273 6.14 1.41 6.14 1.40 n/s -
PBC 278 4.88 1.07 4.75 1.02 n/s -
Risky riding intentions 277 2.07 1.07 1.83 0.94 < .001 0.07
Thrill seeking mcycle 209 2.84 1.24 2.60 1.20 < .001 0.10
Aggressive riding 196 1.90 0.90 n/a n/a - -
T2 non-respondents
Safety attitudes 159 5.95 0.54 n/a n/a - -
Family & friends influence 160 6.60 0.80 n/a n/a - -
Riding peer influence 157 6.45 0.89 n/a n/a - -
PBC 159 4.87 0.94 n/a n/a - -
Risky riding intentions 160 1.94 1.13 n/a n/a - -
Thrill seeking mcycle 80 2.46 1.21 n/a n/a - -
Aggressive riding 64 1.75 0.80 n/a n/a - -
4.5.3.2 Comparing T2 Respondents with Non-respondents
Between groups t-tests comparing T2 respondents with non-respondents
revealed some significant differences between the two groups on several measures at
T1. As the sample size and standard deviations varied between groups on all

121
measures, Levene’s test for equality of variance was utilised and equal variances
were only assumed for the purpose of significance testing where Levene’s test was
not breached.
Significantly lower mean scores were found at T1 for the T2 respondent
subset compared to non-respondents regarding Safety Attitudes, t (377) = -2.14,
p<.05, Family and Friends Influence, t (432) = -2.27, p<.05, and Riding Peer
Influence, t (424) = -2.82, p<.01. In contrast, significantly higher mean scores were
found for T2 respondents compared to non-respondents regarding Motorcycle Thrill
Seeking, t (294) = 2.22, p<.05. Beyond the major scales used in the study, scores on
several other variables were found to be significantly higher at T1 for the end of
training respondent subset compared to non-respondents: Self-rated Riding skill, t
(200) = 2.21, p<.05, the number of self-reported speeding offences in the past three
years, t (425) = 1.97, p=.05, and total self-reported crashes in the past three years, t
(416) = 3.91, p<.001.
Additionally, chi-squared analysis revealed that males were significantly
more likely to respond at T2 than females, 2(1) = 30.78, p < .001, and that the
existing rider group were significantly more likely to respond at T2 than the new
rider group, 2(1) = 37.21, p < .001. There were no significant differences between
any age groups, riding purposes (recreational/commuting), or education levels
regarding the likelihood of responding at T2 (or not). Collectively, these findings
suggest that those who responded at T2 were a more risky group than those who did
not complete T2 measures in terms of psychosocial indicators of safe riding, and past
traffic history.
4.5.3.3 Start and End of Training Data Comparisons (T1 vs T2)
Statistical comparisons of scores over time were undertaken for the key
psychosocial risk scales in order to determine the effects of training on attitudinal
and motivational influences on risk taking (e.g. attitudes, subjective norms, and
intentions to engage in risky riding) for those who responded at both times. Repeated
measures t-tests were used to compare T1 and T2 data. Given that the small number
of respondents at T3 would reduce the available data and compromise statistical
power for comparisons across all three time periods, it was decided that t-tests
between T1 and T2 were the best alternative compared to repeated measures
122
ANOVA across all time periods. Additionally, the nature of the key scales of interest
varied between T2 and T3 with predominantly behavioural scales employed in the
latter. Accordingly, repeated measures t-tests were used to allow for a sufficient
sample size to be retained for direct comparison of the effects on key variables of
interest from T1 to T2.
Mean scores on key scales of interest relating to these analyses are shown in
Table 4.5 for T2 respondents. A repeated measures t-test found a significant increase
in mean scores for the Safety Attitudes scale from T1 to T2, t(278) = -3.59, p<.001.
This suggests that training had a positive influence on riders’ attitudes to road safety.
A significant decrease in mean scores for the Intentions to Engage in Risky Riding
scale was found at T2 using a repeated measures t-test, t(276) = 4.72, p<.001. This
indicates that riders would be less likely to intend to engage in future risky riding
following training. Additionally, a repeated measures t-test found a significant
decrease in mean scores for the Motorcycle Thrill Seeking scale at T2 from T1,
t(208) = 4.89, p<.001. Comparisons between T1 and T2 were found to be non-
significant using paired samples t-tests for Family and Friends Influence (subjective
norm), t(278) = -.17, p=.87, as well as the Riding Peer Influence (specific subjective
norm), t(272) = .04, p=.97. This indicated that training had little effect on normative
influences on riding behaviour. As the distribution of scores on the abovementioned
scales were skewed, a nonparametric test, the Wilcoxon Signed Rank test was
performed for each and confirmed the statistical significance of each t-test finding.
This suggests that repeated measures t-tests are reasonably robust to breaches of
normality. A repeated measures t-test for PBC also revealed a non-significant change
over time, t(277) = 1.88, p=.06. Notably, scores for PBC decreased as a function of
training.
Effect sizes calculated using eta squared for the significant findings were in
accordance with procedures highlighted by Pallant (2007). These calculations show
small effect sizes for Safety Attitudes, Risky Riding Intentions, and Motorcycle
Thrill Seeking as noted in Table 4.5.
In addition to the key scales of interest, Self-rated Skill and Self-rated Safe
Riding variables were examined as a function of training. Mean scores at T1 and T2
for the Self-rated Skill and Self-rated Safe Riding variables are displayed in Table
4.9 for males and females, showing a slight increase for each variable over time for
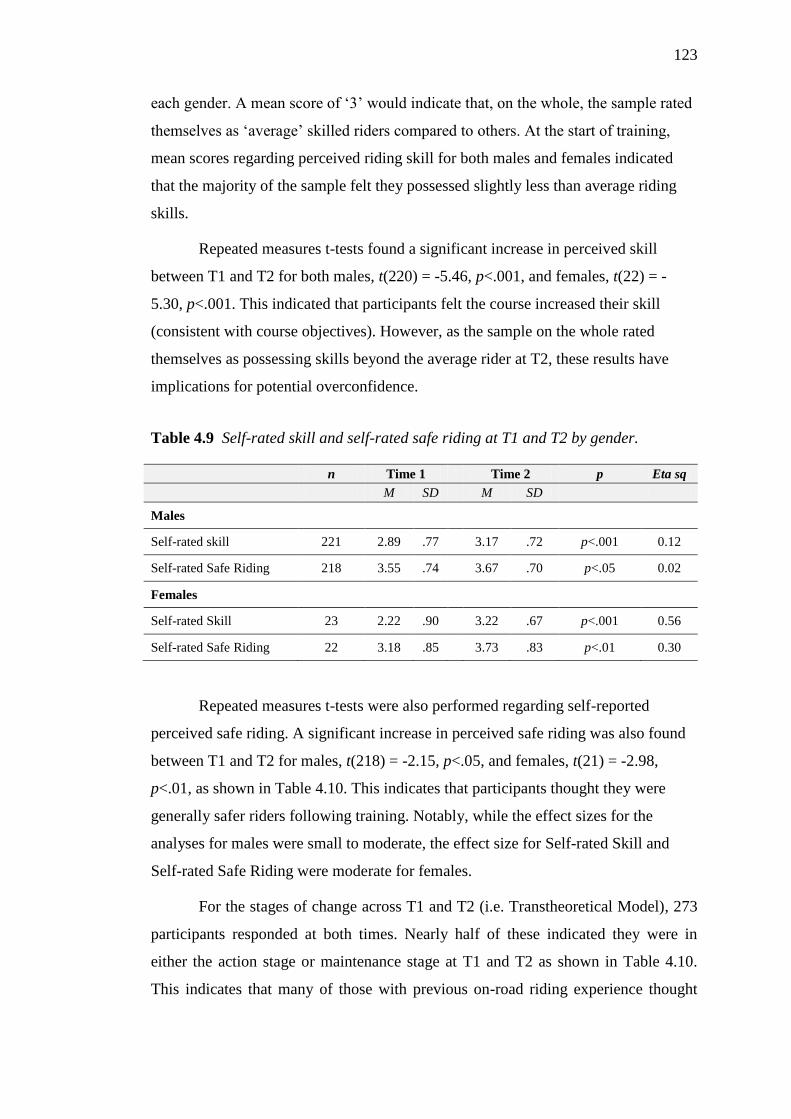
123
each gender. A mean score of ‘3’ would indicate that, on the whole, the sample rated
themselves as ‘average’ skilled riders compared to others. At the start of training,
mean scores regarding perceived riding skill for both males and females indicated
that the majority of the sample felt they possessed slightly less than average riding
skills.
Repeated measures t-tests found a significant increase in perceived skill
between T1 and T2 for both males, t(220) = -5.46, p<.001, and females, t(22) = -
5.30, p<.001. This indicated that participants felt the course increased their skill
(consistent with course objectives). However, as the sample on the whole rated
themselves as possessing skills beyond the average rider at T2, these results have
implications for potential overconfidence.
Table 4.9 Self-rated skill and self-rated safe riding at T1 and T2 by gender.
n Time 1 Time 2 p Eta sq
M SD M SD
Males
Self-rated skill 221 2.89 .77 3.17 .72 p<.001 0.12
Self-rated Safe Riding 218 3.55 .74 3.67 .70 p<.05 0.02
Females
Self-rated Skill 23 2.22 .90 3.22 .67 p<.001 0.56
Self-rated Safe Riding 22 3.18 .85 3.73 .83 p<.01 0.30
Repeated measures t-tests were also performed regarding self-reported
perceived safe riding. A significant increase in perceived safe riding was also found
between T1 and T2 for males, t(218) = -2.15, p<.05, and females, t(21) = -2.98,
p<.01, as shown in Table 4.10. This indicates that participants thought they were
generally safer riders following training. Notably, while the effect sizes for the
analyses for males were small to moderate, the effect size for Self-rated Skill and
Self-rated Safe Riding were moderate for females.
For the stages of change across T1 and T2 (i.e. Transtheoretical Model), 273
participants responded at both times. Nearly half of these indicated they were in
either the action stage or maintenance stage at T1 and T2 as shown in Table 4.10.
This indicates that many of those with previous on-road riding experience thought
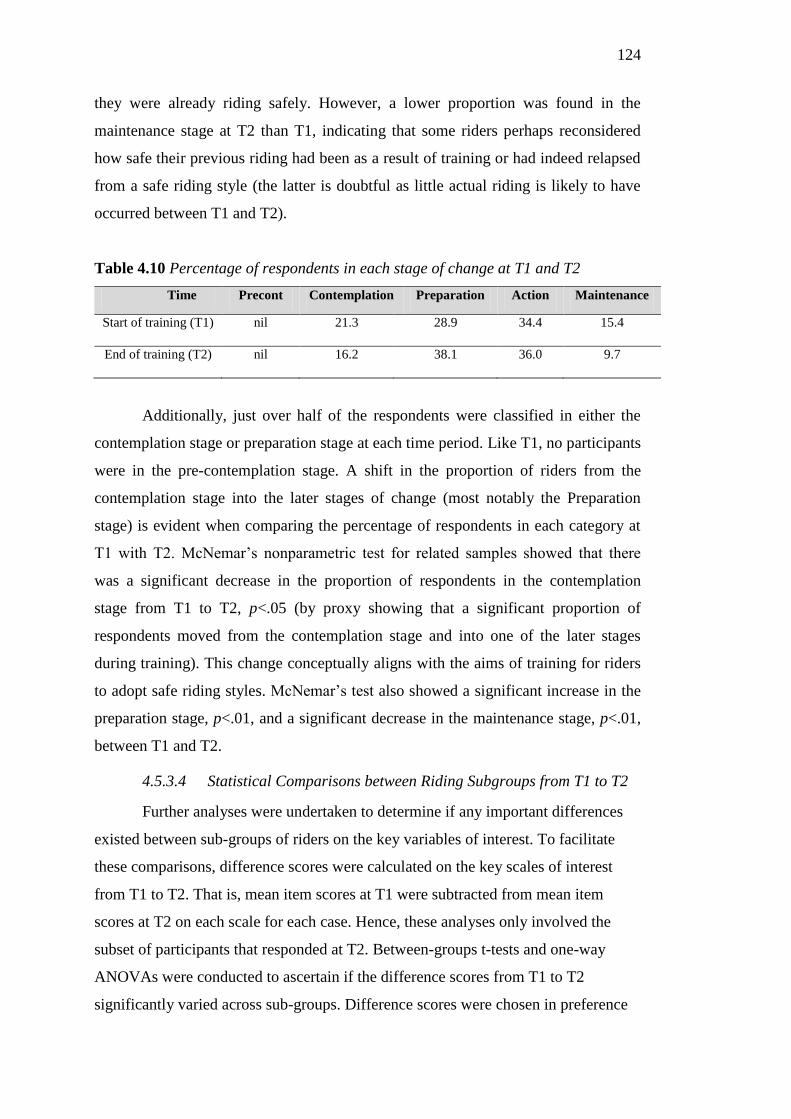
124
they were already riding safely. However, a lower proportion was found in the
maintenance stage at T2 than T1, indicating that some riders perhaps reconsidered
how safe their previous riding had been as a result of training or had indeed relapsed
from a safe riding style (the latter is doubtful as little actual riding is likely to have
occurred between T1 and T2).
Table 4.10 Percentage of respondents in each stage of change at T1 and T2
Time Precont Contemplation Preparation Action Maintenance
Start of training (T1) nil 21.3 28.9 34.4 15.4
End of training (T2) nil 16.2 38.1 36.0 9.7
Additionally, just over half of the respondents were classified in either the
contemplation stage or preparation stage at each time period. Like T1, no participants
were in the pre-contemplation stage. A shift in the proportion of riders from the
contemplation stage into the later stages of change (most notably the Preparation
stage) is evident when comparing the percentage of respondents in each category at
T1 with T2. McNemar’s nonparametric test for related samples showed that there
was a significant decrease in the proportion of respondents in the contemplation
stage from T1 to T2, p<.05 (by proxy showing that a significant proportion of
respondents moved from the contemplation stage and into one of the later stages
during training). This change conceptually aligns with the aims of training for riders
to adopt safe riding styles. McNemar’s test also showed a significant increase in the
preparation stage, p<.01, and a significant decrease in the maintenance stage, p<.01,
between T1 and T2.
4.5.3.4 Statistical Comparisons between Riding Subgroups from T1 to T2
Further analyses were undertaken to determine if any important differences
existed between sub-groups of riders on the key variables of interest. To facilitate
these comparisons, difference scores were calculated on the key scales of interest
from T1 to T2. That is, mean item scores at T1 were subtracted from mean item
scores at T2 on each scale for each case. Hence, these analyses only involved the
subset of participants that responded at T2. Between-groups t-tests and one-way
ANOVAs were conducted to ascertain if the difference scores from T1 to T2
significantly varied across sub-groups. Difference scores were chosen in preference
125
to two-way ANOVA for each key variable because difference scores also provide a
vehicle for simple comparisons between treatment and comparison groups for the
later intervention evaluation (see Chapter 5).
No statistically significant differences were found in t-test comparisons of
difference scores when examining existing riders and new riders on the variables
Safety Attitude, Riding Peer Influence, Family and Friend Influence, or Intentions to
Engage in Risky Riding. Hence, while a marginal difference on one scale was found
at the start of training, it appears that training did not differentially affect existing and
new riders to any great extent. Comparisons for Motorcycle Thrill Seeking could not
be made between these groups as new riders were not asked to respond to this scale
as they had never ridden before.
No statistically significant differences were found for difference scores on
any of the key risk scales as a function of gender. Between-groups t-tests comparing
licence classes revealed that riders obtaining an R class licence showed significantly
greater reductions on scores for Intentions to Engage in Risky Riding than those
riders obtaining an RE class licence between T1 and T2, t(274) = 2.85, p < .01. R
class licence applicants also showed significantly greater reductions in Motorcycle
Thrill Seeking than RE class licence applicants between T1 andT2, t(205) = 2.91, p <
.01. As an artefact of Q-Ride, RE applicants at the time of the study were
predominantly riders aged 20 years and under. Hence, the differences found
regarding licence class were further examined to ascertain if they may merely have
reflected age differences. However, t-tests between riders aged 20 years or less and
other riders aged 21 years and over found only one statistically significant result for
difference scores on the key scales of interest between T1 and T2: riders aged 21
years and older were found to have reductions in Intentions to Engage in Risky
Riding, whilst riders aged 20 years and younger were found to have an increase,
t(269) = 2.84, p < .01.
Those riders intending to ride mainly for recreational purposes showed
significantly greater reductions in Motorcycle Thrill Seeking from T1 to T2 than
those intending to mainly commute, t(198) = 2.73, p < .01. No other significant
differences were found across these two groups on other key scales of interest.
126
Comparisons for participants who had been involved in a crash in the
previous three years (any vehicle) with those who had not crashed showed no
significant differences between T1 and T2 for responses on the key scales of interest.
This indicated that previous crash involvement did not influence the potential for
change of factors underpinning risky riding as a function of training.
One way between-groups ANOVA revealed that there was a significant effect
of marital status on difference scores for the Riding Peer Influence scale, F(2, 269) =
3.78, p<.05. A Tukey’s adjustment (a = .025) was employed for post-hoc
comparisons which found that separated or divorced group showed significantly
greater increases in Riding Peer Influence than the married/defacto group.
Comparisons for the effect of marital status on difference scores for other key scales
were not significant. Similar analyses regarding the type of motorcycle that
participants intended to ride found no significant effect for difference scores on any
of the key risk scales at a = .025.
One way between-groups ANOVA revealed that there was a significant effect
of education level on difference scores for the Risky Riding Intentions scale,
however Levene’s test for homogeneity of variance was breached in this analysis.
When the Welch test (recognised as a more robust measure of equality of variance)
was used, the finding was not statistically significant. Similarly, no other significant
results were found for difference scores on any of the other key risk scales as a
function of education level.
4.5.4 Self-report Post Licence Follow-up (T3)
Data gathered at T3 was predominantly in regard to self-reported riding
behaviour and riding history since the time of training. Forty five participants
responded to the post-licence follow-up at T3 from the original sample of 438
(10.27%). Due to the low response rate the majority of findings for this group are in
relation to establishing representativeness. These results which show demographic
information and comparisons of descriptive data to the original sample can be found
in Appendix 4.3. For the sake of brevity these findings are summarised below.
For the two psychosocial factors examined across all three time periods,
scores on the Safety Attitudes scale were maintained over time, with a marginal
decrease in scores on the propensity for Motorcycle Thrill Seeking scale at T3

127
compared to T2. Trends for these variables differed between respondents and non-
respondents. For T3 respondents, mean scores on the Aggressive Riding scale
increased from T1 to T3. Bivariate relationships between key variables showed that
propensity for Motorcycle Thrill Seeking and Rider Aggression showed moderate
positive correlations with the risky riding behaviour scales (Emotional Riding,
Pushing Limits, Bending Road Rules) and items from other risky riding concepts
(e.g. Group Riding, Extreme Speeds and Stunts, Impaired Riding). Items relating to
performing stunts were particularly related to increases in self-rated skill, and lower
age appeared to be more so related to poorer scores on psychosocial influences rather
than self-reported risky riding behaviour.
Overall, results at T3 must be interpreted with extreme caution due to the
small sample size and low response rate. When considering all available information,
the assertion that the T3 subsample is representative of the overall study sample is at
best contentious. Therefore, further analyses of the T3 data were not undertaken in
regard to possible theoretical relationships that may be present between, for example,
intentions to engage in risky riding at T2 and actual riding behaviour at T3, or
multivariate analyses. The results of such analyses would be difficult to generalise
with any confidence. Poor reliability of some behavioural scales at T3 as previously
shown in Table 4.2 also precluded meaningful analyses using them as dependent
variables.
4.6 Discussion
The primary aim of this study was to investigate the effect of an existing rider
training program on factors known to influence risky riding. This study was not
expected to examine crash involvement following training to any meaningful degree
due to crashes being relatively infrequent events. As such, intermediate measures of
psychosocial influences on risky riding were the main focus with the view to
establish the potential benefits of the existing program and, additionally, to provide
comparison data for the Three Steps to Safer Riding training intervention. Three key
issues were examined in this study to inform RQ3 and RQ4. The findings are
discussed in the following sections with specific reference to each of the issues.
128
4.6.1 Does the Existing Training have an Immediate Positive or Negative Effect on
Self-reported Attitudinal and Motivational Factors that may Influence Risky riding?
The attitudinal and motivational influences on risky riding were examined at
three points in time through the use of self-report data, whereby scales were
constructed to measure key factors (e.g. Safety Attitudes). Data from the first two
time points (at the start and end of training) informed this research question
regarding immediate effects. Accordingly, the majority of discussion in this section
will be focussed on findings from T1 and T2.
4.6.1.1 Immediate Positive Effects
For those riders who completed training and responded at T2 it appears that
training had some positive effects on some psychosocial influences. Specifically, it
was found that training significantly reduced the reported propensity for thrill
seeking on a motorcycle as well as riders’ intentions to engage in risky riding in the
next 12 months. Findings also showed a significant increase in attitudes to safety as
an immediate outcome of training. Whilst small to moderate effect sizes were found
for these changes, they were positive outcomes nonetheless.
Several authors have previously commented that rider training may benefit
from addressing attitudes to safety (e.g. Jonah et al., 1982; Haworth & Mulvihill,
2005). The findings of this study at T2 suggest that the traditional training program
provided by the industry partner organisation was achieving this goal to some degree,
albeit in an unstructured manner. Ad hoc discussions during training regarding safe
riding practices often also define which riding practices are not safe. Hence, whilst
the central focus of the licence training was to assist riders reach the requisite level of
vehicle control skill and manoeuvring in traffic to pass the licence competencies, it
appears the training from the partner organisation also somewhat guided riders’
perceptions of responsible riding.
The positive findings at T2 are somewhat incongruent with the balance of
findings from the existing literature that shows little or no reduction in crash
involvement for formally trained riders when compared to informally trained riders.
This could simply be because the partner organisation maintained a stronger focus on
safety than other training organisations in general. It could also potentially also be
that minor changes in psychosocial indicators of risk taking are common in training,
however may not necessarily be sustained over time or transpose to reductions in

129
crash involvement. Previous research has not longitudinally examined these factors
within the context of training and the link between addressing psychosocial
influences and subsequent crash involvement. Unfortunately, while a significant
effect was found in this study it is not possible to determine to what degree such a
change would need to be for it to have a meaningful effect on crash involvement.
This study did not aim to provide such answers as it was merely a comparison group
for the planned intervention.
Interestingly, those who did not complete the T2 questionnaire were found to
possess slightly less propensity to take risks (from T1 data) and also possessed more
positive attitudes to safety than those who did respond at T2. Non-respondents at T2
were also found to be more likely to be female, be ‘new’ riders, and rate their riding
skill lower than those who did respond at T2. This suggests that some attrition at T2
may have been due to people who had never previously ridden deciding that
motorcycling was not something they wished to pursue further. Speculatively, this
may be because these riders did not possess the requisite skill to meet the licensing
competencies and decided that motorcycling was not for them (perhaps not confident
enough).
A similar attrition rate was found in recent research by Haworth, Rowden and
Schramm (2010) for all motorcyclists progressing to licensing after obtaining a
motorcycle learner permit throughout the state of Queensland. Hence, the attrition
rate found in this current study is not unusual. However, in the Haworth et al. study,
riders aged 20yrs and under were less likely to proceed to licensing than other age
groups which was not found in this study. The number of people that do not
complete training and receive a certificate of competence has potential safety
benefits in terms of reduced exposure (i.e. less riders on the road); however this may
be an artefact of the licensing system rather than the training of the industry partner
per se.
4.6.1.2 Immediate Potential Negative Effects
Potential negative influences on risky riding were also found from the study
in terms of increased perceived riding skill from T1 to T2. On the whole, participants
rated their skill levels as slightly below average when compared to others before
training. This was more pronounced for females. Previous research suggests that
130
optimism bias is a pervasive and robust phenomenon for driving (Harré & Sibley,
2007; Sűmer, et al, 2006; Waylen, Horswill, Alexander, & McKenna, 2004) however
this has primarily focussed on novice drivers. It is possible that the lack of effect
found at the start of training may reflect differences between novice driver and
novice rider populations. For example, there is an increasing trend for people to take
up motorcycling later in life (Haworth, Mulvihill & Rowden, 2006). The current
study sample (mean age 33yrs) reflects this age disparity between novice drivers
(who are typically younger) and novice riders, and is representative of Q-Ride
trainees in Queensland as found in previous research (Watson et al., 2003). It is
therefore unknown if the findings at the start of training reflect a more realistic
appreciation of riding skills by participants due to their cumulative life experience.
Another possible explanation for the lack of optimism bias prior to training is
that trainees felt more anxious and less in control before training due to the situation
of knowing that their riding skills would actually be assessed by the instructors
during the course (refer McKenna and Myers, 1997). Both anxiety and the illusion of
control have been found to correlate with unrealistic optimism (see Moen &
Rundmo, 2005). Additionally, it is possible that the findings for perceived skill at T1
reflect a self-selection bias for people choosing to undertake training through Q-Ride
as previous research by Watson et al. (2003) found that those obtaining a licence
through Q-Ride rated their riding skills lower than riders obtaining their licence
through Q-Safe (the alternative testing regime for licensing in Queensland).
The findings that perceived riding skill significantly increased from T1 to T2
support the notion that training may potentially contribute to overconfidence.
However, the notion of overconfidence is dependent upon the sample perceiving
themselves as being more skilled than they actually are. Self-perceived skill was only
examined in the current study on a sample-wide basis rather than on an individual
basis due to concern from the industry partner that instructor ratings of individual
riding skill beyond the threshold of being declared ‘competent’ would conflict with
the principles of competency-based assessment where riders are declared either
‘competent’ or ‘not yet competent’ and not rated or ranked.
At T2, mean perceived skill scores were marginally above ‘3’ for both male
and female riders, indicating that by the end of training participants felt their skill
levels had increased, and more importantly, were now perceived as slightly above
131
average compared to other riders. Hence, it is possible that overconfidence may have
resulted from this training program for some riders. However, consideration of the
statistical significance of the findings of this current study must be balanced with
their practical significance. Whilst a statistically significant change in perceived skill
was found for trainees, the final mean scores were not excessively high for either
males or females. It could therefore be argued that the risk of overconfidence in this
cohort is marginal and that the increase in perceived skill may merely reflect a level
of confidence that is desirable for trainees to face the challenges of the traffic
environment. Furthermore, it is logical to expect that actual riding skills would be
increased as a result of training. Therefore, it is unknown if the increases in
perceived skill found in this study are likely to result in decreased safety or not.
Follow up of participants’ crash involvement over time is to be undertaken as part of
the broader project and will examine such issues relating to this sample.
4.6.2 Does the Existing Standard Training Have Differential Positive or Negative
Effects on Different Types of Riders?
It is important to consider subgroup differences when examining motorcycle
rider training as riders are not a homogeneous group. People of all ages and
backgrounds are attracted to motorcycling, with many different motives for
commencing riding (Broughton, 2005). The findings of this current study support
this notion with the heterogeneity of the sample shown in the main purpose of riding,
previous riding experience, the type of motorcycle they chose to ride, as well as
demographics such as age, gender, education status, and marital status. From a
training perspective each of these subgroups requires consideration when designing
programs to be delivered in the licensing context. Whilst it is possible for post-
licence courses to be specifically designed to target a particular rider group (e.g.
sports bike riders), licence training must be broad enough for all riders to gain some
personal meaning from the program. This is particularly important for psychosocial
influences on risky riding as each person will possess their own personal
constellation of risk factors and previous experience.
Findings from this study suggest that, in the main, the goal of addressing
subgroups in an equal manner is being met in the standard program design from the
partner organisation. Comparisons between rider subgroups for the key risk scales
found no differences as a function of gender. Additionally, no significant differences

132
were found between participants who had crashed in the last three years and those
who had not on any of the key risk scales. This suggests that, where risk factors are
being addressed through the program (albeit in an ad hoc manner), they are having
reasonably even effects across these groups.
In contrast, a difference between participants applying for an R class licence
and those applying for an RE class licence was found regarding future intentions to
engage in risky riding and the propensity for thrill seeking. Training was found to
have greater positive changes in thrill seeking for riders of larger capacity machines
than riders of smaller machines. However, this appears to be predominantly related
to the fact that RE licence applicants (on smaller machines) are younger than R class
licence applicants. When examined as a function of youthfulness, the program did
not appear to have the desired effect for riders aged 20 years and under in terms of
future risky riding intentions. Young males have consistently been found to be the
highest risk group in motorcycling and road safety generally and the findings from
this study (where the sample was predominantly male at T2) affirm that they are
particularly resistant to change compared to people of other ages. This presents a
challenge for rider training; however other measures such as graduated licensing may
have greater potential to protect young riders through licence restrictions. Such a
measure has been initiated in Queensland since the time of the study to now ensure
that for motorcyclists to obtain a Learner licence they must first hold a car drivers
licence for at least one year. This is effectively a proxy for an age restriction as the
vast majority of older learner riders already hold a car drivers licence.
Separated or divorced participants showed significantly higher increases in
riding peer influence than married participants or participants that had never married.
Such results are difficult to explain beyond the notion that appeals to riding
camaraderie during training instilled a higher sense of the importance of riding peers
for this group. This represents a concept that can be further targeted at this group in
training to appeal for riders to protect their riding companions. Peer to peer programs
such as Riders Helping Riders (see McKnight, 2009) have much potential for
positive effects through riders actively recognising that they can potentially save the
lives of other riders rather than negatively influencing them through modelled risky
behaviour. For riders who are divorced or dealing with marital separation, close
riding comrades may be a particular source of support and social companionship.

133
Riders who indicated they wished to ride mainly for recreational purposes
were found to have significantly greater reductions in thrill seeking propensity than
commuters. This indicates that those who intended to be recreational riders may have
learnt the dangers associated with thrill seeking from material delivered in the
program. Speculatively, ad hoc discussions of such behaviour during training were
perhaps centred upon recreational riding as thrill seeking is generally associated with
this type of riding rather than commuting. As the training program did not address
such issues in a structured manner it is difficult to conclude this with any degree of
absolute confidence however. It possibly also reflects a floor effect for thrill seeking
by commuters at the start of training (hence very low possibility of finding reduced
scores at T2).
Overall, the differential effects of the program between T1 and T2 on various
subgroups of riders were subtle, suggesting that the program generally addressed a
broad range of individuals in an equitable manner. However, the results also indicate
that there was scope to develop the program to address specific risk taking issues
further for particular groups.
Unfortunately, due to the relatively small sample size at T3, insufficient cell
sizes rendered analyses between subgroups of riders problematic at follow-up. The
following section discusses findings from the T3 follow up.
4.6.3 Are any Immediate Effects of Training Maintained Over Time and do They
Transpose to Riding Behaviour at 24 months Post Licence?
This research question aimed to examine whether or not any effects from
training on psychosocial factors such as Safety Attitudes and Motorcycle Thrill
Seeking were maintained beyond training and whether such factors influenced the
types of riding behaviours that riders in this sample actively engaged in.
Unfortunately the low response rate upon follow up resulted in the answers to these
questions remaining somewhat clouded. The length of the T3 questionnaire possibly
contributed to the low response rate. Additionally, many of the scales for
psychosocial risk factors were necessarily omitted from the T3 questionnaire due to
the amount of behavioural items. This unfortunately restricts conclusions that can be
drawn in terms of whether other psychosocial factors (e.g. Risky Riding Intentions)
were maintained over time.
134
However, it is apparent for those participants that did respond at T3 that
Safety Attitudes were maintained over time. A marginal increase across each of the
time periods was evident for this scale. Due to the contentious issue of
representativeness of the T3 subsample this promising result must however be
regarded with caution. Similarly, a positive result was found regarding the change in
the propensity for thrill seeking on a motorcycle, with a decrease in scores on this
scale found between T2 and T3. However, due to disparities between the scores of
T3 respondents and non-respondents at earlier times, this result also cannot be
asserted with any confidence.
Aggressive riding was higher at T3 than T1 for the subsample that responded
at both times. This indicates that behaviours such as tailgating and illegal overtaking
had increased once licensed. Whilst this indicates that training may not have
sufficiently addressed such issues, this is not surprising as prior to training and
licensing it would be expected that riders may have feared being apprehended for
unlicensed riding and may have somewhat censored their behaviour. Again this
result must be regarded with caution however.
The relationship between psychosocial risk scales and behavioural scales at
T3 was not examined beyond simple correlations due to the low response rate. For
those who did respond at T3 there were clear associations between the psychosocial
risk scales and risky riding behaviours such as pushing limits, bending road rules,
emotional riding, and riding fatigued. Whilst limited, these simple correlations
supported previous research by Watson et al. (2007) in regard to related concepts of
risky riding as defined by experienced riders. For the sample of riders in this study
who generally had little experience, this provided some basis to support the
application of these concepts within the framework for the Three Steps to Safer
Riding training intervention.
The number of self-reported crashes and offences following training were too
low for meaningful analyses in this study. However within the broader project that
this PhD is nested in, official government recorded crashes and traffic infringements
for all participants will be followed up over an extended time period to ascertain how
psychosocial influences on risk taking affected these critical outcomes.
135
4.6.4 How Findings Informed Intervention Development
The study mainly aimed to inform the planning and development of the Three
Steps to Safer Riding intervention to be applied by the industry partner organisation
at the same training site. This had a practical component in terms of trialling research
protocols within the applied context and gauging student acceptance of the course,
and also a design component in terms of assessing which components to target for
the pilot intervention and whether or not training was already having an effect in
moving riders towards adopting safe riding practices.
The findings discussed thus far indicate that training had a marginal positive
effect on many perceptions of risk for participants, however perhaps still left them
susceptible to risk taking via increased levels of perceived skill at the end of training.
Further to this, analyses of the Stages of Change variable indicated that a greater
proportion of riders were in the Preparedness stage at T2 rather than the
Contemplation stage at T1. Whilst this was a necessarily limited representation of the
Transtheoretical Model concepts due to questionnaire length, this was a positive
indication that the existing training program was generally moving riders towards a
readiness to adopt safe riding practices.
Trialling of the paper-based questionnaire was another component of this
study. As there was a delicate balance between the length of the questionnaire and
time that could otherwise be dedicated to training it was important to ensure that the
information included was actually useful and reliable. With the exception of the
motives for attending training section in which all items were scored highly, the
questionnaire data provided useful information for comparison to the pilot
intervention cohort and was therefore retained for the following study reported in
Chapter 5. The length of the questionnaire and face validity appeared acceptable as
evidenced by the response rates at T1 and T2 and generally low rates of missing data.
As this was merely a comparison group study for this project, no formal process
evaluation was conducted to formally investigate all possible issues.
The findings from this study regarding the use of modified TPB constructs
from the Watson et al. (2007) study for evaluation confirmed that such constructs
generally provided useful information for future comparisons to the pilot intervention
cohort. The inclusion of only two perceived behavioural control (PBC) items in the
136
questionnaire was due to the lack of overall effect on riding behaviour found for this
construct in the Watson et al. study. T3 data in this study was not useful for similar
analyses, however simple correlations suggested that PBC may be useful to address
in relation to emotional riding and bending road rules. The relationships found
between Safety Attitudes and all of the behavioural scales at T3, whilst interpreted
with caution, were largely consistent with the Watson et al. study and therefore
affirmed that attitudes towards these clusters of behaviours would be useful to target
in the intervention.
4.6.5 Limitations
There are several limitations of the study that have possible implications for
the validity of the results and therefore must be acknowledged. Firstly, there are the
inherent challenges associated with self-report data in regard to ensuring accurate
and honest responding, limiting demand characteristics, and minimising recall bias.
However, for the type of research being conducted in this study (i.e. of an
attitudinal/introspective nature), self-report is necessary and over and above the
limitations of self-report this method is more suitable than others for such research.
Several measures were implemented to minimise the likelihood of the limitations of
self-report. These included assurances that the data collected would be aggregated
across all participants, was sealed in envelopes at the time of collection (for paper-
based questionnaires), and would remain confidential to the research team.
Additionally, the study information sheet and introductory video at the
commencement of the study both gave assurances that the information collected
would in no way influence the likelihood of qualifying for a licence as the riding
instructors would not see the data. Recollection of crashes and offences was limited
to the past three years to avoid potential recall bias over a longer time period (see
Wahlberg, 2003). Furthermore, all participation was voluntary and motivation to
respond dishonestly was therefore minimised.
Secondly, T3 data collection suffered from considerable attrition. As this
follow up was conducted using a web-based survey it is possible that differences in
response rates were influenced by the mode of data collection, although it was more
likely to be as a result of the extended period since training (approximately 24
months). Reminder emails and SMS mobile phone messages were sent two weeks
after the survey went ‘live’ on the internet to boost the response rate in addition to

137
the original notifications when the survey was released. However, this had little
effect on the response rate unfortunately. It is likely that the high response rate at T1
was due to participants being a convenience sample at the time of training and
receptive to the offer to participate. However at T3 riders had obtained their licence
and therefore possibly were not so motivated to assist. It is also possible that riders
who were actively engaged in risky riding did not want to respond as their behaviour
was contrary to their training and they perhaps did not perceive the research as
independent from the training organisation and transport authorities.
The third limitation of this study was that it is possible that the effect on
perceptions of risk found in the data was an artefact of completing the questionnaires
rather than an effect of the training per se. That is, completion of the questionnaire at
the start of training actually may have raised awareness of risk issues which
facilitated further consideration of the dangers of such issues at T2 data collection
and primed responses. If so, it is possible that the questionnaire is a tool for
intervention. As all protocols from this study were also to be applied to the pilot
intervention cohort reported in Chapter 5, any demand characteristics or
questionnaire effects that were present should conceivably be equal across cohorts
and therefore not contaminate results where cohorts are compared.
4.7 Summary and Conclusions
This study served primarily as a trial for the planned intervention to test
research protocols and concepts in the questionnaires and, importantly, to gather
comparison data. Hence, many aspects of this study could be also expected to apply
to the intervention. For example, demographics, attrition rates and other pragmatic
issues would be expected to be similar in the pilot intervention.
It appears that the existing training program of the partner organisation
generally had a positive (albeit small) effect on potential safety in terms of
perceptions of risk taking and moved participants towards safe riding. As the data
collected in this study will be used for comparisons to the pilot intervention data this
may unfortunately mean that some effect of the pilot intervention may be masked by
effects evidenced in this comparison cohort. It remains unclear as to the level of
138
effect for psychosocial influences that would be required to reduce crash
involvement.
While the results of this study cannot necessarily be generalised to other
training organisations, the sample appeared to be representative of Q-Ride licence
applicants generally in terms of age and gender. Q-Ride has standardised assessment
requirements across all motorcycle licence training providers in the state that dictates
similar training content across providers in order for licence applicants to pass the
requisite licensing competencies. However, the Q-ride assessment effectively sets a
minimum level for licence training and providers may go above and beyond if
desired. It is therefore difficult to draw conclusive implications for Q-Ride from this
study as only one training provider was sampled.
139
Chapter 5: Study 3 – Formative evaluation of the effects of a rider education
program to address attitudinal and motivational influences on risky riding.
5.1 Introductory Comments
As highlighted in the literature review, a need has been identified for
motorcycle rider training to address risk-taking behaviour in addition to vehicle
control skills (Jonah, 1982; Elliott et al., 2003; Haworth & Mulvihill, 2005; Watson
et al., 1996). Accordingly, the Three Steps to Safer Riding education program was
designed to address attitudinal and motivational influences on risky riding as an
adjunct to an existing skills-based motorcycle licensing training program. The
structured classroom-based education module was designed to be delivered by
motorcycle riding instructors.
This chapter outlines two studies undertaken in the final phase of this
program of research: Study 3a, an interim outcome evaluation of the effects of the
pilot program on psychosocial factors relating to risky riding; and Study 3b, a
process evaluation of the pilot program. The intervention was trialled within a real
world commercial motorcycle training organisation in Brisbane, Australia. The
literature review and studies reported in previous chapters helped to inform the
development of the Three Steps to Safer Riding intervention. However, the pilot
program curriculum was decided by the broader project team and is therefore not the
intellectual property of the author and does not form part of this thesis. The studies in
this chapter were designed to contribute to the overall formative evaluation of the
pilot program.
The interim outcome evaluation of program effects on psychosocial factors
reported in this chapter, Study 3a, compares data from the intervention cohort of
riders to data gathered from the comparison cohort reported in Chapter 4 (as
specified in the research design outlined in the previous chapter). In addition, the
process evaluation, Study 3b, primarily gathered qualitative data to assess delivery
protocols and course participant perceptions of the program.
140
5.2 Study 3a: Evaluation of the Effects of the Three Steps to Safer Riding
Program on Psychosocial Influences on Risky Riding
5.2.1 Aims & Hypotheses
The interim outcome evaluation aimed to assess the effectiveness of the pilot
intervention in terms of changes in participants’ perceptions of risky riding and the
associated psychosocial factors when compared to the comparison group of
participants who received a standard rider training program. The aims of this
component of the study align with Objective 8 in Chapter 1. Key issues explored in
this study as follows are a breakdown of overarching research questions RQ3 and
RQ4:
1. To inform RQ3 - does the Three Steps to Safer Riding pilot program have
an immediate positive effect on self-reported attitudinal and motivational
factors that may influence risky riding (defined by T1 and T2 data
comparisons for variables such as propensity for thrill seeking, rider
aggression, attitudes to risky riding, social influences, and intentions for
future riding) when compared to the standard training program?
2. To inform RQ3 - does the Three Steps to Safer Riding have differential
effects on attitudinal and motivational factors for different types of riders
(e.g. male vs female; absolute novices vs those with some previous riding
experience; those that ride mainly for recreation vs commuters)?
3. To inform RQ3 and RQ4 - are any immediate effects from training on
self-reported attitudinal and motivational factors maintained over time
and do they transpose to actual riding behaviour at 12 months post
training3?
Specific hypotheses were:
H1: Greater positive changes in psychosocial influences on risky riding will be
apparent between T1 and T2 for the treatment group compared to the comparison
3The follow up period was shorter than Study 2 due to the time limitations of the PhD.

141
group (i.e. intervention will have greater effects than traditional training immediately
after the program).
H2: Intentions to engage in risky riding in the next 12 months will be lower for the
treatment group than the comparison group at the end of training (T2).
H3: Any change in scores for psychosocial influences on risky riding from training
for the treatment group will be maintained following licensing (i.e. at T3).
H4: Self-reported risky riding behaviour measured at T3 will be significantly lower
for the treatment group compared to the comparison group.
H5: Intentions to engage in future risky riding at T2 for the treatment group will
predict risky riding behaviours at T3.
As the intervention was required to broadly accommodate all types of riders
there were no a-priori expectations for differences between rider subgroups, although
it was nonetheless considered essential to determine if such effects existed.
Therefore, in addition to the above hypotheses, exploratory analyses were undertaken
to investigate rider subgroup differences as a function of the intervention.
Self-reported crashes, offences and exposure data were gathered for this study
as part of the follow up of riders 12 months post licence. However, due to the
relatively long follow-up period (and the time limitations of completing the PhD)
plus the large sample size that is usually required to find significant effects for these
variables, no a-priori expectations were held in regard to how the intervention
affected crashes or offences. As very few self-reported crashes and offences were
found at follow up for the comparison cohort, it was not considered logical to
develop specific hypotheses relating to comparisons between the intervention group
and comparison group in this regard. Therefore, investigations regarding self-
reported crashes and offences were also considered exploratory in this study. As
previously mentioned, follow up of participants’ crash and offence records were
planned as part of the broader project and was beyond the scope of this study.
5.2.2 Method
5.2.2.1 Participants
Five hundred and thirty-five riders attended motorcycle rider training offered
by the partner organisation between May and August 2008. Of these, 518

142
volunteered to participate in the study at T1 (97% response rate). Of the 518
participants at T1, 369 completed the questionnaire at T2 (71% response rate), and
39 at T3 (8% response rate).
Consistent with the comparison group reported in Chapter 4, all riders
attended training at the same site in Brisbane, Australia, to obtain a motorcycle
licence. All participants were blind as to the nature of the modified training program
(i.e. they were not informed that their training differed from the standard training
program) to avoid a possible “Hawthorne Effect” whereby participants’ attitudes and
behaviour may have been changed merely from the knowledge of being involved in
an intervention aiming to reduce risky riding. Participants were assured of the
confidentiality of data, however participation was not anonymous. For the purpose of
matching individual responses at various points in time, participants were asked to
supply individual identifiers (date of birth and driver licence number). Consent was
obtained from participants in accordance with Queensland University of Technology
Human Research Ethics approval for the study. Participants could elect not to
participate in the study or could exit the study at any time without this affecting the
training they received or their licence assessment. No incentives for participation
were offered at T1 or T2. However, at T3 (follow-up) each participant went in the
draw to win motorcycle protective apparel.
The median age of participants was 32 years (M = 33.5, SD = 10) and ranged
from 17 to 70 years. The proportion of participants within various age categories can
be seen in Table 5.1. Notably, only 28% of participants were aged over 40 years,
with a third of the sample aged between 30 and 39years. The age of this intervention
cohort was generally consistent with that of the comparison cohort (also shown in
Table 5.1), with no significant difference found between the cohorts using a chi-
square test.
Table 5.1 Proportion of T1 respondents in each age category for intervention and
comparison cohorts
Age (yrs) 17-24 25-29 30-39 40-49 50-59 60+
Comparison 24% 17% 34% 16% 8% 1%
Intervention 20% 20% 32% 21% 6% 1%

143
The vast majority of all participants were male (76.3%) which is also
comparable to that of the comparison cohort. A chi-squared test found no significant
difference for gender between the cohorts.
5.2.2.2 Materials
Largely the same materials were used for this study as were used for Study 2
with the exception of an additional block of questions to assess key intervention
messages added to the end of training questionnaire, which can be found in
Appendix 5.1. All paper-based questionnaires used at the time of training were
however colour coded to distinguish them from the comparison cohort so that
possible contamination at the time of data entry was avoided. The same consent
forms, information sheets, and Introduction to Training video were used for this
study as were used for Study 2.
The Three Steps to Safer Riding training package is not detailed here in full
for reasons relating to shared intellectual property with the commercial industry
partner, however a training manual as well as a structured Powerpoint presentation
were developed by the project team to guide instructors. Video vignettes filmed for
the intervention were also embedded within the Powerpoint presentation to ensure
consistency of delivery across instructors. A Toolkit booklet (see Appendix 5.2) was
developed as a take home resource to encourage self-monitoring of riding in the
initial stages after licensing. Hence, the final product was a highly structured module
that was delivered as an additional component to the standard training program
already being delivered by the industry partner. Given that the intervention program
represented a one hour block of content in the classroom session (i.e. as an adjunct to
the existing classroom session), and a 20 minute end of training debrief, it is best
conceptualised as a brief intervention.
5.2.2.3 Procedure
Identical operational procedures were used in this study for data collection as
were used for Study 2. However before Study 3 could commence, the riding
instructors that were to be involved in delivering the classroom intervention were
trained by the author, another academic project team member (who was an active
rider), and the Chief Instructor from the partner organisation who had been actively
involved throughout the development phase of the Three Steps to Safer Riding

144
program. Two ‘train the trainer’ sessions were provided to progressively familiarise
instructors with the overall rationale for the program, all specific aspects of the
program content, and training materials. The Chief Instructor then conducted an
initial ‘dummy’ training session with the other instructors as students prior to
commencement of the program on a daily basis. The Chief Instructor also actively
conducted observations of the other instructors throughout the overall intervention
period and provided them with support and guidance where required (see process
evaluation for more details).
The one hour intervention module was usually delivered as part of the
morning classroom session to groups of up to 10 riders. The entire one hour initial
block of content was delivered in a one session. Practical riding sessions followed
the classroom sessions but did not include intervention material (i.e. they represented
the standard training provided by the industry partner organisation). On several
occasions the classroom sessions, including the intervention module, were delivered
at night due to high demand. This was an exception and only for a minority of
participants. The 20 minute end of training final debrief component of the
intervention was delivered once all the Q-Ride licensing competencies had been met.
Hence, only those participants that were successful in obtaining a licence received
this component.
Active discussion among course participants was encouraged regarding most
of the slides. Therefore some scope remained for individual facilitation styles by
instructors to address individual learning needs.
Web-based data collection
Follow up data for this cohort was collected using the same web-based survey
as outlined in Study 2. Hence, identical procedures were used for this study as
previously mentioned in Chapter 4 (see Section 4.4.3.2). However, the time period
for follow up was 12 months for this study as it was completed concurrently with the
T3 data collection for Study 2. Follow up T3 data for Study 2 was collected 24
months after completion of T2 data collection however a 24 month follow up period
145
for Study 3 would have exceeded the overall time available for completion of the
PhD. Hence, the follow up period for Study 3 was restricted to 12 months4.
5.2.2.4 Data Analysis and Data Cleaning
All data analyses were performed using the SPSS statistical software
package. The same procedures for data cleaning and replacing missing data were
followed for this study as were reported in Chapter 4 for Study 2. The distribution of
scores for each scale was examined to identify outliers and skew that may be
problematic for data analysis. Non-parametric analyses were performed where highly
skewed distributions where found and the assumption of normality was breached.
Outliers beyond three standard deviations were examined on a case by case basis and
excluded from the analyses where appropriate.
For the purpose of statistical testing an alpha level of .05 was assumed unless
otherwise stated. Statistical power was considered when determining a minimum
sample size for the study and the requisite analyses undertaken.
Also like Study 2, data analyses were undertaken using repeated measures t-
tests to compare variable scores for each participant at different points in time.
Independent means t-tests were used to compare scores for key variables between
groups (e.g. new riders vs existing riders; male vs female). Multivariate analyses
were performed using ANCOVA to ascertain effects of the intervention on key
dependent variables whilst controlling for covariates. Nonparametric tests for
significance were performed where distributions were skewed as these are more
robust to breaches of normality.
When reporting findings there is a predominant focus on reporting probability
scores, test values, and effect sizes for statistically significant results due to the
considerable amount of analyses undertaken. Non-significant findings are noted as
such, however where these are many, specific values for probability scores, test
values, and effect sizes for non-significant findings are not reported.
4 Further discussion of the limitations of the follow up periods is included in Section 5.2.4.8

146
5.2.3 Results
This section initially examines the internal consistency (Cronbach a) of scales
constructed for the study. Descriptive statistics for the pilot intervention cohort are
reported for each time point of data collection. The representativeness of respondents
at T2 and T3 compared to the entire study sample at T1 is also examined. Changes
over time for key concepts are examined and, finally, data is compared to the
comparison cohort reported in the previous chapter to ascertain treatment effects.
Details for statistically significant results are provided such as t statistics and F
statistics, however non-significant results are simply noted as not significant (or ns in
tables).
5.2.3.1 Scale Reliability
As the key variables of interest for analysis were composite scales, it was
important to examine the reliability of each scale to ensure that the relevant items
were internally consistent. The Cronbach’s alpha of each scale is shown in Table 5.2
as measured at T1, T2, and T3. Reliability for the Perceived Bahavioural Control
(PBC) was not examined as only two items were used for this construct (and three
items are technically required for a scale).
Table 5.2 Scale reliability at T1, T2, and T3 for the pilot intervention cohort Scale Cronbach’s a
T1 (n=518) T2 (n=369) T3 (n=32)
Safety attitudes 0.71 0.76 0.84
Family & friends influence 0.88 0.94 n/a
Positive riding peer influence 0.88 0.91 n/a
Risky riding intentions 0.88 0.87 n/a
Thrill seeking mcycle 0.89 0.87 0.97
Aggressive riding 0.76 n/a 0.73
Extreme speed and stunts (behaviour) n/a n/a 0.87
Bending road rules (behaviour) n/a n/a 0.84
Impairment (behaviour) n/a n/a 0.37
Emotional riding (behaviour) n/a n/a 0.62
Pushing limits (behaviour) n/a n/a 0.90
Group riding (behaviour) n/a n/a 0.36
All scales at T1 and T2 showed acceptable reliability, with Cronbach’s alpha
scores above 0.70. However, like the comparison cohort, the reliability of some of
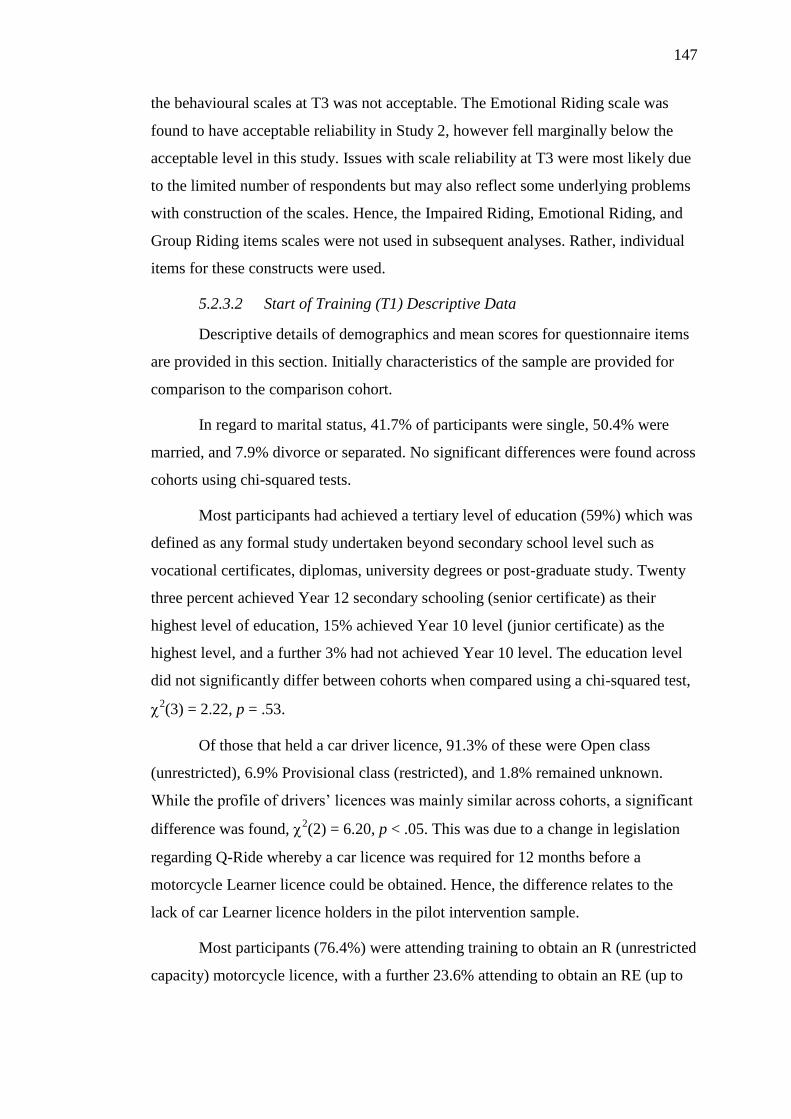
147
the behavioural scales at T3 was not acceptable. The Emotional Riding scale was
found to have acceptable reliability in Study 2, however fell marginally below the
acceptable level in this study. Issues with scale reliability at T3 were most likely due
to the limited number of respondents but may also reflect some underlying problems
with construction of the scales. Hence, the Impaired Riding, Emotional Riding, and
Group Riding items scales were not used in subsequent analyses. Rather, individual
items for these constructs were used.
5.2.3.2 Start of Training (T1) Descriptive Data
Descriptive details of demographics and mean scores for questionnaire items
are provided in this section. Initially characteristics of the sample are provided for
comparison to the comparison cohort.
In regard to marital status, 41.7% of participants were single, 50.4% were
married, and 7.9% divorce or separated. No significant differences were found across
cohorts using chi-squared tests.
Most participants had achieved a tertiary level of education (59%) which was
defined as any formal study undertaken beyond secondary school level such as
vocational certificates, diplomas, university degrees or post-graduate study. Twenty
three percent achieved Year 12 secondary schooling (senior certificate) as their
highest level of education, 15% achieved Year 10 level (junior certificate) as the
highest level, and a further 3% had not achieved Year 10 level. The education level
did not significantly differ between cohorts when compared using a chi-squared test,
2(3) = 2.22, p = .53.
Of those that held a car driver licence, 91.3% of these were Open class
(unrestricted), 6.9% Provisional class (restricted), and 1.8% remained unknown.
While the profile of drivers’ licences was mainly similar across cohorts, a significant
difference was found, 2(2) = 6.20, p < .05. This was due to a change in legislation
regarding Q-Ride whereby a car licence was required for 12 months before a
motorcycle Learner licence could be obtained. Hence, the difference relates to the
lack of car Learner licence holders in the pilot intervention sample.
Most participants (76.4%) were attending training to obtain an R (unrestricted
capacity) motorcycle licence, with a further 23.6% attending to obtain an RE (up to

148
250cc) motorcycle licence. This is similar to the profile of riders in the comparison
group, with no significant differences found using a chi-squared test, 2(1) = 1.80, p
= .18.
Most participants (61.4%) were classed as existing riders (i.e. had ridden
before), with 38.6% of participants classed as ‘new’ rider. Notably, the proportion of
new riders was higher than that of the comparison cohort (29.9%), 2(1) = 7.79, p <
.05. This is likely due to changes to Q-ride that took place in July 2008 whereby an R
class licence could only be obtained if graduating from an RE class. Hence, a higher
proportion of people who had never ridden before may have been attracted to obtain
a licence prior to the cut-off date although the proportion of R and RE licences did
not differ across cohorts across the entire time periods sampled. Essentially, any
spike in the number of riders obtaining a licence before the cut-off date was largely
counterbalanced by the subsequent dip in numbers following the cut-off period.
Merely, slightly more new riders were attracted to riding as a result.
Of the existing riders, 42.7% indicated they had never ridden on the road
before (same proportion as controls). A further 20.6% indicated they had one year or
less actual on-road riding experience. Seventy-six percent of existing riders had
ridden less than 1000kms on-road in the past year. Hence, like the comparison cohort
most of the overall sample had very minimal exposure to the traffic environment on a
motorcycle prior to the commencement of training. Also similar to the comparison
cohort, 53.4% of the existing riders had only two years or less previous off-road
riding experience.
Like findings from Study 2, the vast majority of intervention participants
rated all indices of motives for attending training as ‘very important’. Mean scores
and standard deviations for motives for attending training and motives for riding are
shown in Table 5.3. Notably, scores for motives for attending training were highly
skewed with little variation. When compared to scores for these items for the
comparison cohort there were no significant differences found using independent
means (between groups) t-tests, as shown in Table 5.3. Nonparametric Mann-
Whitney U-tests which do not rely on the assumption of normality of the distribution
of scores also confirmed that there were no significant differences between the
control and treatment groups for any motive for attending training.

149
Motives for riding that were rated highly (i.e. mean scores above five on a 7-
point Likert) by the majority of riders in the treatment group were: enjoyment / fun;
and practical aspects of riding (e.g. save on fuel costs, ease of parking) perhaps
reflecting the nature of recreational riding and commuting that attracts many people
to motorcycling. Motives for riding that were overwhelmingly rated as low in
importance (i.e. mean scores less than three on a 7-point Likert) were: to impress
others; and image. When compared to scores for these items for the comparison
cohort, between groups t-tests found a significant difference for the importance of
practical aspects of riding, t(876) = -3.25, p=.001, with the pilot intervention group
scoring higher. No other significant results were found between cohorts, indicating
that predominantly the same type of riding was likely to be undertaken by the two
samples following licensing.
Table 5.3 Mean scores and standard deviations for motives for attending training
and motives for riding for the treatment and comparison cohorts
Control Treatment p
M SD M SD
Motive for Attending Training
Important for me to learn how to control the bike 6.76 0.66 6.79 0.57 ns
Important for me to learn how to recognize hazards 6.69 0.70 6.76 0.59 ns
Important for me to learn how to be a safe rider 6.78 0.20 6.81 0.53 ns
Important for me to learn how to deal with emergency
situations 6.76 0.61 6.79 0.55
ns
Important for me to learn to ride in a range of conditions 6.66 0.72 6.66 0.75 ns
Motive for Riding
The feeling of freedom/no pressure is an important reason
for riding for me 4.70 1.74 4.71 1.69
ns
Enjoyment/fun is an important reason for riding for me 5.62 1.31 5.66 1.27 ns
Social aspects are an important reason for riding for me 3.98 1.85 3.93 1.82 ns
Image is an important reason for riding for me 2.20 1.42 2.18 1.34 ns
To impress others is an important reason for riding for me 1.84 1.21 1.77 1.13 ns
Practical aspects are an important reason for riding for me 4.85 2.08 5.26 1.84 .001
In regard to the stages of change for adopting safe riding practices, no
participants indicated they were in the precontemplation stage. Twenty-two percent
of the sample indicated they were in the contemplation stage, 32% indicated they
were in the preparation stage (i.e. ready to start adopting safe riding practices) and,

150
additionally, many of the active riders (47%) indicated that they were already in the
action or maintenance stage. These baseline findings were similar to those for the
comparison cohort as shown in Table 5.4 and a chi-squared test confirmed no
statistically significant difference between the cohorts.
Table 5.4 Start of training percentage of comparison and treatment cohort
participants in each stage of change
Precontemplation Contemplation Preparation Action Maintenance
Comparison nil 21.3 31.3 35.2 12.3
Treatment nil 21.5 31.7 39.0 7.9
The types of motorcycles that participants intended to ride in the next 12
months were: sports (28.6%), sports tourers (16.6%), tourers (6.3%), cruisers
(19.4%), trail bikes (14.7%), scooters (12.8%), and others such as postal delivery
motorcycles (1.5%). Fifty seven percent of respondents indicated that recreation was
their main purpose for riding, with the remaining 43% indicating that they rode most
predominantly for commuting purposes. The proportion of riders preferring various
types of motorcycles was generally similar to that of the comparison cohort and no
significant difference was found using a chi-squared test. Similarly, the proportion of
recreational riders compared to commuters did not significantly differ across cohorts.
Self-reported road crashes and traffic offences over the past three years were
measured at the start of training. Several different crash types are shown in Table 5.5
while riding a motorcycle, driving a car, or controlling any other vehicle. As
expected, few motorcycle crashes were recorded as most riders had limited exposure
to on-road riding prior to licensing. Also as expected, there were considerably more
minor crashes than injury crashes. There were a similar proportion of single-vehicle
and multi-vehicle crashes reported.
Table 5.5 Number of self-reported on-road crashes within the three years prior to
training (N=518).
Crash types Motorcycle Car Other Total
Single vehicle minor 9 68 3 80
Single vehicle injury 1 4 0 5
Multi vehicle minor 1 76 10 87
Multi vehicle injury 1 6 0 7
Total 12 154 13 179

151
Additionally, self-reported offences in the three years prior to training where
participants were fined by police are shown in Table 5.6. The number of overall
offences for each case ranged between zero and 15 (M = 1.12, SD = 1.48). Like the
comparison cohort, speeding was much more frequent than any other traffic offence,
with half the sample reporting at least one speeding offence.
Table 5.6 Number and percentage of participants with one or more self-reported
traffic offences within the three years prior to training (N=518)*
Offence types Number and percent of participants within each category
Nil offences 1 offence 2 offences >2 offences Missing
Speeding 251(50) 140(29) 63(13) 38(8) 26
Drink driving 472(96) 18(4) 1 1 26
Unlicensed 481(98) 9(2) 0 2 26
Running a red light 448(91) 40(8) 3(1) 1 26
Other 451(92) 35(7) 2 2 28
All Offences 204(42) 146(30) 81(17) 58(11) 29
*Percentages in brackets
Descriptive data for the key scales of interest at T1 (start of training) are
shown in Table 5.7. Scores on the Safety Attitudes scale were reasonably high,
indicating positive attitudes to safety. Similarly, scores on the Family and Friends
Influence scale and Riding Peer Influence scale were high, indicating that
participants felt that significant others did not support risky riding. Scores on the
Risky Riding Intentions scale were on average low, as were scores for Aggressive
Riding. Scores on the Thrill Seeking scale indicated some propensity for thrill
seeking on a motorcycle, although these too were on average low. Perceived
behavioural control was calculated as the mean of two questionnaire items (rather
than a complete scale) and scores on this variable were found to be moderate,
indicating that participants felt their safety was somewhat within their control.

152
Table 5.7 Mean item scores and standard deviations for psychosocial influences on
risky riding scales at T1*
n M SD
Safety attitudes 515 5.57 0.49
Family & friends influence 515 6.46 1.09
Riding peer influence 508 6.21 1.21
PBC 516 4.80 1.05
Risky riding intentions 515 2.12 1.12
Thrill seeking mcycle 302 2.85 1.27
Aggressive riding 264 1.82 0.76
* measured on 7-point Likert scales
Bivariate correlations between scales and other continuous variables of
interest are shown in Table 5.8. Whilst many of the relationships are statistically
significant, the strength of association was generally weak to moderate. However,
several associations are evident in relation to the theoretical concepts that formed the
framework for the intervention. For example, Intentions to Engage in Risky Riding
showed a significant (albeit low) positive association with PBC (r = .18, p < .01),
and significant negative associations with Safety Attitudes (r = -.36, p < .01) and
Riding Peer Influence (r = -.24, p < .01). There was no clear relationship between
Intentions to Engage in Risky Riding and Family and Friends Influence. In addition
to the central TPB constructs, Intentions to Engage in Risky Riding also showed a
significant positive correlation with Motorcycle Thrill Seeking (r = .30, p < .01).
Hence, the bivariate correlations at the start of training partially support the
prescribed relationships between Intentions to Engage in Risky Riding and the
variables that were proposed to be linked to such intentions within the modified TPB
framework utilised for the study.
Safety Attitudes also showed moderate negative correlations with the
Motorcycle Thrill Seeking and Aggression scales and moderate positive correlations
with normative influences in the form of both Family and Friends Influence and
Riding Peer Influence. Notably, Thrill Seeking was negatively associated with age
indicating that the propensity for using a motorcycle as a tool for thrill seeking
declined with age. Thrill Seeking also negatively correlated with Riding Peer
Influence (indicating a potential protective effect of riding peers) and was positively

153
correlated with Aggression and Risky Riding Intentions. Self-rated Skill showed
low-moderate positive associations with the number of years ridden off road and
Aggression. Relationships between the risk scales and categorical variables (e.g.
gender) are reported in later sections of this chapter where motorcycling subgroups
are examined.
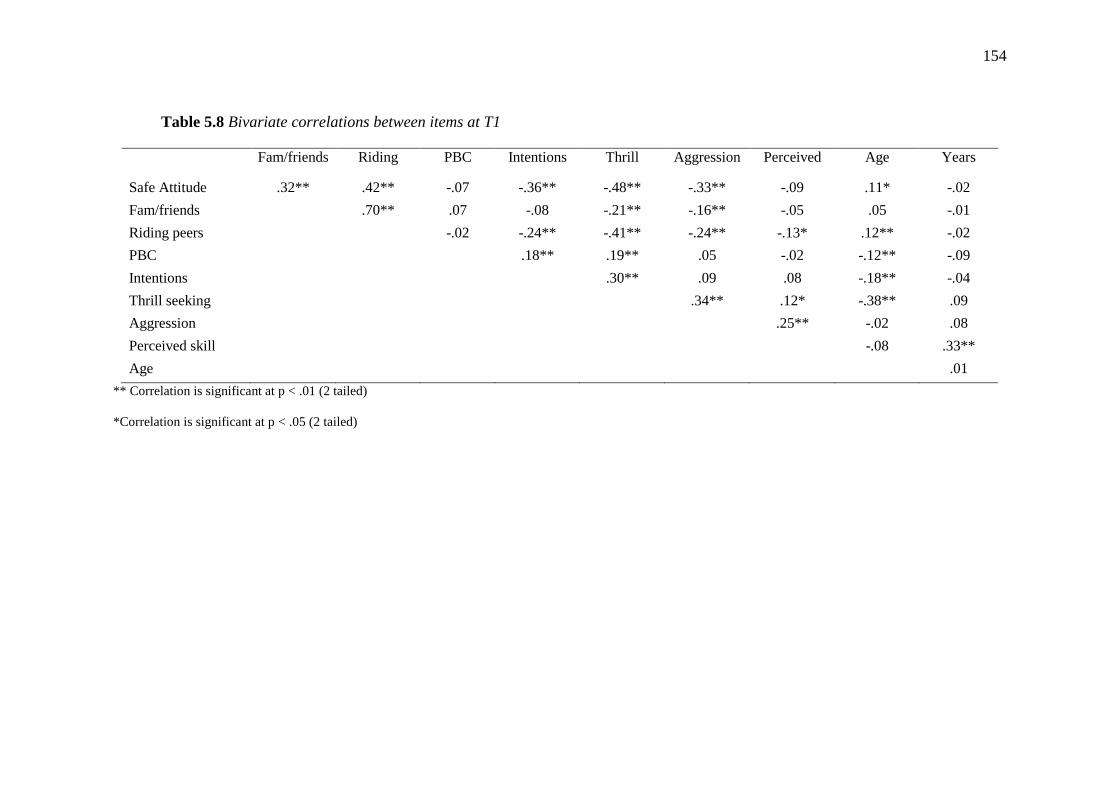
154
Table 5.8 Bivariate correlations between items at T1
Fam/friends Riding
peers
PBC Intentions Thrill
seeking
Aggression Perceived
skill
Age Years
ridden
Safe Attitude .32** .42** -.07 -.36** -.48** -.33** -.09 .11* -.02
Fam/friends .70** .07 -.08 -.21** -.16** -.05 .05 -.01
Riding peers -.02 -.24** -.41** -.24** -.13* .12** -.02
PBC .18** .19** .05 -.02 -.12** -.09
Intentions .30** .09 .08 -.18** -.04
Thrill seeking .34** .12* -.38** .09
Aggression .25** -.02 .08
Perceived skill -.08 .33**
Age .01
** Correlation is significant at p < .01 (2 tailed)
*Correlation is significant at p < .05 (2 tailed)

155
5.2.3.3 End of Training (T2)
As with the comparison cohort, some attrition in data was evident at T2.
Descriptive statistics separating the subset of participants that responded at T2 (n =
369) from those who did not (n = 149) are shown in Table 5.9 for all major scales
used in the study. For those who responded, mean scores were higher at T2 than at
T1 for Safety Attitudes, Family and Friends Influence, and Riding Peer Influence.
Conversely, lower mean scores are evident at T2 for PBC, Risky Riding Intentions,
and Motorcycle Thrill Seeking. With the exception of PBC, these findings indicate
that training was associated with changes in participants’ perceptions of risk in the
desired direction.
Table 5.9 Mean item scores and standard deviations for risk scales at T1 (for end of
training respondents and non-respondents) and at T2.
Time 1 Time 2 P value Eta Sq
T2 Respondents n M SD M SD
Safety attitudes 367 5.58 0.48 6.04 0.59 <.001 0.44
Family & friends influence 366 6.40 1.19 6.49 1.20 <.01* -
Riding peer influence 363 6.21 1.19 6.24 1.23 ns -
PBC 367 4.85 1.06 4.44 0.86 <.001 0.13
Risky riding intentions 367 2.16 1.15 1.87 0.97 <.001 0.06
Thrill seeking mcycle 240 2.88 0.08 2.55 1.16 <.001 0.12
Aggressive riding 215 1.81 0.72 n/a n/a - -
T2 non-respondents
Safety attitudes 147 5.57 0.51 n/a n/a - -
Family & friends influence 149 6.58 0.86 n/a n/a - -
Riding peer influence 145 6.25 1.24 n/a n/a - -
PBC 148 4.70 1.04 n/a n/a - -
Risky riding intentions 148 2.00 1.03 n/a n/a - -
Thrill seeking mcycle 59 2.74 1.26 n/a n/a - -
Aggressive riding 49 1.87 0.88 n/a n/a - -
*denotes significant result from Mann-Whitney U-test only. Other significant results are from paired
samples t-tests and confirmed with Mann-Whitney U-tests.

156
5.2.3.4 Start and End of Training Data Comparisons (T1 vs T2)
A repeated measures t-test found a significant increase in mean scores for the
Safety Attitudes scale from T1 to T2, t(366) = -17.01, p<.001. This suggests that
training had a positive influence on riders’ attitudes to road safety. A significant
decrease in mean scores for the Intentions to Engage in Risky Riding scale was
found at T2 using a repeated measures t-test, t(366) = 5.02, p<.001. This suggests
that riders reported to be less likely to intend to engage in future risky riding as a
function of training. Additionally, a repeated measures t-test found a significant
decrease in mean scores for the Motorcycle Thrill Seeking scale at T2 from T1,
t(239) = 5.73, p<.001. Comparisons for the influence of family and friends
(subjective norm) as well as the influence of riding peers (specific subjective norm)
between T1 and T2 were non-significant. The abovementioned significant findings
are consistent with that of the comparison cohort for the same risk scales. A repeated
measures t-test for PBC also revealed a significant decrease in scores between T1
and T2, t(366) = 7.42, p<.001. However this effect was not in the expected direction
and suggests that participants felt that their safety was less within their own control
at the end of training. Findings from all significant t-tests mentioned above were
confirmed using Mann-Whitney U-tests as some distributions were skewed.
Additionally, a significant increase in scores on the Family and Friends Influence
scale was found using a Mann-Whitney U-test (p<.01).
Effect sizes calculated using eta squared for the significant findings were in
accordance with procedures highlighted by Pallant (2007) and show a medium effect
size for Attitudes to Safety. Small effects effect sizes were found for PBC,
Motorcycle Thrill Seeking, and Intentions to Engage in Risky Riding.
Mean scores at T1 and T2 for the Self-rated Skill and Self-rated Safe Riding
variables are displayed in Table 5.10 for both males and females. Like the
comparison cohort, an increase in mean scores from T1 to T2 was evident for each
variable and each gender. A mean score of ‘3’ would indicate that, on the whole, the
sample rated themselves as ‘average’ compared to others. Self-rated skill was found
to be lower for females than males at the start of training, however was marginally
higher for females at the end of training.
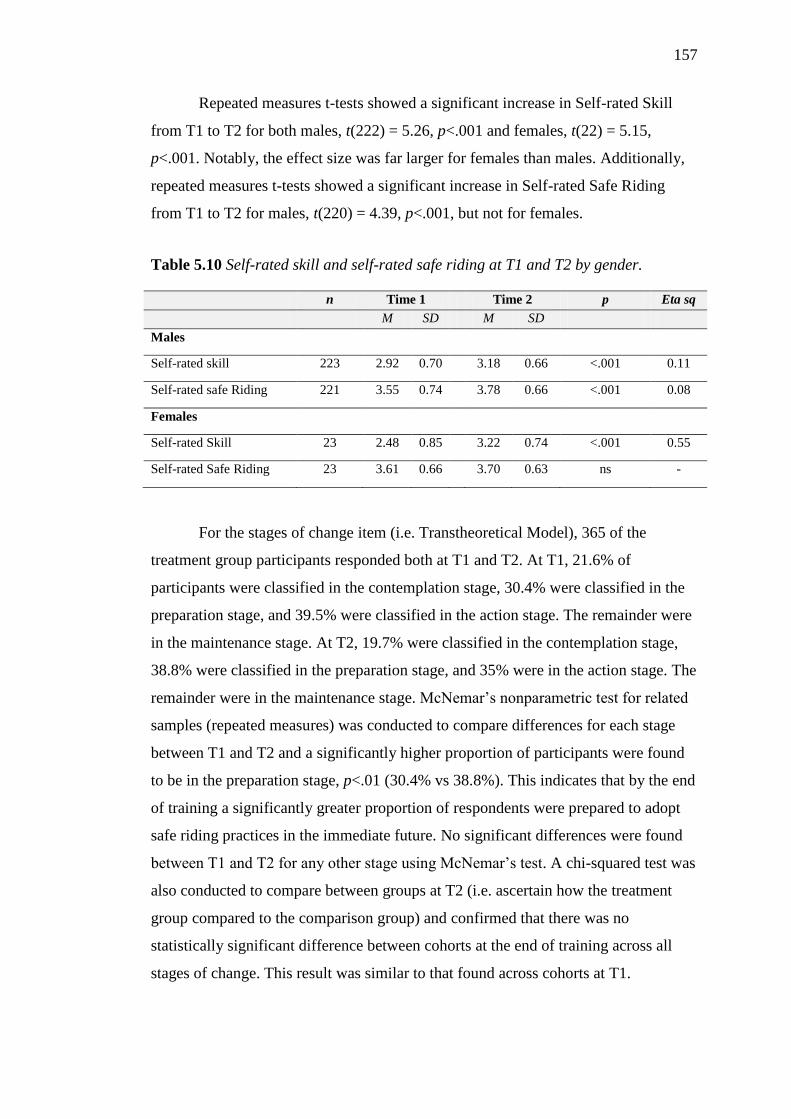
157
Repeated measures t-tests showed a significant increase in Self-rated Skill
from T1 to T2 for both males, t(222) = 5.26, p<.001 and females, t(22) = 5.15,
p<.001. Notably, the effect size was far larger for females than males. Additionally,
repeated measures t-tests showed a significant increase in Self-rated Safe Riding
from T1 to T2 for males, t(220) = 4.39, p<.001, but not for females.
Table 5.10 Self-rated skill and self-rated safe riding at T1 and T2 by gender.
n Time 1 Time 2 p Eta sq
M SD M SD
Males
Self-rated skill 223 2.92 0.70 3.18 0.66 <.001 0.11
Self-rated safe Riding 221 3.55 0.74 3.78 0.66 <.001 0.08
Females
Self-rated Skill 23 2.48 0.85 3.22 0.74 <.001 0.55
Self-rated Safe Riding 23 3.61 0.66 3.70 0.63 ns -
For the stages of change item (i.e. Transtheoretical Model), 365 of the
treatment group participants responded both at T1 and T2. At T1, 21.6% of
participants were classified in the contemplation stage, 30.4% were classified in the
preparation stage, and 39.5% were classified in the action stage. The remainder were
in the maintenance stage. At T2, 19.7% were classified in the contemplation stage,
38.8% were classified in the preparation stage, and 35% were in the action stage. The
remainder were in the maintenance stage. McNemar’s nonparametric test for related
samples (repeated measures) was conducted to compare differences for each stage
between T1 and T2 and a significantly higher proportion of participants were found
to be in the preparation stage, p<.01 (30.4% vs 38.8%). This indicates that by the end
of training a significantly greater proportion of respondents were prepared to adopt
safe riding practices in the immediate future. No significant differences were found
between T1 and T2 for any other stage using McNemar’s test. A chi-squared test was
also conducted to compare between groups at T2 (i.e. ascertain how the treatment
group compared to the comparison group) and confirmed that there was no
statistically significant difference between cohorts at the end of training across all
stages of change. This result was similar to that found across cohorts at T1.
158
Comparing T2 respondents with non-respondents
While most demographic characteristics and indices for risk propensity did
not vary between T2 respondents with non-respondents, between groups t-tests
revealed some significant differences between the two groups at baseline. As the
sample size and standard deviations varied between groups on all measures,
Levene’s test for equality of variance was utilised and equal variances were only
assumed for the purpose of significance testing where Levene’s test was not
breached.
Significantly lower mean scores were found at the start of training for the T2
respondent subset compared to non-respondents for age, t(496) = -2.67, p<.01, and
Family and Friends Influence, t(372) = -1.97, p=.05. Conversely, a significantly
higher mean score for red light offences in the last three years was found for the T2
respondents compared to non-respondents, t(483) = 3.32, p<.001.
Chi-squared analysis revealed that males were significantly more likely to
respond at T2 than females, 2(1) = 25.73, p < .001. As T2 measures were only
offered to those who finished training and met the licensing competencies, this
perhaps indicates that males were more likely to pass the licensing competencies.
Additionally, scooter and trail bike riders were more likely to respond at T2 than
tourer riders or sports tourer riders, 2(6) = 23.24, p = .001.
Overall, the differences between T2 respondents and non-respondents appear
to be not as pronounced in the treatment sample as in the compaison sample (see
Section 4.5.3.2). There was only one significant difference found for the major risk
scales (i.e. for Family and Friends Influence) between T2 respondents and non-
respondents in the treatment group compared to significant differences in many of
the risk scales in the comparison group. Still, these results suggest those who finished
training and completed the T2 measures were more likely to be younger, male, and
slightly higher risk takers than those who did not. It remains unknown if this was
because those who completed T2 measures were more capable of meeting the licence
competencies or if it was merely these riders who were more likely to respond at T2.
159
5.2.3.5 Statistical Comparisons for Riding Subgroups from T1 to T2
Like Study 2, difference scores were calculated on the key scales of interest
from T1 to T2 to determine if the training had any differential effect on various
riding subgroups. That is, mean item scores at T1 were subtracted from mean item
scores at T2 on each scale for each case. Hence, these analyses only involved the
subset of participants that responded at T2. Between-groups t-tests and one-way
ANOVAs were conducted to ascertain if the difference scores from T1 to T2
significantly varied across sub-groups.
When between groups t-tests were conducted for T1 to T2 difference scores
there were no significant findings as a function of gender, rider experience group
(new vs existing), purpose of riding (recreational vs commuting), or licence type (R
vs RE). A between groups t-test for participants aged 20yrs or younger compared to
those 21yrs or older also found no significant differences. Therefore, unlike the
comparison cohort, the pilot intervention showed no differential effects for these
various subgroups of riders.
For marital status, one-way ANOVAs revealed no significant effect regarding
difference scores between T1 and T2 for any of the key risk scales. One-way
ANOVAs as a function of the type of motorcycle intended to be ridden also revealed
no significant effect regarding difference scores between the start and finish of
training for any of the key risk scales.
For education level, homogeneity of variance assumptions of ANOVA were
unfortunately breached for several risk scales (using Levene’s test). Therefore, a
more robust test for equality of variance, the Welch test, was used and showed a
significant effect for the Motorcycle Thrill Seeking difference scores as a function of
education status. Post-hoc comparisons using Tukey’s adjustment (a = .025) found
that participants who did not complete Year 10 significantly differed from the other
education levels on Motorcycle Thrill Seeking difference scores (F(3,37) = 2.86,
p<.05). Those who had not achieved a Year 10 level education actually increased in
their propensity for thrill seeking as a function of training, whereas all other groups
decreased.

160
5.2.3.6 Self-report Post Licence Follow-up (T3)
Like Study 2, data gathered at T3 in this study was predominantly in regard to
self-reported riding behaviour and riding history since the time of training. However,
the follow-up period for this study was 12 months, not 24 months, as the comparison
group and treatment group follow-up studies were conducted concurrently online
(reflecting the inherent time constraints of the PhD).
Seven of the 39 respondents at T3 indicated that they had not ridden since
training and these cases were therefore excluded from further analyses as the purpose
of the study was to follow up riders once they had gained some on-road riding
experience. Hence, the final 32 valid respondents represented only 6% of the original
study sample that were contacted for follow-up at T3.
Of the 32 valid participants that completed the T3 self-report measures, 25
(78%) were male and 7 (22%) female. The median age was 40 years (M = 38yrs, SD
= 11yrs) with a range from 20-55 years. The distribution within age categories is
shown in Table 5.11. The distribution of ages across categories differs from that
found at T1 for the entire treatment group. For example, more than half of the T3
respondents were aged over 40 years compared to only 28% of the entire treatment
group at T1. The distribution of ages also differs from the T3 comparison group
respondents, with the treatment group (intervention) being older.
Table 5.11 Proportion of T3 respondents in each age category
Age (yrs) 17-24 25-29 30-39 40-49 50-59 60+
T1 Comparison 24% 17% 34% 16% 8% 1%
T3 Comparison 31% 18% 22% 22% 7% 0%
T1 Intervention 20% 20% 32% 21% 6% 1%
T3 Intervention 19% 10% 19% 36% 16% 0%
Twenty eight percent were single, 59% married or de-facto, and 13% were
separated or divorced. Sixty three percent had completed formal study or vocational
training since secondary school, with a further 25% having completed Year 12
(senior secondary school certificate) as their highest level of education, and 9%
having completed Year 10 (junior secondary school certificate) as their highest level.
One respondent indicated that they had never completed Year 10 (junior certificate)
161
at high school. The educational status indicates that the subsample of participants at
T3 were generally representative of the overall study sample at T1, however the age
distribution does not support the notion of representativeness.
Twenty five (81%) indicated they currently owned a registered motorcycle
(all in Queensland). Thirty three riders (72%) indicated that they rode at least
weekly, whilst a further five (16%) indicated they rode two to three times a month
(but less frequently than weekly). Four participants (12%) indicated that they rode
monthly or less frequently.
Half of the participants indicated that they rode less than 100kms per week,
and half indicated they rode between 100 and 499klms per week. No participants
rode more than 500klms per week. Half of the respondents indicated that they rode
mainly for recreational purposes, while 36% indicated that they rode mainly for
commuting purposes.
Only two participants (6%) reported involvement as controllers in one
motorcycle crash since training and one further participant (3%) reported being the
controller in two motorcycle crashes since training. No participants reported having
been cited for a traffic offence whilst riding a motorcycle since training. Like the
comparison cohort, the low number of motorcycling crashes and offences since
training unfortunately rendered further analyses for these variables impractical.
The types of motorcycles that participants reported riding most since training
were: sports (10%), sports tourers (16%), tourers (3%), cruisers (32%), trail bikes
(7%), scooters (23%), and others such as postal delivery motorcycles (9%). These
results are not representative of the type of motorcycle the entire study sample
indicated they intended to ride at T1 with a far higher proportion of cruiser (32% vs
19%) and scooter riders (23% vs 13%) responding at T3, and a far lower proportion
of sports bike riders (10% vs 29%) and trail bike riders (7% vs 15%). These results
also show quite a different distribution of the types of motorcycle ridden to that of
control respondents at T3 discussed in Chapter 4.
Only one rider indicated that they had received further training since their
licensing course. Twenty two percent of participants indicated they currently held an
RE class (restricted) motorcycle licence, whilst 78% held an R class (unrestricted).
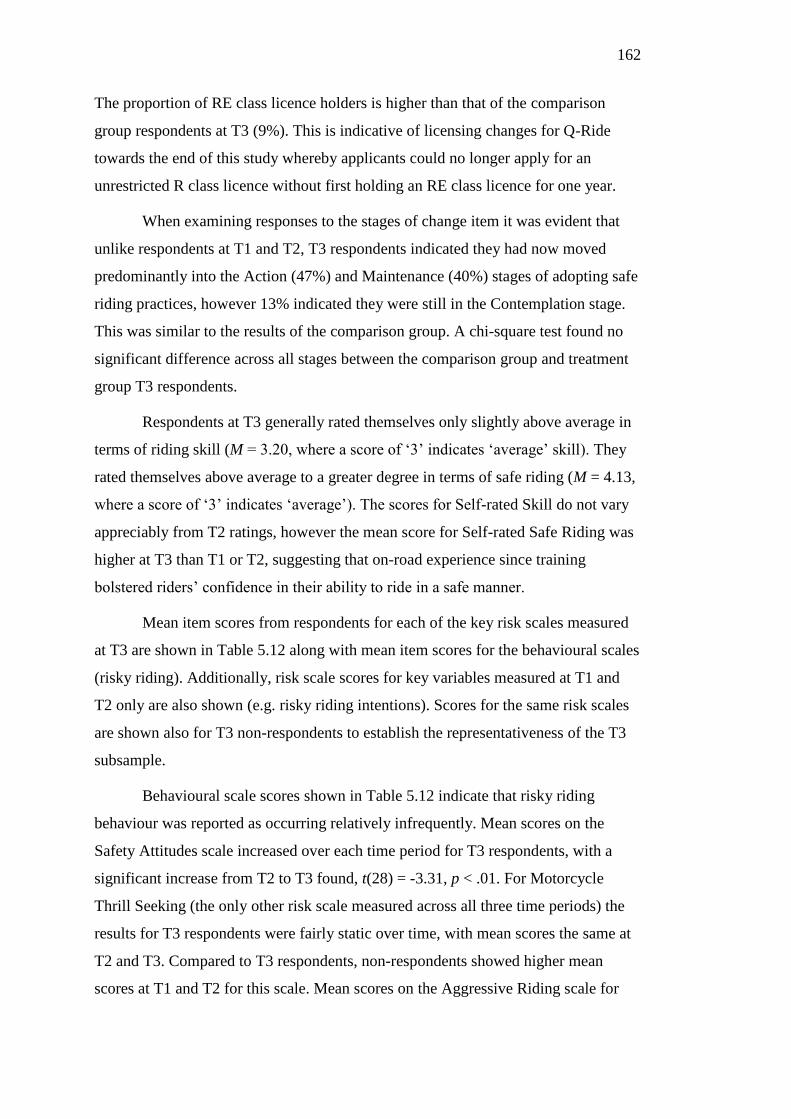
162
The proportion of RE class licence holders is higher than that of the comparison
group respondents at T3 (9%). This is indicative of licensing changes for Q-Ride
towards the end of this study whereby applicants could no longer apply for an
unrestricted R class licence without first holding an RE class licence for one year.
When examining responses to the stages of change item it was evident that
unlike respondents at T1 and T2, T3 respondents indicated they had now moved
predominantly into the Action (47%) and Maintenance (40%) stages of adopting safe
riding practices, however 13% indicated they were still in the Contemplation stage.
This was similar to the results of the comparison group. A chi-square test found no
significant difference across all stages between the comparison group and treatment
group T3 respondents.
Respondents at T3 generally rated themselves only slightly above average in
terms of riding skill (M = 3.20, where a score of ‘3’ indicates ‘average’ skill). They
rated themselves above average to a greater degree in terms of safe riding (M = 4.13,
where a score of ‘3’ indicates ‘average’). The scores for Self-rated Skill do not vary
appreciably from T2 ratings, however the mean score for Self-rated Safe Riding was
higher at T3 than T1 or T2, suggesting that on-road experience since training
bolstered riders’ confidence in their ability to ride in a safe manner.
Mean item scores from respondents for each of the key risk scales measured
at T3 are shown in Table 5.12 along with mean item scores for the behavioural scales
(risky riding). Additionally, risk scale scores for key variables measured at T1 and
T2 only are also shown (e.g. risky riding intentions). Scores for the same risk scales
are shown also for T3 non-respondents to establish the representativeness of the T3
subsample.
Behavioural scale scores shown in Table 5.12 indicate that risky riding
behaviour was reported as occurring relatively infrequently. Mean scores on the
Safety Attitudes scale increased over each time period for T3 respondents, with a
significant increase from T2 to T3 found, t(28) = -3.31, p < .01. For Motorcycle
Thrill Seeking (the only other risk scale measured across all three time periods) the
results for T3 respondents were fairly static over time, with mean scores the same at
T2 and T3. Compared to T3 respondents, non-respondents showed higher mean
scores at T1 and T2 for this scale. Mean scores on the Aggressive Riding scale for

163
the T3 respondents were higher at T3 than at T1. Scores at T1 for this scale were
similar for T3 respondents and non-respondents.
On the whole, the data in Table 5.12 indicates that trends are reasonably
similar between T3 respondents and non-respondents for the key risk scales. The
Family and Friends Influence variable showed the greatest difference in the trends
between T3 respondents and non-respondents over time. Lower scores for
Motorcycle Thrill Seeking and Family and Friends Influence may reflect the fact that
half of the T3 respondents were aged 40-60 years.
Table 5.12 Treatment group scale mean scores and standard deviations across all
time periods
Time 1 Time 2 Time 3
T3 Respondents n = 32 M SD M SD M SD
Emotional riding (Bhvr) - - - - 1.52 0.70
Pushing limits (Bhvr) - - - - 1.26 0.61
Speed & stunts (Bhvr) - - - - 1.38 0.81
Bending road rules (Bhvr) - - - - 2.20 1.00
Group riding (Bhvr) - - - - 2.95 0.97
Safety attitudes 5.55 0.42 6.14 0.51 6.36 0.81
Thrill seeking mcycle 2.56 1.39 2.37 1.25 2.37 1.28
Aggressive riding 1.79 0.67 - - 1.93 0.65
Risky riding intentions 2.14 1.36 1.84 1.09 - -
Family and friends influence 6.63 0.52 6.80 0.29 - -
Riding peer influence 6.34 0.90 6.33 1.07 - -
T3 Non-respondents (i.e. all other T1 participants) n = 439
Safety attitudes 5.58 0.49 6.03 0.59 - -
Thrill seeking mcycle 2.86 1.26 2.53 1.08 - -
Aggressive riding 1.82 0.76 - - - -
Risky riding intentions 2.12 1.10 1.88 0.96 - -
Family and friends influence 6.45 1.12 6.45 1.25 - -
Riding peer influence 6.20 1.23 6.22 1.25 - -
T3 intercorrelations between key variables
Pearson’s correlations between the key variables of interest at T3 are shown
in Table 5.13. This includes relationships between each of the self-reported risky

164
riding behaviours at T3 and also their relationship to psychosocial factors that
influence risky riding (e.g. the Safety Attitudes scale). Moderate to high correlations
were found between each of the risky riding behavioural scales (Extreme Speeds and
Stunts, Bending Road Rules, and Pushing Limits) supporting the notion that those
riders who take risks do so across a range of behaviours. Safety Attitude scale scores
were found to be significantly negatively associated with all the risky riding
behavioural scales and the Motorcycle Thrill Seeking and Rider Aggression scales as
expected. In addition, scores on Safety Attitudes were found to be significantly
positively associated with age (i.e. better regard for safety with increasing age).
Motorcycle Thrill Seeking showed a significant positive association with
each of the behavioural scales and a high positive association with Self Rated Skill
(although not significant). The Rider Aggression scale was most highly positively
associated with bending road rules. Notably, age showed a high negative correlation
with Self Rated Skill (i.e. younger riders rated their skill higher). Perceived
Behavioural Control showed a significant negative association with Rider
Aggression and Extreme Speeds and Stunts.
Table 5.13 Bivariate correlations between age, risk scales, T2 intentions, and riding
behaviour at T3
PBC
Thrill
Seeking Aggression
Speed
stunts
Pushing
limits
Bending
rules
Riding
Fatigued
Self
rated
skill Age
T2
Intentions
Attitudes .11 -.63** -.46** -
.79**
-.63** -.79** -.38* -.54 .36* -
PBC -.08 -.46** -
.79**
-.02 -.12 -.04 .49 .12 -
Thrill
Seeking
.16 .54** .49** .44* .16 .76 -.28 -
Aggression .41* .26 .70** .50** .07 -.44 -
Speed /
stunts
.88** .60** .34 -.61 -.21 .81**
Pushing
limits
.49 .20 .31 -.29 .83**
Bending
rules
.49** .33 -
.45*
.66**
Ride
Fatigued
.41 -.18 -
Self rated
skill
-
.94*
-
** Correlation is significant at p < .01 (2 tailed)
*Correlation is significant at p < .05 (2 tailed)
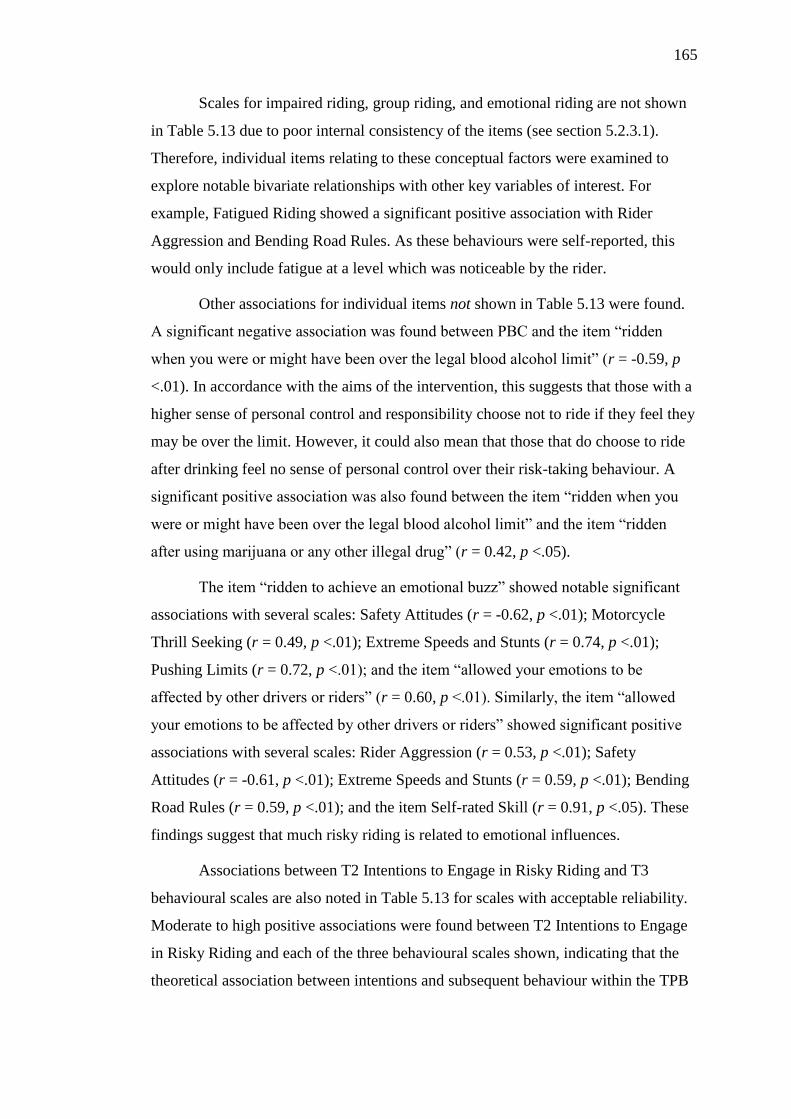
165
Scales for impaired riding, group riding, and emotional riding are not shown
in Table 5.13 due to poor internal consistency of the items (see section 5.2.3.1).
Therefore, individual items relating to these conceptual factors were examined to
explore notable bivariate relationships with other key variables of interest. For
example, Fatigued Riding showed a significant positive association with Rider
Aggression and Bending Road Rules. As these behaviours were self-reported, this
would only include fatigue at a level which was noticeable by the rider.
Other associations for individual items not shown in Table 5.13 were found.
A significant negative association was found between PBC and the item “ridden
when you were or might have been over the legal blood alcohol limit” (r = -0.59, p
<.01). In accordance with the aims of the intervention, this suggests that those with a
higher sense of personal control and responsibility choose not to ride if they feel they
may be over the limit. However, it could also mean that those that do choose to ride
after drinking feel no sense of personal control over their risk-taking behaviour. A
significant positive association was also found between the item “ridden when you
were or might have been over the legal blood alcohol limit” and the item “ridden
after using marijuana or any other illegal drug” (r = 0.42, p <.05).
The item “ridden to achieve an emotional buzz” showed notable significant
associations with several scales: Safety Attitudes (r = -0.62, p <.01); Motorcycle
Thrill Seeking (r = 0.49, p <.01); Extreme Speeds and Stunts (r = 0.74, p <.01);
Pushing Limits (r = 0.72, p <.01); and the item “allowed your emotions to be
affected by other drivers or riders” (r = 0.60, p <.01). Similarly, the item “allowed
your emotions to be affected by other drivers or riders” showed significant positive
associations with several scales: Rider Aggression (r = 0.53, p <.01); Safety
Attitudes (r = -0.61, p <.01); Extreme Speeds and Stunts (r = 0.59, p <.01); Bending
Road Rules (r = 0.59, p <.01); and the item Self-rated Skill (r = 0.91, p <.05). These
findings suggest that much risky riding is related to emotional influences.
Associations between T2 Intentions to Engage in Risky Riding and T3
behavioural scales are also noted in Table 5.13 for scales with acceptable reliability.
Moderate to high positive associations were found between T2 Intentions to Engage
in Risky Riding and each of the three behavioural scales shown, indicating that the
theoretical association between intentions and subsequent behaviour within the TPB

166
may be supported by this data to some extent. However, like findings for the
comparison cohort, results at T3 must be interpreted with extreme caution due to the
relatively small sample size and poor response rate (6.2% active riders).
When considering all available information, the assertion that the T3
subsample is representative of the overall study sample is contentious. Therefore,
regression analyses of the T3 data were not undertaken in regard to possible
theoretical relationships that may be present between intentions to engage in risky
riding at T2 and actual riding behaviour at T3. The results of such analyses would be
difficult to generalise with any confidence. Poor reliability of some behavioural
scales at T3 as previously shown in Table 5.2 also precluded meaningful analyses.
5.2.3.7 Comparing Program Effects for the Treatment and Comparison
groups
Comparisons across the treatment and comparison cohorts were undertaken
for the key variables of interest to ascertain any significant effects of the training
intervention over and above those of the standard training. Baseline comparisons
revealed that the treatment group scored significantly lower on the Safety Attitudes
scale than the comparison group at the start of training, t(835) = 8.21, p<.001. No
other scales were found to significantly differ across the cohorts at baseline. This
finding suggests that the two cohorts were largely the same in terms of psychosocial
influences on risk taking upon commencement of training, with the exception that the
pilot intervention participants had slightly worse attitudes to safety than the
comparison group participants.
To ascertain any immediate effects of the intervention over and above the
comparison group, difference scores (i.e. the degree of change) for the key risk scales
were calculated between the start (T1) and finish (T2) of training and compared
across cohorts as shown in Table 5.14.
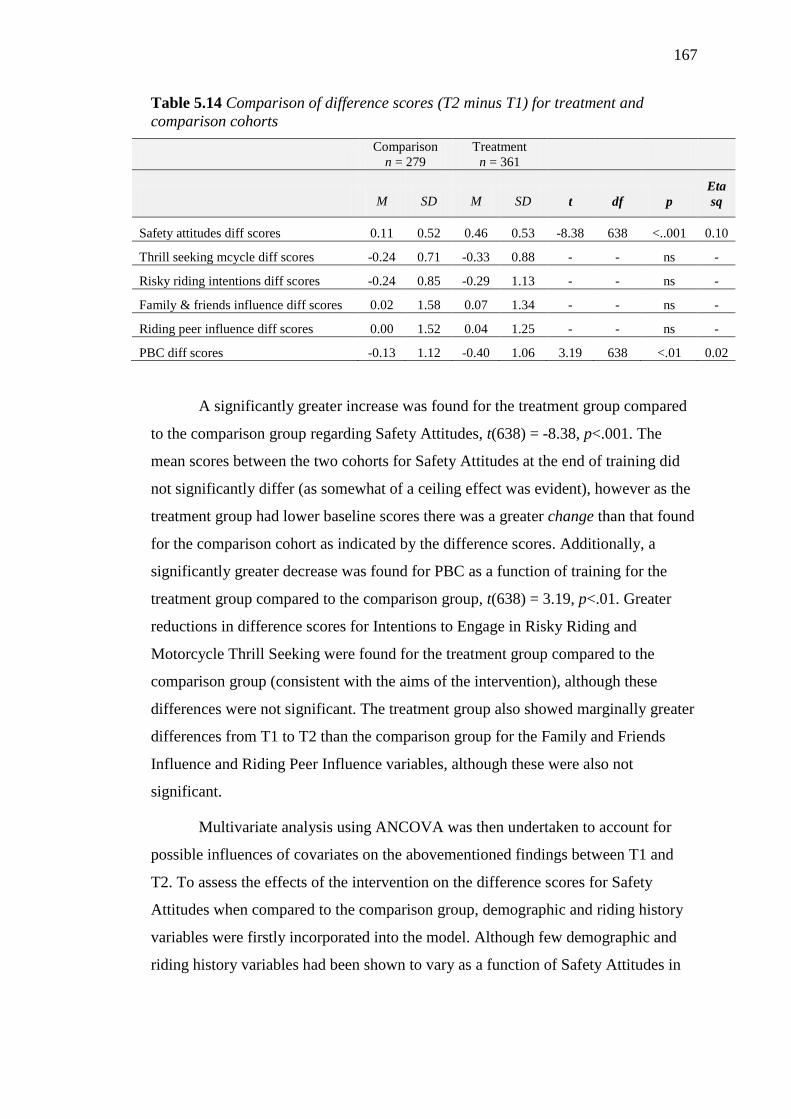
167
Table 5.14 Comparison of difference scores (T2 minus T1) for treatment and
comparison cohorts
Comparison
n = 279
Treatment
n = 361
M SD M SD t df p
Eta
sq
Safety attitudes diff scores 0.11 0.52 0.46 0.53 -8.38 638 <..001 0.10
Thrill seeking mcycle diff scores -0.24 0.71 -0.33 0.88 - - ns -
Risky riding intentions diff scores -0.24 0.85 -0.29 1.13 - - ns -
Family & friends influence diff scores 0.02 1.58 0.07 1.34 - - ns -
Riding peer influence diff scores 0.00 1.52 0.04 1.25 - - ns -
PBC diff scores -0.13 1.12 -0.40 1.06 3.19 638 <.01 0.02
A significantly greater increase was found for the treatment group compared
to the comparison group regarding Safety Attitudes, t(638) = -8.38, p<.001. The
mean scores between the two cohorts for Safety Attitudes at the end of training did
not significantly differ (as somewhat of a ceiling effect was evident), however as the
treatment group had lower baseline scores there was a greater change than that found
for the comparison cohort as indicated by the difference scores. Additionally, a
significantly greater decrease was found for PBC as a function of training for the
treatment group compared to the comparison group, t(638) = 3.19, p<.01. Greater
reductions in difference scores for Intentions to Engage in Risky Riding and
Motorcycle Thrill Seeking were found for the treatment group compared to the
comparison group (consistent with the aims of the intervention), although these
differences were not significant. The treatment group also showed marginally greater
differences from T1 to T2 than the comparison group for the Family and Friends
Influence and Riding Peer Influence variables, although these were also not
significant.
Multivariate analysis using ANCOVA was then undertaken to account for
possible influences of covariates on the abovementioned findings between T1 and
T2. To assess the effects of the intervention on the difference scores for Safety
Attitudes when compared to the comparison group, demographic and riding history
variables were firstly incorporated into the model. Although few demographic and
riding history variables had been shown to vary as a function of Safety Attitudes in

168
the T1 subgroup analyses, it was considered important to ascertain if they influenced
differences in the Safety Attitudes scale as a function of training (i.e. T2 minus T1
scores). The Safety Attitudes difference score was the dependent variable.
Independent variables in the model included were: age, gender, marital status,
education status, new or existing rider group, previous traffic offences, motorcycle
licence type (R or RE), T2 self-rated skill, and T2 self-rated safe riding ability. The
overall model was significant, F(10, 589) = 9.24, p<.001, partial eta squared = 0.14.
The effects of cohort (i.e. treatment vs comparison group) remained significant and
accounted for most of the effect of the model (albeit a small effect size), F(1, 589) =
61.31, p<.001, partial eta squared = 0.10. Age was the only other variable in the
model found to have a significant effect although the effect was minimal, F(1, 589) =
11.07, p<.001, partial eta squared = 0.02.
A further ANCOVA was conducted for the effects of cohort on the difference
scores for Safety Attitudes, this time with difference scores from the other risk scales
included as covariates. This included difference scores for Intentions to Engage in
Risky Riding, Family and Friends Influence, Riding Peer Influence, and Motorcycle
Thrill Seeking. As the risk scales had showed moderate intercorrelations at T1, it was
expected that these may have an effect in the model. Once again, the model was
significant, F(5, 431) = 18.09, p<.001, partial eta squared = 0.18. The effects of
cohort remained significant but small, F(1, 431) = 37.23, p=.001, partial eta squared
= 0.08. Other significant effects were found for Family and Friends Influence, F(1,
431) = 5.22, p<.05, partial eta squared = 0.02, and Intentions to Engage in Risky
Riding F(1, 431) = 23.32, p<.001, partial eta squared = 0.06. These findings
indicated that while the pilot intervention had a significant effect on Safety Attitudes,
this effect was not totally independent from that of other psychosocial influences in
risky riding. This is somewhat consistent with TPB concepts. However, the causal
nature and ordering of these relationships remains unclear.
For PBC difference scores (DV), ANCOVA was also conducted for the
effects of cohort when accounting for demographic and riding history variables. The
overall model was not significant. Another ANCOVA was conducted using the other
risk scale difference scores as covariates. This model was significant, with a small
effect size, F(6, 431) = 3.28, p<.01, partial eta squared = 0.04. The effects of cohort
remained significant, F(1, 431) = 11.14, p=.001, partial eta squared = 0.03, and no

169
other variables were found to have a significant effect. Collectively, the ANCOVA
findings show a very minimal effect of the type of training on PBC. A more
pronounced effect was found for the type of training on Safety Attitudes although the
magnitude of the effect was still small.
End of training between-groups comparisons for risky riding intentions
A between groups t-test was conducted to ascertain if the pilot intervention
resulted in lower intentions to engage in risky riding than the comparison group at
T2. The result was found to be non-significant. There was little difference observed
between the mean scores for the two groups, with the treatment group (pilot
intervention) scoring only marginally higher (M = 1.88, SD = 0.97).than the
comparison group (M = 1.84, SD = 0.95).
Each of the eight items from the Intentions to Engage in Risky Riding scale
was then compared between the control and treatment groups for scores at the end of
training. Once again, no statistically significant differences were found using
between-groups t-tests.
T3 comparisons between the treatment and comparison groups
For follow up after licensing, riding behaviour scores at T3 were also
compared between the control and treatment cohorts as shown in Table 5.15. These
related to self-reported risky riding at follow-up, although it must be noted that the
follow-up period differed between the two cohorts as previously mentioned (control
24mth, intervention 12mth).
A significantly lower level of self-reported Emotional Riding was reported by
the treatment group than the comparison group, t(73) = 2.74, p <.01, although due to
the difference in follow-up duration these results must be interpreted with caution.
No other significant differences were found for other riding behaviours using t-tests,
although lower scores were observed in all the means for the intervention group.
Nonparametric Mann-Whitney U-tests were conducted as some scales were skewed,
and it was found that the treatment group scored significantly lower on the Pushing
Limits scale (p<.05) and the Extreme Speeds and Stunts scale (p<.05) in addition to
the Emotional Riding scale (p<.01). As both the control and treatment samples at T3
were small and scale reliability was found to vary across cohorts, results may not be
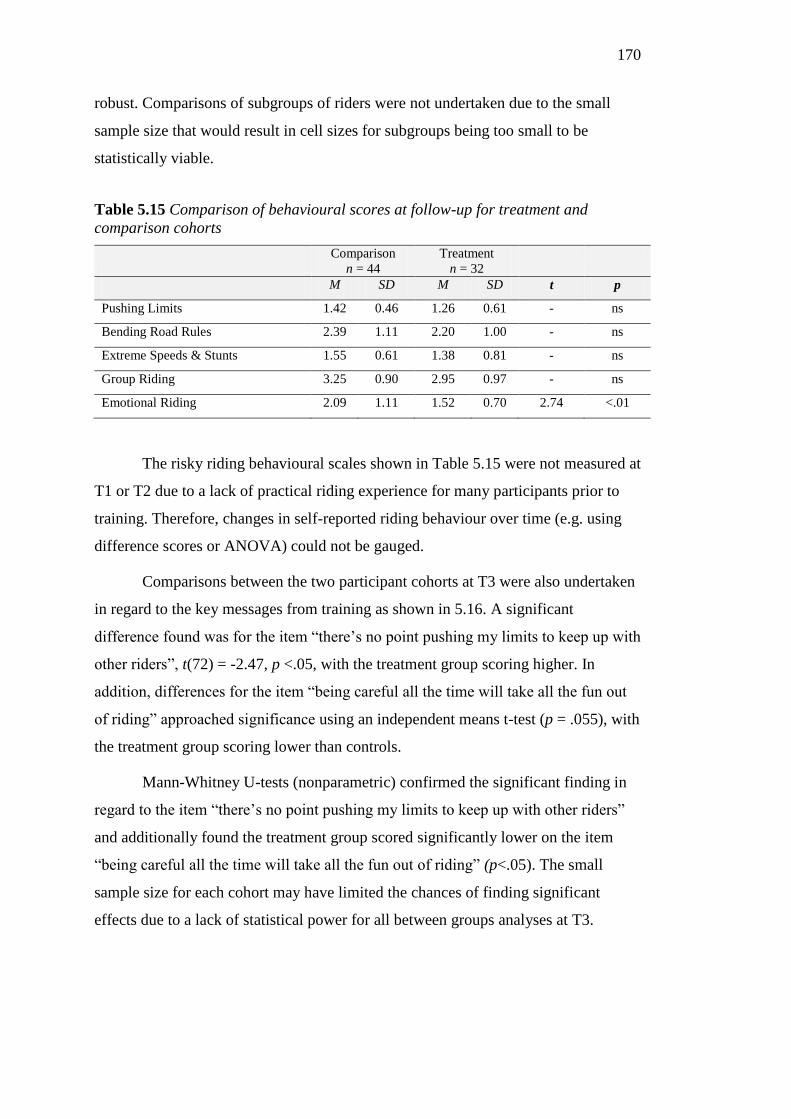
170
robust. Comparisons of subgroups of riders were not undertaken due to the small
sample size that would result in cell sizes for subgroups being too small to be
statistically viable.
Table 5.15 Comparison of behavioural scores at follow-up for treatment and
comparison cohorts
Comparison
n = 44
Treatment
n = 32
M SD M SD t p
Pushing Limits 1.42 0.46 1.26 0.61 - ns
Bending Road Rules 2.39 1.11 2.20 1.00 - ns
Extreme Speeds & Stunts 1.55 0.61 1.38 0.81 - ns
Group Riding 3.25 0.90 2.95 0.97 - ns
Emotional Riding 2.09 1.11 1.52 0.70 2.74 <.01
The risky riding behavioural scales shown in Table 5.15 were not measured at
T1 or T2 due to a lack of practical riding experience for many participants prior to
training. Therefore, changes in self-reported riding behaviour over time (e.g. using
difference scores or ANOVA) could not be gauged.
Comparisons between the two participant cohorts at T3 were also undertaken
in regard to the key messages from training as shown in 5.16. A significant
difference found was for the item “there’s no point pushing my limits to keep up with
other riders”, t(72) = -2.47, p <.05, with the treatment group scoring higher. In
addition, differences for the item “being careful all the time will take all the fun out
of riding” approached significance using an independent means t-test (p = .055), with
the treatment group scoring lower than controls.
Mann-Whitney U-tests (nonparametric) confirmed the significant finding in
regard to the item “there’s no point pushing my limits to keep up with other riders”
and additionally found the treatment group scored significantly lower on the item
“being careful all the time will take all the fun out of riding” (p<.05). The small
sample size for each cohort may have limited the chances of finding significant
effects due to a lack of statistical power for all between groups analyses at T3.

171
Table 5.16 Comparisons of scores for key training messages at follow-up for
treatment and comparison cohorts*
Comparison
n = 44
Treatment
n = 32
M SD M SD t p
Being careful all the time will take all the fun
out of riding 2.48 1.91 1.73 1.36 - ns
It’s important to look after mates when riding
together 6.40 0.92 6.22 1.52 - ns
You don’t have to be a highly skilled rider to be
a safe rider 4.82 1.82 5.50 1.78 - ns
There’s no point pushing my limits to keep up
with other riders 5.59 1.74 6.43 1.19 -2.47 <.05
I’m not likely to suffer any bad consequences if
I choose to bend the road rules 2.18 1.73 1.63 1.01 - ns
*scored on a 7-point Likert scale
5.2.4 Discussion – Interim Outcome Evaluation
The interim outcome evaluation aimed to determine what effects the pilot
intervention had on self-reported influences on risky riding immediately following
training, and riding behaviour following licensing. Most previous rider training
evaluations have focused on determining effects on crash involvement and traffic
offences as these are the most important outcome indicators for safe riding. Unless
very large sample sizes are utilised, attempting to determine the effects of training on
crashes is likely to result in a lack of statistical power due to the relatively rare nature
of crashes. Intermediate measures such as self-reported attitudes, intentions, and
behaviours are not definitive in their influence on rider safety; however inform areas
where training and education may be developed. Hence, this study provided insight
into the mechanisms involved in addressing risk taking that many previous driver
and motorcycle rider training evaluations have not.
Five specific hypotheses were formulated for this study relating to the
overarching research questions RQ3 and RQ4 and the further breakdown of issues as
noted at the commencement of this chapter. The discussion of findings will address
each of these in turn in the following sections to determine if the stated goals of the
pilot intervention were met.
172
5.2.4.1 Hypothesis 1
The first hypothesis predicted that the enhanced training package including
the intervention would have greater immediate effects on psychosocial influences on
risky riding than a traditional training program. The findings showed that the pilot
intervention had an effect in the intended direction on several of the key variables
between T1 and T2. However, only the participants’ attitudes toward safety were
found to significantly change in the desired direction over and above that of the
comparison group. Therefore, only partial support was found for the first hypothesis.
Interestingly, PBC was found to change to a greater extent for the treatment group
than the comparison group, but in the direction opposite to that which the
intervention aimed to achieve.
Attitudes
Watson et al. (2007) found that attitudes were an important predictor of
intentions to engage in engage in risky riding in a sample of licensed riders. Sexton
et al. (2004) profiled motorcyclists’ attitudes and motivations and found that these
shaped particular riding styles that contributed to crash involvement. For example,
riders that expressed an attitude supporting speeding were shown to commit more
control errors that, in turn, contributed to crashes. Attitudes to safety also formally
underpin the range of riding competencies within the Q-Ride licensing system.
Hence, any positive change in attitudes as a function of training can be seen as a
valuable outcome.
As different attitudinal items were used in this study to the Watson et al.
(2007) study, direct comparisons cannot be made for scale scores. An evaluation of
Q-Ride by Watson et al. (2003) did however use some of the same items to this study
(items reverse scored). The mean scores for these items for both the comparison
group and the intervention group in this study at T3 were marginally more favourable
than licensed riders in the Watson et al. (2003) Q-Ride evaluation once the scores
were adjusted for the scoring key. This may reflect the type of clientele that the
partner training organisation attracts compared to other Q-Ride providers.
Importantly, motorcycle licence training provides a window of opportunity to
change attitudes to some degree. The finding in the current study that attitudes
towards safe riding can be modified during licence training offers encouragement

173
that this is worth pursuing in future programs. Establishing positive attitudes to
safety before riders commence unaccompanied riding provides a platform from
which they might assess future risks with greater consideration. Other motorcycle
licence training programs such as the MSF BasicRider course in the United States
now also aim to address attitudes to safety as part of their program, however no
evaluations of licensing programs of this nature have been published to date. The
findings from this study lend credence to this approach in that, as a basic starting
point, attitudes can be shaped by training/education. Given the moderate-high
strength of association found between attitudes and a range of self-reported risky
riding behaviours for the T3 subsample (albeit with limitations), any positive change
in attitudes could be regarded as a potential benefit to road safety.
Broughton et al. (2009) also used self-report data to evaluate the RIDE traffic
offender program for motorcyclists in Great Britain. The research included self-
reported measures of attitudes (deemed Deviant Beliefs) and found that intervention
participants’ scores decreased as a function of training, compared to a comparison
group whose scores remained stable. While the RIDE course targeted a different
population of riders to the Three Steps to Safer Riding, these findings too are
encouraging for the shaping of attitudinal factors by training/education programs.
Subjective norms
Subjective norms were examined in this study in terms of: 1) the influence of
family and friends; and 2) the influence of riding peers. Within the traditional TPB
framework, norms are viewed as one factor underpinning behavioural intentions
(Azjen, 1991). While ‘significant others’ that may influence norms are often family
and friends, a specific subjective norm variable, Riding Peer Influence, was
incorporated into this study following findings from Watson et al. (2007) that
showed that risky riding was more likely to be influenced by other riders than by
family and friends. Motorcycling is predominantly a male activity and recreational
riding is often undertaken in groups. This presents considerable scope for peer
influence when riding once licensed. Other road safety campaigns are also framed
around the concept of ‘mates’ to raise awareness of possible positive and negative
peer influence (e.g. the Victorian TAC Mates campaign).
174
Findings of this study showed that there was no significant difference
between the treatment group and comparison group from T1 to T2 for either variable
measuring normative influence. However, this result was somewhat expected as
many participants had not commenced active on-road riding at the time of
measurement. Their perception of what significant others thought of risky riding
might only be expected to become meaningful at follow-up (once unsupervised
riding had commenced) and not as an immediate function of training.
A potential benefit of the Three Steps to Safer Riding Program for
participants is insight into how their choice of riding companions may affect their
risk taking. As the intervention specifically raises awareness of the likely influence
of riding peers and how to manage such influence, this issue requires measurement
rather than their perception of what peers might think of their risk taking. Hence,
better mapping of questionnaire measures onto what the intervention aimed to
change may have been beneficial.
Perceived behavioural control
PBC difference scores between T1 and T2 were found to decrease
significantly more for the treatment group than the comparison group. That is, the
intervention participants perceived that they had less control over their own
behaviour as a function of training than the standard program participants did. This
finding was contrary to a key message from the pilot intervention that riders should
assume responsibility for their own action.
The study by Watson et al. (2007) that was a precursor to this program of
research found that PBC was not a strong predictor of intentions for future risky
riding, or for self-reported risky riding behaviour. For this reason PBC was not
planned as a central aspect of the pilot intervention. Two items formed the basis for
measurement of PBC in this evaluation: 1) “I'm the only one responsible for the way
I ride”; and 2) “avoiding risks on a motorcycle is largely a matter of self-control”. It
is difficult to reconcile why decreased PBC was found, however a potential reason
may be that the intervention provided somewhat of a ‘reality check’ for participants,
thereby reducing their perceptions of being able to control their environment. The
pilot intervention aimed to raise awareness of how risk taking may increase the
potential for conflicts with other traffic or roadside objects. However, possibly this

175
merely highlighted the vulnerability of motorcycling to participants and they failed to
see the link between their own behaviour and potential conflicts. Their perceived
susceptibility to injury may have been externalised (i.e. at the mercy of the road
environment) rather than internalising the key message. The findings may simply
reflect a realistic awakening by participants to the dangers of motorcycling that were
generated by the program material.
Another potential reason for this finding is the lack of a complete scale for
PBC. Possibly the two items do not represent the same underlying concept. Hence,
future refinement of the intervention should consider more items for PBC in the
questionnaires for evaluation purposes (where the reliability of the scale can be
assessed).
The exact nature of the relationship between the intended intervention
message and the findings remains unknown and therefore requires further
investigation in future studies which could include more questionnaire items
specifically relating to PBC. Another option for future studies may be to also
complement the PBC construct with an item relating to perceived crash vulnerability.
While perceived crash vulnerability was not included in the modified TPB
framework for this program of research, it may assist to clarify the link between PBC
and intentions and also PBC and behaviour, as increased perceived control over
one’s risk taking behaviour may potentially link to an increased awareness of crash
vulnerability.
Thrill seeking
The propensity for thrill seeking on a motorcycle was also found to be
reduced by the intervention but not significantly more than in the traditional standard
training. This may be an artefact of the study design more than a weakness of the
intervention. As the standard traditional training program (control) was also found to
reduce the propensity for thrill seeking, this may reflect the difficulties inherent in
finding an effect with this comparison group as opposed to a ‘no training’ group.
Another possible explanation may be that this concept reflects a basic underlying
personality dimension, sensation seeking. If the concept of Thrill Seeking is viewed
as a personality trait then it could be argued that this should be stable over time and
176
unlikely to change as a function of training/education. However, the pilot program
conceptualised the issue more as a desire to engage in thrill seeking and, therefore, of
a psychological nature and something that might be subject to change with exposure
to information regarding the dangers of adopting this approach to riding.
Different studies frame the desire for thrill seeking on a motorcycle in
different terms. However the central tenet of hedonic motives is consistent across
several studies. Broughton et al. (2009) also examined this concept that they termed
“Thrill Culture” and found no significant reduction in scores on this scale for their
intervention group compared to a comparison group. Watson et al. (2007) framed the
same items used in the current study as the “Sensation Seeking” scale in their study
and found it to be a significant predictor of intentions for future risky riding and self-
reported risky riding behaviour. While the Watson et al. study was a precursor to the
program of research undertaken for this PhD, the terminology was changed for this
study to more accurately align with the original source of the items: the Thrill
Seeking subscale of the Driver Stress Inventory (Matthews et al., 1997). The Watson
et al. (2007) study did not report mean scores for their Sensation Seeking variable so
direct comparisons to this study cannot be made. However, mean items scores for the
Thrill Seeking scale found at T1 in this study were consistent with those found for
the same items in a sample of 247 car drivers in Australia (Rowden et al., 2011).
When considering all of the abovementioned concepts, it appears that the
pilot intervention had some immediate benefit in terms of changing motorcyclists’
way of thinking about risk taking. These intermediate measures offer some indication
of the possible benefits of addressing risk taking during licence training.
5.2.4.2 Hypothesis 2
In the theoretical framework of the study, the Theory of Planned Behaviour,
intentions to engage in risky riding should be the most pertinent and direct predictor
of actual behaviour. An examination of the participants’ intentions to engage in
future risky riding at the end of training revealed no significant difference between
the comparison group participants and the pilot intervention participants. This was
for the overall Intentions to Engage in Risky Riding scale and also for each of the
eight intention items. Therefore, the hypothesis that intentions to engage in risky
riding would be lower for the pilot intervention group than the comparison group is
not supported.

177
Additionally, analysis of the difference scores across cohorts indicated that
intentions to engage in risky riding were significantly reduced between T1 and T2 in
the Three Steps to Safer Riding intervention; however this was not found to be over
and above the effect of the standard training program. This finding for difference
scores, and the specific finding in relation to scores at the end of training, may partly
be an artefact of the study design as the standard training program was also found to
reduce intentions for risky riding. As a “no training” comparison group would have
introduced a self-selection bias, the selection of the standard training program
participants for comparison was a necessary compromise. Hence, the lack of
statistically significant findings may reflect the positive benefits of the standard
training program rather than indicating that the pilot intervention was not effective in
reducing intentions for risky riding.
Questionnaire design may also have influenced the findings. The eight items
used to form the Intentions to Engage in Risky Riding scale may not have adequately
reflected the specific key messages of the intervention. While the items are a
representation of dangerous acts that could be undertaken in future riding, there was
not specific focus on all of these within the actual intervention program. The
questionnaire items were unfortunately developed for measurement of the
comparison cohort which preceded intervention development. Better alignment of
questionnaire items and intervention material may have yielded greater changes in
self-reported intentions for future risky riding.
5.2.4.3 Hypothesis 3
This hypothesis predicted that effects for psychosocial influences on risky
riding found from training would be maintained following licensing for the pilot
intervention participants. This is important as riders may be negatively influenced by
others when they commence active riding or they may potentially disregard safety
information learnt from training as they learn from experience. If they try unsafe
behaviours and do not experience any immediate negative consequences, then the
unsafe behaviour may be strengthened and safety attitudes diminished.
Mean scale scores upon follow up at 12 months post licence showed that
riders’ attitudes to safety were not diminished compared to scores immediately

178
following training. In fact a significant increase was found from T2 to T3 for scores
on the Safety Attitudes scale. Additionally, mean scores for the propensity for thrill
seeking were stable across T2 and T3 (an increase would indicate increased
likelihood of thrill seeking). Both of the above findings support the hypothesis. No
other psychosocial influences on risk taking were measured at both T2 and T3 due to
the length of the T3 questionnaire. Aggression when riding was not measured at T2,
however T3 mean scores were marginally higher than at T1, indicating some
increased aggression as riding experience is gained. This finding fails to support the
hypothesis.
The maintenance of positive attitudes and motives regarding risk taking was
an important outcome for any road safety training program. Previous research has
showed that many motorcycle crashes occur in the first six months after licensing
(Billheimer, 1991). This could be due to insufficient vehicle control or hazard
perception skills, but also could be partly due to risk taking. Licence training courses
should not only aim to develop vehicle control skills that endure over time, but also
attitudes to safety that keep dangerous behaviour in check as experience is gained.
While the findings must be interpreted with caution as very few people responded
upon follow up, this is further encouragement that the intervention may have some
lasting effect. Further data when the full intervention is implemented as part of the
broader project should add clarity to this issue.
5.2.4.4 Hypothesis 4
Hypothesis 4 predicted that risky riding behaviour measured at T3 would be
significantly lower for the treatment group compared to the comparison group.
Overall, only partial support was found for the hypothesis. Comparisons for self-
reported riding behaviour upon follow up showed that the treatment group scored
significantly lower on the measure of emotional riding than the comparison group.
While mean scores on all other behavioural clusters were, as expected, lower for the
treatment group than the comparison group, none of these differences were found to
be statistically significant using t-tests. However, when the non-parametric Mann-
Whitney U-test was used, significantly lower scores for the treatment group were
found in regard to the behavioural clusters for pushing limits and extreme speeds and
stunts.
179
The importance of emotion and feelings to motorcycling has been noted in
some previous research (e.g. Tunnicliff, 2005; Burgess, 2004) however has not been
specifically evaluated as a function of training to the author’s knowledge. The
finding in this study that the pilot intervention participants reported less emotional
riding than those receiving standard traditional training is encouraging as emotional
stress may not only increase risky behaviours but may potentially also impede
information processing for some individuals (Matthews, 2001).
A possible reason why scores on some constructs (e.g. impaired riding) were
not found to differ between cohorts is that some behaviours received little or no
attention in the pilot intervention due to time constraints within the Q-Ride licensing
regime. Again, this is an issue related to the lack of mapping of the questionnaire
items onto the key intervention issues and messages as the questionnaire was
originally designed with longer duration of the intervention in mind.
Another possible reason for a lack of differences between the treatment and
comparison groups is that, as mentioned previously, the standard (control) training
delivered by the industry partner organisation already informally addressed risk
taking behaviour in an ad hoc manner. The level of risky riding found in the
comparison group at T3 was generally very low across all behavioural clusters. This
may be an artefact of the type of clientele that the industry partner organisation
attracts due to the company’s marketing of safety or it may be that more safety
conscious individuals chose to respond at T3. The representativeness of the T3
subsample for the comparison group, as discussed in Chapter 4, was questionable.
Unfortunately, the very low response rate at T3 for both the comparison
group and the treatment group means that the findings must be regarded with caution
and are indicative only. The findings do however offer some encouragement for the
future full intervention.
5.2.4.5 Hypothesis 5
This hypothesis posited that intentions to engage in future risky riding at T2
for the treatment group would statistically predict risky riding behaviours at T3.
However, this hypothesis was not examined through regression analyses as planned
for several reasons:

180
the very low sample size at T3 for the treatment group;
the lack of representativeness of that subsample of treatment group
respondents at T3; and
the low reliability (Cronbach’s a) for several risky riding behavioural scales.
However, simple correlations between T2 intentions and the range of T3
behaviours (for those who responded at T3) were moderate to high, indicating a
reasonably strong relationship. Further data beyond the scope of this dissertation will
be gathered for the broader ARC project. Such data may provide further insight into
the theoretical relationships within the TPB as applied to rider education for risk
taking.
5.2.4.6 Effects for Motorcycling Subgroups
The examination of results by rider subgroup between T1 and T2 showed
little differential effect of the Three Steps to Safer Riding program across different
types of riding or demographic characteristics. The only difference found was for
riders who had a lower level of education subsequently scoring higher on the
Intentions to Engage in Risky Riding scale than riders with other levels of education.
It is unknown to what extent literacy issues influenced this result, however
differences on other variables would probably also be expected if there were
difficulties understanding the questionnaire or the program.
The pilot intervention aimed to address all types of riders and it is therefore
encouraging to find that the overwhelming majority of subgroups changed equally
during training. As licensing systems cannot discriminate between type of riders,
these findings add strength to the commercial viability of the Three Steps to Safer
Riding for application within licensing systems.
5.2.4.7 Implications
The study had implications for the further development of the intervention
program but also for motorcycle rider training and licensing more broadly. Each of
these is discussed in turn in this section.
Further development of the Three Steps to Safer Riding program
The findings suggest that the pilot program is having a positive immediate
influence on attitudinal and motivational factors, however some of the effect is
181
masked in the evaluation due to the nature of the comparison group. The findings are
less clear regarding the longer term benefits of the program, but are encouraging.
Further development of the program must look to capitalise on the strength of the
pilot in shaping rider attitudes to safety, and improve in other areas.
As intentions for future behaviour have generally been found to be the
strongest predictor of behaviour within the TPB theoretical framework in other
studies (see Armitage &Connor, 2001 for a complete review), it is important for the
Three Steps to Safer Riding to particularly focus on shaping how riders think about
their future riding. The video vignettes in the existing program are designed to
achieve this aim by presenting riding scenarios then asking riders to think about how
they would handle the specific situations. Greater effect may therefore rely not only
on the program content, but the way in which such scenarios are discussed to
enhance understanding and assign personal meaning. The greatest challenge is to be
able to achieve this within the limited time allocated for the program.
Mapping of the questionnaire items more precisely onto the specific issues
discussed in the intervention regarding future riding intentions should enhance the
likelihood of finding effects. The TPB was used as a framework for the development
and evaluation of the pilot program. However, the pilot intervention could never
change what significant others actually think (as they are not part of the intervention)
nor how participants perceived what significant others thought. In essence, normative
influences must be addressed at a broader social level. Therefore, it is not surprising
that there was little change found for the subjective norm or specific subjective norm
scales in this study between T1 and T2.
As previous research by Tunnicliff (2005) found that riding peers
significantly influenced risky riding styles, the pilot intervention did specifically aim
to raise awareness of the potential negative influence of riding peers regarding risk
taking and how to manage such issues. However, the TPB constructs for these factors
are not framed in this manner. Therefore, the TPB framework provides a guiding
framework for intervention design but not for short-term measurement regarding
change in normative influences in this instance. Ideally the short-term questionnaire
should measure participants’ understanding of how normative pressures may
influence their likelihood of risk taking. That is, the normative pressures may in
182
reality remain the same between T1 and T2 but the training may better inform
participants as to which influences are likely to be protective and which may be
harmful. This does not strictly align with how measurement of the TPB is
operationalised.
Perceived behavioural control was found to decrease as a function of training.
This may have been due to the program not sufficiently emphasising the
‘internalisation’ of risk as intended in regard to voluntary risky riding. Ideally the
program aimed to increase PBC to provide understanding that riders chose how they
will ride and should exert self-control. The study shows that this is not being
achieved. However, it must be kept in mind that the treatment condition included the
classroom-based pilot intervention but also included practical training. The practical
training component should be examined to ensure no information or messages are
given that are contrary to the intervention objectives.
Possible concern regarding a significant increase in perceived riding skills as
a result of the program is not likely an issue in regard to most participants, although a
mechanism to identify the minority most at risk from overconfidence would be
useful. While a significant increase in perceived skill was found, the majority of both
males and females at T2 rated their riding skills as average, indicating that
(generally) overconfidence may not be an issue. Perceptions of skill by participants
are more than likely to be fairly realistic given the context. Rating of participant skill
by the instructors would help to clarify any concern over this issue as the realistic
calibration of student and instructor ratings could be investigated. However, this was
not possible within Q-Ride (as ratings or rankings are not scored).
Overall, the study lends some support for maintaining the content of the
intervention program but reviewing the questionnaire in order to identify the full
effects of the program in future. The findings also suggest that the messages
regarding PBC should be refined to provide a clear understanding that riders should
take responsibility for their own actions and additionally not attribute undue blame to
others. Unfortunately, the study is not conclusive regarding risky riding behaviour
following licensing, so implications for refinement of the program in this regard
remain unknown.
183
Implications for motorcycle rider training generally
One of the broader implications of the pilot program is that a brief
educational course can have a positive effect on motorcycle rider attitudes to safety.
This means that licensing programs and post-licensing programs may benefit from a
structured classroom session specifically addressing voluntary risk taking. Some
rider training courses throughout the world may already address such issues in a
structured or non-structured manner. This study showed that a highly structured
program does have benefits over and above that of a program that addresses risk
taking on an ad-hoc basis. Published evaluations of this nature for other programs
around the world are required to provide further evidence of what may be effective
and what may not.
While a longer duration for the program spaced over several sessions was
originally conceived as ideal, licensing jurisdictions may be reluctant to commit to
such timeframes. The pilot intervention examined in this study ran for one hour with
a further 20 minute debrief session once licence competencies had been met. This
offers a realistic, achievable option for inclusion of education for attitudinal and
motivational factors within training curricula without major changes to licensing
systems or legislation.
A further implication is that intervention programs of this nature are likely to
benefit from preliminary research to establish local issues for risky riding. This
current project was preceded by work by Tunnicliff (2005) to establish how
motorcyclists conceptualised risky riding and the underlying influences on intentions
for risky riding. Concepts such as ‘Pushing the Limits’, ‘Bending Roads Rules’, and
‘Extreme Speeds and Stunts’ formed the basis for how the pilot intervention was
conceived. Attitudes to safety were shaped using these concepts to develop riding
videos, scripts, and scenarios as talking points. Furthermore, narratives for actual
crashes were used to support these concepts. Any training programs aiming to
address attitudinal and motivational influences on riding should investigate key
beliefs underlying risky riding behaviour.
184
5.2.4.8 Strengths and Weaknesses of the Study
The study had a particular strength in that it was conducted in a real world
motorcycle context. While this meant that there were some pragmatic constraints, the
study had high ecological validity. The benefit of this approach is that the findings
are likely to represent the true effects of the program as the contextual environment
in which people obtain their motorcycle licence in Queensland was maintained. This
includes the emotional context (e.g. anxiety, apprehension) and the actual learning
environment (at the Q-Ride service provider’s premises and delivered by actual
riding instructors). It is possible that if the program was delivered by psychologists
then greater insight and internalisation of risky riding issues may have been elicited,
but it is unlikely that psychologists would have the same level of credibility as the
riding instructors in the eyes of the students.
A further strength of the study was that self-selection bias that is often seen in
rider training evaluations was minimised by the use of a comparison group who
voluntarily chose to undertake training through the same training organisation as the
treatment group. A previous evaluation of motorcycle licensing in Queensland by
Watson et al. (2003) found that participants that chose to complete training through
the Q-Ride licensing stream had many pre-existing differences when compared to
those who chose to be licensed through the Q-Safe option which involves only a test,
with no training provided. These included variables such as age, gender, previous
riding experience, and attitudes to safety. Self-selection bias was also limited in this
current study by ensuring all participants were blind to the nature of this study.
Participants were only aware that they were part of a study, not part of a trial for a
new training program. If the pilot intervention had been promoted, this may have
influenced people to chose (or not chose) to complete the intervention program over
the standard training program.
There were several limitations of the study that were controlled for where
possible. Firstly, a randomised control design was not possible as this was in direct
conflict with the real world applied nature of the study. People cannot be forced to
undertake a particular type of training for experimental purposes. While concurrent
sampling from two sites was originally planned (one site for treatment and one site
for comparison data) this design was not possible as one of the training sites closed
due to commercial pressures. Therefore, the final temporal block AB design was a

185
necessary compromise. There were changes to the Q-ride licensing system from the
time of the comparison block to the time of the treatment block; however the
findings suggest that any differences between groups at baseline for psychosocial
influences, demographics, or riding history were very minimal. This suggests that
participants in each cohort were, in the main, from the same ‘population’. Hence,
while the final design was not ideal, the integrity of the study was not compromised
to any large degree.
Secondly, as the study was conducted in the context of licensing, there was
potential for demand characteristics to influence self-report data. The project team
was aware that this would not only relate to social desirability generally, but had a
further direct influence on the perceived likelihood of failing licensing requirements
if the instructors became aware of participant responses. As previously discussed,
several measures were put in place to ensure participants knew the study was for
research purposes only and that confidentiality was assured. This included sealing
completed questionnaires in envelopes for collection by the research team, a detailed
information sheet, and a pre-training video featuring the Chief Instructor and the
research Chief Investigator explaining the study. These procedures were the same for
the control and treatment groups. Overall, while the accuracy of self-report data can
never be totally assured, the steps taken to address this issue should have limited
potential biases.
Thirdly, accurate results for the study relied on the delivery of other training
components being consistent over time. This was required to ascribe any effects from
the pilot intervention to actual planned differences in the classroom program.
However, a practical reality is that, while every effort was made to ensure the same
trainers were used over time, there is staff turnover in any business. Change in
personnel during the comparison block was not recorded. Therefore, despite program
delivery protocols in place by the partner organisation, there is a possibility that the
findings may have been influenced by staff turnover. This is likely in any training
organisation over time. The consistency of the delivery of the pilot intervention is
assessed in Study 3b to follow.
Finally, the web-based follow-up study to gather T3 data for both the control
and treatment groups differed in the amount of time since licensing between groups
186
and had an extremely low response rate. It was originally planned for the control
period for training to be immediately followed by the pilot intervention training
period. However, a considerable delay in commencing the pilot intervention was
experienced due to ongoing negotiations with Queensland Transport to conduct the
intervention within the context of Q-Ride. This was because Q-Ride regulations did
not allow the partner training organisation to run two different programs. The follow-
up study at T3 was originally planned to be conducted 24 months following each of
the two programs (consecutively). However the delays in commencing the pilot
intervention meant that two separate follow-up studies would be required, which
became too logistically cumbersome within the context of the PhD (considering the
amount of other studies already conducted). Hence, one follow-up data collection
period was decided upon, resulting in different durations since training for the two
groups. This combined with the very low response rate, as discussed throughout the
chapter, means that T3 results are merely indicative and should be regarded with
caution.
5.2.4.9 Conclusions
Education at the learner licence stage can have an immediate positive
influence on motorcyclists’ attitudes to risk taking. It is apparent that a highly
structured, dedicated classroom module to address risk taking has benefits over and
above a traditional training program that addresses such issues in an ad-hoc manner.
It appears that the effect of the Three Steps to Safer Riding program for attitudes may
last beyond licensing, however this requires confirmation in future research along
with the effect of the program on actual riding behaviour. This issue is discussed
further in Chapter 6.
5.3 Study 3b: Process Evaluation
5.3.1 Background
A process evaluation of the pilot intervention was also incorporated into the
current program of research in keeping with the overall goal of conducting a
thorough formative evaluation of the Three Steps to Safer Riding program. It was
considered necessary to gauge how participants regarded the intervention program
and, additionally, whether it had been delivered by instructors in accordance with the
187
specified protocols and if refinement was required in any regard (delivery or content)
to best suit the target audience.
Three forms of qualitative data were utilised in the process evaluation: 1)
individual interviews with the four riding instructors (trainers) who were involved in
delivery of the intervention, and the Chief Instructor; and 2) three focus groups and
one individual semi-structured interview with participants of the intervention (N =
18). Additionally, observation of training was undertaken for each instructor on two
occasions each.
Also, quantitative data was also gathered in the T2 questionnaires to measure
the degree of perceived learning, to measure the effectiveness of the delivery
techniques used by the instructors (student rated), and to gauge acceptance of the
program concepts by intervention participants.
5.3.2 Research Aims
This study aligned with Objective 8 of the overall project (see Table 1.1) and
with overarching research questions RQ2 and RQ5. More particularly, a range of
issues were identified to guide the research within each phase of this study. Key
issues examined in relation to intervention participants (i.e. those who had gone
through the new program) were:
1. the degree to which participants recalled the information presented in the
Three Steps to Safer Riding intervention module;
2. the face validity of intervention concepts;
3. whether the teaching techniques and presentation modes facilitated sufficient
understanding of the intervention concepts;
4. if the intervention challenged existing dysfunctional beliefs regarding safety
for learner motorcyclists (i.e. facilitated Transformative learning);
5. whether or not participants found the intervention concepts personally
meaningful and useful for their day to day riding once licensed (i.e.
influenced or transformed behaviour); and
6. suggestions for improvement.

188
In regard to the riding instructor interviews the issues examined were:
1. the level of support for the intervention concepts by instructors;
2. if the instructors thought that students were understanding the information
presented (i.e. any instances where misunderstandings were evident);
3. if the delivery timeframes for the intervention module were achievable in the
context of the overall time demands of the entire licence training program;
and
4. suggestions for further refinement of content or delivery.
Issues examined in the observation of training sessions were:
1. if the program was being delivered as intended and gauge any practical
constraints or skill deficits by instructors;
2. the consistency of delivery across various instructors and over time; and
3. whether the training sessions were being delivered within the allocated
timeframe.
Finally, issues relating to the quantitative component (T2 questionnaire items used
for the process evaluation) were:
1. measurement of the acceptance of intervention concepts by students; and
2. comparisons of the level of student rated perceived learning and program
delivery techniques to that of the comparison group (standard training).
5.3.3 Interview and Focus Group Methods
5.3.3.1 Participants
For graduates of the pilot intervention course, focus group participants and
the sole individual interview participant were selected at random from the available
pool of original pilot intervention participants and recruited by telephone. They were
each compensated for their time by the partner organisation with issue of a voucher
for a further half day training course. The individual interview participant was
initially to be part of a small focus group however other planned participants did not
attend as arranged. It was therefore decided to conduct an individual interview as the
participant could not attend at any other time. The age of participants was not
recorded. Of the 18 participants, three were female.
189
Interviews with the four riding instructors that delivered the program were
also conducted. They were three male instructors and one female all aged over 30
years. The instructors were rotated through the classroom training during the course
of the intervention, with only one instructor generally delivering any particular
session.
Participation in each facet of the qualitative research was voluntary with
informed consent. Whilst the focus groups and individual interview with intervention
participants were anonymous, the riding instructors were known to the researchers.
However, the confidentially of all individuals in data reporting was maintained in
accordance with Queensland University of Technology Human Research Ethics
Committee approval and no individual identifiers are reported in this document.
Qualitative data collection occurred two months after the finalisation of the
pilot intervention trial. However, focus group participants and the sole individual
interview participant may have completed the intervention at any stage of the three
month trial, hence time since training varied between individuals.
5.3.3.2 Materials and Procedure
Questions relating to the focus groups with intervention participants explored
issues such as what information was retained from the intervention, the perceived
usefulness of intervention concepts, presentation media/resources, teaching
techniques, and the level at which the intervention challenged beliefs about risky
riding. Identical questions were used for the individual interview and the focus
groups. A list of these questions can be found in Appendix 5.3. Questions relating the
instructor interviews explored issues such as program acceptance by instructors, ease
of delivery, and perceived effectiveness of the program for subgroups of riders. A list
of the instructor interview questions can be found in Appendix 5.4.
Focus groups and the sole individual interview with intervention participants
each took between one and a half hours and two hours to complete and were
conducted at the premises of the primary industry partner (i.e. motorcycle training
facility) for convenience as all participants were familiar with this location.
Attendance may have been compromised if the research was conducted at other
premises such as university offices. Focus groups were conducted until saturation of

190
the data was achieved (i.e. until no new/unique information was forthcoming).
Additionally, notes were taken by two researchers (the facilitator and an observer)
during the focus groups to enhance the reliability of the data. Instructor interviews
took between 30 minutes and one hour to complete. They were completed
individually in a quiet office at the premises of their employ. Auditory recording of
each session for participant focus groups and the instructor interviews was
undertaken.
Conceptual content analysis was undertaken to identify key themes in the
data for the focus groups and individual interview, and again for the instructor
interviews. Researcher notes were visually scanned to assimilate information and
auditory recordings were examined and further notes and quotes recorded manually
for key information. The qualitative method was chosen in order to obtain a richness
of data that could not be obtained using quantitative measurement.
5.3.4 Training Delivery Observation Methods
5.3.4.1 Participants
Participants were the four riding instructors (three male, one female) that
delivered the intervention as part of the overall licensing course. Each was aware that
their lessons were being observed although no prior notice was given as to when this
would occur.
5.3.4.2 Materials and procedure
The Chief Instructor was chosen to conduct the formal observations as he was
part of the project development team and he expressed the view that overall program
delivery was ultimately his responsibility from a business perspective (he was
accountable for such). Another reason for using the Chief Instructor for this task was
that the observations were perhaps more naturalistic in the training environment than
if a researcher was present. The Chief Instructor wore the company uniform and
regularly informally observed training sessions as part of his normal routine. Hence,
this was not foreign to the instructors or students. If a researcher was used to conduct
observations, instructors may have felt threatened or this may have resulted in
unnatural delivery styles.
The Chief Instructor sat at the back of the training room and did not interfere
with program delivery by each instructor. He completed the observation checklist
191
during each session observed, ticking ‘yes’ or ‘no’ for each of the items. Each of the
three instructors was formally observed on two separate occasions. Dates for
observation were arbitrarily chosen by the Chief Instructor although spread evenly
across the pilot intervention block.
The program was highly structured in its delivery format whereby all
information and videos were embedded within a single Powerpoint presentation.
Therefore, there was little scope for instructors to deviate substantially from the
desired program and observations were centred mainly on how the instructor
explained concepts and facilitated discussion. The Observation check list contained
the following items for noting program delivery:
introduction video & questionnaires administered;
intervention concepts discussed as defined;
training videos utilised and issues discussed appropriately;
the take home Toolkit was explained;
all participant questions answered appropriately; and
delivery timeframe adhered to.
5.3.5 Process Evaluation Results
5.3.5.1 Findings from Instructor Interviews
The instructors reported that whilst they each took several sessions to become
familiar with the new training program, the timeframe for delivery was manageable.
There was general consensus that any qualified trainer should have the skills to easily
deliver the intervention and that students generally engaged in the pilot program. One
instructor did however mention that sometimes students became a bit “brain dead”
with information overload. Another instructor mentioned that while the structure and
concepts of the intervention were sound, there was often limited time for in-depth
discussion of any particular issue. This has implications for the amount of
information covered in the intervention and the placement of the intervention within
the overall training course. There were several key themes that were apparent in the
interviews with instructors:
192
1. instructors supported the new direction in training (i.e. focussing on attitudes,
thinking about risks and rider behaviour);
2. due to the time constraints the intervention may be better served by focussing
on fewer issues, allowing for more in-depth discussion where required. That
is, some streamlining was required; and
3. the “toolkit” required further consultation with the instructors for
understanding of the aims of this resource, how it may have been better
utilised within the training program, and how it may be refined (trimmed).
While most instructors felt that the Three Steps to Safer Riding pilot
intervention had equal impact for all rider groups (e.g. new, experienced, male,
female), one trainer mentioned that experienced male riders may simply give “lip
service” during discussion of some of the issues and continue to take risks once
licensed as some behaviours such as extreme speeds and stunts are their basic reason
for riding. The Chief Instructor expressed a belief that the program would be very
useful for post-licence training courses to address some of the risks that experienced
riders take.
Additionally, there were suggestions for how to continue students’
engagement in the program. These included follow-up telephone contact with riders
and incentives / rewards for completing on-going aspects of the program (after
licensing) if introduced. It was suggested that to optimally engage students the
question of “what’s in it for me” from a student perspective should always be
considered.
It was also mentioned that it was sometimes impossible not to address
intervention concepts in the standard control training sessions as they arose in
general discussion (thereby possibly limiting the comparable effect of the new
program). This point was elaborated by the Chief Instructor. That is, the standard
training program always addressed rider behaviour, however not in a structured
manner. Therefore, whilst the terminology may not be the same, there is some
overlap in the key messages. This may have had implications for student responses to
questionnaire items, potentially limiting differences in responses between the
intervention pilot and comparison groups.
193
The Chief Instructor was also consulted regarding management / business
aspects of conducting the trial, and in terms of the future sustainability of the training
program. It was evident that, whilst the research trial presented several challenges
(time issues, database management), continuance of the intervention training
program was quite manageable as there would no longer be the need to complete
questionnaires for research purposes which were time consuming. Hence, it appears
that the Three Steps to Safer Riding program (as a marketable product) would be
able to be readily adapted to suit other rider training organisations with minor
changes to content that was specific to the industry partner organisation.
5.3.5.2 Focus Groups and Interview Findings for Intervention Participants
Data emerged from two main subgroups: 1) trainees who had never ridden
before; and 2) those with some prior riding experience. Discussions with these riders
suggested that new riders (absolute novices) embraced and internalised many of the
intervention concepts. However, it was difficult to centre discussions on specific
intervention concepts as they did not see the Three Steps to Safer Riding intervention
as distinctly different from the rest of their training. That is, they appear to have
fused the intervention concepts into their global understanding of riding, rather than
recalling specific concepts. The following quotes highlight this.
“Focus is the key word, switch on. Do your checks .......you’ve got the
appropriate clothing, you’ve got the appropriate machine. Have you got the
appropriate attitude?”
“I don’t remember what the three steps are exactly but I just remember it was
a lot around your frame of mind, being prepared mentally and physically.
Basically to think about how you’re thinking when you go riding. That’s the
main message I get from it.”
The majority of new riders had initially used the “toolkit” booklet following
training to a minimal extent to put the riding tips into practice. Most new riders
found it useful as a learning tool, some for any form of on-road vehicle use.
However, some more experienced riders thought it would be useful for new riders
and they did not see that it had specific value for them.

194
“I used it the three times it was recommended and while I was doing it I
jumped on the internet and searched a few forums to see if anyone had come
across situations like I had in my review and found there was an enormous
amount of information.”
“I showed it to my girlfriend and she read it, and just reading it for car
driving she thought it was really good.”
“I personally just thought it was common sense. I thought it was good to
include in the mandatory literature that they hand out - it’s always good to
include these things because there’s a whole mix of people. Some people will
read it, some people won’t. But I didn’t.”
For the more experienced riders there were some other mixed results, with
some riders supporting and utilising the intervention information in their subsequent
riding whilst others felt it was all common sense and that they did not need to be told
what they should (or should not) be doing when they ride. Whilst they stated these
issues were common sense, some riders still expressed riding styles that were
contrary to key messages (e.g. bending road rules) or felt the concepts may be more
useful for ‘other’ riders rather than themselves.
“I’d done a couple of these things before before, .......it makes you think then
you see the error in your ways. But you don’t do it (overtaking across double
white lines) all the time. It comes down to one of those common sense things.
I’ve done it in the past and I know the road’s clear then I don’t really see the
danger in it.”
“I can see it would be good for someone who’s really young, maybe only just
got their (car) licence, but I’ve got 25 years driving experience.”
Most riders felt that they got something new from the program and it changed
the way they thought about risk taking. Some riders however felt that some of the
concepts were covered in general road safety messages. It is apparent that due to the
heterogeneity of the people attending licence training that each person valued
something different. That is, what may have been effective for one was not effective

195
for someone else. However, the concept of emotions and feeling appeared to resonate
positively with most participants.
“You don’t go out riding if you’re upset, like if you’ve had an argument of
something.”
“I never thought of it, more along the line of emotion and feelings. All the
other stuff, being a dickhead and bending the road rules is pretty
straightforward – comes up with your car licence.”
“If I hadn’t had that stuff (i.e. the training information) I wouldn’t be half as
safe as I am today............. they’re really obvious things where you think of
course, of course......... sometimes when you’re a bit pissed off and haven’t
got the opportunity to jump in the car you’ve really got to think - this is a risk
factor, tone it down.”
“The one that stuck in my mind was the one about the guy that gets in a fight
with his girlfriend. It’s something that I hadn’t thought of before and I see
other people that just jump on the bike and go flying off because they’re upset
or angry.”
“Mainly like the mood. Your personality / emotion stuff.”
Some riders reported that when they experienced an incident on-road
subsequent to licensing they were prompted to reflect back on some of the
intervention issues. This information suggested that these riders are putting the pilot
intervention information into practice and that they feel it enhances their safety and
that of others.
“Because I ride every day, you hop on the bike and your riding and you’re
running late for work, and it’s those things that pop into your mind. It’s better
being five minutes late than not turning up at all.”
“Yeah, I thought about it probably about two weeks ago, the emotional
influence one because I noticed somebody and I said something like – Hey
196
hang on, you’re a little upset, don’t go taking it out on everyone else on the
road – and they did settle down.
“State of mind definitely for me on a motorbike. I cancelled a ride not long
ago and just went in the afternoon because I’d had a big night the night
before.”
“I have this peer pressure thing with my husband ........ but I ride my own
ride. I don’t care if I do 90 or 95 (km/h).”
“For me, I’m riding within MY limits but also within my equipment limits.”
Several issues regarding the delivery of the intervention were discussed.
Firstly, the majority of participants felt the trainers did a great job. Also, many
participants got value from the various modes of presentation such as video examples
and group discussion of crash scenarios. However, there were suggestions for
improvement.
“I reckon it’s (group discussion) good for other people. Like someone
actually has to articulate how it could happen or how it has happened to them
in real life. And he (the instructor) was pretty good because he didn’t make
anyone feel stupid.”
“He (the instructor) might ask you a few questions here and there but there
wasn’t really open discussion about the topics.”
“I’m one of those people that remember stories more than putting something
up on an overhead or Powerpoint. I think the shared experience is valuable.”
“It was definitely better than just watching video’s or Powerpoints.”
“You actually sat there and thought about what you’d do next rather than just
watching it roll on.”
“I thought it was really good but fewer simplified messages – things that
stuck in your head might help.”
While some participants received a debrief as part of their training, others
could not recall this. Some participants reported that they filled out paperwork at the

197
end of training (e.g. questionnaires) with no review of the intervention concepts as
originally intended with the debrief session. One rider felt they would benefit greatly
from a discussion with the instructors regarding their road ride at this point (review).
However, there is a possibility that participants recalled only limited details of the
debrief session due to the excitement of meeting the licence competencies.
“You’d probably get more discussion after you’ve been out and done the
riding.”
“He (the instructor) was busy writing out all the certificates for us.”
“I remember filling out a questionnaire at the end. He might have had a
quick little chat about the booklet and things.”
“(suggestion) Even after the road test you come back in and talk about the
road test. Because there wasn’t really much discussion about that – everyone
come back and mix amongst yourself and here’s your licence.”
The length of the intervention session was generally acceptable to most
people. However, it was evident that the change in Q-Ride legislation during the trial
resulted in the industry partner being much busier than usual during the month prior
to introduction of the legislation, and that some trainees “tuned out” to the classroom
sessions as they were sometimes conducted at night with no practical riding
immediately after.
“I personally don’t think it went for too long. I think other people in the class
were running out of concentration for that sort of thing because they were
there for the more technical stuff.”
“I didn’t think it was too long, I thought it was a good mix of talking and
video.”
“It’s not that it deliberately went in one ear and out the other. I just think it
was that time of the evening after a full day (at work) ........ then it was
actually four months until we got out on the bike.”
198
“I found an hour was good for me. It would have been ok with me if it had
have gone longer. I was getting on the bike that afternoon and putting it into
practice. If it had have been a month between doing that course and getting
on the bike I think I would have needed longer to bring that back.”
While most feedback was positive, there were some comments as to how the
program and Q-ride could be improved. This reflected a mixed focus on practical
riding and behavioural issues from the pilot intervention.
“Why not have five year periodic (mandatory) training for motorcyclists or
for all road users?”
“People with more experience on the road, personally, I would have
preferred to have double the time out there doing the slow ride stuff and half
the time in here and I think I still could have gathered this stuff in twice the
speed.”
“Like, jackets and stuff weren’t really covered that much. I have to go to
forums and stuff to try to broaden my knowledge.”
“Another way of going about it is to mount a camera on one of the instructors
and have them go out into the traffic (on their motorcycle) and then bring that
back in and say this is what you might encounter on the road..........it’s a
difference ball game when you get out into peak hour traffic.”
Collectively, the focus group and interview findings from intervention
participants confirm which aspects of the program are valuable to individuals and
where there remains room for improvement. Such information is valuable to inform
the future development of the program.
5.3.5.3 Training Delivery Observation Findings
Training delivery during the intervention pilot was noted by the Chief
Instructor as mainly consistent across time and different trainers. All issues on the
observation checklists were satisfactorily met for each observation. The designated
timeframe of one hour for the delivery of the group classroom session was met
satisfactorily for each observation. However, it was noted that the more sessions each
trainer completed, the more comprehensive knowledge store they had in regard to

199
student perspectives and discussion on each of the intervention concepts.
Additionally, as the Chief Instructor was required to complete a checklist regarding
intervention delivery, he gave feedback to each of the instructors where required as a
process of continual refinement. This was important from a business point of view to
provide the best possible product to customers. However, this feedback may have, in
practice, actually impacted on the consistency with which each trainer delivered the
program over time.
5.3.5.4 Process Evaluation Findings from Questionnaire Items
Items relating to teaching and learning were included to ascertain if the pilot
intervention, which was an addition to the standard training program, was
satisfactory or potentially detrimental in any respect. For example, if students
perceived that there was too much information in the overall licensing program to
remember, then the intervention could be counterproductive as valuable information
throughout may not have been retained. It must be noted that most items were not
specific to the classroom training but rather framed in regard to the overall course.
Therefore, data for the treatment group (standard licensing course plus intervention)
can only be interpreted with any meaning when compared to the comparison group
(standard licensing course).
Mean items scores and standard deviations for items relating to program
delivery are shown for the treatment and comparison groups in Table 5.17.
Independent means t-tests were conducted to ascertain any statistically significant
difference between cohorts as also noted in Table 5.17. Delivery by instructors in the
treatment condition (intervention program) was generally rated more favourably than
in the comparison condition. In regard to the classroom training being perceived as
too long, scores on this variable were significantly higher for the treatment group
than the comparison group. This is consistent with the extra classroom time required
to deliver the pilot intervention. Practical riding duration was rated as being too short
to a greater degree for the treatment group than the comparison group. This duration
was unlikely to have systematically varied across groups because each had to meet
the same licence competencies, although no measure of the duration of practical
training was taken (as psychosocial influences on risk taking were not addressed
during practical training). As distributions for some of the scales were highly
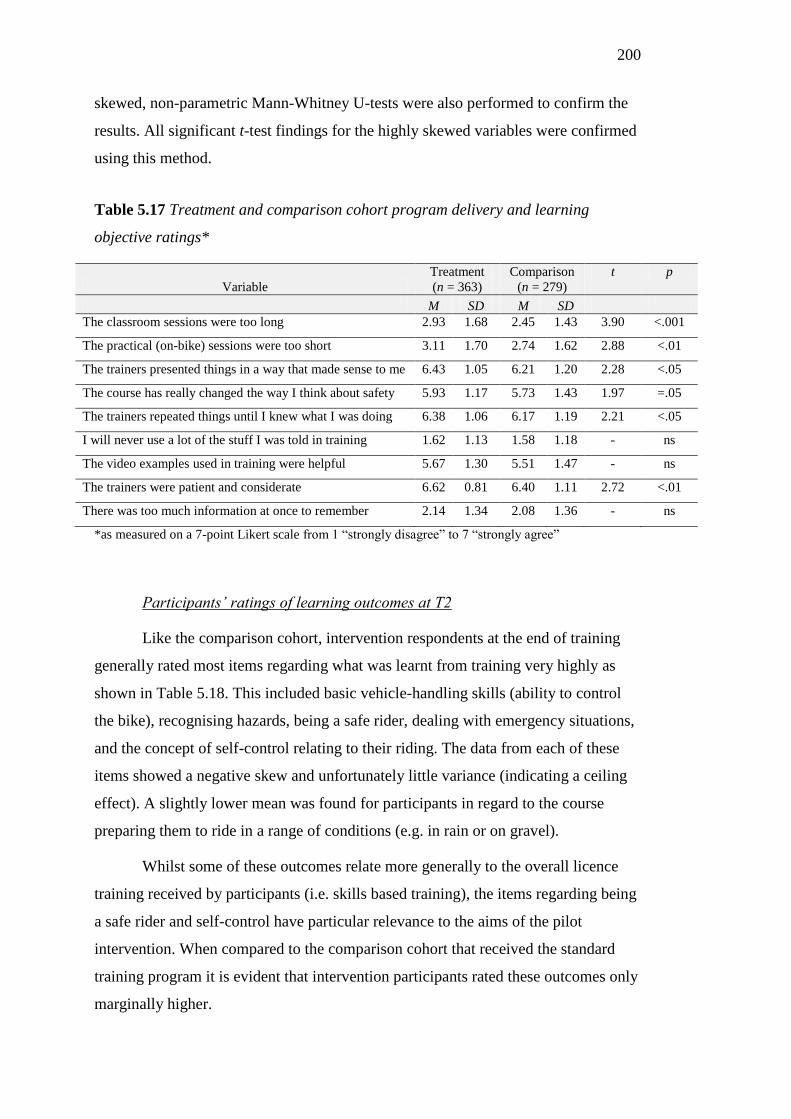
200
skewed, non-parametric Mann-Whitney U-tests were also performed to confirm the
results. All significant t-test findings for the highly skewed variables were confirmed
using this method.
Table 5.17 Treatment and comparison cohort program delivery and learning
objective ratings*
Variable
Treatment
(n = 363)
Comparison
(n = 279)
t p
M SD M SD
The classroom sessions were too long 2.93 1.68 2.45 1.43 3.90 <.001
The practical (on-bike) sessions were too short 3.11 1.70 2.74 1.62 2.88 <.01
The trainers presented things in a way that made sense to me 6.43 1.05 6.21 1.20 2.28 <.05
The course has really changed the way I think about safety 5.93 1.17 5.73 1.43 1.97 =.05
The trainers repeated things until I knew what I was doing 6.38 1.06 6.17 1.19 2.21 <.05
I will never use a lot of the stuff I was told in training 1.62 1.13 1.58 1.18 - ns
The video examples used in training were helpful 5.67 1.30 5.51 1.47 - ns
The trainers were patient and considerate 6.62 0.81 6.40 1.11 2.72 <.01
There was too much information at once to remember 2.14 1.34 2.08 1.36 - ns
*as measured on a 7-point Likert scale from 1 “strongly disagree” to 7 “strongly agree”
Participants’ ratings of learning outcomes at T2
Like the comparison cohort, intervention respondents at the end of training
generally rated most items regarding what was learnt from training very highly as
shown in Table 5.18. This included basic vehicle-handling skills (ability to control
the bike), recognising hazards, being a safe rider, dealing with emergency situations,
and the concept of self-control relating to their riding. The data from each of these
items showed a negative skew and unfortunately little variance (indicating a ceiling
effect). A slightly lower mean was found for participants in regard to the course
preparing them to ride in a range of conditions (e.g. in rain or on gravel).
Whilst some of these outcomes relate more generally to the overall licence
training received by participants (i.e. skills based training), the items regarding being
a safe rider and self-control have particular relevance to the aims of the pilot
intervention. When compared to the comparison cohort that received the standard
training program it is evident that intervention participants rated these outcomes only
marginally higher.

201
Table 5.18 Participant ratings of learning outcomes at T2
Variable
Treatment
(n = 369)
Comparison
(n = 279)
t p
M SD M SD
Learning – Ability to control the bike 6.51 0.79 6.46 0.97 - ns
Learning – Recognizing hazards 6.39 0.90 6.26 1.11 - ns
Learning – Being a safe rider 6.53 0.78 6.46 0.99 - ns
Learning – Dealing with emergency situations 6.33 0.89 6.26 1.04 - ns
Learning - Self control (e.g. reducing risk taking) 6.08 1.11 6.04 1.21 - ns
Learning – Ability to ride in a range of conditions
(e.g. gravel, rain) 4.92 1.74 5.18 1.64
2.02
<.05
Between groups t-tests found that the pilot intervention participants rated
learning to ride in a range of conditions significantly lower than the comparison
group participants, t(637) = 2.02, p<.05. In reality, neither the standard course nor
the pilot intervention program included riding in gravel. No other significant
differences were found, indicating that the intervention had little differential effect
on participants’ perceptions of learning as they were already high in the comparison
group.
5.3.6 Discussion - Process Evaluation
There are several important implications from the process evaluation for the
content and delivery of the Three Steps to Safer Riding program. The instructors
appeared to have embraced the intervention concepts and were supportive of the
need to introduce new training content to address risk taking. This finding was
positive as organisational change and the introduction of new concepts is often met
with resistance in the workplace. Several measures were taken during the
introduction of the intervention pilot to quell any anxiety that instructors may have
had in relation to the change in their routine. Firstly, two train-the-trainer sessions
were conducted by CARRS-Q personnel to outline the rationale for the intervention
to instructors and conduct a ‘dummy run’ of the program to show how the program
was to be delivered and to answer any questions. Secondly, the Chief Instructor
played a pivotal role in promoting the intervention to instructors and offering his
guidance, support, and feedback to them throughout the intervention trial. Similar
processes should be encouraged to enhance the success of any new training program.
202
The ease of delivery reported by instructors may be predominantly because of
the structured program delivery design. Whilst the individual training style of
instructors should not be thwarted, it appears important that a highly structured
program is designed for timing and consistency of delivery. Powerpoint slides with
each issue progressively addressed and video vignettes embedded into the slide show
no doubt assisted in the ease of delivery.
In regard to improving the intervention program it appears that the debrief
session at the end of training did not satisfactorily occur, at least for some
participants. This may be due to forgetfulness and fatigue on the part of the
instructors, or merely that trainees did not readily recall the debrief session due to
information overload and fatigue. In either case a solution to this problem must be
found as reinforcement of the intervention concepts is important if they are to be
internalised long-term. Follow-up of riders by telephone in the initial weeks
following completion of training is an option to discuss intervention concepts in
conjunction with the take-home toolkit booklet and the actual application of the
concepts to on-road riding. A brief take-home DVD has also been designed to
complement the program in the future, with the aim of reinforcing the intervention
concepts.
Additionally, the instructors felt that the program needed to be trimmed to
allow more discussion about fewer concepts. This is an important aspect if effective
learning is to occur. Hence, any training program needs to carefully consider and
monitor the amount of information presented to maximise understanding by
participants, engagement in the program, and information retention. It remains
unknown if the duration of this brief intervention is optimal. Further design of
interventions of this type could explore the effect of extending program duration by
spacing learning over several weekly sessions if the context allowed.
For rider trainees, it appears that the intervention concepts made sense.
However these may not have been as readily embraced by those with previous riding
experience as by those who were absolute novices. Absolute novices may be
regarded as ‘blank slates’ (Tabula Rasa) and acceptance of the intervention concepts
for this target audience may best be considered in terms of motivation to learn. For
some more experienced riders however, there may be a need to change fundamental
beliefs towards risk. In this regard, the pilot intervention may not have challenged

203
beliefs about risk taking to a sufficient degree. Overall, it appears that the pilot
intervention was successful in raising awareness of risk factors; however its
influence on actual behaviour change remains unclear from the information obtained
in this study. The potential for behaviour change for existing riders may be
maximised by decreasing the amount of content in the intervention so that more in-
depth discussion can take place regarding focal behaviours.
The Three Steps to Safer Riding unfortunately lacks multiple sessions and is
designed to be more akin to a brief educational intervention delivered in a group
setting. Hence, it lacks the cumulative exposure that may assist in challenging
underlying beliefs to shape behaviour. The program employs techniques such as
evoking self-awareness, identifying antecedents to risky riding, self-reflection, and
self-monitoring but is limited by the time that instructors can devote to group
discussion. The program also has a different educational focus to what the instructors
have traditionally delivered, and while they have expressed support for the program,
it is possible that they do not have a complete understanding of the aims of the
Toolkit resource as a tool for self-monitoring and the self-management of riding
behaviour. Further train-the-trainer sessions may help to reinforce the goals of each
component of the program in terms of awareness-raising versus behaviour
management.
Lastly, on occasions where the intervention was delivered of an evening as
part of an overall classroom session it may not have had its optimal effect. It appears
that there is a need for training programs to specifically follow up information learnt
in the classroom with practical riding in the same day. This is consistent with
previous findings of Rowden et al. (2007). This is not to say that the intervention
would not work as a standalone program, rather that expectations of training may
influence engagement in the program. If rider trainees attend training with the
primary goal of learning vehicle-control skills then classroom learning may be
diminished if it is not framed in a manner that is consistent with trainee expectations.
5.3.6.1 Conclusions
When integrating information from the range of methods used for the process
evaluation it is apparent that, in the main, the pilot intervention program was

204
delivered as intended and was perceived to be of some value by course participants.
Furthermore, the quantitative component of this study indicated that pilot
intervention participants rated the quality of teaching higher in some respects than
those attending the existing standard training course. This is an encouraging finding
and may reflect the benefits of the train-the-trainer sessions in focusing the
instructors on the quality of program delivery. Issues for particular improvement
were trimming the amount of risky riding concepts addressed, explaining the Toolkit
booklet concepts more fully, and ensuring sufficient time is spent on the debrief
session.
5.4 Chapter Summary
This chapter presented research relating to the formative evaluation of the
Three Steps to Safer Riding intervention pilot. This included two main components:
the interim outcome evaluation, and a multifaceted process evaluation. These studies
informed further refinement of the program, but also had important implications for
motorcycle rider training generally.
The interim outcome evaluation found that the licensing course which
included the Three Steps to Safer Riding program elicited more positive attitudes
towards road safety than the traditional standard licensing course. This effect was
found immediately following training, and mean scores for attitudes towards safety
were also maintained at the 12 month follow-up. The intervention also had an
immediate effect on other key variables such as risky riding intentions and the
propensity for thrill seeking, although not significantly greater than the traditional
standard training. This may have been due to the traditional standard training already
informally addressing risk taking issues in an ad hoc manner. The low response rate
at follow-up unfortunately prevented any firm conclusions being drawn regarding the
impact of the pilot intervention on self-reported risky riding once licensed.
The study showed that the use of intermediate outcomes such as self-reported
TPB variables for evaluation purposes provides insights into the mechanisms
underpinning the formation of risky attitudes and intentions that can be brought
about by education and training. The sole use of crash involvement as an outcome
variable in this case would not provide insights into establishing the specific aspects
of training that may be further developed to enhance the safety of motorcyclists as
205
this study has done. This has value for future driver or rider training programs that
aim to achieve such changes.
The process evaluation revealed that the program was largely being delivered
as intended although it required some refinement for future application. Time to
discuss topics in detail in the group training situation as well as a lack of focus on the
behaviour management component of the program (e.g. Toolkit) represented the
greatest pragmatic challenges to the success of the program. This suggests that other
strategies are required to extend learning for motorcyclists beyond the constraints of
the current licensing system.

206
207
Chapter 6: Discussion
6.1 Introductory Comments
The program of research undertaken for this dissertation was based on the
rationale that motorcycle rider training and education should address risk taking
issues at the time of licensing. Among the nine overall objectives of the Three Steps
to Safer Riding project (see Table 1.1) the following three objectives represented the
focus of this PhD program of research:
Investigate previous empirical research evidence and theoretical principles to
guide development, delivery, and evaluation of an educational program to
reduce risk taking by motorcyclists;
Examine the existing motorcycle rider training program delivered by the
partner organisation for its effect on psychosocial influences on risky riding
(to establish a baseline for improvement) and issues that may impact on
program delivery (e.g. adult learning principles); and
Conduct a formative evaluation of the short-term outcomes and
implementation processes underpinning a new pilot program in order to
inform the ongoing development of the program. That is, establish what
effect the pilot program had (if any) on key outcomes such as participants’
attitudes, intentions, and behaviour and identify how these effects may be
maximised. Process issues included implementation components such as
fidelity of delivery, context, resourcing, and barriers to success.
Investigation of the training content and delivery practices for the existing
rider training program of the industry partner organisation established a baseline for
the development of the Three Steps to Safer Riding program. The face-to-face
classroom-based intervention was subsequently developed by a project team
consisting of the PhD candidate and other behavioural scientists and the Chief
Instructor of the rider training organisation. It was applied as an adjunct to the
existing licensing course in a real world setting.

208
The research was informed by a prior study by Tunnicliff (2005) and a further
report by Watson et al. (2007) that explored the factors influencing risky riding
intentions and behaviour using the Theory of Planned Behaviour. With this prior
research as a foundation, the current program of research aimed for each study to
incrementally build upon the knowledge base for motorcycle rider training and
identify areas for improvement in the Three Steps to Safer Riding pilot program. The
research arguably achieved these aims and provided insight into the challenges
associated with developing and evaluating an innovative educational program for
motorcyclists within a prevailing licensing system.
This chapter aims to synthesise the knowledge gained from each of the
studies undertaken in this program of research. A discussion of how the findings
answer the research questions will initially be presented in the next section. This is
followed by broader ‘real world’ implications for government and industry. The
strengths and limitations of the research are discussed along with future directions
for research in this field.
6.2 Review of Findings
The findings are discussed with reference to the overarching research
questions underpinning the program of research as stated in Table 2.2 at the end of
Chapter 2. As only a single rider training organisation was utilised for this research,
most findings are specific to the development, evaluation and ongoing enhancement
of the Three Steps to Safer Riding program implemented by the industry partner
organisation, however this program of research does have broader implications for
road safety. The findings for each of the overarching research questions are discussed
in turn in this section.
6.2.1 What are the desirable components of a classroom-based educational
program to address risky riding by motorcyclists (RQ1)?
This research question was primarily informed by a review of the literature
on the topic undertaken in Chapter 2 and a summary of desirable components was
provided in Table 2.2. As such, all details will not be repeated here in detail. Rather,
this section will discuss how findings from the program of research undertaken
inform which components appear to be most suitable, and how the implementation
context influences the selection of desirable components for programs.

209
Perhaps the key lesson learnt from the applied research is that program design
needs to be context specific. That is, while careful consideration of the literature on
the topic informs what components are desirable for inclusion in a program to
address risky riding by motorcyclists, pragmatic issues influence what can and
cannot be included. The original objective of the candidate regarding this issue was
to review the literature to identify desirable components; however the final design of
the pilot program was a task for the broader project team. Inclusion of both
academics and industry experts as subject matter experts on the project team resulted
in the decision not to specifically address some content issues in the Three Steps to
Safer Riding program that were previously identified as desirable from the literature
review. These included behaviours such as riding while impaired by drugs, alcohol,
or fatigue and the use of protective clothing. The reason these were trimmed from the
scope of the pilot program was primarily related to time constraints within the user
pays context in which the program was implemented, which resulted in the
narrowing of the range of issues covered. The final concepts chosen for the
intervention were mainly those not commonly utilised in other programs or
campaigns. These were identified from previous research by Tunnicliff (2005) (also
reported by Watson et al., 2007) and focussed on the factors such as peer influence
that had been previously found to underpin a range of risky riding behaviour. These
were labelled ‘Personal Risk Factor’ and included the concepts of Pushing Limits,
Bending Road Rules, Extreme Speeds and Stunts, Peer Influence, Personality, and
Feelings and Emotions.
An examination of the process evaluation findings confirmed that the
concepts chosen for inclusion in the Three Steps to Safer Riding program were
indeed suitable for an educational program of this nature. Qualitative data from
Study 3b indicated that all concepts used in the pilot program made sense to the
participants. However one riding instructor indicated that addressing extreme speeds
and stunts was perhaps the most challenging component due to many riders’ basic
motives for riding. This does not mean that the extreme speeds and stunts component
is not suitable to address in such a program, though perhaps this concept may require
more specific focus and time to address than other components.
210
Desirable components not only include behaviours but can also include
processes. For example, the GDE matrix includes self-awareness as a key
component. Processes that raise personal awareness of risk and confront
dysfunctional beliefs could be considered key components. The findings of the
formative evaluation affirmed that this is achievable to some degree for a classroom-
based education program addressing risky riding. Broader project data is required
regarding traffic offences and crashes for the control and treatment groups over time
to ascertain if the pilot program achieved the goal of reducing risky riding behaviour.
Overall, while many components may be desirable to address in educational
programs to reduce risky riding, program success relies on careful consideration of
how many topics can be addressed within the specific context and the processes
employed to address each topic. The program of research undertaken by the
candidate also confirmed that piloting of programs is desirable to ascertain what
components may be most valuable to the particular audience. So the final selection of
the most ‘desirable’ components for any program is reliant on a process of:
firstly identifying a ‘wish list’ of components based on previous research and
theory;
then considering pragmatic needs associated with the implementation context;
then piloting and evaluating.
6.2.2 What specific learning needs do motorcycle riders have and how do student
perceptions and program context influence what is learnt (RQ2)?
Study 1 and Study 3b both used a qualitative approach to explore this
research question. Study 1 sought to establish what learning needs students had for
rider training and how they subsequently used the information for riding once
licensed. This included anything that they believed contributed to their safety,
including practical riding skills and behaviour. Study 3b focussed solely on the
learning needs related to classroom education for risky riding issues. Accordingly,
this section initially discusses learning needs for motorcyclists in a global sense;
however specific attention is given to addressing learning needs in regard to the
Three Steps to Safer Riding program.
Broadly, the findings of Study 1 and Study 3b suggest that, similar to training
for adults in other domains, rider education should utilise established adult learning

211
principles to engage students in the learning process and facilitate greater
understanding of the range of information presented. Quantitative data from Study 3b
also identified that learner riders felt it was important for them to learn basic skills
for vehicle-control, hazard recognition, dealing with emergency situations applicable
to motorcycling, and riding in a range of conditions, as well as generally learning
safety related information. Using a learner-centred approach to teaching as was
applied in the Three Steps to Safer Riding pilot program appeared to work well to
achieve these goals as this approach accommodates individual differences such as
previous experience and learning styles that may impact on how students grasp
understanding of key issues. For risk taking issues, facilitated group discussion
focussing on specific riding scenarios appeared to be central to classroom learning as
found in Study 3b. Presentation of learning materials using several different modes
such as video, Powerpoint, and whiteboard sketching to elaborate on particular issues
appeared to be well received by learner motorcyclists in the classroom setting. This
was highlighted in Study 1 and in the process evaluation undertaken in Study 3b.
Additionally, the presentation of too much information in one classroom
sitting should be avoided. However, student ratings of program delivery for the item
“there was too much information at once to remember” indicated that, at the very
least, students did not perceive that the pilot program resulted in information
overload. The Three Steps to Safer Riding module was presented in the classroom
along with other pertinent information for learner riders attending a licensing course
(e.g. braking and countersteering). Study 3b also found that for new riders there was
little distinction between the safety information presented as part of the pilot
intervention and other safety information for technical, skills-based aspects of riding.
Hence, as all information was being processed on the same day by new riders they
perceived it in a holistic manner as a protective package even though behavioural
aspects are quite different to the technical aspects of riding. If too much new
information was included at once then it may have resulted in some important
aspects not being retained due to information overload. The amount of information
presented was also particularly critical because of the time constraints in the
licensing system.

212
Study 1 found that feedback was important for learner riders in regard to
meeting competencies within the CBTA format. Aupetit (2008) also found that
individual feedback for motorcyclists in the form of a confrontational interview
following training sessions was important. This involved the student and instructor
reviewing video footage of the student performing manoeuvres and then noting areas
for improvement. However, the findings in Study 1 of this program of research
suggested that it is not until riders are actually exposed to on-road situations
discussed in training that important information from traditional training becomes
personally meaningful. As most rider training at licensing is conducted off road this
is problematic. Hence, a learning need specific to motorcyclists appears to be
consolidation of information learnt in the classroom with practical riding experience.
This relies on riders recalling what was learnt from the classroom when they are out
riding. Formal feedback is not generally available beyond licensing and riders must
rely on informal feedback from riding companions (which is not always accurate) or
offence notices from authorities. A mechanism for feedback in the initial months of
solo riding is therefore desirable.
The Three Steps to Safer Riding encouraged self-monitoring and self-
reflection through use of the Toolkit. Follow-up data after licensing in Study 3a
indicated that attitudes to safety were maintained 12 months after completion of the
program for those who responded to the follow up questionnaire. However the
effects of the program could have possibly been further enhanced by the use of
multiple resources following completion of the program to extend learning.
Interviews in Study 3b with participants who had completed the pilot program
suggested that this was desirable for some students.
6.2.2.1 The Hidden Curriculum and Student Perceptions
The hidden curriculum is a term used to describe unintended effects on
student learning from educational programs. Modelling appropriate behaviours and
attitudes by riding instructors is an essential aspect of training that can alter student
perceptions of what is being taught. Students attending training hold instructors in
high regard as found in Study 1. Therefore, any example they set, either formally or
informally, will influence student learning. In terms of attitudes and safe riding
behaviours, this may be reflected in issues as straightforward as the instructor not
wearing protective clothing during training. This hidden curriculum may also
213
negatively influence attitudes to safety if, for example in a group training situation,
students and/or instructors glorify risk taking behaviour as representing highly
skilled riding (e.g. cornering at high speed). Issues of this nature were not mentioned
by any course participants during the qualitative research in Study 1 or Study 3b
therefore it is unlikely that the hidden curriculum had any effect on the Three Steps
to Safer Riding pilot; however this remains an issue to be considered in relation to
the learning needs of motorcyclists.
Overall, the research found that learning for motorcyclists during
training/education is not as straightforward as telling them or showing them what to
do in a didactic manner, particularly where attitudinal influences are to be addressed.
Individual differences in how people learn, what factors affect their engagement in
the learning process, and the context in which training/education is undertaken are all
critical. For riders to eventually become their own coach, processes and tools to
elucidate self-awareness, self-monitoring, and self-regulation (as used in the Three
Steps to Safer Riding program) appear to be useful based on results from the
formative evaluation.
6.2.3 What effect (if any) does the Three Steps to Safer Riding pilot program have
on attitudinal and motivational factors that underpin risky riding, and is this more
specific to particular subgroups of riders (RQ3)?
The pilot intervention program used the TPB as a theoretical framework to
guide intervention development and quantitative evaluation. As such, item scales
constructed in accordance with the modified TPB constructs were utilised throughout
the research. However, these concepts were examined as a function of training for
evaluation purposes (i.e. changes over time) and the TPB model was not included
with the intention of testing the relationship of all the variables in the model at each
point of time. Hence, the discussion that follows is about the effects of the program
on the concepts, not how the relationship between variables in the model changed
over time. The overarching research question was examined in Chapter 5, with
further comparison group data reported in Chapter 4. This section firstly discusses
findings from pre and post measurement of psychosocial factors underpinning risky
riding for the pilot program. The likelihood of lasting effects of the program are then
considered. A discussion of findings compared to the comparison group then follows.
214
Study 3a found that between the start and end of training (T1 and T2), the
Three Steps to Safer Riding pilot program significantly reduced thrill seeking
propensity, intentions to engage in future risky riding, and perceived behavioural
control. It also significantly increased rider’s attitudes to safety and participant
perceptions of how family and friends support or disapprove of their riding
behaviour. The program aimed to achieve each of these effects apart from the
findings for PBC which may have unfortunately been an artefact of the questionnaire
design (i.e. only two items assessing this construct rather than a more comprehensive
scale). The findings for attitudes, intentions, thrill seeking, and the normative
influence of family and friends are indicators that the program is achieving an effect
as designed, albeit possibly not to the desired degree. This is discussed further in the
following section regarding comparisons between the intervention group (pilot
program) and the comparison group (standard training program).
The findings for the program’s effect on psychosocial factors that underpin
risky riding are an indicator that education for motorcyclists can influence the way
they think about risk-taking issues. As measurement of these variables is seldom
undertaken for the effects of motorcycle training/education, this is an important first
step in establishing how training may have an effect on safety. Linking such data to
Government crash and offence records as part of the broader project in the future will
provide more valuable insight into the useful mechanisms of the program.
Follow up of program participants a year after completion of the course was
undertaken by the candidate to ascertain how the psychosocial factors examined at
the start and end of training were maintained after licensing and how they linked to
specific riding behaviours. The low response rate upon follow up, despite
participants being contacted twice within a two week period, resulted in a lack of
robust findings. However, for the group that did respond at follow up it appeared that
the effects of Three Steps to Safer Riding program on the psychosocial variables did
not decay once licensed. This is a positive indicator that the program may have a
reasonably lasting effect as designed. Riding behaviours at follow-up are discussed
later in Section 6.2.4 regarding comparison to the comparison group.
6.2.3.1 Riding subgroups
Changes between the start and end of training on all the key risky riding
concepts did not vary for specific subgroups apart from those who were less educated
215
increasing in their propensity for thrill seeking, whereas all other educational
categories decreased in the propensity for risk taking. Overall, the program appeared
to have equal effect for, and thereby likely ‘reach’ to, most subgroups of riders
examined in the quantitative data: the implications of this being that the program can
be applied in the licensing context with confidence that it is not merely having an
effect on a particular group of riders. Qualitative data did however suggest that
absolute novice riders with no previous experience embraced the intervention
concepts more. As this was not found in the quantitative data, this may require
further specific investigation for program effects in future research comparing riders
with previous riding experience to those without it at the time of licensing. No
comparison of subgroups were undertaken for the T3 follow-up data due to the small
sample size.
6.2.3.2 Differences between the treatment group and comparison group
When compared to the comparison group who received the industry partner’s
standard Q-Ride training package, the Three Steps to Safer Riding program
participants were found to report increase more in their positive attitudes to safety
over the duration of training. This is a particularly valuable finding as one of the
aims of Q-Ride is for riders to hold appropriate attitudes to safety. Even though the
pilot intervention program did have a positive effect on future riding intentions and
thrill seeking, these were also reflected in changes produced by the standard training
program examined in the comparison cohort. This also suggests that the intervention
program requires further refinement to maximise its potential as discussed later in
detail in Section 6.2.5. Nonetheless, the significant effect of the program on attitudes
to safety, over and above that of the comparison group, makes the program a
valuable resource worthy of further development by the industry partner.
Overall, future research continuing the program would be valuable to confirm
its value, although it is posited that such research is best conducted across many
organisations to maximise the external validity of the program.
6.2.4 What effect (if any) does the Three Steps to Safer Riding pilot program have
on risky riding behaviour (RQ4)?
This section discusses the degree to which the pilot intervention program
influenced actual risky riding subsequent to training. As many participants were not

216
active riders before commencing training, actual risky riding behaviours were not
studied during the training period. Rather, the research aimed to follow-up riders
after licensing with their permission.
Unfortunately, a low response rate at follow-up for Study 2 and Study 3a and
methodological limitations resulted in the findings for risky riding behaviour being
indicative at best. Nonetheless these findings offer some value in terms of issues for
further investigation in future studies.
In relation to self-reported riding behaviour after licensing, Study 3a found
moderate to high positive associations between riders’ intentions at the end of
training (T2) and risky riding behaviours at follow-up (T3) for the intervention
group. This finding indicates that attitudinal and motivational factors addressed in
training are potentially well aligned with future riding behaviour. This is consistent
with the relationship between intentions and behaviours within the TPB (albeit
merely observed from correlations rather than regressions as would normally be
undertaken to examine this relationship).
Comparisons of self-reported riding behaviours were also undertaken at
follow up approximately one year after licensing for the intervention group and
approximately two years after licensing for the comparison group. The follow up
period between the two cohorts varied as only one follow-up study was conducted to
attempt to capture both cohorts of participants. Emotional riding was the only
concept that was found to vary between the pilot intervention group and the
comparison group. The levels of emotional riding reported in the Three Steps to
Safer Riding group were significantly less than that of the comparison group
participants. Tentatively, this indicates that emotional riding is a key concept for the
intervention program. This is also supported by participant comments in the follow-
up focus groups that often cited emotion as something they had not really previously
considered as a risk factor and that awareness of the issue raised through training had
changed the way they rode. The limited qualitative and quantitative data do not allow
firm conclusions to be drawn, but do support the notion that the concept of emotion
should be further investigated in motorcycle rider training.
Further strategies for participant recruitment to ensure a higher response rate
follow-up are required to ensure riding behaviours are examined in detail following
217
training and licensing. This may involve considerable incentives and/or different
methods of follow-up such as telephone contact. The T3 method used for this study
was a web-based questionnaire with participants recruited from the original T1
participant pool 12 months after the completion of training via email contact and
SMS (mobile phone texting). A reminder email or SMS was also sent in an effort to
enhance the response rate however it is possible that both email and SMS may have
been considered rather impersonal and therefore perhaps ignored. Direct contact via
telephone survey may have overcome this issue somewhat and also perhaps accessed
any of the original sample that did not have internet access. Another issue for
consideration in future studies of this nature is a shorter follow-up period. For
example, Cunningham et al. (2009) obtained an 80% response rate three months after
a brief intervention for alcohol and violence among youths. Additionally, the length
of the T3 questionnaire used in Study 2 and Study 3 may have been viewed by
prospective participants as being too long, thereby resulting in them not participating.
This may have potentially been overcome by more comprehensive trialling of the
web-based questionnaire among motorcyclists before release and the exclusion of
some items if need be to shorten the completion time. However, completion time
would inherently also be influenced by individual computer processing speed and
internet speed. Each of the issues mentioned above require consideration for future
studies of this nature to ensure a sufficient, meaningful response rate.
6.2.5 What improvements can be made to enhance the Three Steps to Safer Riding
pilot program, its practical utility and potential safety efficacy (RQ5)?
The primary objective of the program of research by the candidate was to
inform the future refinement of the Three Steps to Safer Riding program through
formative evaluation. The process evaluation suggests that the pilot intervention was
generally implemented as intended and had sound fidelity; however some room for
improvement was identified. Therefore, the research has important implications for
the refinement of the intervention for future application. Potential improvements to
licensing systems to accommodate programs that address attitudinal and motivational
factors for motorcyclists have already been discussed in the previous sections.
However, this section focuses on the utility of the program in the current context in
which it is applied (i.e. a brief intervention within Q-Ride). This does not discount

218
the proposition that the program may have greater safety efficacy if delivered partly
before on-road experience is gained and partly after several months of riding
experience.
It is evident that the amount of content that can be included in the program is
limited by the licensing context in which it operates. Within the user pays Q-Ride
system, the program must be necessarily brief or the cost of training to customers
will not be commercially competitive. The issue of the cost of training is discussed
further in Section 6.3 regarding implications for exposure and safety.
Issues for improvement of the program were identified in Section 5.2.4.7.
Instructors indicated that they were able to deliver the program in the allocated time
once they had become familiar with it. However, some thought that they lacked time
to facilitate extended discussions on any particular topic. Group discussion has been
shown to be a useful tool in driver training (Gregersen et al., 1996). Hence, the focus
of the program may need to be narrowed marginally in the future to allow for more
time for discussion of the chosen program topics within the current context of Q-
Ride.
Study 3b also found that program delivery procedures generally appeared
sound for the intervention with the exception of: 1) times where the program was
delivered at night due to the high demand periods; and 2) a lack of focus on working
through the Toolkit during the initial classroom session and at the debrief session
immediately following the end of training. For times where night classes were
conducted it appeared that for some students the overall training course lacked
continuity as practical riding was not conducted on the same day. Hence, night
classes may not be ideal as students are more likely to be tired if they have worked
throughout the day and may see the classroom session merely as a licensing
formality. For these reasons, the intended effect of training may be undermined
during night time classroom training during the licensing course.
In regard to delivery of the Toolkit booklet there were mixed findings but
these indicated that there was room for improvement nonetheless. The process
evaluation found that some course participants used the booklet for self-monitoring
purposes following licensing (as intended). However, other participants did not fully
grasp the aim of the booklet and instructors admitted that they did not spend a lot of
219
time working through the booklet during training. Therefore, this is a particular issue
for improvement to ensure that the instructors receive more training regarding the
Toolkit aims and concepts as well as the need to prioritise sufficient time to be able
to work through it. Reducing the amount of information in the booklet while
retaining its central concepts (i.e. the three steps) may assist in this process. This may
also be assisted by development of an additional take home resource such as a DVD
to extend learning beyond the classroom.
The focus groups conducted in Study 3b appeared to be in themselves a
valuable learning tool for some participants who got value from sharing their riding
experiences since licensing and hearing of other riders’ experiences. Hence, an
additional learning strategy to maximise the potential effect of the program could be
to hold face-to-face review sessions or develop an online forum for those who are
interested. One instructor suggested a procedure where follow-up review phone calls
are made to students (say a month or two post licence) to discuss how the concepts
covered in training have been applied. This is another possible strategy to extend the
learning arising from the program, although it would have resource implications to
avail instructors time to do this.
A further important point is that motorcycle riders are not a homogenous
group. They vary on a range of demographic indicators as found in Study 2 and
Study 3a and each licence applicant brings a range of personal experience with them
to the training situation. The program appears to have accommodated this well.
Study 3a found that the program effects did not differ significantly across subgroups
of riders. The process evaluation in Study 3b indicated that participants valued
different aspects of the Three Steps to Safer Riding program. Therefore, while
individual differences between riders exist, as is likely to be present in any adult
learning situation, the program appeared to have had broad enough reach to
accommodate these.
In sum, it appears that the pilot intervention was largely delivered in an
effective manner that raised awareness for riders of their own personal risk factors
and encouraged introspective learning. It is recommended that the abovementioned
refinements to the existing program and procedures are made prior to
commencement of the full intervention. While the value of strategies to extend

220
learning beyond the classroom may be speculative until confirmed through further
evaluation, it is recommended that at least one of these initiatives (e.g. a ‘booster’
DVD) be trialled and evaluated. If the above concerns can be overcome then the
program should be more manageable in a practical sense for instructors and possibly
have more value to course participants.
6.2.6 Summary of Research Findings
Overall, the findings suggest that: 1) minor refinements are required to the
Three Steps to Safer Riding intervention for future application; and 2) that a host of
contextual factors need to be considered for the application of motorcycle licensing
programs to address attitudinal and motivational factors relating to risky riding. The
most important of these is arguably the structure of the licensing system itself.
6.3 Broad Implications for Rider Training and Licensing
The previous section discussed the findings of the research in regard to
program effect and further refinement of the Three Steps to Safer Riding program.
This section aims to extend that knowledge to further discuss implications for
government policies for rider training and what measures are potentially required to
best support inclusion of programs such as the Three Steps to Safer Riding in
licensing systems.
The main lessons learnt from the implementation of the pilot intervention to
inform other rider education programs of this nature are that:
1. the program should be highly structured, with supporting materials for
standardisation;
2. concepts should be based on the language of motorcyclists to have high face
validity to riders;
3. sufficient prior training of the instructors for program goals and delivery
protocols should be conducted;
4. riding scenarios and crash narratives are a useful tool for discussion of risky
riding issues; and
5. an absolute minimum of one hour would appear to be required for the main
session, with some time dedicated to a debrief session to reaffirm the key
points at the end of licence training.
221
A major influence on rider training programs is the context in which it is
conducted, often within a licensing system. It is logical that many motorcycle rider
training organisations would devote the vast majority of time and effort to addressing
the requisite skills-based competencies as set by the licensing authority. The
development and implementation of a motorcycle-specific attitude assessment as part
of the licensing process could motivate licence applicants to explore attitudinal
influences on riding prior to assessment. However, developing such an assessment
tool for licensing is a challenging task as responses to attitudinal assessment items
may be easily faked if licence applicants are motivated to do so. The motivation to
honestly report attitudes, intentions, and motives for risk taking is quite different for
confidential research as undertaken for this project (in which demand characteristics
where specifically addressed) compared to when licence applicants know this
information will be scrutinised by licensing authorities. Rather than an attitude test, a
more practical solution is for structured sessions to address attitudes and motives for
risk taking (such as the Three Steps to Safer Riding module) to be mandated as part
of licence training without assessment of such a component. To achieve this, it is
important that programs be validated for their effect in the real world context of a
licensing system. Further validation of the Three Steps to Safer Riding program for
reductions in crash involvement or reductions in traffic violations is necessary. This
is planned as part of the broader project that this PhD is nested within. Nonetheless,
the research undertaken by the candidate has shown that the Three Steps to Safer
Riding does address the competency concerns within Q-Ride regarding rider
attitudes and that these can be shaped (at least for some riders) during the licensing
process.
Licensing systems can accommodate structured programs such as the Three
Steps to Safer Riding. However, it has historically been rare for motorcycle licensing
systems to have a sufficient focus on risk taking issues (Haworth et al, 2000). As the
vast majority of motorcycle rider training is undertaken in the context of licensing it
is important that authorities create opportunities to implement and evaluate programs
such as the Three Steps to Safer Riding through inclusion in mandatory training
curricula. The remainder of this section aims to provide a rationale for how this may
be achieved to elicit changes in attitudes as found in this program of research, and
222
how effects may possibly be enhanced through modifications in the licensing system
to best accommodate effective learning by novice motorcyclists. While the
discussion that follows in this section is speculative, such an endeavour may provide
a framework to capitalise on the findings of this research and possibly achieve
greater benefits to motorcycle safety. This would also need to be evaluated to
determine what effect it has compared to the brief intervention.
A key issue that requires further consideration for the learning needs of
motorcyclists is the amount of time devoted to training. The Three Steps to Safer
Riding pilot was constrained in terms of the amount of time that could be allocated
within the context of the licensing system and, hence, was effectively a brief
intervention. It is unknown if the short time frame represented a barrier to achieving
better outcomes as a trial with multiple sessions would be required to determine this.
The formative evaluation of the pilot program showed that it could influence rider
attitudes in the limited time allocated and the program was accepted by participants
and instructors. Hence, within the Q-Ride context, the brief intervention program had
some success. However, it could be that if the context allowed more time, more
issues could be addressed, with greater potential for elaboration of information. To
avoid information overload for course participants several classroom sessions spaced
over time would be ideal.
Therefore, licensing authorities may benefit by focusing on the learning needs
of novice riders by incorporating several formal learning opportunities to address
attitudes and behaviour into motorcycle licensing systems in a graduated manner
over an extended time period. This approach is consistent with the views of the
Motorcycle Safety Foundation in the United States (Buche, Williams & Ochs, 2010)
and may offer greater opportunity for training to have an effect beyond what was
found in the brief pilot intervention. Figure 6.1 provides a basic framework for this.5
5Note, Figure 6.1 focuses on learning opportunities within a graduated system but does not include
licensing restrictions at each stage or penalties for traffic violations that may also be useful to assist
learning and serve to enhance overall safety. Detailed discussion of such issues is beyond the
immediate scope of this research.
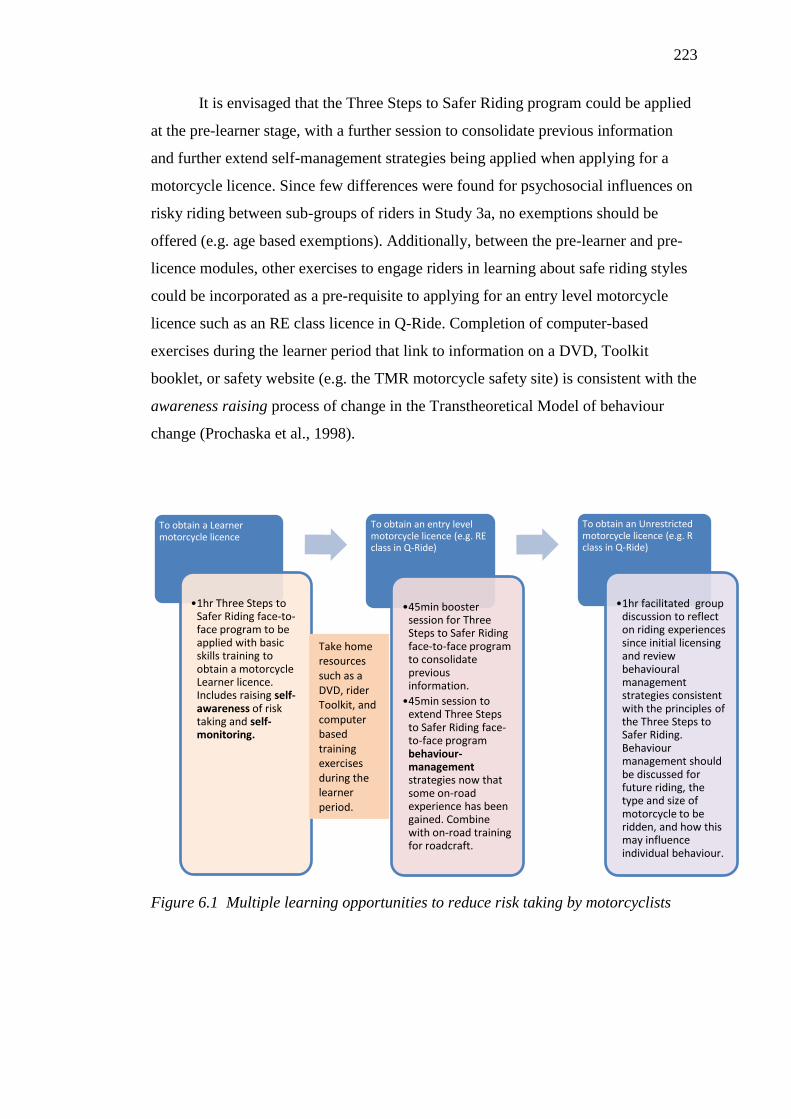
223
It is envisaged that the Three Steps to Safer Riding program could be applied
at the pre-learner stage, with a further session to consolidate previous information
and further extend self-management strategies being applied when applying for a
motorcycle licence. Since few differences were found for psychosocial influences on
risky riding between sub-groups of riders in Study 3a, no exemptions should be
offered (e.g. age based exemptions). Additionally, between the pre-learner and pre-
licence modules, other exercises to engage riders in learning about safe riding styles
could be incorporated as a pre-requisite to applying for an entry level motorcycle
licence such as an RE class licence in Q-Ride. Completion of computer-based
exercises during the learner period that link to information on a DVD, Toolkit
booklet, or safety website (e.g. the TMR motorcycle safety site) is consistent with the
awareness raising process of change in the Transtheoretical Model of behaviour
change (Prochaska et al., 1998).
Figure 6.1 Multiple learning opportunities to reduce risk taking by motorcyclists
To obtain a Learner motorcycle licence
•1hr Three Steps to Safer Riding face-to-face program to be applied with basic skills training to obtain a motorcycle Learner licence. Includes raising self-awareness of risk taking and self-monitoring.
To obtain an entry level motorcycle licence (e.g. RE class in Q-Ride)
•45min booster session for Three Steps to Safer Riding face-to-face program to consolidate previous information.
•45min session to extend Three Steps to Safer Riding face-to-face program behaviour-management strategies now that some on-road experience has been gained. Combine with on-road training for roadcraft.
To obtain an Unrestricted motorcycle licence (e.g. R class in Q-Ride)
•1hr facilitated group discussion to reflect on riding experiences since initial licensing and review behavioural management strategies consistent with the principles of the Three Steps to Safer Riding. Behaviour management should be discussed for future riding, the type and size of motorcycle to be ridden, and how this may influence individual behaviour.
Take home resources such as a DVD, rider Toolkit, and computer based training exercises during the learner period.
224
Licensing systems could impose a module for further discussion of risky
riding issues upon applying for an unrestricted motorcycle licence, with reflection on
riding experiences and behaviour management conducted in a group situation.
Queensland currently requires riders to undertake practical assessment on a larger
capacity machine to graduate to an unrestricted capacity (R class) motorcycle
licence: either a practical on-road test (Q-Safe) or Q-Ride. Hence, this presents
another stage for learning about risk taking issues and behaviour. Potential influences
of larger machines on risk taking and the factors that motivate riders to choose larger
machines could be key components of education at this stage. It should be noted that
it is the lessons to elucidate introspective thinking that are important regarding risk
taking behaviour, and graduated stages should not merely focus on assessment per
se. Group sessions may potentially result in better outcomes (Gregersen, Brehmer &
Moren, 1996). Set curricula for all modules would be required within a graduated
system.
Any increase in the amount of time required in the licensing process to facilitate
programs such as the Three Steps to Safer Riding raises two key issues: 1) an
increase in cost, and; 2) the potential effect on overall exposure. If the aim of the
licensing and training system is to reduce injury to motorcyclists then increased costs
from more comprehensive training such as including the Three Steps to Safer riding
program may have an effect in two ways:
1. more positive attitudes to safety may protect riders from injury (yet to be
confirmed through crash data), and;
2. higher costs for training/education may discourage some potential riders from
riding, thereby reducing the number of crashes through reductions in
exposure.
This is only likely to occur in a system with mandatory training. Alternately,
if training is subsidised to encourage people to undertake training in a voluntary
system, any potential benefit in terms of reduced crash risk may be outweighed by an
increase in exposure through increased uptake of riding. These issues must also be
considered with reference to the potential likelihood of motorcyclists riding
unlicensed if the licensing system is perceived as being too onerous or costly.
225
In sum, this section presents motorcycle licensing authorities with some
initial evidence to support the incorporation of programs such as the Three Steps to
Safer Riding to address attitudinal and motivational factors into motorcycle licensing
systems. However, such initiatives need to consider the possible implications of
program design and delivery, cost, and potential effects on exposure and unlicensed
riding. Furthermore, any future incorporation of a program like the Three Steps to
Safer Riding into the licensing system would need to be subject to thorough trialling
and evaluation to determine its overall cost effectiveness and, hence, sustainability.
6.4 Strengths and Limitations
The overall program of research undertaken had several strengths and
limitations. These have been discussed in relation to each study in previous chapters
and therefore will not be discussed at length in this section. However, the main
strengths and limitations are briefly summarised in the following sections to provide
context to the overall findings and how they should be interpreted.
6.4.1 Strengths of the Research
At a broad level, the main strengths of the program of research were: 1) that
the research was conducted in a real world motorcycle rider training context, thereby
having high ecological validity; 2) that a comparison group was incorporated into the
interim outcome design in a way that limited potential selection bias; 3) both
qualitative and quantitative data collection methods were used to provide a
comprehensive understanding of the topic; and 4) the evaluation was guided by the
same theoretical model (the TPB) which was used to inform the development of the
program.
When considering the first point mentioned above, the research was
conducted in a real world motorcycle licensing and training context with the
assistance of an industry partner training organisation. While this resulted in some
practical constraints (discussed in the following section), the environment in which
each of the studies took place relates explicitly to Q-Ride. Therefore, the
implications for Q-Ride from this research are much more likely to be credible than
if studies were conducted in an experimental research setting or if psychologists

226
delivered the program instead of riding instructors. This adds much to the legitimacy
of interpreting the implications of the research for policy.
In regard to evaluation design, previous evaluations of motorcycle rider
training programs have generally endeavoured to compare formally trained riders
with those that are informally trained (e.g. learned from friends). If using such a
design, self selection may result in pre-existing differences for attitudinal and
motivational issues that cloud the results, even if participants are matched for
demographic characteristics and riding history. Essentially this may result in two
quite different populations of riders as found by Watson et al. (2003). The design
used to evaluate the effects of the Three Steps to Safer Riding program minimised
the potential for such differences.
For the third major strength, qualitative methods were used in two of the
studies for the richness of data that could not readily be obtained using quantitative
measurement. For determining learning issues for rider training, this was an essential
method. Additionally, the largely qualitative process evaluation gathered valuable
data to inform the further refinement of the intervention program. Together, these
qualitative and quantitative components provided important formative information to
guide the future development of the Three Steps to Safer Riding program.
Finally, the design and evaluation of the pilot intervention were guided by a
theoretical model (the TPB). This provided a framework for consideration of the
relevant issues and further lays the foundation to explore the relationships with
crashes and offences to be obtained as part of the broader project.
6.4.2 Limitations of the Research
The main limitations of the research were related to: 1) the practical
constraints of the industry setting and the licensing system; 2) that the research was
conducted within only one training organisation; 3) the low response rate for the
follow-up of riders for self-reported riding behaviour after licensing; and 4) the
inability to determine crash involvement or injury reduction to motorcyclists
subsequent to training and licensing.
In regard to the practical constraints of the real world setting, several aspects
of the studies that were planned could not be conducted as originally intended. This
included the change in research design from concurrent training sites for comparison

227
to a temporal block design where the standard training program was measured
followed by the implementation of the pilot intervention program at the same site.
This increased the potential for extraneous influences during the different periods on
the psychosocial factors measured. This included changes to Q-Ride and the related
licensing requirements. However, baseline comparisons across the two cohorts found
that, while there was an increase in the proportion of new riders during the pilot
intervention, most indices of attitudinal and motivational influences on risky riding
did not differ at baseline. This suggested that extraneous influences were limited.
Another practical constraint was the lack of instructor measurement of student riding
skill which left the issue of overconfidence as a function of training to be interpreted
at a group level (in comparison to ‘average’) rather than at an individual level in
comparison to instructor ratings, as originally planned. The industry partner stated
that the scoring of skill levels for each individual was against the principles of
competency-based training and assessment and was therefore not incorporated in the
research as this raised liability concerns for the industry partner. Overall, these
practical issues reflect the constraints of conducting research in an applied context.
The use of only one rider training organisation to implement the pilot
intervention and gather data does limit the generalisability of the findings. Using
other training organisations may have potentially resulted in higher or lower scores
for the psychosocial factors that influence risky riding for their standard training
programs or potentially their students may have reacted differently to the
intervention concepts. However, as the partner organisation was found to have a
sound existing approach to teaching and learning, and their standard program was
also found to have an effect on psychosocial factors as a function of training, it could
be argued that there is more scope for the intervention content and delivery protocols
to have a positive effect for other training organisations. The need for further
research in this area is discussed in the Section 6.5.1 to follow.
The low response rate for self-reported riding behaviour was discussed at
length in Chapter 5 (see Section 5.2.3.6). This unfortunately resulted in the inability
to undertake meaningful analyses to link the effect of attitudinal and motivational
factors measured at the time of licensing to subsequent riding behaviour. The lack of
representativeness of the follow-up sample also meant that comparisons between the
228
control and treatment groups should be interpreted with caution. Again, the further
follow-up study of official crash and traffic offence data as part of the broader
project may help to add clarity to this issue.
Finally, not enough self-reported crash data was obtained in this program of
research to be able to determine the effects of the pilot intervention on crash
involvement or injury for riders. This was expected and flagged in Chapter 4. As
such it remains difficult to argue that the positive effects of the pilot intervention on
riders’ attitudes to safety will have an effect on actual injury rates. Hence, further
research is required in this regard with a larger sample size over an extended follow-
up period before it can be determined that the Three Steps to Safer Riding program
will benefit road safety.
In sum, the studies were conducted in a real world setting which resulted in
some practical constraints however also presented a rare opportunity for applied
research with sound ecological validity. The research controlled for limitations where
possible (e.g. self-selection bias) but the effects found in the trial must be interpreted
with the limitations in mind.
6.5 Future Research Directions
6.5.1 Establishing the Crash Reduction Benefits of the Three Steps to Safer Riding
Program
Future research is required to establish if the intervention program reduces
crash risk. The larger project in which this PhD is nested plans to track the crash and
offence histories of consenting participants over time using Queensland Transport
and Main Roads official records and compare them with comparison group
participants that complete the standard training of the industry partner organisation.
Such research will need to ideally account for exposure in terms of distance travelled
since training.
Another consideration for this research is obtaining a sufficient sample size to
ensure sufficient statistical power as crashes are relatively rare events. It is planned
that participants will be tracked over five years to enable enough time for a sufficient
number of crashes to occur. Self-report questionnaire data gathered for intervention
and comparison group participants at the start and finish of training can be examined
for variables that might predict crash involvement or higher rates of traffic violations.

229
Ideally such research would be undertaken across an entire licensing system to obtain
greater numbers of participants and ensure increased external validity of the results.
6.5.2 Electronic Delivery of Education to Address Attitudinal and Motivational
Factors
With ever increasing computer and internet usage, computer-based
applications are an alternative to face-to-face intervention programs. The potential
for the use of such intervention packages for motorcyclists has been established
within the IRT project in Europe as discussed in Section 2.5.1.2. Due to the
geographical expanse of Australia, computer-based training appears to be a feasible
option not only in populated metropolitan areas, but also to reach licence applicants
in less populated rural areas where face-to-face training does not exist due to a lack
of commercial viability. Hence, future research to develop a computer-based version
of the Three Steps to Safer Riding may have some value. To date, there is a paucity
of formal evaluations for electronically delivered road safety interventions.
Further development of the program in electronic formats would have to
consider issues such as internet access in certain geographical areas and/or the
processing speed required to run programs need to be considered for web-based or
MAC/PC-based applications. Many principles of the face-to-face program can be
incorporated into an electronic program. These include scenario-based learning and
encouraging personal reflection. However, the important tool of group discussion
cannot be directly incorporated. Video segments of group discussion for some topics
could, however, be inserted into the computer-based program as examples to
encourage further reflection. Knowledge based assessment could be incorporated
with a bank of multiple choice questions which would require validation.
A supplementary DVD is under development for the Three Steps to Safer
Riding, however remains to be trialled. The DVD is to provide a further resource for
ongoing learning and to consolidate the learning of key messages from the program.
Future research could establish if this has any effects on attitudinal and motivational
factors beyond the intervention program or as a stand-alone product.
230
In sum, the Three Steps to Safer Riding has potential to be delivered as an
electronic resource. This could be as a tool for licence training, or could be applied at
the pre-learner stage or at any other point early in the riding career.
6.5.3 Other issues for future research for rider training
Another key issue that needs to be addressed for the safety of motorcyclists is
hazard perception training. Future research should aim to establish the safety benefits
of hazard perception training using a range of approaches. For example, electronic
applications such as RideSmart (Transport Accident Commission, 2009) that run on
a personal computer could provide motorcyclists in the early stages of their riding
careers with vital skills to recognise and respond to common road-based hazards and
other road users. Other programs that encourage rider commentary may also be
worthy of future research. Motorcycle simulators also provide an opportunity for
hazard perception training. Increased physical fidelity from that available at present
may also facilitate training for hazard avoidance skills. Hence, the development of
such tools and training protocols may be valuable avenues for future research.
Training that uses instrumented motorcycles has also been shown to
potentially be a useful approach to improve safety (Aupetit, 2008). Further broad
scale research of this nature could provide useful objective data that can be used as a
feedback tool for riders both at the face-to-face training stage and beyond,
incorporating such data to support self-monitoring.
In addition, future research for motorcycle rider education should also aim to
develop programs to address specific issues such as the wearing of protective
clothing and/or helmets. Increasing wearing rates has considerable potential to
reduce injury for motorcyclists. While the wearing of helmets is compulsory in
Australia, there is much scope for broad scale benefits internationally as the
protective value of motorcycle helmets has been well established. In Australia, the
voluntary uptake of wearing suitable boots, jackets, gloves, and pants requires
attention. Potentially many novice riders are particularly uninformed as to the
benefits of such apparel.
In summary, all of the abovementioned issues for future research in rider
training and education could be applied to various target groups such as learner
riders, riders returning after a riding hiatus, or recidivist traffic offenders. As research
231
for motorcycle safety is limited in comparison to that for other road users (e.g.
novice drivers), such research has the potential to provide valuable knowledge to
inform evidence-based policy formulation. Key to any such initiatives for education
is incorporating evaluation measures.
6.6 Concluding Remarks
The Three Steps to Safer Riding intervention is a brief classroom-based
educational program that aims to address the psychosocial factors that underpin risky
riding for motorcyclists with a view to ultimately result in safer riding behaviours.
The research presented in this dissertation contributed to the development of the
program through a review of the literature and an initial qualitative study to
investigate the approach to teaching and learning of the industry partner training
organisation. A thorough formative evaluation of the pilot program was also
conducted incorporating an interim outcome evaluation of intermediate variables
such as attitudes and motives for risk taking as well as a process evaluation of the
program implementation and delivery.
Collectively the findings suggest that the Three Steps to Safer Riding
program was viewed in a positive light by riding instructors, was well received by
learner riders, and had an immediate positive influence on rider attitudes to safety
which appeared to persist for some time after completion of the program. The
findings also suggest that minor improvements are required to the program. In a
broader sense, the implications from this research for motorcycle safety in general
are twofold: 1) that a brief structured educational program addressing risk taking
may have value for motorcycle safety (at least for immediate influences on attitudes),
and; 2) that the Q-Ride licensing system is not ideally designed to facilitate such
educational programs (i.e. pressures of commercial competition may sway training
organisations to adopt a minimalistic approach to user-pays training to remain
financially viable).
The primary finding of the research was that psychosocial influences on risky
riding appear amenable to influence through structured education that focuses on
awareness raising at a personal level and provides strategies to deal with future riding
situations. For motorcycle licensing authorities worldwide, this is an indication that

232
such programs may have value within licensing systems. Future follow-up of
program participants’ official crash and traffic offence records over time may lend
further support for the application of the program within licensing systems.

233
References
Ajzen, I. (1991). The theory of planned behaviour. Organizational Behavior and
Human Decision Processes, 50, 179-211.
Armitage, C. J. & Conner, M. (2001). Efficacy of the Theory of Planned Behaviour:
A meta-analytic review. British Journal of Social Psychology, 40, 471-499.
Association of European Motorcycle Manufacturers (ACEM) (2004). Motorcycling
accident in-depth study (MAIDS). Retrieved from http://maids.acembike.org/
Aupetit, S. (2008). Studying motorcycle learning in real context to improve rider’s
education. Paper presented to IMC.
Australian Transport Safety Bureau (2002). Motorcycle rider age and risk of fatal
injury – Monograph 12. Retrieved 3/3/06 from www.atsb.gov.au
Bailey, T. (2002). Novice driver self-monitoring. In proceedings of the Development
of Safer Drivers and Riders Conference. Brisbane: Australian College of Road
Safety.
Bailey, T. (2003). Differences in teaching approaches among car driving instructors.
In proceedings of the Road Safety Research, Policing, and Education Conference
– Sydney.
Baldi, S., Baer, J. D., & Cook, J. L. (2005). Identifying best practice states in
motorcycle rider education and licensing. Journal of Safety Research, 36, 19-32.
Baranowski, T, & Stables, G. (2000). Process evaluations of the 5-a-day projects.
Health Education and Behaviour, 27, 157-166.
Baughan, C, Sexton, B., & Elliott, M. (2004). Motorcyclists’ accident risk: Results
from a new survey. In Behavioural Research in Road Safety 14th
Seminar.
London: British Department of Transport.
Beaty, L., Gibbs, G., & Morgan, A. (1997). Learning orientations and study
contracts. In F. Marton, D. Hounsell, & N. Entwhistle’s (Eds.) The experience of
learning (2nd
Ed., pp. 3-22). Edinburgh: Scottish Academic Press.
Bellaby, P., & Lawrenson, D. (2001). Approaches to the risk of riding motorcycles:
Reflections on the problem of reconciling statistical risk assessment and
motorcyclists’ own reasons for riding. Sociological Review, 49(3), 368-389.
Bien, T. H., Miller, W. R., & Tonigan, J. S. (1993). Brief interventions for alcohol
problems: A review. Addiction, 88, 315-336.

234
Biggs, J. (2003). Teaching for quality learning at university: What the student does
(2nd
Ed.). Berkshire, UK: Open University Press.
Billheimer, J. W. (1991). California Motorcyclist Safety Program: Final Evaluation
Report. Prepared for the California Highway Patrol by SYSTAN, Inc., Los Altos,
CA.
Blackman, R. A., Veitch, C., & Steinhardt, D. A. (2008) Non-fatal motorcycle
crashes on public roads in North Queensland. In Australasian Road Safety
Research, Policing and Education Conference. Adelaide.
Broadley, C., & Hawkins, A. (2011). Older motorcycle rider safety in Queensland.
In proceedings of the Australasian Road Safety Research, Policing, & Education
Conference. Perth.
Broughton, P., Burgess, C., Fylan, F., & Srtadling, S. (2010). Evaluation of the
national RIDE scheme. Leeds: University of Leeds.
Broughton, P. S., & Stradling, S. G. (2005). Why ride powered two-wheelers? In
proceedings from Behavioural Research in Road Safety: Fifteenth seminar.
London: Department of Transport.
Buche, T., Williams, S., & Ochs, R. (2010). MSF RETS: A system designed to
succeed. In Proceedings of the Vulnerable Road Users Conference. Jerusalem.
Bureau of Infrastructure, Transport and Regional Economics (BITRE) (2011). Road
deaths Australia 2011 statistical summary. Canberra, ACT.
Burgess, C. (2006). Rider Risk Reduction Course. Course summary document.
Unpublished paper.
Chang, L. (2006). A new health education instrument for occupational health
promotion – Transtheoretical Model approach. International Congress Series,
1294, 115-118.
Christie, R. (2001). The effectiveness of driver training as a road safety measure: A
review of the literature. Noble Park, Victoria: Royal Automobile Club of
Victoria.
Christie, R., Harrison, W., & Johnson, D. (2006) Q-Ride curriculum reform.
Unpublished report to Queensland Transport. Sydney: Authors
Christie, R., Harrison, W., & Johnston, D. (2004). Development of a novice driver
education curriculum for the ATSB. Report # CR222. Canberra: Australian
Transport Safety Bureau.
Christmas, S., Young, D., Cookson, R., & Cuerden, R. (2009). Passion, performance,
practicality: Motorcyclists’ motivations and attitudes to safety - motorcycle
safety research project, PPR 442. Crowthorne: Transport Research Laboratory.

235
CIECA (2002). The EU ADVANCED project: Description and analysis of post-
licence driver and rider training. Final report. The Hague, Netherlands: CIECA.
Coben, J.H., Steiner, C. A., & Miller, T. R. (2006). Characteristics of motorcycle-
related hospitalizations: Comparing states with different helmet laws. Accident
Analysis & Prevention, 39(1), 190-196.
Cook, C., & Perri, M. (2004). Single-item vs multiple-item measures of stages of
change in compliance with prescribed medications. Psychological Review, 94(1),
155-124.
Cunnigham, R. M., Walton, M. A., Goldstein, A., Chermack, S. T., Shope, J. T.,
Bingham, C. R. et al. (2009). Three-month follow up of brief computerized and
therapist interventions for alcohol and violence among teens. Academic
Emergency Medicine, 16. 1193-1207.
Daniello, A., Gabler, H., & Mehta, Y. (2009). Effectiveness of motorcycle rider
training. Transport Research Record, 2140, 206-213.
Dee, T. S. (2008). Motorcycle helmets and traffic safety. Journal of Health
Economics, 28(2), 398-412.
Dehar, M., Duignan, P., Casswell, S. (1993). Formative and process evaluation of
health promotion and disease prevention programs. Evaluation Review, 17, 204-
220.
Delahaye, B. L. (2005). Human resource development: Adult learning and
knowledge management (2nd
Ed.). Brisbane: John Wiley and Sons Australia Ltd.
de Rome, L (2006) Planning for motorcycle safety: measures of success. In
proceedings of the Australasian Road Safety Research, Policing and Education
Conference. Gold Coast.
Dolan, R. J. (2002). Emotion, cognition, and behaviour. Science, 298, 1191-1194.
Drummer, O. (2003). The incidence of drugs in drivers killed in Australian Road
Crashes. Forensic Science International, 134, 154-162.
Elliott, M., Baughan, C., Broughton, J., Chinn, B., Grayson, G., Knowles, J., Smith,
L. & Simpson, H. (2003a). Motorcycle safety: a scoping study. TRL Report
TRL 581. Crowthorne: Transport Research Laboratory.
Elliott, M. A., Baughan, C. J., & Sexton, B. F. (2007). Errors and violations in
relation to motorcyclists’ crash risk. Accident Analysis & Prevention, 39(3), 491-
499.
236
Elliott, M. A., Sexton, B., & Keating, S. (2003b). Motorcyclists' behaviour and
accidents. In: Behavioural Research in Road Safety: Thirteenth Seminar (pp.139-
152). London: Department for Transport.
Entwhistle, N. (1997). Contrasting perspectives on learning. In F. Marton, D.
Hounsell, & N. Entwhistle’s (Eds.) The experience of learning (2nd
Ed., pp. 3-
22). Edinburgh: Scottish Academic Press.
Entwhistle, N. (1998). Approaches to learning and forms of understanding. In B.
Dart and G. Boulton-Lewis’ (Eds.), Teaching and learning in higher education
(pp.72-101). Melbourne: The Australian Council for Educational Research Ltd.
Entwhistle, N., McCune, V., & Hounsell, J. (2002). Approaches to studying and
perceptions of university teaching-learning environments: Concepts, measures
and preliminary findings (Occasional Report 1, ETL project). Edinburgh:
Economic and Social Research Council. Retrieved 20th March, 2005 from
http://www.ed.ac.uk/etl.
Evans, R. I., Raines, B. E., & Owen, A. E. (1989). Formative evaluation in school-
based health promotion investigations. Preventive Medicine 18, 229-34.
Evers, K. E., Prochaska, J. O., Johnson, J. L., Mauriello, L. M.., Padula, J. A., &
Prochaska, J. M. (2006). A randomized clinical trial of a population and
Transtheoretical Model based stress-management intervention. Health
Psychology, 25(4), 521-529.
European Commission (2007). Developing a European approach to the initial
training of motorcyclists.TREN-SUB-2003-S07.30333. Retrieved from
www.initialridertraining.eu
Federal Office of Road Safety. (1997a). Profile of unlicensed motorists in fatal
crashes
(Monograph 20). Canberra: Federal Office of Road Safety.
Freeman, J., Liossis, P., Schonfeld, C., Sheehan, M., Siskind, V., & Watson, B.
(2005). Self-reported motivations to change and self-efficacy levels for a group
of recidivist drink drivers. Addictive Behaviours, 30, 1230-1235.
French, M., Gumus, G., & Homer, J. (2009). Public policies and motorcycle safety.
Journal of Health Economics, 28(4), 831-838.
Gatscha, M., Brandstaetter, C., Kaltenegger, A., & Pripfl, J. (2008). Evaluation of the
Austrian multi-phase driving licensing model. In proceedings of the 4th
International Conference on Traffic and Transport Psychology. Washington, D.C.
Germeni, E., Lionis, C., Davou, B., & Th Petridou, E. (2009). Understanding reasons
for non-compliance in motorcycle helmet use among adolescents in Greece.
Injury Prevention, 15(1), 19-23.
237
Gray, J. R. (2001). Emotional modulation of cognitive control: Approach-withdrawal
states double-dissociate spatial from verbal two-back task performance. Journal
of Experimental Psychology: General, 130(3), 436-452.
Gregersen, N. P. (1996). Young drivers’ overestimation of their own skill – an
experiment on the relation between training strategy and skill. Accident Analysis
and Prevention, 28(2), 243-250.
Gregersen, N. P., Brehmer, B., & Moren, B. (1996). Roadsafety improvement in
large companies: An experimental comparison of different measures. Accident
Analyses & Prevention, 28(3), 297-306.
Harré, N., & Sibley, C. G. (2007). Explicit and implicit self-enhancement biases in
drivers and their relationship to driving violations and crash-risk optimism.
Accident Analysis and Prevention, 39, 1155-1161.
Hatakka, M., Keskinen, E., Gregersen, N. P., Glad, A., & Hernetkoski, K. (2002).
From control of the vehicle to personal self-control: Broadening the perspectives
to driver education. Transportation Research Part F, 5, 201-215.
Hatfield, J., & Job, R. F. S. (2001). Reduction of road related optimism bias and risk
taking: Final Report. Canberra: Australian Transport Safety Bureau.
Haworth, N., & Blackman, R. (2011). Research on fatigue to support the
development of the NSW Motorcycle Safety Strategy. Final report to the RTA.
Brisbane: Centre for Accident Research and Road Safety Queensland.
Haworth, N., de Rome, L., Varnsverry, P., & Rowden, P. (2007). Motorcycle
protective clothing: Are stars better than standards? In proceedings of the
Australasian Road Safety Research, Policing, and Education Conference.
Melbourne.
Haworth, N., Greig, K., & Nielson, A. (2009). A comparison of risk taking in moped
and motorcycles crashes. Transportation Research Record, 2140, 182-187.
Haworth, N. & Mulvihill, C. (2005). Review of motorcycle licensing and training
(Report No. 240). Melbourne: Monash University Accident Research Centre.
Haworth, N., Mulvihill, C., & Rowden, P. (2006). Teaching old dogs new tricks:
Training and older motorcyclists. In proceedings of the Australasian Road Safety
Research, Policing, and Education Conference. Gold Coast, Australia.
Haworth, N., & Rowden, P. (2006). Investigation of fatigue-related motorcycle
crashes: Literature review - Monograph. Brisbane: Centre for Accident Research
and Road Safety – Queensland.
238
Haworth, N., & Rowden, P. (2010). The applicability of learner driver research to
learner motorcyclists. In proceedings of the 27th
International Congress of
Applied Psychology, Melbourne.
Haworth, N. L., Rowden, P. J., & Schramm, A. J. (2010). A preliminary examination
of the effects of changes in motorcycle licensing in Queensland. In: Proceedings
of the Australasian Road Safety Research, Policing and Education Conference.
Canberra.
Haworth, N., & Smith, R. (1999). Single training course and test for the motorcycle
licence. Report prepared for VicRoads. Melbourne: Monash University Accident
Research Centre.
Haworth, N., Smith, R., Brumen, L., & Pronk, N. (1997). Case-control study of
motorcycle crashes (Contract report CR174). Canberra: Federal Office of Road
Safety.
Haworth, N., Smith, R., & Kowadlo, N. (2000). Evaluation of rider training
curriculum in Victoria (Report No.165). Melbourne: Monash University
Accident Research Centre
Hedlund, J. & Compton, R. (2005). Graduated driver licensing research in 2004 and
2005. Journal of Safety Research, 36, 109-119.
Henderson, M. (1991). Education, publicity and training in road safety: A literature
review, report No.22. Melbourne: Monash University Accident Research Centre
Hirsch, P., Maag, U., & Laberge-Nadeau, C. (2006). The role of driver education in
the licensing process in Quebec. Traffic Injury Prevention, 7, 130-142.
Horberry, T., Hutchins, R., & Tong, R. (2008). Motorcycle rider fatigue: A review.
Road Safety Research Report No. 78. London: British Department of Transport.
Horswill, M.S., & Helman, S. (2001). A comparative approach to differential
accident liability: Motorcyclists versus car drivers. In Grayson, G.B. (Ed),
Behavioural Research in Road Safety: Eleventh Seminar. London: Department
of Environment, Transport, and the Regions.
Horswill, M. S. & Helman, S. (2003). A behavioural comparison between
motorcyclists and a matched group of non-motorcyclists car drivers: Factors
influencing accident risk. Accident Analysis and Prevention, 35, 589-597.
Houston, D. J. (2007). Are helmet laws protecting young motorcyclists? Journal of
Safety Research, 38(3), 329-336.
Hung, D. V., Stevenson, M. R., & Ivers, R. Q. (2008). Barriers to, and factors
associated, with observed motorcycle helmet use in Vietnam. Accident Analysis
and Prevention, 40(4), 1627-1633.
239
Hurt, H., Ouellet, J, & Thom, D. (1981). Motorcycle accident cause factors and
identification of countermeasures, Volume 1 technical report. Prepared for the
U.S. National Highway Traffic Safety Administration, Washington.
Hutchinson, T. P., Kloeden, C. N., & Wundersitz, L. N. (2007). South Australia’s
driver intervention program: Personality characteristics of participants and their
subsequent crash and offence experience. In proceedings of the Australasian
Road Safety Research, Policing, and Education Conference. Melbourne.
ICCS (2010). Understanding risk taking behaviour within the context of PTW riders:
A report on rider diversity with regard to attitudes, perceptions and behavioural
choices. 2BeSafe Project Report. Greece: Author.
IRTAD (2011). International Traffic Safety Data and Analysis Group annual report
2010. France: OECD/ITF.
Jerrim, A (2003). Working in parallel. In proceedings of the Australasian Road
Safety, Policing, and Education Conference, Sydney.
Jonah, B. A., Dawson, N. E., & Bragg, B. W. E. (1982). Are formally trained
motorcyclists safer? Accident Analysis and Prevention, 14(4), 247-255.
Johnson, C. (2009). The Attitude Advisor: Attitude assessment for learner drivers.
Presentation at the CIECA-VdTÜV Congress on Technology, Training and
Testing. Germany.
Johnston, P., Brooks, C., & Savage, H. (2008). Fatal and serious road crashes
involving motorcyclists. Road safety research and analysis report: Monograph
20. Canberra: Australian Department of Infrastructure, Transport, Regional
Development and Local Government.
Kardamanidis, K., Martiniuk, A., Ivers, R., Stevenson, M., & Thistlewaite, K.
(2010). Motorcycle rider training for the prevention of road traffic crashes.
Cochrane Database Systematic Review, 10.
Kasantikul, V., Ouellet, J. V., Smith, T., Sirathranont, J. & Panichabhongse, V.
(1995). The role of alcohol in Thailand motorcycle crashes. Accident Analysis &
Prevention, 37(2), 357-366.
Katila, A., Keskinen, E., Hatakka, M., & Laapotti, S. (2004). Does increased
confidence amongst novice drivers imply a decrease in safety: The effects of skid
training on slippery road accidents. Accident Analysis & Prevention, 36, 543-550.
KfV SUPREME (2007). Summary and publication of best practices in road safety in
the member states. Thematic report: Driver education, training, and licensing.
Austrian Road Safety Board.

240
Kidd, P., Reed, D., Weaver, L., Westneat, S., Rayens, K. (2003). The transtheoretical
model of change in adolescents: Implications for injury prevention. Journal of
Safety Research, 34, 281-288.
Kloeden, C. & Hutchinson, T. P. (2007). Follow-up of subsequent crash and offence
records of offending drivers who either did or did not attend a driver intervention
program. 30th Australasian Transport Research Forum. Melbourne.
Kostyniuk, L. P., & Nation, A. D. (2006). Motorcycle crash trends in Michigan:
2001-2005. Michigan, U.S.; University of Michigan Transport Research Institute.
Kraus, J. F., Peek-Asa, C., & Cryer, H. G. (2002). Incidence, severity, and patterns of
intrathoracic and intra-abdominal injuries in motorcycle crashes. The Journal of
Trauma Injury, Infection, and Critical Care, 52, 548-553.
Krueger, R. A. (1998). Analyzing and reporting focus group results. Thousand Oaks:
CA: Sage publishing.
Lane, R. D., Nadel, L., Allen, J. J. B., & Kaszniak, A. W. (2000). The study of
emotion from the perspective of cognitive neuroscience, In R. D. Lane & L.
Nadel (Eds.) Cognitive neuroscience of emotion. New York: Oxford Press.
Lund, B. A. (2006). New rider training system in Norway. Paper submitted to The
Human Element International Motorcycle Safety Conference: California.
Ma, T., Williamson, A., & Friswell, R. (2003). A pilot study of fatigue on motorcycle
day trips. Sydney: NSW Injury Risk Management Research Centre.
Marottoli, R. A. (2002). Commentary: Riding off into the sunset: Implications for an
aging motorcyclist population. Annals of Emergency Medicine, 39, 196-197.
Marton, F., & Saljo, R. (1997). Approaches to learning. In F. Marton, D. Hounsell, &
N. Entwhistle’s (Eds.) The experience of learning (2nd
Ed., pp. 3-22). Edinburgh:
Scottish Academic Press.
Masten, S. V. & Peck, R. C. (2004). Problem driver remediation: A meta-analysis of
the driver improvement literature. Journal of Safety Research, 35(4). 403-425.
Matthews, G., Desmond, P. A., Joyner, L., Carcary, B., & Gilliland, K. (1997). A
comprehensive questionnaire measure of driver stress and affect. In T.
Rothengatter & E. C. Vaya’s (Eds.), Traffic and transport psychology: Theory
and application (pp. 317-324). New York: Elsevier Science Ltd.
Matthews, G. (2001). A transactional model of driver stress. In P. A. Hancock & P.
A. Desmond’s (Eds.), Stress, workload and fatigue (pp. 133-163). New Jersey,
USA: Lawrence Erlbaum.
241
Mayhew, D. R. (2006). The future of driver education. In Transport Research
Circular E-C101, Driver education: The path ahead (pp 17-18). Washington:
Transport Research Board.
Mayhew, D. R., Simpson, H. M., & Robinson, A. (2002). The safety value of driver
education and training. Injury Prevention, 8, 3-8.
Mayhew, D. R., Simpson, H. M., Williams, A. F., & Ferguson, S. A. (1998).
Effectiveness and role of driver education and training in a graduated licensing
system. Journal of Public Health Policy, 19(1), 51-67.
McGuire, M. (2004). Making motorcycling safer. In proceedings of the Australasian
Road Safety Research, Policing, and Education Conference. Perth.
McKenna, F. (2004). The Thames Valley speeding awareness scheme: A comparison
of high and low speed courses. In Behavioural Research in Road Safety 2004:
Fourteenth Seminar. London: British Department of Transport.
McKenna, F. P. (2005). Why do drivers break the speed limit? In Behavioural
Research in Road Safety 2005: Fifteenth Seminar. London: British Department of
Transport.
McKenna, F. P. (2006). Should speed awareness courses be only about speed? In
Behavioural Research in Road Safety 2006: Sixteenth Seminar. London: British
Department of Transport.
McKenna, F. P., & Myers, L. B. (1997). Can accountability reduce or reverse
existing illusory self-assessments? British Journal of Psychology, 88, 39-51.
McKnight, A. S. (2009). Riders Helping Riders: An alcohol peer intervention
program for motorcyclists. Presentation to the Governor’s DWI Research Forum.
Albuquerque, NM.
McKnight, A. S, Becker, L. R. & Hohn, R. L. (2009). Riders Helping Riders: An
alcohol peer intervention program for motorcyclists. Retrieved from
http://www.msf-usa.org/imsc/proceedings/c1-McKnight-
RidersHelpingRiders.pdf
Mertz, K. J., & Weiss, H. B. (2008). Changes in motorcycle-related head injury
deaths, hospitalizations, and hospital charges following repeal of Pennsylvania's
mandatory motorcycle helmet law. American Journal of Public Health, 98(8),
1464-1467.
Mignealt, J. P., Adams, T. B., & Read, J. P. (2005). Application of the
Transtheoretical Model to substance abuse: Historical development and future
directions. Drug and Alcohol Review, 24, 437-448.
242
Miles, D. R., van den Bree, M. B. M., Gupman, A. E., Newlin, D. B., Glantz, M. D.,
& Pickens, R. W. (2001). A twin study on sensation seeking, risk taking
behaviour and marijuana use. Drug and Alcohol Dependence, 62, 57-68.
Moen, B.E. & Rundmo, T. (2005) Predictors of unrealistic optimism: A study of
Norwegian risk takers. Journal of Risk Research, Vol. 8(5), 363-382.
Motorcycle Safety Foundation. (2005). Motorcycling excellence 2nd
Edition. New
Hampshire: Whitehorse Press.
Moyer, A., Finney, J.W., Swearingen, C.E. and Vergun, P. (2002). Brief
interventions for alcohol problems: A meta-analytic review of controlled
investigations in treatment-seeking and non-treatment-seeking populations.
Addiction 97(3), 279-292.
Mullin, B., Jackson, R., Langley, J., & Norton, R. (2000). Increasing age and
experience: are both protective against motorcycle injury? A case control study.
Injury Prevention, 6, 32-35.
Nairn, R. J. (1992). Motorcycle safety research literature review: 1987-1991.
Canberra: Federal Office of Road Safety.
Natalier, K. (2001). Motorcyclists interpretation of risk and hazards. Journal of
Sociology, 37(1), 65-80. NHTSA (2002). Recent trends in motorcycle fatalities. Annals of Emergency
Medicine, 39, 195-196.
NHTSA (2008). Countermeasures that work: A highway safety countermeasure
guide for state highway safety offices, Third Ed. Washington, DC: National
Highway Traffic Safety Administration.
Nigg, C. R., Burbank, P. M., Padula, C., Dufrene, R., Rossi, J. S., Velicer, W. F. et
al. (1999). Stages of change across ten health risk behaviours for older adults.
The Gerontologist, 39(4), 473-482.
Noordzij, P. C., Forke, E., Brendicke, R., & Chinn, B. P. (2001). Integration of needs
of moped and motorcycle riders into safety measures. Leidschendam: SWOV.
Norwegian Public Roads Administration (2004). Curriculum driving licence
categories A and A1. Handbook 251E – English version. Norwegian Public
Roads Administration.
OECD (2008). Workshop on motorcycle safety. Held in Lillehammer, Norway.
Brussels: Organisation for Economic Co-operation and Development.
Ohman, A., Flykt, A., & Lundqvist, D. (2000). Unconscious emotion: Evolutionary
perspectives, psychophysiological data, and neuropsychological mechanisms, In
243
R. D. Lane & L. Nadel (Eds.) Cognitive neuroscience of emotion. New York:
Oxford Press.
Ormston, R., Dudleston, A., Pearson, S., & Stradling, S. (2003). Evaluation of
Bikesafe Scotland. Edinburgh: Transport Planning Research Group.
Pallant, J. (2007). SPSS survival manual: A step-by-step guide to data analysis using
SPSS for windows. Crows Nest NSW: Allen & Unwin
Parliament of Victoria (1993). Inquiry into motorcycle safety in Victoria. Retrieved
2/3/06 from parliament.vic.gov.au
Paulozzi, L. J., & Patel, M. D. (2004). Trends in motorcycle fatalities associated with
alcohol impaired driving: United States 1983-2003. Atlanta, U.S.: Centres for
Disease Control and Prevention.
Peck, R. C. (2006). Novice driver training effectiveness evaluation. In Transport
Research Circular E-C101, Driver education: The path ahead (pp 12-16).
Washington: Transport Research Board.
Peek-Asa, C., Kraus, J.F., 1996. Alcohol use, driver, and crash characteristics among
injured motorcycle drivers. Journal of Trauma 41 (6), 989–993.
Pham, K. H., Le Thi, Q.X., Petrie, D. J., Adams, J., & Doran, C. M. (2008).
Households' willingness to pay for a motorcycle helmet in Hanoi, Vietnam.
Applied Health Economics and Health Policy, 6(2-3), 137-144.
Preusser, D. F., Williams, A. F., & Ulmer, R. G. (1995). Analysis of fatal motorcycle
crashes: Crash typing. Accident Analysis and Prevention, 27(6), 845-851.
Prochaska, J. O., Johnson, S., & Lee, P. (1998). The transtheoretical model of
behaviour change. In S. A. Schumaker, E. B. Schron, J. K. Ockene, & W. L.
McBee (Eds.) The handbook of health behaviour change. New York; Springer.
Prochaska, J. O., & Di Clemente, C. C. (1983). Stages and processes of self-change
of smoking: Towards an integrative model of change. Journal of Consulting and
Clinical Psychology, 51(3), 390-395.
Prosser, M., & Trigwell, K. (1999). Understanding learning and teaching: The
experience in higher education. Buckingham, UK: Open University Press.
Queensland Government (2009). Queensland Motorcycle Safety Strategy 2009-2012.
Brisbane
Queensland Parliamentary Travelsafe Committee (2003). Reducing the road toll for
young Queenslanders – is education enough? Report # 40. Brisbane: Parliament
of Queensland.
244
Queensland Parliamentary Travelsafe Committee (2007). Report on the inquiry into
Q-RIDE. Brisbane: Legislative Assembly of Queensland.
Queensland Transport (2006). Queensland road toll - 2005 in review. Retrieved
2/6/06 from www.roadsafety.qld.gov.au
Queensland Transport and Main Roads (2009). Queensland road toll weekly report.
Report 589. Brisbane: Queensland Transport.
Queensland Transport and Main Roads. (2011). 2010 year in review road crash
report: Road fatalities and hospitalised casualties. Brisbane: Queensland
Government
Ramsden, P. (1997). The context of learning in academic departments. In F. Marton,
D. Hounsell, & N. Entwhistle’s (Eds.) The experience of learning (2nd
Ed., pp. 3-
22). Edinburgh: Scottish Academic Press.
Ranta, P., Maki, A., & Huikkola, M. (2007). An evaluation of the potential of e-
coaching for riders. Federation of European Motorcyclists’ Association.
Reason, J. T., Manstead, A. S. R., Stradling, S., Baxter, J. S., & Campbell, K. (1990).
Errors and violations on the roads: A real distinction? Ergonomics, 33, 1315-
1332.
Reeder, A.I., Chalmers, D.J., & Langley, J.D. (1996). Rider training, reasons for
riding, and the social context of riding among young on-road motorcyclists in
New Zealand. Australian & New Zealand Journal of Public Health, 20, 369-374.
Reeder, A.I., Chalmers, D.J., Marshall, S. W., & Langley, J.D. (1997). Psychosocial
and social predictors of motorcycle use by young adult males in New Zealand.
Social Science and Medicine, 45, 1357-1376.
Rhodes, R. & Plotnikoff, R. (2006). Understanding action control: Predicting
physical activity intention-behaviour profiles across six-months in a Canadian
sample. Health Psychology, 25(3), 292-299.
RoSPA (2009). Driver Profiler 2. Retrieved from
http://www.rospa.com/drivertraining/ managementinfo/driverprofiler.htm
Rowden, P., Mazurski, E., Withaneachi, D., & Stevens, M. (2011). Roadside drug
testing in New South Wales. In proceedings of the Australasian Road Safety
Research, Policing, & Education Conference. Perth.
Rowden, P., & Watson, B. (2008). Motorcycle rider training and perceptions of skill.
In proceedings of the Australasian Road Safety Research, Policing, and
Education Conference. Adelaide.
245
Rowden, P., Matthews, G., Watson, B., & Biggs, H. (2011). The relative impact of
work-related stress, life stress, and driving environment stress on driving
outcomes. Accident Analysis and Prevention, 43(4), 1332-1340.
RTA (2004). Motorcycle Safety. Issues and countermeasures. Publication no.
04.092. Sydney, Australia: NSW Roads and Traffic Authority.
RTA (2008). Road Traffic Crashes in New South Wales. Statistical Statement for the
Year Ended 31 Dec 2006. Sydney, Australia: NSW Roads and Traffic Authority.
Rutter, D. R., & Quine, L. (1996). Age and experience in motorcycle safety. Accident
Analysis and Prevention, 28(1), 15-21.
Savolainen, P., & Mannering, F. (2007). Effectiveness of motorcycle training and
motorcyclists' risk-taking behavior. Journal of the Transportation Research
Board, 2031, 52-58.
Senserrick, T. M., & Swinburne, G. C. (2001). Evaluation of an insight driver-
training program for young drivers. Report #186. Melbourne: Monash University
Accident Research Centre.
Sexton, B., Baughan, C., Elliot, M., & Maycock, G. (2004). The accident risk of
motorcyclists (TRL 607). Crowthorne: Transport Research Laboratory.
Sexton, B., Hamilton, K., Baughan, C., Stradling, S., & Broughton, P. (2006). Risk
and Motorcyclists in Scotland. Edinburgh: Scottish Executive Research Unit
Shankar, U., & Varghese, C. (2006). Recent trends in fatal motorcycle crashes: An
update. DOT Report HS 810 606. Washington; National Highway Traffic Safety
Administration.
Simpson, H.M., & Mayhew, D.R. (1990). The promotion of motorcycle safety:
Training, education, and awareness. Health Education Research, 5 (2), 257-264.
Smith, P., & Blake, D. (2005). Facilitating learning through effective teaching.
Adelaide, SA: National Centre for Vocational Education Research.
Spencer, L., Pagell, F., & Adams, T. (2005). Applying the Transtheoretical Model to
cancer screening behaviour. American Journal of Health Behaviour, 29(1), 36-
56.
Stella, J., Cooke, C., & Spivulis, P. (2002). Most head injury related motorcycle
crash deaths are related to poor riding practices. Emergency Medicine, 14, 58-61.
Stradling, S. G., & Parker, D. (1997). Extending the theory of planned behaviour:
The role of personal norm, instrumental beliefs and affective beliefs in predicting
246
driving violations. In T. Rothengatter & E. C. Vaya (Eds.) Traffic and transport
psychology: Theory and application. Oxford, U.K.; Pergamon.
Sudlow, D. (2003). Scoping study on motorcycle training. Road safety research
report No. 36. London: British Department of Transport.
Sűmer, N., Ozkan, T., & Lajunen, T. (2006). Asymmetric relationship between
driving and safety skills. Accident Analysis and Prevention, 38, 703-711.
Summala, H. (2005). Traffic psychology theories: Towards understanding driving
behaviour and safety efforts. In G. Underwood (Ed.) Traffic and transport
psychology: Theory and application. Proceedings of the ICTTP 2004. Oxford,
U.K.; Elsevier.
Swaddiwudhipong, W., Boonmak, C., Nguntra, P., & Mahasakpan, P. (1998). Effect
of motorcycle rider education on changes in risk behaviours and motorcycle-
related injuries in rural Thailand. Tropical Medicine and International Health,
3(10), 767-770.
Symmons, M., Mulvihill, C., & Haworth, N. (2007). Motorcycle crash involvement
as a function of self-assessed riding style and rider attitudes. In proceedings of
the Australasian Road Safety Research, Policing, and Education Conference.
Melbourne.
Transport Accident Commission (2009). Ride Smart CD-ROM. Retrieved from
http://www.spokes.com.au/#/rider-safety/ride-smart-cd-rom
Tunnicliff, D. (2005). Psychosocial factors contributing to motorcyclists’ intended
riding style: An application of an extended version of the theory of planned
behaviour. Unpublished Masters thesis. Brisbane: Queensland University of
Technology.
Wahlberg, A. E. (2003). Some methodological deficiencies in studies on traffic
accident predictors. Accident Analysis and Prevention, 35(4), 473-486.
Watson, B. (2003). Research priorities in driver training: Bridging the gap between
research and practice. In the proceedings of the Road Safety Research, Policing,
and Education Conference - Sydney.
Watson B. (2004). The crash risk of disqualified/suspended and other unlicensed
drivers. Oliver, Williams & Clayton (Eds), Proceedings of the 17th International
Conference on Alcohol, Drugs and Traffic Safety (T2004), Glasgow:
International Council on Alcohol, Drugs and Traffic Safety (ICADTS).
Watson, B., Steinhardt, D. (2006). A comparison of the crash involvement of
unlicensed motorcycle riders and unlicensed drivers in Queensland. Proceedings
of the 2006 Australasian Road Safety, Research Policing & Education
Conference. Brisbane: Queensland Transport.
247
Watson, B., Fresta, J., Whan, H., McDonald, J., Dray, R., Beuermann, C., &
Churchward, R. (1996). Enhancing driver management in Queensland. Brisbane:
Queensland Transport.
Watson, B., Tay, R., Schonfeld, C., Wishart, D., Tunnicliff, D., Lang, C. &
Edmonston, C. (2003). Short-term process and outcome evaluation of Q-RIDE.
Report to Queensland Transport. Brisbane: Centre for Accident Research and
Road Safety -Queensland.
Watson, B., Tunnicliff, D., White, K., Schonfeld, C., & Wishart, D. (2007).
Psychosocial and social factors influencing motorcycle rider intentions and
behaviour. ATSB research and analysis report. Canberra: Australian Transport
Safety Bureau.
Waylen, A. E., Horswill, M. A., Alexander, J. L., & McKenna, F. P. (2004). Do
expert drivers have a reduced illusion of superiority? Transportation Research
Part F, 7, 323-331.
West, R. (2005). The Transtheoretical Model of behaviour change and the scientific
method. Addiction, 101, 768-778.
Wishart, D., Tunnicliff, D., Watson, B., & Schonfeld, C. (2005). Motorcycle safety
apparel observation study: Westridge Outlook Mt Nebo Road. Unpublished
report. Brisbane: Centre for Accident Research and Road Safety – Queensland.
Wundersitz, L. N., & Hutchinson, T. P. (2006). South Australia’s driver intervention
program: Participant characteristics, best practice discussion and literature
review. CASR021. Adelaide: Centre for Automotive Safety Research.

248

249
Appendices
1.1 Three Steps to Safer Riding lesson plan
3.1 Summary of Q-Ride licensing system
3.2 Study 1 focus group questions
4.1 Start of Training Existing Rider Questionnaire
4.2 Motorcycle Rider Training Questionnaire (for follow-up data)
5.1 Additional questions included in the End of Training
questionnaire for the pilot intervention group
5.2 Toolkit booklet
5.3 Process evaluation focus group and interview questions for
intervention graduates
5.4 Process evaluation riding instructor interview questions
250
Appendix 1.1 – Three Steps to Safer Riding lesson plan
3 Steps to Safer Riding
THIS APPENDIX WAS
SUPPLIED TO THE
THESIS EXAMINERS
ONLY
THIS APPENDIX WAS SUPPLIED TO THE THESIS
EXAMINERS ONLY. DUE TO INTELLECTUAL PROPERTY
PROTECTION THE APPENDIX IS NOT INCLUDED IN THIS
VERSION FOR PUBLIC RELEASE. PLEASE CONTACT
THE AUTHOR FOR FURTHER DETAILS.

251
Appendix 3.1 - Summary of Q-Ride licensing system
Q-Ride is a voluntary, competency-based motorcycle training and licensing option
within Queensland where training is delivered by registered service providers who
are private commercial organisations throughout the State. There is no set curriculum
for Q-Ride; however there are set assessment competencies. Each service provider
submits their training program for accreditation by Queensland Transport and Main
Roads who are the regulator of the system. Under the system, training is delivered to
holders of Learner licences. As it is a competency-based assessment regime, there is
no set maximum training duration and the number of hours completed will vary
between individuals until they are deemed ‘competent’. There is however a
minimum of six hours training required. Course participants cannot fail within the
competency-based regime; they are merely declared ‘not yet competent’.
Q-Ride assesses both restricted (RE) and open class (R) motorcycle licences.
Assessment is initially conducted off-road for vehicle handling skills, then on-road
for roadcraft. Note, no pre-learner motorcycle training requirement currently exists
in Queensland.
http://www.tmr.qld.gov.au/Licensing/Getting-a-licence/Motorbike-licence/Q-
Ride.aspx
Relevant changes
Since 1 July 2007, applicants for learner motorcycle licence must hold a provisional
or open car licence for at least 12 months. This made the de facto motorcycle learner
minimum age 18 years from this date. Prior to this date the minimum age was 16.5
years. Also, prior to 1 July 2007 a person could obtain a motorcycle licence (RE
class) and not have held a C class (car) licence. However, after that date it became
necessary to hold the C class licence for a period of 12 months before obtaining an
RE learner licence (as stated above).
Before 1 July 2008 a person who had held a C class (car) licence for a period of three
years (within the last five) could in fact progress directly to an R class motorcycle
licence through the Q-Ride program. However, after 1 July 2008 any person who
obtained an RE class motorcycle licence has been required to hold an RE class
licence for a period of 12 months prior to progressing to an R class licence.

252
Appendix 3.2 - Study 1 focus group questions
Student Motivations
1. Why do you ride?
a. Prompt – Do you ride for enjoyment, fun with mates, for the thrill, or
purely practical reasons (like easier in traffic, better on fuel).
2. What did you hope to get from the course when you commenced?
a. Prompt - Did you just want to get your licence or did you want to
learn all the safety stuff?
3. At the start of the course what sort of things did you think you would be
assessed on?
Students’ perceptions of their learning experience.
4. What was covered in the practical and classroom sessions of the course?
5. How do you think your past experiences affected how you learned during the
course? For example, you had past riding experience or other courses you’d
done.
a. Prompt – What about watching or being pillion with family/friends?
6. Look at the sheet I’ve given you and consider how you learn best. What
things did the trainer do to help you understand and learn in the classroom
and practical sessions?
a. Prompt – e.g. did he tell stories that helped explain it for you? Was
there open discussion, did he question you, give feedback, or get you
to demonstrate how it was done?
7. What things have happened on the road since you’ve been licensed that make
you think of important things you learned in the classroom and practical
sessions of your training?
a. Consider what happens now compared to when you first started riding
after you got your licence?
8. What else can you think of that wasn’t in the course that you think you
needed to know now that you’ve been riding a while?
9. How was your attitude/belief towards safety challenged or changed during
training (or from being out on the road since then)?

253
Appendix 4.1 - Start of Training Existing Rider Questionnaire
RIDER TRAINING
QUESTIONNAIRE
EXISTING RIDERS
START OF TRAINING

254
Motorcycle Rider Questionnaire
What is this project about?
The QUT Centre for Accident Research and Road Safety – Queensland (CARRS-Q) is undertaking research into the factors which influence the safety of motorcyclists. We are interested in finding out what affects rider behaviour in both safe and unsafe ways.
This questionnaire has been developed by motorcyclists, for motorcyclists. We have talked to lots of people about safe and unsafe behaviours and have used these discussions to develop this survey.
What will my answers be used for?
This research will be used to assist in the design of motorcycle safety programs, particularly in the area of rider training. Our goal is to reduce the involvement of motorcyclists in road crashes.
This is an anonymous questionnaire so we do not want to know your name or any contact details.
What are we asking you to do?
We are asking you to complete the Rider Training Questionnaire, and that you answer all questions honestly. There are no ‘right’ or ‘wrong’ answers as we understand that every motorcyclist has different riding abilities, experience, and opinions.
Please try to answer all the questions, however if there is a question you don’t understand, or feel uncomfortable about, just leave it and move onto the next question.
Your participation in this survey is voluntary. If you start to fill out the questionnaire but then decide you do not wish to continue, you can stop at any time. We assume that by completing the questionnaire you have freely consented to do so.
Where can I find out more?
If you have any questions about this research, you can contact Peter Rowden (email [email protected] or telephone 3138 4545) or Barry Watson (3138 4955).
If you have any concerns about the ethical conduct of this research, please contact the University Research Ethics Officer on 3138-2340 or [email protected]
Thank you for your time in completing this questionnaire.
Please tear off this page to keep for your future reference.
255
INSTRUCTIONS
For each of the questions please select the answer which best reflects your views and/or experiences.
Some of the questions may seem to be very similar, but they are different and we would like you to answer all of them if possible
To ensure your confidentiality and anonymity all questionnaires are returned directly to researchers at QUT. Please do not put your name on the questionnaire. Please note that the answers you give in this questionnaire will not affect your chance of getting a licence. Please answer all questions honestly and truthfully.

256
Q1 How important is it for you to learn
about each of the following during
your training?
Ability to control the bike ..................................................
Recognising hazards ...........................................................
Being a safe rider ...............................................................
Dealing with emergency situations ....................................
Ability to ride in a range of conditions (e.g.
gravel, rain) .................................................................
Not at all Very
important important
1 2 3 4 5 6 7
1 2 3 4 5 6 7
1 2 3 4 5 6 7
1 2 3 4 5 6 7
1 2 3 4 5 6 7
Q2 How important to you are each of
the following reasons for riding a
bike?
Feeling of freedom / no pressures ......................................
Enjoyment/fun ....................................................................
Social reasons (mates, meet new people) ...........................
Image ..................................................................................
To impress others ...............................................................
Practical reasons (easy to find parking,
cheaper to run) ............................................................
Not at all Very
important important
1 2 3 4 5 6 7
1 2 3 4 5 6 7
1 2 3 4 5 6 7
1 2 3 4 5 6 7
1 2 3 4 5 6 7
1 2 3 4 5 6 7
Q3 Please tick one of the following statements that best describes you.
I think there’s no point trying to ride safely because I can still get hurt anyway
I think there are things I should probably do to improve my safety when riding a motorcycle
I’m ready to start riding as safely as possible in the near future
I don’t do risky things on a motorcycle because I know how dangerous it is
I’ve been riding as safely as possible for a long time (6 months or more)

257
The following questions are about how you feel when driving a car and when riding a
motorcycle. Please circle one number in each row for driving (black section) then
riding (grey section).
Q4 Please indicate how much you
agree or disagree with the
following statements
(Please circle a number from
1 to 7 to show your answers)
DRIVING RIDING
I would enjoy driving/riding on a
road with no speed limit 1 2 3 4 5 6 7 1 2 3 4 5 6 7
I enjoy the sensation of accelerating
rapidly 1 2 3 4 5 6 7 1 2 3 4 5 6 7
I enjoy taking risks in my car/on my
bike 1 2 3 4 5 6 7 1 2 3 4 5 6 7
I get a real thrill out of driving/riding
fast 1 2 3 4 5 6 7 1 2 3 4 5 6 7
I enjoy cornering as fast as I can 1 2 3 4 5 6 7 1 2 3 4 5 6 7
I would like to be a professional a
racing driver/rider 1 2 3 4 5 6 7 1 2 3 4 5 6 7
I like to raise my adrenaline levels
while driving/riding 1 2 3 4 5 6 7 1 2 3 4 5 6 7
I sometimes like to frighten myself a
little while driving/riding 1 2 3 4 5 6 7 1 2 3 4 5 6 7
Strongly
Agree
Strongly
Agree
Strongly
Disagree
Strongly
Disagree

258
Q5 How often have you done each
of the following over the past
12 months?
(Please circle a number from 1
to 7 to show your answers)
DRIVING
RIDING
Felt frustrated by other road users 1 2 3 4 5 6 7 1 2 3 4 5 6 7
Felt angry and aggressive towards
another road user 1 2 3 4 5 6 7 1 2 3 4 5 6 7
Indicated your hostility towards
another road user by whatever means
you could
1 2 3 4 5 6 7 1 2 3 4 5 6 7
Gave chase when angered by another
road user 1 2 3 4 5 6 7 1 2 3 4 5 6 7
Physically attacked another vehicle or
driver when angered 1 2 3 4 5 6 7 1 2 3 4 5 6 7
Ridden/driven especially close to the
car in front as a signal to its driver to
go faster or get out of the way
1 2 3 4 5 6 7 1 2 3 4 5 6 7
Overtaken illegally when a slower
vehicle was holding me up 1 2 3 4 5 6 7 1 2 3 4 5 6 7
Never Most of
the time Never Most of
the time

259
Q6 Please indicate how much you agree or disagree with each statement by circling an
answer?
Strongly
disagree
Strongly agree
It’s OK to exceed the speed limit if you are riding
safely
1 2 3 4 5 6 7
Wearing the right protective gear on every ride is
important
1 2 3 4 5 6 7
People who take drugs and ride should lose their
licence
1 2 3 4 5 6 7
It's OK to ride without a licence 1 2 3 4 5 6 7
Bending road rules to get through traffic is OK 1 2 3 4 5 6 7
It's OK to ride over the speed limit as long as you don’t
get caught
1 2 3 4 5 6 7
Motorcycle riding is risky compared with driving a car 1 2 3 4 5 6 7
It's OK to ride after drinking so long as you don't get
caught
1 2 3 4 5 6 7
Pushing my limits is important for me to become a
better rider
1 2 3 4 5 6 7
Motorcycle riders need to be more patient with other
road users
1 2 3 4 5 6 7
The chances of having an accident are increased
when a rider is tired or drowsy
1 2 3 4 5 6 7
Speed limits are generally set at reasonable levels 1 2 3 4 5 6 7
It's okay to ride after taking drugs so long as
you're not stoned/high
1 2 3 4 5 6 7
Performing stunts is a good way to prove your skill on
a motorcycle
1 2 3 4 5 6 7
It’s OK to ride between lanes of stationary traffic 1 2 3 4 5 6 7
Riding at extreme speeds is stupid 1 2 3 4 5 6 7
People who ride after drinking should lose their licence 1 2 3 4 5 6 7
There’s nothing wrong with being quick off the mark at
traffic lights
1 2 3 4 5 6 7
It takes a long time to become a skilled motorcyclist 1 2 3 4 5 6 7
If it was legal, I’d prefer to ride without a helmet 1 2 3 4 5 6 7
Avoiding risks on a motorcycle is largely a matter of
self-control
1 2 3 4 5 6 7
I’m the only one responsible for the way I ride 1 2 3 4 5 6 7

260
The questions on this page are about your riding over the next 12 months. Please
circle one number in each row to show how much you agree or disagree with each of
the following statements.
Q7 My family and friends would never want me to
do the following
Strongly Strongly
Disagree Agree
Ride if I have any alcohol in my system 1 2 3 4 5 6 7
Exceed the posted speed limit 1 2 3 4 5 6 7
Push myself and/or the bike to the point where handling
becomes unpredictable 1 2 3 4 5 6 7
Ride recklessly or do dangerous stunts to test my abilities 1 2 3 4 5 6 7
Q8 The people I ride with would never want me to do
the following
Strongly Strongly
Disagree Agree
Ride if I have any alcohol in my system 1 2 3 4 5 6 7
Exceed the posted speed limit 1 2 3 4 5 6 7
Push myself and/or the bike to the point where handling becomes
unpredictable 1 2 3 4 5 6 7
Ride recklessly or do dangerous stunts to test my abilities 1 2 3 4 5 6 7
Q9 It is likely that I will do the following in the next 12
months
Strongly Strongly
Disagree Agree
Ride up the inside shoulder of the road to get around traffic 1 2 3 4 5 6 7
Try to do a wheelie or stoppie 1 2 3 4 5 6 7
Ride when tired 1 2 3 4 5 6 7
Allow my emotions to influence the way I ride 1 2 3 4 5 6 7
Ride through a red light when there is no traffic coming 1 2 3 4 5 6 7
Try to break my own speed record 1 2 3 4 5 6 7
Race other riders 1 2 3 4 5 6 7
Ride at 50kph over the speed limit 1 2 3 4 5 6 7

261
This section just tells us a little bit about your background and riding experience.
Please tick the boxes that best describe you:
Q10. Gender
Male
Female
Q11. Age
____ yrs
Q12. Marital status (tick one)
Single
Married / de facto
Separated, divorced,
widowed
Q13. Education Level
(please tick highest level
reached)
Did not complete Year 10
Completed Year 10
Completed Year 12
Completed tertiary
education (e.g. Tafe or
university)
Q14. Motorcycle licence (tick
one)
I am doing this course to get
my RE Licence (maximum
250cc)
I am doing this course to get
my R Licence (open
motorcycle)
Q15. Car licence (tick one)
I have a learner licence
I have a provisional licence
I have an open licence
I don’t have a car licence
Q16. How many years have
you had a car licence?
______ years
(If less than 1 year please say
how many months)
______ months
Q17. Lifetime motorcycle riding experience
How many years have you ridden on road? (Please
don’t count long breaks)
__________ years
How many years have you ridden off road? (Please
don’t count long breaks)
__________ years
Q18. Please estimate how far you’ve ridden
a motorcycle on-road in the last year.
Less than 1000 kms
Between 1000 & 4999 kms
Between 5000 & 9999 kms
10000 kms or more
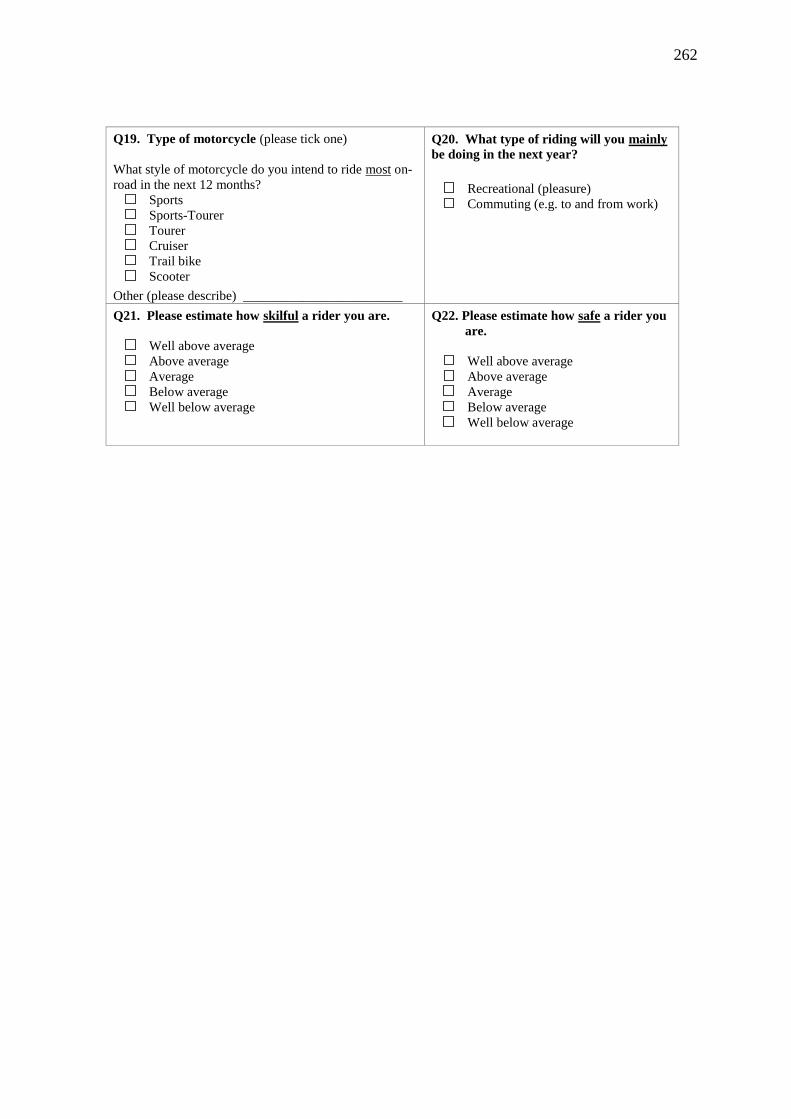
262
Q19. Type of motorcycle (please tick one)
What style of motorcycle do you intend to ride most on-
road in the next 12 months?
Sports
Sports-Tourer
Tourer
Cruiser
Trail bike
Scooter
Other (please describe) ________________________
Q20. What type of riding will you mainly
be doing in the next year?
Recreational (pleasure)
Commuting (e.g. to and from work)
Q21. Please estimate how skilful a rider you are.
Well above average
Above average
Average
Below average
Well below average
Q22. Please estimate how safe a rider you
are.
Well above average
Above average
Average
Below average
Well below average

263
Q23. How many times have you been booked for the following traffic offences (any
vehicle) in the last 3 years?
Speeding _______
Drink driving _______
Driving without a licence _______
Failing to stop at a red light or stop sign _______
Other (please specify) _______
A minor crash is an incident where no one needed medical attention (treated by a doctor or nurse), but
there was serious damage to your vehicle or another vehicle.
Q24. How many MINOR crashes have you had in the last 3 years whilst riding or driving on-
road?
Involving your vehicle only Whilst riding a motorcycle ______
Whilst driving a car ______
Whilst driving another vehicle ______
Involving two or more vehicles
Whilst riding a motorcycle ______
Whilst driving a car ______
Whilst driving another vehicle ______
An injury crash is an incident which resulted in an injury to you or someone else that needed medical
attention (treated by a doctor or nurse).
Q25. How many INJURY crashes have you had in the last 3 years whilst riding or driving on-
road?
Involving your vehicle only Whilst riding a motorcycle ______
Whilst driving a car ______
Whilst driving another vehicle ______
Involving two or more vehicles
Whilst riding a motorcycle ______
Whilst driving a car ______
Whilst driving another vehicle ______
Please help us out by providing the following details. Remember that this is completely
confidential.
Full Name:………………………………………………
Date of Birth: ……/……/………..
Licence Number: ………………………
Thank you for helping us out. The information you provided will help
improve safety for all motorcyclists that undertake training.
Please place your questionnaire in the envelope provided, seal the envelope, and put it in the
box.
264
Appendix 4.2 - Motorcycle Rider Training Questionnaire
MOTORCYCLE
RIDER TRAINING
QUESTIONNAIRE
265
Motorcycle Training Questionnaire Information Sheet
What is this project about?
In conjunction with Morgan & Wacker Motorcycle Training Centre, the QUT Centre for Accident Research and Road Safety – Queensland (CARRS-Q) is undertaking research into the safety of motorcyclists who do training.
This questionnaire has been developed based on what other riders have said. We have talked to lots of people about safe and unsafe behaviours and have used these discussions to develop this questionnaire. It is similar to the questionnaires that you completed during training. It’s important for us to gather similar information from you again now so that we can see how things might have changed since you have completed your training.
What will my answers be used for?
This research will be used to find out how the safety of motorcyclists can be improved through training. We will combine the information from everyone to get a good idea of how effective the program has been at reducing the risk for motorcyclists. Our goal is to reduce the involvement of motorcyclists in road crashes.
What are we asking you to do?
We are asking you to complete the Rider Training Questionnaire, and that you answer all questions honestly. There are no ‘right’ or ‘wrong’ answers as we understand that every motorcyclist has different riding abilities, experience, and opinions. Please try to answer all the questions, however if there is a question you don’t understand, or feel uncomfortable about, just leave it and move onto the next question. Your participation in this survey is voluntary and you can stop at any time. All information you provide is confidential. Your answers will be combined with those from other riders so your name will not appear anywhere and your information cannot be accessed by anyone except the research team.
Taking part in this project will not add any risk to you beyond your normal day-to-day risks.
Where can I find out more?
If you have any questions about this research, you can contact Peter Rowden (email [email protected] or telephone 3138 4545) or the project Chief Investigator Barry Watson (3138 4955).
If you have any concerns about the ethical conduct of this research, please contact the University Research Ethics Officer on 3138 2340 or [email protected]

266
INSTRUCTIONS
For each of the questions please select the answer which best reflects your views and/or experiences about on-road riding and driving. Some of the questions may seem to be very similar, but they are different and we would like you to answer all of them if possible. Many of the questions focus on your riding experiences since your training. To ensure your confidentiality, please put your completed questionnaire in the envelope provided when finished so that it can be returned directly to researchers at QUT. The researchers will be the only ones that look at it.
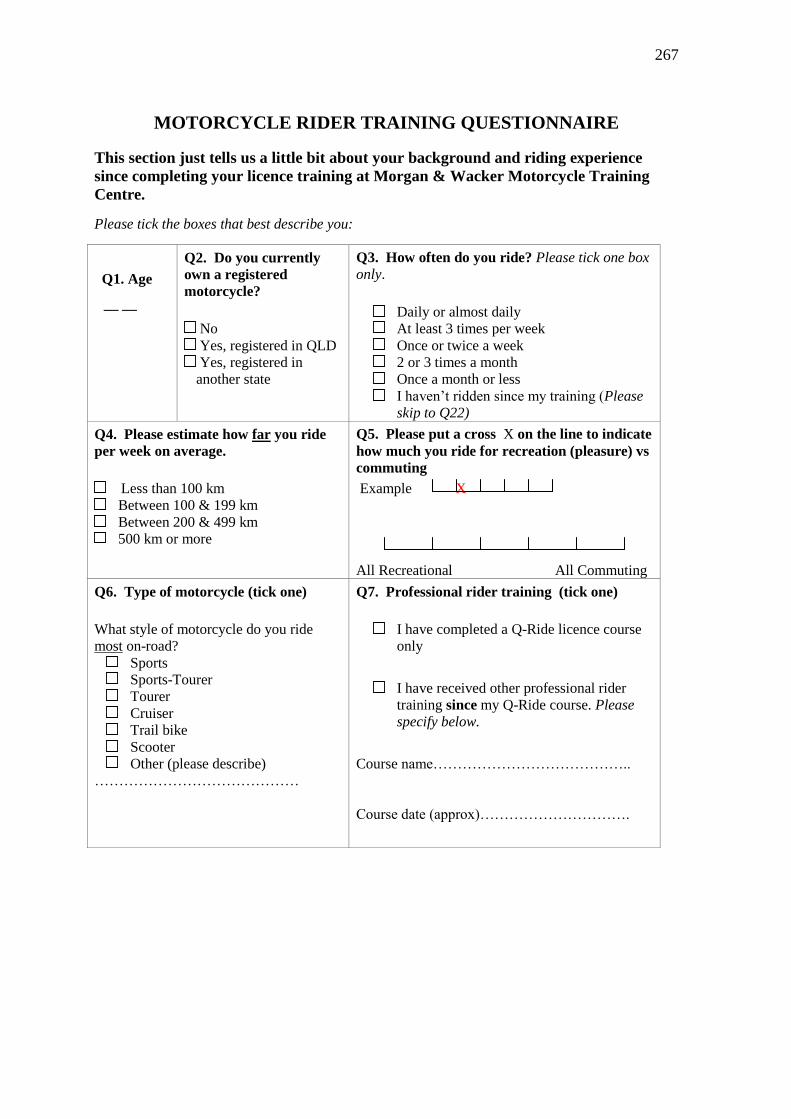
267
MOTORCYCLE RIDER TRAINING QUESTIONNAIRE
This section just tells us a little bit about your background and riding experience
since completing your licence training at Morgan & Wacker Motorcycle Training
Centre.
Please tick the boxes that best describe you:
Q1. Age
__ __
Q2. Do you currently
own a registered
motorcycle?
No
Yes, registered in QLD
Yes, registered in
another state
Q3. How often do you ride? Please tick one box
only.
Daily or almost daily
At least 3 times per week
Once or twice a week
2 or 3 times a month
Once a month or less
I haven’t ridden since my training (Please
skip to Q22)
Q4. Please estimate how far you ride
per week on average.
Less than 100 km
Between 100 & 199 km
Between 200 & 499 km
500 km or more
Q5. Please put a cross X on the line to indicate
how much you ride for recreation (pleasure) vs
commuting
Example X
All Recreational All Commuting
Q6. Type of motorcycle (tick one)
What style of motorcycle do you ride
most on-road?
Sports
Sports-Tourer
Tourer
Cruiser
Trail bike
Scooter
Other (please describe)
……………………………………
Q7. Professional rider training (tick one)
I have completed a Q-Ride licence course
only
I have received other professional rider
training since my Q-Ride course. Please
specify below.
Course name…………………………………..
Course date (approx)………………………….
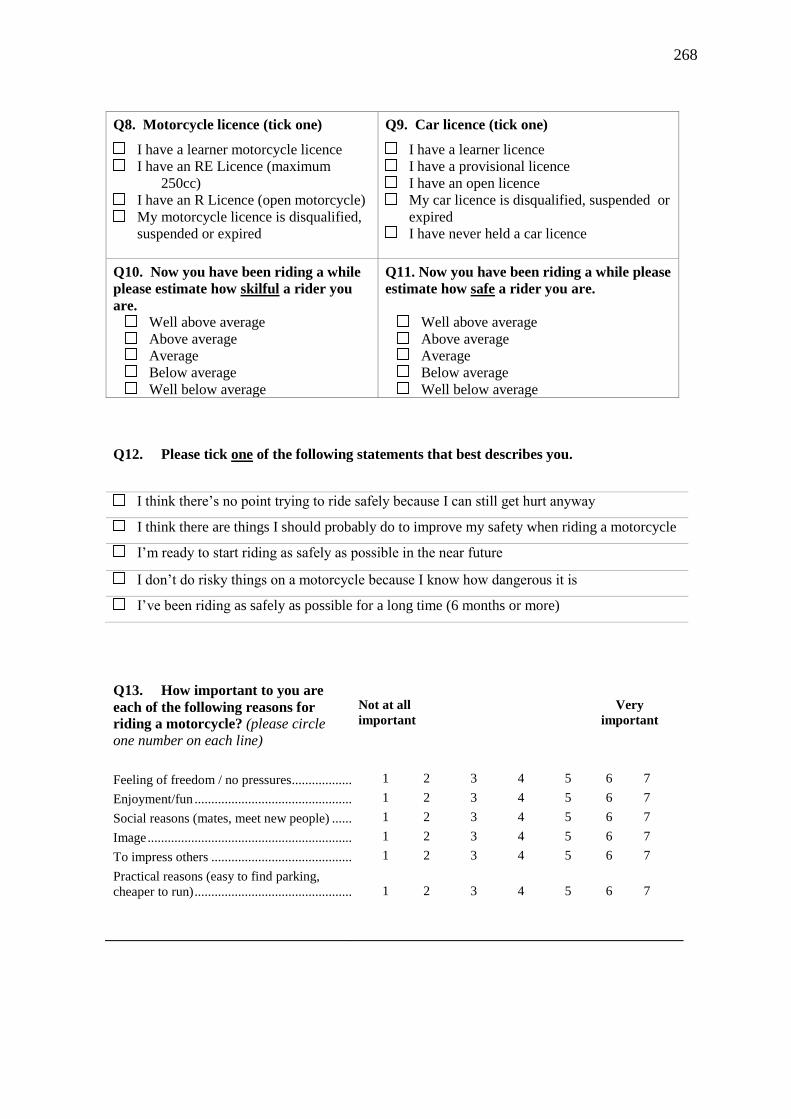
268
Q8. Motorcycle licence (tick one)
I have a learner motorcycle licence
I have an RE Licence (maximum
250cc)
I have an R Licence (open motorcycle)
My motorcycle licence is disqualified,
suspended or expired
Q9. Car licence (tick one)
I have a learner licence
I have a provisional licence
I have an open licence
My car licence is disqualified, suspended or
expired
I have never held a car licence
Q10. Now you have been riding a while
please estimate how skilful a rider you
are.
Well above average
Above average
Average
Below average
Well below average
Q11. Now you have been riding a while please
estimate how safe a rider you are.
Well above average
Above average
Average
Below average
Well below average
Q12. Please tick one of the following statements that best describes you.
I think there’s no point trying to ride safely because I can still get hurt anyway
I think there are things I should probably do to improve my safety when riding a motorcycle
I’m ready to start riding as safely as possible in the near future
I don’t do risky things on a motorcycle because I know how dangerous it is
I’ve been riding as safely as possible for a long time (6 months or more)
Q13. How important to you are
each of the following reasons for
riding a motorcycle? (please circle
one number on each line)
Feeling of freedom / no pressures................................................
Enjoyment/fun .............................................................................
Social reasons (mates, meet new people) ....................................
Image ...........................................................................................
To impress others ........................................................................
Practical reasons (easy to find parking,
cheaper to run) .............................................................................
Not at all Very
important important
1 2 3 4 5 6 7
1 2 3 4 5 6 7
1 2 3 4 5 6 7
1 2 3 4 5 6 7
1 2 3 4 5 6 7
1 2 3 4 5 6 7
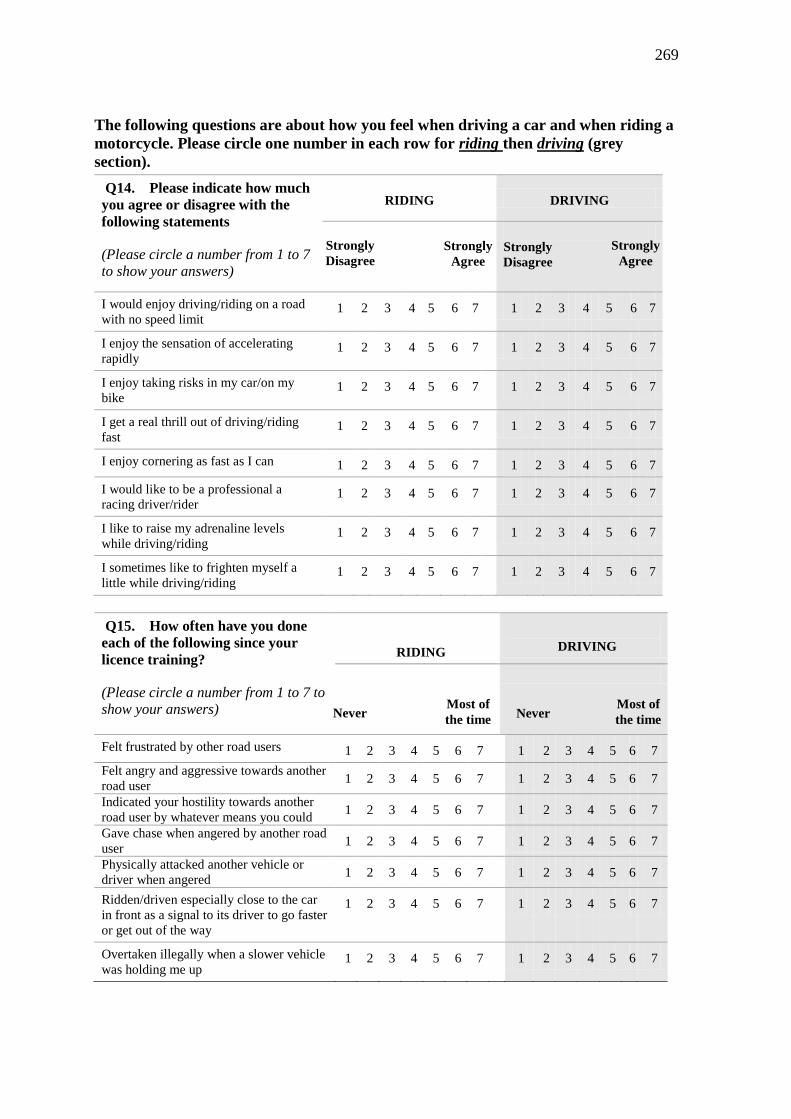
269
The following questions are about how you feel when driving a car and when riding a
motorcycle. Please circle one number in each row for riding then driving (grey
section).
Q14. Please indicate how much
you agree or disagree with the
following statements
(Please circle a number from 1 to 7
to show your answers)
RIDING DRIVING
I would enjoy driving/riding on a road
with no speed limit 1 2 3 4 5 6 7 1 2 3 4 5 6 7
I enjoy the sensation of accelerating
rapidly 1 2 3 4 5 6 7 1 2 3 4 5 6 7
I enjoy taking risks in my car/on my
bike 1 2 3 4 5 6 7 1 2 3 4 5 6 7
I get a real thrill out of driving/riding
fast 1 2 3 4 5 6 7 1 2 3 4 5 6 7
I enjoy cornering as fast as I can 1 2 3 4 5 6 7 1 2 3 4 5 6 7
I would like to be a professional a
racing driver/rider 1 2 3 4 5 6 7 1 2 3 4 5 6 7
I like to raise my adrenaline levels
while driving/riding 1 2 3 4 5 6 7 1 2 3 4 5 6 7
I sometimes like to frighten myself a
little while driving/riding 1 2 3 4 5 6 7 1 2 3 4 5 6 7
Q15. How often have you done
each of the following since your
licence training?
(Please circle a number from 1 to 7 to
show your answers)
RIDING
DRIVING
Felt frustrated by other road users 1 2 3 4 5 6 7 1 2 3 4 5 6 7
Felt angry and aggressive towards another
road user 1 2 3 4 5 6 7 1 2 3 4 5 6 7
Indicated your hostility towards another
road user by whatever means you could 1 2 3 4 5 6 7 1 2 3 4 5 6 7
Gave chase when angered by another road
user 1 2 3 4 5 6 7 1 2 3 4 5 6 7
Physically attacked another vehicle or
driver when angered 1 2 3 4 5 6 7 1 2 3 4 5 6 7
Ridden/driven especially close to the car
in front as a signal to its driver to go faster
or get out of the way
1 2 3 4 5 6 7 1 2 3 4 5 6 7
Overtaken illegally when a slower vehicle
was holding me up 1 2 3 4 5 6 7 1 2 3 4 5 6 7
Strongly
Agree
Strongly
Agree Strongly
Disagree
Strongly
Disagree
Never Most of
the time Never
Most of
the time

270
Q16. Please indicate how much you agree or disagree with each statement by circling an
answer?
Strongly
disagree
Strongly agree
It’s OK to exceed the speed limit if you are riding
safely
1 2 3 4 5 6 7
It's OK to ride without a licence 1 2 3 4 5 6 7
Bending road rules to get through traffic is OK 1 2 3 4 5 6 7
It's OK to ride over the speed limit as long as you don’t
get caught
1 2 3 4 5 6 7
It's OK to ride after drinking so long as you don't get
caught
1 2 3 4 5 6 7
Pushing my limits is important for me to become a
better rider
1 2 3 4 5 6 7
The chances of having an accident are increased
when a rider is tired or drowsy
1 2 3 4 5 6 7
It's okay to ride after taking drugs so long as
you're not stoned/high
1 2 3 4 5 6 7
Performing stunts is a good way to prove your skill on
a motorcycle
1 2 3 4 5 6 7
It’s OK to ride between lanes of stationary traffic 1 2 3 4 5 6 7
The following questions are about your riding since completing your licence training
course.
Q17. When you’ve been riding on-road since licensing
how often have you:
(Circle a number from 1 to 7 to show how often you have done these things)
Please circle one number in each
row
Never Always
Ridden up in between two lanes of fast moving traffic 1 2 3 4 5 6 7
Ridden between two lanes of stationary traffic 1 2 3 4 5 6 7
Gone up the inside shoulder to get through traffic 1 2 3 4 5 6 7
Frequently changed lanes to get ahead of traffic 1 2 3 4 5 6 7
Raced away from the traffic lights with the intention of getting ahead
of the traffic 1 2 3 4 5 6 7

271
Q17 (cont). When you’ve been riding on-road since licensing
how often have you:
(Circle a number from 1 to 7 to show how often you have done these things)
Please circle one number
in each row
Never Always
Exceeded the posted speed limit 1 2 3 4 5 6 7
Ridden 15kph or more over the speed limit in 50kph or 60kph
zones 1 2 3 4 5 6 7
Ridden over the speed limit in a 40kph school zone during school
hours 1 2 3 4 5 6 7
Ridden 25kph or more over the speed limit in zones that are
100kph or higher 1 2 3 4 5 6 7
Ridden too fast for the conditions 1 2 3 4 5 6 7
Bent some road rules in order to get ahead in traffic 1 2 3 4 5 6 7
Ridden when you were or might have been over the legal blood
alcohol limit 1 2 3 4 5 6 7
Ridden when you might have had any alcohol in your system 1 2 3 4 5 6 7
Ridden after using marijuana or any other illicit drug 1 2 3 4 5 6 7
Ridden when you were fatigued 1 2 3 4 5 6 7
Allowed your emotions / feelings to influence your riding in an
unsafe way 1 2 3 4 5 6 7
Ridden through a red light when there was no traffic coming 1 2 3 4 5 6 7
Pushed yourself and /or the bike until the handling became
unpredictable 1 2 3 4 5 6 7
Pushed your limits too far and ‘came off’ 1 2 3 4 5 6 7
Practiced taking corners the way that racers do 1 2 3 4 5 6 7
Raced strangers on motorcycles or other road users 1 2 3 4 5 6 7
Attempted to keep up with other riders or traffic travelling faster than
you 1 2 3 4 5 6 7
Attempted to do, or actually did, a wheelie or stoppie 1 2 3 4 5 6 7
Tried to break your own speed record 1 2 3 4 5 6 7
Rode recklessly or performed dangerous stunts to test your abilities 1 2 3 4 5 6 7
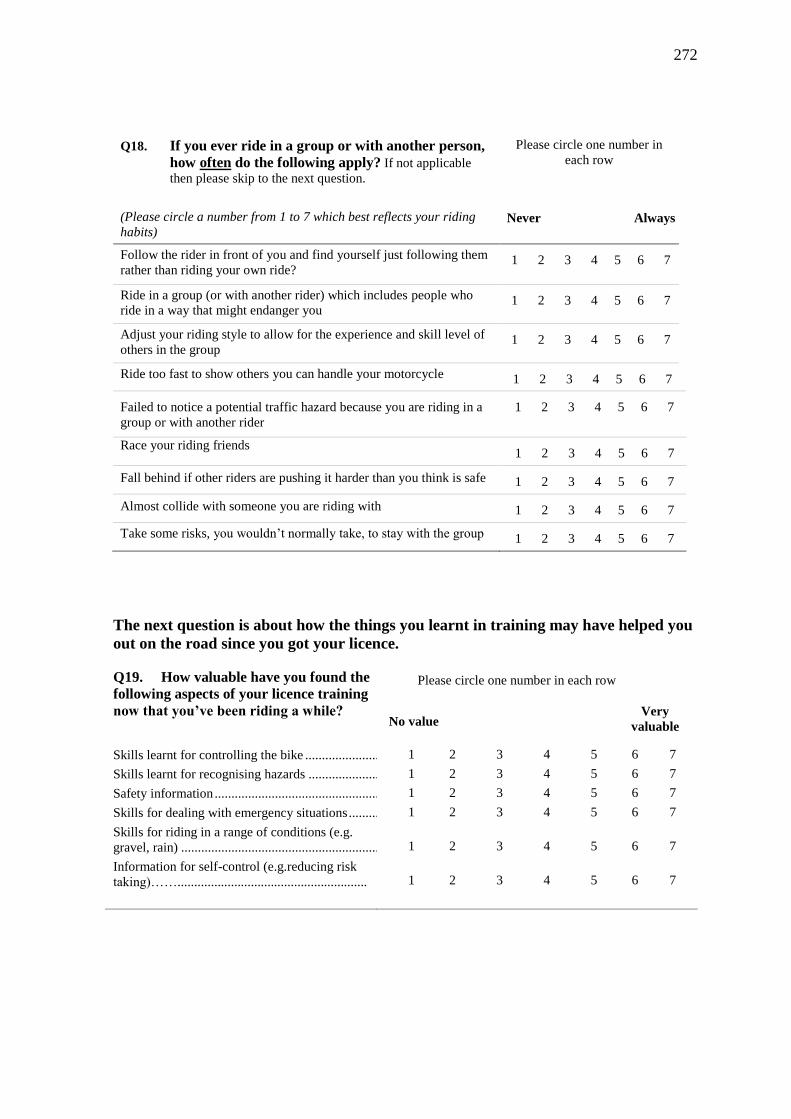
272
Q18. If you ever ride in a group or with another person,
how often do the following apply? If not applicable
then please skip to the next question.
(Please circle a number from 1 to 7 which best reflects your riding
habits)
Please circle one number in
each row
Never Always
Follow the rider in front of you and find yourself just following them
rather than riding your own ride? 1 2 3 4 5 6 7
Ride in a group (or with another rider) which includes people who
ride in a way that might endanger you 1 2 3 4 5 6 7
Adjust your riding style to allow for the experience and skill level of
others in the group 1 2 3 4 5 6 7
Ride too fast to show others you can handle your motorcycle 1 2 3 4 5 6 7
Failed to notice a potential traffic hazard because you are riding in a
group or with another rider
1 2 3 4 5 6 7
Race your riding friends 1 2 3 4 5 6 7
Fall behind if other riders are pushing it harder than you think is safe 1 2 3 4 5 6 7
Almost collide with someone you are riding with 1 2 3 4 5 6 7
Take some risks, you wouldn’t normally take, to stay with the group 1 2 3 4 5 6 7
The next question is about how the things you learnt in training may have helped you
out on the road since you got your licence.
Q19. How valuable have you found the
following aspects of your licence training
now that you’ve been riding a while?
Skills learnt for controlling the bike ............................................
Skills learnt for recognising hazards ...........................................
Safety information .......................................................................
Skills for dealing with emergency situations ...............................
Skills for riding in a range of conditions (e.g.
gravel, rain) .................................................................................
Information for self-control (e.g.reducing risk
taking)…….........................................................
Please circle one number in each row
1 2 3 4 5 6 7
1 2 3 4 5 6 7
1 2 3 4 5 6 7
1 2 3 4 5 6 7
1 2 3 4 5 6 7
1 2 3 4 5 6 7
No value Very
valuable
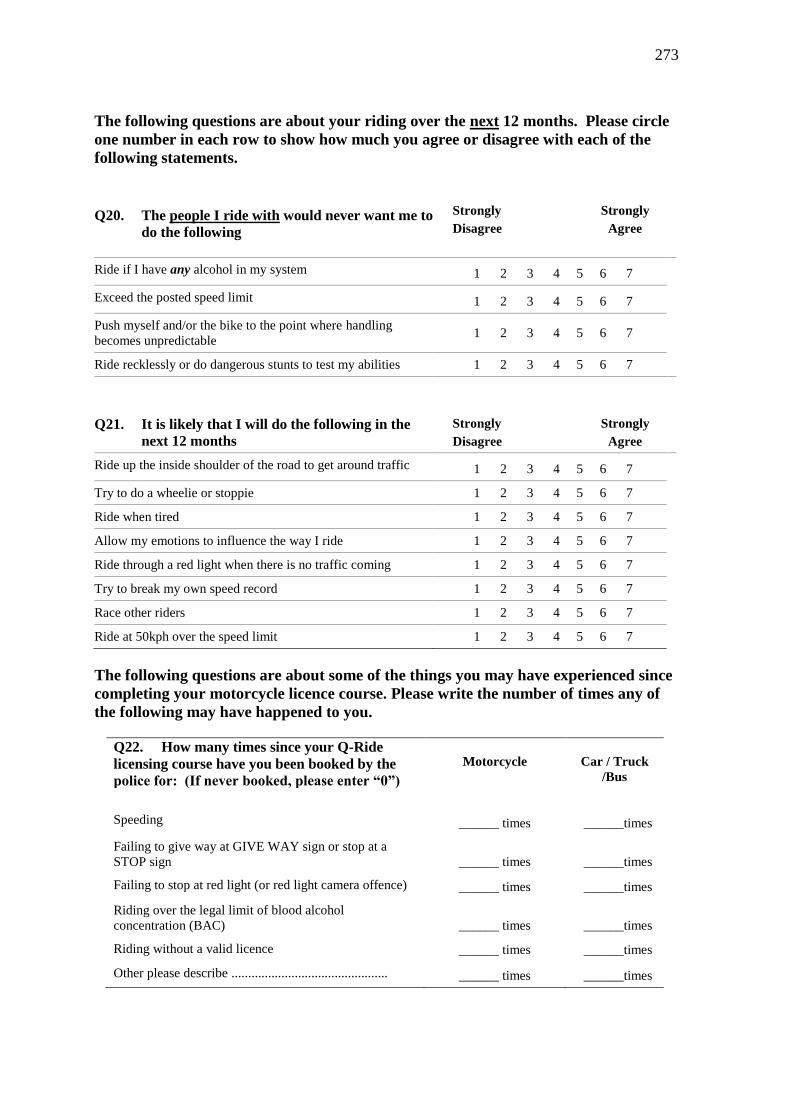
273
The following questions are about your riding over the next 12 months. Please circle
one number in each row to show how much you agree or disagree with each of the
following statements.
Q20. The people I ride with would never want me to
do the following
Strongly Strongly
Disagree Agree
Ride if I have any alcohol in my system 1 2 3 4 5 6 7
Exceed the posted speed limit 1 2 3 4 5 6 7
Push myself and/or the bike to the point where handling
becomes unpredictable 1 2 3 4 5 6 7
Ride recklessly or do dangerous stunts to test my abilities 1 2 3 4 5 6 7
Q21. It is likely that I will do the following in the
next 12 months
Strongly Strongly
Disagree Agree
Ride up the inside shoulder of the road to get around traffic 1 2 3 4 5 6 7
Try to do a wheelie or stoppie 1 2 3 4 5 6 7
Ride when tired 1 2 3 4 5 6 7
Allow my emotions to influence the way I ride 1 2 3 4 5 6 7
Ride through a red light when there is no traffic coming 1 2 3 4 5 6 7
Try to break my own speed record 1 2 3 4 5 6 7
Race other riders 1 2 3 4 5 6 7
Ride at 50kph over the speed limit 1 2 3 4 5 6 7
The following questions are about some of the things you may have experienced since
completing your motorcycle licence course. Please write the number of times any of
the following may have happened to you.
Q22. How many times since your Q-Ride
licensing course have you been booked by the
police for: (If never booked, please enter “0”)
Motorcycle
Car / Truck
/Bus
Speeding ______ times ______times
Failing to give way at GIVE WAY sign or stop at a
STOP sign ______ times ______times
Failing to stop at red light (or red light camera offence) ______ times ______times
Riding over the legal limit of blood alcohol
concentration (BAC) ______ times ______times
Riding without a valid licence ______ times ______times
Other please describe ............................................... ______ times ______times
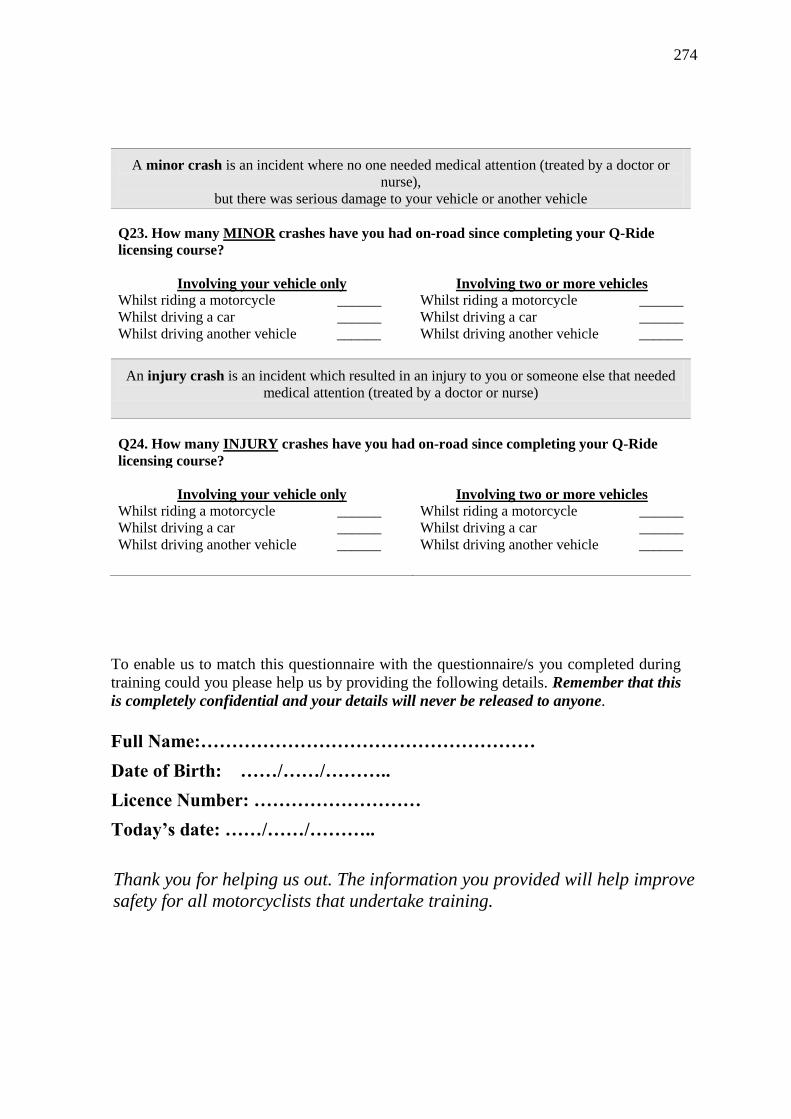
274
A minor crash is an incident where no one needed medical attention (treated by a doctor or
nurse),
but there was serious damage to your vehicle or another vehicle
Q23. How many MINOR crashes have you had on-road since completing your Q-Ride
licensing course?
Involving your vehicle only Whilst riding a motorcycle ______
Whilst driving a car ______
Whilst driving another vehicle ______
Involving two or more vehicles
Whilst riding a motorcycle ______
Whilst driving a car ______
Whilst driving another vehicle ______
An injury crash is an incident which resulted in an injury to you or someone else that needed
medical attention (treated by a doctor or nurse)
Q24. How many INJURY crashes have you had on-road since completing your Q-Ride
licensing course?
Involving your vehicle only Whilst riding a motorcycle ______
Whilst driving a car ______
Whilst driving another vehicle ______
Involving two or more vehicles
Whilst riding a motorcycle ______
Whilst driving a car ______
Whilst driving another vehicle ______
To enable us to match this questionnaire with the questionnaire/s you completed during
training could you please help us by providing the following details. Remember that this
is completely confidential and your details will never be released to anyone.
Full Name:………………………………………………
Date of Birth: ……/……/………..
Licence Number: ………………………
Today’s date: ……/……/………..
Thank you for helping us out. The information you provided will help improve
safety for all motorcyclists that undertake training.
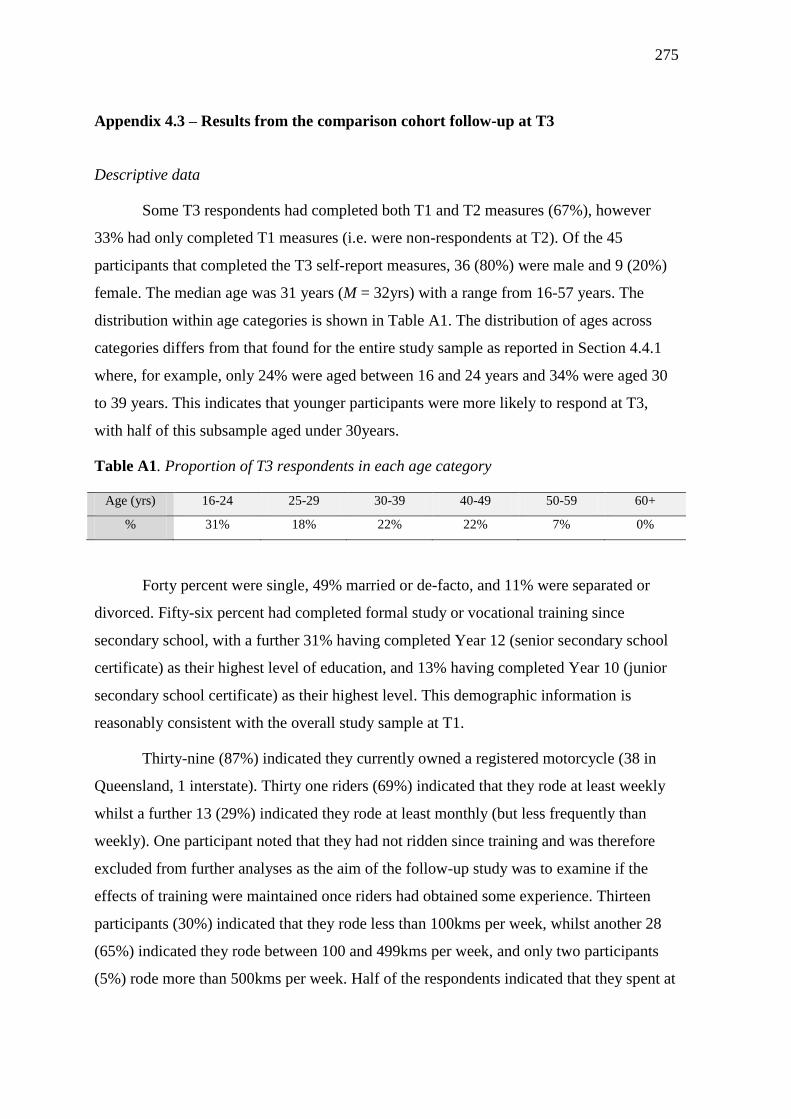
275
Appendix 4.3 – Results from the comparison cohort follow-up at T3
Descriptive data
Some T3 respondents had completed both T1 and T2 measures (67%), however
33% had only completed T1 measures (i.e. were non-respondents at T2). Of the 45
participants that completed the T3 self-report measures, 36 (80%) were male and 9 (20%)
female. The median age was 31 years (M = 32yrs) with a range from 16-57 years. The
distribution within age categories is shown in Table A1. The distribution of ages across
categories differs from that found for the entire study sample as reported in Section 4.4.1
where, for example, only 24% were aged between 16 and 24 years and 34% were aged 30
to 39 years. This indicates that younger participants were more likely to respond at T3,
with half of this subsample aged under 30years.
Table A1. Proportion of T3 respondents in each age category
Age (yrs) 16-24 25-29 30-39 40-49 50-59 60+
% 31% 18% 22% 22% 7% 0%
Forty percent were single, 49% married or de-facto, and 11% were separated or
divorced. Fifty-six percent had completed formal study or vocational training since
secondary school, with a further 31% having completed Year 12 (senior secondary school
certificate) as their highest level of education, and 13% having completed Year 10 (junior
secondary school certificate) as their highest level. This demographic information is
reasonably consistent with the overall study sample at T1.
Thirty-nine (87%) indicated they currently owned a registered motorcycle (38 in
Queensland, 1 interstate). Thirty one riders (69%) indicated that they rode at least weekly
whilst a further 13 (29%) indicated they rode at least monthly (but less frequently than
weekly). One participant noted that they had not ridden since training and was therefore
excluded from further analyses as the aim of the follow-up study was to examine if the
effects of training were maintained once riders had obtained some experience. Thirteen
participants (30%) indicated that they rode less than 100kms per week, whilst another 28
(65%) indicated they rode between 100 and 499kms per week, and only two participants
(5%) rode more than 500kms per week. Half of the respondents indicated that they spent at

276
least 90% of their time on the motorcycle riding for recreational purposes, whilst a further
36% indicated that they rode 90% of the time for commuting purposes.
Seven participants reported involvement as controllers in one motorcycle crash
since training and a further two participants reported being involved in two motorcycle
crashes since training. Only three participants reported having been cited for a traffic
offence whilst riding a motorcycle since training, all for speeding. The low number of
motorcycling crashes and offences since training unfortunately rendered further analyses
for these variables not worthwhile as no meaningful information could be gained from
such analyses (e.g. to determine factors influencing crashes or offences).
The types of motorcycles that participants reported riding most since training were:
sports (32.8%), sports tourers (18.2%), tourers (2.3%), cruisers (25%), trail bikes (4.5%),
scooters (15.9%), and others such as postal delivery motorcycles (2.3%). These results are
generally representative of the type of motorcycle the entire study sample indicated they
intended to ride at T1 (about half the sample riding sports, sports/tourer, or tourer; and
about one quarter riding cruisers). A notably lower proportion of participants riding trail
bikes were evident at T3 compared to T1, although this is expected as some riders progress
from off-road riding prior to licensing to on-road riding once licensed. The proportion of
scooter riders was reasonably similar to the overall sample at T1 as reported in Section
4.5.2.
Nine percent of participants indicated they currently held an RE class (restricted)
motorcycle licence, whilst 91% held an R class (unrestricted). Notably, the proportion of
RE class licence holders is half that of the entire study sample at T1. This is expected
however, as riders are able to progress to an R class licence if they wish (with further
assessment) after holding an RE class for 12 months. Only four riders indicated that they
had received further training since their licensing course.
Table A2 shows responses across all three time periods for the T3 respondents.
They differed considerably in their T1 and T2 responses to the broader sample and, as
such, are not representative of most riders in the initial sample. Additionally, some of the
subgroup did not respond at T2. However, findings from this subgroup do highlight some
interesting points in their own right regarding movement through the stages of change,
particularly in regard to their reported adoption and maintenance of safe riding practices

277
after licensing. The vast majority of the subgroup nominated that they were in the action or
maintenance stage at T3. However, few reported to be in the preparation stage. This
indicates that many had progressed from the preparation stage upon finishing training to
adopt safe riding practices two years after training (as defined by self-report). McNemar’s
nonparametric test for related samples found that there was a significant decrease in the
likelihood of respondents being in the preparation stage from T2 to T3, p<.001, and a
significant increase in the likelihood of respondents being in the maintenance stage from
T2 to T3, p<.05. Change in all other stages between T2 and T3 were non-significant for
this subsample.
Table A2. Percentage of T3 respondents in each stage of change at each time
n Pre-cont Contemplation Preparation Action Maintenance
Start of training (T1) 43 0 16.3 34.8 44.2 4.7
End of training (T2) 29 0 10.3 48.3 34.5 6.9
2yr follow-up (T3) 43 0 16.3 2.3 39.5 41.9
Respondents at T3 rated themselves generally above average in terms of riding skill
(M = 4.15, where a score of ‘3’ indicates ‘average’ skill). Similarly, they rated themselves
as above average in terms of safe riding (M = 4.24).
Mean item scores from respondents for each of the key risk scales measured at T3
are shown in Table A2 along with mean item scores for the behavioural scales (risky
riding). Additionally, risk scale scores for key variables measured at T1 and T2 only, and
not at follow up, are also shown (e.g. risky riding intentions). Scores for the same risk
scales are shown also for T3 non-respondents to explore the representativeness of the T3
subsample.
Behavioural scale scores shown in Table A3 indicate that risky riding behaviour
was relatively infrequent. The Group Riding scale was the highest indicator of risky riding,
although this was still relatively low when considering that range of measurement (i.e. 1-7
Likert scale with higher scores indicating more frequent risky riding). A visual
examination of mean scores in Table A3 at T1 and T2 provided insight into the differences
278
in the patterns between T3 respondents and non-respondents. Significance tests were not
undertaken for such comparisons as distinctly different patterns of responding are obvious
for some key indices; where an increase can be seen for one group and a decrease can be
seen for the other.
Mean scores on the Safety Attitudes scale increased over each time period for the
T3 respondents (indicating more positive attitudes towards safety over time). This trend
was less pronounced for the T3 non-respondents for this variable. For Motorcycle Thrill
Seeking (the only other risk scale measured across all three time periods) the results for T3
respondents showed a slightly higher mean score at T2 than at other times. Whilst the
change over time is marginal, this trend differs from that shown for T3 non-respondents,
where a reduction from T1 to T2 was apparent for this scale. Mean scores on the
Aggressive Riding scale for the T3 respondents were higher at T3 than at T1. Scores at T1
for this scale were marginally lower for T3 respondents than non-respondents. Notably,
mean scores on the Risky Riding Intentions scale increased between T1 and T2 for the T3
respondent subset, whilst scores for this scale decreased between T1 and T2 for T3 non-
respondents.
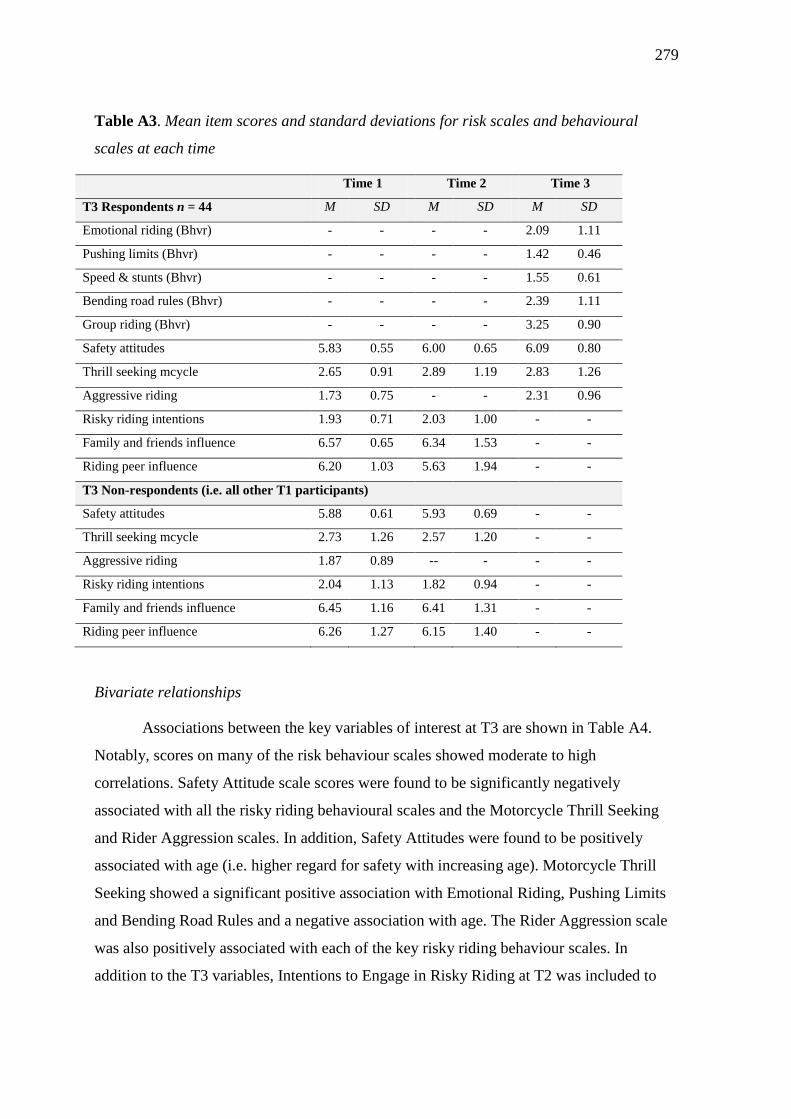
279
Table A3. Mean item scores and standard deviations for risk scales and behavioural
scales at each time
Time 1 Time 2 Time 3
T3 Respondents n = 44 M SD M SD M SD
Emotional riding (Bhvr) - - - - 2.09 1.11
Pushing limits (Bhvr) - - - - 1.42 0.46
Speed & stunts (Bhvr) - - - - 1.55 0.61
Bending road rules (Bhvr) - - - - 2.39 1.11
Group riding (Bhvr) - - - - 3.25 0.90
Safety attitudes 5.83 0.55 6.00 0.65 6.09 0.80
Thrill seeking mcycle 2.65 0.91 2.89 1.19 2.83 1.26
Aggressive riding 1.73 0.75 - - 2.31 0.96
Risky riding intentions 1.93 0.71 2.03 1.00 - -
Family and friends influence 6.57 0.65 6.34 1.53 - -
Riding peer influence 6.20 1.03 5.63 1.94 - -
T3 Non-respondents (i.e. all other T1 participants)
Safety attitudes 5.88 0.61 5.93 0.69 - -
Thrill seeking mcycle 2.73 1.26 2.57 1.20 - -
Aggressive riding 1.87 0.89 -- - - -
Risky riding intentions 2.04 1.13 1.82 0.94 - -
Family and friends influence 6.45 1.16 6.41 1.31 - -
Riding peer influence 6.26 1.27 6.15 1.40 - -
Bivariate relationships
Associations between the key variables of interest at T3 are shown in Table A4.
Notably, scores on many of the risk behaviour scales showed moderate to high
correlations. Safety Attitude scale scores were found to be significantly negatively
associated with all the risky riding behavioural scales and the Motorcycle Thrill Seeking
and Rider Aggression scales. In addition, Safety Attitudes were found to be positively
associated with age (i.e. higher regard for safety with increasing age). Motorcycle Thrill
Seeking showed a significant positive association with Emotional Riding, Pushing Limits
and Bending Road Rules and a negative association with age. The Rider Aggression scale
was also positively associated with each of the key risky riding behaviour scales. In
addition to the T3 variables, Intentions to Engage in Risky Riding at T2 was included to
280
show correlations with the T3 riding behaviours for scales with acceptable reliability.
Emotional Riding, Pushing Limits, and Bending Road Rules all showed moderate positive
correlations with T2 Intentions to Engage in Risky Riding.
Scales for impaired riding, group riding, and extreme speeds and stunts are not
shown in Table A4 due to poor internal consistency of the items (Cronbach’s alpha).
Therefore, individual items relating to these conceptual factors were examined to ascertain
the level of bivariate correlation with other key variables of interest. Fatigue is one of the
individual items reported in Table A4, correlating moderately with all risk and behavioural
scales.
Important associations for those variables not shown in the table are briefly
described as follows. A significant moderate positive association was found between the
group riding item “Follow the rider in front of you and find yourself just following them
instead of riding your own ride” and scores for the Pushing Limits scale (r = .36, p < .05).
Significant positive associations were also found between another group riding item “Ride
in a group (or with another rider) which includes people who ride in a way that endangers
you” and the Pushing Limits scale (r = .43, p < .01) and the Emotional riding scale (r =
.54, p < .01). A moderate positive association was found between riding fatigued and the
item “Ridden after using marijuana or any other illicit drug” (r = .37, p < .05) and a
moderate to high positive association was found between riding fatigued and the item
“Ridden when you might have had any alcohol in your system” (r = .63, p < .01).
A moderate positive correlation was found between scores on the propensity for
Motorcycle Thrill Seeking scale and the item “Rode recklessly or performed dangerous
stunts to test your skill” (r = .43, p < .01). This item also correlated positively with self-
rated riding skill (r = .68, p < .05). The item “Ridden 15km/h or more over the speed limit
in 50km/h or 60km/h zones” showed a high positive correlation with the Bending Road
Rules scale (r = .82, p < .01) and the Pushing Limits scale (r = .69, p < .01) and
additionally showed a high negative correlation with Safety Attitudes (r = .75, p < .01).
The item “attempted to do or actually did a wheelie or stoppie” showed a positive
moderate to high correlation with self-rated skill (r = .68, p < .05).
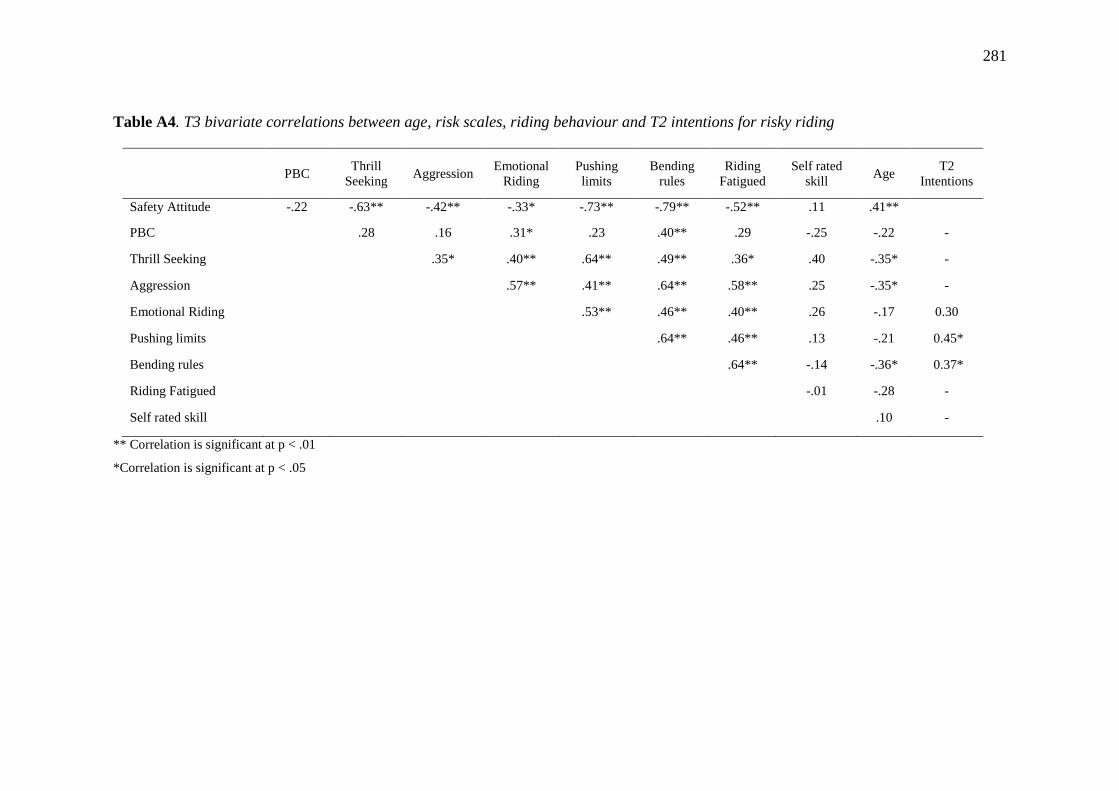
281
Table A4. T3 bivariate correlations between age, risk scales, riding behaviour and T2 intentions for risky riding
PBC Thrill
Seeking Aggression
Emotional
Riding
Pushing
limits
Bending
rules
Riding
Fatigued
Self rated
skill Age
T2
Intentions
Safety Attitude -.22 -.63** -.42** -.33* -.73** -.79** -.52** .11 .41**
PBC .28 .16 .31* .23 .40** .29 -.25 -.22 -
Thrill Seeking .35* .40** .64** .49** .36* .40 -.35* -
Aggression .57** .41** .64** .58** .25 -.35* -
Emotional Riding .53** .46** .40** .26 -.17 0.30
Pushing limits .64** .46** .13 -.21 0.45*
Bending rules .64** -.14 -.36* 0.37*
Riding Fatigued -.01 -.28 -
Self rated skill .10 -
** Correlation is significant at p < .01
*Correlation is significant at p < .05

282
Appendix 5.1 – Additional questions for the pilot intervention end of training
questionnaire
1. Being careful all the time will take all the fun out of riding
2. It’s important to look after mates when riding together
3. You don’t have to be a highly skilled rider to be a safe rider
4. There’s no point pushing my limits to keep up with other riders
5. I’m not likely to suffer any bad consequences if I choose to bend the road rules
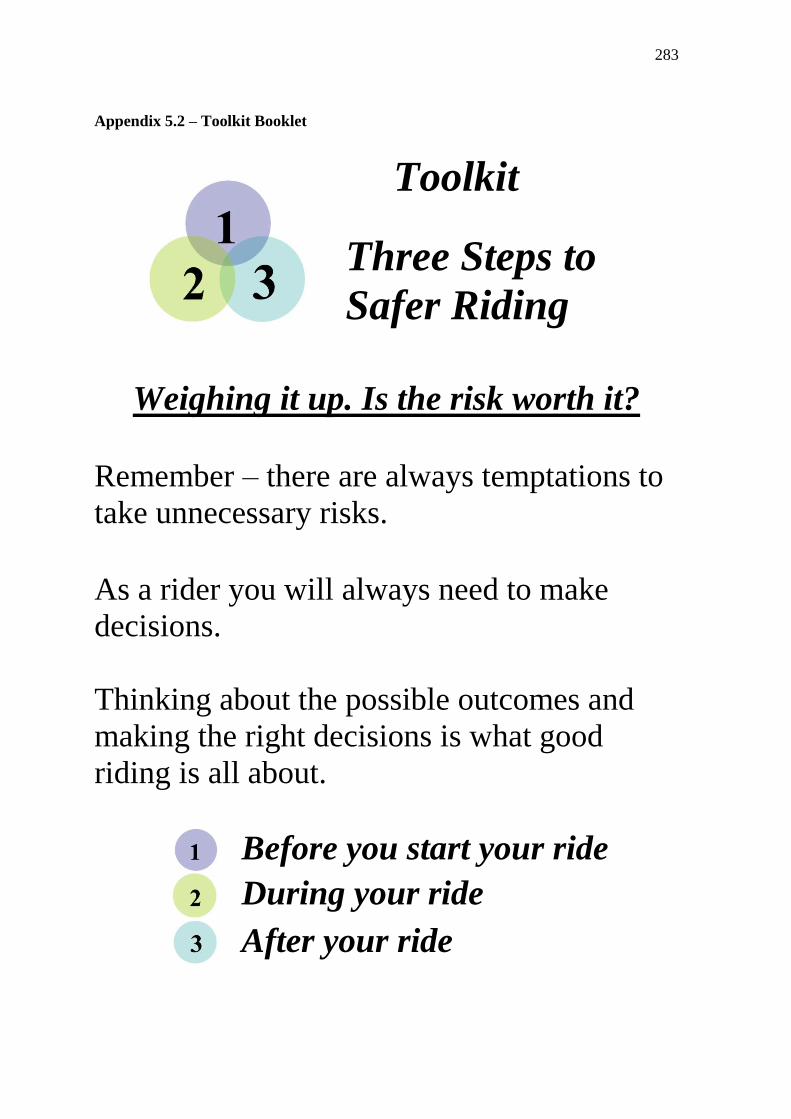
283
Appendix 5.2 – Toolkit Booklet
Toolkit
Three Steps to
Safer Riding
Weighing it up. Is the risk worth it?
Remember – there are always temptations to
take unnecessary risks.
As a rider you will always need to make
decisions.
Thinking about the possible outcomes and
making the right decisions is what good
riding is all about.
Before you start your ride
During your ride
After your ride
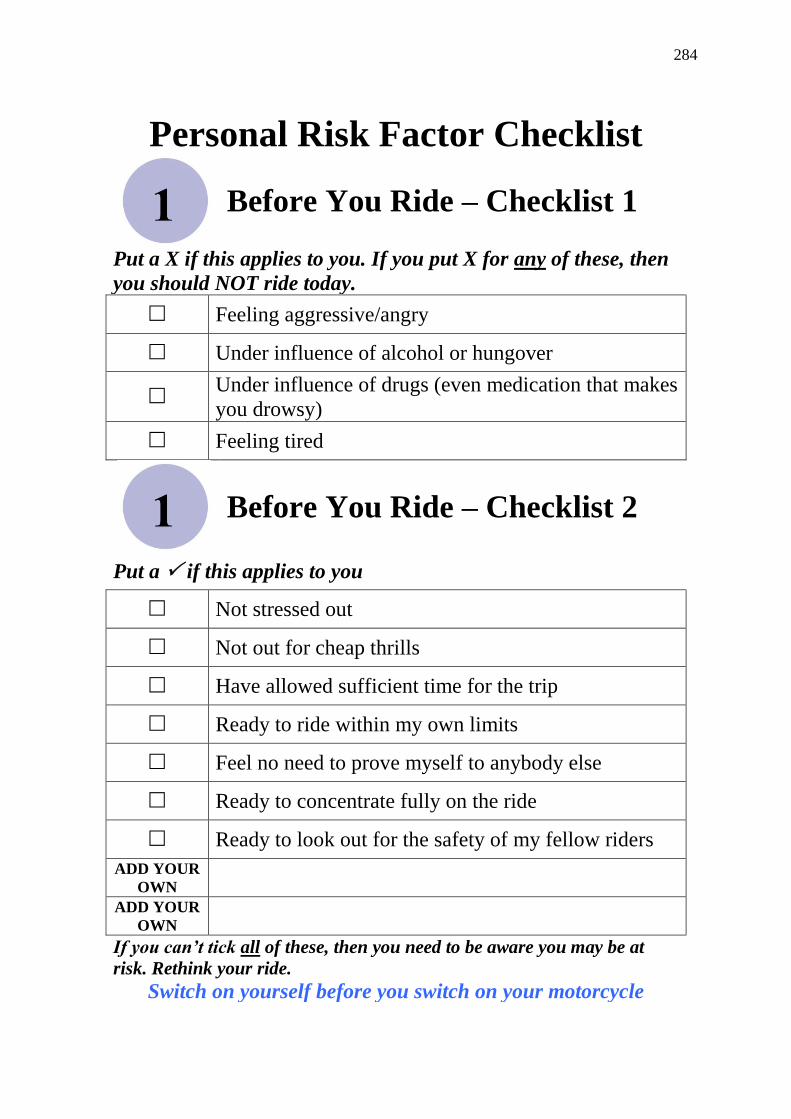
284
Personal Risk Factor Checklist
Before You Ride – Checklist 1
Put a X if this applies to you. If you put X for any of these, then
you should NOT ride today.
Feeling aggressive/angry
Under influence of alcohol or hungover
Under influence of drugs (even medication that makes
you drowsy)
Feeling tired
Before You Ride – Checklist 2
Put a if this applies to you
Not stressed out
Not out for cheap thrills
Have allowed sufficient time for the trip
Ready to ride within my own limits
Feel no need to prove myself to anybody else
Ready to concentrate fully on the ride
Ready to look out for the safety of my fellow riders
ADD YOUR
OWN
ADD YOUR
OWN
If you can’t tick all of these, then you need to be aware you may be at
risk. Rethink your ride.
Switch on yourself before you switch on your motorcycle
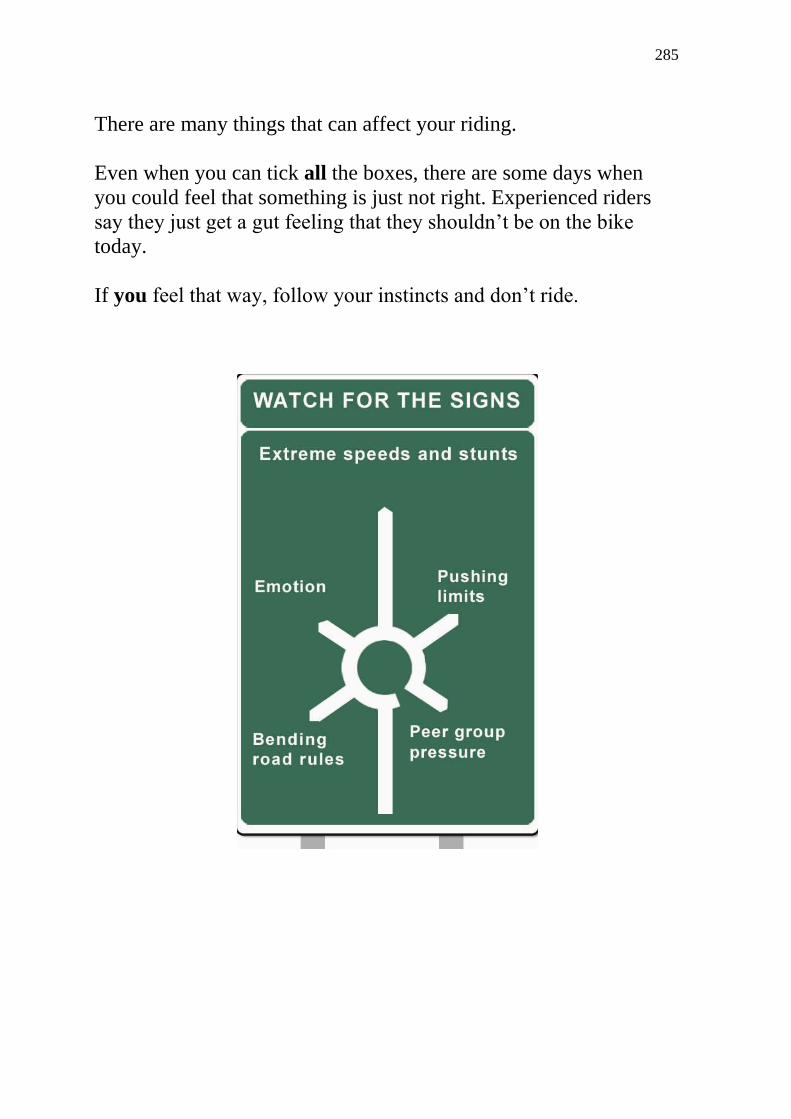
285
There are many things that can affect your riding.
Even when you can tick all the boxes, there are some days when
you could feel that something is just not right. Experienced riders
say they just get a gut feeling that they shouldn’t be on the bike
today.
If you feel that way, follow your instincts and don’t ride.

286
During your ride
So what can you do about it?
Some examples
On-bike Signs How you react to this
Pushing your limits
Starting to push your limits
simply Back Off! You don’t need to push your limits to be a good rider or enjoy
your ride. You’ll never know what your limits are until it’s too late.
Trying to keep up with riders who appear
/ make out to be more experienced
riders
ride your own ride – you’re the most important person in the world
develop YOUR experience
accept your level of ability and ride within your limits.
Getting carried away in the heat of the
moment
take a moment, ease off, and think about what you’re doing. Make sure you
leave some margin for error.
bike handling getting loose or running
wide on corners
Stop in a safe place. Re-assess your eye line. Remember where you look, you
go.
Take a break – spend 15 minutes not riding but relaxing.

287
Bending road rules
overtaking in dangerous situations (e.g.
double white lines) to get ahead of
traffic
keep it legal – follow the law and avoid fines and hassles.
following too closely remember that you haven’t left any room for error – by you or the driver/ rider in
front. You cannot out brake another vehicle.
lane splitting to save time
lane splitting makes it difficult for other people to know what you are doing – so
that’s why it’s illegal
you can’t always predict what other people will do
the consequences might outweigh the time benefits – DOA is not your aim
riding up the shoulder of the road consider the potential hazards (debris, cars veering out of lane). Stay in your lane –
don’t put yourself in a vulnerable situation.
Extreme speeds and stunts
tempted to open it up for the thrill you have no time to react at high speed. Remember time is distance traveled. Take
it to the track - not on public roads
in a hurry if you’re running late, ring ahead and let people know to take the pressure off.
feel the need to blow off steam control your emotions – don’t let them control you. Take a break /few deep breaths
until you settle down.
feel the need to impress others show maturity – what reward will you gain? Nobody will be impressed if you
come off. You have nothing to prove to anybody else.
want to test your motorcycle The manufacturer has already paid a test rider to do this for you. Resist the
temptation - you’ll reach your limits before you reach the bikes limits.
288
Riding Review
After Riding –Being your own coach!
Any time something has happened during your ride (e.g. a
near miss or you pushed things a little too hard and gave
yourself a bit of a scare) then think back and go over all
the details.
This will help you learn from common experiences so you
can avoid risky situations in the future.
What can you do?
Review when
who
why →
what
The following questions will help you
work out what went wrong. You can
print another set of these questions
from the Morgan&Wacker website:
www.mwmtc.com.au
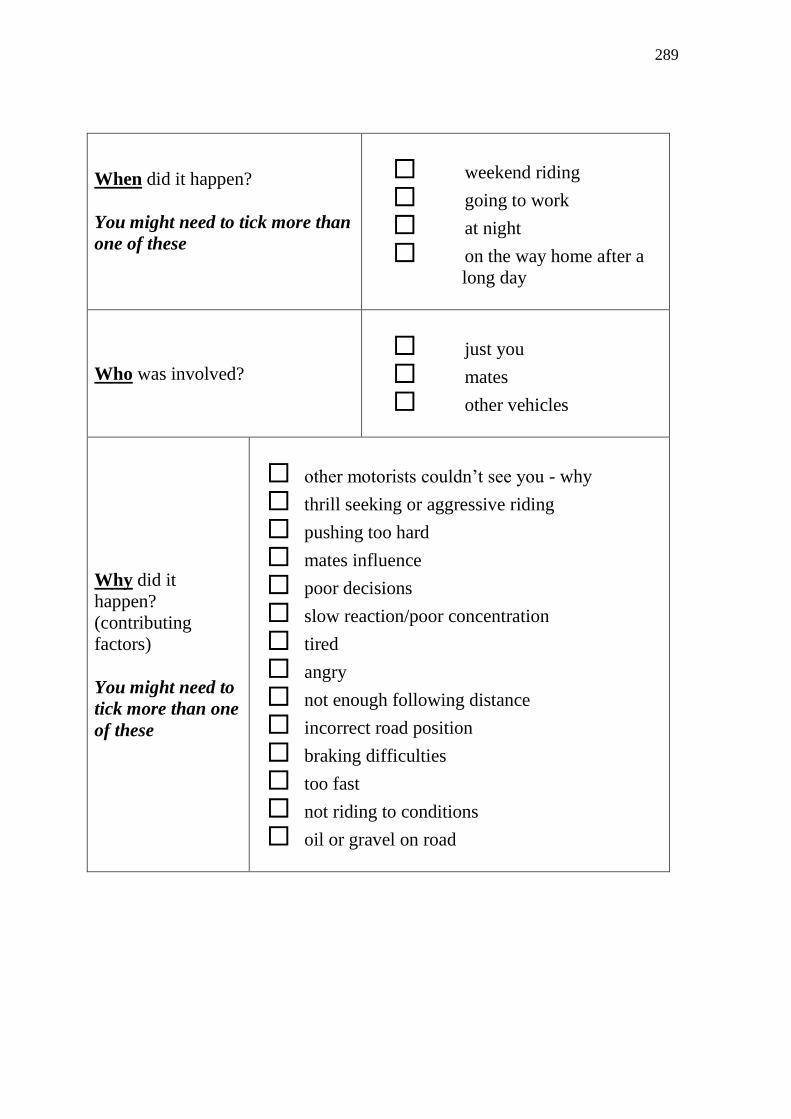
289
When did it happen?
You might need to tick more than
one of these
weekend riding
going to work
at night
on the way home after a
long day
Who was involved?
just you
mates
other vehicles
Why did it
happen?
(contributing
factors)
You might need to
tick more than one
of these
other motorists couldn’t see you - why
thrill seeking or aggressive riding
pushing too hard
mates influence
poor decisions
slow reaction/poor concentration
tired
angry
not enough following distance
incorrect road position
braking difficulties
too fast
not riding to conditions
oil or gravel on road
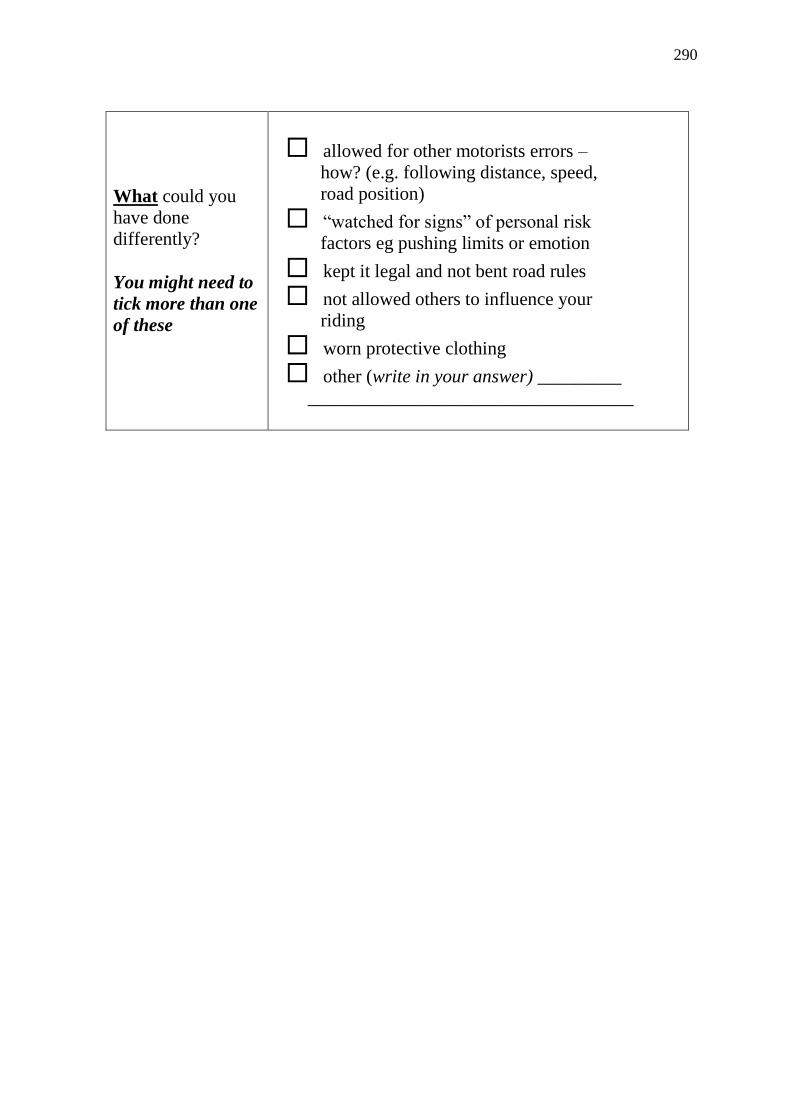
290
What could you
have done
differently?
You might need to
tick more than one
of these
allowed for other motorists errors –
how? (e.g. following distance, speed,
road position)
“watched for signs” of personal risk
factors eg pushing limits or emotion
kept it legal and not bent road rules
not allowed others to influence your
riding
worn protective clothing
other (write in your answer) _________
___________________________________

291
Any other things that you need to remind yourself
about?
Make a note of them below:
_________________________________________________________________________
_________________________________________________________________________
_________________________________________________________________________
_________________________________________________________________________
_________________________________________________________________________
_________________________________________________________________________
_________________________________________________________________________
_________________________________________________________________________
_________________________________________________________________________
_________________________________________________________________________
________
© QUT 2008

292
Appendix 5.3 - Process evaluation focus group and interview questions for
intervention graduates.
Q1. What can you tell me about the 3 Steps to Safer Riding?
Prompt: The 3 Steps stand for some of the things you need to consider before you
ride, during your ride, and after your ride for your safety….is it a useful way to
remember things?
Q2. What 6 Personal Risk Factors were covered in the training and have you found
these useful for your riding?
Q3. The 3 Steps session went for about an hour in your training in the classroom.
What do you think about this timeframe?
Q4 What do you think about the ‘Toolkit” booklet to remind you of how to be a
better and safer rider, and did you use it much?
Q5. What do you think about the video clips showing different riding situations?
Q6. Did the trainer get you involved in discussions and was that a good way to
learn?
Q7. What issues came up in the 3 Steps program that challenged your own beliefs
or attitudes about riding and/or made you change your mind (e.g. riding with mates,
aggression)?
Q8. Now that you’ve been licensed for a while can you recall the last time you
thought about the things in the 3 Steps program and has it helped you out on the
road?
Q9. Overall, what did you think of the 3 Steps to Safer Riding program & is there
any way to improve it?
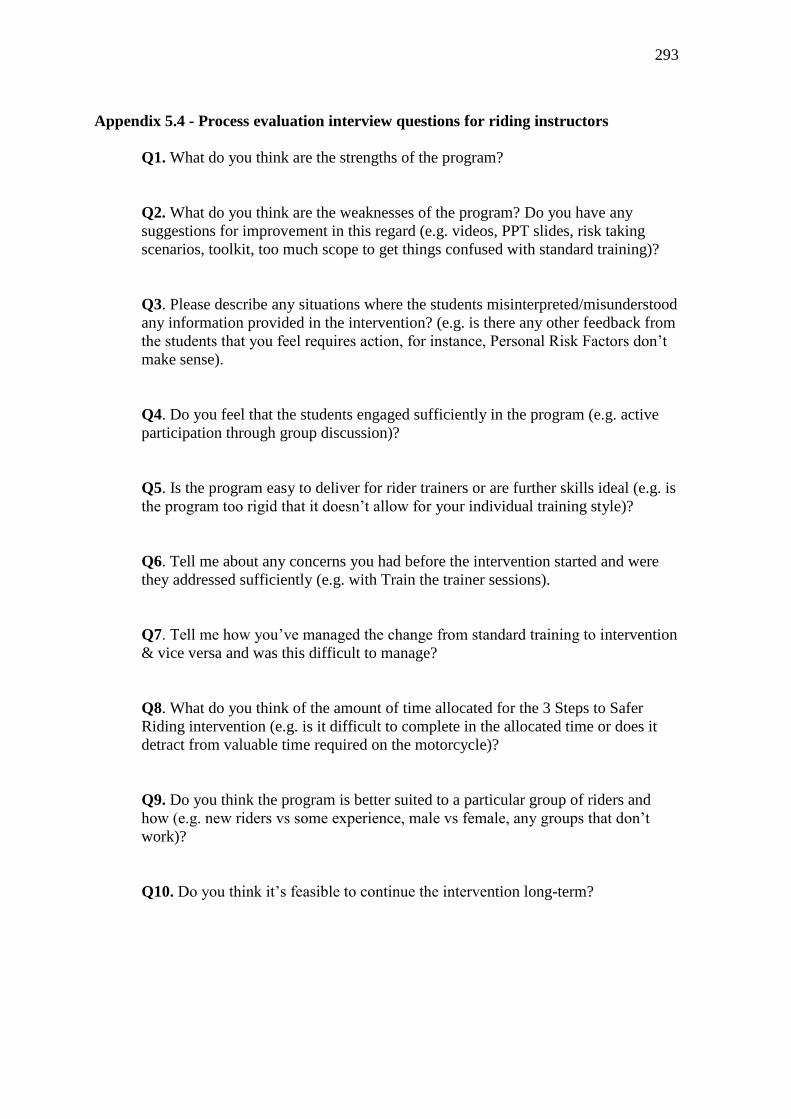
293
Appendix 5.4 - Process evaluation interview questions for riding instructors
Q1. What do you think are the strengths of the program?
Q2. What do you think are the weaknesses of the program? Do you have any
suggestions for improvement in this regard (e.g. videos, PPT slides, risk taking
scenarios, toolkit, too much scope to get things confused with standard training)?
Q3. Please describe any situations where the students misinterpreted/misunderstood
any information provided in the intervention? (e.g. is there any other feedback from
the students that you feel requires action, for instance, Personal Risk Factors don’t
make sense).
Q4. Do you feel that the students engaged sufficiently in the program (e.g. active
participation through group discussion)?
Q5. Is the program easy to deliver for rider trainers or are further skills ideal (e.g. is
the program too rigid that it doesn’t allow for your individual training style)?
Q6. Tell me about any concerns you had before the intervention started and were
they addressed sufficiently (e.g. with Train the trainer sessions).
Q7. Tell me how you’ve managed the change from standard training to intervention
& vice versa and was this difficult to manage?
Q8. What do you think of the amount of time allocated for the 3 Steps to Safer
Riding intervention (e.g. is it difficult to complete in the allocated time or does it
detract from valuable time required on the motorcycle)?
Q9. Do you think the program is better suited to a particular group of riders and
how (e.g. new riders vs some experience, male vs female, any groups that don’t
work)?
Q10. Do you think it’s feasible to continue the intervention long-term?