development and application of high-field asymmetric
TRANSCRIPT

Development and application of high-field
asymmetric waveform ion mobility
spectrometry and mass spectrometry for
the investigation of fibroblast growth
factor signalling
by
Hongyan Zhao
A thesis submitted to the University of Birmingham for the degree of
DOCTOR OF PHILOSOPHY
School of Biosciences
The University of Birmingham
September 2016

University of Birmingham Research Archive
e-theses repository This unpublished thesis/dissertation is copyright of the author and/or third parties. The intellectual property rights of the author or third parties in respect of this work are as defined by The Copyright Designs and Patents Act 1988 or as modified by any successor legislation. Any use made of information contained in this thesis/dissertation must be in accordance with that legislation and must be properly acknowledged. Further distribution or reproduction in any format is prohibited without the permission of the copyright holder.

Acknowledgment
I would like to thank my supervisors, Professor Helen Cooper and Professor John Heath for
their constant support and help throughout the course of my studies. It was a great
opportunity to get to work with experienced experts in related field. Many thanks go to Dr
Andrew Creese and Dr Debbie Cunningham who always unselfishly share their expertise
and experience.
I am grateful for Jinglei Yu and Cleidiane Zampronio for providing practical assistance. A
special thanks go to colleague Gloria Ulasi who accompany me through various instrument
troubleshooting. Thanks to all in Cooper Mass Spectrometry group and friends on 5th floor,
Biosciences, for making my time at the university so pleasurable.
I would like to acknowledge Chinese Scholarship Council for funding my PhD.
To Yu, thank you for raising me up so I can see the mountains.

I
Abstract
The deregulation of FGF signalling is closely linked to many human diseases, including
cancer. Through phosphorylation and dephosphorylation processes, FGF signalling is
finely controlled. The thesis presented focuses on applying mass spectrometry tools to
investigate FGF signalling using the breast carcinoma SUM52 cell line.
High-Field Asymmetric Waveform Ion Mobility Spectrometry (FAIMS) is a technique
that separates and focuses ions at atmospheric pressure. It has been demonstrated that
the application of LC-FAIMS-MS/MS results in increased signal-to-noise ratios and
improved dynamic range in the analysis of complex proteomics samples. The LC-
FAIMS-MS/MS method for large-scale quantitative analysis was optimized and the
performance of LC-MS/MS and LC-FAIMS-MS/MS was compared. Results showed
the two techniques shared good complementarity. The incorporation of FAIMS resulted
in an increase in identifications of novel phosphosites and an increase in the
identification of multiply-phosphorylated peptides. Next, a modified FAIMS interface
was evaluated for proteomic analyses. This novel FAIMS device exhibited potential in
enhancing proteomic analysis showing an increase in peak capacity and proteome
coverage and a lower level of redundancy. Next, SRM was applied for accurate
quantitation of 75 phosphopeptides in a time-resolved way. These candidates were
selected from kinases in response to FGFR inhibition in a SILAC experiment performed
on SUM52 and MFM233 cells, with peptides containing multiple sites of
phosphorylation also included. The data revealed that these phosphorylation sites
showed different associations with FGF1 stimulation. Expression patterns were
clustered into early, mid- and late stage response.
Results presented in this work range from the large-scale investigation of
phosphorylation events involved in FGF signalling, the application of a novel FAIMS
interface and a targeted quantitation profile of the key phosphorylation events in FGF
signalling, which would benefit both understanding and the potential mechanisms of
FGF signalling.

II
Table of contents
Abstract-------------------------------------------------------------------------------------------- I
Table of contents -------------------------------------------------------------------------------- II
LIST OF FIGURES AND TABLES ------------------------------------------------------- VI
ABBREVIATIONS --------------------------------------------------------------------------- IX
Chapter 1
1.1 Overview ------------------------------------------------------------------------------------- 2
1.2 Fibroblast growth factor (FGF) and FGF signalling ------------------------------- 3
1.2.1 FGFs ------------------------------------------------------------------------------------- 3
1.2.2 FGFR ------------------------------------------------------------------------------------ 4
1.2.3 FGF signalling -------------------------------------------------------------------------- 7
1.2.4 FGF signalling and cancer ----------------------------------------------------------- 10
1.3 Mass spectrometry ------------------------------------------------------------------------ 15
1.3.1 Ionization ------------------------------------------------------------------------------- 16
1.3.2 Mass analysers------------------------------------------------------------------------- 18
1.3.3 Tandem mass spectrometry ---------------------------------------------------------- 18
1.3.4 Hybrid instruments ------------------------------------------------------------------- 21
1.4 Proteomics by mass spectrometry ----------------------------------------------------- 27
1.4.1 Bottom-up proteomics workflow --------------------------------------------------- 28
1.4.2 Phosphoproteomics by mass spectrometry ---------------------------------------- 30
1.4.3 Targeted proteomics-selected reaction monitoring ------------------------------ 37
1.5 High-Field Asymmetric Waveform Ion Mobility Spectrometry (FAIMS) --- 43
1.5.1 Ion mobility mass spectrometry ---------------------------------------------------- 43
1.5.2 Fundamentals of FAIMS ------------------------------------------------------------- 45
1.5.3 Design of FAIMS electrodes -------------------------------------------------------- 48
1.5.4 FAIMS and proteomics -------------------------------------------------------------- 53
1.6 Aims and objectives ---------------------------------------------------------------------- 55
Chapter 2
2.1. Buffers and solutions -------------------------------------------------------------------- 57

III
2.1.1 General laboratory reagents --------------------------------------------------------- 57
2.1.2 Cell culture ----------------------------------------------------------------------------- 57
2.1.3 Sample preparation ------------------------------------------------------------------- 58
2.1.4 Fractionations -------------------------------------------------------------------------- 58
2.1.5 Mass spectrometry -------------------------------------------------------------------- 59
2.2 Methods ------------------------------------------------------------------------------------- 59
2.2.1 Cell culture ----------------------------------------------------------------------------- 59
2.2.2 Fractionations -------------------------------------------------------------------------- 61
2.2.3 LC-MS/MS analysis ------------------------------------------------------------------ 63
2.2.4 LC-FAIMS-MS/MS analysis -------------------------------------------------------- 64
2.2.5 LC-SRM-MS/MS analysis----------------------------------------------------------- 65
2.2.6 Data analysis --------------------------------------------------------------------------- 67
2.2.7 Workflow of SILAC experiment --------------------------------------------------- 69
2.2.8 Workflow of SRM experiment ------------------------------------------------------ 70
Chapter 3
3.1 Introduction -------------------------------------------------------------------------------- 73
3.2 Results --------------------------------------------------------------------------------------- 73
3.2.1 Quantitation analysis by LC-FAIMS-MS/MS ------------------------------------ 73
3.2.2 Phosphoproteomic analysis of 293T cells by LC-MS/MS and LC-FAIMS-
MS/MS ---------------------------------------------------------------------------------------- 75
3.2.3 Phosphoproteomic analysis of SUM52 cells by LC-MS/MS and LC-FAIMS-
MS/MS ---------------------------------------------------------------------------------------- 78
3.2.4 Optimization of phosphoenrichment ----------------------------------------------- 81
3.3 Conclusion ---------------------------------------------------------------------------------- 82
Chapter 4
4.1 Introduction -------------------------------------------------------------------------------- 84
4.2 Results --------------------------------------------------------------------------------------- 85
4.2.1 Phosphopeptide identification by LC-MS/MS and LC-FAIMS-MS/MS ----- 85
4.2.2 CV Distribution ----------------------------------------------------------------------- 86
4.2.3 Charge state distribution ------------------------------------------------------------- 87

IV
4.2.4 Phosphopeptide length --------------------------------------------------------------- 88
4.2.5 Phosphorylation status --------------------------------------------------------------- 90
4.2.6 Novel phosphorylation sites --------------------------------------------------------- 91
4.2.7 FGFR and Src mediated phosphorylation events --------------------------------- 94
4.3 Discussion --------------------------------------------------------------------------------- 105
4.3.1 Complementarity -------------------------------------------------------------------- 105
4.3.2 CV distribution ---------------------------------------------------------------------- 106
4.3.3 Charge state distribution ----------------------------------------------------------- 106
4.3.4 Phosphorylation status ------------------------------------------------------------- 107
4.3.5 Novel phosphorylation status ----------------------------------------------------- 107
4.3.6 FGFR and Src mediated phosphorylation events ------------------------------- 108
4.4 Conclusion -------------------------------------------------------------------------------- 110
Chapter 5
5.1 Introduction ------------------------------------------------------------------------------ 112
5.2 Results ------------------------------------------------------------------------------------- 113
5.2.1 Direct infusion of substance P ---------------------------------------------------- 113
5.2.2 Direct infusion of a tryptic digest of six standard proteins-------------------- 114
5.2.3 LC-FAIMS-MS/MS analysis of a tryptic digest of six standard proteins--- 116
5.2.4 LC-FAIMS-MS/MS analysis of SUM52 cell lysate --------------------------- 117
5.3 Discussion --------------------------------------------------------------------------------- 126
5.3.1 Instrumental and operational parameters ---------------------------------------- 126
5.3.2 Direct infusion ----------------------------------------------------------------------- 127
5.3.3 LC-FAIMS-MS/MS analysis of a tryptic digest of six standard proteins--- 128
5.3.4 LC-FAIMS-MS/MS analysis of SUM 52 cell lysate -------------------------- 128
5.3.4 Charge state -------------------------------------------------------------------------- 129
5.4 Conclusion -------------------------------------------------------------------------------- 130
Chapter 6
6.1 Introduction ------------------------------------------------------------------------------ 132
6.2 Results ------------------------------------------------------------------------------------- 136
6.2.1 Initial assessment of SRM assay -------------------------------------------------- 136

V
6.2.2 Overview of SRM-based quantitation of key phosphorylation events in FGF
signalling ------------------------------------------------------------------------------------ 138
6.2.3 Phosphopeptides response to FGF1 treatment ---------------------------------- 140
6.2.4 Establishment of calibration curve ----------------------------------------------- 143
6.2.5 Response of multi-site phosphopeptides ----------------------------------------- 145
6.2.6 Trouble shooting -------------------------------------------------------------------- 153
6.3 Discussion --------------------------------------------------------------------------------- 154
6.3.1 Initial assessment of SRM assay -------------------------------------------------- 154
6.3.2 Phosphopeptides response to FGF1 treatment ---------------------------------- 154
6.3.3 Calibration curve -------------------------------------------------------------------- 155
6.3.4 Response of multi-site phosphopeptides ----------------------------------------- 155
6.3.5 Trouble shooting -------------------------------------------------------------------- 161
6.4 Conclusion -------------------------------------------------------------------------------- 162
Chapter 7
7.1 Optimization of phosphoproteomic analysis by LC-FAIMS-MS/MS ------- 165
7.2 FAIMS and phosphoproteomics of FGF signalling ----------------------------- 165
7.3 Evaluation of modified FAIMS interface ------------------------------------------ 166
7.4 Investigation of dynamics of the key phosphorylation events in FGF signalling
by selected reaction monitoring ---------------------------------------------------------- 167
Reference -------------------------------------------------------------------------------------- 168
Appendix -------------------------------------------------------------------------------------- 187
Appendix 1 Information of novel phosphorylation sites ----------------------------- 188
Appendix 2 Peptide details of the SRM assay ----------------------------------------- 196
Appendix 3 Quantitation results of SRM assay --------------------------------------- 203

VI
List of figures and tables
Chapter 1
Figure 1.1 Schematic structure of FGFRs
Figure 1.2 Structure and phosphorylation sites of FGFR1
Figure 1.3 FGFR signalling network
Figure 1.4 Chemical structures of (A) SU5402 and (B) dasatinib
Figure 1.5 Electrospray ionisation: the proposed model of CRM and IEM
Figure 1.6 Dissociation products of protonated peptides
Figure 1.7 Schematic of LTQ Orbitrap Velos ETD mass spectrometer
Figure 1.8 Schematic of TSQ Vantage Triple Quadrupole Mass Spectrometer (Thermo Scientific)
Figure 1.9 Scan modes of QqQ mass analyser
Figure 1.10 Typical bottom-up proteomics workflow
Figure 1.11 Selected reaction monitoring technique
Figure 1.12 Schematic diagram of FAIMS separation
Figure 1.13 FAIMS separation by tuning CVs
Figure 1.14 Schematic diagrams of (A) p-FAIMS, (B) c-FAIMS and (C) ultra-FAIMS chip.
Figure 1.15 Side view comparison of standard and modified FAIMS electrodes
Chapter 2
Figure 2.1 Schematic diagram of the sample preparation procedure
Figure 2.2 Strategy for absolute SRM quantitation assay
Chapter 3
Figure 3.1 Spectrum of peptide ALIVLAHSER
Figure 3.2 Workflow of phosphoproteomics analysis of 293T cells
Figure 3.3 (A) Number of phosphopeptides identified in LC-MS/MS per SCX fraction and (B) number
of phosphopeptides identified in LC-FAIMS-MS/MS per CV step
Figure 3.4 Workflow of phosphoproteomics analysis of SUM52
Figure 3.5 Phosphorylation status by LC-MS/MS and LC-FAIMS-MS/MS analyses
Figure 3.6 Overlap between LC-MS/MS and LC-FAIMS-MS/MS analyses
Figure 3.7 Phosphopeptides identified by two enrichment methods
Chapter 4
Figure 4.1 Schematic diagram of sample preparation workflow
Figure 4.2 Well-localized phosphosites identified via LC−MS/MS and LC−FAIMS−MS/MS
Figure 4.3 Unique peptides identified in (A) LC-MS/MS and (B) LC-FAIMS-MS/MS analyses
Figure 4.4 Pie chart showing doubly, multiply-charged peptides in LC-MS/MS and LC-FAIMS-MS/MS
analyses
Figure 4.5 Distribution of 2+ and 3+ ions identified in (A) LC-MS/MS and (B) LC-FAIMS-MS/MS

VII
Figure 4.6 Distribution of identified phosphopeptides in (A) LC-MS/MS and (B) LC-FAIMS-MS/MS
according to fraction and peptide length (number of amino acid residues)
Figure 4.7 (A) Distribution of singly-, doubly- and multiply-phosphorylated peptides. (B) Comparison
of singly-, doubly- and multiply-phosphorylated peptides in LC-MS/MS and LC-FAIMS-MS/MS
Figure 4.8 Distribution of charge states of doubly- and multiply- phosphorylated peptides in (A) LC-
MS/MS analyses and (B) LC-FAIMS-MS/MS analyses
Figure 4.9 Identification of doubly- and multiply-phosphorylated peptides from LC-MS/MS and LC-
FAIMS-MS/MS: (A) doubly-phosphorylated peptides and (B) multiply-phosphorylated peptides
Figure 4.10 Motif analysis of the novel phosphorylation sites in the LC-FAIMS-MS/MS analyses
Figure 4.11 CID mass spectrum of [M+3H]3+ ions of MAPAFLLLLLLWPQGCVSGPpSADpSVpYpTK
Figure 4.12. Histogram showing the quantitation consistency between LC-MS/MS and LC-FAIMS-
MS/MS assays
Figure 4.13 (A) Log2 plot of the ratio of the peptide abundance for SU5402/FGF1 treatments for each
phosphopeptide identified; (B) Log2 plot of the ratio of the peptide abundance ratio for dasatinib/FGF1
treatments for each phosphopeptide identified
Figure 4.14 (A) Log2-log2 plots to visualise SU5402 and dasatinib sensitive phosphosites
Figure 4.15 (A) Motif analysis of phosphorylation sites in FAIMS and non-FAIMS dataset by WebLogo.
(B) Heat map showing proteins and kinases that predicted to phosphorylate substrates in FAIMS and
non-FAIMS dataset
Chapter 5
Figure 5.1 Optimum CV of 2+ ions of substance P
Figure 5.2 Optimum CV of the peptide (A) GTDKcAcSNHEPYFGYSGAFK and (B)
FDEFFSAGcAPGSPR
Figure 5.3 Number of peptides identified across CVs
Figure 5.4 Sequence coverage, protein score, number of peptide and PSM in FAIMS analyses
Figure 5.5 Number of peptides identified in the FAIMS analysis
Figure 5.6 Distribution of peptides identified across CV steps in the FAIMS analyses
Figure 5.7 Box plot of the number of matched ions in the FAIMS analyses
Figure 5.8 Distribution of peptides in the (A) standard and (B) modified FAIMS analysis in replicate 1
Figure 5.9 Distribution of peptides in the (A) standard and (B) modified FAIMS analysis in replicate 2
Figure 5.10 Replicate 1: redundancy rate of the (A) standard and (B) modified FAIMS analysis
Figure 5.11 Replicate 2: redundancy rate of the (A) standard and (B) modified FAIMS analysis
Figure 5.12 Number of times a peptide is identified in the (A) standard and (B) modified FAIMS analysis
Figure 5.13 Charge state distribution in the standard and modified FAIMS analysis
Chapter 6
Figure 6.1 Boxplots of RSDs derived from the 3 technical replicates spectra for 2 independent datasets.
Figure 6.2 Histogram showing the reproducibility of 2 independent biological datasets

VIII
Figure 6.3 Hierarchical clustering of relative phosphorylation profile of key phosphorylation events
during FGF1 stimulation.
Figure 6.4 Hierarchical clustering of relative phosphorylation profile of early response phosphopeptides.
Figure 6.5 Hierarchical clustering of relative phosphorylation profile of mid response phosphopeptides.
Figure 6.6 Hierarchical clustering of relative phosphorylation profile of late response phosphopeptides.
Figure 6.7 Schematic diagram of the logarithm transform approach
Figure 6.8 Calibration curve of phosphopeptides
Figure 6.9 Phosphorylation profile of 2 isobaric phosphopeptides of FGFR2
Figure 6.10Phosphorylation profile of a group phosphopeptides of RSK1
Figure 6.11 Phosphorylation profile of peptide pTPKDSPGIPPSAGAHQLFR (Ser359) of RSK1
Figure 6.12 Phosphorylation profile of peptide TPKDpSPGIPPSANAHQLFR (Ser369) of RSK3
Figure 6.13 Phosphorylation profile of a group of isobaric phosphopeptides of ERK1
Figure 6.14 Phosphorylation profile of a group of phosphopeptides of MAPK2
Figure 6.15 A schematic model for RSK activation
Figure 6.16 Alignment of amino acid sequence in active site of ERK1 and ERK2
Tables
Table 1.1 Summary of the main enrichment methods used in phosphoproteomic studies
Table 1.2 Summary of fractionation methods used in phosphoproteomic studies
Table 1.3 Comparison of the three types of IMS
Table 3.1 Quantitation results of Qual/Quant Mix
Table 3.2 Number of peptides and proteins identified
Table 3.3 Number of peptides and proteins identified
Table 3.4 Number of peptides and proteins identified
Table 3.5 Peptides identified in phosphoenrichment
Table 4.1 Summary of LC-MS/MS and LC-FAIMS-MS/MS analyses
Table 4.2 Summary of quantitation analysis
Table 4.3 Novel phosphosites sensitive to SU5402 or dasatinib
Table 6.1 Overview of selected phosphopeptides for SRM assay
Table 6.2 Early response phosphopeptides
Table 6.3 Mid response phosphopeptides
Table 6.4 Late response phosphopeptides
Table 6.5 Summary of identification results

IX
Abbreviations
CID, collision induced dissociation
CV, compensation voltage
Da, Daltons
DV, dispersion voltage
EGFR, epidermal growth factor receptor
ESI, electrospray ionization
ETD, electron transfer dissociation
FAIMS, field asymmetric ion mobility spectrometry
FGFR, fibroblast growth factor receptor
GRB2, growth-factor-receptor-bound protein 2
IMS, ion mobility spectrometry
IS, internal standard
LC, liquid chromatography
MS/MS, tandem mass spectrometry
PDGF, platelet-derived growth factor receptor
PI3K, phosphoinositide 3-kinase
PLCγ, phospholipase Cγ
PTM, posttranslational modification
QqQ, triple quadrupole mass analyser
Ras/MAPK, rat sarcoma/mitogen-activated protein kinase
RTK, receptor tyrosine kinase
SCX, strong cation exchange
SFK, Src family kinase
SILAC, stable isotope labelling of amino acids in cell culture
S/N signal-to-noise ratio
SOS, Son of Sevenless
SRM, selected reaction monitoring
VEGFR, vascular Endothelial Growth Factor Receptor

1
CHAPTER 1
INTRODUCTION

2
1.1 Overview
Fibroblast growth factor (FGF) ligands and receptors play important roles in the regulation of
cell growth, cell division, angiogenesis and tumour growth. Accumulating evidence
demonstrates that deregulation of FGF signalling is closely related to many human diseases
including cancer. Through phosphorylation and dephosphorylation processes, FGF signalling
is propagated through a series of receptor proteins, scaffolding proteins and signal mediators,
leading to activation of multiple downstream pathways.
Tandem mass spectrometry (MS/MS) combined with pre-fractionation and phosphoenrichment
is a well-established workflow for large-scale quantitative phosphoproteomic analysis. One of
the major challenges in phosphoproteomic research is to map sites of modification in multiply-
phosphorylated peptides. In recent years, ion mobility spectrometry has emerged as an
attractive technique for specific and global proteome profiling. Field asymmetric waveform
ion mobility spectrometry (FAIMS) is a gas phase separation technique based on the
differences in ion mobility in high and low electric fields. Coupled with liquid chromatography
(LC)-MS/MS, FAIMS has been shown to enhance proteomic analyses by extending proteome
coverage, improving signal-to-noise and separating isomeric peptides.
Following the discovery phase provided by a shotgun strategy, a targeted quantitation method
is needed for biological interpretation. For sensitive detection and accurate quantitation of
selected peptides, selected reaction monitoring (SRM) has emerged as the method of choice
that complements the discovery capabilities of shotgun approach. Consistently identified and
precisely quantified data across multiple samples provide the basis for a system biology
interpretation, a requirement that can be achieved by SRM.
The aim of this chapter is to provide background on current research and development in FGF
signalling (section 1.2), an overview of mass spectrometry (section 1.3), proteomics by mass

3
spectrometry (section 1.4) and FAIMS (section 1.5), which forms the basis for the work
presented in this thesis: investigation of the application of FAIMS to increase
phosphoproteomic coverage in FGF signalling (Chapter 4) and the employment of targeted
approaches for accurate quantitation (Chapter 6).
1.2 Fibroblast growth factor (FGF) and FGF signalling
Fibroblast growth factor was first discovered in bovine pituitary extracts by Armelin et al. in
1973 and it was found to introduce the proliferation of fibroblasts1. Over forty years, extensive
research has been carried out in order to reveal the functions of FGF and the signal transduction
of FGF pathway2. It has been shown that FGF and the FGF signalling pathway play diverse
roles in cell division, cell growth and maturation, angiogenesis, wound healing and tumour
growth3. Accumulating evidence suggests the deregulation of FGF signalling has been
associated with many human diseases, including cancer4.
1.2.1 FGFs
FGFs are glycoproteins that bind to cell surface receptors to initiate signalling. The mammalian
FGF family comprises 23 members5. They are structurally related and all share a highly
conserved region of 120 amino acids, which is responsible for the interaction with FGF
receptors2. This conserved region forms 12 anti-parallel β-strands, which fold into a cylindrical
barrel. Many FGFs contain a signal peptide region for secretion into the extracellular
environment.
An important feature of FGF family is that they have a strong affinity for heparin and heparin-
like glycosaminoglycans (HLGAGs). Current understanding holds that the binding to heparin

4
and HLGAGs could protect FGFs from degradation, leading to FGFR dimerization and
subsequent activation of the intracellular kinase domain6. Although not all members are
receptor activating (except FGF11, 12, 13 and 14), or have fibroblast stimulation activities
(FGF-7), they are still clustered as FGF family members as they are structurally related.
Generally, FGFs are secreted glycoproteins that are localized to the extracellular matrix7. Most
FGFs (except FGF1 and FGF2) are produced in endoplasmic reticulum (ER) and utilize the
signal peptide for secretion into extracellular matrix. In order to signal, FGFs are released from
the extracellular matrix and free FGFs can bind with low-affinity receptors, such as heparin.
Heparin can guide FGFs to FGFR and stabilize the ligand-receptor complex. Some FGF
members, such as FGF1 and FGF2, have also been found in nucleus and nucleolus in addition
to their extracellular and transmembrane locations8. FGF1 and FGF2 contain a nuclear
localization signal (NLS), which regulates their translocation of FGFs after internalization.
This provides a novel mechanism for FGF-mediated nuclear events, which are regulated
through a direct interaction with nuclear effectors9.
1.2.2 FGFR
1.2.2.1 Structure
FGFs activate FGF signalling by binding with four tyrosine kinase receptors (FGFR1, FGFR2,
FGFR3 and FGFR4), which are responsible for transmitting the extracellular signal to
cytoplasmic environment. The members of FGFR family are composed of an extracellular
ligand-binding domain, a transmembrane spanning domain, and an intracellular domain
containing a protein tyrosine kinase (TK) core. The extracellular portion contains three
immunoglobulin (Ig)-like domains. The second and third Ig domains interact directly with the
FGF ligand10. The intracellular region possesses a juxtamembrane domain, two tyrosine kinase

5
domains (which are split by a kinase insert sequence) and a C-terminal tail. This protein
structure places FGFR in the Ig superfamily of receptors and the family of receptor tyrosine
kinase (RTK), such as EGFR family (epidermal growth factor receptor), PDGF family
(platelet-derived growth factor receptor)11.
Figure 1.1 Schematic structure of FGFRs (Adapted from Turner et al.12)
FGFR consists of extracellular domain, transmembrane domain and tyrosine kinase (TK) domain. The dotted lines
indicates FGFR in monomer status.
1.2.2.2 FGFR specificity
FGFR isoforms, arising from various alternative splicing events occurring both in the
extracellular and the intracellular domain of receptors, are crucial in modulating ligand-binding
specificity and receptor activity13. Generally, each receptor can be activated by different FGFs
and most of the FGFs can bind with multiple receptors (with the exception of FGF3, 7 and 9
which can bind with one FGFR member). Differences in splice variants in the extracellular
domain are often associated with the specificity of the receptor. For instance, shortened FGFR2

6
splice variants in the C-terminal tail were observed in several cancer cell lines. It was
established that the C-terminal deletion is able to induce conformational changes in the receptor,
leading to accumulated level of the receptor at cell surface and thus enhanced signalling
capacity14.
Also, the spatial and temporal expression patterns of FGF and FGFR are jointly responsible for
regulation of the specificity of the FGF-FGFR interaction15. For instance, the FGFR IIIb and
FGFR IIIc splice isoforms in Ig-like domain III are regulated in a tissue-specific manner. The
FGFR IIIb isoform is expressed exclusively in epithelial tissues and the FGFR IIIc isoform is
preferentially expressed in mesenchymal tissues16.
1.2.2.3 Phosphorylation of receptor
Receptor tyrosine kinase (RTK) represents a family of cell-surface proteins that can be
activated by ligands in cell signalling processes. Like other RTKs, the intracellular tyrosine
domain of FGFR catalyses autophosphorylation of the receptor itself and phosphorylation of
RTK substrates (see Figure 1.2). For FGFR, this was first suggested by the finding that an
elevated expression level of tyrosine phosphorylation was observed upon FGF-1 and FGF-2
stimulation in 3T3 fibroblasts, by Western blot using phosphotyrosine antibody17. FGF
stimulation is able to induce an immediate response in phosphorylation of the receptor and
tyrosine phosphorylation of FGFR was found to occur within 30 seconds of FGF stimulation18.
In FGFR1, seven phosphotyrosine sites have been identified in the cytoplasmic domain
(Figure1.2): Y463 in juxtamembrane (JM) domain, Y583 and Y585 in the kinase insert (KI)
domain, Y653 and Y654 in the activation loop of the second tyrosine kinase domain19, Y730
and Y766 in the C-terminal tail20. The activation of FGFR1 has been described as a temporal
phosphorylation mechanism occurring in the intracellular domain21. Of these seven tyrosine

7
sites, the phosphorylation of Y653 serves as the initiation reaction, which activates the kinase
by 50-100 fold, and the phosphorylation of Y654 can increase kinase activity by up to 500-
1000 fold. Followed by the activation of two tyrosine sites in the activation loop,
juxtamembrane region Y463, kinase insert Y586/Y588, and in the C-terminal region Y769 are
also phosphorylated to promote further receptor activation or serve as the recruitment site for
downstream signalling proteins.
Figure 1.2 Structure and phosphorylation sites of FGFR1
FGFR1 comprises an extracellular domain, a transmembrane domain (TM) and a cytoplasmic domain. Signal
peptide (SP) sits in N-terminal. There are 2 or 3 Ig-like domains in the extracellular domain. The acid box (AB)
locates between Ig-I and Ig-II. Heparin binding domain is in Ig-II. Followed by juxtamembrane domain (JM) are
two tyrosine kinase (TK) subdomains, including a nuclear binding domain (NB) and a short kinase insert (KI).
Seven tyrosine phosphorylation sites have been identified so far: Tyr463 in JM, Tyr582 and Tyr585 in KI, Tyr653
and Tyr654 in TK2, Tyr730 and Tyr766 in C-terminal tail.
1.2.3 FGF signalling
1.2.3.1 Activation of FGF signalling
The FGF signalling is a typical RTK-induced signalling cascade (see Figure 1.3). The FGFs
exert their biological functions through the binding with Ig-like domain (II and III) of FGFR,
with the assistance of heparin22. Binding of FGFs to receptors induces dimerization of the
receptors, which will cause a conformational shift in the intracellular domain of the receptor.
In contrast to the non-dimerized form, the conformational change opens the kinase domain for
ATP binding. It activates FGFR and leads to trans-autophosphorylation reaction in the receptor,
where phosphorylation occurs through the other kinase in the dimer. Following
phosphorylation in the activation loop (e.g. Y653 and Y654 in FGFR1), the activated FGFR is
capable of catalysing the phosphorylation of multiple tyrosine residues in the kinase domain.

8
The phosphorylated tyrosine residues on the receptor can function as regulation sites or docking
sites for adaptor proteins. FGFR substrate 2 (FRS2), a key adapter protein in FGF signalling,
are recruited to the FGF-FGFR complex in this step23. FRS2 binds with the juxtamembrane
region of FGFR. The recruitment of FRS2 initiates the phosphorylation of itself and FRS2 can
further recruit downstream molecules and adaptor proteins via phosphorylation events.
Figure 1.3 FGFR signalling network (Adapted from Turner and Grose12)
Upon ligand binding, FGFRs at plasma membrane dimerise and trans-autophosphorylate, thus triggering series of
phosphorylation and dephosphorylation events in various signalling proteins.
Phosphorylation events hold the key to understand the signalling events downstream of FGFR.
For instance, phosphorylation of the active sites of kinases often significantly alter the binding
capacity for substrates24. At the next level, specificity is regulated by the interaction between
the docking motif of the substrate and the kinase. In some cases, recruitment of substrates to
kinases require phosphorylation of an adjacent or distant residue from the active site25.
One of the most widely accepted models for FGF signal transduction is the diffusion-based
model (also termed canonical model)26. It proposes the receptors are monomers in the absence
9
of ligands, and dimerise and trans-phosphorylated each other upon ligand binding. The other
model postulates that FGF receptors form dimers even in the absence of ligands, but ligand
binding triggers the structural changes of the dimers and significantly increases FGFR
phosphorylation. Also, different ligand binding (e.g. FGF1 and FGF2) can cause different
effects on the receptor structure, therefore induce specific biological responses27.
1.2.3.2 Downstream of FGF signalling
The main downstream pathways of FGF signalling include the Ras/MAPK (rat sarcoma
mitogen-activated protein kinase) pathway whose activation is mediated by growth-factor-
receptor-bound protein 2 (GRB2) and Son of Sevenless (SOS), the PI3K (phosphoinositide 3-
kinase)/AKT pathway activated by GRB2, and the Src pathway that initiated directly by
FRS228–30. In addition, instead of propagating the signal through FRS2, the tyrosine site (e.g.
Y766 in FGFR1) in the kinase domain of FGFR can directly act as the recruiting site for PLCγ
(phospholipase Cγ), leading to the recruitment of more partner proteins. These signalling
cascades form a complex network, which regulates a wide array of biological processes and
also mediates the FGF signal transduction by regulation of phosphorylation of downstream
signalling molecules.
In humans, the activation of the Ras/MAPK pathway is a highly conserved mechanism in
response to FGFs, while activation of other downstream pathways is subject to cell type or
tissue. The maintenance of certain levels of phosphorylation of Ras and MAPKs is critical to
enable phosphorylation of target substrates. A number of inhibitors, targeting upstream
proteins (e.g. FGFRs or Ras), were developed to block the activation of Ras/MAPK pathway.
Another complex activated through GRB2 is the PI3K/AKT pathway, which further activates
AKT-dependent anti-apoptotic pathway. The PI3K/AKT pathway also responds to a wide

10
variety of stimuli, such as RTKs, B/T cell receptors, integrin, G-protein-coupled receptors and
other receptors that catalyse the production of phosphatidylinositol (3,4,5) trisphosphate (PIP3)
by PI3K31. Downstream effects of AKT are primarily associated with the regulation of cell
cycle, cell survival and metabolism via mTOR pathway32.
Non receptor Src family kinases (SFKs) are regulators of FGF signalling33. Of Src family, Src,
Fyn and Yes are found universally expressed in human cells while other members are expressed
in specific tissues or particular development stages. In addition to FGF signalling, SFKs are
involved in signalling by many RTKs, including PDGF receptor (PDGF-R)34, epidermal
growth factor receptor (EGFR)35 and insulin-like growth factor-1 receptor (IGF-1R)36. Their
participation is particularly important in the regulation of DNA synthesis and endocytosis. It
has been shown the elevated levels of dephosphorylation of Tyr527 in Src, which has been
detected in various cell lines, transforms Src to become abnormally active.
An important aspect of FGFR-induced cellular events is through PLCγ-mediated mitogenesis.
Activation of PLCγ is through direct binding to a conserved phosphotyrosine residue in C-
terminal tail of FGFR37. PLC then hydrolyses phosphotidylinositol-4,5-diphosphate to
inositol-1,4,5-trisphosphate (IP3) and diacylglycerol (DAG). IP3 stimulates intracellular
calcium release, while DAG activates protein kinase C (PKC)38.
1.2.4 FGF signalling and cancer
1.2.4.1 Current understanding of FGF signalling and cancer
FGFR2 has been extensively examined in its relationship with breast, gastric and bladder
cancer 39–42. The FGFR2 gene is located on human chromosome 10 and it encodes FGFR2
protein which shares highly conservative sequence with the FGFR family members. Due to

11
splicing of the third Ig-like domain, there are two natural isoforms of FGFR2: FGFR2IIIb and
FGFR2IIIc. The IIIb isoform is expressed exclusively in epithelial tissue and the IIIc isoform
is preferentially expressed in mesenchymal tissue. Triple-negative breast cancer (TNBC) cell
lines, for example SUM52 and MFM223, show FGFR2 amplification. FGFR2 amplifications
have also been described in approximately 3% -10% of primary gastric cancers patients and
usually associated with the poor prognosis and low survival rate43. Decreased levels of FGFR2-
IIIb have also been reported in a number of bladder cancer cases, which suggests the potential
role of FGFR2 as a tumour suppressor in bladder carcinomas44,45.
A genome-wide association study (GWAS) has identified several SNPs (single nucleotide
polymorphism) in FGFR family as novel breast cancer susceptibility loci46. Eight SNPs located
in intron 2 of FGFR2 have attracted extensive attention. They change binding affinity of
transcription factors directly downstream of FGFR47. A SNP in FGFR4 has been shown to
contribute to more aggressive behaviour and poor prognosis in several types of cancer,
including breast cancer48.
Mutated FGFRs have also been found to be associated with several developmental syndromes,
including cancer49. Mutations in cytoplasmic and tyrosine kinase domain of FGFR1 and
FGFR2 have been discovered in endometrial cancer, which alter the ligand specificity and
kinase activity respectively50. In some circumstances, mutation can cause loss-of-function51.
As a result of gene splicing, novel splice variants of FGF family are identified to be associated
with cancer. For example, an FGFR2 variant with a shortened C-terminus has been identified
in several cancer cell lines. The study of rat osteosarcoma cell line has shown the alteration of
C-terminus resulted from the fusion of FGFR2 to a novel protein due to chromosomal
rearrangement. The fusion protein acts as dimer leading to the autophosphorylation of tyrosine
domain. Therefore this protein can cause continuous signalling in the absence of FGFs and
thus enhanced signalling capacity52.
12
1.2.4.2 Therapeutic development
Upstream intervention of FGF signalling primarily involves inhibiting ligand-receptor binding.
FGF ligand traps (e.g. FP1039), a fusion protein comprised of the extracellular domain of
FGFR fused with the Fc region of IgG, was developed and is being tested for clinical
application53. Another approach to inhibit ligand binding is to use peptide mimics, which is
particularly useful for patients with FGFR amplification54.
A number of tyrosine kinase inhibitors targeting FGFR activity are in early clinical
development. These inhibitors are multi-targeting ATP-competitive inhibitors. As kinase
domains of RTKs are similar in structure, these inhibitors are not specific and activity of
VEGFRs and PDGFRs could also be affected51. Dovitinib is a potent TKI with anti-angiogenic
activity through the inhibition of FGFR, VEGFR, and PDGFR. Dovitinib is in phase II clinical
trials for advanced breast and endometrial cancers and phase III clinical trial for renal cell
carcinoma. The second generation inhibitors target FGFRs with selectivity over other kinases.
For example, AZD 4547 shows affinity with FGFRs approximately 120-fold higher than
VEGFRs. AZD4547 is in phase II clinical trial for breast cancer55. SU5402 is one of the
compounds that have been designed as FGFR specific inhibitors56. SU5402 occupies the same
region in FGFRs as ATP to inhibit FGFR tyrosine phosphorylation and does not affect kinase
activity of VEGFRs and PDGFRs. It should be noted that the selective inhibitors also exhibits
toxicities, including hypertension, cardiovascular events and some FGFR-specific toxicities57.
The development of specific toxicity management protocols is required and a few projects are
on the way58. Monoclonal antibodies are an alternative to avoid the side effects of multi-
targeting inhibitors. Antibodies targeting FGFR1-IIIc and FGFR3 are in preclinical
development55.

13
Proteins downstream of FGFRs also participate in multiple signalling, therefore it is difficult
to target them to inhibit FGF signalling. Thus, targeting downstream effectors is aiming at more
specific processes or pathways. In this thesis, to inhibit Src family kinase, dasatinib is used.
Dasatinib is a small molecule inhibitor of Src and Abl proteins and has already been used in
treatment of imatinib refractory chronic myelogenous leukemia (CML)59. It is not clear whether
it can be used as breast tumour suppressor, but its association with FGF signalling has made it
promising for clinical trial for breast cancer patients.
Figure 1.4 Chemical structures of (A) SU5402 and (B) dasatinib
Previous studies have provided a valid rationale to further explore the potency of FGFR-
targeting drugs in their targeting specificity, toxicity and anti-tumour activity. Although the
most effective anti-tumour activity was observed with multi-targeting kinase inhibitors,
selective inhibitors present less toxicity and non-FGF related problems. In addition to small
molecule inhibitor, the application of small interfering RNAs, the combination of FGFR and
other kinase inhibitors has shown preliminary progress in targeting specific FGFR events60.
1.2.4.3 Future prospects
Progress is being made in understanding the association between FGF signalling and
development of cancer, and therapeutic strategy, e.g. key signalling molecules responsible for
cancer pathogenesis and progression, response of FGF signalling to chemotherapy and

14
development of FGFR inhibitor in combination with conventional therapies. However, this is
still the early phase of understanding of how FGF signalling can be targeted in development of
cancer. Understanding the mechanism underlying intracellular responses induced by FGF
signalling requires knowledge of receptor activation, signal transduction cascades and the
downstream regulation of gene expression, which are modulated by phosphorylation and
dephosphorylation at different levels.
Functional interpretation of these phosphorylation events requires detailed analysis of specific
residues or combinations of residues. Much attention has been focused on individual residues
and multiple/combinatorial phosphorylation events have attracted less attention because it is
harder to identify these peptides. Current understanding suggests that it is more challenging to
detect doubly- and multiply-phosphorylated peptides than singly-phosphorylated peptides due
to their low stoichiometry and poor binding ability to chromatographic columns. Whereas,
deciphering the mechanisms of FGFR signalling requires knowledge of multiply-
phosphorylated peptides as the adjacent phosphosites may play regulatory roles. Thus, one of
the major challenges in intracellular cell signalling research is to map sites of modification in
multiply-phosphorylated peptides.
Liquid chromatography coupled with tandem mass spectrometry, combined with pre-
fractionation and phosphoenrichment is a well-established workflow for large-scale
quantitative phosphoproteomic analysis61. Although progress has been made, low
phosphoproteome coverage, limited dynamic range and co-elution of peptide isomers still
remain a challenge. With the development in phosphopeptide enrichment protocols, liquid
chromatography, combinations of MS/MS approaches and development of novel data handling
software, a more profound understanding of FGF signalling and its role in cancer development
will emerge.

15
1.3 Mass spectrometry
Mass spectrometry (MS) is an analytical technique that enables identification and quantitation
of molecules by their measuring mass-to-charge ratio (m/z)62. As it is a sensitive technique that
offers both low detection limits and high mass accuracy, mass spectrometry is an invaluable
tool for study in a range of fields, including organic chemistry, proteomics, metabolomics and
clinical testing etc. In addition, high throughput analysis is possible by mass spectrometry63.
In mass spectrometric analysis, samples are ionised and subject to gas phase environment for
separation based on m/z values. Tandem mass spectrometry (MS/MS) technique allows the
multiple stages of isolation and fragmentation in time and space. Charged ions (termed
precursor ions) are isolated according to their m/z values, typically by subjecting them and
accelerating them into an electric field. Therefore, the isolation and fragmentation of the
precursor ions occurs in multiple stages. MS/MS results will be displayed in spectra with the
relative abundance of detected fragment ions and a function of the m/z ratio. Mass
spectrometers comprise three parts: an ion source that ionizes the sample, mass analyser that
separates ions based on m/z ratios and detector that records the signal. Modern mass
spectrometers have undergone immense technological innovations during recent decades
allowing for applications in analyses of drugs, peptides, proteins, carbohydrates, DNA and
many other biologically relevant molecules64–66. Separation techniques combined with mass
spectrometry have been widely used to enhance resolving power in the analysis of complex
samples. Increasing application of mass spectrometry to complex biological samples has driven
data analysis software development. In the following text, instrumentations and applications of
mass spectrometry will be introduced in more detail.
16
1.3.1 Ionization
The ionization process enables molecules to acquire a negative or positive charge through
interactions with chemicals, light or electrons. The earliest ionization techniques were electron
ionization (EI)67 and chemical ionisation (CI)68, which tend to induce fragmentation thus
limiting formation of stable molecular ions. These two techniques are primarily used in the
analysis of organic molecules. Fast atom bombardment (FAB) is a soft ionization technique,
which yield little or no fragmentation, thus allowing the analysis of molecules larger than
25,000 Da. It uses a beam of high energy atoms to desorb ions from a surface69. When highly
energetic ions are used instead of atoms, this method is also known as liquid secondary ion
mass spectrometry (LSIMS)70. More recent techniques, matrix-assisted laser desorption
ionization (MALDI)71 and electrospray ionization (ESI)72 are also soft ionization techniques,
similar to FAB. The key feature of MALDI is the use of a matrix to assist desorption. Prior to
MALDI ionization, the sample is mixed with an organic matrix on a metal plate. The mixture
is dried and the matrix co-crystallised with the sample. A laser beam at a specific wavelength
is then directed at the sample-matrix mixture, causing the matrix to absorb energy, which
enables protons to be transferred from matrix to the sample and ionise the sample. In 2002, the
developers of MALDI (Koichi Tanaka) and ESI (John Fenn) were awarded Nobel Prize in
Chemistry ‘for their development of soft ionization methods for mass spectrometric analyses
of biological macromolecules’. Currently, MALDI is routinely used in tissue imaging and
identification of a wide variety of analytes in tissues73.
ESI is suitable for both organic and biological molecules and was used in the work presented
herein. In ESI, samples are usually dissolved in a mixture containing volatile organic solvents
(e.g. methanol or acetonitrile) and an acidic buffer. Typically, the sample will go through three
major stages. First, the sample solution becomes charged when passing through a thin metal
capillary at a certain voltage. Second, as the surface tension of the droplet overcome the

17
electrostatic repulsion, the charged droplets become unstable when Rayleigh limits is reached,
leading to evaporation of solvent from the charged droplets and formation of decreasing
charged droplets. There are two main models describing the third stage of ESI process (see
Figure 1.5): the charge residue model (CRM)74 and the ion evaporation model (IEM)75. The
CRM model suggests as the remaining solvent evaporates, the gas phase ions are produced as
the size of the droplet decreases into a droplet containing only one macromolecule. The IEM
model proposes that as the droplet decreases to a radius of 10 nM, the strength at the surface
of the droplet can assist the field desorption and allow the formation of gas phase ions. The
exact mechanism of ESI is still under debate. However, there is a consensus among scientists
that a combination of these two models occur during ESI.
ESI is able to preserve multiply charged ions, facilitating the identification of large molecules.
Due to multiple charging, the m/z values of multiple charged ions become lower and fall into
the mass range of common mass analysers. Thus, analysis of protein and macromolecules is
made possible by applying ESI in modern mass spectrometer.
Figure 1.5 Electrospray ionisation: the proposed model of CRM and IEM、

18
1.3.2 Mass analysers
Once in the gas phase, ions are transferred to the mass analyser for isolation or/and separation
based on m/z values. Several types of mass analysers that utilise different mechanisms to
separate ions, either by static or dynamic electric or/and magnetic fields or in combination,
have been developed. There are three main classes of mass analyser. One type of mass analyser
separates ions in space according to their m/z values, i.e., the time-of-flight (TOF)76 analyser.
Another type of mass analyser scans for a particular m/z value while removing all the other
ions, such as the quadrupole mass analyser77. Thirdly, mass analysers can measure the resonant
oscillations of ions in electric/magnetic fields, such as the linear ion trap78, 3D ion trap79,
Fourier transform ion cyclotron resonance (FTICR)80 and orbitrap81 mass analyser. The mass
analysers which have been employed in this work are the dual-pressure linear ion trap, the
Orbitrap mass analyser and the triple-quadrupole mass analyser and a detailed introduction is
given in Section 1.3.4.1 and 1.3.4.2.
1.3.3 Tandem mass spectrometry
Tandem mass spectrometry (MS/MS) enables characterisation of the structure of an analyte,
and is especially useful in the analysis of peptides, intact proteins and post-translational
modifications. In mass spectrometry-based proteomic analyses, MS/MS of a peptide provides
information on peptide sequence and structure. There are different fragmentation techniques
available. The most commonly used are collision induced dissociation (CID)82,83, electron
capture dissociation (ECD)84 and electron transfer dissociation (ETD)85. CID and ETD are the
most widely used fragmentation techniques in proteomics and solely used in this thesis, and
therefore are discussed further below.

19
1.3.3.1 Collision induced dissociation
In CID (also referred to as collision activated dissociation, CAD), precursor ions are
accelerated by electric potentials to high kinetic energy and collided with inert gas (typically
helium, nitrogen or argon). During the collision, a certain amount of kinetic energy is converted
into internal energy resulting in bond breakage and fragmentation of molecules. The mobile
proton model proposed by Gaskell and Wysocki best describes the mechanism of CID
fragmentation on peptides and proteins86,87. The model proposes that a proton is mobile
between various protonation sites and the actual fragmentation site is the result of competition
between various fragmentation pathways. The energy required for proton mobility depends on
gas-phase basicity of the group. The proton is preferentially mobilised to N-terminal or basic
site, e.g. lysine or arginine, over non-basic amino acid, leading to charge-directed
fragmentation. Therefore, as the proton migrates to amide nitrogen, which leads to weakening
of the amide bond and makes the adjacent carbonyl group susceptible to attack, peptides tend
to undergo N-Co breakage along the peptide backbone, which produces a series of b and y
fragment ions (Figure 1.6)88,89.
Figure 1.6 Dissociation products of protonated peptides
CID produces b and y type anions by heterolytic amide bond breakage. ETD and ECD produces c and z type ions
by homolytic bond cleavage.

20
1.3.3.2 Electron transfer dissociation
ETD induces fragmentation by transferring electrons to positively charged precursor ions to
induce specific N-Cα breakage along the peptide backbone, while the side chains and peptide
modifications are left intact85,90. The ETD radical anions (e.g. anthracene or fluoranthene) are
required as strong bases or/and reagents for proton abstraction.
The ETD fragmentation mechanism can be described by the Utah-Washington mechanism,
developed independently by two groups91,92. In a peptide, the electron attachment to amide π*
orbital makes it a strong base with a strong affinity to protons. The amide group is then able to
participate in proton abstraction, leading to the breakage of N-Cα bond and generation of c and
z ions, as shown in Figure 1.7. The proton abstraction is where the two mechanisms differ. The
Washington mechanism proposes the initial electron capture takes place at a charge site.
However, the Utah mechanism suggests that capture occurs directly in a stabilised orbital (S-S
σ* or amide π* orbital), leading to peptide fragmentation.
ETD has been seen as a complementary technique to CID fragmentation, as ETD (a) favours
fragmentation of large peptides and intact proteins, and (b) is able to preserve labile PTMs on
backbone fragments for PTM characterisation. Combinations of CID and ETD fragmentation
and alternating CID/ETD fragmentation methods both proved to improve sequence coverage
and PTM identification than individual CID and ETD fragmentation alone93.

21
1.3.4 Hybrid instruments
1.3.4.1 Hybrid Orbitrap mass spectrometer
The LTQ Orbitrap Velos ETD mass spectrometer is a hybrid mass spectrometer comprising a
dual-pressure linear ion trap (the linear trap quadrupole, LTQ) and the Orbitrap analyser94.
Figure1.8 shows the schematic diagram of an LTQ Orbitrap Velos ETD mass spectrometer.
The LTQ is used for for ion trapping, ion selection, ion fragmentation and low resolution
scanning. In the LTQ, ions are trapped (and fragmented) in the first ion trap with high gas
(helium) pressure (-5×10⁻³ Torr) before passed to the second ion trap with low gas pressure (-
4×10⁻⁴ Torr) for fast scanning. The LTQ comprises linear ion traps (LIT) which create two
dimensional (2-D) quadrupole fields95. The 2-D ion trap uses an oscillating field (radio
frequency field, RF field) to trap ions radially and a static electric field applied to the tip of the
rods to trap ions axially in two dimensions. A 2-D ion trap comprises of four parallel electrode
rods and an opposite electrical potential applied to the end electrodes with the same polarity.
In the 2-D trap, the ions collide with inert gas and travel along the z axis through the centre of
rods owing to the application of a balanced dipolar field. In the xy plane, the ions are oscillated
due to a RF potential on the rods. The application of DC voltage to the rods allows the ions to
be trapped. Within an LIT, ions can be ejected between the rods and the exit lens either axially
or radially by applying an AC voltage. The toroidal shape of the ion trap increases the ion
trapping capacity, as well as increased the scanning speed.

22
Figure 1.7 Schematic of LTQ Orbitrap Velos ETD mass spectrometer (Adapted from Thermo Scientific)
Based on Thermo Scientific, 2009. It comprises of an ion guide for collimating ion beam and enhancing ion transmission; a dual-pressure ion trap, which isolates ions according
to m/z value and fragment ions; an Orbitrap mass analyser coupled with a C-trap and HCD collision cell for high-resolution MS scan and HCD fragmentation; and an ETD unit
that provides ETD fragmentation.

23
Developed by Makarov in 199681, Orbitrap mass analyser is the modification of ion trap, which
is made of an electrically isolated barrel-like outer cylindrical electrode and a spindle-shape
inner electrode (see Figure 1.7). In Orbitrap, ions are ejected tangentially into the interstice
while an electrostatic voltage is applied to the inner electrode and the outer electrode is at the
ground potential. As ions enter the trap, they start to oscillate around the inner electrode under
the electrostatic attraction. Due to properties of quadro-logarithmic potential, ion motion in the
axial direction is harmonic. To stabilize the ions in a stable spiral radius around the inner
electrode and to prevent unwanted collisions with the outer electrode, the potential of inner
electrode is set at around -3200 V for positive ions to provide kinetic energy. The axial
frequency (w) of ion oscillation can be described as:
q: total charge; m: ion mass; k: force constant of the potential
This equation shows the axial frequency is dependent on the m/q ratio. Therefore, ions of
different m/z ratios will oscillate along the inner electrode at a specific frequency. The image
current induced by the oscillating ions can be detected on the outer electrode and converted to
frequencies and intensities by Fourier transform algorithm, yielding the mass spectrum.
LTQ and Orbitrap work in parallel in data dependent acquisition: Orbitrap is performing MS1
scan while LTQ is isolating and fragmenting ions detected in MS1 spectrum. This combination
allows for acquirement of high resolution MS spectra with excellent mass accuracy in the
Orbitrap and rapid MS/MS scan (several Hz) in the ion trap. A pre-defined number of precursor
ions will be selected according to their abundance and reported back to LTQ for selection and
fragmentation. MS/MS scan can be acquired in either CID or ETD mode in LTQ. In addition,
HCD fragmentation is introduced in HCD collision cell to overcome the drawback of low mass

24
resolution and accuracy when performing fragmentation of LTQ. For highly complex samples,
the high resolution of hybrid LTQ/Orbitrap instrument maximizes the number of ions analysed,
which is particularly advantageous for bottom-up proteomic analysis. Initial reports showed
the resolution of Orbitrap spectrum can achieve 60,000 at m/z in 1 second of scan time and the
increases of resolution are proportional to the allowed scan time and inversely proportional to
the square root of m/z values. In proteomics, these features make it ideal for analysis of intact
protein, complex peptide mixtures and their PTMs. Coupled with nanoLC and electrospray,
LTQ Orbitrap is one of the most commonly used mass spectrometers in large scale proteomics
analysis. The LTQ Orbitrap Velos mass spectrometer was used in Chapter 3 and 4; LTQ
Orbitrap Elite mass spectrometer was used in Chapter 5.
1.3.4.2 Triple-quadrupole mass spectrometer
TSQ Vantage Triple Quadrupole Mass Spectrometer (referred to as QqQ in the thesis),
introduced by Thermo Scientific, is a triple quadrupole (QqQ) mass spectrometer featuring a
QqQ mass analyser. QqQ mass analyser primarily used in study of drug metabolism,
environmental studies and targeted proteomic quantitation96.
QqQ analyser is made of four cylindrical or hyperbolic rods in parallel97. In a quadrupole, ions
are separated based on the stability of their trajectories in oscillating electric fields which are
applied to the rods. Each rods pair is connected electrically. Paul and Steinwegen described the
principle of the quadrupole98.
φ represents the potential applied to the rods, w is the angular frequency, U is the DC voltage and V is the
amplitude of RF voltage.

25
Ions travelling between the quadrupole rods are subjected to a RF field superposed on a
constant field (DC voltage) that is applied to one pair of the rods or the other. The principle of
ion motion in a quadrupole field can be described by Mathieu equation:
u represents x, y and z coordinates, au and qu are dimensionless trapping parameters, and ζ is a dimensionless
trapping parameter equal to Ωt/2 (Ω is frequency and time).
While travelling along the z axis, ions are also exposed to x and y accelerations induced by the
electric field:
φ the quadrupolar potential:
Thus, we can deduce:
Both U and V are constant for a given quadrupole instrument. Thus, each ion has a specific au
and qu, resulting in the difference in field influence. At a given ratio of voltages, only the ions
of a certain m/z value are allowed to travel through the poles and reach the detector. By varying
the applied DC voltage, selection of ions within a particular m/z window can be achieved.
In this thesis, QqQ mass spectrometer was used predominantly in Chapter 6 in selected reaction
monitoring (SRM)99 mode. Figure 1.8 shows the schematic design of the QqQ mass
spectrometer. Ions are focused into the instrument via the S-Lens, through quadrupoles and

26
reached the channel electron multiplier (CEM) for detection. QqQ analyser is comprised of
three quadrupoles: Q1 and Q3 act as mass filters and Q2 is the collision cell.
Figure 1.8 Schematic of TSQ Vantage Triple Quadrupole Mass Spectrometer (Thermo Scientific)
Based on Thermo Scientific, 2009. It comprises of an S-lens, an ion guide for collimating ion beam and enhancing
ion transmission; a quadrupole mass filter (Q1), which filters ions according to m/z value; a collision cell for
fragmentation of selected ions; and a linear ion trap that can also function as a mass filter.
The design of QqQ analyser allows the mass analysis to happen in a sequential manner100. QqQ
analyser can operate in full scan mode, product ion mode, precursor ion mode and neutral loss
mode etc, as shown in Figure 1.9. In full scan mode, Q1 and Q3 quadrupoles are set to scan the
full mass range, which is used to detect unknown products in a sample. Product ion scan mode
selects a particular ion, passes it into Q2 for fragmentation and full mass range of fragment
ions is scanned in Q3. SRM scan mode has two stages of mass selection. Q1 quadrupole is
responsible for filtering the precursor ions according to their m/z ratio. Q2 acts as collision cell

27
and Q3 is then set to filter the pre-set fragment ions, allowing only the selected fragment ions
to reach detector. If Q1 or Q3 is set to scan more than a single mass, this method is referred to
multiple reaction monitoring (MRM).
Figure 1.9 Scan modes of QqQ mass analyser
1.4 Proteomics by mass spectrometry
Proteomics is an established field focusing on study of proteins hugely aided by the
development of mass spectrometry. Proteomics aims to understand the molecular mechanism
of biological processes and diseases from the study of peptide or protein structure, expression,
protein-protein interaction and post-translational modification etc101.
There are two complementary strategies in MS-based proteomics: bottom-up and top-down 102.
The bottom-up approach focuses on MS/MS analysis of tryptic digested peptides for protein
identification. This approach usually requires pre-separation prior to MS analysis, such as high
performance liquid chromatography (HPLC). The peptide sequence identified in the bottom-

28
up analysis can be searched against protein databases and limited sequence coverage is required
for unambiguous identification. An alternative approach is top-down, which analyses intact
proteins without proteolytic digestion and preserves the labile structural characteristics which
are likely to be destroyed in bottom-up strategy. However, the application of top-down
approach is limited to certain types of proteins and instruments and is faced with technical
challenges such as electrospray efficiency, instrument sensitivity and detection limit.
Proteomic profiling of a biological process or cellular network is typically achieved by bottom-
up approaches. Especially within the last decade, owing to technological advances the scale of
our understanding has been expanded with great accuracy and depth, from identification and
structure of proteins to creation of a comprehensive proteomic network. Subsequently, to
determine the candidate arising from discovery experiment, a targeted quantitation method is
required. Selected reaction monitoring (SRM, also known as MRM, multiple reaction
monitoring) has emerged as the method of choice103. This method is well-established for
quantitative MS/MS analysis, offering high selectivity and high-throughput ability. SRM has
been applied in small molecules quantitation for several decades104. More recently, researchers
employed SRM approach in environmental compounds, drug metabolites and it is being
increasingly applied in peptide quantitation in complex biological samples.
1.4.1 Bottom-up proteomics workflow
1.4.1.2 Bottom-up proteomics workflow
Complex samples, such as whole cell lysate and protein complexes, often require pre-
separation prior to LC-MS/MS analysis in bottom-up approach. Coupled with high scanning
speed of mass spectrometry, this approach is able to recover hundreds to thousands of peptides
29
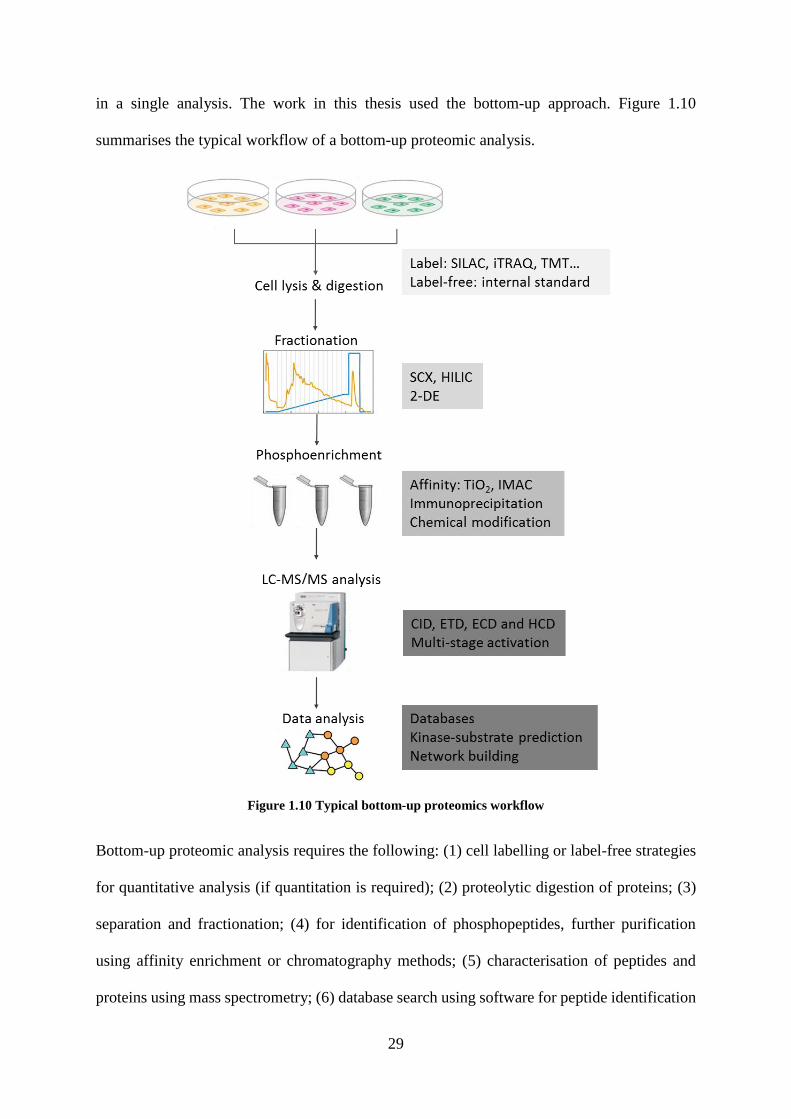
in a single analysis. The work in this thesis used the bottom-up approach. Figure 1.10
summarises the typical workflow of a bottom-up proteomic analysis.
Figure 1.10 Typical bottom-up proteomics workflow
Bottom-up proteomic analysis requires the following: (1) cell labelling or label-free strategies
for quantitative analysis (if quantitation is required); (2) proteolytic digestion of proteins; (3)
separation and fractionation; (4) for identification of phosphopeptides, further purification
using affinity enrichment or chromatography methods; (5) characterisation of peptides and
proteins using mass spectrometry; (6) database search using software for peptide identification
30
and site specific identification. The development and application of these aspects are discussed
in detail in the following sections.
1.4.1.3 Data scan mode
The extreme complexity of biological samples typically requires mass spectrometers with
faster scanning speeds, better resolution and broader dynamic range. Traditionally MS/MS data
are acquired through data-dependent acquisition (DDA) mode, where a full mass spectrum
dictates which peptide ions are selected for fragmentation. Data-independent acquisition (DIA)
performed fragmentation on all peptides in a defined m/z window, and this process can be
repeated to map the desired m/z range. This approach is not biased towards the peptides with
the strongest signal and has been proved efficient in the identification of low abundance
precursors, with at least 5-fold increase in precursor selectivity105.
Another research area that attracts attention is ion mobility mass spectrometry (IMS). IMS is a
gas phase separation technique that can either be used prior to MS detection or as an integrated
part of mass spectrometer. Drift tube IMS, travelling wave IMS and differential IMS have been
applied as an additional dimension of separation/fractionation technique and have shown
potential in enhancing separation/identification.
1.4.2 Phosphoproteomics by mass spectrometry
Phosphoproteomics is a branch of proteomics that focuses on identification and quantitation of
specific and global phosphorylation events. As the most common mechanism of regulation of
protein function and signal transduction, the interpretation of protein phosphorylation in the
context of human diseases is an area of intense research106. Phosphorylation has been
extensively investigated with small-scale protein approaches (e.g. immuno-detection and

31
kinase activity assays) and high throughput mass spectrometry approaches. Developments in
enrichment strategies, sample labelling methods, and mass spectrometry methods have all
contributed to the rapid progress of phosphoproteomics in recent years107.
1.4.2.1 Enrichment and fractionation
Efficient isolation of phosphopeptides from a complex biological mixture, e.g. whole cell lysate
or serum, is the initial step in phosphoproteomics analysis. Currently, the immunoaffinity-
based approach is the most commonly used methods for phosphopeptide and phosphoprotein
enrichment108. Table 1.1 summarises the main methods used in phosphoproteomic studies.
Incorporation of additional reagents, such as citric acid109 and aliphatic hydroxy acid110 in
enrichment protocols has been shown to enhance enrichment efficiency, especially for multiply
phosphorylated peptides. The former has been used in the work presented here. New affinity
materials (e.g. TiO2, Fe2O3111 and SiO2
112) that exhibit complementary enrichment
performance are being used in combination in phosphoproteomic studies.
Table 1.1 Summary of the classic enrichment methods used in phosphoproteomic studies
(Adapted from Thingholm et al.108)
Name Principle Reference Immunoprecipitation (IP)
Isolation of phosphoproteins by binding to
antibodies (e.g. anti-phosphotyrosine
antibodies)
113
Immobilised Metal ion
Affinity Chromatography
(IMAC)
Purifying phosphoproteins and
phosphopeptides from complex samples by
their affinity toward positively charged metal
ions (Fe3+ or Al3+ )
114
Titanium dioxide (TiO2)
chromatography
Highly selective enrichment of
phosphopeptides from complex samples by
their affinity toward TiO2-coated beads
packed in a micro-column
115
Sequential elution from
IMAC (SIMAC)
Method in which mono-and multi-
phosphorylated peptides are enriched from
highly complex samples and separated prior to
MS/MS analysis
116
Phosphoramidate
Chemistry (PAC)
To link phosphate groups to
immobilised iodoacetyl groups for purification
117

32
Fractionation methods, e.g. strong cation exchange chromatography (SCX) and hydrophilic
interaction chromatography (HILIC), provide an extra dimension of separation prior to MS/MS
analysis. Alternatively, two-dimensional gel electrophoresis (2-DE) can be used for the
separation of proteins and phosphoproteins in proteomic analysis. Combinations of enrichment
and fractionation methods are used widely in current phosphoproteomic strategies to maximize
phosphoproteome coverage (see Table 1.2).
Table 1.2 Summary of fractionation methods used in phosphoproteomic studies
1.4.2.2 Quantitation strategy
Strategies based on differential stable isotope labelling are frequently used in quantitative
phosphoproteomic analyses. Mass spectrometric isotope dilution was first introduced by
Moore et al., a MS-based quantitation strategy to determine the concentration by adding known
amount of isotopic standards118. This concept has since been applied to quantitation of a large
number of biological analytes, such as glucose and cholesterol119,120. A quantitation approach
in complex biological mixtures using isotope-coded affinity tags (ICAT) tag was described by
Gygi and co-workers in 1999121. The ICAT tag specifically target reduced cysteine residues
and the tag can result in a mass difference of either 8 Da. Samples carrying light or heavy
107
260
259

33
isotope labels are mixed prior to trypsin digestion, minimising the variance arising from sample
preparation procedures. Using this strategy, they investigated the protein expression level in
Saccharomyces cerevisiae under glucose-repressed conditions. ICAT method has been widely
used and the concept of ICAT strategy has been adapted and modified to a number of isotope
labelling methods, such as Isotope-coded protein labels (ICPL)122, Isobaric tags for relative and
absolute quantitation (iTRAQ)123 and tandem mass tags (TMT)124.
In stable isotope labelling by amino acids in cell culture (SILAC)125 approach, cells are cultured
in a medium containing differentially isotopically labelled amino acids (usually lysine and
arginine). Lysates with different labels are mixed prior to digestion and sample preparation. As
a result, peptides with the same amino acid sequence and different isotopic labels can be
distinguished by mass spectrometry; relative abundance can be obtained by calculating the ratio
of differentially labelled peptides. For example, using the SILAC-based method combined with
SCX and TiO2 enrichment, 6600 unique phosphorylation sites from 2244 proteins were
successfully identified in EGF-stimulated HeLa cells107. More recently, Olsen et al. showed
that quantification of 20,443 phosphorylation sites from 6027 proteins was achieved in a study
of the phosphoproteome of the cell cycle and a specific kinase motif was identified at various
stages in the cell cycle126. Hinsby et al. applied SILAC in the phosphoproteomics workflow to
study protein phosphorylation in response to FGF1 stimulation in the human 293T cell line.
An antibody was used to isolate binding proteins of a specific phosphoprotein and 28 binding
partners were identified that were involved in stimulation by FGF1127. A novel component of
FGF signalling, for example insulin receptor substrate 4 (IRS4), was identified and a novel
tyrosine phosphorylation site (Tyr915) in IRS4 was found to directly interact with several
proteins in FGF signalling cascade. More recently, the SILAC approach has been not only
limited to cell culture systems, but also available to in vivo experiments in mice128.

34
Label-free quantitation methods typically require the use of an internal standard. Methods were
developed using peak height, spectral count or fragment-ion intensities to normalize the peptide
signal 129,130. These methods are increasingly popular, as they are especially valuable for
samples that are not suitable for in vitro labelling. Langlais et al. investigated the site-specific
phosphorylation of Insulin Receptor Substrate-1 with a label-free method and were able to
relatively quantify isobaric phosphopeptides within one protein131. Old et al. performed global
profiling using a label-free quantitation method to identify the phosphorylation events involved
in oncogenic B-Raf signalling. Ninety phosphorylation events were revealed to be sensitive to
MEK1/2 inhibitor. Multiple phosphorylation sites of an uncharacterised protein were subjected
to detailed investigation and its phosphorylation was shown to be involved in controlling
melanoma cell invasion132.
1.4.2.3 Mass spectrometry analysis
CID and ETD are the most frequently used fragmentation techniques in proteomics133. Some
reports suggest ETD can identify a larger number of phosphopeptides than CID, especially for
multiply charged peptides134. An alternative strategy is to combine CID and ETD results or
alternate CID/ETD in one analysis. Electron capture dissociation (ECD)135 and higher energy
collision activated dissociation (HCD)136 are also used in large-scale localization of
phosphorylation.
Phosphopeptides in complex mixtures often escape standard mass spectrometry detection
because of their low abundance and inadequate fragmentation patterns. Neutral loss scanning,
in which the mass range is continuously scanned for ions with a mass shift of 98 Da (H3PO4),
can be used in sequential fragmentation to partially address these issues137. In ion traps, MS3
will be triggered if a 98 Da mass shift is detected. A drawback of this approach is tyrosine-
35
phosphorylated peptides typically lose HPO3 rather than H3PO4 thus the product ion is the
unmodified amino acid, which may limit the identification of tyrosine-phosphorylated peptides
Combinations of multiple fragmentation methods have been employed to exploit their
complementarity. Frese and co-workers coupled multi-enzyme digestion and alternate CID and
ETD tandem mass spectrometry for the characterisation of caseins138. They concluded that the
complementary information provided by CID (peptide sequencing and identification of single-
point modification) and ETD (PTMs) was crucial for complete protein sequencing, where an
average 32% increase of sequence coverage was observed in alternating CID/ETD approach
compared to CID or ETD alone.
1.4.2.4 Data analysis
The three main databases in phosphoproteome research, which store biochemically verified
and mass spectrometry identified protein phosphorylation data are PhosphoSitePlus
(www.phosphosite.org), Phospho.ELM (http://phospho.elm.eu.org) and Phosida
(www.phosida.com). Phosphoproteome data of model organisms and various species are
available through their websites.
Annotation of phosphorylation is the first step towards the interpretation of protein function.
While phosphoproteomics has greatly broadened the knowledge of phosphorylation events in
various biological processes, the need to characterise the regulatory relationship between
kinases and phosphorylation substrates has expanded. Software focusing on motif analysis, e.g.
Scansite (http://scansite.mit.edu), NetWorkin (http://networkin.info) and iGPS
(http://igps.biocuckoo.org), have been developed to identify the upstream kinases responsible
for identified phosphorylation sites. Results from bioinformatic mining are powerful in

36
revealing the protein family, pathway or biological function related to a group of
phosphorylation substrates139.
Software based on consensus motif to predict upstream kinases are popular in deciphering high-
throughput phosphoproteomic data. Pawson and co-workers showed with Networkin kinase
prediction was able to assign 60-80 % of substrate from an in vivo study139. Although this
marked huge progress in phosphoproteome software, it still points out limitation of current
bioinformatic tools. It should be noted that the prediction does not provide direct evidence of
specific kinase-substrate information and further validation is required. In addition, the
knowledge of novel phosphorylation sites is limited in context of their function and consensus
motif, which offers another direction of future bioinformatic innovation.
1.4.2.5 Future prospects
Owing to the huge role played by phosphorylation in signal transduction, phosphoproteomics
is becoming one of the fastest-growing areas in the study of signal transduction pathways.
Many studies have focused on the temporal dynamics of regulated phosphorylation events in
cell signalling or various biological processes. In recent years, the large-scale
phosphoproteomics workflow is able to map phosphorylation events in considerable depth,
from a few hundreds of phosphorylation sites up to thousands of sites in one single analysis. A
huge emphasis has also been placed from discovery-driven to site-specific analysis that focuses
on interpretation of specific biological connections.
Phosphopeptide identification capacity is still limited by enrichment methods, instrument
performance and data interpretation methods. For tryptic peptides, singly modified peptides
constitute the majority of the total phosphopeptides identified by current technologies140.
Current understanding holds that it is more challenging to identify doubly- and multiply-

37
phosphorylated peptides than singly-phosphorylated peptides. Nevertheless, deciphering the
mechanisms of cell signalling requires knowledge of multiply-phosphorylated peptides as these
adjacent phosphorylation sites may play important regulatory roles. Therefore, one of the
crucial challenges in cell signalling research is to map modification sites in multiply-
phosphorylated peptides.
Although significant progress has been made, low phosphoproteomic coverage, limited
dynamic range and co-elution of peptide isomers still remain a challenge. The development of
phosphoproteomics required the advances in sample preparation, multiplexed MS techniques
and novel data handling software in the future.
1.4.3 Targeted proteomics-selected reaction monitoring
1.4.3.1 Overview
Large-scale proteome analysis has been extensively applied in biomarker discovery and the
development of shotgun approaches greatly increased proteome coverage141. Accurate
quantitation and validation is a necessary step for further characterisation. Conventional
methods, e.g. Western blot and enzyme-linked immunosorbent assay (ELISA) provide good
sensitivity and reproducibility. However, antibody is not always available for such assays.
SRM has emerged as an alternative approach with high reproducibility and throughput. Also,
in combination with LC-MS/MS, the detection limit in attomole level can be routinely achieved
by SRM142,143.
Unlike full MS scan mode, where data are collected by summing up signal intensity over all
m/z to a total-ion chromatogram (TIC), SRM data is collected to form an extracted ion
chromatogram (XIC), where m/z values are extracted from the full mass range to build an

38
elution profile for a given analyte. In SRM analysis, mass spectrometer only selects a set of
target ions within the given m/z range and allow them for fragmentation. The relative
abundance of specified fragment ions is indicative of the abundance of peptides in the sample.
In some cases, peptides with similar m/z or isobaric peptides may appear in the same mass
window in SRM selection144. Thus, monitoring a single precursor mass is not sufficient to
define a unique analyte. Then, targeting a specific precursor as well as multiple fragment ions
may provide highly specific signal to minimize the incidence of false positive detection.
SRM assay typically makes use of a QqQ mass analyser. The most widely used instruments
are QqQ mass spectrometer, quadrupole-time of flight (Q-TOF) mass spectrometer and
quadrupole-TRAP mass spectrometer. TSQ Vantage Triple Quadrupole Mass Spectrometer
used in this thesis was described in detail in Section 1.3.4.2.
Figure 1.11 Selected reaction monitoring technique
As a targeted method, SRM has to be hypothesis-driven; therefore, knowledge of the analyte
is required from previously acquired discovery data145. Based on information of
precursor/fragment ions obtained from discovery data, a transition (pair of product ion and
fragment ion) list can be built to ensure accurate and specific quantitation. This underlying
mechanism of SRM makes it an ideal validation platform, complimentary to the results
obtained from the discovery-based method.

39
1.4.3.2 SRM experiment design
As SRM-based quantitation approach does not allow peptide de novo sequencing. Knowledge
of the MS/MS behaviour of the peptides is required. The selection of target peptides and
transitions are crucial for accuracy and precision of the SRM assays, especially for complex
biological samples.
The target peptides are usually referred to as signature peptides or proteotypic peptides
(PTPs)146. The signal intensity of different peptides of the same protein can differ by up to 100-
fold in intensity147. There are several factors and empirical rules affecting the choice of peptides.
First, peptides with the most intense MS response are promising targets for SRM assay, such
as the highly detectable peptides derived from previous shotgun experiments or peptides
predicted by computational tools148. Second, the signature peptides can be uniquely identified
only in one protein or one isoform. Third, for peptides with post-translational modification, it
is important to distinguish the unmodified and modified form as in most cases they tend to
show different responses.
The selection of signature peptides is then followed by the selection of a set of fragment ions.
There are a number of public available databases of MS/MS spectra and validated SRM assays
to provide empirical guides to assay development and transition selection149–151. An alternative
way to optimize the transition selection is to directly infuse the target peptide and select the
unique fragments with the most intense signals. Fragments with similar masses should be
avoided. To study PTM peptides, the fragment losing the modified group, e.g. phosphate group,
is necessary in order to distinguish them from unmodified peptides. Commonly, 2 to 4 fragment
ions are selected for each peptide due to the limitation of the number of transitions that can be
measured per LC-MS/MS analysis. If measuring too many transitions in one run, the cycle time
will be prolonged, thus there will not be enough data points to build the chromatographic

40
elution profile of the targeted peptides. However, the number of transitions analysed per LC-
MS/MS run can be increased by scheduling SRM transitions152. A retention time window can
be set to scan for a specific peptide, therefore a higher number of peptides can be measured in
one LC-MS/MS run.
To improve the accuracy and precision of SRM assay, pre-fractionation is usually necessary
depending on the complexity of sample. The most widely used approach is to couple LC with
SRM tandem mass spectrometry153. Selective enrichment procedures following enzyme
digestion could be employed for the investigation of peptides with PTM154,155. It is reported the
combination of enrichment and fractionation is able to enrich the target peptide by up to 3
orders of magnitude104. However, it is worth mentioning that the introduction of sample
processing procedures will potentially affect the reproducibility and precision of SRM assay.
SRM has also been coupled with ion mobility separation156.
1.4.3.3 Absolute quantitation
SRM can perform relative and absolute quantitation. Relative (differential) quantitation by
SRM is straightforward and can be used to determine the relative quantities between two
samples. In some cases, the amount of biomarkers present in a sample or a parallel comparison
of peptide quantities is needed among multiple samples, thus the relative quantitation
information is insufficient. Absolute quantitation can be achieved, combined with isotope
labelling or label-free approach.
1.4.3.3.1 Isotope-based quantitation
The widespread and frequently used absolute quantitation approach employs an internal
standard (IS) with isotope labelling154. First, a calibration curve needs to be established by

41
infusing stable-isotope labelled IS peptides. IS peptides can be synthesised by solid-phase
peptide synthesis to incorporate heavy labelled amino acids. Then, IS peptides of known
amount can be spiked into the isotopic labelled endogenous peptides. The amount of IS peptide
required can be determined in a pilot experiment for the individual peptide. The absolute
amount of endogenous peptides can then be derived from the relative signal intensity of
endogenous peptides compared with that of the IS peptides. The introduction of isotopic labels
as internal standards has enabled absolute peptide quantitation and data replication. Although
labelling the endogenous peptides and synthesis of IS peptide are cost-intensive, it is
compensated by better accuracy and more precise quantitation157.
1.4.3.3.2 Label-free quantitation
Label-free SRM is based on quantitation of a single or a group of IS peptides as the reference
standard to measure all the target endogenous peptides158. Although the label-free approach is
experimentally simple, variations in the signal intensity among LC-MS/MS analyses or within
a single LC-MS/MS pose a challenge to the accuracy of quantitation assay. To minimize these
fluctuations, normalization is performed to ensure there is no global shift in the ion intensities.
The need for absolute quantitation information and reducing the cost of an experiment has
increased the demand for label-free quantitation strategies. The QconCAT159 strategy employs
a pool of signature internal standard peptides and enables absolute parallel quantitation of
multiple samples. A recently developed label-free approach uses internal standard peptides
with a quantitation tag160. The tag is added via the trypsin cleavage site to all peptides, which
can then be used to normalize the amount of internal standard peptides.

42
1.4.3.4 Applications of SRM
The specificity of SRM assay depends on the uniqueness of the peptide sequence and the
response of the fragment ions of each peptide. Highly sequence-homologous proteins and
mutant proteins, which cannot be distinguished by traditional affinity-based methods, can be
unambiguously identified by SRM. Wang et al. demonstrated the applicability of SRM in the
measurement of peptides with somatic mutations of Ras, with peptides differing by only one
amino acid161. The capability of site-specific quantitation opens up opportunities for SRM-
based diagnostic applications.
Large-scale proteomics and genomics screen can generate a list of proteins of potential interest.
Based on this previous knowledge, SRM-based experiment can then be performed to target
these proteins for validation or detailed characterisation. Jovanovic and co-workers used SRM
to quantitatively monitor a set of putative target proteins of microRNA let-7 in Caenorhabditis
elegans162. These targets were selected from microarray RNAi screen, microRNA target
prediction algorithms and literature. Around 50% of proteins of interest were successfully
quantified and biologically relevant let-7 interactors were identified. Wolf-Wolf-Yadlin et al.
investigated previously identified phosphorylation events in EGF signalling163. They combined
affinity-based enrichment and SRM to study the dynamics of phosphorylation in a time-course
manner during EGF simulation. Over 200 hundred phosphorylation profiles were recorded, and
early and late phosphorylation responses were identified upon stimulation.
The SRM approach can be applied to identify novel biomarkers for a disease due to its
multiplexing capabilities of up to 100 analytes164. Anderson and Hunter assessed the precision
and dynamic range of SRM technique for multiple quantitations in plasma samples99. They
used multiplexed SRM to reproducibly quantify 47 out of 53 proteins. These quantitation
results yielded a limit of quantification (LOQ) of 0.1 μg/mL and a dynamic range of

43
approximately 4.5 orders of magnitude. Coupled with affinity enrichment and fractionation,
Keshishian et al. significantly expanded the detection limit down to 1–10 ng/mL165. With this
strategy, Cima et al. measured 49 candidate biomarkers for prostate cancer from serum samples
from more than 100 individuals, from which they proposed a four-protein signature for prostate
cancer detection166.
1.5 High-Field Asymmetric Waveform Ion Mobility Spectrometry
(FAIMS)
1.5.1 Ion mobility mass spectrometry
Ion mobility spectrometry (IMS) is a gas-phase analytical technique used to separate and
identify ions based on their ion mobility as they travel through an electric field167. Separation
is not based on m/z ratio as it is in conventional mass spectrometry, but on a combination of
the mass, charge, size, and shape of an ion. Separation in IMS occurs on a timescale of
milliseconds, several orders of magnitudes faster than the seconds to hours in chromatographic
separations. The compact design of some IMS devices has allowed the approach to be used in
detection of explosives, drugs and chemical weapons. Although it was demonstrated in 1962
that IMS could be coupled with mass spectrometry168, it was not until 1993 with the
advancement of instrumentation that IMS-MS has been used in detection of low abundance
chemicals, separation of complex mixtures and characterization of structural information169.
Types of IMS techniques in mass spectrometry include drift tube ion mobility spectrometry
(DTIMS), travelling wave ion mobility spectrometry (TWIMS) and high-field asymmetric ion
mobility spectrometry (FAIMS)170. Features of these three techniques are shown in Table 1.3.
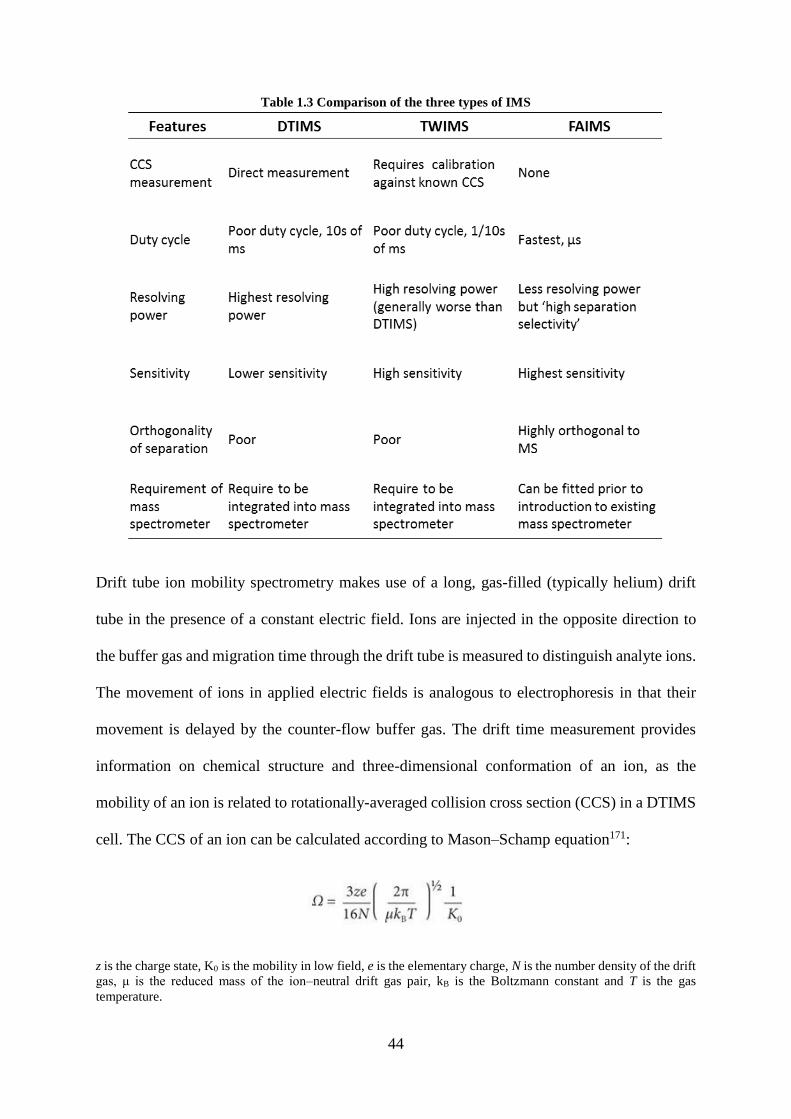
44
Table 1.3 Comparison of the three types of IMS
Drift tube ion mobility spectrometry makes use of a long, gas-filled (typically helium) drift
tube in the presence of a constant electric field. Ions are injected in the opposite direction to
the buffer gas and migration time through the drift tube is measured to distinguish analyte ions.
The movement of ions in applied electric fields is analogous to electrophoresis in that their
movement is delayed by the counter-flow buffer gas. The drift time measurement provides
information on chemical structure and three-dimensional conformation of an ion, as the
mobility of an ion is related to rotationally-averaged collision cross section (CCS) in a DTIMS
cell. The CCS of an ion can be calculated according to Mason–Schamp equation171:
z is the charge state, K0 is the mobility in low field, e is the elementary charge, N is the number density of the drift
gas, μ is the reduced mass of the ion–neutral drift gas pair, kB is the Boltzmann constant and T is the gas
temperature.

45
Together with molecular dynamics simulations, DTIMS technique is useful in providing
structural information, which can be compared with data acquired by techniques such as X-ray
crystallography and nuclear magnetic resonance (NMR) spectroscopy. Commercially available
instruments, e.g. Agilent ion mobility Q-TOF mass spectrometer, featuring a drift tube ion
mobility cell are able to provide extra separation and acquire structural information besides
routine qualitative and quantitative applications.
The travelling wave ion mobility spectrometry (TWIMS) device is similar to traditional
DTIMS but comprised of stacked ring electrodes, to which a radio frequency (RF) is applied172.
Adjacent rings have opposite RF voltage applied to them, which confines the ions within the
cell, whilst the application of a direct current (DC) to each pair of adjacent rings provides the
wave that drives the ions through the mobility cell. By tuning RF and DC, separation can be
achieved. TWIMS has shown improved duty cycle and better capabilities for multiply charged
ions compared with traditional DTIMS173. Another advantage of TWIMS is that the ion
confinement and accumulation ability does not hugely compromise the sensitivity of mass
spectrometer, therefore allowing the application of low abundance analytes. TWIMS is only
available in a number of Water SYNAPT family instruments.
FAIMS is exploited in the course of this study. Fundamental theories and applications of
FAIMS are described in the following sections.
1.5.2 Fundamentals of FAIMS
FAIMS separates ions according to differences in ion mobility in high and low electric fields.
In a FAIMS device, ions are guided by carrier gas into a pair of parallel electrodes to which a
radiofrequency waveform voltage is applied. The radiofrequency waveform, termed dispersion

46
voltage (DV), is asymmetric and alternating between positive and negative field. An equal
product of each part for the wave form is maintained but the value of positive field is higher
than that of negative field. To produce equal part of waveform, the high-field wave is twice the
magnitude and half the duration of the low-field. Ions, exposed to alternating high and low
electric fields, travel through electrodes guided by the carrier gas (helium or nitrogen). Ion
mobility in an electric field can be described as below169:
(1) Kh is the ion mobility at high field and K0 is the ion mobility at zero field. f(E/N) describes the ion mobility as a
function of electric field strength (E) and density of gas (N).
At zero/low field, ion drift velocity is proportional to the applied field and K is constant with
varying field strength. As field strength increases, the velocity is no longer proportional to the
applied field and the increase in K is nonlinear170. The dependence of Kh on field strength is
the basis of FAIMS separation. When exposed to high electric field, the collision energy
between an ion and a carrier gas molecule is different from that in low electric field. Certain
ions show increased mobility as field strength increases (type A ions); certain ions show initial
increase in ion mobility as field strength increases, follow by decreased mobility as field
strength further increases (type B ions); certain types of ions show decreased mobility with
increased field strength (type C ions).
The ion mobility can also be influenced by use of gas mixtures. According to Blanc’s law, the
mobility of an ion in gas mixtures is correlated to the mobility in individual gas and their
abundance. Therefore, for a mixture of gas X and gas Y, the mobility of an ion can be calculated
as:

47
(2) KX and KY is the ion mobility in gas X and gas Y. x and y is the relative abundance of gas X and gas Y.
Furthermore, when the ions interact with the carrier gas which is dense enough, the ions will
quickly acquire a terminal velocity. The terminal velocity is proportional to the strength of the
electric field. This proportionality differs at high and low electric field and allows the
separation of FAIMS.
(3) Vd represents an ion's terminal velocity, k is the ion’s mobility and E is the electric field strength.
Thus, in each cycle of changing waveform the ions will drift towards one of the electrodes.
After a couple of cycles, the majority of the ions will end up colliding with one of the electrodes
and neutralize. Only the ions with ‘balanced’ drift will be allowed to pass on and exit the
electrode. Figure 1.12 shows the separation trajectory of a FAIMS device.
Figure 1.12 Schematic diagram of FAIMS separation

48
Figure 1.13 FAIMS separation by tuning CVs
By superposing a small direct current (DC), the compensation voltage (CV) to the electrode,
the drift induced by the difference in high and low electric field can be compensated or
eliminated. Accordingly, by applying different CVs, ions of interest can be selectively
transmitted through the device (see Figure 1.13). The CV value of an ion is compound-specific.
To analyse a mixture of ions, separation can be achieved by scanning through CVs. As majority
of the chemical noise and short peptide exhibit type C behaviour, they will be largely filtered
out during FAIMS cycles. This selective transmission significantly improved signal-to-noise
ratio and detection limit of FAIMS technique.
1.5.3 Design of FAIMS electrodes
1.5.3.1 Planar FAIMS
Separation in planar FAIMS is performed between two parallel planar electrodes (see Figure
1.14A). The design of planar FAIMS (p-FAIMS) allows decreased residence time and faster
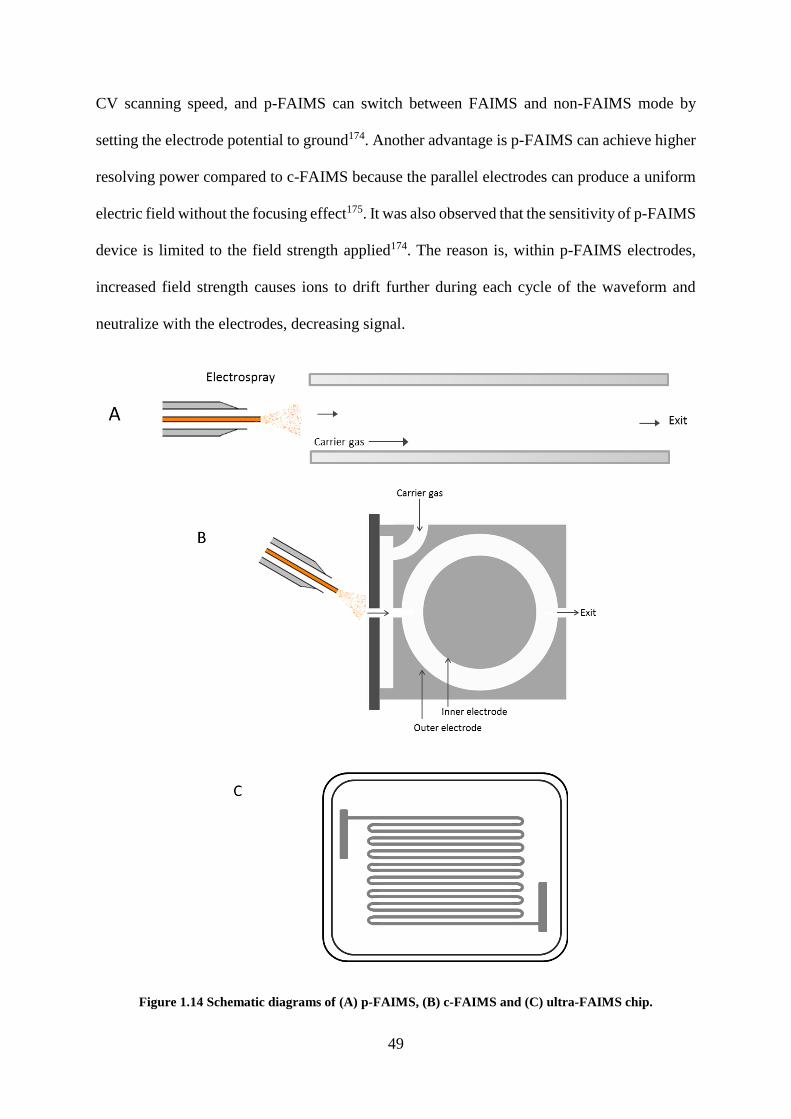
49
CV scanning speed, and p-FAIMS can switch between FAIMS and non-FAIMS mode by
setting the electrode potential to ground174. Another advantage is p-FAIMS can achieve higher
resolving power compared to c-FAIMS because the parallel electrodes can produce a uniform
electric field without the focusing effect175. It was also observed that the sensitivity of p-FAIMS
device is limited to the field strength applied174. The reason is, within p-FAIMS electrodes,
increased field strength causes ions to drift further during each cycle of the waveform and
neutralize with the electrodes, decreasing signal.
Figure 1.14 Schematic diagrams of (A) p-FAIMS, (B) c-FAIMS and (C) ultra-FAIMS chip.

50
1.5.3.2 Cylindrical FAIMS
An electrode design of concentric cylinders was first introduced by Carnahan et al. and
improved by Guevremont et al176. The prototype design consisted of an inner electrode
(cylinder) and an outer electrode, which are coaxially aligned with a 5 mm gap. In this model,
ions are focused in the electrode gap, travelling transversely along the electrode. Asymmetric
waveform (up to ±3000V) is applied to outer electrode at a frequency of 200 kHz. The
cylindrical design creates an inhomogeneous ion focusing effect, where ions with high field
dependence will be efficiently focused and transmitted while ions exhibit low field dependence
may be poorly focused177. A theoretical analysis of the focusing effect was described by
Krylov178. In contrast to p-FAIMS, the sensitivity of cylindrical FAIMS increases as the field
strength increases due to the focusing effect.
In 2005, c-FAIMS device was marketed by Thermo Fisher Scientific (developed by Ionalytics
Corporation) with interface to mass spectrometer. Improvements were adopted where ions are
introduced into the electrodes in a direction orthogonal to the axis of the electrodes and guided
by carrier gas to the exit through an aperture on the opposite side of the electrode (Figure 1.11).
In this device, the inner and outer electrode is 13 mm and 18 mm in diameter, with a 2.5 mm
gap. Asymmetric waveform is applied to the inner electrode. A high flow ESI probe (New
Objective probe, μL/min to mL/min) is compatible with the Thermo c-FAIMS device. Recently,
to couple nanoLC with FAIMS, a modified HESI probe (Thermo Scientific) was introduced by
Swearingen et al. to accommodate a capillary column179. This probe also allows the use of
sheath gas to assist electrospray. A 33.0% increase in proteome coverage was observed with
these modifications. The Thermo c-FAIMS device with a modified HESI was used in the work
presented in Chapter 3 and 4.

51
1.5.3.3 Ultra FAIMS
A multichannel microchip p-FAIMS device (termed ultra-FAIMS) was described by
Shvartsburg et al.180 and is manufactured by Owlstone Nanotech. It is constructed with
interleaved plates with multiple parallel gaps 35 μm in width and 300 μm in length, as shown
in Figure 1.11. Compared with conventional p-FAIMS with field strength of approximate 20
kV/cm, ultra-FAIMS device can raise the field strength up to 60 kV/cm or 180 kV/cm. The
drawback of the ultra-FAIMS device is that extreme high fields will decrease transmission
efficiency due to increased diffusion, but this loss can be partially offset by the decreased
residence time. The scan time of ultra-FAIMS device can be 100-10,000 times faster than
previous devices. Dispersion field and compensation field can be varied simultaneously to
allow two dimensional FAIMS analysis and identify the optimum conditions for separation of
a particular (set of) ion. The chip-based FAIMS device can be attached to suitable mass
spectrometers between the ionisation source and MS inlet.
1.5.3.4 Novel cylindrical electrode design
Recently, a modified FAIMS device was described which is based on the Thermo c-FAIMS
device181. There are two main improvements in the modified FAIMS interface: (1) the gap
between inner and outer electrode was reduced gap from 2.5 mm to 1.5 mm; (2) FAIMS inlet
was modified to improve ion transmission.
Figure 1.15 Side view comparison of standard and modified FAIMS electrodes

52
The field strength in a ring-shaped region can be described as in the equation below174. The
reduction in gap by increasing the radius of the inner electrode allows application of higher
field strength at a fixed Va. The increase in the magnitude of the focusing field could enhance
dependence of ion on field strength; therefore enhance ion focusing effect through the
electrodes. Separation at low field strength is closely related to m/z ratio and therefore
separation at low field strength has no particular advantages in resolving similar analytes.
Therefore, increasing applied field strength compatible with available instrument becomes a
useful separation enhancement tool in optimization of the FAIMS device.
(4) Va: potential applied to inner electrode; r: radial distance from the inner electrode; a: outer diameter of the inner
electrode; b: inner diameter of the inner electrode.
The ion inlet region of the FAIMS device was modified to accommodate two carrier gas inlets,
creating a symmetric gas flow and reducing ion loss in the entrance region. Comparison
between standard and modified FAIMS showed little improvement in sensitivity but significant
improvement in S/N was observed. It has been demonstrated that in analysis of standard
peptides the modified FAIMS device resulted in up to ten-fold increase in S/N and simulation
analysis showed the ion transmission efficiency was improved of ~9-fold and residence time
can be reduced to 13.2 ms (± 3.9 ms), compared with 50-100 ms in standard FAIMS. Evaluation
of the modified FAIMS for qualitative and quantitative analysis of complex biological samples
is presented in Chapter 5.

53
1.5.4 FAIMS and proteomics
The FAIMS technology has introduced new opportunities into proteomics research. FAIMS
can be used to separate ions, either with direct infusion electrospray or with LC, prior to their
introduction into mass spectrometer182. In 2001, a commercialized c-FAIMS device was first
introduced by Ionalytics Corporation, which enabled FAIMS to couple with electrospray
ionization (ESI). Thermo Fisher Scientific released the c-FAIMS device based on Ionalytics
that interfaced with their instruments in 2005. Since then, an increasing number of studies have
been carried out to investigate the potential of FAIMS in proteomics research179,183,184.
The application of FAIMS in proteomics as a separation technique provides advantages in
several aspects: (a) reduced background signal and improved signal-to-noise ratio; (b)
increased limits of detection and dynamic range; (c) enhanced separation and identification of
isobaric ions.
Venne et al. combined FAIMS with a quadrupole time-of-flight (Q-TOF) spectrometer in the
study of Glu-fibrinopeptide B185. A 6~12-fold improvement of S/N ratio and a 20% increase in
peptide identification were observed. They applied an ‘internal CV-stepping’ FAIMS method:
each LC-MS/MS scan was collected at a different CV in a single LC-FAIMS-MS/MS run.
With this method, LC-FAIMS-MS/MS provided a 20% increase in the number of peptide ions
compared with the conventional LC-MS/MS approach in the analysis of U937 cells.
FAIMS has shown potential in shotgun proteomic analysis, especially when coupled with LC,
adding an extra dimension of separation. Canterbury et al. coupled FAIMS with a LTQ linear
ion trap to analyse a complex tryptic digest of S. cerevisiae proteins186. The use of FAIMS
resulted in a fivefold increase in dynamic range and an eightfold increase in peak capacity.
However, a loss of signal of one order of magnitude was reported. They proposed the loss may
occur in the ion inlet region of FAIMS device as explained above. Saba et al. have

54
demonstrated the ability of FAIMS to enrich multiply charged peptides and increase dynamic
range while reducing the background signal187. The ‘external CV-stepping’ method was used
in their study: the CV was kept constant during one LC-FAIMS-MS/MS analysis and multiple
CVs were scanned individually (in this case ranging from -22 V to -46 V). With this method,
they reported a 46% increase in the number of peptide assignment in analysing tryptic digest
of U937 cells.
In early studies, FAIMS was normally operated with nitrogen alone. Recently, several groups
have also reported the addition of He to the carrier gas could enhance the peptide detection188,189.
Shvartsburg et al. investigated the effect of He content (as carrier gas with nitrogen) on the
separation of 3 mono-phosphorylated peptide isomers189. They found increasing helium
content from 0 % to 75 % induced a shift in the CV value and a decrease in peak widths, which
led to improved isomer separation. Shvartsburg et al. have examined 50:50 He:N2 as the carrier
gas and the result showed that it significantly improved peptide transmission and resolving
power (2~3 times). The composition of carrier gas can greatly affect the behaviour of ions in
high and low electric field. They proposed the addition of He enhanced the ion unfolding in
the gas environment, resulting in broader separation space and narrower peaks.
FAIMS also provides us a new angle to improve the performance of LC-MS/MS by addressing
some of its instrumental limitations. In the investigation of PTM, the presence of positional
isomers and co-eluting peptides of the same mass often lead to ambiguous identification190.
The separation based on LC alone is limited. Thus, pre-separation is particularly useful for the
accurate localization of modifications. Bridon et al. have also demonstrated the advantages of
FAIMS in PTM identification in the study of Drosophila melanogaster Schneider S2 cells,
where FAIMS expanded the phosphoproteome coverage by 49%. Meanwhile, 78 potential
phospho-isomers were identified by FAIMS. Creese et al. applied FAIMS to the analysis of a
phosphopeptide library, which comprised of 4000 phosphopeptides with sequence inversions

55
and structural isomers191. The use of the library enabled evaluation of the performance of
FAIMS regards the separation ability more accurately. The results showed, combined with
SCX, LC-FAIMS-MS/MS analyses exhibited a 2-fold increase in the number of
phosphopeptide assignments compared to SCX-LC-MS/MS.
1.6 Aims and objectives
The aim of this thesis was to develop and apply methods to gain a greater insight into the key
phosphorylation events of FGF signalling following inhibitor treatments. To achieve this, LC-
MS/MS and LC-FAIMS-MS/MS were applied to global phosphoproteomics of FGF signalling
together with targeted quantitation of specific phosphorylation events.
The specific aims of the work presented in the following chapters were:
To evaluate the performance of FAIMS in quantitative proteomic analysis and generate a
method suitable for SILAC-based LC-FAIMS-MS/MS analysis (Chapter 3).
To investigate of site-specific phosphorylation in FGFR signalling following chemical
inhibitions by LC-MS/MS and LC-FAIMS-MS/MS (Chapter 4).
To evaluate the performance of standard and modified FAIMS interface in proteomic
analysis (Chapter 5).
To investigate the dynamics of the key phosphorylation events in the FGF signalling by
SRM (Chapter 6).

56
CHAPTER 2
MATERIALS AND METHODS
57
2.1. Buffers and solutions
2.1.1 General laboratory reagents
Acetic acid (J. T. Baker)
Acetonitrile, HPLC grade (J. T. Baker)
Ammonium bicarbonate (Fisher Scientific)
Ethylenediaminetetraacetic acid (EDTA) (Fisher Scientific)
Formic acid (Fisher Scientific)
Iodoacetamide (Sigma-Aldrich)
Methanol, HPLC grade (J. T. Baker)
Potassium chloride (Sigma-Aldrich)
Potassium dihydrogen phosphate (Sanofi)
Trifluoroacetic acid (TFA) (Sigma-Aldrich)
Water, HPLC grade (J. T. Baker)
2.1.2 Cell culture
Phosphate buffered saline (PBS): PBS pH 7.2 tablets (Oxoid) made up according to
manufacturers’ instructions
RPMI 1640 medium (Life technologies)
RPMI 1640 medium for SILAC (Life technologies)
SILAC labels: L-arginine and L-lysine (R0K0) (Sigma-Aldrich)
SILAC labels: 13C6 L-arginine and 4,4,5,5-D4 L-lysine (R6K4) (Goss Scientific)
SILAC labels: 13C6 15N4 L-arginine and 13C6 15N2 L-lysine (R10K8) (Goss Scientific)
0.1 mg/mL streptomycin and 100 I.U./ml penicillin (Sigma-Aldrich)
0.5 mg/mL proline (Sigma-Aldrich)
58
10 % Fetal bovine serum, FBS (Biosera)
10 % dialyzed FBS (Labtech International)
20 ng/mL FGF1 (BioLegend)
10 mg/mL heparin (Sigma-Aldrich)
1μM dasatinib (Sellek Chemicals)
Cell lysis buffer: 0.05 M tris-HCl (Thermo Fisher Scientific), 0.15 M NaCl (Thermo Fisher
Scientific), 1 % Triton X-100 (Sigma-Aldrich) (v/v), complete protease inhibitor cocktail
tablets (Roche Applied Science): 1 tablet per 10 mL (contains EDTA; final concentration
0.001 M)
Complete Mini, Protease Inhibitor Cocktail Tablets (Roche Diagnostics)
2.1.3 Sample preparation
C18 Zip-Tip (Millipore)
Coomassie protein assay kit (Fisher Scientific)
Trypsin Gold-Mass spectrometry grade (Promega)
TitansphereTM Phos-TiO2 kit (GL Sciences)
NuPAGE 4-12% pre-cast Bis-Tris gels (Life technologies)
2.1.4 Fractionations
Strong cation exchange (SCX) chromatography:
100×2.1 mm polysulfoethyl aspartamide column (5 μm particle size, 20 nm pore size)
Mobile phase A (5 mM KH2PO4, 20 % (v/v) acetonitrile, pH 3.0)
Mobile phase B (5 mM potassium dihydrogen phosphate, 20 % (v/v) acetonitrile, 250
mM potassium chloride, pH 3 with phosphoric acid)

59
Phosphoenrichment :
Buffer A (0.5% TFA, 80 % acetonitrile)
Buffer B (25% lactic acid and 75% Buffer A)
5 % ammonia hydroxide (Sigma-Aldrich)
5% pyrrolidine (Sigma-Aldrich)
2.1.5 Mass spectrometry
LTQ Velos ESI Positive Ion Calibration Solution (Life technologies)
Protein Mixture Digest (Dionex)
MS Qual/Quant QC Mix (Sigma-Aldrich)
Substance P (Sigma-Aldrich)
2.2 Methods
2.2.1 Cell culture
2.2.1.1 Cell culture
SUM52PE breast cancer cell lines were kindly provided by Dr. Simon Cook, Babraham
Institute. SUM52PE cells were grown in RPMI1640 media supplemented with 10% foetal
bovine serum (FBS), 0.2 U/ml penicillin, 0.1 mg/ml streptomycin and 2 mM L-glutamine. Cells
were cultured at 37ºC with 5% CO2.
2.2.1.2 Cell labelling

60
For SILAC labelling, SUM52PE cells were grown in amino acid deficient media (RPMI1640)
supplemented with 0.1 mg/mL L-Lysine and L-Arginine, “medium” 13C6 L-Lysine and 13C6
15N2 L-Arginine or “heavy” 13C6 L-Lysine and 13C6 15N4 L-Arginine, 10% dialyzed FBS, 0.1
mg/mL streptomycin, 0.2 U/mL penicillin and 2 mM L-Glutamine. Cells were cultured for at
least five doublings in order for the cells to fully attain complete labelling192.
2.2.1.3 Cell treatment: SILAC
Prior to treatment, cells grown to 80-90% confluence were serum-starved for 4 hours. After
serum starvation, “light” cells were treated with 20 ng/mL FGF1 and 10 mg/mL heparin for 30
min; “medium” cells were treated with 20 μM SU5402 for 30 min followed by treatment of 10
mg/mL heparin and 20 ng/mL FGF1 for 30 min; cells cultured in “heavy” media were treated
with 1 μM dasatinib for 30 min followed by a 30-minute treatment of 20 ng/mL FGF1 and 10
mg/mL heparin.
2.2.1.4 Cell treatment: SRM
Prior to treatment, SUM52PE cells were serum-starved for 4 hours. Cells were treated with 20
ng/mL of FGF1 and 10 ng/µL of heparin for 0 s, 20 s, 40 s, 1 min, 3 min, 5 min, 10 min, 20
min, 30 min and 60 min individually.
2.2.1.5 Cell lysis
Prior to cell lysis, cells cultured in 100 mM dish were washed twice with cold PBS and
incubated at 4 °C for at least 30 min in 800 μL lysis buffer (50 mM Tris-HCl pH 7.4, 150 mM
NaCl, 1% Triton TX-100, 1 tablet of protease inhibitor cocktail and 1 tablet of phosphatase
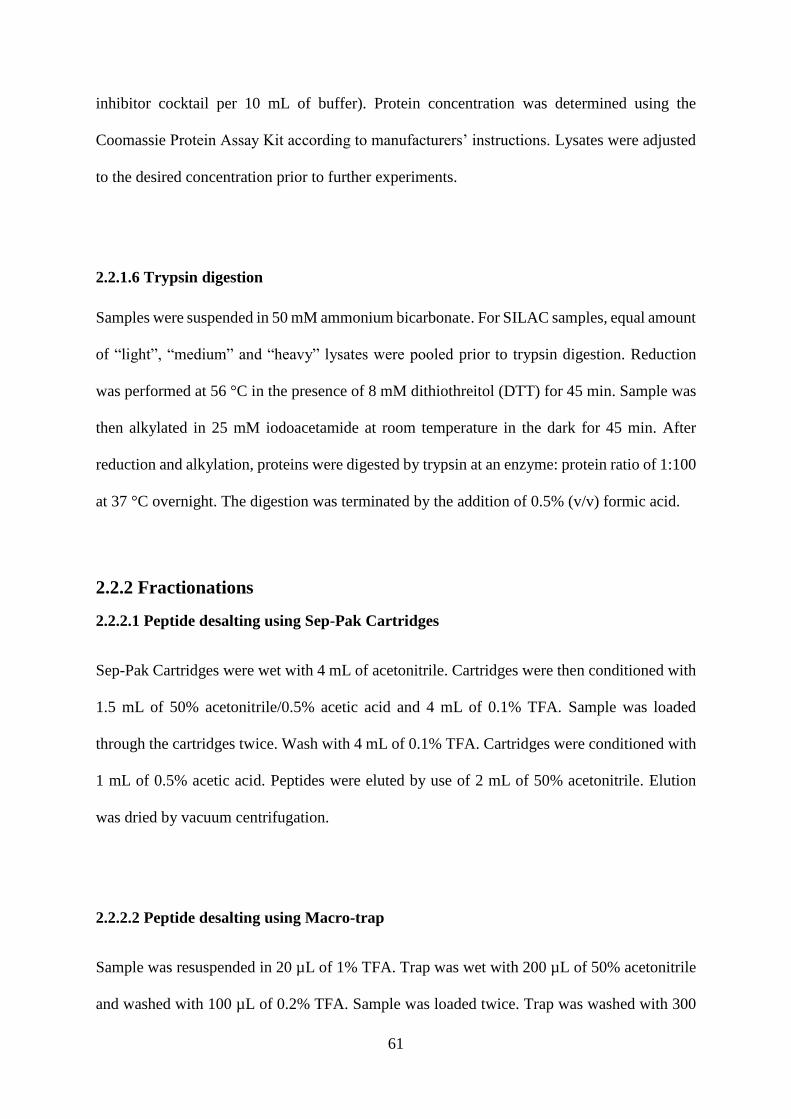
61
inhibitor cocktail per 10 mL of buffer). Protein concentration was determined using the
Coomassie Protein Assay Kit according to manufacturers’ instructions. Lysates were adjusted
to the desired concentration prior to further experiments.
2.2.1.6 Trypsin digestion
Samples were suspended in 50 mM ammonium bicarbonate. For SILAC samples, equal amount
of “light”, “medium” and “heavy” lysates were pooled prior to trypsin digestion. Reduction
was performed at 56 °C in the presence of 8 mM dithiothreitol (DTT) for 45 min. Sample was
then alkylated in 25 mM iodoacetamide at room temperature in the dark for 45 min. After
reduction and alkylation, proteins were digested by trypsin at an enzyme: protein ratio of 1:100
at 37 °C overnight. The digestion was terminated by the addition of 0.5% (v/v) formic acid.
2.2.2 Fractionations
2.2.2.1 Peptide desalting using Sep-Pak Cartridges
Sep-Pak Cartridges were wet with 4 mL of acetonitrile. Cartridges were then conditioned with
1.5 mL of 50% acetonitrile/0.5% acetic acid and 4 mL of 0.1% TFA. Sample was loaded
through the cartridges twice. Wash with 4 mL of 0.1% TFA. Cartridges were conditioned with
1 mL of 0.5% acetic acid. Peptides were eluted by use of 2 mL of 50% acetonitrile. Elution
was dried by vacuum centrifugation.
2.2.2.2 Peptide desalting using Macro-trap
Sample was resuspended in 20 µL of 1% TFA. Trap was wet with 200 µL of 50% acetonitrile
and washed with 100 µL of 0.2% TFA. Sample was loaded twice. Trap was washed with 300

62
µL of 0.1% TFA. Sample was eluted with 300 µL of 70% acetonitrile. Elution was dried by
vacuum centrifugation.
2.2.2.3 Peptide desalting using Ziptip
Sample was resuspended in 20 µL of 1% TFA. Tip was wet with 10 µL 100% acetonitrile
(repeat twice) and conditioned with 10 µL of 0.1% TFA (repeat three times). Sample was
loaded by aspirating and dispensing the solvent 7-8 times. Tip was washed with 10 µL of 0.1%
TFA (repeat three times). Peptides was eluted by aspirating and dispensing in 10 µL of 70%
acetonitrile. Elution was dried by vacuum centrifugation.
2.2.2.4 Strong cation exchange (SCX) chromatography
Peptides were resuspended in 100 μL of mobile phase A and loaded onto a 100×2.1 mm
polysulfoethyl aspartamide column at a flow rate of 200 μL/min. Separation gradient started
from 0 % mobile phase B and increased to 50 % mobile phase B in 30 min, increased from 50%
to 100 % mobile phase B in 5 minutes and returned to 100 % mobile phase A to equilibrate.
Fractions with 750 μL were collected throughout the run.
2.2.2.5 Phosphoenrichment
Phosphoenrichment was performed using Phos-TiO2 Phosphopeptide Enrichment Kit
according to manufacturers’ instructions. Spin tips were conditioned sequentially with 20 μL
of Buffer A and 20 μL of Buffer B by centrifugation (3000 ×g, 2 min). Samples were re-
suspended in 50 μL of Buffer B and loaded onto the tip for centrifugation (1000 ×g, 10 min).
Repeat this step and centrifuge again to maximize the binding. Column was washed with 20

63
μL of Buffer B and 20 μL of Buffer A sequentially and subjected to centrifugation (3000 ×g, 2
min). Phosphopeptides were eluted with 5 % ammonium hydroxide and 5% pyrrolidine
solution upon centrifugation individually (1000 ×g, 5 min). Elution was dried by vacuum
centrifugation.
2.2.3 LC-MS/MS analysis
2.2.3.1 Orbitrap Velos mass spectrometer (Chapter 3 and 4)
Experiments were performed on an Orbitrap Velos ETD mass spectrometer, equipped with a
Dionex Ultimate 3000 Nano-LC system. Samples were loaded onto a 15 cm C18 Acclaim
PepMap100 column in mobile phase A (0.1% formic acid) and separated by a gradient from
3.2% to 44% mobile phase B (acetonitrile in 0.1 % formic acid) in 30 min, followed by a 10-
minute wash of 90% mobile phase B and a 15 min re-equilibration of 3.2% mobile phase B.
Peptides were eluted via a TriVersa Nanomate chip-based electrospray device into the mass
spectrometer. For both CID and ETD analyses, the mass spectrometer performed a ‘top 7’
method comprising a full FT-MS scan (m/z 380–1600) at a resolution of 30,000 in the Orbitrap
with a 1×10⁶ automatic gain control (AGC) target and a 1 s maximum fill time. The seven most
abundant precursor ions was isolated for MS/MS scans in ion trap. For CID, MS/MS analysis
of the seven most abundant precursor ions above 1000 was performed with a normalized
collision energy of 35% (AGC target 5×10⁴ charges, maximum fill time 100 ms). For ETD,
MS/MS analyses of the seven most abundant precursor ions above a threshold of 5000 was
performed with 100 ms activation time (AGC target 5×10⁴ charges, maximum fill time 100 ms,
reagent AGC target 1×10⁵). The precursor isolation window was 2 m/z. Only multiply charged
precursors were selected for fragmentation. Dynamic exclusion was applied for 60 s.

64
2.2.3.2 Orbitrap Elite mass spectrometer (Chapter 5)
The mass spectrometer performed a ‘top 7’ method comprising a full FT-MS scan (m/z 380–
1600) at a resolution of 30,000 (m/z 400) in the Orbitrap with an AGC target of 1×10⁶ charges
and a maximum fill time of 1 s. The seven most abundant precursor ions detected was isolated
for MS/MS scans in ion trap. For CID, MS/MS analyses of the seven most abundant precursor
ions above a cut-off of 1000 with a 35% normalized collision energy was performed (AGC
target: 5×10⁴ charges and maximum fill time 100 ms). Width of the precursor isolation window
was 2 m/z. Only multiply charged precursors were subjected to fragmentation. Dynamic
exclusion was applied for 60 s.
2.2.4 LC-FAIMS-MS/MS analysis
2.2.4.1 Standard FAIMS analysis
The standard FAIMS device was used in Chapter 3, 4 and 5. The standard FAIMS device with
a 2.5mm electrode gap width was operated under the following conditions: carrier gas flow
rate 2.9 L/min and carrier gas composition 50/50 He:N2, dispersion voltage (DV) -5 kV, and
the inner and outer electrodes temperatures 70 °C/90 °C. Liquid chromatography method was
as described above. To couple nanospray, the HESI-II source was modified to accommodate
the 360 μm O.D. fused silica capillary, with 2 arbitrary units sheath gas to assist electrospray,
similar to that described by Swearingen et al179. The ‘external CV stepping’ method was used
in which the CV is kept constant throughout the LC-MS/MS analysis. Therefore, each analysis
is performed at a fixed and separate CV. Liquid chromatography method and MS/MS methods
were as described above.

65
2.2.4.2 Modified FAIMS analysis
The modified FAIMS device was used in Chapter 5. The modified FAIMS device with a 1.5
mm electrode gap width (Thermo Fisher Scientific) was operated under the following
conditions: carrier gas (He) flow rate 2.0 L/min, dispersion voltage -5 kV, and the inner and
outer electrodes temperatures 70 °C/90 °C. To couple nanospray, an in-house nanospray source
was modified to accommodate the 360 μm O.D. fused silica capillary. The ‘external CV
stepping’ method was used in which the CV is kept constant throughout the LC-MS/MS
analysis. Therefore, each analysis is performed at a fixed and separate CV. Liquid
chromatography method and MS/MS methods were as described above.
2.2.5 LC-SRM-MS/MS analysis
2.2.5.1 Synthesis of internal standard peptides
The phosphopeptides selected for SRM analysis were synthesised by GenicBio Limited,
Shanghai, China. The phosphopeptides were synthesised without isotope labels by solid phase
peptide synthesis. The quantity of each phosphopeptide is 1 mg and the purity of all
phosphopeptides is above 95%. Synthetic peptides were resuspended in 50% ACN, 0.1%
formic acid to a concentration of 2 pmol/μL. A pool of phosphopeptides was generated by
mixing phosphopeptides at the concentration of 2 pmol/μL and stored at -20 °C until further
use.
2.2.5.2 Selection of transitions
Synthesized phosphopeptides were directly infused into Orbitrap Velos mass spectrometer to
assess the purity of each phosphopeptide and optimize the SRM parameters. Specifically, each
peptide was prepared at a concentration of 2 pmol/μL in 30% ACN, 0.1% FA.

66
To assess the quality of each peptide, the total ion MS profile of each peptide was acquired
within the mass range m/z 380–1800 and the MS/MS profile of each peptide was acquired.
Fragment ions with the highest intensity were selected, along with the neutral loss fragment
ions for Ser and Thr-containing peptides. To allow comparable quantitation, the same
transitions were selected corresponding to endogenous (heavy-labelled) peptides and internal
standard (unlabelled) peptides (see Appendix 2).
2.5.5.3 Scheduling of SRM peptides
Scheduling retention time of the phosphopeptides was performed using a Dionex 3000 UHPLC
coupled to a TSQ Vantage triple stage quadrupole mass spectrometer. Synthetic
phosphopeptides pool (2 picomole/uL) were prepared for LC-SRM-MS/MS analysis. An LC
gradient of 3.2-44% ACN over 20 min was delivered, followed by a 5-minute wash of 90%
mobile phase B and a 10 min re-equilibration of 3.2% mobile phase B. The SRM transitions
were scheduled around their expected elution times. Due to the large number of transitions in
this assay (450 transitions for endogenous labelled) and IS peptides), 3 identical methods with
different transition sets were created.
2.5.5.4 Establishment of calibration curve
For absolute quantitation, a calibration curve is required to determine the absolute expression
level of a peptide. Calibration curves were prepared for each phosphopeptide using synthetic
version. A 6-point calibration curve was produced using the following concentrations: 100
attomole, 500 attomole, 1 femtomole, 10 femtomole, 50femtomole and 250 femtomole. Three
runs were performed individually in order to accommodate large number of transitions. Three
technical replicates were performed in different days.

67
2.5.5.5 LC-SRM-MS/MS
Peptide mixtures were separated at a flow rate of 352 nL/min in Dionex UHPLC system
equipped with 1:300 splitter cartridge to provide nano flow. Samples were loaded onto a 150
mm Acclaim PepMap100 C18 column in mobile phase A (0.1% formic acid) and separated by
a 20-minute gradient from 3.2% to 44% in mobile phase B (acetonitrile, 0.1 % formic acid),
and followed by a 10-minute wash of 90% mobile phase B and re-equilibration (10 min) with
3.2% mobile phase B. Peptides were eluted via a TriVersa Nanomate chip-based electrospray
device into the mass spectrometer and a spray voltage of 1.7 kV was used.
All peptides were analysed by TSQ Vantage Triple Quadrupole mass spectrometer. The TSQ
Vantage was operated with an ion source temperature of 275 °C, a unit/unit resolution of 0.7
Da in Q1 and Q3, and a scan width of 0.002 m/z for all SRM transitions.
2.2.6 Data analysis
2.2.6.1 SILAC data analysis (Chapter 3 and 4)
Mass spectra were collected using Xcalibur 2.2 and processed by the MaxQuant (version
1.4.1.3).193 Data were searched against SwissProt human database containing common
contaminants and reverse sequence (175242 protein entries) with Mascot (Matrix Science).
The search parameters were: minimum peptide length 6, cleavage enzyme trypsin, missed
cleavages 2, peptide tolerance 20 ppm and mass tolerance 0.5 Da. Carbamidomethyl (C) was
set as a fixed modification. Oxidation (M), acetylation (N-term) and phosphorylation (STY)
were set as variable modifications. The appropriate SILAC labels were selected and the
maximum labelled amino acids was set to 3. FDR for peptide, protein and site identification
was set to 0.01. FDR was calculated as Global FDR at spectral level. Within the Maxquant

68
output, phosphorylation sites with a Localization Score above 0.75 were considered localized
accurately and the accurately localized phosphorylation sites were selected for further analysis.
2.2.6.2 Peptide identifications (Chapter 5)
Data were searched by the Proteome Discoverer 2.1 using the SEQUEST and Mascot
algorithms. The following parameters were used: no spectral grouping; fully tryptic, 2 missed
cleavages allowed; precursor ion m/z tolerance ±10 ppm; fragment ion m/z tolerance ±0.8 Da;
Carbamidomethyl (Cys) was set as a fixed modification; N-terminal acetylation, oxidation
(Met) and phosphorylation (Ser, Thr, and Tyr) were set as variable modifications. Data were
filtered to 1 % peptide FDR. For data search of 6 standard proteins, a database containing the
6 proteins and containing common contaminants and reverse sequences were used. For data
search of SUM52PE lysates, the SwissProt human database containing common contaminants
and reverse sequences were used.
2.2.6.3 SRM data analysis (Chapter 6)
SRM data were acquired using Xcalibur 3.0 and loaded into Skyline 3.1194 for data analysis. In
Skyline, peak detection was manually inspected to ensure retention time of relative transitions
were similar and correct peaks were detected. The SRM peak area of synthetic peptides was
used to generate calibration curves. The SRM peak area of endogenous peptides was used to
generate correlation profiles.
A logarithm transform approach was adopted to combine inter-day calibration data. The mean
of triplicate measurements was calculated for further analysis. Next, transform all data and the
value of concentration by taking the log base 2 value. Then, calculate the slope and intercept
of each peptide in each assay. Next, calculate the mean of slope and intercept of each peptide
in inter-day assays. Calculate the R-squared value and the mean of R-squared value of each

69
peptide. The calibration of data with a less than 0.9 R-squared value will be excluded from
further analysis. Convert the data to linear scale and construct calibration curve.
2.2.6.4 Motif-X analysis
The sequence window with the centred phosphorylation sites were submitted for Motif-X
analysis. Search parameters were: width 13, occurrences 20, significance 0.000001 and
background IPI Human Proteome.
2.2.7 Workflow of SILAC experiment
The schematic diagram of sample preparation process is shown in Figure 2.1. Equal amounts
of light, medium and heavy labelled peptides were mixed, digested and then desalted using
Sep-pak cartridges. Peptides were re-suspended for SCX fractionation. In SCX, 53 fractions
were collected and these fractions were combined into 12. The combined fractions were
desalted using Macro-trap cartridges. Phosphoenrichment were performed for the 12 fractions.
Following phosphoenrichment, each of the 12 fractions was subsequently split into two. One
half of each of the fractions was destined for LC-MS/MS analyses. Ziptip desalting was
performed prior to mass spectrometry analyses. For the LC-FAIMS-MS/MS analyses, the
remaining twelve half-fractions were pooled and divided equally into 12 aliquots. Each of these
12 aliquots was then analysed at a separate CV. Each of the 24 samples (12 x half-fractions for
LC-MS/MS and 12 x aliquots for LC-FAIMS MS/MS) was split into four to allow 2 x CID
MS/MS analyses and 2 x ETD MS/MS analyses.

70
Figure 2.1 Schematic diagram of the sample preparation procedure
2.2.8 Workflow of SRM experiment
In this SRM assay, an absolute quantitation strategy was employed (see Figure 2.2). To obtain
absolute quantitation information, internal standard peptides were synthesised corresponding
to the peptides of interest. Each IS peptide is identical to native peptides except from their
isotopic labels with a difference of 6-10 Da in molecular weight. A known amount (20 fmol)
of an IS peptide was spiked to SUM52 cell digests, desalted by Ziptip and analysed by LC-
SRM-MS/MS. The quantity of native peptide was calculated using peak ratios in Skyline.

71
Figure 2.2 Strategy for absolute SRM quantitation assay
20 fmol

72
CHAPTER 3
OPTIMIZATION OF
PHOSPHOPROTEOMIC ANALYSIS BY
LC-FAIMS-MS/MS

73
3.1 Introduction
The aim of the work presented in this chapter was to establish a method that can be used in
SILAC-based LC-FAIMS-MS/MS analysis. In this thesis, SILAC was used for quantitative
analysis of FGF signalling. In SILAC, cells cultured in different media are labelled by light,
medium and heavy isotopic labels. It has been shown, by Shvartsburg et al, that different
peptides are transmitted at various compensation voltages (CVs) ranges in FAIMS device195.
It was unclear whether peptides with different isotope labels would be transmitted over
different CV ranges, leading to discrepancies in quantitative results. In order to couple SILAC
with FAIMS, it was first necessary to evaluate the transmission behaviour of stable isotopic
labels in FAIMS device. Secondly, in order to ensure maximum proteome coverage, a pilot
experiment was set up to determine the appropriate workflow for SILAC FAIMS using 293T
cells and explore the optimum CV range for phosphoproteomics analysis of SU5402 whole cell
lysate.
3.2 Results
3.2.1 Quantitation analysis by LC-FAIMS-MS/MS
MS Qual/Quant QC Mix (Sigma-Aldrich) is an “injection-ready” standard and is typically used
to monitor quantitation performance. MS Qual/Quant QC Mix contains a set of 14 peptides
with light and heavy isotopic labels from 6 pre-digested proteins. These peptides span a 25-
fold range of concentration, which makes it ideal for quantitation assessment. A volume of 2
μL of resuspended solution was subjected to LC-FAIMS-MS/MS analyses. Four separate
analyses were performed at CVs of -25.0 V, -30.0 V, -35.0V and -40.0V. Results are shown in
Table 3.1. The values shown in the table were the average of the four CV steps.

74
Table 3.1 Quantitation results of Qual/Quant Mix by LC-MS/MS and LC-FAIMS-MS/MS
Ratio of light/heavy peptides by LC-MS/MS analysis was shown in grey ; ratio of light/heavy peptides by LC-
FAIMS-MS/MS analysis was shown in yellow ; SD indicates the standard deciation among FAIMS analysis
The results show that when peptides were selected at different CVs (-25 V, -30 V, -35 V and -
40 V), FAIMS was not altering the transmission efficiency of peptides with isotope labels, as
indicated by the standard deviation between LC-MS/MS and LC-FAIMS-MS/MS analyses.
Comparison of the ratio of light/heavy peptide between LC-MS/MS and LC-FAIMS-MS/MS
analyses demonstrated LC-FAIMS-MS/MS was capable of performing quantitative analysis.
A few peptides failed to be identified in FAIMS or both of the methods, which is possibly due
to their poor capacity to bind columns, low abundance in the mixture or inadequate CV steps.
Figure 3.1 shows the MS/MS spectrum of 2+ peptide ALIVLAHSER obtained via LC-MS/MS
and LC-FAIMS-MS/MS at CV of -25.0 V and -30.0 V.

75
Figure 3.1 MS/MS spectrum of 2+ peptide ALIVLAHSER
A: LC-FAIMS-MS/MS, CV -25 V; B: LC-FAIMS-MS/MS, CV -30 V; C: LC-MS/MS
3.2.2 Phosphoproteomic analysis of 293T cells by LC-MS/MS and LC-
FAIMS-MS/MS
3.2.2.1 Workflow
The whole cell lysate of 293T cells was digested, as described in Chapter 2.2.1. For LC-MS/MS
analysis, peptides were separated by SCX, following by phosphoenrichment. Previous

76
experiments conducted within the laboratory suggested that the optimum CV range for
proteomic analysis ranged from -20 V to -50 V. Therefore, a CV range of -20 V to -50V was
selected. For LC-FAIMS-MS/MS, 13 separate analyses were performed and for each the CV
remained constant throughout (CV -20 V, -22.5 V, -25 V…-50 V), as described in Chapter
2.2.4.1.
Figure 3.2 Workflow of phosphoproteomics analysis of 293T cells
293T cells lysates were halved after trypsin digestion. For LC-MS/MS analysis, peptides were fractionated by
SCX, enriched and submitted for 12 LC-MS/MS runs. For LC-FAIMS-MS/MS analysis, peptides were enriched
and analysed at 12 individual CVs.
3.2.2.2 Results
Table 3.2 Number of peptides and proteins identified
MS SCX-LC-MS/MS LC-FAIMS-MS/MS Overlap
Phosphopeptide 2034 340 155
Protein 939 184 96
Table 3.2 shows the number of non-redundant phosphopeptides identified from the two
analyses. A total of 2034 non-redundant phosphopeptides were identified by LC-MS/MS
(duplicate), compared to 340 by FAIMS analysis (one replicate). LC-MS/MS outperformed
FAIMS in terms of the number of identifications. Due to instrument failure, only one set of

77
FAIMS analysis was performed, which has limited the identification number to some extent. It
is also possible that the phosphoenrichment before FAIMS was not efficient. Moreover, these
data may indicate further optimization of FAIMS is necessary. It should be noted that although
limited information was obtained, 54.4% of the identification by FAIMS was missed by LC-
MS/MS approach, which implied FAIMS has the potential to augment proteome research.
Figure 3.3 (A) Number of phosphopeptides identified in LC-MS/MS per SCX fraction and (B) number of
phosphopeptides identified in LC-FAIMS-MS/MS per CV step.
Figure 3.3 shows the number of phosphopeptides identified per SCX fraction and CV step. In
LC-MS/MS analyses, 57.2% phosphopeptides were identified from the fraction 3 to 6. In the
latter fractions, non-phosphopeptides started to appear while the number of phosphopeptides
has started to decrease, which is in agreement with previous studies196. In the FAIMS analyses,
the identification of phosphopeptides is more evenly distributed across the CV range and the
majority (92.3%) of phosphopeptide are identified from CV ranging from -25.0 V to -42.5 V.
These data provided the basis for further optimization of CV range.
0
200
400
600
800
1 2 3 4 5 6 7 8 9 10 11 12 13
Nu
mb
er
of
ph
os
ph
op
ep
tid
e
SCX fractions
ETD
Overlap
CID
A
B
0
20
40
60
80
100
120
Nu
mb
er
of
ph
os
ph
op
ep
tid
e
Compensation voltage
ETD
Overlap
CID
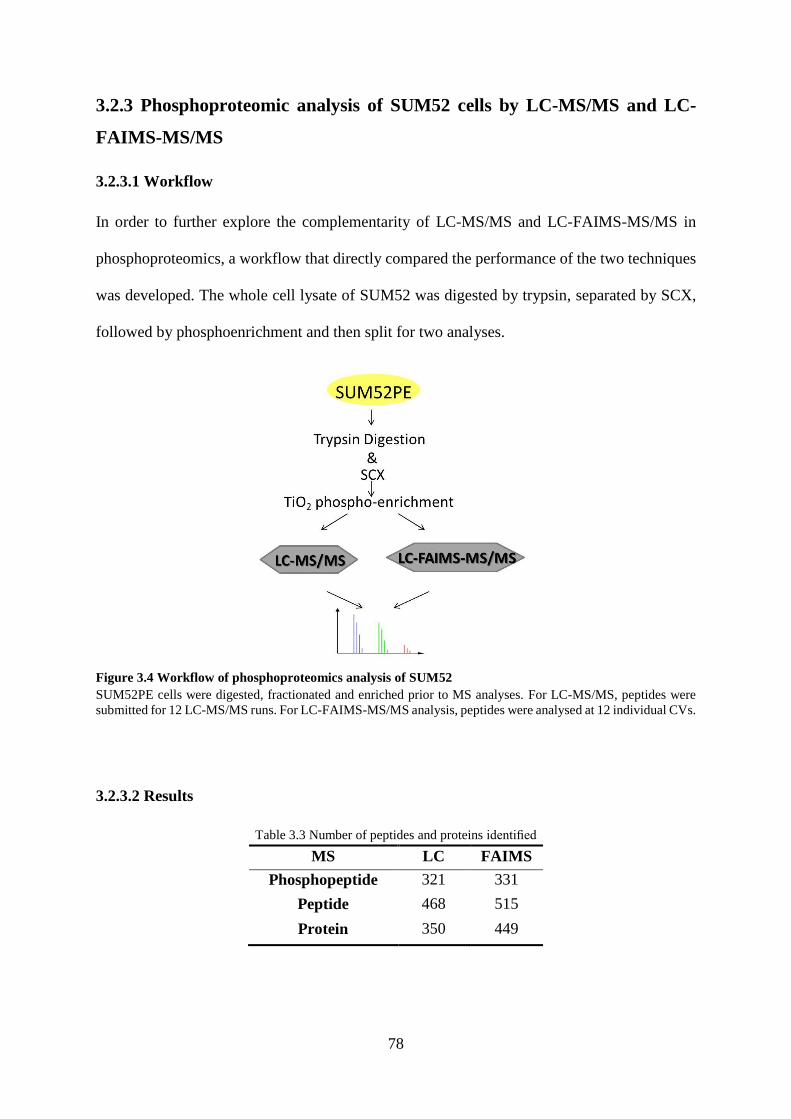
78
3.2.3 Phosphoproteomic analysis of SUM52 cells by LC-MS/MS and LC-
FAIMS-MS/MS
3.2.3.1 Workflow
In order to further explore the complementarity of LC-MS/MS and LC-FAIMS-MS/MS in
phosphoproteomics, a workflow that directly compared the performance of the two techniques
was developed. The whole cell lysate of SUM52 was digested by trypsin, separated by SCX,
followed by phosphoenrichment and then split for two analyses.
Figure 3.4 Workflow of phosphoproteomics analysis of SUM52
SUM52PE cells were digested, fractionated and enriched prior to MS analyses. For LC-MS/MS, peptides were
submitted for 12 LC-MS/MS runs. For LC-FAIMS-MS/MS analysis, peptides were analysed at 12 individual CVs.
3.2.3.2 Results
Table 3.3 Number of peptides and proteins identified
MS LC FAIMS
Phosphopeptide 321 331
Peptide 468 515
Protein 350 449
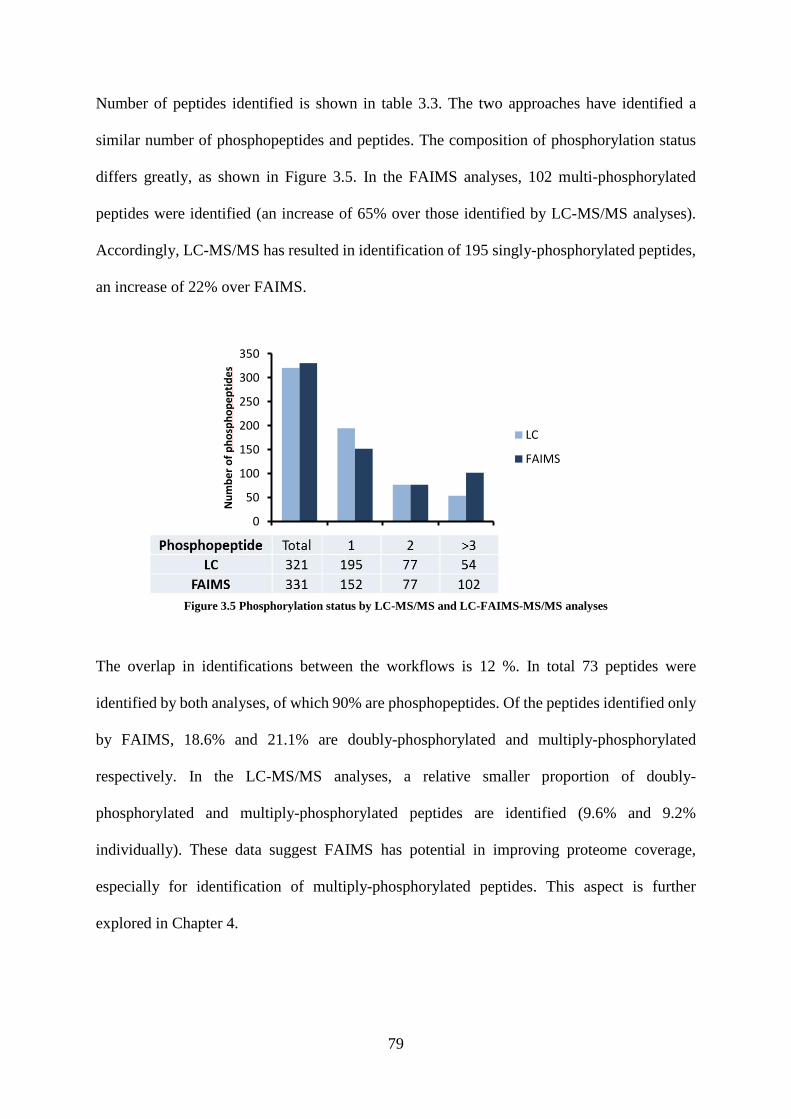
79
Number of peptides identified is shown in table 3.3. The two approaches have identified a
similar number of phosphopeptides and peptides. The composition of phosphorylation status
differs greatly, as shown in Figure 3.5. In the FAIMS analyses, 102 multi-phosphorylated
peptides were identified (an increase of 65% over those identified by LC-MS/MS analyses).
Accordingly, LC-MS/MS has resulted in identification of 195 singly-phosphorylated peptides,
an increase of 22% over FAIMS.
Figure 3.5 Phosphorylation status by LC-MS/MS and LC-FAIMS-MS/MS analyses
The overlap in identifications between the workflows is 12 %. In total 73 peptides were
identified by both analyses, of which 90% are phosphopeptides. Of the peptides identified only
by FAIMS, 18.6% and 21.1% are doubly-phosphorylated and multiply-phosphorylated
respectively. In the LC-MS/MS analyses, a relative smaller proportion of doubly-
phosphorylated and multiply-phosphorylated peptides are identified (9.6% and 9.2%
individually). These data suggest FAIMS has potential in improving proteome coverage,
especially for identification of multiply-phosphorylated peptides. This aspect is further
explored in Chapter 4.
0
50
100
150
200
250
300
350
Total 1+ 2+ >3+
Nu
mb
er
of
ph
osp
ho
pe
pti
de
s
LC
FAIMS

80
Figure 3.6 Overlap between LC-MS/MS and LC-FAIMS-MS/MS analyses
The table below shows the difference in phosphorylation status
Nevertheless, in this experiment the overall proteome coverage was low and limited
information was obtained. This is partly due to the FAIMS workflow needing to be further
optimised. It is possible that following SCX, the efficiency of enrichment is limited, which
could affect the number of phosphopeptides. Therefore, a replicate experiment was performed
with more TiO2-enrichment tips. As shown in Table 3.4, LC analysis identified 736
phosphopeptides compared to 660 identified by FAIMS.
Table 3.4 Number of peptides and proteins identified in LC-MS/MS and LC-FAIMS-MS/MS analyses
Number of LC FAIMS
Phosphopeptide 736 660
Peptide 1271 979
Protein 499 349

81
3.2.4 Optimization of phosphoenrichment
The TitansphereTM Phos-TiO2 Kit is based on lactic acid assisted phosphoenrichment using a
TiO2 micro column. Zhao and co-workers developed a two-step separation procedure for
sequentially enriching mono- and multi-phosphorylated peptides using citric acid109 and
improvement of multi-phosphorylated peptides identification was observed. In order to
evaluate this method and to further apply it to large-scale phosphoproteomic analysis, an
experiment comparing the performance of lactic acid and citric acid was performed.
Whole cell lysate of SUM52PE was digested overnight by trypsin. After desalting with Sep-
Pak, phosphopeptides were enriched with TitansphereTM Phos-TiO2 kit using lactic acid and
citric acid according to Zhao et al. Enriched peptides were desalted using reversed phase C18
Zip-Tip prior to LC-MS/MS analyses.
Figure 3.7 Phosphopeptides identified by two enrichment methods (one repeat)
Citric acid-assisted enrichment resulted in a slight increase in the number of phosphopeptides
but a very different group of phosphopeptides was identified (see Figure 3.7). Citric acid
resulted in a 20.0% increase in the identifications of multiply-phosphorylated peptides
compared to lactic acid-assisted enrichment. The two-step method is helpful for the enrichment
and purification of phosphopeptide, especially multi-phosphorylated peptides. In this thesis, in
order to achieve maximum proteome coverage, phosphoenrichment was performed by lactic
acid and two-step citric acid jointly in Chapter 4.

82
Table 3.5 Peptides identified in phosphoenrichment by lactic acid and citric acid
Number of Lactic acid Citric acid
Peptide 340
363
Phosphopeptide 248 274
Multi-phosphor (%) 25.9 46.2
3.3 Conclusion
The performance of LC-FAIMS-MS/MS for quantitative proteomic analysis was evaluated.
The use of calibration standards with isotopic labels showed FAIMS did not alter quantitation
results compared with the LC-MS/MS method. The method for quantitative LC-FAIMS-
MS/MS analysis was established using 293T cells and SUM52 cells. A CV range from -22.5
V to -50 V was selected for further experiments.

83
CHAPTER 4
FAIMS AND PHOSPHOPROTEOMICS OF
FGF SIGNALLING
The content of this chapter has been published in Journal of Proteome Research: Zhao H,
Cunningham DL, Creese AJ, Heath JK, Cooper HJ. FAIMS and Phosphoproteomics of
Fibroblast Growth Factor Signaling: Enhanced Identification of Multiply Phosphorylated
Peptides. 2015, 14(12), 5077-87

84
4.1 Introduction
By current technologies, singly-phosphorylated peptides constitute the majority of the total
phosphopeptides identified140. The identification of doubly- and multiply-phosphorylated
peptides is more challenging due to their low stoichiometry, poor binding ability to
chromatographic columns. Nevertheless, deciphering mechanisms of FGFR signalling requires
the knowledge of multiply-phosphorylated peptides as the adjacent phosphorylation sites may
play important regulatory roles. Therefore, one of the major challenges in phosphoproteomics
research is to map sites of modification in multiply-phosphorylated peptides.
Figure 4.1 Schematic diagram of sample preparation workflow
In this chapter, LC-MS/MS and LC-FAIMS-MS/MS was applied for the investigation of site-
specific phosphorylation in FGFR signalling. Previously, quantitative LC-MS/MS was used to
identify SFKs-mediated phosphorylation events in FGFR signalling. To further map the key
phosphorylation events involved in FGF signalling and SFKs, we used the SILAC approach
combined with inhibition of FGFR and SFK. SU5402, a specific FGFR tyrosine kinase
inhibitor, and dasatinib, a SFKs inhibitor, were used. Figure 4.1 describes the sample

85
preparation workflow. SILAC-labelled SUM52 cells were treated with either SU5402 or
dasatinib before FGF1 stimulation. Following cell lysis, equal amounts of cell lysates were
pooled and digested by trypsin. Next, peptides were fractionated and enriched, and each of the
resulting twelve fractions was then divided into two for separate LC-MS/MS and LC-FAIMS-
MS/MS analysis. Each LC-FAIMS-MS/MS analysis was performed at a separate and constant
compensation voltage (-22.5 V, -25.0 V, -27.5 V…-50.0 V, in 2.5 V steps).
4.2 Results
4.2.1 Phosphopeptide identification by LC-MS/MS and LC-FAIMS-MS/MS
In LC-MS/MS analyses, a total of 3197 non-redundant peptides were identified, of which 2741
were phosphopeptides (85.7%), as shown in Table 4.1. From these phosphopeptides, 2642
phosphosites were identified, of which 1853 phosphosites were accurately localized. Within
the well-localised phosphosites, 1542 serine (83.2%), 207 threonine (11.1%) and 104 tyrosine
(5.6%) residues were identified.
Table 4.1 Summary of LC-MS/MS and LC-FAIMS-MS/MS analyses
In LC-FAIMS-MS/MS analyses, a total of 1774 non-redundant peptides were identified, of
which 1529 were phosphopeptides (86.2%). Within these phosphopeptides, a total of 1930
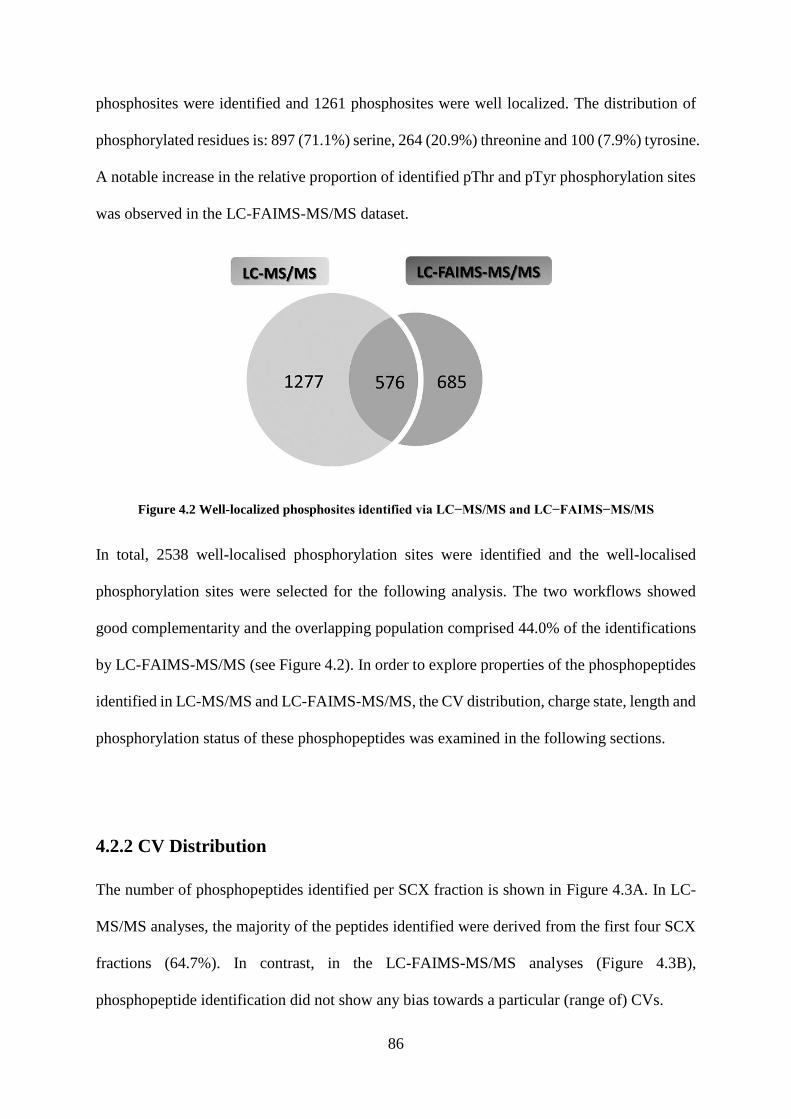
86
phosphosites were identified and 1261 phosphosites were well localized. The distribution of
phosphorylated residues is: 897 (71.1%) serine, 264 (20.9%) threonine and 100 (7.9%) tyrosine.
A notable increase in the relative proportion of identified pThr and pTyr phosphorylation sites
was observed in the LC-FAIMS-MS/MS dataset.
Figure 4.2 Well-localized phosphosites identified via LC−MS/MS and LC−FAIMS−MS/MS
In total, 2538 well-localised phosphorylation sites were identified and the well-localised
phosphorylation sites were selected for the following analysis. The two workflows showed
good complementarity and the overlapping population comprised 44.0% of the identifications
by LC-FAIMS-MS/MS (see Figure 4.2). In order to explore properties of the phosphopeptides
identified in LC-MS/MS and LC-FAIMS-MS/MS, the CV distribution, charge state, length and
phosphorylation status of these phosphopeptides was examined in the following sections.
4.2.2 CV Distribution
The number of phosphopeptides identified per SCX fraction is shown in Figure 4.3A. In LC-
MS/MS analyses, the majority of the peptides identified were derived from the first four SCX
fractions (64.7%). In contrast, in the LC-FAIMS-MS/MS analyses (Figure 4.3B),
phosphopeptide identification did not show any bias towards a particular (range of) CVs.

87
Figure 4.3 Unique peptides identified in (A) LC-MS/MS and (B) LC-FAIMS-MS/MS analyses
4.2.3 Charge state distribution
The distribution of charge states of the identified phosphopeptides is shown in Figure 4.4.
Doubly-charged ions (57.7%) constituted the majority of identifications from the LC-MS/MS
dataset, with 3+ ions contributing 36.6% of the identifications. For the LC-FAIMS-MS/MS
dataset, 26.9% of the total identifications arose from 2+ precursor ions, compared with 63.8%
from 3+ ions.
Figure 4.4 Pie chart showing doubly, multiply-charged peptides in LC-MS/MS and LC-FAIMS-MS/MS
analyses

88
Further examination revealed that the majority of the 2+ peptides were identified from the first
four fractions, see Figure 4.5. The distribution of triply charged peptides showed a bimodal
distribution.
Figure 4.5 Distribution of 2+ and 3+ ions identified in (A) LC-MS/MS and (B) LC-FAIMS-MS/MS
Examination of the LC-MS/MS dataset showed, again, that the majority of ions are identified
in the first four fractions (Figure 4.5A). In the LC-FAIMS-MS/MS dataset, 2+ and 3+ ions
were identified at distinctly different CV ranges (Figure 4.5B). Doubly-charged ions were
mainly observed in CV -22.5 V to -30 V (72.8%); however, 3+ ions were identified throughout
all CVs.
4.2.4 Phosphopeptide length
The length of the phosphopeptides identified in the FAIMS dataset ranged from 7 to 40 amino
acids and 98.6% were between 7 to 33 amino acids. The distribution of phosphopeptides

89
according to peptide length (7 to 33 amino acids) and CV is shown in Figure 4.6A. The heat
map identified two areas with high incidence of phosphopeptide identification. One is in the
CV range -22.5 V to -27.5 V and length 12-18 amino acids. The other area is in the CV range
-32.5 V to -47.5 V and length 15-21 amino acids. The two regions overlap with the charge state
distribution discussed above: the top-left area is mostly comprised of 2+ phosphopeptides and
the middle one is exclusively comprised of 3+ ions. For phosphopeptides identified in LC-
MS/MS analyses, 64.7% peptides were identified from the first 4 fractions and 72.5% the
peptides were between 11 and 23 amino acid residues (Figure 4.6B).
Figure 4.6 Distribution of identified phosphopeptides in (A) LC-MS/MS and (B) LC-FAIMS-MS/MS
according to fraction and peptide length (number of amino acid residues). Numbers in each cell represent the
number of phosphopeptides identified under the given condition.
A
B

90
4.2.5 Phosphorylation status
The distribution of singly-, doubly- and multiply-phosphorylated peptides is shown in Figure
4.7A. The majority of the phosphopeptide assignments were singly-phosphorylated in both
workflows (80.7% in LC-MS/MS dataset and 70.5% in LC-FAIMS-MS/MS dataset). A total
of 29.5% of the phosphopeptides identified in the LC-FAIMS-MS/MS analyses were doubly-
or multiply-phosphorylated, compared with 19.3% in the LC-MS/MS analyses.
Figure 4.7 (A) Distribution of singly-, doubly- and multiply-phosphorylated peptides. (B) Comparison of
singly-, doubly- and multiply-phosphorylated peptides in LC-MS/MS and LC-FAIMS-MS/MS
The distribution of charge states for the doubly- and multiply-phosphorylated peptides
identified is shown in Figure 4.8. The multiply-phosphorylated peptides are mainly associated
with 3+ ions in the FAIMS dataset compared to non-FAIMS. The enhanced identification of
multiply phosphorylated peptides is likely due to the separation of charge states by FAIMS.

91
Figure 4.8 Distribution of charge states of doubly- and multiply- phosphorylated peptides in (A) LC-
MS/MS analyses and (B) LC-FAIMS-MS/MS analyses
In Figure 4.9, the overlap in identification of doubly-phosphorylated peptide from the two
workflows was 21.2%. For multiply-phosphorylated peptides, only 7 of the 188
phosphopeptides were identified by both methods, less than 4% of the total multiply-
phosphorylated peptide identifications, emphasizing the complementarity of the two methods,
particularly in multiply-phosphorylated peptides.
Figure 4.9 Identification of doubly- and multiply-phosphorylated peptides from LC-MS/MS and LC-
FAIMS-MS/MS: (A) doubly-phosphorylated peptides and (B) multiply-phosphorylated peptides
4.2.6 Novel phosphorylation sites
To further probe the two datasets, PhosphoSitePlus (http://www.phosphosite.org)197 was used
to identify novel phosphorylation sites from the known sites. In the LC-MS/MS dataset, 75
(4.3%) of the identified phosphosites were novel phosphorylation sites, including 33 pSer sites,

92
9 pThr sites and 33 pTyr sites. Only three of these sites were also identified in the LC-FAIMS-
MS/MS dataset. In contrast, 227 novel phosphosites (19.9%) identified by LC-FAIMS-MS/MS
have not been previously reported, comprising of 168 pSer, 42 pThr and 17 pTyr sites.
Remarkably, 187 of the novel phosphorylation sites were assigned from multiply-
phosphorylated peptides. Details of the novel phosphosites can be found in Appendix 1.
In order to explore the sequence features of the novel sites, Motif-X198 was used to identify
motifs from the novel phosphosites identified in the LC-FAIMS-MS/MS dataset. From 227
novel phosphorylation sites, 3 potential motifs were identified (P<0.0003): SxxT, SxxxT and
TxxxxS (see Figure 4.10). SxxxT is a highly conserved motif, recognised by MAPKK
supergene family in animals199. As promotion and attenuation of FGF signalling requires the
involvement of the MAPKK cascade, this observation indicates that substrates of MAPKK
with uncharacterised phosphorylation sites may possess interesting properties for further
investigation. No consensus motif was identified from the novel phosphosites identified in the
LC-MS/MS dataset.
Figure 4.10 Motif analysis of the novel phosphorylation sites in the LC-FAIMS-MS/MS analyses
Motif-X centred on the phosphorylated serine residue. The size of the adjacent amino acid indicates the frequency
of the appearance of a particular amino acid.

93
To determine if the enhancement in identification of novel phosphorylation sites is associated
with charge state, the charge state distribution was profiled. In the LC-FAIMS-MS/MS
analyses, phosphopeptides with charge states ≥ 3+ represented 91.2% of the novel sites
identified compared to 55.3% in LC-MS/MS analyses.
Further analysis by DAVID Functional Classification200 based on KEGG database revealed a
number of highly involved proteins (see Appendix 2). A cluster of G protein-coupled receptors
(GPCRs) was enriched in the novel proteins identified in the LC-FAIMS-MS/MS workflow.
An example of this is Trem-like transcript 2 (TLT-2) protein, a cell surface receptor protein
that may play a role in immune response201. A quadruply-phosphorylated peptide
MAPAFLLLLLLWPQGCVSGPpSADpSVpYpTK of TLT-2 including the signal peptide
region (1-18) was identified at CV of -27.5V. Tandem mass spectrum of the 3+ peptide was
shown in Figure 4.11. The signal peptide region is not phosphorylated, but the N-terminus of
Ig-like V-set domain (19-268) is highly phosphorylated and this is the first time that
phosphorylation sites have been reported within this region.
Figure 4.11 CID mass spectrum of [M+3H]3+ ions of MAPAFLLLLLLWPQGCVSGPpSADpSVpYpTK at
CV of -27.5 V, a multiply-phosphorylated peptide containing previously unobserved phosphosites

94
4.2.7 FGFR and Src mediated phosphorylation events
4.2.7.1 Initial assessment
To analyse the quantitative response of the phosphosites, an initial assessment was necessary.
In the LC-MS/MS dataset, SILAC information on 75.6% of the identified phosphosites were
obtained compared to 69.8% in LC-FAIMS-MS/MS dataset. SILAC ratios were normalised
(by Maxquant) to avoid unimodal global distribution. The fold change cut-off was applied
based on a previous experiment. In that experiment, samples labelled with light, medium and
heavy isotopic labels were mixed in equal portions and subjected to LC-MS/MS analysis. The
mean SILAC ratios and SD was calculated. For a probability cut-off of p=0.05, the mean ratio
± 2SD was between 0.58 and 1.73. For a more stringent cut-off (p=0.0027), the mean ratio ±
3SD was between 0.44 and 2.23. Therefore, |log2 (FC)|=1 was defined as the boundary of
differentially regulated phosphosites to give greater than 95% confidence.
The consistency of quantitation results of the two approaches is shown in Figure 4.12. The
quantitation results of the corresponding peptides between the two approaches are in good
agreement with 68.6% of the fold-change ratios in the 95% confidence interval.

95
Figure 4.12. Histogram showing the quantitation consistency between LC-MS/MS and LC-FAIMS-MS/MS
assays. The frequency was calculated using the ratio of the fold-change of the corresponding peptides of LC-
MS/MS against LC-FAIMS-MS/MS assays. (A) Quantitation of SU5402/FGF1; (B) Quantitation of
dasatinib/FGF1.
The labelling efficiency of SILAC approach was determined by submitting the light, medium
and heavy isotope labelled peptides for individual LC-MS/MS analysis. A manual analysis was
performed to ensure the medium and heavy cells were corrected labelled over 98.5%.
4.2.7.2 SU5402 and dasatinib sensitive phosphosites
In order to map the phosphosites regulated by SU5402 and dasatinib, a large-scale quantitative
analysis was performed. The comparative analysis of phosphosites responded to SU5402 in
LC-MS/MS dataset only, LC-FAIMS-MS/MS dataset only and in both is shown in Figure 4.13.

96
Figure 4.13 (A) Log2 plot of the ratio of the peptide abundance for SU5402/FGF1 treatments for each
phosphopeptide identified; (B) Log2 plot of the ratio of the peptide abundance ratio for dasatinib/FGF1
treatments for each phosphopeptide identified. Peptides identified by FAIMS only are shown in green and
those identified by LC-MS/MS only are shown in red. Peptides identified by both are shown in blue. Dashed lines
indicate the cut-off (log2 = ±1).
A high occurrence of global down-regulation in phosphorylation levels was observed in the
FGF pathway and downstream processes. A total of 256 phosphosites responded to SU5402
(log2 ≤ -1 or log2 ≥ 1) were detected by both methods (Figure 4.13, shown in blue). LC-MS/MS
identified 175 phosphosites (shown in red) and LC-FAIMS-MS/MS identified 153

97
phosphosites (shown in green) sensitive to SU5402 treatment. There were 186 phosphosites
down-regulated due to SU5402 treatment, of which 70 were uniquely identified via the FAIMS
workflow. Seventy four phosphosites were up-regulated in response to SU5402, with 29 unique
to FAIMS workflow (see Table 4.2).
There are 87 phosphosites sensitive to dasatinib were detected by both methods. LC-MS/MS
and LC-FAIMS-MS/MS identified 24 and 60 phosphosites sensitive to dasatinib respectively.
A total of 40 phosphosites were down-regulated due to dasatinib treatment, of which 27 were
uniquely identified via the FAIMS workflow. Forty-seven phosphosites were found to be up-
regulated in response to dasatinib, with 32 unique to the FAIMS workflow.
Table 4.2 Summary of quantitation analysis
The LC-MS/MS and LC-FAIMS-MS/MS dataset was further explored to interrogate the
coordination between SU5402 and dasatinib treatments. A log2-log2 plot was used to visualise
the underlying interaction (see Figure 4.14). There are 53 phosphosites sensitive to both
SU5402 and dasatinib treatment. LC-FAIMS-MS/MS alone detected 38 phosphosites sensitive
to both treatments, 2 of which were found by both methods.

98
Figure 4.14 (A) Log2-log2 plots to visualise SU5402 and dasatinib sensitive phosphosites.
The ratio of phosphosites abundance of SU5402/FGF1treatment is plotted against the ratio of dasatinib/FGF1 treatments. Phosphosites identified by LC-MS/MS analyses
only are shown in red. Phosphosites derived from singly- and multiply-phosphorylated peptides identified by FAIMS only are shown in blue and green respectively. Those
identified by both methods are shown in grey. Dashed lines indicate the cut-off (log2 = ±1).

99
4.2.7.3 SU5402 and dasatinib sensitive proteins
The DAVID Functional Classification tool was used to identify the protein groups in response
to SU5402 and dasatinib. The regulated peptides were submitted to DAVID and two groups of
protein were enriched in the KEGG database annotation. One is the kinases involved in the cell
cycle regulation and translation. For instance, ribosomal protein S6 kinase beta-2 (S6K2) with
decreased phosphorylation upon SU5402 and dasatinib inhibition was identified in FAIMS
analysis. S6K2 has been previously identified as a downstream effector of FGF signalling202.
The other group contains a cluster of cell membrane receptors participating in signal
transduction, such as LILRB1 and MRG.
Although some of the identified proteins were already known to be associated with FGF
signalling, many of the individual proteins or phosphosites identified are novel to this pathway.
As an example, breast cancer anti-estrogen resistance protein 3 (BCAR3) acts as an adapter
protein for tyrosine kinase-based signalling in breast cancer cells203. The FAIMS results
revealed a previously unidentified phosphorylation site within this protein (Thr 368). It has
been shown BCAR3 enhances cell mobility through interaction with p130 and Src. It has been
demonstrated this binding capacity could be greatly reduced when Src activity is affected204.
The phosphorylation level of T368 site was up-regulated upon SU5402 and dasatinib treatment.
Whether or not the up-regulation of T368 is associated with the activity of BCAR3 is yet
unknown: this result may provide an entry point to decipher mechanisms of estrogen regulation.

100
4.2.7.4 Enrichment in multiply-phosphorylated peptides
Table 4.3 Phosphopeptides containing novel phosphosites sensitive to SU5402 or dasatinib
Modified sequenceNovel
site
Amino
acid
No of
phosphositesCharge
Localization
probability
(ac)ATPAAVNPPEMAS(ph)DIPGSVTLPVAPM(ox)AAT(ph)GQVR 29 T 2 4 0.957
(ac)EETMKLAT(ph)M(ox)EDT(ph)VEYCLFLIPDESR 12 T 2 3 0.758
(ac)M(ox)S(ph)S(ph)NSDTGDLQES(ph)LK 3 S 3 3 0.899
(ac)MAS(ph)LS(ph)AAAIT(ph)VPPSVPSR 3 S 3 3 1.000
AS(ph)SPHQAGLGLS(ph)LTPS(ph)PES(ph)PPLPDVSAFS(ph)RGRGGGEGR 2 S 5 4 0.826
AS(ph)SPHQAGLGLS(ph)LTPS(ph)PES(ph)PPLPDVSAFS(ph)RGRGGGEGR 29 S 5 4 0.787
ASLY(ph)VGDLHPEVT(ph)EAM(ox)LY(ph)EK 13 T 3 3 1.000
AT(ph)PLS(ph)STVTLS(ph)M(ox)S(ph)ADVPLVVEY(ph)K 22 Y 5 3 0.987
AT(ph)PLS(ph)STVTLS(ph)M(ox)S(ph)ADVPLVVEY(ph)K 11 S 5 3 0.781
AT(ph)PLS(ph)STVTLS(ph)M(ox)S(ph)ADVPLVVEY(ph)K 13 S 5 3 0.781
DQTAALPLAAEET(ph)ANLPPSPPPSPAS(ph)EQTVT(ph)VEEAS(ph)K 36 S 4 3 0.996
DQTAALPLAAEET(ph)ANLPPSPPPSPAS(ph)EQTVT(ph)VEEAS(ph)K 31 T 4 3 0.831
DS(ph)GQVIPLIVES(ph)CIR 2 S 2 2 1.000
DS(ph)GQVIPLIVES(ph)CIR 12 S 2 2 1.000
DSEDS(ph)LY(ph)NDYVDVFY(ph)NTK 7 Y 3 3 0.989
DSEDS(ph)LY(ph)NDYVDVFY(ph)NTK 5 S 3 3 0.942
EVM(ox)LENY(ph)GNVVS(ph)LGILLR 12 S 2 3 1.000
EVM(ox)LENY(ph)GNVVS(ph)LGILLR 7 Y 2 3 1.000
FPGGSCM(ox)AALTVT(ph)LM(ox)VLSS(ph)PLALAGDTR 13 T 2 3 0.953
GS(ph)FIITLVKIPRMILM(ox)Y(ph)IHS(ph)QLK 2 S 3 3 0.868
GS(ph)T(ph)VHT(ph)AY(ph)LVLSSLAMFT(ph)CLCGM(ox)AGNSMVIWLLGFR 18 T 5 4 0.924
GS(ph)T(ph)VHT(ph)AY(ph)LVLSSLAMFT(ph)CLCGM(ox)AGNSMVIWLLGFR 8 Y 5 4 0.814
LES(ph)Y(ph)LDLM(ox)PNPSLAQVK 3 S 2 3 1.000
LLEPGTHQFAS(ph)VPVR 11 S 3 3 1.000
LLS(ph)HPFLS(ph)THLGSS(ph)M(ox)AR 3 S 2 3 0.957
LPAPLIS(ph)KQQFLS(ph)NS(ph)S(ph)R 7 S 4 3 1.000
LPAPLIS(ph)KQQFLS(ph)NS(ph)S(ph)R 13 S 4 3 1.000
LPVAT(ph)IFTT(ph)HAT(ph)LLGR 5 T 2 3 1.000
M(ox)DIGTLIWDGGPVPNT(ph)HINKCKNY(ph)Y(ph)EVLGVTK 25 Y 2 4 0.915
M(ox)GRTPT(ph)AVQVKS(ph)FTK 12 S 4 3 0.990
M(ox)T(ph)CT(ph)AFGNPKPIVT(ph)WLK 14 T 4 2 1.000
MAPAFLLLLLLWPQGCVSGPS(ph)ADS(ph)VY(ph)T(ph)K 27 T 3 3 0.999
MAPAFLLLLLLWPQGCVSGPS(ph)ADS(ph)VY(ph)T(ph)K 26 Y 3 3 0.999
MAPAFLLLLLLWPQGCVSGPS(ph)ADS(ph)VY(ph)T(ph)K 24 S 3 3 0.998
MAPAFLLLLLLWPQGCVSGPS(ph)ADS(ph)VY(ph)T(ph)K 21 S 3 3 0.839
PLAPPPQPPASPTHS(ph)PS(ph)FPIPDR 17 S 2 3 1.000
PLAPPPQPPASPTHS(ph)PS(ph)FPIPDR 15 S 2 3 0.998
QGQY(ph)S(ph)PM(ox)AIEEQVAVIY(ph)AGVR 17 Y 2 3 1.000
QLEPT(ph)VQSLEMKSKT(ph)AR 15 T 2 3 0.908
QLEPT(ph)VQSLEMKSKT(ph)AR 5 T 2 3 0.908
THNYSM(ox)AIT(ph)Y(ph)Y(ph)EAALK 10 Y 3 3 0.979
TLLTPHT(ph)GVT(ph)S(ph)QVLGVAAAVM(ox)TPLPGGHAAGR 7 T 2 5 0.788
TVTGT(ph)T(ph)M(ox)T(ph)LIPSEMPTPPK 8 T 2 3 0.866
VT(ph)VNYYDEEGS(ph)IPIDQAGLFLT(ph)AIEIS(ph)LDVDADR 2 T 3 4 0.841
VT(ph)VNYYDEEGS(ph)IPIDQAGLFLT(ph)AIEIS(ph)LDVDADR 27 S 2 4 1.000
VT(ph)VNYYDEEGS(ph)IPIDQAGLFLT(ph)AIEIS(ph)LDVDADR 11 S 2 4 0.967
VVLAAASHFFNLM(ox)FT(ph)T(ph)NM(ox)LES(ph)K 16 T 2 3 0.996
VVLAAASHFFNLM(ox)FT(ph)T(ph)NM(ox)LES(ph)K 21 S 2 3 0.990
Y(ph)IWGGFAY(ph)LQDM(ox)VEQGIT(ph)R 18 T 2 3 1.000
Y(ph)IWGGFAY(ph)LQDM(ox)VEQGIT(ph)R 1 Y 2 3 1.000
Y(ph)IWGGFAY(ph)LQDM(ox)VEQGIT(ph)R 8 Y 2 3 1.000

101
As described above, an enrichment of multiply-phosphorylated peptides was observed in the
peptides identified by LC-FAIMS-MS/MS: a total of 67 (55.8%) phosphosites sensitive to
SU5402 were from multiply-phosphorylated peptides, compared with 6 from the LC-MS/MS
dataset. Similarly, 46 out of 70 phosphosites sensitive to dasatinib originated from multiply
phosphorylated-peptides in the LC-FAIMS-MS/MS dataset. Furthermore, among the 67
phosphosites sensitive to SU5402 treatment, 31 were novel phosphosites. The results therefore
provide a useful starting point for follow-up functional investigations. A list of novel
phosphorylation sites identified from multiply-phosphorylated peptides sensitive to SU5402 or
dasatinib treatment is presented in Table 4.3.
4.2.7.5 Kinases involved in FGFR-and Src-regulated phosphorylation events
Based on the kinase-substrate specificity assay, the analysis of regulated phosphosites further
reveals how kinases mechanistically affect the changes in a cell. Analysis of amino acid
frequency in the phosphorylation sites in FAIMS and non-FAIMS dataset was performed by
WebLogo205 (see Figure 4.15A). The majority of the sequence motif is pSer-derived in both
datasets. A higher frequency of serine residues in proximity to the site of phosphorylation in
the FAIMS dataset was observed compared to the non-FAIMS because of the multiply
phosphorylated peptides.
To identify kinases with putative roles in FGF signalling, bioinformatics tools were used to
characterise the phosphorylation motifs identified by FAIMS analysis, non-FAIMS analysis
and both methods. Phosphorylation sites sensitive to SU5402 were searched using the kinase
prediction tool iGPS 1.0106 and the number of phosphorylation sites predicted in each method
were displayed representatively in the heatmap shown in Figure 4.15. In total, 355 kinases were
predicted and the kinases with over 22 substrate matches were shown. Kinases with various

102
biological functions were identified. Notably, one family that exhibits active kinase activity in
response to SU5402 is MAPK family kinase (including Erks, p38 and JNKs).
A closer inspection of the phosphorylation sites in response to SU5402 treatment was analysed
by Cytoscape 3.0206. The predicted kinases/shared substrates was visualised by nodes/edges
relationship. A cluster with a high degree of consensus substrates have been classified. In this
cluster, MAP kinases, PLKs and KSRs are fundamental participators Ras-raf-ERK/MAPK
pathway207 and these findings indicate the ERK pathway plays an important role in mediating
FGF signalling. It is noteworthy that the kinase prediction is based on consensus
phosphorylation motif. Therefore, the prediction does not take into consideration
interdependence between multiple phosphorylation sites, which make it difficult to correlate
the function of these sites to the activity of signalling. Pie charts (representing nodes) were
used to display the number of substrates identified in FAIMS analysis, non-FAIMS analysis
and both methods, displayed in Figure 4.16.
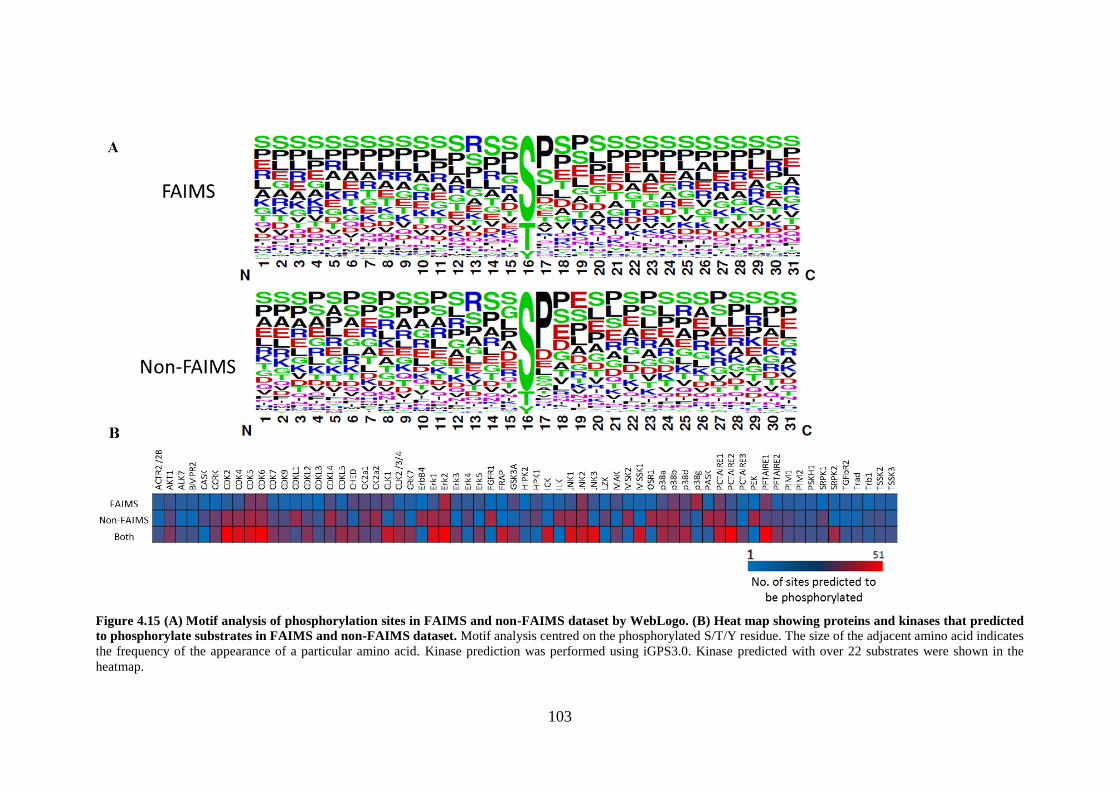
103
Figure 4.15 (A) Motif analysis of phosphorylation sites in FAIMS and non-FAIMS dataset by WebLogo. (B) Heat map showing proteins and kinases that predicted
to phosphorylate substrates in FAIMS and non-FAIMS dataset. Motif analysis centred on the phosphorylated S/T/Y residue. The size of the adjacent amino acid indicates
the frequency of the appearance of a particular amino acid. Kinase prediction was performed using iGPS3.0. Kinase predicted with over 22 substrates were shown in the
heatmap.
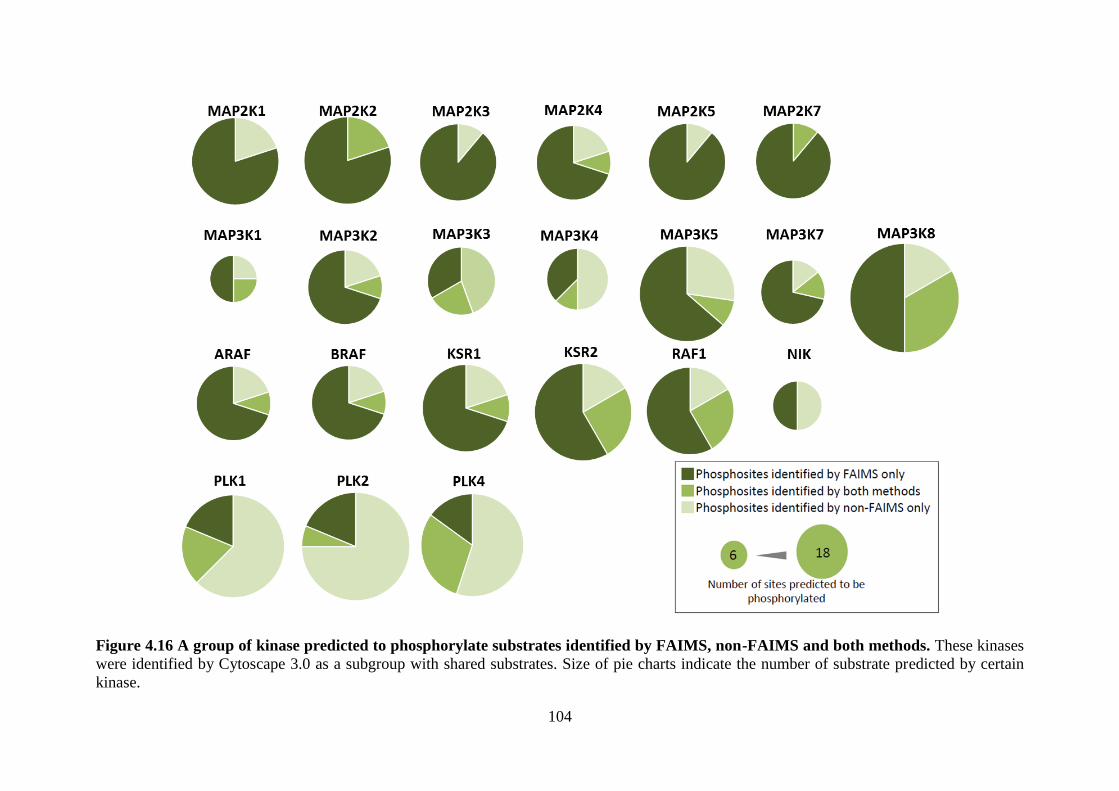
104
Figure 4.16 A group of kinase predicted to phosphorylate substrates identified by FAIMS, non-FAIMS and both methods. These kinases
were identified by Cytoscape 3.0 as a subgroup with shared substrates. Size of pie charts indicate the number of substrate predicted by certain
kinase.

105
4.3 Discussion
4.3.1 Complementarity
The scale of the analyses was not designed to comprehensively map FGF signalling and its
downstream pathways, but to generate a complementary set of phosphosites that provide novel
insights into the field of phosphoproteomic research. The stochastic nature of LC-MS/MS
sampling can result in complementary peptide identifications in technical repeats. Nevertheless,
the application of FAIMS identified a distinct set of phosphosites, which is evidenced by a
37.0% increase in the phosphoproteome coverage. Notably, a similar increase in
phosphoproteome coverage was observed following multiple replicates (n=2) of LC-MS/MS
analyses; however, the properties of the phosphopeptides identified by FAIMS are intrinsically
different to those identified by LC-MS/MS in regards to charge state, length and
phosphorylation status.
Fewer phosphosites were identified from the FAIMS dataset than the non-FAIMS dataset. This
is likely due to low transmission efficiency of FAIMS (typically about 10-20%). In addition,
samples analysed by FAIMS were homogenous while samples analysed by the non-FAIMS
approach were fractionated by SCX. This difference will contribute to the difference in
performance of electrospray ionisation efficiency, LC separation and MS/MS identification.
Note that an increase in the relative proportion of pThr and pTyr sites was observed in the LC-
FAIMS-MS/MS dataset. It has been estimated, in eukaryotic cells, the composition of pSer,
pThr and pTyr sites is expected to be approximately 86.4%, 11.8% and 1.8%107. The successful
identification of tyrosine phosphorylation is particularly challenging as it is a substoichiometric
modification often occurring on low-abundance proteins208. Moreover, knowledge of tyrosine
phosphorylation is necessary in deciphering the mechanisms of signal transduction processes
and regulation of kinase activity.

106
4.3.2 CV distribution
In an acidic solution, most tryptic peptides carry ≥2+ charges, however many tryptic
phosphopeptides carry 1+ or even negative charges due to the addition of phosphate groups209.
Therefore in SCX chromatography, peptides are eluted according to their net charge states:
multiply-phosphorylated peptides are eluted first due to their negative charge, followed by
singly-phosphorylated peptides, missed cleavage phosphopeptides and finally non-
phosphopeptides. An enrichment of phosphopeptides was therefore observed in the first few
fractions. In the FAIMS analyses, samples from all SCX fractions were pooled to ensure
homogeneity, whilst allowing a direct comparison in sample preparation. Thus, the distribution
of phosphopeptides in FAIMS analyses is solely based on pre-set CV values.
The extent of proteome coverage is in proportion to the degree of peptide fractionation and
resolving power of mass spectrometer. The uneven distribution of phosphopeptides across the
12 LC-MS/MS fractions potentially lowers the efficiency of peptide fractionation, as evidenced
by the under-representation of phosphopeptides in the latter eight SCX fractions (35.3% of the
total identifications).
4.3.3 Charge state distribution
In MS analysis, one of the difficulties of phosphopeptide detection is low protonation
efficiency in the presence of acidic groups (e.g. phosphate group). Doubly-charged species are
normally the predominant ions following electrospray of tryptic peptides. By coupling FAIMS
to LC-MS/MS, an enrichment of 3+ and 4+ ions was observed. These findings suggest that the
charge-based selection afforded by the FAIMS device influences the phosphopeptides
identified.

107
In LC-MS/MS analyses, the distributions of peptide charges agree with the pH-dependent
elution from SCX cartridges, where phosphopeptides are eluted first as a result of their negative
charge, followed by non-phosphopeptides then acidic peptides.
4.3.4 Phosphorylation status
In MS analyses, it is more challenging to detect multiply-phosphorylated peptides due to low
ionization efficiency in electrospray process and poor binding to chromatographic columns.
The enhancement in identification multiply-phosphorylated peptides is significant in view of
their low abundance relative to singly- and non-phosphorylated peptides. This finding may be
the result of the improved S/N ratio afforded by FAIMS or charge state differentiation via
FAIMS as discussed above. The identification of singly- and multiply-phosphorylated peptides
did not show any correlation with the distribution of CV.
Successful identification of multiply-phosphorylated peptides and localization of the
phosphorylation sites also has a profound impact on data interpretation, enabling evaluation of
the coordination among adjacent phosphorylation sites or investigation of the dynamics
between singly- and multiply-phosphorylated peptide forms.
4.3.5 Novel phosphorylation status
The results show that coupling FAIMS to LC-MS/MS in phosphoproteomic analyses not only
improves the proteome coverage but also identifies a large set of uncharacterized
phosphorylation sites, suggesting that FAIMS has specifically accessed a group of
phosphosites not readily accessible by LC-MS/MS. Remarkably, a large number of the novel
phosphosites were assigned from multiply-phosphorylated peptides. Again, this finding

108
highlights the advantages of FAIMS in identification of multiply-phosphorylated peptides. A
relationship between the overrepresentation of higher charge state (>3+) and enhanced
identification of multiply-phosphorylated peptides is also established, indicating charge-based
selection of FAIMS may be responsible for the increase in the number of novel sites.
The peptide MAPAFLLLLLLWPQGCVSGPpSADpSVpYpTK was found to be down-
regulated in response to SU5402 but not to dasatinib. Whether these phosphorylation sites in
the N-terminus are involved in cleavage of signal peptides or signal recognition is yet unknown.
An in-depth analysis is required to establish the cross-talk between these phosphorylation
events and perturbation of FGF signalling.
4.3.6 FGFR and Src mediated phosphorylation events
Overall, the results show that chemical inhibition induced significant changes in ~ 17% of the
measured phosphosites. The scale of this experiment was not intended to reveal the whole map
of FGF signalling, but to provide a unique resource of phosphosites for further study and an
example of the utility of FAIMS in phosphoproteomic research.
Activation of FGF signalling can induce diverse cellular response and Erk pathways is one of
the four downstream targets of FGF signalling.210 Activated FGFRs can initiate the downstream
cellular response by phosphorylation of specific residues in MAPK family kinases to induce
cell differentiation. Previous findings also demonstrated that the activation of Erk1/2 could
reduce the FGF-stimulated receptor tyrosine phosphorylation as feedback control.211 Based on
the kinase prediction, our data shows that MAPK pathway exhibits the most prominent
perturbation following the inhibition of FGFR activity.

109
It has been shown, both theoretically and experimentally, that multisite phosphorylation can
generate a switch-like temporal profile of response212 and, when executed in a specific order,
dictates the timing of output responses213,214. The ability to efficiently define multisite
phosphorylation events is of particular biological significance as they represent a significant
regulatory mechanism in a variety of settings. However, judged by existing phosphosite
databases, the extent and identity of multisite phosphorylation events is poorly defined
compared to single site events. Current bioinformatic software, e.g. iGPS and NetWorkin,
mainly focuses on interpretation of single sites, rather than interaction of multi-phosphorylation
sites. Kinases with a variety of biological functions were identified and FAIMS provides a
small and complementary fraction. This is likely because in the FAIMS dataset, 55.8% of
regulated phosphosites were identified from multiply-phosphorylated peptides.
Phosphorylation of tyrosine residues is a well-defined mechanism of eliciting protein/protein
interaction via sequence specific recognition, such as pTyr binding motifs-SH2 domain215.
Recognition of pTyr binding motifs can be modified by concurrent phosphorylation of adjacent
Ser/Thr that occlude the SH2 binding pocket216. This results in the formation/dissolution of
protein complexes, which is controlled by the combined action of Tyr and Ser/Thr directed
kinases. It is notable that multiply-phosphorylated peptides identified in the FAIMS dataset
reveal a significant fraction (58.4%) in which a phosphorylated Tyr is located within ±4
residues of a phospho Ser/Thr. This indicates that the multisite phosphorylation is a prevalent
regulatory event which can be preferentially resolved by the application of FAIMS. Besides,
this points to the work that can be carried out in the following step, which focuses on the
dynamics of key phosphorylation events within FGF signalling. The site-specific analysis of
key phosphorylation sites, especially the interdependence among multisite phosphorylation,
will be of great significance to determine the downstream network of FGF perturbation.

110
4.4 Conclusion
The LC-MS/MS and LC-FAIMS-MS/MS analyses have combined SILAC labelling with SCX
pre-fractionation and phosphoenrichment. This approach allows us to investigate the regulated
phosphorylation events involved in FGF signalling. The two techniques showed
complementarity. The application of FAIMS improved the phosphoproteome coverage by 37.0%
over that identified with the conventional LC-MS/MS workflow. An enhancement in the
identification of multiply phosphorylated peptides and a preference for peptides with high
charge states (3+ and above) was observed in the LC-FAIMS-MS/MS dataset. It is also
observed that ~20% of the phosphosites identified via FAIMS have not been reported
previously. Remarkably, 82.3% of these novel sites are identified from multiply
phosphorylated peptides. These properties make FAIMS a valuable addition to
phosphoproteomic studies, enhancing the coverage of the phosphoproteome and increasing the
confidence of site localisation.
The LC-FAIMS-MS/MS analyses also revealed a substantial number of phosphosites regulated
upon inhibitor treatments, especially sites from multiply-phosphorylated peptides. Hence, I
propose the LC-FAIMS-MS/MS workflow is a suitable complementary approach in
phosphoproteomic analysis. Together, these observations open new possibilities for in-depth
characterisation of interesting candidates for their roles in FGF signalling and trafficking.

111
CHAPTER 5
EVALUATION OF A MODIFIED FAIMS INTERFACE

112
5.1 Introduction
FAIMS, coupled with LC-MS/MS, has been applied in proteomics studies, and offers
advantages including reduced chemical noise and increased signal-to-noise ratio, as described
in the introduction. FAIMS can be applied as a complementary tool to augment proteomic
analysis.
Recently, a novel FAIMS interface (termed modified FAIMS) was introduced with a reduced
electrode gap width (as shown in Figure 1.15) and modified ion inlet design181. The standard
FAIMS electrode consists of an outer electrode with an inner radius of 9 mm and an inner
electrode with a radius of 6.5 mm, forming a 2.5 mm gap. The modified FAIMS electrode is
comprised of the standard outer electrode with an enlarged inner electrode (radius of 7.5 mm).
The gap between electrodes is reduced from 2.5 mm to 1.5 mm. The reduction in gap allows
the application of higher field strength at a fixed DV. The increase in the field magnitude
enhances the ion focusing effect through the electrodes. The modification in the ion inlet
creates a symmetric gas flow, decreasing the disruption of ion flow and increasing the gas flow
to the electrodes. These modifications were reported to enhance the performance of FAIMS
(coupled to a triple quadrupole mass spectrometer) by increasing peak capacity without
decreasing signal output as shown for bromochlorate anions and six tryptic peptides from
bovine serum albumin and enolase181. The aim of the work presented in this chapter was to
characterise the performance of the standard and modified FAIMS device on an Orbitrap mass
spectrometer for proteomic analysis, from a standard peptide to a complex protein digest. The
modified FAIMS device was developed by Thermo Fisher and supplied to the University of
Birmingham for evaluation.
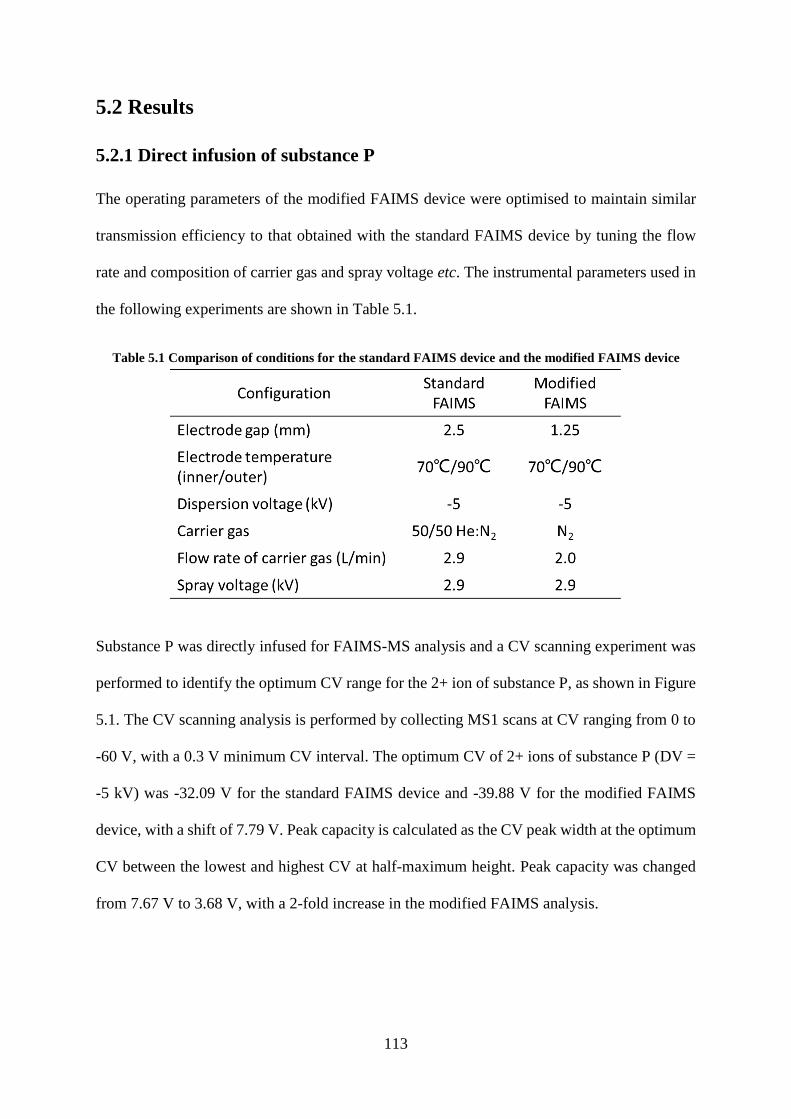
113
5.2 Results
5.2.1 Direct infusion of substance P
The operating parameters of the modified FAIMS device were optimised to maintain similar
transmission efficiency to that obtained with the standard FAIMS device by tuning the flow
rate and composition of carrier gas and spray voltage etc. The instrumental parameters used in
the following experiments are shown in Table 5.1.
Table 5.1 Comparison of conditions for the standard FAIMS device and the modified FAIMS device
Substance P was directly infused for FAIMS-MS analysis and a CV scanning experiment was
performed to identify the optimum CV range for the 2+ ion of substance P, as shown in Figure
5.1. The CV scanning analysis is performed by collecting MS1 scans at CV ranging from 0 to
-60 V, with a 0.3 V minimum CV interval. The optimum CV of 2+ ions of substance P (DV =
-5 kV) was -32.09 V for the standard FAIMS device and -39.88 V for the modified FAIMS
device, with a shift of 7.79 V. Peak capacity is calculated as the CV peak width at the optimum
CV between the lowest and highest CV at half-maximum height. Peak capacity was changed
from 7.67 V to 3.68 V, with a 2-fold increase in the modified FAIMS analysis.

114
Figure 5.1 Optimum CV of 2+ ions of substance P
5.2.2 Direct infusion of a tryptic digest of six standard proteins
A tryptic digest of six standard proteins (cytochrome c, lysozyme, alcohol dehydrogenase,
bovine serum albumin, transferrin and beta-galactosidase) was directly infused for FAIMS
analysis. Two representative peptides were selected for CV scanning analysis, as shown in
Figure 5.2. For 3+ ions of the peptide GTDKcAcSNHEPYFGYSGAFK (transferrin), the
optimum CV shifted from -36.08 V to -47.12 V, an 11.04 V difference. Peak capacity was
changed from 10.43 V to 3.98 V, resulting in a 2.62-fold increase in the modified FAIMS
analysis. A 68% decrease in the ion signal is observed in the modified FAIMS analysis.

115
Figure 5.2 Optimum CV of the peptide (A) GTDKcAcSNHEPYFGYSGAFK and (B)
FDEFFSAGcAPGSPR
Figure 5.2B shows the CV scanning analysis of 2+ ions of the peptide FDEFFSAGcAPGSPR
(transferrin). The optimum CV of this peptide shifted from -28.11 V to -38.53 V from the
standard to the modified FAIMS analysis, resulting in a 10.42 V difference. Peak capacity is
changed from 7.66 V to 3.38 V, resulting in a 2.26-fold increase in the modified FAIMS
analysis. Similarly, a decrease of 72% in the ion signal in the modified FAIMS analysis was
observed.
Overall, direct infusion analysis of these two peptides and substance P revealed the optimum
CV values for transmission shifted on average by approximately 9.75 V when using the
modified FAIMS device. An average increase of 2.32-fold in peak capacity was observed with
the modified FAIMS device.

116
5.2.3 LC-FAIMS-MS/MS analysis of a tryptic digest of six standard proteins
An LC-FAIMS-MS/MS analysis was performed on the tryptic digest of six standard proteins.
Based on the direct infusion experiments described above, a different CV range was selected
for analyses with the standard and the modified FAIMS device: standard FAIMS CV range =
-20 V to -45 V; modified FAIMS CV range = -30 V to -60 V. The ‘external CV stepping’
method was used in which the CV is kept constant throughout the LC-MS/MS analysis, as
described in Chapter 2.2.4.0. The data were searched using the Sequest algorithm in Proteome
Discoverer 1.4.
Figure 5.3 Number of peptides identified across CVs:
CV range of the standard FAIMS analysis -25V to -45V; CV range of the modified FAIMS analysis -30V to -
60V
Figure 5.3 shows the number of peptides identified in each analysis. For the standard FAIMS
analysis, approximately ~70 to ~110 peptides were identified in each analysis with the most
identified at CV = -35 V. For the modified FAIMS analysis, the majority of the peptides were
identified at CVs -35 V and -40 V; at CVs of -50 V to -60 V, no peptides were identified (see
discussion below).

117
Figure 5.4 Sequence coverage, protein score, number of peptide and PSM in FAIMS analyses
The protein sequence coverage, protein score, number of peptide and peptide spectrum matches
(PSM, the number of spectrum matches for the protein) obtained following LC-FAIMS-
MS/MS analyses is shown in Figure 5.4. The two devices provided similar results in terms of
sequence coverage and the number of peptides identified; however, increased scores and PSMs
were observed when using the modified FAIMS device.
5.2.4 LC-FAIMS-MS/MS analysis of SUM52 cell lysate
5.2.4.1 Number of identified peptides
In order to explore the performance of the modified FAIMS device for complex mixtures,
SUM52 cells were lysed, and digested for LC-FAIMS-MS/MS analysis, see Chapter 2.2.2.6.
The CV range for standard and modified FAIMS was further optimised: for the standard
FAIMS device the CV range was -20 V to -45 V; for the modified FAIMS device the CV range

118
was -30 V to -55 V. Experiments were performed in duplicate. The first replicate analyses were
performed on the Orbitrap Velos and the second were performed on the Orbitrap Elite. A
higher number of identifications were observed for both FAIMS devices for the analyses
performed on the Orbitrap Elite. As shown in Figure 5.5, non-redundant peptide identifications
obtained via the two FAIMS devices were complementary, of which 69.4% of the total peptide
identifications were identified by both devices.
Figure 5.5 Number of peptides identified in the FAIMS analysis (performed by Orbitrap Elite)
(A): replicate 1; (B) replicate 2
5.2.4.2 Distribution of peptides according to CV
In order to visualise the number of peptides across the different CV ranges, Figure 5.6 was
plotted. For the standard FAIMS analyses, peptides were uniformly identified across the CV
range. In the modified FAIMS analyses, fewer than 100 peptides were identified from CV steps
-50 V to -55 V.

119
Figure 5.6 Distribution of peptides identified across CV steps in the FAIMS analyses
(A): replicate 1; (B) replicate 2
In the standard FAIMS analyses, e.g. replicate 1, there are 396 peptides identified in each CV
analysis on average, compared with 290 identified in modified FAIMS analyses (excluding CV
of -52.5 and -55). In replicate 2, 1399 peptides are identified in each CV analysis on average
in the standard FAIMS dataset, compared with 1112 identified in the modified FAIMS analyses.
Figure 5.5 shows that use of the modified FAIMS device resulted in more identifications than

120
the standard FAIMS device. This contradiction indicates there might be a lower level of
redundant identifications in the modified FAIMS analysis. To that end, the distribution of
unique peptides was plotted, see Figure 5.7. In the following, redundant peptides refers to the
peptides identified in multiple CV analyses.
5.2.4.3 Redundancy
5.2.4.3.1 Intra-assay redundancy
The intra-assay redundancy was calculated by extracting the matched ions between biological
replicate analyses (see Figure 5.7). The number of matched ions is the number of identified
ions matched to a specific peptide in a single analysis, therefore indicating the level of
redundancy within an assay. The distribution of the number of matched ions between the two
analyses shows a small but significant difference of P<0.0001.
Figure 5.7 Box plot of the number of matched ions in the FAIMS analyses
The box spans from the Q1 (quartile 1) to Q3 (quartile 3) and median (quartile 2) is shown in the middle. Whiskers
above and below the box show the maximum and minimum values. *** indicates a significant difference of
P<0.001. (A): replicate 1; (B) replicate 2

121
5.2.4.3.2 Inter-assay redundancy
Figure 5.8 and Figure 5.9 show the number of unique and redundant peptides identified in each
FAIMS analysis. As predicted, a higher level of redundant peptides was identified in standard
FAIMS analyses. In replicate 1, for example, the average number of unique peptides in each
CV is 98 in the standard FAIMS analyses, while in the modified FAIMS the average number
is 153. The increase in unique peptide identification of the modified FAIMS analyses is 1.56-
fold over the standard FAIMS.
Figure 5.8 Distribution of peptides in the (A) standard and (B) modified FAIMS analysis in replicate 1
Performed by Orbitrap Velos

122
Figure 5.9 Distribution of peptides in the (A) standard and (B) modified FAIMS analysis in replicate 2
Performed by Orbitrap Elite
Figure 5.10 and Figure 5.11 below show the redundancy level in both analyses. The redundancy
rate is calculated by dividing the number of redundant peptides against the number of all
peptides identified in each CV analysis. In replicate 1, the average redundancy rate of the
standard FAIMS analyses is 78.1%, while the redundancy rate of the modified FAIMS analyses
is 49.7%. In replicate 2, the average redundancy rate of the standard FAIMS analyses is 83.1%
and the redundancy rate of the modified FAIMS analyses is 59.0%.

123
Figure 5.10 Replicate 1: redundancy rate of the (A) standard and (B) modified FAIMS analysis
The dashed line indicates the average redundancy level. Performed by Orbitrap Velos.
Figure 5.11 Replicate 2: redundancy rate of the (A) standard and (B) modified FAIMS analysis
The dashed line indicates the average redundancy level. Performed by Orbitrap Velos

124
To further understand the redundancy level, the number of times that a peptide is identified
across the whole analysis was investigated, as shown in Figure 5.12. In replicate 1, in the
standard FAIMS analyses, peptides identified twice and three times constitute 42.5% of the
total identifications. While in the modified FAIMS analyses, peptides identified once alone
constitute 49.9% of the total identifications. In replicate 2, in the standard FAIMS analyses,
peptides identified twice and three times constitute 50.7% of the total identifications. While in
the modified FAIMS analyses, peptides identified once alone constitute 61.8% of the total
identifications.
Figure 5.12 Number of times a peptide is identified in the (A) standard and (B) modified FAIMS analysis

125
5.2.4.4 Charge state
As shown in Chapter 4, the charge-based selection is a feature of FAIMS separation. To explore
differences in the charge-based selection in the modified FAIMS device, Figure 5.13 was
plotted. In each case 2+ ions constitute the majority of the identifications. In experiment 1, the
percentage of 2+ ions is dramatically increased from 58% in the standard FAIMS analyses to
83% in the modified FAIMS analyses. A similar trend was observed in experiment 2, in which
48% of the identifications came from 2+ ions when using the standard FAIMS device compared
with 62% with the modified FAIMS device.
To further understand whether this difference relates to the differences in redundancy level, the
charge state distribution of uniquely identified ions (ions that have been identified in one CV
only) was analysed. A similar trend was observed, where the average proportion of 2+ ions
were increased from 52% to 65% from the standard to the modified FAIMS dataset.
Figure 5.13 Charge state distribution in the standard and modified FAIMS analysis
(A): replicate 1; (B) replicate 2

126
5.3 Discussion
Although FAIMS has proven beneficial for proteomics in recent years, the wide-spread
application has been hindered by poor ion transmission, especially for ions with weak field
dependence or ions having extreme low CV. The recently developed modified FAIMS interface
was reported to have potential to increase ion transmission efficiency217. In the present study,
direct infusion experiments and LC-FAIMS-MS/MS analyses were employed to evaluate the
performance of the standard and the modified FAIMS device in proteomic applications.
5.3.1 Instrumental and operational parameters
The analytical response of FAIMS is controlled by a fine balance of multiple instrumental and
operational parameters. In cylindrical FAIMS, such as that used here, a reduced electrode gap
can increase field strength (E) without altering the DV, and enhance the ion focusing effect218.
For example, by reducing the gap from 2.5 mm to 1.5 mm, the maximum field strength can
increase from -23.6 kV/cm to -42.1 kV/cm. This enhancement significantly improves the peak
capacity, hence increases separation efficiency. It should be noted that the increase in
separation efficiency is at the expense of sensitivity, as shown in Figure 5.2.
The trade-off between sensitivity and resolution has been observed by others and can be
partially offset by tuning the gap width, waveform frequency, carrier gas compositions and
electrode temperatures218–220. By reducing the gap width to 0.5-1 mm, FAIMS becomes more
suitable for large multi-charged ions analysis, especially intact protein separation and
identification218. Barnett and co-workers investigated the effect of temperature and other
variables on field strength and ion separation efficiency220. By inverting the electrode
temperatures (the inner/outer electrode temperature was 70℃/90℃), sensitivity was increased

127
but peak capacity was reduced. Based on this finding, Swearingen et al. tested the performance
of a modified FAIMS device with the addition of a gas-phase fractionation within the mass
analyser using an unfractionated yeast digest217. Their findings were published after our
experiments finished in this chapter. Their device used the electrodes with 1.25 mm gap and
no ion inlet modification was made. By reducing the electrode gap, better separation was
achieved at the expense of a decreased sensitivity, which is in agreement with the results in this
chapter. They found the modified FAIMS, operating at DV of -4 kV, improved protein
discovery by 86%. Further, by inverting the electrode temperatures, the decrease in sensitivity
of modified FAIMS could be partially offset.
Shvartburgs et al. found increasing He fractions in carrier gas composition significantly
improved resolution189. Peak capacity is defined as the ratio of separation space to the peak
width at half maximum. The molecular polarizability of He is much lower than that of N2 and
there is greater unfolding in He-rich environments than N2-rich environments, leading to a
higher separation space in He and, thus, improved peak capacity221. Barnett and Ouellette
demonstrated that using FAIMS with a reduced electrode gap eliminates the He requirement
222. In the present study, therefore, supplemental He is not required as carrier gas. The benefits
of this are reduced costs and risk of He interfering with mass analyser performance of mass
analysers, without sacrificing resolution181.
5.3.2 Direct infusion
Adjustments in electrode gap width were previously reported to alter the gas flow velocities
and CV values222.The results obtained from direct infusion ESI of substance P and tryptic digest
of standard proteins also showed the optimum CV range for peptide ion transmission by the
modified FAIMS device shifted by approximately 9.75 V. Moreover, the shift of CV of

128
different ions follows a similar pattern. In the standard FAIMS device, the DV of -5 kV creates
a field strength equivalent to -23.6 kV/cm. In the modified FAIMS device, the DV is identical
to that in the standard device but due to decrease in the gap width, the field strength is increased
to -43.1 kV/cm. As the field strength is different in the two devices, the voltage required to
compensate ion shift would be different accordingly.
5.3.3 LC-FAIMS-MS/MS analysis of a tryptic digest of six standard proteins
As the sample is a simple protein mixture, the sequence coverage is expected to be limited by
sample purity and instrumental limits. As expected, the two devices achieved similar results
for sequence coverage; however, a higher number of PSMs and higher protein scores were
observed in the modified FAIMS analyses. The number of PSMs indicates the number of
MS/MS spectra matched for any peptide assigned to a particular protein. The results of the
modified FAIMS showed more spectrum were unambiguously matched to the identified
peptides. When using the Sequest algorithm, the protein score relates to the number of possible
peptide matches. Thus, better protein scores were observed in the modified FAIMS analyses.
In the broader CV ranges (from -50 V to 60 V), no peptides were successfully identified. This
result is probably due to the CV range from -30 V to -45 V being adequate for transmission of
peptides from this simple mixture.
5.3.4 LC-FAIMS-MS/MS analysis of SUM 52 cell lysate
In bottom-up proteomics, protein mixtures are usually enzymatically digested into small
peptides and subjected to fractionation and MS analyses. In this manner, identifications yield
a series of redundant results within a single LC-MS/MS analysis, as well as across multiple

129
analyses223. Tremendous efforts have been given to enhance the throughput of MS analysis,
from prolonged fractionations, multiple replicates and multi-stage MS/MS fragmentations224.
Yet little consideration has been given to reducing the redundancy in identifications225.
In the modified FAIMS analyses, the overall reduction in redundant identifications arises
through reduced redundancy levels both within an assay and between assays. For intra-assay
redundancy, statistical tests showed the distribution of the number of matched ions was
significantly lower in the modified FAIMS than that of the standard analyses. For inter-assay
redundancy, the modified FAIMS analyses have shown a lower redundancy rate in peptide
identifications across multiple CV analyses, as demonstrated in Figure 5.11 and 5.12. This
finding can be explained by the reduction in FAIMS peak width in the modified device, as
shown in Figure 5.1 and 5.2. That is, the narrower the peak, the less likely a peptide will be
observed in multiple CV steps. Therefore, the difference in the inter-assay redundancy seems
to have accounted for the overall lower level redundancy.
Typically, FAIMS analyses of complex mixtures are performed at separate CVs, therefore
samples need to be split into a number of fractions for each CV analysis. The splitting of
samples will result in reduced sample amounts and long instrument hours. Therefore, there is
a balance between the number of CV steps and the amount of sample for each analysis. The
reduced peak widths observed with the modified FAIMS allows the analyses to be performed
with fewer CV steps, potentially increasing the sample amount in each analysis.
5.3.4 Charge state
Comparison of the charge state distribution of the peptide identifications from the standard and
modified FAIMS analyses revealed a higher proportion of 2+ peptide ion identification from
the modified FAIMS dataset. Chapter 4 shows that charge-based selection is an important

130
feature of FAIMS separation and, typically, 2+ ions are better transmitted in the non-FAIMS
analyses and 3+ ions are the dominant group in the standard FAIMS analyses. The preference
for lower charge state ions of the modified FAIMS device resembles that of the non-FAIMS
analyses. The extent of charging reflects the compactness of a conformation, where higher
charge state typically indicates unfolded structure226. The difference in peptide/proteins charge
state is also sequence specific. The change in charge state preference in the modified FAIMS
device indicates, for a particular range of CV, the change in the preferred structure, which is
the possible reason for the difference in the preferred CV range in the modified FAIMS device.
The difference in charge state is also likely to contribute to the unique identifications in the
modified FAIMS dataset.
5.4 Conclusion
In this chapter, the performance of a novel FAIMS interface developed by Thermo and supplied
to the University of Birmingham was evaluated and compared with the commercial Thermo
ScientificTM FAIMS device. The direct infusion ESI analysis showed that the modified FAIMS
device resulted in a nearly 3-fold increase in the peak capacity and a CV shift of approximately
10 V. Based on this, a different CV range was selected for LC-FAIMS-MS/MS analysis. In
analysis of tryptic digest of standard proteins, the two devices showed similar results in
sequence coverage but a higher number of PSMs was observed in the modified FAIMS dataset.
In order to further explore the potential of the modified FAIMS in proteomic experiments, a
whole cell lysate sample was analysed. An increase in the proteome coverage of 69.4% was
observed in the modified FAIMS dataset. The increase in proteome coverage can be attributed
to the reduced redundancy in identifications between CV steps in the modified FAIMS analysis,
in turn the result of improved resolution.

131
CHAPTER 6
INVESTIGATION OF DYNAMICS OF THE KEY
PHOSPHORYLATION EVENTS IN FGF SIGNALLING
BY SELECTED REACTION MONITORING

132
6.1 Introduction
In a proteomic workflow, the discovery of key proteins is typically initiated by a large-scale
shotgun experiment for de novo identification of potential biomarkers. A large number of
studies have used this methodology for discovery of potential biomarkers involved in a
biological process or a disease. The selected reaction monitoring (SRM)-based approach can
then be applied for determination and efficient quantitative validation of targeted analytes.
The FGF signalling cascade is the result of protein-protein interactions regulated by specific
phosphorylation events. One of the downstream signalling protein family is Src, a non-receptor
tyrosine kinase, which has been shown to be recruited by receptor-mediated phosphorylation
to the FGF signalling complex to regulate signalling dynamics227. Deregulation of FGF
signalling, such as overexpression and inhibition, has been associated with many human
diseases, including cancer10. It has been indicated that the intervention of FGFR activity can
be accentuated for therapeutic use56. From a clinical view, it is necessary to understand the
downstream effect of this inhibition if patients are to receive treatment with FGFR or Src family
kinases inhibitors.
Previously, in order to understand the global impact on intracellular phosphorylation events
following inhibition of FGFR or Src family kinases, a SILAC experiment was carried out using
the triple negative breast cancer cell lines: SUM52 and MFM233 (unpublished, Debbie
Cunningham et al.,). Results showed that the FGFR dependent phosphorylation events
represented a wide variety of biological functions and processes. Therefore, the understanding
of the key phosphorylation dynamics is a useful indicator of protein activity and related kinase
function.

133
The aim of the work presented in this chapter was to (1) study the dynamics of key
phosphorylation events following activation of FGF signalling, and (2) explore the molecular
mechanisms of the FGF signalling cascade in SUM52 cells.
To directly study the downstream dynamics of FGF signalling, we focused on proteins with
kinase function. In total, 75 phosphopeptides from kinase were selected for the SRM assay,
including 62 singly-phosphorylated peptides and 13 doubly-phosphorylated peptides. These
candidates were selected from kinases that contained phosphosites that were sensitive to
treatment with the FGFR inhibitor, SU5402, in the SILAC experiment described previously
(shown in Table 6.1 and Appendix 2). The phosphorylation profile of these peptides following
FGF1 stimulation was studied in a time-resolved way (0 s, 20 s, 40 s, 1 min, 3 min, 5 min, 10
min, 20 min, 30 min and 60 min). An absolute quantitation strategy was employed (see Chapter
2.2.8). To explore the dynamics of the specific phosphorylation events, peptides with
differentially phosphorylated versions were investigated individually.

134
Table 6.1 Overview of selected phosphopeptides for SRM assay
Peptide sequence Protein Peptide sequence Protein
ALGERVSIL Serine/threonine-protein kinase D1 RLSSTSLASGHSVR Serine/threonine-protein kinase D2
ATDSFSGRFEDVYQLQEDVLGEGAHAR MAP kinase-interacting serine/threonine-protein kinase 2 RLSSTSLASGHSVR Serine/threonine-protein kinase D2
AVLSPGSVFSPGR Inositol-trisphosphate 3-kinase B RLSSTSLASGHSVR Serine/threonine-protein kinase D2
DALDLSDINSEPPRGSFPSFEPR Membrane-associated tyrosine/ threonine-specific cdc2-inhibitory kinase
RNSFTPLSSSNTIR 6-phosphofructo-2-kinase/fructose-2,6-bisphosphatase 2
DINNIDYYKK Fibroblast growth factor receptor 2 RNSFTPLSSSNTIR 6-phosphofructo-2-kinase/fructose-2,6-bisphosphatase 2
DINNIDYYKK Fibroblast growth factor receptor 2 RPHFPQFSYSASGRE RAC-gamma serine/threonine-protein kinase
DINNIDYYKK Fibroblast growth factor receptor 2 RPHFPQFSYSASGRE RAC-alpha serine/threonine-protein kinase
EHIEIIAPSPQR Eukaryotic translation initiation factor 2-alpha kinase 3 RPHFPQFSYSASGRE RAC-alpha serine/threonine-protein kinase
EKFSFEPK Ribosomal protein S6 kinase RPHFPQFSYSASGTA RAC-gamma serine/threonine-protein kinase
EYGSPLKAYTPVVVTQWYR Cyclin-dependent kinase 11B RPPGMEYSYDINR Fibroblast growth factor receptor 2
GAILTTM(ox)LVSR Calcium/calmodulin-dependent protein kinase type II subunit RPPGMEYSYDINR Fibroblast growth factor receptor 2
GAQASSGSPALPR Abelson tyrosine-protein kinase 2 RRSIQDLTVTGTEPGQVSSR Mitogen-activated protein kinase kinase kinase 7
GFSFVATGLM(ox)EDDGKPR Ribosomal protein S6 kinase RSDSASSEPVGIYQGFEK Protein kinase C delta type
GLCTSPAEHQYFMTEYVATR Mitogen-activated protein kinase 7 RSDSASSEPVGIYQGFEK Protein kinase C delta type
GRNSATSADEQPHIGNYR serine/threonine-protein kinase MARK2 RVSLSEIGFGK Cyclin-dependent kinase 16
HFM(ox)HQIITGMLYLHSHGILHR Serine/threonine-protein kinase PLK4 RYSDHAGPAIPSVVAYPK MAP/microtubule affinity-regulating kinase 3
IADPEHDHTGFLTEYVATR Mitogen-activated protein kinase 3 SGEQITSSPVSPK Inositol hexakisphosphate/diphosphoinositol-pentakisphosphate kinase 2
IADPEHDHTGFLTEYVATR Mitogen-activated protein kinase 3 SGGGDLTLGLEPSEEEAPR Receptor tyrosine-protein kinase erbB 2
IADPEHDHTGFLTEYVATR Mitogen-activated protein kinase 3 SHNDFVAILDLPEGEHQYK 5'-AMP-activated protein kinase subunit beta 2
IADPEHDHTGFLTEYVATR Mitogen-activated protein kinase 3 STVASMMHR Calcium/calmodulin-dependent protein kinase type II subunit delta
KLPSTTL Ribosomal protein S6 kinase SVVGTPAYLAPEVLR Serine/threonine-protein kinase D1, D3
KLPSTTL Ribosomal protein S6 kinase SGSPSDNSGAEEMEVSLAKPK RAC-alpha serine/threonine-protein kinase
LGSYSGPTSVSR Pantothenate kinase 2, mitochondrial STSWHTALR Triple functional domain protein
LQPFHSTELEDDAIYSVHVPAGLYR ARF GTPase-activating protein GIT1 TPKDSPGIPPSAGAHQLFR Ribosomal protein S6 kinase
LSEEAECPNPSTPSK Serine/threonine-protein kinase 10 TTSFAESCKPVQQPSAFGSM(ox)K Glycogen synthase kinase-3 beta
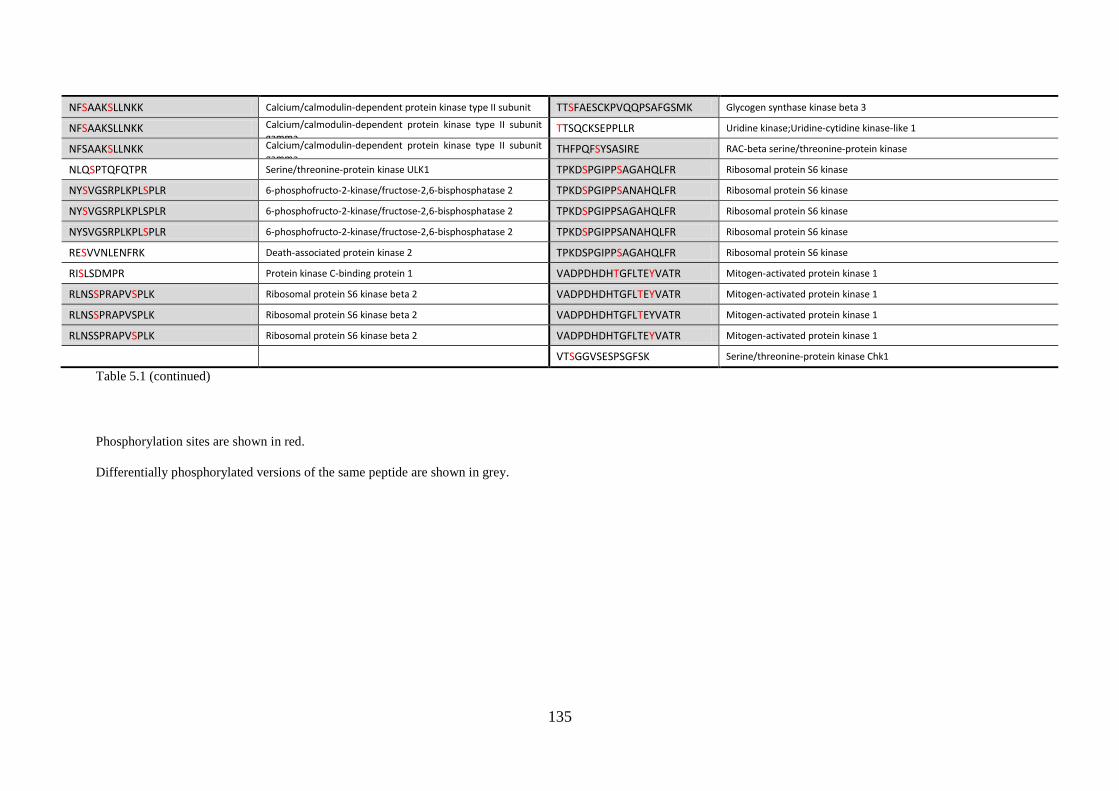
135
NFSAAKSLLNKK Calcium/calmodulin-dependent protein kinase type II subunit TTSFAESCKPVQQPSAFGSMK Glycogen synthase kinase beta 3
NFSAAKSLLNKK Calcium/calmodulin-dependent protein kinase type II subunit gamma
TTSQCKSEPPLLR Uridine kinase;Uridine-cytidine kinase-like 1
NFSAAKSLLNKK Calcium/calmodulin-dependent protein kinase type II subunit gamma
THFPQFSYSASIRE RAC-beta serine/threonine-protein kinase
NLQSPTQFQTPR Serine/threonine-protein kinase ULK1 TPKDSPGIPPSAGAHQLFR Ribosomal protein S6 kinase
NYSVGSRPLKPLSPLR 6-phosphofructo-2-kinase/fructose-2,6-bisphosphatase 2 TPKDSPGIPPSANAHQLFR Ribosomal protein S6 kinase
NYSVGSRPLKPLSPLR 6-phosphofructo-2-kinase/fructose-2,6-bisphosphatase 2 TPKDSPGIPPSAGAHQLFR Ribosomal protein S6 kinase
NYSVGSRPLKPLSPLR 6-phosphofructo-2-kinase/fructose-2,6-bisphosphatase 2 TPKDSPGIPPSANAHQLFR Ribosomal protein S6 kinase
RESVVNLENFRK Death-associated protein kinase 2 TPKDSPGIPPSAGAHQLFR Ribosomal protein S6 kinase
RISLSDMPR Protein kinase C-binding protein 1 VADPDHDHTGFLTEYVATR Mitogen-activated protein kinase 1
RLNSSPRAPVSPLK Ribosomal protein S6 kinase beta 2 VADPDHDHTGFLTEYVATR Mitogen-activated protein kinase 1
RLNSSPRAPVSPLK Ribosomal protein S6 kinase beta 2 VADPDHDHTGFLTEYVATR Mitogen-activated protein kinase 1
RLNSSPRAPVSPLK Ribosomal protein S6 kinase beta 2 VADPDHDHTGFLTEYVATR Mitogen-activated protein kinase 1
VTSGGVSESPSGFSK Serine/threonine-protein kinase Chk1
Table 5.1 (continued)
Phosphorylation sites are shown in red.
Differentially phosphorylated versions of the same peptide are shown in grey.

136
6.2 Results
The dynamics of specific phosphorylation events in FGF signalling were investigated by SRM
in SUM52 cells, as described in Section 2.2.5. The data was collected in a time-dependent
profile during FGF1 stimulation (0 s, 20 s, 40 s, 1 min, 3 min, 5 min, 10 min, 20 min, 30 min
and 60 min). Three technical replicates and two biological replicates were performed.
Phosphopeptides with a peak area count of over 5000 were selected for further analysis. With
these criteria, 38 of 75 phosphopeptides were quantified reproducibly.
6.2.1 Initial assessment of SRM assay
To investigate the reproducibility of the quantitation results, precision was assessed using the
data from technical replicates (intra-assay precision) and biological replicates (inter-assay
precision). In this assay, data from ten time-points following FGF stimulation were collected.
Three transitions were selected per phosphopeptide based on the description in Chapter 1.4.3.2.
The transitions were monitored in a time-constrained way (termed scheduled), where a small
elution time window was specified for transitions of a given peptides (performed by Dr Andrew
Creese). In one LC-MS/MS assay, 50 phosphopeptides (25 pairs of IS peptides and endogenous
peptides, 150 transitions) were scheduled. Therefore, 3 independent analytical runs were
performed for a total of 75 targeted phosphopeptides. Three technical replicates and two
biological replicates were performed. Therefore, a total of 6 sets were taken forward for
replicate analyses.

137
6.2.1.1 Technical reproducibility
To assess technical reproducibility, relative standard deviation (% RSD, also known as
coefficient of variation) was used to evaluate the variances among three technical replicates
(Figure 6.1). RSD was calculated as the standard deviation of peptide measurements over the
three replicates divided by the average peptide intensity.
In Figure 6.2, each box displays the distribution of RSD of phosphopeptides detected within
each dataset. The red line indicates the 10% cut off of RSD. The medians of RSD of 6 sets of
analysis are all below 10%, ranging from 8.01% to 9.87%.
Figure 6.1 Boxplots of RSDs derived from the 3 technical replicates spectra for 2 independent datasets. Box
plot shows the RSD for three technical replicates averaged independently for all biological replicates. The number
of data point of the 6 datasets are 130,117,119,150,180 and 100 individually. The box spans from the Q1 (quartile
1) to Q3 (quartile 3) and median (quartile 2) is shown in the middle. Whiskers above the box show the maximum
values.
For peptide quantitation, a typical SRM assay requires the RSD of technical replicates lower
than 10% to 20%, depending on the concentration of peptides228. Our results demonstrated
good precision among technical replicates, confirming the robustness of the SRM assay.

138
6.2.1.2 Biological reproducibility
To assess reproducibility in absolute quantitation between independently prepared biological
samples, a histogram analysis was performed. For each identified phosphopeptide, the mean of
their relative abundance across a time series profile was calculated. Next, the ratios of the mean
of relative abundance (endogenous peptide/ IS peptide) between the two biological replicates
were calculated, as displayed in Figure 6.2. The distribution shows an approximately normal
distribution around the ratio of 1. The variance of 28 phosphopeptides (60.9%) is within ± 20%,
suggesting the overall absolute quantitation results are within the acceptable level of precision.
Figure 6.2 Histogram showing the reproducibility of 2 independent biological datasets
X-axis represents the ratio of the values from 2 biological replicates. The dashed lines indicate the ± 20%
deviation of the ratio 1.
6.2.2 Overview of SRM-based quantitation of key phosphorylation events in
FGF signalling
In order to examine the patterns of phosphopeptide responses following FGF1 stimulation,
hierarchical clustering was performed on the phosphopeptides identified reproducibly in the
assay. The clustering of phosphopeptides was based on their relative phosphorylation profile
and allowed classification of the phosphopeptides from a complex dataset. As shown in Figure
6.3, phosphopeptides were grouped into 4 clusters. The clustering revealed that the
phosphopeptides showed different response towards FGF1 stimulation. Different response

139
patterns were identified: early, mid and late responses. Phosphopeptides with early response
type were either down-regulated at early time points (from 20 s to 1 min) after FGF1 treatment
or underwent up-regulation followed by rapid down-regulation. Phosphopeptides with mid
response pattern were up-regulated from 1min to 10 min following FGF1 treatment. Late
response phosphopeptides were up-regulated from 30 min to 60 min of FGF1 stimulation.
Figure 6.3 Hierarchical clustering of relative phosphorylation profile of key phosphorylation events during
FGF1 stimulation. The expression of each phosphopeptide was normalized to a percentage of the highest
expression in a time profile (horizontally). The colours in the map display the relative expression of
phosphopeptides during FGF1 stimulation. Phosphopeptides with similar expression profiles were grouped
together and were connected by clustering tree. Clustering distance was calculated based on Euclidean distance
with average linkage by Perseus 1.5.1.6.

140
6.2.3 Phosphopeptides response to FGF1 treatment
6.2.3.1 Early response phosphopeptides
In total, 12 phosphopeptides were characterised as early response phosphopeptides (0 s to 1
min following FGF1 stimulation), see Table 6.2. There are 10 singly phosphorylated peptides
and 2 doubly phosphorylated peptides. Phosphorylation levels of the early response
phosphopeptides were down-regulated immediately (except peptide RLSpSTSLASGHSVR
which shows the highest expression at 20 s) following the addition of FGF1.
Table 6.2 Early response phosphopeptides
Figure 6.4 Hierarchical clustering of relative phosphorylation profile of early response phosphopeptides.
The expression of each phosphopeptide was normalized to a percentage of the highest expression in a time profile
(horizontally). The colours in the map display the relative expression of phosphopeptides during FGF1 stimulation.
Phosphopeptide sequences were shown on the left of clustering image.

141
6.2.3.2 Mid response phosphopeptides
In total, 10 phosphopeptides were characterised as mid response phosphopeptides (1 min to 20
min following FGF1 stimulation), shown in Table 6.3. There are 9 singly phosphorylated
peptides and 1 doubly phosphorylated peptide. The kinases corresponding to these
phosphopeptides include participators of the MAPK pathway, CoA biosynthesis, carbohydrate
metabolic process, proliferation and apoptosis. Phosphorylation levels of the mid response
phosphopeptides were up-regulated from 1 min to around 20 min following the addition of
FGF1.
Table 6.3 Mid response phosphopeptides
Figure 6.5 Hierarchical clustering of relative phosphorylation profile of mid response phosphopeptides.
The expression of each phosphopeptide was normalized to a percentage of the highest expression in a time profile
(horizontally). The colours in the map display the relative expression of phosphopeptides during FGF1 stimulation.
Phosphopeptides sequences were shown on the left of clustering image.

142
6.2.3.3. Late response phosphopeptides
In total, 12 phosphopeptides were characterised as late response phosphopeptides (30 min to
60 min following FGF1 stimulation), shown in Table 6.4. There are 10 singly phosphorylated
peptides and 2 doubly phosphorylated peptides. The kinases corresponding to these
phosphopeptides include participators of transcription, translation, MAPK pathway, calcium
metabolic process, proliferation and apoptosis. Phosphorylation levels of the late response
phosphopeptides were up-regulated from 30 min to 60 min following the addition of FGF1.
Table 6.4 Late response phosphopeptides
Figure 6.6 Hierarchical clustering of relative phosphorylation profile of late response phosphopeptides. The
expression of each phosphopeptide was normalized to a percentage of the highest expression in a time profile
(horizontally). The colours in the map display the relative expression of phosphopeptides during FGF1 stimulation.
Phosphopeptide sequences were shown on the left of clustering image.

143
6.2.4 Establishment of calibration curve
For absolute quantitation, a calibration curve is required to determine the absolute amount of a
peptide. Calibration curves were prepared for each phosphopeptide using synthetic peptides. A
6-point calibration curve was produced: 100 attomole, 500 attomole, 1 femtomole, 10
femtomole, 50 femtomole and 250 femtomole. Triplicate measurements were performed for
each phosphopeptide and three inter-day analyses were performed at the beginning, middle and
end of the sample analysis.
When evaluating the reproducibility of the calibration curve assay, the mean of three
measurements were used for further analysis; however, the inter-assay variance was observed
for experiments performed over a four-week period. Using the mean of three inter-day results
could potentially bias the calibration curve as the value of peak area over 6 concentrations can
differ by up to 1,000 fold. Therefore, a logarithm transform approach was adopted to combine
the inter-day results, as shown in Figure 6.7.
Figure 6.7 Schematic diagram of the logarithm transform approach

144
Figure 6.8 Calibration curve of phosphopeptides
(A) DINNIDpYYKK of Fibroblast growth factor receptor 2; (B) TPKDSPGIPPSAGAHQLFR of Ribosomal
protein S6 kinase alpha-3; (C) TPKDpSPGIPPSANAHQLFR of Ribosomal protein S6 kinase alpha-1
A
B
C

145
Figure 6.8 shows a number of calibration curves constructed using the approach described
above. The calibration curve with a less than 0.9 R-squared value will be excluded from further
analysis. Therefore, 65 phosphopeptides are allowed for absolute quantitation. A representative
Skyline output is shown in Figure 6.9.
Figure 6.9 Representative Skyline output of 2+ peptide pSVVGTPAYLAPEVLR following FGF1 treatment
(A) Time profile of endogenous peptides; (B) Time profile of IS peptides. Three transitions shown in the figure
are neutral loss ion (precursor-98, blue), b3 (purple) and y10 (dark red).
6.2.5 Response of multi-site phosphopeptides
6.2.5.1 Fibroblast growth factor receptor 2
Figure 6.10 shows the temporal phosphorylation profile of two isobaric phosphopeptides
(Tyr656 and Tyr657) following the addition of FGF1 and the absolute abundance of
phosphopeptides present at each time point is quantified. For DINNIDpYYKK, the
phosphorylation level showed a time-dependent increase following the addition of FGF1, and

146
at 60 min the maximum phosphorylation level was reached. For DINNIDYpYKK, FGF1
induced a quick reduction in phosphorylation level and the phosphorylation level tended to be
stable after 1 min of FGF1 stimulation.
Figure 6.10 Phosphorylation profile of 2 isobaric phosphopeptides of FGFR2
(A): Clustering presentation of phosphopeptides from FGFR2. (B) Phosphorylation profile of peptide
DINNIDpYYKK (Tyr656) following addition of FGF1. (C) Phosphorylation profile of peptide DINNIDYpYKK
(Tyr657) following addition of FGF1. Early response profile was shown on the right of the figure. Results from
two biological replicates are shown in green and red.
A
B
C

147
6.2.5.2 Ribosomal protein S6 kinase alpha-1
Figure 6.11 shows the temporal phosphorylation profile of three isobaric phosphopeptides
(Ser363, Ser369 and both) following addition of FGF1 and the absolute abundance of
phosphopeptides present at each time point is quantified. For all three peptides, up-regulated
phosphorylation levels were observed from 20 s after the addition of FGF1 and the
phosphorylation level reached a maximum around 40 s to 1 min. After 10 min stimulation, the
response was slowly tuned back to initiation level. The phosphorylation of Ser359 of RSK1
and Ser369 of RSK3 (homologous to Ser363 of RSK1) exhibited a similar profile, displayed
in Figure 6.12 and 6.13.

148
Figure 6.11 Phosphorylation profile of a group phosphopeptides of RSK1
(A) Clustering presentation of phosphopeptides from RSK1. (B) Phosphorylation profile of peptide
TPKDpSPGIPPSAGAHQLFR (Ser363) following addition of FGF1. (C) Phosphorylation profile of peptide
TPKDSPGIPPpSAGAHQLFR (Ser369) following addition of FGF1. (D) Phosphorylation profile of peptide
TPKDpSPGIPPpSAGAHQLFR (Ser363 and Ser369) following addition of FGF1. Early response profile was
shown on the right of the figure. Results from two biological replicates are shown in green and red.
A
B
C
D
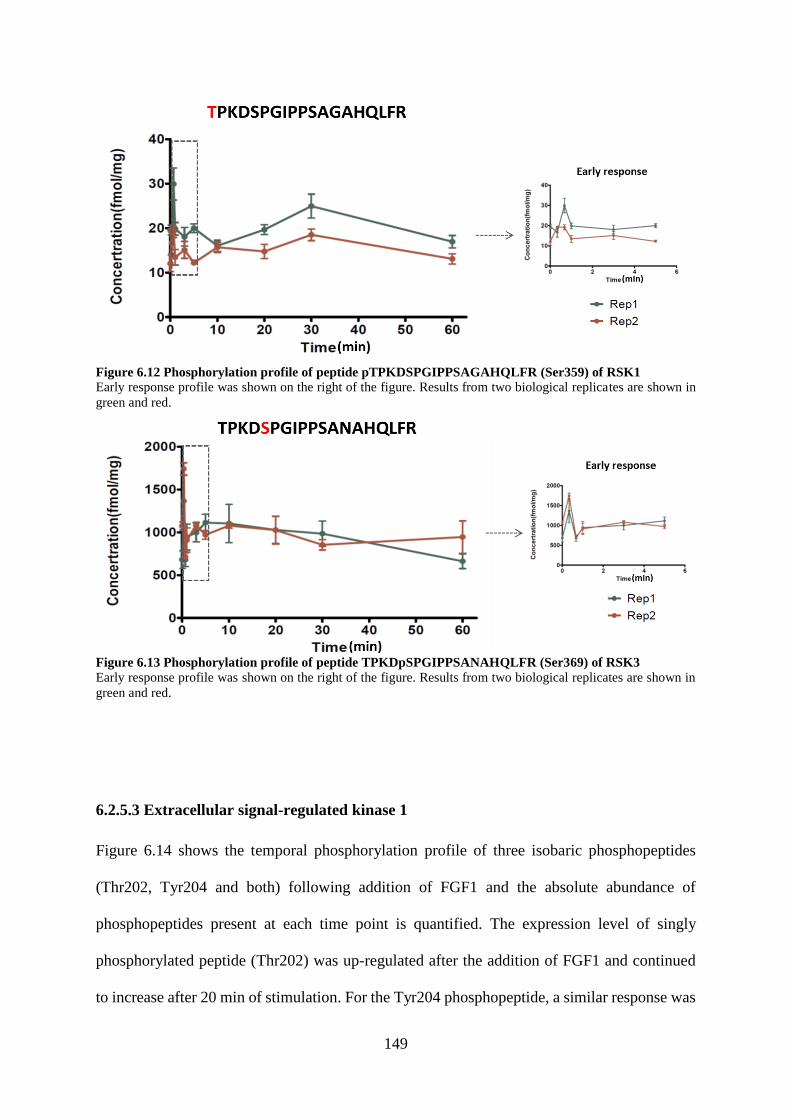
149
Figure 6.12 Phosphorylation profile of peptide pTPKDSPGIPPSAGAHQLFR (Ser359) of RSK1
Early response profile was shown on the right of the figure. Results from two biological replicates are shown in
green and red.
Figure 6.13 Phosphorylation profile of peptide TPKDpSPGIPPSANAHQLFR (Ser369) of RSK3
Early response profile was shown on the right of the figure. Results from two biological replicates are shown in
green and red.
6.2.5.3 Extracellular signal-regulated kinase 1
Figure 6.14 shows the temporal phosphorylation profile of three isobaric phosphopeptides
(Thr202, Tyr204 and both) following addition of FGF1 and the absolute abundance of
phosphopeptides present at each time point is quantified. The expression level of singly
phosphorylated peptide (Thr202) was up-regulated after the addition of FGF1 and continued
to increase after 20 min of stimulation. For the Tyr204 phosphopeptide, a similar response was

150
revealed and a rapid increase in phosphorylation was observed at 1 min of FGF1 stimulation.
For the doubly-phosphorylated peptide (Thr202 and Tyr204), the phosphorylation level was
increased at 40 s and 20 min of stimulation and decreased after 20 min. From the analysis of
the three isobaric peptides, it is likely that upon FGF1 stimulation, Thr202 and Tyr204 are both
activated. Dephosphorylation of these two sites is initiated after 20 min, therefore a decrease
was observed.
A
B

151
Figure 6.14 Phosphorylation profile of a group of isobaric phosphopeptides of ERK1
(A): Clustering presentation of phosphopeptides from ERK1. (B) Phosphorylation profile of peptide
IADPEHDHTGFLpTEYVATR (Thr202) following addition of FGF1. (C) Phosphorylation profile of peptide
IADPEHDHTGFLTEpYVATR (Tyr204) following addition of FGF1. (D) Phosphorylation profile of peptide
IADPEHDHTGFLpTEpYVATR (Thr202 and Tyr204) following addition of FGF1.Early response profile was
shown on the right of the figure. Results from two biological replicates are shown in green and red.
6.2.5.4 Extracellular signal-regulated kinase 2
Figure 6.15 shows the temporal phosphorylation profile of three phosphopeptides (Thr185,
Tyr187 and both) following addition of FGF1 and the absolute abundance of phosphopeptides
present at each time point is quantified. The response of the three phosphopeptides is different
in response to FGF1. Singly-phosphorylated peptide Thr185 showed an increase following
addition of FGF1 and the phosphorylation level kept increasing until 60 min of treatment. For
peptide with Tyr187 phosphorylation, no obvious response was observed. In contrast, the
phosphorylation level of the doubly phosphorylated peptide showed a reduction immediately
after treatment.
D

152
Figure 6.15 Phosphorylation profile of a group of phosphopeptides of MAPK2
(A): Clustering presentation of phosphopeptides from ERK2. (B) Phosphorylation profile of peptide
VADPDHDHTGFLpTEYVATR (Tyr185) following addition of FGF1. (C) Phosphorylation profile of peptide
VADPDHDHTGFLTEpYVATR (Thr187) following addition of FGF1. (D) Phosphorylation profile of peptide
VADPDHDHTGFLpTEpYVATR (Thr185 and Tyr187) following addition of FGF1. Early response profile was
shown on the right of the figure. Results from two biological replicates are shown in green and red.

153
6.2.6 Trouble shooting
A total of 75 phosphosites were submitted for SRM quantitation, 38 of which were
reproducibly quantified. The other 37 phosphopeptides were not successfully quantified due to
a number of reasons, as summarised in Table 6.5. In order to ensure reproducible quantitation,
a peak area cut-off of 5000 was selected to exclude low-abundance ions. A total of 21
phosphopeptides were removed from further analyses as a result of low MS response. Five
phosphopeptides showed sufficient MS signal but fell partially outside of the retention time
window, therefore the data could not be used for quantitation. Peptides EHIEIIAPpSPQR,
EKFpSFEPK and pSGGGDLTLGLEPSEEEAPR were successfully identified in only one set
of biological replicates. Six phosphopeptides did not show good correlation between the two
biological replicates, therefore they were excluded from further analysis.
Table 6.5 Summary of identification results
Peptide sequence Identification results Peptide sequence Identification resultsATDSFSGRFEDVYQLQEDVLGEGAHAR Low signal RLNSSPRAPVSPLK Low signalDINNIDYYKK Low signal RLSSTSLASGHSVR Low signalEHIEIIAPSPQR One repeat RNSFTPLSSSNTIR Low signalEKFSFEPK One repeat RPHFPQFSYSASGRE Outside of RT windowEYGSPLKAYTPVVVTQWYR Low signal RPHFPQFSYSASGRE Poor reproducibilityGAILTTM(ox)LVSR Low signal RPPGMEYSYDINR Outside of RT windowGAQASSGSPALPR Low signal RSDSASSEPVGIYQGFEK Low signalGFSFVATGLM(ox)EDDGKPR Outside of RT window RVSLSEIGFGK Low signalGLCTSPAEHQYFMTEYVATR Low signal SGGGDLTLGLEPSEEEAPR One repeatGRNSATSADEQPHIGNYR Low signal SGSPSDNSGAEEMEVSLAKPK Low signalHFM(ox)HQIITGMLYLHSHGILHR Outside of RT window SHNDFVAILDLPEGEHQYK Outside of RT windowKLPSTTL Poor reproducibility STVASMMHR Low signalLQPFHSTELEDDAIYSVHVPAGLYR Low signal THFPQFSYSASIRE No calibration dataNFSAAKSLLNKK Poor reproducibility TPKDSPGIPPSANAHQLFR Low signalNFSAAKSLLNKK Poor reproducibility TTSFAESCKPVQQPSAFGSM(ox)KNo calibration dataNFSAAKSLLNKK Poor reproducibility TTSFAESCKPVQQPSAFGSMK Poor reproducibilityNLQSPTQFQTPR Low signal VADPDHDHTGFLTEYVATR Low signalNYSVGSRPLKPLSPLR Low signal VTSGGVSESPSGFSK Low signalNYSVGSRPLKPLSPLR Low signal

154
6.3 Discussion
6.3.1 Initial assessment of SRM assay
To measure the biological reproducibility of the SRM assay, a histogram was used to assess
the overall performance between the two datasets. Approximately 39.8% of peptides showed a
variance above 20%. This results is due, firstly, to the variance in instrumental performance.
The samples from the two biological replicates were analysed on different days, therefore a
certain level of instrumental error was expected. Secondly, for each phosphopeptide, the ratio
of absolute measurements used in the evaluation of biological reproducibility is the average
expression across the time expression profile, where different phosphorylation levels are
expected within a time-dependent profile. Although high variances were observed between
biological replicates, in some cases, a similar response pattern was found in the two replicates.
To further optimize the reproducibility, inclusion of an internal standard (i.e. a peptide of a
known amount) was thought to be advisable.
6.3.2 Phosphopeptides response to FGF1 treatment
In the initial stage of FGF activation, a number of conserved tyrosine residues in the
intracellular domain of the FGFR will undergo phosphorylation. The activated FGFR kinases,
in turn, phosphorylate downstream signalling protein for signal transduction. The trafficking
of FGF signalling is mediated by the diverse downstream responses. Dissecting their
expression patterns and subjecting them to pathway analysis may yield deeper insights into the
mechanisms of FGF activation and trafficking.
The SRM assay identified differences in the phosphorylation response after the activation of
FGF signalling. The clustering of phosphopeptide expression patterns allowed the peptides that

155
play different roles in FGF signalling to be distinguished. Previously published data
demonstrated that immediate phosphorylation of the receptor and tyrosine phosphorylation of
FGFR was observed to occur within 30 seconds of FGF stimulation in vitro18. FGF1 induced
intra-cellular signalling is time-dependent and the induction can be sustained until 24 hours
after FGF1 stimulation. In order to study the immediate and transient activation of FGF
signalling, in this assay, the expression profile of key phosphorylation events within one hour
of FGF1 stimulation was monitored.
6.3.3 Calibration curve
The calibration curve was generated from three independent calibration analyses performed on
different days. Certain types of data, e.g. gene expression data or protein expression data, are
heavily skewed in linear scale229. It is arbitrary simply to take the average for data analysis.
When interpreting SRM data, the value of peak area over 6 concentrations can differ by up to
1,000 fold. Thus, using the mean of three inter-day results could potentially bias the calibration
curve. To reduce the data skewness in linear scale, a log-transform approach was used to
calculate the calibration curve, as described by Irizarry et al230. After log2 transformation,
parameters of linear regression were calculated. To identify the linearity of calibration data, an
empirical R-squared value of 0.9 was selected as the cut-off.
6.3.4 Response of multi-site phosphopeptides
6.3.4.1 Fibroblast growth factor receptor 2
FGFR2 is a key protein in FGF signalling and predominantly expressed in epithelium cells16.
FGFR2 isoforms, both FGFR2IIIb and FGFR2IIIc have been shown to interact with FGF1 to
156
initiate the signalling231. The crystal structure revealed that the interaction between FGFR2 and
FGF1 was formed by linking the two ligands into the dimeric receptors chains232. The direct
result of this interaction is the conformation change in the cytoplasmic domain of the receptor,
which will lead to the autophosphorylation of two tyrosine site Y656 and Y657.
A mechanism of FGFR1 activation has been described by Furdui et al21. They hypothesised a
two-step activation mechanism by using rapid chemical quench method and time-resolved ESI-
TOF-MS. In the first step, the autophosphorylation of Y653 (homologous to Y656 of FGFR2)
in the activation loop will result in approximately 50 to 100 fold increase in kinase activity,
whereas the catalyse activity is further enhanced by 500 to 1000 fold after the auto-
phosphorylation of Y654 (homologous to Y657 of FGFR2). The auto-phosphorylation of
FGFR1 is not a homogenous process, but a sequential, strictly ordered reaction. Next, Y463 in
juxtamembrane region, Y586 and Y588 in kinase insert, and Y769 in C-terminal region are
also phosphorylated to enhance the signal propagation or serve as recruitment sites for
downstream signalling proteins.
The results here provide temporal evidence in support of this hypothesis. In the first step, FGF1
stimulation enhances kinase activity by phosphorylating of Y656 of FGFR2, which was
evidenced by the increased phosphorylation level of DINNIDpYYKK (Figure 6.9B). The
subsequent phosphorylation of Y657 will further promote catalytic activity of FGFR2,
resulting in a decreased phosphorylation level of the singly phosphorylated peptide and an
increased level of the doubly phosphorylated peptide. Unfortunately, the doubly
phosphorylated version was too low abundance to establish a temporal phosphorylation profile.
The results presented here support the theory that the catalytic activity of FGFR during signal
initiation stage is activated and mediated by a sequential tyrosine autophosphorylation process.
Moreover, this process is likely to be a conserved mechanism of FGFR family members.

157
6.3.4.2 Ribosomal protein S6 kinase alpha-1
Ribosomal protein S6 kinase (RSK) represents an important family of serine-threonine kinases
that acts downstream of the Ras-MAPK cascade233. RSKs comprise two distinct kinase domain
(N- and C-terminal kinase domain) and this family has four isoforms (RSK1-4) in humans.
Phosphorylation of RSKs occurs at multiple Ser and Thr sites through sequential reactions by
various kinases, e.g. Erk1/2 in response to growth factors234. RSKs have been extensively
implicated in mitotic phosphorylation events and the regulation of cell cycle235. There is
increasing evidence pointing to RSKs as the potential therapeutic targets for a number of
cancers, including breast cancer236,237.
Figure 6.16 A schematic model for RSK activation (Adapted from Anjum and Blenis234)
RSKs can be activated via canonical MAPK cascade upon treatment with growth factors and
other extracellular signals. As shown in Figure 6.16, activation of cell surface receptor leads to

158
auto-phosphorylation of receptor and creates recruitment sites for scaffolding proteins such as
growth factor receptor-bound protein-2 (GRB2). Upon activation of GRB2, downstream
signalling protein, such as SOS, Ras and Raf, are recruited subsequently, leading to the
activation of MEK1/2. Next, ERK1/2 directly phosphorylates and activates RSKs (e.g. Ser363
and Ser380 of RSK1). Alternatively, RSK is modulated by 3'-phosphoinositide-dependent
kinase-1 (PDK) by phosphorylation of Ser221 of RSK1.
Ser363 of RSK1 (TPKDpSPGIPPSAGAHQLFR, homologous to other members of RSK
family) is located within sequences that are conserved in the most AGC kinases and is
phosphorylated by ERK1/2238. It has been demonstrated that the phosphorylation of Ser363
and Ser380 is critical for activation of the N-terminal kinase domain. Together with Ser359
(pTPKDSPGIPPSAGAHQLFR), these two sites has been termed the ‘turn-motif’, which is
primarily involved in modulating structure of the kinase in order to influence kinase activity.
Our findings showed FGF1 stimulation induced immediate response and increase of Ser359,
Ser363 and the doubly-phosphorylated version. It was previously reported the phosphorylation
of doubly-phosphorylated version was involved in stabilizing the kinase core239. Whether the
phosphorylation of Ser359 is required for activation is unclear so far, but the low level of the
Ser359 peptide may indicate it is not a specific target of ERK1/2.
In addition, absolute quantitation results revealed that the phosphorylation level of Ser369 of
RSK3 was much higher than the homologous site of RSK1 (see Figure 6.13), which suggests
the basal level of RSK3-associate phosphorylation is more abundant than other members of
RSK family. There is evidence demonstrating, upon mitogen stimulation, RSK3 is able to
maintain interaction with ERK1/2 longer than RSK1 and RSK2 in 293T cells240. Therefore, it
is likely that the high level of RSK3 phosphorylation is associated with the preference of
ERK1/2 to bind with RSK3 than other members of RSK family.

159
6.3.4.3 Extracellular signal-regulated kinase 1
Extracellular signal-regulated kinase, also known as mitogen-activated protein kinase 3
(MAPK3), is one of the central regulators in cellular response to extracellular stimuli, such as
oxidative stress, DNA damage and infection etc241. The ERK1/ERK2 pathway is known to be
the best-characterized MAPK cascade. ERK1 was found to be phosphorylated on Tyr and Thr
residues in response to a wide variety of stimuli, such as growth factor, Ca2+,
neurotransmitters242. Thr202 and Tyr204 of ERK1 were shown to be further phosphorylated
by MEK1/2 to fully active kinase activity and Thr202 and Tyr204 are the only substrates of
MEK1/2 known so far243. Crystal structure revealed the mono-phosphorylated form at Tyr204
and dual-phosphorylated form possess distinct conformations, which contribute to the huge
difference in kinase activity244. Some proteins have been identified to regulate ERK1 activity
in multiple levels. Upstream of ERK1, the phosphorylation status of Ser298 outside of
activation loop of MEK could regulate ERK1 activity in positive or negative manner. Dual
Specificity Phosphatases (DUSPs) interact directly with ERK1 to dephosphorylate both sites
of Thr202 and Tyr204 to regulate its kinase activity245. Downstream of ERK1, negative
regulation also occurs through feedback of a variety of substrates and its subcellular
localization.
Currently, antibody in the market is only able to target Thr202 and Tyr204 at the same time.
However, our results showed a different effect on three isobaric phosphopeptides upon FGF1
treatment. An increase in the singly phosphorylated form while a decrease in the doubly
phosphorylated form was observed after 20 min stimulation. This is likely to be a negative
feedback in response to the activated MAPK pathway. It is unclear which mechanism is
responsible for this negative regulation. However, it is obvious that the addition of ligand is
able to induce an immediate response of ERK1 through phosphorylation of Thr202 and Tyr204,
and a negative feedback is initiated around 20 min after the stimulation.

160
6.3.4.4 Extracellular signal-regulated kinase 2
ERK2 (also known as mitogen-activated protein kinase 1, MAPK1) is a member of MAP
kinase family. Together with ERK1, they participate in MAP kinase signal transduction
pathway and regulate a variety of biological processes. The Thr185 and Tyr187 of ERK2 are
homologous to Thr202 and Tyr204 of ERK1, as shown in Figure 6.17. Similar to ERK1,
activity of ERK2 is regulated through the dual-phosphorylation mechanism of Thr185 and
Tyr187246. Thr185 and Tyr187 have been reported to be phosphorylated by a number of
upstream kinases, e.g. PLC-γ247, MEK1 and MEK2248. All known cellular stimuli of the
ERK1/2 pathway are able to induce the parallel activation of ERK1 and ERK2. On the other
hand, a number of downstream substrates can regulate ERK2 kinase activity, e.g. DUSP5, a
mitogen-activated protein kinase dephosphorylates ERK2 at Thr185 and Tyr187 to prevent it
from leaving nucleus, therefore deactivating the kinase249.
Figure 6.17 Alignment of amino acid sequence in active site of ERK1 and ERK2
The dual phosphorylation sites are shown in red. Numbers indicate the site of amino acid in ERK1 or ERK2. The
unconserved amino acid between ERK1/2 is shown in green.
ERK1 and ERK2 are 82% identical in amino acid sequence and they share the same substrates
specificity under most circumstances250. Also, they are co-expressed ubiquitously but with a
remarkably variable relative abundance251. Recent evidence suggests ERK1 and ERK2 are not
always interchangeable and some differences between their regulation and function have been
elucidated under specific conditions. Fischer et al,. showed ERK2 was indispensable in
multiple stages of T-cell development in mice, while ERK1-deficient mice was still viable
through the development252. Also, ERK2 but not ERK1 is necessary for Ras-induced epithelial-

161
to-mesenchymal transformation (EMT)253. Moreover, a number of research points that
quantitative differences in ERK1 and ERK2 dynamics could have a significant role in their
regulation. Pages et al,. have shown an elevated level of ERK1 protein was capable of
compensating the lack of ERK2 during the proliferation and differentiation of positive
thymocytes254. It indicates ERK1 and ERK2 might compete with each other for upstream MEK
activation. Last, alternatively spliced isoforms of ERK1 and ERK2 have been reported to
determine signalling specificity255,256.
Thr185 (ERK1) and Thr 202 (ERK2) showed a similar phosphorylation profile in response to
FGF1. Their phosphorylation was gradually increased until 60 min of stimulation. Tyr187
(ERK1) showed in increase while Tyr204 (ERK2) showed a decrease following addition of
FGF1. For doubly phosphorylated peptides, ERK2 peptide showed a sharp decrease while
ERK1 peptide exhibited a peak of phosphorylation aound 20 min of stimulation. ERK2 showed
higher absolute abundance than ERK1 in general. Our data suggests, in SUM52 cells, the
activation of FGF signalling does not induce equivalent activation of ERK1 and ERK2, as their
dual-phosphorylation response are different. It may suggest there is regulation either in the
specificity of ERK isoform or in the quantitative difference.
6.3.5 Trouble shooting
The SRM assay reproducibly quantified 38 of 75 phosphopeptides. The method used in this
assay presents a substantial room for optimization. A total of 28.0% of phosphopeptides were
not successfully quantified due to a low MS signal. The MS response in SRM analysis is
determined by the abundance of target peptide in the sample, the compatibility with LC
separation and the intensity of the specified transitions257. The phosphopeptides selected for
these assay are all from related kinases, which are usually low-abundant proteins compared

162
with the majority of cellular proteins. Selective prefractionation techniques are available to
enrich phosphopeptides, however, additional sample handling places more risk in interfering
with the quantitation results.
The scheduled SRM approach decreases the number of concurrent transitions monitored
simultaneously. In this assay, most of the peptides are scheduled in a 6-minute window (from
13 min to 19 min) and 50 peptides (25 IS peptide and 25 endogenous peptides) are monitored
within one run. The congestion of scheduled transitions potentially decrease the dwell time for
each transition, therefore decrease the signal258. A certain number of peptide was not
successfully quantified because the specified retention time window did not cover the whole
peak of transitions. A more relaxed schedule method or a method with fewer transitions can be
established in the future. Compromise choices will need to be made between the amount of
sample, the number of instrument hours and the signal in order to obtain data for analysis.
Combined with western blot, the establishment of the phosphorylation site analysis can also be
applied as a standard platform for further quantitation investigations.
6.4 Conclusion
In this chapter, a quantitative and time-resolved phosphorylation site analysis was performed
to study the phosphorylation responses following FGF1 stimulation. A total of 38
phosphopeptides were reproducibly quantified. The clustering of relative phosphorylation
profile showed distinct associations towards FGF1 stimulation. The phosphorylation response
was classified as early, mid and late response type. With a special focus on peptide of
differentially phosphorylated versions, results showed a sequential phosphorylation pattern
was observed for phosphorylation sites in the activation loop of FGFR2 and ERK1. A similar
phosphorylation response was observed for isobaric phosphorylated peptides of RSK1. As

163
shown in this study, evidence for the previously proposed mechanisms of FGF signal
transduction was provided. Following the proteome-scale studies, this assay provided a more
detailed insight into the central regulators involved in the signal transduction process.

164
CHAPTER 7
CONCLUSIONS AND FUTURE WORK
165
FGF signalling is a highly complex growth factor signalling pathway, reflecting a wide range
of biological processes regulated through phosphorylation and dephosphorylation events. The
deregulation of FGF signalling is closely linked to many human diseases, including cancer.
The aim of the work presented in this thesis was to investigate the key phosphorylation events
and dynamics of FGF signalling using mass spectrometry tools, including the development of
those tools. To address this aim, the method of LC-FAIMS-MS/MS analyses was established
(Chapter 3), the phosphorylation response to signalling inhibitors was investigated by LC-
MS/MS and LC-FAIMS-MS/MS (Chapter 4); the performance of a novel FAIMS interface
was evaluated for further proteomic analyses (Chapter 5); a targeted quantitation assay was
performed to profile the dynamics of the key phosphorylation events in FGF signalling
(Chapter 6).
7.1 Optimization of phosphoproteomic analysis by LC-FAIMS-
MS/MS
In order to establish the method for quantitative analysis, the performance of LC-FAIMS-
MS/MS was evaluated. The use of calibration standards with isotopic labels showed FAIMS
did not alter quantitation results compared with the LC-MS/MS method. The method for
quantitative LC-FAIMS-MS/MS analysis was optimized using 293T cells and SUM52 cells. A
CV range from -22.5 V to -50 V (with 2.5 V intervals) was selected for future experiments.
7.2 FAIMS and phosphoproteomics of FGF signalling
In Chapter 4, the LC-MS/MS and LC-FAIMS-MS/MS analyses have combined SILAC
labelling with SCX pre-fractionation and phosphoenrichment. This approach allowed the
investigation of the regulated phosphorylation events involved in FGF signalling. The two

166
techniques showed complementarity. An enhancement in the identification of multiply
phosphorylated peptides and a preference for peptides with high charge states (3+ and above)
was observed in the LC-FAIMS-MS/MS dataset. It was also observed that ~20% of the
phosphosites identified via FAIMS have not been reported previously.
The LC-FAIMS-MS/MS analyses also revealed a substantial number of phosphosites regulated
upon inhibitor treatments, especially sites from multiply-phosphorylated peptides. An
attractive application of FAIMS is the targeted analysis of peptides, thus enabling the direct
quantitation of peptide candidates in the future. Together, these observations open new
possibilities for in-depth characterisation of interesting candidates for their roles in FGF
signalling and trafficking.
7.3 Evaluation of modified FAIMS interface
In Chapter 5, the performance of a novel FAIMS interface was evaluated and compared with
the commercial standard FAIMS device, from direct infusion of peptide standards and peptide
mixtures to LC-FAIMS-MS/MS analysis of peptide mixture and whole cell lysates. The
modified FAIMS interface showed a CV shift of approximately 10 V and nearly 3-fold increase
in peak capacity. In the analyses of whole cell lysate, an increase in the proteome coverage of
69.4% was observed in the modified FAIMS dataset. The increase in proteome coverage can
be attributed to the reduced redundancy in identifications between CV steps when using the
modified FAIMS, in turn result in improved resolution.
The elimination of He in the modified FAIMS device is advantageous in terms of cost reduction
and laboratory automation. Therefore, these results demonstrate the modified FAIMS interface

167
as a powerful tool for proteomic study that provides high resolution and low redundancy
identifications.
7.4 Investigation of dynamics of the key phosphorylation events in
FGF signalling by selected reaction monitoring
A number of phosphoproteomic studies have attempted to understand FGF signalling on a wide
scale. Chapter 6 was aimed at exploring the site-specific response during the activation FGF
signalling using a targeted mass spectrometry approach. A quantitative and time-resolved SRM
assay of 38 phosphorylation sites was successfully performed. The hierarchy clustering of their
relative phosphorylation profiles showed distinct associations towards FGF1 stimulation. The
phosphorylation response was classified as early, mid and late response type.
Following the proteome-scale studies, this assay provided a more detailed insight into the
central regulators involved in the signal transduction process. For future study, the SRM
workflow could be optimized to obtain the desired data. The detailed specific phosphorylation
profile of individual phosphorylation site need to be investigated, ideally compared with
biochemistry evidence, to fully understand the potential mechanisms of the activation FGF
signalling.

168
Reference
(1) Armelin, H. A. Pituitary Extracts and Steroid Hormones in the Control of 3T3 Cell
Growth. Proc. Natl. Acad. Sci. 1973, 70 (9), 2702–2706.
(2) Ornitz, D. M.; Itoh, N. Fibroblast growth factors. Genome Biol. 2001, 2 (3),
REVIEWS3005.
(3) Powers, C. J.; McLeskey, S. W.; Wellstein, a. Fibroblast growth factors, their
receptors and signaling. Endocr. Relat. Cancer 2000, 7 (3), 165–197.
(4) Greenman, C.; Stephens, P.; Smith, R.; Dalgliesh, G. L.; Hunter, C.; Bignell, G.;
Davies, H.; Teague, J.; Butler, A.; Stevens, C.; et al. Patterns of somatic mutation in
human cancer genomes. Nature 2007, 446 (7132), 153–158.
(5) Imel, E. A.; Econs, M. J. Fibroblast growth factor 23: roles in health and disease. J.
Am. Soc. Nephrol. 2005, 16 (9), 2565–2575.
(6) Burgess, W. H.; Maciag, T. The heparin-binding (fibroblast) growth factor family of
proteins. Annu. Rev. Biochem. 1989, 58, 575–606.
(7) Wiedłocha, A.; Sørensen, V. Signaling, internalization, and intracellular activity of
fibroblast growth factor. Curr. Top. Microbiol. Immunol. 2004, 286, 45–79.
(8) Sheng, Z.; Lewis, J. A.; Chirico, W. J. Nuclear and nucleolar localization of 18-kDa
fibroblast growth factor-2 is controlled by C-terminal signals. J. Biol. Chem. 2004, 279
(38), 40153–40160.
(9) Stachowiak, M. K.; Maher, P. A.; Joy, A.; Mordechai, E.; Stachowiak, E. K. Nuclear
localization of functional FGF receptor 1 in human astrocytes suggests a novel
mechanism for growth factor action. Mol. Brain Res. 1996, 38 (1), 161–165.
(10) Beenken, A.; Mohammadi, M. The FGF family: biology, pathophysiology and therapy.
Nat. Rev. Drug Discov. 2009, 8 (3), 235–253.
(11) Schlessinger, J. Cell Signaling by Receptor Tyrosine Kinases. Cell 2000, 103 (2), 211–
225.
(12) Turner, N.; Grose, R. Fibroblast growth factor signalling: from development to cancer.
Nat. Rev. Cancer 2010, 10 (2), 116–129.
(13) Mohammadi, M.; Olsen, S. K.; Ibrahimi, O. A. Structural basis for fibroblast growth
factor receptor activation. Cytokine Growth Factor Rev. 2005, 16 (2), 107–137.
(14) Cha, J. Y.; Maddileti, S.; Mitin, N.; Harden, T. K.; Der, C. J. Aberrant receptor
internalization and enhanced FRS2-dependent signaling contribute to the transforming
activity of the fibroblast growth factor receptor 2 IIIb C3 isoform. J. Biol. Chem. 2009,
284 (10), 6227–6240.
(15) Zhang, X.; Ibrahimi, O. A.; Olsen, S. K.; Umemori, H.; Mohammadi, M.; Ornitz, D.
M. Receptor specificity of the fibroblast growth factor family. The complete
mammalian FGF family. J. Biol. Chem. 2006, 281 (23), 15694–15700.

169
(16) Orr-Urtreger, A.; Bedford, M. T.; Burakova, T.; Arman, E.; Zimmer, Y.; Yayon, A.;
Givol, D.; Lonai, P. Developmental localization of the splicing alternatives of
fibroblast growth factor receptor-2 (FGFR2). Dev. Biol. 1993, 158 (2), 475–486.
(17) Sahni, M.; Ambrosetti, D.-C.; Mansukhani, A.; Gertner, R.; Levy, D.; Basilico, C.
FGF signaling inhibits chondrocyte proliferation and regulates bone development
through the STAT-1 pathway. Genes Dev. 1999, 13 (11), 1361–1366.
(18) Coughlin, S. R.; Barr, P. J.; Cousens, L. S.; Fretto, L. J.; Williams, L. T. Acidic and
basic fibroblast growth factors stimulate tyrosine kinase activity in vivo. J. Biol. Chem.
1988, 263 (2), 988–993.
(19) Mohammadi, M.; Dikic, I.; Sorokin, A.; Burgess, W. H.; Jaye, M.; Schlessinger, J.
Identification of six novel autophosphorylation sites on fibroblast growth factor
receptor 1 and elucidation of their importance in receptor activation and signal
transduction. Mol. Cell. Biol. 1996, 16 (3), 977–989.
(20) Mohammadi, M.; Honegger, A. M.; Rotin, D.; Fischer, R.; Bellot, F.; Li, W.; Dionne,
C. A.; Jaye, M.; Rubinstein, M.; Schlessinger, J. A tyrosine-phosphorylated carboxy-
terminal peptide of the fibroblast growth factor receptor (Flg) is a binding site for the
SH2 domain of phospholipase C-gamma 1. Mol. Cell. Biol. 1991, 11 (10), 5068–5078.
(21) Furdui, C. M.; Lew, E. D.; Schlessinger, J.; Anderson, K. S. Autophosphorylation of
FGFR1 kinase is mediated by a sequential and precisely ordered reaction. Mol. Cell
2006, 21 (5), 711–717.
(22) Ornitz, D. M.; Itoh, N. The Fibroblast Growth Factor signaling pathway. Wiley
Interdiscip. Rev. Dev. Biol. 2015, 4 (3), 215–266.
(23) Gotoh, N. Regulation of growth factor signaling by FRS2 family docking/scaffold
adaptor proteins. Cancer Sci. 2008, 99 (7), 1319–1325.
(24) Ubersax, J. a; Ferrell, J. E. Mechanisms of specificity in protein phosphorylation. Nat.
Rev. Mol. Cell Biol. 2007, 8 (7), 530–541.
(25) Pinna, L. A.; Ruzzene, M. How do protein kinases recognize their substrates? Biochim.
Biophys. Acta - Mol. Cell Res. 1996, 1314 (3), 191–225.
(26) Fantl, W. J.; Johnson, D. E.; Williams, L. T. Signalling by receptor tyrosine kinases.
Annu. Rev. Biochem. 1993, 62, 453–481.
(27) Sarabipour, S.; Hristova, K. Mechanism of FGF receptor dimerization and activation.
Nat. Commun. 2016, 7, 10262.
(28) Zhan, X.; Plourde, C.; Hu, X.; Friesel, R.; Maciag, T. Association of fibroblast growth
factor receptor-1 with c-Src correlates with association between c-Src and cortactin. J.
Biol. Chem. 1994, 269 (32), 20221–20224.
(29) Altomare, D. A.; Testa, J. R. Perturbations of the AKT signaling pathway in human
cancer. Oncogene 2005, 24 (50), 7455–7464.
(30) Kouhara, H.; Hadari, Y. R.; Spivak-Kroizman, T.; Schilling, J.; Bar-Sagi, D.; Lax, I.;
Schlessinger, J. A lipid-anchored Grb2-binding protein that links FGF-receptor
activation to the Ras/MAPK signaling pathway. Cell 1997, 89 (5), 693–702.

170
(31) Hers, I.; Vincent, E. E.; Tavaré, J. M. Akt signalling in health and disease. Cell. Signal.
2011, 23 (10), 1515–1527.
(32) Manning, B. D.; Cantley, L. C. AKT/PKB signaling: navigating downstream. Cell
2007, 129 (7), 1261–1274.
(33) Parsons, S. J.; Parsons, J. T. Src family kinases, key regulators of signal transduction.
Oncogene 2004, 23 (48), 7906–7909.
(34) Twamley-Stein, G. M.; Pepperkok, R.; Ansorge, W.; Courtneidge, S. A. The Src
family tyrosine kinases are required for platelet-derived growth factor-mediated signal
transduction in NIH 3T3 cells. Proc. Natl. Acad. Sci. U. S. A. 1993, 90 (16), 7696–
7700.
(35) Biscardi, J. S.; Maa, M.-C.; Tice, D. A.; Cox, M. E.; Leu, T.-H.; Parsons, S. J. c-Src-
mediated Phosphorylation of the Epidermal Growth Factor Receptor on Tyr845 and
Tyr1101 Is Associated with Modulation of Receptor Function. J. Biol. Chem. 1999,
274 (12), 8335–8343.
(36) Bromann, P. A.; Korkaya, H.; Courtneidge, S. A. The interplay between Src family
kinases and receptor tyrosine kinases. Oncogene 2004, 23 (48), 7957–7968.
(37) Dorey, K.; Amaya, E. FGF signalling: diverse roles during early vertebrate
embryogenesis. Development 2010, 137 (22), 3731–3742.
(38) Raffioni, S.; Thomas, D.; Foehr, E. D.; Thompson, L. M.; Bradshaw, R. A.
Comparison of the intracellular signaling responses by three chimeric fibroblast
growth factor receptors in PC12 cells. Proc. Natl. Acad. Sci. 1999, 96 (13), 7178–
7183.
(39) Sharpe, R.; Pearson, A.; Herrera-Abreu, M. T.; Johnson, D.; Mackay, A.; Welti, J. C.;
Natrajan, R.; Reynolds, A. R.; Reis-Filho, J. S.; Ashworth, A.; et al. FGFR signaling
promotes the growth of triple-negative and basal-like breast cancer cell lines both in
vitro and in vivo. Clin. Cancer Res. 2011, 17 (16), 5275–5286.
(40) Adnane, J.; Gaudray, P.; Dionne, C. A.; Crumley, G.; Jaye, M.; Schlessinger, J.;
Jeanteur, P.; Birnbaum, D.; Theillet, C. BEK and FLG, two receptors to members of
the FGF family, are amplified in subsets of human breast cancers. Oncogene 1991, 6
(4), 659–663.
(41) Tannheimer, S. L.; Rehemtulla, A.; Ethier, S. P. Characterization of fibroblast growth
factor receptor 2 overexpression in the human breast cancer cell line SUM-52PE.
Breast Cancer Res. 2000, 2 (4), 311–320.
(42) Vercoutter-Edouart, A. S.; Czeszak, X.; Crépin, M.; Lemoine, J.; Boilly, B.; Le
Bourhis, X.; Peyrat, J. P.; Hondermarck, H. Proteomic detection of changes in protein
synthesis induced by fibroblast growth factor-2 in MCF-7 human breast cancer cells.
Exp. Cell Res. 2001, 262 (1), 59–68.
(43) Kunii, K.; Davis, L.; Gorenstein, J.; Hatch, H.; Yashiro, M.; Di Bacco, A.; Elbi, C.;
Lutterbach, B. FGFR2-amplified gastric cancer cell lines require FGFR2 and Erbb3
signaling for growth and survival. Cancer Res. 2008, 68 (7), 2340–2348.
171
(44) Turner, N. C.; Reis-Filho, J. S. Tackling the diversity of triple-negative breast cancer.
Clin. Cancer Res. 2013, 19 (23), 6380–6388.
(45) Ricol, D.; Cappellen, D.; El Marjou, A.; Gil-Diez-de-Medina, S.; Girault, J. M.;
Yoshida, T.; Ferry, G.; Tucker, G.; Poupon, M. F.; Chopin, D.; et al. Tumour
suppressive properties of fibroblast growth factor receptor 2-IIIb in human bladder
cancer. Oncogene 1999, 18 (51), 7234–7243.
(46) Easton, D. F.; Pooley, K. A.; Dunning, A. M.; Pharoah, P. D. P.; Thompson, D.;
Ballinger, D. G.; Struewing, J. P.; Morrison, J.; Field, H.; Luben, R.; et al. Genome-
wide association study identifies novel breast cancer susceptibility loci. Nature 2007,
447 (7148), 1087–1093.
(47) Garcia-Closas, M.; Hall, P.; Nevanlinna, H.; Pooley, K.; Morrison, J.; Richesson, D.
A.; Bojesen, S. E.; Nordestgaard, B. G.; Axelsson, C. K.; Arias, J. I.; et al.
Heterogeneity of breast cancer associations with five susceptibility loci by clinical and
pathological characteristics. PLoS Genet. 2008, 4 (4), e1000054.
(48) Serra S, Zheng L, Hassan M, Phan AT, Woodhouse LJ, Yao JC, Ezzat S, A. S. The
FGFR4-G388R single-nucleotide polymorphism alters pancreatic neuroendocrine
tumor progression and response to mTOR inhibition therapy. Cancer Res. 2012, 72
(22), 5683–5691.
(49) Baird, K.; Davis, S.; Antonescu, C. R.; Harper, U. L.; Walker, R. L.; Chen, Y.;
Glatfelter, A. A.; Duray, P. H.; Meltzer, P. S. Gene expression profiling of human
sarcomas: insights into sarcoma biology. Cancer Res. 2005, 65 (20), 9226–9235.
(50) Pollock, P. M.; Gartside, M. G.; Dejeza, L. C.; Powell, M. A.; Mallon, M. A.; Davies,
H.; Mohammadi, M.; Futreal, P. A.; Stratton, M. R.; Trent, J. M.; et al. Frequent
activating FGFR2 mutations in endometrial carcinomas parallel germline mutations
associated with craniosynostosis and skeletal dysplasia syndromes. Oncogene 2007, 26
(50), 7158–7162.
(51) Turner, N.; Pearson, A.; Sharpe, R.; Lambros, M.; Geyer, F.; Lopez-Garcia, M. A.;
Natrajan, R.; Marchio, C.; Iorns, E.; Mackay, A.; et al. FGFR1 amplification drives
endocrine therapy resistance and is a therapeutic target in breast cancer. Cancer Res.
2010, 70 (5), 2085–2094.
(52) Heiskanen, M.; Kononen, J.; Bärlund, M.; Torhorst, J.; Sauter, G.; Kallioniemi, A.;
Kallioniemi, O. CGH, cDNA and tissue microarray analyses implicate FGFR2
amplification in a small subset of breast tumors. Anal. Cell. Pathol. 2001, 22 (4), 229–
234.
(53) Marshall, M. E.; Hinz, T. K.; Kono, S. A.; Singleton, K. R.; Bichon, B.; Ware, K. E.;
Marek, L.; Frederick, B. A.; Raben, D.; Heasley, L. E. Fibroblast growth factor
receptors are components of autocrine signaling networks in head and neck squamous
cell carcinoma cells. Clin. Cancer Res. 2011, 17 (15), 5016–5025.
(54) Flemming, A. Cancer: Small-molecule FGF trap shrinks tumours. Nat. Rev. Drug
Discov. 2015, 14 (10), 680.
(55) Gavine, P. R.; Mooney, L.; Kilgour, E.; Thomas, A. P.; Al-Kadhimi, K.; Beck, S.;
Rooney, C.; Coleman, T.; Baker, D.; Mellor, M. J.; et al. AZD4547: an orally
172
bioavailable, potent, and selective inhibitor of the fibroblast growth factor receptor
tyrosine kinase family. Cancer Res. 2012, 72 (8), 2045–2056.
(56) Mohammadi, M.; McMahon, G.; Sun, L.; Tang, C.; Hirth, P.; Yeh, B. K.; Hubbard, S.
R.; Schlessinger, J. Structures of the tyrosine kinase domain of fibroblast growth factor
receptor in complex with inhibitors. Science 1997, 276 (5314), 955–960.
(57) Katoh, M.; Nakagama, H. FGF receptors: cancer biology and therapeutics. Med. Res.
Rev. 2014, 34 (2), 280–300.
(58) Siu, J. L. and L. L. Development of Fibroblast Growth Factor Receptor Inhibitors:
Kissing Frogs to Find a Prince? Am. Soc. Clin. Oncol. 2015, 33 (30), 3372–3374.
(59) Das, J.; Chen, P.; Norris, D.; Padmanabha, R.; Lin, J.; Moquin, R. V; Shen, Z.; Cook,
L. S.; Doweyko, A. M.; Pitt, S.; et al. 2-aminothiazole as a novel kinase inhibitor
template. Structure-activity relationship studies toward the discovery of N-(2-chloro-6-
methylphenyl)-2-[[6-[4-(2-hydroxyethyl)-1- piperazinyl)]-2-methyl-4-
pyrimidinyl]amino)]-1,3-thiazole-5-carboxamide (Dasatin. J. Med. Chem. 2006, 49
(23), 6819–6832.
(60) Dieci, M. V.; Arnedos, M.; Andre, F.; Soria, J. C. Fibroblast growth factor receptor
inhibitors as a cancer treatment: from a biologic rationale to medical perspectives.
Cancer Discov. 2013, 3 (3), 264–279.
(61) Mann, M.; Ong, S.-E.; Grønborg, M.; Steen, H.; Jensen, O. N.; Pandey, A. Analysis of
protein phosphorylation using mass spectrometry: deciphering the phosphoproteome.
Trends Biotechnol. 2002, 20 (6), 261–268.
(62) Glish, G. L.; Vachet, R. W. The basics of mass spectrometry in the twenty-first
century. Nat. Rev. Drug Discov. 2003, 2 (2), 140–150.
(63) Nilsson, T.; Mann, M.; Aebersold, R.; Yates, J. R.; Bairoch, A.; Bergeron, J. J. M.
Mass spectrometry in high-throughput proteomics: ready for the big time. Nat.
Methods 2010, 7 (9), 681–685.
(64) Tost, J.; Gut, I. G. DNA analysis by mass spectrometry-past, present and future. J.
Mass Spectrom. 2006, 41 (8), 981–995.
(65) Harvey, D. J. Matrix-assisted laser desorption/ionization mass spectrometry of
carbohydrates. Mass Spectrom. Rev. 1999, 18 (6), 349–450.
(66) Mueller, C. A.; Weinmann, W.; Dresen, S.; Schreiber, A.; Gergov, M. Development of
a multi-target screening analysis for 301 drugs using a QTrap liquid
chromatography/tandem mass spectrometry system and automated library searching.
Rapid Commun. Mass Spectrom. 2005, 19 (10), 1332–1338.
(67) Dempster, A. J. A new Method of Positive Ray Analysis. Phys. Rev. 1918, 11 (4),
316–325.
(68) Munson, M. S. B.; Field, F. H. Chemical Ionization Mass Spectrometry. I. General
Introduction. J. Am. Chem. Soc. 1966, 88 (12), 2621–2630.
173
(69) Morris, H. R.; Panico, M.; Barber, M.; Bordoli, R. S.; Sedgwick, R. D.; Tyler, A. Fast
atom bombardment: A new mass spectrometric method for peptide sequence analysis.
Biochem. Biophys. Res. Commun. 1981, 101 (2), 623–631.
(70) De Pauw, E.; Agnello, A.; Derwa, F. Liquid matrices for liquid secondary ion mass
spectrometry-fast atom bombardment: An update. Mass Spectrom. Rev. 1991, 10 (4),
283–301.
(71) Tanaka, K.; Waki, H.; Ido, Y.; Akita, S.; Yoshida, Y.; Yoshida, T.; Matsuo, T. Protein
and polymer analyses up tom/z 100 000 by laser ionization time-of-flight mass
spectrometry. Rapid Commun. Mass Spectrom. 1988, 2 (8), 151–153.
(72) Fenn, J. B.; Mann, M.; Meng, C. K.; Wong, S. F.; Whitehouse, C. M. Electrospray
ionization for mass spectrometry of large biomolecules. Science 1989, 246 (4926), 64–
71.
(73) Seeley, E. H.; Caprioli, R. M. Molecular imaging of proteins in tissues by mass
spectrometry. Proc. Natl. Acad. Sci. U. S. A. 2008, 105 (47), 18126–18131.
(74) Dole, M. Molecular Beams of Macroions. J. Chem. Phys. 1968, 49 (5), 2240.
(75) Iribarne, J. V. On the evaporation of small ions from charged droplets. J. Chem. Phys.
1976, 64 (6), 2287.
(76) Wolff, M. M.; Stephens, W. E. A Pulsed Mass Spectrometer with Time Dispersion.
Rev. Sci. Instrum. 1953, 24 (8), 616.
(77) Paul, W.; Reinhard, H. P.; von Zahn, U. Das elektrische Massenfilter als
Massenspektrometer und Isotopentrenner. Zeitschrift für Phys. 1958, 152 (2), 143–182.
(78) Prestage, J. D.; Dick, G. J.; Maleki, L. New ion trap for frequency standard
applications. J. Appl. Phys. 1989, 66 (3), 1013.
(79) Wolfgang, P.; Helmut, S. Apparatus for separating charged particles of different
specific charges. December 21, 1954.
(80) Comisarow, M. B.; Marshall, A. G. Fourier transform ion cyclotron resonance
spectroscopy. Chem. Phys. Lett. 1974, 25 (2), 282–283.
(81) Makarov, A. Electrostatic Axially Harmonic Orbital Trapping: A High-Performance
Technique of Mass Analysis. Anal. Chem. 2000, 72 (6), 1156–1162.
(82) Jennings, K. R. Collision-induced decompositions of aromatic molecular ions. Int. J.
Mass Spectrom. Ion Phys. 1968, 1 (3), 227–235.
(83) Haddon, W. F.; McLafferty, F. W. Metastable ion characteristics. VII. Collision-
induced metastables. J. Am. Chem. Soc. 1968, 90 (17), 4745–4746.
(84) ZUBAREV, R. A.; KELLEHER, N. L.; MCLAFFERTY, F. W. ELECTRON
CAPTURE DISSOCIATION OF MULTIPLY CHARGED PROTEIN CATIONS. A
NONERGODIC PROCESS . J. Am. Chem. Soc. 120 (13), 3265–3266.

174
(85) Syka, J. E. P.; Coon, J. J.; Schroeder, M. J.; Shabanowitz, J.; Hunt, D. F. Peptide and
protein sequence analysis by electron transfer dissociation mass spectrometry. Proc.
Natl. Acad. Sci. U. S. A. 2004, 101 (26), 9528–9533.
(86) Tsaprailis, G.; Nair, H.; Somogyi, Á.; Wysocki, V. H.; Zhong, W.; Futrell, J. H.;
Summerfield, S. G.; Gaskell, S. J. Influence of Secondary Structure on the
Fragmentation of Protonated Peptides. J. Am. Chem. Soc. 1999, 121 (22), 5142–5154.
(87) McCormack, A. L.; Somogyi, A.; Dongre, A. R.; Wysocki, V. H. Fragmentation of
protonated peptides: surface-induced dissociation in conjunction with a quantum
mechanical approach. Anal. Chem. 1993, 65 (20), 2859–2872.
(88) Wells, J. M.; McLuckey, S. A. Collision-induced dissociation (CID) of peptides and
proteins. Methods Enzymol. 2005, 402, 148–185.
(89) Roepstorff, P.; Fohlman, J. Proposal for a common nomenclature for sequence ions in
mass spectra of peptides. Biomed. Mass Spectrom. 1984, 11 (11), 601.
(90) Kim, M.-S.; Pandey, A. Electron transfer dissociation mass spectrometry in
proteomics. Proteomics 2012, 12 (4-5), 530–542.
(91) Sobczyk M, Anusiewicz I, Berdys-Kochanska J, Sawicka A, Skurski P, S. J. Coulomb-
Assisted Dissociative Electron Attachment: Application to a Model Peptide. J. Phys.
Chem. A 2005, 109 (1), 250–258.
(92) Syrstad, E. A.; Turecek, F. Toward a general mechanism of electron capture
dissociation. J. Am. Soc. Mass Spectrom. 2005, 16 (2), 208–224.
(93) Kim, M.-S.; Zhong, J.; Kandasamy, K.; Delanghe, B.; Pandey, A. Systematic
evaluation of alternating CID and ETD fragmentation for phosphorylated peptides.
Proteomics 2011, 11 (12), 2568–2572.
(94) Olsen, J. V; Schwartz, J. C.; Griep-Raming, J.; Nielsen, M. L.; Damoc, E.; Denisov,
E.; Lange, O.; Remes, P.; Taylor, D.; Splendore, M.; et al. A dual pressure linear ion
trap Orbitrap instrument with very high sequencing speed. Mol. Cell. Proteomics 2009,
8 (12), 2759–2769.
(95) Schwartz, J. C.; Senko, M. W.; Syka, J. E. P. A two-dimensional quadrupole ion trap
mass spectrometer. J. Am. Soc. Mass Spectrom. 2002, 13 (6), 659–669.
(96) Lesur, A.; Domon, B. Advances in high-resolution accurate mass spectrometry
application to targeted proteomics. Proteomics 2015, 15 (5-6), 880–890.
(97) Yost, R. A.; Enke, C. G. Selected ion fragmentation with a tandem quadrupole mass
spectrometer. J. Am. Chem. Soc. 1978, 100 (7), 2274–2275.
(98) Paul, Wolfgang; Steinwedel, H. Ein neues Massenspektrometer ohne Magnetfeld.
Zeitschrift für Naturforsch. A 1953, 8 (7), 448–450.
(99) Anderson, L.; Hunter, C. L. Quantitative mass spectrometric multiple reaction
monitoring assays for major plasma proteins. Mol. Cell. Proteomics 2006, 5 (4), 573–
588.

175
(100) Johnson, J. V.; Yost, R. A.; Kelley, P. E.; Bradford, D. C. Tandem-in-space and
tandem-in-time mass spectrometry: triple quadrupoles and quadrupole ion traps. Anal.
Chem. 1990, 62 (20), 2162–2172.
(101) Ariel Bensimon, Albert J.R. Heck, and R. A. Mass Spectrometry–Based Proteomics
and Network Biology. Annu. Rev. Biochem. 2012, 81 (10), 379–405.
(102) Zhang, H.; Ge, Y. Comprehensive Analysis of Protein Modifications by Top-down
Mass Spectrometry. Circ Cardiovasc Genet 2011, 4 (6), 711–726.
(103) Chang, C.-Y.; Picotti, P.; Hüttenhain, R.; Heinzelmann-Schwarz, V.; Jovanovic, M.;
Aebersold, R.; Vitek, O. Protein significance analysis in selected reaction monitoring
(SRM) measurements. Mol. Cell. Proteomics 2012, 11 (4), M111.014662.
(104) Duncan, M. W.; Yergey, A. L.; Patterson, S. D. Quantifying proteins by mass
spectrometry: The selectivity of SRM is only part of the problem. Proteomics 2009, 9
(5), 1124–1127.
(105) Egertson, J. D.; Kuehn, A.; Merrihew, G. E.; Bateman, N. W.; MacLean, B. X.; Ting,
Y. S.; Canterbury, J. D.; Marsh, D. M.; Kellmann, M.; Zabrouskov, V.; et al.
Multiplexed MS/MS for improved data-independent acquisition. Nat. Methods 2013,
10 (8), 744–746.
(106) Song, C.; Ye, M.; Liu, Z.; Cheng, H.; Jiang, X.; Han, G.; Songyang, Z.; Tan, Y.;
Wang, H.; Ren, J.; et al. Systematic analysis of protein phosphorylation networks from
phosphoproteomic data. Mol. Cell. Proteomics 2012, 11 (10), 1070–1083.
(107) Olsen, J. V; Blagoev, B.; Gnad, F.; Macek, B.; Kumar, C.; Mortensen, P.; Mann, M.
Global, in vivo, and site-specific phosphorylation dynamics in signaling networks. Cell
2006, 127 (3), 635–648.
(108) Thingholm TE, Jensen ON, L. M. Analytical strategies for phosphoproteomics.
Proteomics 2009, 9 (6), 1451–1468.
(109) Zhao, X.; Wang, Q.; Wang, S.; Zou, X.; An, M.; Zhang, X.; Ji, J. Citric acid-assisted
two-step enrichment with TiO2 enhances the separation of multi- and
monophosphorylated peptides and increases phosphoprotein profiling. J. Proteome
Res. 2013, 12 (6), 2467–2476.
(110) Sugiyama, N.; Masuda, T.; Shinoda, K.; Nakamura, A.; Tomita, M.; Ishihama, Y.
Phosphopeptide enrichment by aliphatic hydroxy acid-modified metal oxide
chromatography for nano-LC-MS/MS in proteomics applications. Mol. Cell.
Proteomics 2007, 6 (6), 1103–1109.
(111) Lu, J.; Qi, D.; Deng, C.; Zhang, X.; Yang, P. Hydrothermal synthesis of α-
Fe(2)O(3)@SnO(2) core-shell nanotubes for highly selective enrichment of
phosphopeptides for mass spectrometry analysis. Nanoscale 2010, 2 (10), 1892–1900.
(112) He, X.-M.; Zhu, G.-T.; Li, X.-S.; Yuan, B.-F.; Shi, Z.-G.; Feng, Y.-Q. Rapid
enrichment of phosphopeptides by SiO2-TiO2 composite fibers. Analyst 2013, 138
(18), 5495–5502.
(113) Grønborg, M.; Kristiansen, T. Z.; Stensballe, A.; Andersen, J. S.; Ohara, O.; Mann,
M.; Jensen, O. N.; Pandey, A. A mass spectrometry-based proteomic approach for

176
identification of serine/threonine-phosphorylated proteins by enrichment with
phospho-specific antibodies: identification of a novel protein, Frigg, as a protein
kinase A substrate. Mol. Cell. Proteomics 2002, 1 (7), 517–527.
(114) Neville, D. C.; Rozanas, C. R.; Price, E. M.; Gruis, D. B.; Verkman, A. S.; Townsend,
R. R. Evidence for phosphorylation of serine 753 in CFTR using a novel metal-ion
affinity resin and matrix-assisted laser desorption mass spectrometry. Protein Sci.
1997, 6 (11), 2436–2445.
(115) Thingholm, T. E.; Larsen, M. R.; Ingrell, C. R.; Kassem, M.; Jensen, O. N. TiO(2)-
based phosphoproteomic analysis of the plasma membrane and the effects of
phosphatase inhibitor treatment. J. Proteome Res. 2008, 7 (8), 3304–3313.
(116) Thingholm, T. E.; Jensen, O. N.; Robinson, P. J.; Larsen, M. R. SIMAC (sequential
elution from IMAC), a phosphoproteomics strategy for the rapid separation of
monophosphorylated from multiply phosphorylated peptides. Mol. Cell. Proteomics
2008, 7 (4), 661–671.
(117) Oda, Y.; Nagasu, T.; Chait, B. T. Enrichment analysis of phosphorylated proteins as a
tool for probing the phosphoproteome. Nat. Biotechnol. 2001, 19 (4), 379–382.
(118) Moore, L. J.; Machlan, L. A. High-accuracy determination of calcium in blood serum
by isotope dilution mass spectrometry. Anal. Chem. 1972, 44 (14), 2291–2296.
(119) Cohen, A.; Hertz, H. S.; Mandel, J.; Paule, R. C.; Schaffer, R.; Sniegoski, L. T.; Sun,
T.; Welch, M. J.; White, E. Total serum cholesterol by isotope dilution/mass
spectrometry: a candidate definitive method. Clin. Chem. 1980, 26 (7), 854–860.
(120) White, E.; Welch, V. M.; Sun, T.; Sniegoski, L. T.; Schaffer, R.; Hertz, H. S.; Cohen,
A. The accurate determination of serum glucose by isotope dilution mass
spectrometry--two methods. Biomed. Mass Spectrom. 1982, 9 (9), 395–405.
(121) Gygi, S. P.; Rist, B.; Gerber, S. A.; Turecek, F.; Gelb, M. H.; Aebersold, R.
Quantitative analysis of complex protein mixtures using isotope-coded affinity tags.
Nat. Biotechnol. 1999, 17 (10), 994–999.
(122) Schmidt, A.; Kellermann, J.; Lottspeich, F. A novel strategy for quantitative
proteomics using isotope-coded protein labels. Proteomics 2005, 5 (1), 4–15.
(123) Wiese, S.; Reidegeld, K. A.; Meyer, H. E.; Warscheid, B. Protein labeling by iTRAQ:
a new tool for quantitative mass spectrometry in proteome research. Proteomics 2007,
7 (3), 340–350.
(124) Thompson, A.; Schäfer, J.; Kuhn, K.; Kienle, S.; Schwarz, J.; Schmidt, G.; Neumann,
T.; Hamon, C. Tandem Mass Tags: A Novel Quantification Strategy for Comparative
Analysis of Complex Protein Mixtures by MS/MS. Anal. Chem. 2003, 75 (8), 1895–
1904.
(125) Ong, S.-E.; Blagoev, B.; Kratchmarova, I.; Kristensen, D. B.; Steen, H.; Pandey, A.;
Mann, M. Stable isotope labeling by amino acids in cell culture, SILAC, as a simple
and accurate approach to expression proteomics. Mol. Cell. Proteomics 2002, 1, 376–
386.

177
(126) Olsen, J. V; Vermeulen, M.; Santamaria, A.; Kumar, C.; Miller, M. L.; Jensen, L. J.;
Gnad, F.; Cox, J.; Jensen, T. S.; Nigg, E. A.; et al. Quantitative phosphoproteomics
reveals widespread full phosphorylation site occupancy during mitosis. Sci. Signal.
2010, 3 (104), ra3.
(127) Hinsby, A. M.; Olsen, J. V; Mann, M. Tyrosine phosphoproteomics of fibroblast
growth factor signaling: a role for insulin receptor substrate-4. J. Biol. Chem. 2004,
279 (45), 46438–46447.
(128) Krüger, M.; Moser, M.; Ussar, S.; Thievessen, I.; Luber, C. A.; Forner, F.; Schmidt, S.;
Zanivan, S.; Fässler, R.; Mann, M. SILAC mouse for quantitative proteomics uncovers
kindlin-3 as an essential factor for red blood cell function. Cell 2008, 134 (2), 353–
364.
(129) Kosako, H.; Nagano, K. Quantitative phosphoproteomics strategies for understanding
protein kinase-mediated signal transduction pathways. Expert Rev. Proteomics 2011, 8
(1), 81–94.
(130) Griffin, N. M.; Yu, J.; Long, F.; Oh, P.; Shore, S.; Li, Y.; Koziol, J. A.; Schnitzer, J. E.
Label-free, normalized quantification of complex mass spectrometry data for
proteomic analysis. Nat. Biotechnol. 2010, 28 (1), 83–89.
(131) Langlais, P.; Mandarino, L. J.; Yi, Z. Label-free relative quantification of co-eluting
isobaric phosphopeptides of insulin receptor substrate-1 by HPLC-ESI-MS/MS. J. Am.
Soc. Mass Spectrom. 2010, 21 (9), 1490–1499.
(132) Old, W. M.; Shabb, J. B.; Houel, S.; Wang, H.; Couts, K. L.; Yen, C.-Y.; Litman, E.
S.; Croy, C. H.; Meyer-Arendt, K.; Miranda, J. G.; et al. Functional proteomics
identifies targets of phosphorylation by B-Raf signaling in melanoma. Mol. Cell 2009,
34 (1), 115–131.
(133) Boersema, P. J.; Mohammed, S.; Heck, A. J. R. Phosphopeptide fragmentation and
analysis by mass spectrometry. J. Mass Spectrom. 2009, 44 (6), 861–878.
(134) Wiesner, J.; Premsler, T.; Sickmann, A. Application of electron transfer dissociation
(ETD) for the analysis of posttranslational modifications. Proteomics 2008, 8 (21),
4466–4483.
(135) Sweet, S. M. M.; Bailey, C. M.; Cunningham, D. L.; Heath, J. K.; Cooper, H. J. Large
scale localization of protein phosphorylation by use of electron capture dissociation
mass spectrometry. Mol. Cell. Proteomics 2009, 8 (5), 904–912.
(136) Zhang, Y.; Ficarro, S. B.; Li, S.; Marto, J. A. Optimized Orbitrap HCD for quantitative
analysis of phosphopeptides. J. Am. Soc. Mass Spectrom. 2009, 20 (8), 1425–1434.
(137) Carr, S. A.; Huddleston, M. J.; Annan, R. S. Selective detection and sequencing of
phosphopeptides at the femtomole level by mass spectrometry. Anal. Biochem. 1996,
239 (2), 180–192.
(138) Nardiello, D.; Palermo, C.; Natale, A.; Quinto, M.; Centonze, D. Strategies in protein
sequencing and characterization: multi-enzyme digestion coupled with alternate
CID/ETD tandem mass spectrometry. Anal. Chim. Acta 2015, 854, 106–117.

178
(139) Linding, R.; Jensen, L. J.; Ostheimer, G. J.; van Vugt, M. A. T. M.; Jørgensen, C.;
Miron, I. M.; Diella, F.; Colwill, K.; Taylor, L.; Elder, K.; et al. Systematic discovery
of in vivo phosphorylation networks. Cell 2007, 129 (7), 1415–1426.
(140) Steen, H.; Jebanathirajah, J. A.; Rush, J.; Morrice, N.; Kirschner, M. W.
Phosphorylation analysis by mass spectrometry: myths, facts, and the consequences for
qualitative and quantitative measurements. Mol. Cell. Proteomics 2006, 5 (1), 172–
181.
(141) Yates, J. R. The revolution and evolution of shotgun proteomics for large-scale
proteome analysis. J. Am. Chem. Soc. 2013, 135 (5), 1629–1640.
(142) Brun, V.; Dupuis, A.; Adrait, A.; Marcellin, M.; Thomas, D.; Court, M.; Vandenesch,
F.; Garin, J. Isotope-labeled protein standards: toward absolute quantitative
proteomics. Mol. Cell. Proteomics 2007, 6 (12), 2139–2149.
(143) Addona, T. A.; Abbatiello, S. E.; Schilling, B.; Skates, S. J.; Mani, D. R.; Bunk, D. M.;
Spiegelman, C. H.; Zimmerman, L. J.; Ham, A.-J. L.; Keshishian, H.; et al. Multi-site
assessment of the precision and reproducibility of multiple reaction monitoring-based
measurements of proteins in plasma. Nat. Biotechnol. 2009, 27 (7), 633–641.
(144) Sherman, J.; McKay, M. J.; Ashman, K.; Molloy, M. P. How specific is my SRM?:
The issue of precursor and product ion redundancy. Proteomics 2009, 9 (5), 1120–
1123.
(145) Nesvizhskii, A. I.; Vitek, O.; Aebersold, R. Analysis and validation of proteomic data
generated by tandem mass spectrometry. Nat. Methods 2007, 4 (10), 787–797.
(146) Mallick, P.; Schirle, M.; Chen, S. S.; Flory, M. R.; Lee, H.; Martin, D.; Ranish, J.;
Raught, B.; Schmitt, R.; Werner, T.; et al. Computational prediction of proteotypic
peptides for quantitative proteomics. Nat. Biotechnol. 2007, 25 (1), 125–131.
(147) Picotti, P.; Aebersold, R.; Domon, B. The implications of proteolytic background for
shotgun proteomics. Mol. Cell. Proteomics 2007, 6 (9), 1589–1598.
(148) Fusaro, V. A.; Mani, D. R.; Mesirov, J. P.; Carr, S. A. Prediction of high-responding
peptides for targeted protein assays by mass spectrometry. Nat. Biotechnol. 2009, 27
(2), 190–198.
(149) Deutsch, E. W.; Lam, H.; Aebersold, R. PeptideAtlas: a resource for target selection
for emerging targeted proteomics workflows. EMBO Rep. 2008, 9 (5), 429–434.
(150) Craig, R.; Cortens, J. P.; Beavis, R. C. Open source system for analyzing, validating,
and storing protein identification data. J. Proteome Res. 3 (6), 1234–1242.
(151) Picotti, P.; Lam, H.; Campbell, D.; Deutsch, E. W.; Mirzaei, H.; Ranish, J.; Domon,
B.; Aebersold, R. A database of mass spectrometric assays for the yeast proteome. Nat.
Methods 2008, 5 (11), 913–914.
(152) Picotti, P.; Bodenmiller, B.; Mueller, L. N.; Domon, B.; Aebersold, R. Full dynamic
range proteome analysis of S. cerevisiae by targeted proteomics. Cell 2009, 138 (4),
795–806.

179
(153) Jemal, M.; Xia, Y.-Q. The need for adequate chromatographic separation in the
quantitative determination of drugs in biological samples by high performance liquid
chromatography with tandem mass spectrometry. Rapid Commun. Mass Spectrom.
1999, 13 (2), 97–106.
(154) Gerber, S. A.; Rush, J.; Stemman, O.; Kirschner, M. W.; Gygi, S. P. Absolute
quantification of proteins and phosphoproteins from cell lysates by tandem MS. Proc.
Natl. Acad. Sci. U. S. A. 2003, 100 (12), 6940–6945.
(155) Berna, M.; Ackermann, B. Increased throughput for low-abundance protein biomarker
verification by liquid chromatography/tandem mass spectrometry. Anal. Chem. 2009,
81 (10), 3950–3956.
(156) Barnett, D. a; Ding, L.; Ells, B.; Purves, R. W.; Guevremont, R. Tandem mass spectra
of tryptic peptides at signal-to-background ratios approaching unity using electrospray
ionization high-field asymmetric waveform ion mobility spectrometry/hybrid
quadrupole time-of-flight mass spectrometry. Rapid Commun. Mass Spectrom. 2002,
16 (7), 676–680.
(157) Ong, S.-E.; Mann, M. Mass spectrometry-based proteomics turns quantitative. Nat.
Chem. Biol. 2005, 1 (5), 252–262.
(158) Zhang, H.; Liu, Q.; Zimmerman, L. J.; Ham, A.-J. L.; Slebos, R. J. C.; Rahman, J.;
Kikuchi, T.; Massion, P. P.; Carbone, D. P.; Billheimer, D.; et al. Methods for peptide
and protein quantitation by liquid chromatography-multiple reaction monitoring mass
spectrometry. Mol. Cell. Proteomics 2011, 10 (6), M110.006593.
(159) Beynon, R. J.; Doherty, M. K.; Pratt, J. M.; Gaskell, S. J. Multiplexed absolute
quantification in proteomics using artificial QCAT proteins of concatenated signature
peptides. Nat. Methods 2005, 2 (8), 587–589.
(160) Holzmann, J.; Pichler, P.; Madalinski, M.; Kurzbauer, R.; Mechtler, K. Stoichiometry
determination of the MP1-p14 complex using a novel and cost-efficient method to
produce an equimolar mixture of standard peptides. Anal. Chem. 2009, 81 (24),
10254–10261.
(161) Wang, Q.; Chaerkady, R.; Wu, J.; Hwang, H. J.; Papadopoulos, N.; Kopelovich, L.;
Maitra, A.; Matthaei, H.; Eshleman, J. R.; Hruban, R. H.; et al. Mutant proteins as
cancer-specific biomarkers. Proc. Natl. Acad. Sci. U. S. A. 2011, 108 (6), 2444–2449.
(162) Jovanovic, M.; Reiter, L.; Picotti, P.; Lange, V.; Bogan, E.; Hurschler, B. A.;
Blenkiron, C.; Lehrbach, N. J.; Ding, X. C.; Weiss, M.; et al. A quantitative targeted
proteomics approach to validate predicted microRNA targets in C. elegans. Nat.
Methods 2010, 7 (10), 837–842.
(163) Wolf-Yadlin, A.; Hautaniemi, S.; Lauffenburger, D. A.; White, F. M. Multiple reaction
monitoring for robust quantitative proteomic analysis of cellular signaling networks.
Proc. Natl. Acad. Sci. U. S. A. 2007, 104 (14), 5860–5865.
(164) Picotti, P.; Aebersold, R. Selected reaction monitoring-based proteomics: workflows,
potential, pitfalls and future directions. Nat. Methods 2012, 9 (6), 555–566.

180
(165) Keshishian, H.; Addona, T.; Burgess, M.; Kuhn, E.; Carr, S. A. Quantitative,
multiplexed assays for low abundance proteins in plasma by targeted mass
spectrometry and stable isotope dilution. Mol. Cell. Proteomics 2007, 6 (12), 2212–
2229.
(166) Cima, I.; Schiess, R.; Wild, P.; Kaelin, M.; Schüffler, P.; Lange, V.; Picotti, P.; Ossola,
R.; Templeton, A.; Schubert, O.; et al. Cancer genetics-guided discovery of serum
biomarker signatures for diagnosis and prognosis of prostate cancer. Proc. Natl. Acad.
Sci. U. S. A. 2011, 108 (8), 3342–3347.
(167) Guevremont, R. High-field asymmetric waveform ion mobility spectrometry: A new
tool for mass spectrometry. J. Chromatogr. A 2004, 1058 (1-2), 3–19.
(168) McDaniel, E. W.; Martin, D. W.; Barnes, W. S. Drift Tube-Mass Spectrometer for
Studies of Low-Energy Ion-Molecule Reactions. Rev. Sci. Instrum. 1962, 33 (1), 2.
(169) Buryakov, I. A.; Krylov, E. V.; Nazarov, E. G.; Rasulev, U. K. A new method of
separation of multi-atomic ions by mobility at atmospheric pressure using a high-
frequency amplitude-asymmetric strong electric field. Int. J. Mass Spectrom. Ion
Process. 1993, 128 (3), 143–148.
(170) Kolakowski, B. M.; Mester, Z. Review of applications of high-field asymmetric
waveform ion mobility spectrometry (FAIMS) and differential mobility spectrometry
(DMS). Analyst 2007, 132 (9), 842–864.
(171) Mason, E. A.; Schamp, H. W. Mobility of gaseous lons in weak electric fields. Ann.
Phys. (N. Y). 1958, 4 (3), 233–270.
(172) Giles, K.; Pringle, S. D.; Worthington, K. R.; Little, D.; Wildgoose, J. L.; Bateman, R.
H. Applications of a travelling wave-based radio-frequency-only stacked ring ion
guide. Rapid Commun. Mass Spectrom. 2004, 18 (20), 2401–2414.
(173) Pringle, S. D.; Giles, K.; Wildgoose, J. L.; Williams, J. P.; Slade, S. E.; Thalassinos,
K.; Bateman, R. H.; Bowers, M. T.; Scrivens, J. H. An investigation of the mobility
separation of some peptide and protein ions using a new hybrid quadrupole/travelling
wave IMS/oa-ToF instrument. Int. J. Mass Spectrom. 2007, 261 (1), 1–12.
(174) Guevremont, R.; Purves, R. W. Atmospheric pressure ion focusing in a high-field
asymmetric waveform ion mobility spectrometer. Rev. Sci. Instrum. 1999, 70 (2),
1370.
(175) Shvartsburg, A. A.; Li, F.; Tang, K.; Smith, R. D. High-resolution field asymmetric
waveform ion mobility spectrometry using new planar geometry analyzers. Anal.
Chem. 2006, 78 (11), 3706–3714.
(176) Barnett, D. A.; Ells, B.; Guevremont, R.; Purves, R. W. Separation of leucine and
isoleucine by electrospray ionization-high field asymmetric waveform ion mobility
spectrometry-mass spectrometry. J. Am. Soc. Mass Spectrom. 1999, 10 (12), 1279–
1284.
(177) Krylov, E. V. Comparison of the planar and coaxial field asymmetrical waveform ion
mobility spectrometer (FAIMS). Int. J. Mass Spectrom. 2003, 225 (1), 39–51.

181
(178) Krylov, E. V. A method of reducing diffusion losses in a drift spectrometer. Tech.
Phys. 1999, 44 (1), 113–116.
(179) Swearingen, K. E.; Hoopmann, M. R.; Johnson, R. S.; Saleem, R. a.; Aitchison, J. D.;
Moritz, R. L. Nanospray FAIMS Fractionation Provides Significant Increases in
Proteome Coverage of Unfractionated Complex Protein Digests. Mol. Cell. Proteomics
2012, 11 (4), M111.014985–M111.014985.
(180) Shvartsburg, A. A.; Smith, R. D.; Wilks, A.; Koehl, A.; Ruiz-Alonso, D.; Boyle, B.
Ultrafast differential ion mobility spectrometry at extreme electric fields in
multichannel microchips. Anal. Chem. 2009, 81 (15), 6489–6495.
(181) Prasad, S.; Belford, M. W.; Dunyach, J.-J.; Purves, R. W. On an Aerodynamic
Mechanism to Enhance Ion Transmission and Sensitivity of FAIMS for Nano-
Electrospray Ionization-Mass Spectrometry. J. Am. Soc. Mass Spectrom. 2014.
(182) Beach, D. G.; Gabryelski, W. Nontarget analysis of urine by electrospray ionization-
high field asymmetric waveform ion mobility-tandem mass spectrometry. Anal. Chem.
2011, 83 (23), 9107–9113.
(183) Xia, Y.-Q.; Wu, S. T.; Jemal, M. LC-FAIMS-MS/MS for quantification of a peptide in
plasma and evaluation of FAIMS global selectivity from plasma components. Anal.
Chem. 2008, 80 (18), 7137–7143.
(184) Shvartsburg, A. A.; Creese, A. J.; Smith, R. D.; Cooper, H. J. Separation of a set of
peptide sequence isomers using differential ion mobility spectrometry. Anal. Chem.
2011, 83 (18), 6918–6923.
(185) Venne, K.; Bonneil, E.; Eng, K.; Thibault, P. Improvement in Peptide Detection for
Proteomics Analyses Using NanoLC - MS and High-Field Spectrometry. 2005, 77 (7),
2176–2186.
(186) Canterbury, J. D.; Yi, X.; Hoopmann, M. R.; MacCoss, M. J. Assessing the dynamic
range and peak capacity of nanoflow LC-FAIMS-MS on an ion trap mass spectrometer
for proteomics. Anal. Chem. 2008, 80 (18), 6888–6897.
(187) Saba, J.; Bonneil, E.; Pomie, C.; Eng, K.; Thibault, P. Enhanced Sensitivity in
Proteomics Experiments Using FAIMS Coupled with a Hybrid Linear Ion Trap /
Orbitrap Mass Spectrometer † research articles. 2009, No. Cv, 3355–3366.
(188) Shvartsburg, A. A.; Tang, K.; Smith, R. D. Understanding and designing field
asymmetric waveform ion mobility spectrometry separations in gas mixtures. Anal.
Chem. 2004, 76 (24), 7366–7374.
(189) Shvartsburg, A. A.; Danielson, W. F.; Smith, R. D. High-resolution differential ion
mobility separations using helium-rich gases. Anal. Chem. 2010, 82 (6), 2456–2462.
(190) Angel, T. E.; Aryal, U. K.; Hengel, S. M.; Baker, E. S.; Kelly, R. T.; Robinson, E. W.;
Smith, R. D. Mass spectrometry-based proteomics: existing capabilities and future
directions. Chem. Soc. Rev. 2012, 41 (10), 3912–3928.
(191) Creese, A. J.; Smart, J.; Cooper, H. J. Large-scale analysis of peptide sequence
variants: the case for high-field asymmetric waveform ion mobility spectrometry.
Anal. Chem. 2013, 85 (10), 4836–4843.

182
(192) Cunningham, D. L.; Sweet, S. M. M.; Cooper, H. J.; Heath, J. K. Differential
Phosphoproteomics of Fibroblast Growth Factor Signaling : Identification of Src
Family Kinase-Mediated Phosphorylation Events research articles. 2010, 2317–2328.
(193) Cox, J.; Mann, M. MaxQuant enables high peptide identification rates, individualized
p.p.b.-range mass accuracies and proteome-wide protein quantification. Nat.
Biotechnol. 2008, 26 (12), 1367–1372.
(194) MacLean, B.; Tomazela, D. M.; Shulman, N.; Chambers, M.; Finney, G. L.; Frewen,
B.; Kern, R.; Tabb, D. L.; Liebler, D. C.; MacCoss, M. J. Skyline: an open source
document editor for creating and analyzing targeted proteomics experiments.
Bioinformatics 2010, 26 (7), 966–968.
(195) Shvartsburg, A. A.; Smith, R. D. Fundamentals of traveling wave ion mobility
spectrometry. Anal. Chem. 2008, 80 (24), 9689–9699.
(196) Villén J, G. S. The SCX/IMAC enrichment approach for global phosphorylation
analysis by mass spectrometry. Nat. Protoc. 2008, 3 (10), 1630–1638.
(197) Hornbeck, P. V; Kornhauser, J. M.; Tkachev, S.; Zhang, B.; Skrzypek, E.; Murray, B.;
Latham, V.; Sullivan, M. PhosphoSitePlus: a comprehensive resource for investigating
the structure and function of experimentally determined post-translational
modifications in man and mouse. Nucleic Acids Res. 2012, 40 (Database issue), D261–
D270.
(198) Chou, M. F.; Schwartz, D. Using the scan-x Web site to predict protein post-
translational modifications. Curr. Protoc. Bioinformatics 2011, Chapter 13, Unit
13.16.
(199) Mansour, S. J.; Matten, W. T.; Hermann, A. S.; Candia, J. M.; Rong, S.; Fukasawa, K.;
Vande Woude, G. F.; Ahn, N. G. Transformation of mammalian cells by constitutively
active MAP kinase kinase. Science 1994, 265 (5174), 966–970.
(200) Huang, D. W.; Sherman, B. T.; Lempicki, R. A. Systematic and integrative analysis of
large gene lists using DAVID bioinformatics resources. Nat. Protoc. 2009, 4 (1), 44–
57.
(201) Hashiguchi, M.; Kobori, H.; Ritprajak, P.; Kamimura, Y.; Kozono, H.; Azuma, M.
Triggering receptor expressed on myeloid cell-like transcript 2 (TLT-2) is a counter-
receptor for B7-H3 and enhances T cell responses. Proc. Natl. Acad. Sci. U. S. A.
2008, 105 (30), 10495–10500.
(202) Roy, R.; Durie, D.; Li, H.; Liu, B.-Q.; Skehel, J. M.; Mauri, F.; Cuorvo, L. V.;
Barbareschi, M.; Guo, L.; Holcik, M.; et al. hnRNPA1 couples nuclear export and
translation of specific mRNAs downstream of FGF-2/S6K2 signalling. Nucleic Acids
Res. 2014, 42 (20), 12483–12497.
(203) van Agthoven, T.; van Agthoven, T. L.; Dekker, A.; van der Spek, P. J.; Vreede, L.;
Dorssers, L. C. Identification of BCAR3 by a random search for genes involved in
antiestrogen resistance of human breast cancer cells. EMBO J. 1998, 17 (10), 2799–
2808.
183
(204) Makkinje, A.; Vanden Borre, P.; Near, R. I.; Patel, P. S.; Lerner, A. Breast cancer anti-
estrogen resistance 3 (BCAR3) protein augments binding of the c-Src SH3 domain to
Crk-associated substrate (p130cas). J. Biol. Chem. 2012, 287 (33), 27703–27714.
(205) Crooks, G. E.; Hon, G.; Chandonia, J.-M.; Brenner, S. E. WebLogo: a sequence logo
generator. Genome Res. 2004, 14 (6), 1188–1190.
(206) Shannon, P.; Markiel, A.; Ozier, O.; Baliga, N. S.; Wang, J. T.; Ramage, D.; Amin, N.;
Schwikowski, B.; Ideker, T. Cytoscape: a software environment for integrated models
of biomolecular interaction networks. Genome Res. 2003, 13 (11), 2498–2504.
(207) Pearson, G.; Robinson, F.; Beers Gibson, T.; Xu, B. E.; Karandikar, M.; Berman, K.;
Cobb, M. H. Mitogen-activated protein (MAP) kinase pathways: regulation and
physiological functions. Endocr. Rev. 2001, 22 (2), 153–183.
(208) Helling, S.; Shinde, S.; Brosseron, F.; Schnabel, A.; Müller, T.; Meyer, H. E.; Marcus,
K.; Sellergren, B. Ultratrace enrichment of tyrosine phosphorylated peptides on an
imprinted polymer. Anal. Chem. 2011, 83 (5), 1862–1865.
(209) Edelmann, M. J. Strong cation exchange chromatography in analysis of
posttranslational modifications: innovations and perspectives. J. Biomed. Biotechnol.
2011, 2011, 936508.
(210) Dailey, L.; Ambrosetti, D.; Mansukhani, A.; Basilico, C. Mechanisms underlying
differential responses to FGF signaling. Cytokine Growth Factor Rev. 2005, 16 (2),
233–247.
(211) Zakrzewska, M.; Haugsten, E. M.; Nadratowska-Wesolowska, B.; Oppelt, A.; Hausott,
B.; Jin, Y.; Otlewski, J.; Wesche, J.; Wiedlocha, A. ERK-mediated phosphorylation of
fibroblast growth factor receptor 1 on Ser777 inhibits signaling. Sci. Signal. 2013, 6
(262), ra11.
(212) Varedi K, S. M.; Ventura, A. C.; Merajver, S. D.; Lin, X. N. Multisite phosphorylation
provides an effective and flexible mechanism for switch-like protein degradation.
PLoS One 2010, 5 (12), e14029.
(213) Valk, E.; Venta, R.; Ord, M.; Faustova, I.; Kõivomägi, M.; Loog, M. Multistep
phosphorylation systems: tunable components of biological signaling circuits. Mol.
Biol. Cell 2014, 25 (22), 3456–3460.
(214) Gunawardena, J. Distributivity and processivity in multisite phosphorylation can be
distinguished through steady-state invariants. Biophys. J. 2007, 93 (11), 3828–3834.
(215) Jin, J.; Pawson, T. Modular evolution of phosphorylation-based signalling systems.
Philos. Trans. R. Soc. B Biol. Sci. 2012, 367 (1602), 2540–2555.
(216) Lee, J. Y.; Chiu, Y.-H.; Asara, J.; Cantley, L. C. Inhibition of PI3K binding to
activators by serine phosphorylation of PI3K regulatory subunit p85alpha Src
homology-2 domains. Proc. Natl. Acad. Sci. U. S. A. 2011, 108 (34), 14157–14162.
(217) Swearingen, K. E.; Winget, J. M.; Hoopmann, M. R.; Kusebauch, U.; Moritz, R. L.
Decreased Gap Width in a Cylindrical High-Field Asymmetric Waveform Ion
Mobility Spectrometry Device Improves Protein Discovery. Anal. Chem. 2015, 87
(24), 12230–12237.

184
(218) Shvartsburg, A. A.; Tang, K.; Smith, R. D. Optimization of the design and operation of
FAIMS analyzers. J. Am. Soc. Mass Spectrom. 2005, 16 (1), 2–12.
(219) Shvartsburg, A. A.; Tang, K.; Smith, R. D. FAIMS operation for realistic gas flow
profile and asymmetric waveforms including electronic noise and ripple. J. Am. Soc.
Mass Spectrom. 2005, 16 (9), 1447–1455.
(220) Barnett, D. A.; Belford, M.; Dunyach, J.-J.; Purves, R. W. Characterization of a
temperature-controlled FAIMS system. J. Am. Soc. Mass Spectrom. 2007, 18 (9),
1653–1663.
(221) Shvartsburg, A. A.; Tang, K.; Smith, R. D. Differential ion mobility separations of
peptides with resolving power exceeding 50. Anal. Chem. 2010, 82 (1), 32–35.
(222) Barnett, D. A.; Ouellette, R. J. Elimination of the helium requirement in high-field
asymmetric waveform ion mobility spectrometry (FAIMS): beneficial effects of
decreasing the analyzer gap width on peptide analysis. Rapid Commun. Mass
Spectrom. 2011, 25 (14), 1959–1971.
(223) Nesvizhskii, A. I.; Aebersold, R. Interpretation of shotgun proteomic data: the protein
inference problem. Mol. Cell. Proteomics 2005, 4 (10), 1419–1440.
(224) Richards, A. L.; Merrill, A. E.; Coon, J. J. Proteome sequencing goes deep. Curr.
Opin. Chem. Biol. 2015, 24, 11–17.
(225) Kearney, R.; Blondeau, F.; McPherson, P.; Bell, A.; Servant, F.; Drapeau, M.; de
Grandpre, S.; Jm Bergeron, J. Elimination of redundant protein identifications in high
throughput proteomics. Conf. Proc. ... Annu. Int. Conf. IEEE Eng. Med. Biol. Soc.
IEEE Eng. Med. Biol. Soc. Annu. Conf. 2005, 5, 4803–4806.
(226) Frimpong, A. K.; Abzalimov, R. R.; Uversky, V. N.; Kaltashov, I. A. Characterization
of intrinsically disordered proteins with electrospray ionization mass spectrometry:
conformational heterogeneity of alpha-synuclein. Proteins 2010, 78 (3), 714–722.
(227) Sandilands, E.; Akbarzadeh, S.; Vecchione, A.; McEwan, D. G.; Frame, M. C.; Heath,
J. K. Src kinase modulates the activation, transport and signalling dynamics of
fibroblast growth factor receptors. EMBO Rep. 2007, 8 (12), 1162–1169.
(228) Mani, D. R.; Abbatiello, S. E.; Carr, S. A. Statistical characterization of multiple-
reaction monitoring mass spectrometry (MRM-MS) assays for quantitative proteomics.
BMC Bioinformatics 2012, 13 Suppl 1 (Suppl 16), S9.
(229) Durbin, B. P.; Hardin, J. S.; Hawkins, D. M.; Rocke, D. M. A variance-stabilizing
transformation for gene-expression microarray data. Bioinformatics 2002, 18 (Suppl
1), S105–S110.
(230) Irizarry, R. A.; Hobbs, B.; Collin, F.; Beazer-Barclay, Y. D.; Antonellis, K. J.; Scherf,
U.; Speed, T. P. Exploration, normalization, and summaries of high density
oligonucleotide array probe level data. Biostatistics 2003, 4 (2), 249–264.
(231) Stauber, D. J.; DiGabriele, A. D.; Hendrickson, W. A. Structural interactions of
fibroblast growth factor receptor with its ligands. Proc. Natl. Acad. Sci. U. S. A. 2000,
97 (1), 49–54.

185
(232) Pellegrini, L.; Burke, D. F.; von Delft, F.; Mulloy, B.; Blundell, T. L. Crystal structure
of fibroblast growth factor receptor ectodomain bound to ligand and heparin. Nature
2000, 407 (6807), 1029–1034.
(233) Doehn, U.; Hauge, C.; Frank, S. R.; Jensen, C. J.; Duda, K.; Nielsen, J. V; Cohen, M.
S.; Johansen, J. V; Winther, B. R.; Lund, L. R.; et al. RSK is a principal effector of the
RAS-ERK pathway for eliciting a coordinate promotile/invasive gene program and
phenotype in epithelial cells. Mol. Cell 2009, 35 (4), 511–522.
(234) Anjum, R.; Blenis, J. The RSK family of kinases: emerging roles in cellular signalling.
Nat. Rev. Mol. Cell Biol. 2008, 9 (10), 747–758.
(235) Dephoure, N.; Zhou, C.; Villen, J.; Beausoleil, S. A.; Bakalarski, C. E.; Elledge, S. J.;
Gygi, S. P. A quantitative atlas of mitotic phosphorylation. Proc. Natl. Acad. Sci.
2008, 105 (31), 10762–10767.
(236) Cho, Y.-Y.; Yao, K.; Kim, H.-G.; Kang, B. S.; Zheng, D.; Bode, A. M.; Dong, Z.
Ribosomal S6 kinase 2 is a key regulator in tumor promoter induced cell
transformation. Cancer Res. 2007, 67 (17), 8104–8112.
(237) Stratford, A. L.; Reipas, K.; Hu, K.; Fotovati, A.; Brough, R.; Frankum, J.; Takhar, M.;
Watson, P.; Ashworth, A.; Lord, C. J.; et al. Targeting p90 ribosomal S6 kinase
eliminates tumor-initiating cells by inactivating Y-box binding protein-1 in triple-
negative breast cancers. Stem Cells 2012, 30 (7), 1338–1348.
(238) Dalby, K. N.; Morrice, N.; Caudwell, F. B.; Avruch, J.; Cohen, P. Identification of
regulatory phosphorylation sites in mitogen-activated protein kinase (MAPK)-
activated protein kinase-1a/p90rsk that are inducible by MAPK. J. Biol. Chem. 1998,
273 (3), 1496–1505.
(239) Newton, A. C. Regulation of the ABC kinases by phosphorylation: protein kinase C as
a paradigm. Biochem. J. 2003, 370 (Pt 2), 361–371.
(240) Roux, P. P.; Richards, S. A.; Blenis, J. Phosphorylation of p90 ribosomal S6 kinase
(RSK) regulates extracellular signal-regulated kinase docking and RSK activity. Mol.
Cell. Biol. 2003, 23 (14), 4796–4804.
(241) Cargnello, M.; Roux, P. P. Activation and function of the MAPKs and their substrates,
the MAPK-activated protein kinases. Microbiol. Mol. Biol. Rev. 2011, 75 (1), 50–83.
(242) Cooper, J. A.; Bowen-Pope, D. F.; Raines, E.; Ross, R.; Hunter, T. Similar effects of
platelet-derived growth factor and epidermal growth factor on the phosphorylation of
tyrosine in cellular proteins. Cell 1982, 31 (1), 263–273.
(243) Roskoski, R. MEK1/2 dual-specificity protein kinases: structure and regulation.
Biochem. Biophys. Res. Commun. 2012, 417 (1), 5–10.
(244) Kinoshita, T.; Yoshida, I.; Nakae, S.; Okita, K.; Gouda, M.; Matsubara, M.; Yokota,
K.; Ishiguro, H.; Tada, T. Crystal structure of human mono-phosphorylated ERK1 at
Tyr204. Biochem. Biophys. Res. Commun. 2008, 377 (4), 1123–1127.
(245) Jeffrey, K. L.; Camps, M.; Rommel, C.; Mackay, C. R. Targeting dual-specificity
phosphatases: manipulating MAP kinase signalling and immune responses. Nat. Rev.
Drug Discov. 2007, 6 (5), 391–403.

186
(246) Canagarajah, B. J.; Khokhlatchev, A.; Cobb, M. H.; Goldsmith, E. J. Activation
Mechanism of the MAP Kinase ERK2 by Dual Phosphorylation. Cell 1997, 90 (5),
859–869.
(247) Sözeri, O.; Vollmer, K.; Liyanage, M.; Frith, D.; Kour, G.; Mark, G. E.; Stabel, S.
Activation of the c-Raf protein kinase by protein kinase C phosphorylation. Oncogene
1992, 7 (11), 2259–2262.
(248) Robbins, D.; Zhen, E.; Owaki, H.; Vanderbilt, C.; Ebert, D.; Geppert, T.; Cobb, M.
Regulation and properties of extracellular signal-regulated protein kinases 1 and 2 in
vitro. J. Biol. Chem. 1993, 268 (7), 5097–5106.
(249) Bellou, S.; Hink, M. A.; Bagli, E.; Panopoulou, E.; Bastiaens, P. I. H.; Murphy, C.;
Fotsis, T. VEGF autoregulates its proliferative and migratory ERK1/2 and p38
cascades by enhancing the expression of DUSP1 and DUSP5 phosphatases in
endothelial cells. Am. J. Physiol. Cell Physiol. 2009, 297 (6), C1477–C1489.
(250) Roskoski, R. ERK1/2 MAP kinases: structure, function, and regulation. Pharmacol.
Res. 2012, 66 (2), 105–143.
(251) Vantaggiato, C.; Formentini, I.; Bondanza, A.; Bonini, C.; Naldini, L.; Brambilla, R.
ERK1 and ERK2 mitogen-activated protein kinases affect Ras-dependent cell
signaling differentially. J. Biol. 2006, 5 (5), 14.
(252) Fischer, A. M.; Katayama, C. D.; Pagès, G.; Pouysségur, J.; Hedrick, S. M. The role of
erk1 and erk2 in multiple stages of T cell development. Immunity 2005, 23 (4), 431–
443.
(253) Shin, S.; Dimitri, C. A.; Yoon, S.-O.; Dowdle, W.; Blenis, J. ERK2 but not ERK1
induces epithelial-to-mesenchymal transformation via DEF motif-dependent signaling
events. Mol. Cell 2010, 38 (1), 114–127.
(254) Pagès, G. Defective Thymocyte Maturation in p44 MAP Kinase (Erk 1) Knockout
Mice. Science (80-. ). 1999, 286 (5443), 1374–1377.
(255) Lefloch, R.; Pouysségur, J.; Lenormand, P. Single and combined silencing of ERK1
and ERK2 reveals their positive contribution to growth signaling depending on their
expression levels. Mol. Cell. Biol. 2008, 28 (1), 511–527.
(256) Wortzel, I.; Seger, R. The ERK Cascade: Distinct Functions within Various
Subcellular Organelles. Genes Cancer 2011, 2 (3), 195–209.
(257) Lange, V.; Picotti, P.; Domon, B.; Aebersold, R. Selected reaction monitoring for
quantitative proteomics: a tutorial. Mol. Syst. Biol. 2008, 4, 222.
(258) Wissing, J.; Jänsch, L.; Nimtz, M.; Dieterich, G.; Hornberger, R.; Kéri, G.; Wehland,
J.; Daub, H. Proteomics analysis of protein kinases by target class-selective
prefractionation and tandem mass spectrometry. Mol. Cell. Proteomics 2007, 6 (3),
537–547.
(259) Stasyk, T.; Morandell, S.; Bakry, R.; Feuerstein, I.; Huck, C. W.; Stecher, G.; Bonn, G.
K.; Huber, L. A. Quantitative detection of phosphoproteins by combination of two-
dimensional difference gel electrophoresis and phosphospecific fluorescent staining.
Electrophoresis 2005, 26 (14), 2850–2854.

187
(260) McNulty, D. E.; Annan, R. S. Hydrophilic interaction chromatography reduces the
complexity of the phosphoproteome and improves global phosphopeptide isolation and
detection. Mol. Cell. Proteomics 2008, 7 (5), 971–980.
Appendix

188
Appendix 1 Information of novel phosphorylation sites
Peptide sequence Position
Ratio
SU5402/
FGF1
Ratio
dasatinib/
FGF1
Amino acid
No of
phosphosi
tes
ChargeLocalizati
on prob
Sensitive to
treatments
(ac)AEQVLPQALY(ph)LSNM(ox)R 10 0 0 Y 1 3 0.764266
(ac)ATPAAVNPPEMAS(ph)DIPGSVTLPVAPM(ox)AAT(ph)GQVR 29 2.4473 0.69875 T 2 4 0.957397 +
(ac)EETMKLAT(ph)M(ox)EDT(ph)VEYCLFLIPDESR 12 2.3208 0.94942 T 2 3 0.758026 +
(ac)GQHNLTVLTEFILM(ox)ELT(ph)R 17 0.65406 0.54629 T 1 3 0.999583
(ac)M(ox)DLNNMNQSLTLELNT(ph)MKQAMK 16 0 0 T 1 3 0.99976
(ac)M(ox)S(ph)S(ph)NSDTGDLQES(ph)LK 3 2.2934 1.4706 S 3 3 0.899368 +
(ac)M(ox)TTAHFYCQYCT(ph)ASLLGK 12 9.2525 2.6136 T 1 3 0.832268 +
(ac)MAS(ph)LS(ph)AAAIT(ph)VPPSVPSR 3 0.36143 0.43905 S 3 3 0.999828 +
(ac)PNVPAPLAQSQQLS(ph)S(ph)HTPVS(ph)R 20 0 0 S 3 3 0.999446
(ac)RALAVLS(ph)VTLVMACT(ph)EAFFPFIS(ph)R 23 0 0 S 3 3 0.999818
(ac)RALAVLS(ph)VTLVMACT(ph)EAFFPFIS(ph)R 15 0 0 T 3 3 0.947686
(ac)RALAVLS(ph)VTLVMACT(ph)EAFFPFIS(ph)R 7 0 0 S 3 3 0.754244
(ac)RPGLAPEPLSAPPGS(ph)PPPS(ph)AAPTSATSNSSNGGGPSK 15 0 0 S 2 3 0.899589
(ac)USEVDVLVFVVDS(ph)ADRLR 13 0.96865 1.0219 S 1 3 0.99902
(ac)VALAGLLM(ox)T(ph)LPHFISEPYR 9 0.20042 0.91782 T 1 3 0.984761 +
(ac)VSLPPPQS(ph)DVTLPGPTR 8 1.0517 0.8099 S 1 3 0.825843
AADVWSLGVM(ox)LY(ph)TM(ox)LVGR 12 0.58929 0.69977 Y 1 3 0.840918
AMQEKAQDY(ph)QAEQDALR 9 1.6691 1.031 Y 1 3 1 +
AS(ph)SPHQAGLGLS(ph)LTPS(ph)PES(ph)PPLPDVSAFS(ph)RGRGGGEGR 2 0.2513 0.25375 S 5 4 0.825627 +
AS(ph)SPHQAGLGLS(ph)LTPS(ph)PES(ph)PPLPDVSAFS(ph)RGRGGGEGR 29 0.2513 0.25375 S 5 4 0.786732 +
ASLY(ph)VGDLHPEVT(ph)EAM(ox)LY(ph)EK 13 0.43994 0.24746 T 3 3 0.999923 +
AT(ph)LM(ox)GGQVYFCY(ph)DGSPYR 2 0.65888 0.86031 T 2 3 0.999993
AT(ph)PLS(ph)STVTLS(ph)M(ox)S(ph)ADVPLVVEY(ph)K 22 0.17484 0.19655 Y 5 3 0.986773 +
AT(ph)PLS(ph)STVTLS(ph)M(ox)S(ph)ADVPLVVEY(ph)K 11 0.17484 0.19655 S 5 3 0.781149 +
AT(ph)PLS(ph)STVTLS(ph)M(ox)S(ph)ADVPLVVEY(ph)K 13 0.17484 0.19655 S 5 3 0.781149 +
AY(ph)PGY(ph)YFT(ph)GDGAYR 8 0.69665 0.79007 T 3 2 0.978978
DGKLVPM(ox)T(ph)VFHK 8 0 0 T 1 3 1

189
Peptide sequence Position
Ratio
SU5402/
FGF1
Ratio
dasatinib/
FGF1
Amino acid
No of
phosphosi
tes
ChargeLocalizati
on prob
Sensitive to
treatments
DS(ph)GQVIPLIVES(ph)CIR 2 4.697 0.78668 S 2 2 1 +
DS(ph)GQVIPLIVES(ph)CIR 12 4.697 0.78668 S 2 2 1 +
DSEDS(ph)LY(ph)NDYVDVFY(ph)NTK 7 4.0314 2.1864 Y 3 3 0.988714 +
DSEDS(ph)LY(ph)NDYVDVFY(ph)NTK 5 4.0314 2.1864 S 3 3 0.941579 +
DT(ph)LSNS(ph)TLT(ph)EFVK 2 0.6235 0.66507 T 3 3 0.961756
DT(ph)LSNS(ph)TLT(ph)EFVK 9 0.6235 0.66507 T 3 3 0.880026
EFGSQS(ph)IAIHEPQCLQK 6 0.78923 0.68849 S 1 3 0.826564
ENTICLLSQHQFMSGYSQDILM(ox)PLWT(ph)S(ph)YT(ph)VDR 29 0.95505 1.0024 T 3 4 0.87502
ENTICLLSQHQFMSGYSQDILM(ox)PLWT(ph)S(ph)YT(ph)VDR 26 0.95505 1.0024 T 3 4 0.805635
EVM(ox)LENY(ph)GNVVS(ph)LGILLR 12 1.7859 0.53794 S 2 3 1 +
EVM(ox)LENY(ph)GNVVS(ph)LGILLR 7 1.7859 0.53794 Y 2 3 1 +
EVMLENYGNLVSVGCQLS(ph)K 18 0.65302 0.63587 S 1 3 0.973629
FPGGSCM(ox)AALTVT(ph)LM(ox)VLSS(ph)PLALAGDTR 13 4.082 2.0966 T 2 3 0.953492 +
FVSIVT(ph)EEEGVY(ph)S(ph)VDYS(ph)K 12 0 0 Y 4 3 0.989888
FVSIVT(ph)EEEGVY(ph)S(ph)VDYS(ph)K 13 0 0 S 4 3 0.972152
FVSIVT(ph)EEEGVY(ph)S(ph)VDYS(ph)K 6 0 0 T 4 3 0.777465
GLLYDS(ph)DEEDEERPAR 6 0.80199 0.71766 S 1 2 1
GLS(ph)LDSFLR 3 1.0269 0.84621 S 1 2 1
GS(ph)FIITLVKIPRMILM(ox)Y(ph)IHS(ph)QLK 2 0.28389 0.34202 S 3 3 0.867587 +
GS(ph)T(ph)VHT(ph)AY(ph)LVLSSLAMFT(ph)CLCGM(ox)AGNSMVIWLLGFR18 0.23937 0.23771 T 5 4 0.924398 +
GS(ph)T(ph)VHT(ph)AY(ph)LVLSSLAMFT(ph)CLCGM(ox)AGNSMVIWLLGFR8 0.23937 0.23771 Y 5 4 0.814082 +
GY(ph)LSETVS(ph)NALGPQGR 2 0.84249 0.94568 Y 2 2 0.865648
GY(ph)QEVIQS(ph)IVQGPGT(ph)LGR 2 0.95576 0.57832 Y 3 3 1
HLPSPPTLDS(ph)IIT(ph)EY(ph)LR 15 0 0 Y 3 3 0.999796
HLPSPPTLDS(ph)IIT(ph)EY(ph)LR 13 0 0 T 3 3 0.999252
HSGLY(ph)LVVTTSENVS(ph)PFS(ph)LLELLSR 18 0 0 S 3 3 0.789984
HSGLY(ph)LVVTTSENVS(ph)PFS(ph)LLELLSR 5 0 0 Y 3 3 0.784338
IAESHLQSIS(ph)NLNENQASEEEDELGELR 10 0.47153 0.41918 S 1 4 0.837253

190
Peptide sequence Position
Ratio
SU5402/
FGF1
Ratio
dasatinib/
FGF1
Amino acid
No of
phosphosi
tes
ChargeLocalizati
on prob
Sensitive to
treatments
IAFLFDS(ph)T(ph)LTAFLM(ox)M(ox)GNLSPNLK 7 0.93878 0.98284 S 1 3 0.999834
IAFLFDS(ph)T(ph)LTAFLM(ox)M(ox)GNLSPNLK 8 0.93878 0.98284 T 1 3 0.999641
IAQFLS(ph)DIPETVPLSTVNR 6 0.91981 0.80601 S 1 3 0.999994
IIFHENYNAGT(ph)YQNDIALIEMK 11 0.90388 0.7692 T 2 3 0.787359
IIFSTLGVCT(ph)FFAVGY(ph)MLLPLFAY(ph)FIR 24 0 0 Y 2 3 0.997899
IIFSTLGVCT(ph)FFAVGY(ph)MLLPLFAY(ph)FIR 16 0 0 Y 2 3 0.994484
IIFSTLGVCT(ph)FFAVGY(ph)MLLPLFAY(ph)FIR 10 0 0 T 1 3 0.902139
ILQQLGLDST(ph)CEDSIVVK 10 0.64662 0.76701 T 2 3 0.753397
IRS(ph)S(ph)LAVLHLENAS(ph)LS(ph)GRP 3 1.0031 1.0551 S 1 3 1
IRS(ph)S(ph)LAVLHLENAS(ph)LS(ph)GRP 4 1.0031 1.0551 S 1 3 1
IS(ph)LDSAQSSRSTSYSPR 2 0.66952 0.79173 S 1 3 0.997764
ITDT(ph)GLS(ph)Y(ph)LS(ph)TM(ox)SSLR 10 0.25479 0.1748 S 1 3 0.972387 +
ITDT(ph)GLS(ph)Y(ph)LS(ph)TM(ox)SSLR 8 0.25479 0.1748 Y 1 3 0.963579 +
ITDT(ph)GLS(ph)Y(ph)LS(ph)TM(ox)SSLR 4 0.25479 0.1748 T 1 3 0.878893 +
ITDT(ph)GLS(ph)Y(ph)LS(ph)TM(ox)SSLR 7 0.25479 0.1748 S 1 3 0.87763 +
IWALKNAFDY(ph)FNNM(ox)R 10 0 0 Y 1 3 1
IYS(ph)GTIK 3 0.80176 0.88136 S 3 2 0.863251
KDYLT(ph)GT(ph)GQDSS(ph)HLVLVTFK 7 0 0 T 2 3 0.758531
KDYLT(ph)GT(ph)GQDSS(ph)HLVLVTFK 12 0 0 S 1 3 0.877501
KY(ph)QM(ox)T(ph)GVEEVT(ph)QIPQEEHAANGPELLR 2 0 0 Y 2 3 1
KY(ph)QM(ox)T(ph)GVEEVT(ph)QIPQEEHAANGPELLR 5 0 0 T 1 3 1
KY(ph)QM(ox)T(ph)GVEEVT(ph)QIPQEEHAANGPELLR 11 0 0 T 1 3 1
LES(ph)Y(ph)LDLM(ox)PNPSLAQVK 3 0.38154 0.3069 S 2 3 0.999889 +
LES(ph)Y(ph)LDLM(ox)PNPSLAQVK 4 0.38154 0.3069 Y 1 3 0.999882 +
LGLLLLS(ph)LS(ph)QGQECGEY(ph)PVT(ph)IPSDLPADFQDFLK 9 1.3789 7.3773 S 1 4 0.999434 +
LGLLLLS(ph)LS(ph)QGQECGEY(ph)PVT(ph)IPSDLPADFQDFLK 7 1.3789 7.3773 S 1 4 0.99942 +
LHT(ph)PMYFFISQLALM(ox)DLMY(ph)LCVTVPK 19 0 0 Y 4 3 0.950056
LIMIPVELLLCY(ph)LLLHPVDAT(ph)S(ph)Y(ph)GK 21 0 0 T 2 3 1

191
Peptide sequence Position
Ratio
SU5402/
FGF1
Ratio
dasatinib/
FGF1
Amino acid
No of
phosphosi
tes
ChargeLocalizati
on prob
Sensitive to
treatments
LIMIPVELLLCY(ph)LLLHPVDAT(ph)S(ph)Y(ph)GK 12 0 0 Y 2 3 1
LIMIPVELLLCY(ph)LLLHPVDAT(ph)S(ph)Y(ph)GK 22 0 0 S 1 3 1
LIMIPVELLLCY(ph)LLLHPVDAT(ph)S(ph)Y(ph)GK 23 0 0 Y 1 3 1
LLEPGTHQFAS(ph)VPVR 11 0.51573 3.4313 S 3 3 0.999999 +
LLQT(ph)IS(ph)DLM(ox)MS(ph)LPSGSSLQQM(ox)ALR 4 0 0 T 2 3 0.817507
LLQT(ph)IS(ph)DLM(ox)MS(ph)LPSGSSLQQM(ox)ALR 6 0 0 S 1 3 0.820288
LLS(ph)HPFLS(ph)THLGSS(ph)M(ox)AR 3 0.40429 0.19312 S 2 3 0.95699 +
LLS(ph)HPFLS(ph)THLGSS(ph)M(ox)AR 8 0.40429 0.19312 S 1 3 0.95699 +
LLS(ph)HPFLS(ph)THLGSS(ph)M(ox)AR 14 0.40429 0.19312 S 1 3 0.788614 +
LNDCS(ph)CLAS(ph)QAILLGILLK 5 0.23268 0.60836 S 1 3 1 +
LNDCS(ph)CLAS(ph)QAILLGILLK 9 0.23268 0.60836 S 1 3 1 +
LPAPLIS(ph)KQQFLS(ph)NS(ph)S(ph)R 7 1.3606 1.6391 S 4 3 1 +
LPAPLIS(ph)KQQFLS(ph)NS(ph)S(ph)R 13 1.3606 1.6391 S 4 3 1 +
LPEFLS(ph)LGNT(ph)FNS(ph)ITLQDEIHDDQGT(ph)TVIFQER 6 0.72807 2.9788 S 1 4 0.930955 +
LPEFLS(ph)LGNT(ph)FNS(ph)ITLQDEIHDDQGT(ph)TVIFQER 13 0.72807 2.9788 S 1 4 0.805934 +
LPEFLS(ph)LGNT(ph)FNS(ph)ITLQDEIHDDQGT(ph)TVIFQER 10 0.72807 2.9788 T 1 4 0.805934 +
LPVAT(ph)IFTT(ph)HAT(ph)LLGR 5 0.33658 0.75037 T 2 3 0.999966 +
LS(ph)ENAT(ph)IQLDVVEAET(ph)EEIT(ph)QGNT(ph)LLR 2 0 0 S 3 3 1
LS(ph)ENAT(ph)IQLDVVEAET(ph)EEIT(ph)QGNT(ph)LLR 6 0 0 T 3 3 1
LS(ph)ENAT(ph)IQLDVVEAET(ph)EEIT(ph)QGNT(ph)LLR 16 0 0 T 3 3 1
LS(ph)ENAT(ph)IQLDVVEAET(ph)EEIT(ph)QGNT(ph)LLR 24 0 0 T 2 3 1
LS(ph)ENAT(ph)IQLDVVEAET(ph)EEIT(ph)QGNT(ph)LLR 20 0 0 T 1 3 1
LS(ph)VLSALQDTFFAKLHR 2 0.83668 0.74408 S 1 3 0.99507
LSCHVLS(ph)ASVGSSAVMS(ph)T(ph)AIM(ox)AT(ph)LLLFK 23 0 0 T 1 3 0.982996
LSCHVLS(ph)ASVGSSAVMS(ph)T(ph)AIM(ox)AT(ph)LLLFK 18 0 0 T 1 3 0.864788
M(ox)DIGTLIWDGGPVPNT(ph)HINKCKNY(ph)Y(ph)EVLGVTK 25 0.3768 0.17034 Y 2 4 0.914605 +
M(ox)FFIQNYVVSEGQLEDS(ph)S(ph)LLEVDGPAM(ox)K 18 0 0 S 2 3 0.938655
M(ox)FFIQNYVVSEGQLEDS(ph)S(ph)LLEVDGPAM(ox)K 17 0 0 S 2 3 0.794356

192
Peptide sequence Position
Ratio
SU5402/
FGF1
Ratio
dasatinib/
FGF1
Amino acid
No of
phosphosi
tes
ChargeLocalizati
on prob
Sensitive to
treatments
M(ox)GRTPT(ph)AVQVKS(ph)FTK 12 3.7885 1.5436 S 4 3 0.990097 +
M(ox)S(ph)GEFPSPVS(ph)IS(ph)IISSTSGGS(ph)GYGFR 2 0 0 S 3 3 0.772995
M(ox)SM(ox)PEALAAAT(ph)INAAYALGK 11 0.85343 0.63642 T 1 3 0.986677
M(ox)T(ph)CT(ph)AFGNPKPIVT(ph)WLK 14 0.67662 2.7014 T 4 2 1 +
M(ox)T(ph)VFQT(ph)TMCSILTR 2 1.0903 0.794 T 4 2 0.966739
MAPAFLLLLLLWPQGCVSGPS(ph)ADS(ph)VY(ph)T(ph)K 27 0.18958 1.0006 T 3 3 0.999335 +
MAPAFLLLLLLWPQGCVSGPS(ph)ADS(ph)VY(ph)T(ph)K 26 0.18958 1.0006 Y 3 3 0.999285 +
MAPAFLLLLLLWPQGCVSGPS(ph)ADS(ph)VY(ph)T(ph)K 24 0.18958 1.0006 S 3 3 0.997649 +
MAPAFLLLLLLWPQGCVSGPS(ph)ADS(ph)VY(ph)T(ph)K 21 0.18958 1.0006 S 3 3 0.839079 +
MS(ph)NQT(ph)DLLALGT(ph)AVGSILLYSTVK 12 0.91468 0.80016 T 4 4 0.966186
MS(ph)NQTDLLALGT(ph)AVGS(ph)ILLYSTVK 16 0.90513 0.84099 S 4 3 0.780623
NNS(ph)M(ox)NS(ph)NM(ox)GTGTFGPVGNGVHTGPES(ph)R 3 1.2943 0.56317 S 1 4 0.947038
NNS(ph)M(ox)NS(ph)NM(ox)GTGTFGPVGNGVHTGPES(ph)R 6 1.2943 0.56317 S 1 4 0.897224
NNS(ph)M(ox)NS(ph)NM(ox)GTGTFGPVGNGVHTGPES(ph)R 26 1.2943 0.56317 S 1 4 0.894947
NS(ph)QNPALEWNMASSIR 2 1.0189 0.75327 S 1 3 0.999726
PLAPPPQPPASPTHS(ph)PS(ph)FPIPDR 17 0.71038 2.2022 S 2 3 0.999956 +
PLAPPPQPPASPTHS(ph)PS(ph)FPIPDR 15 0.71038 2.2022 S 2 3 0.998423 +
PPALLT(ph)LYPAPDEDEAVERCS(ph)R 21 0 0 S 2 3 1
PPALLT(ph)LYPAPDEDEAVERCS(ph)R 6 0 0 T 2 3 0.84134
PPS(ph)VT(ph)PIFLEPPPK 3 0 0 S 2 2 1
PPS(ph)VT(ph)PIFLEPPPK 5 0 0 T 2 2 1
PRLELMDIIAENVLS(ph)EDR 15 11.696 2.7661 S 1 3 1
PS(ph)T(ph)GLLM(ox)YTLATR 2 0.85225 0.71016 S 5 3 0.996922
PS(ph)T(ph)GLLM(ox)YTLATR 3 0.85225 0.71016 T 1 3 0.996923
PT(ph)S(ph)S(ph)Y(ph)S(ph)MEQDK 2 0 0 T 2 2 1
PT(ph)S(ph)S(ph)Y(ph)S(ph)MEQDK 5 0 0 Y 2 2 1
PT(ph)S(ph)S(ph)Y(ph)S(ph)MEQDK 3 0 0 S 1 2 1
PT(ph)S(ph)S(ph)Y(ph)S(ph)MEQDK 4 0 0 S 1 2 1

193
Peptide sequence Position
Ratio
SU5402/
FGF1
Ratio
dasatinib/
FGF1
Amino acid
No of
phosphosi
tes
ChargeLocalizati
on prob
Sensitive to
treatments
PT(ph)S(ph)S(ph)Y(ph)S(ph)MEQDK 6 0 0 S 1 2 1
PVVCATQM(ox)LESMIT(ph)KPR 14 0.68123 0.82517 T 3 3 0.973748
QFIT(ph)ILEAT(ph)HR 4 9.2751 1.7877 T 1 3 1 +
QFIT(ph)ILEAT(ph)HR 9 9.2751 1.7877 T 1 3 1 +
QGQY(ph)S(ph)PM(ox)AIEEQVAVIY(ph)AGVR 17 0.3762 0.6444 Y 2 3 1 +
QGQY(ph)S(ph)PM(ox)AIEEQVAVIY(ph)AGVR 5 0.3762 0.6444 S 1 3 1 +
QGQY(ph)S(ph)PM(ox)AIEEQVAVIY(ph)AGVR 4 0.3762 0.6444 Y 1 3 1 +
QIHDIVQS(ph)CQPGEVVIR 8 1.4595 0.70571 S 1 3 1
QIVSAVAY(ph)VHS(ph)QGYAHR 11 8.4832 5.4356 S 1 3 0.997785 +
QIVSAVAY(ph)VHS(ph)QGYAHR 8 11.233 6.9786 Y 1 3 0.979815 +
QLEPT(ph)VQSLEMKSKT(ph)AR 15 0.11109 0.11454 T 2 3 0.907779 +
QLEPT(ph)VQSLEMKSKT(ph)AR 5 0.11109 0.11454 T 2 3 0.907754 +
QT(ph)LAQELSLNES(ph)QIK 12 0 0 S 1 3 0.999865
QT(ph)LAQELSLNES(ph)QIK 2 0 0 T 1 3 0.999741
QYEQMHKELT(ph)DKLEHLEQEK 10 0.72529 0.74974 T 1 3 0.999971
RAT(ph)KELLST(ph)ITDPSVIVM(ox)ADWLK 9 0.61388 0.60149 T 1 3 0.870452
RLIAEGDAS(ph)PGEDR 9 0.74168 0.73998 S 3 3 1
S(ph)FTQNYDLLRHERLHMK 1 0.63816 0.19704 S 1 3 0.855715 +
S(ph)KTEADMEEY(ph)IWENSSSERNILET(ph)LLQMK 24 0.65116 0.52321 T 1 4 0.925526
S(ph)KTEADMEEY(ph)IWENSSSERNILET(ph)LLQMK 10 0.65116 0.52321 Y 1 4 0.924293
S(ph)LS(ph)TSHLPGLTT(ph)HS(ph)NKTFTQR 14 0.73791 0.54414 S 1 3 0.784995
S(ph)LS(ph)TSHLPGLTT(ph)HS(ph)NKTFTQR 12 0.73791 0.54414 T 1 3 0.784995
S(ph)LSQSFENLLDEPAYGLIQK 1 1.1582 0.89334 S 5 3 0.995734
S(ph)PEWQVVTQDGT(ph)GALHT(ph)T(ph)Y(ph)LQCK 17 0.82352 0.85004 T 1 3 0.998854
S(ph)PEWQVVTQDGT(ph)GALHT(ph)T(ph)Y(ph)LQCK 18 0.82352 0.85004 T 1 3 0.998854
S(ph)PEWQVVTQDGT(ph)GALHT(ph)T(ph)Y(ph)LQCK 19 0.82352 0.85004 Y 1 3 0.997419
S(ph)PEWQVVTQDGT(ph)GALHT(ph)T(ph)Y(ph)LQCK 12 0.82352 0.85004 T 1 3 0.98088
S(ph)PT(ph)S(ph)SVATPS(ph)STIST(ph)PT(ph)KR 15 0 0 T 2 3 0.833694

194
Peptide sequence Position
Ratio
SU5402/
FGF1
Ratio
dasatinib/
FGF1
Amino acid
No of
phosphosi
tes
ChargeLocalizati
on prob
Sensitive to
treatments
S(ph)PT(ph)S(ph)SVATPS(ph)STIST(ph)PT(ph)KR 17 0 0 T 1 3 0.96545
S(ph)PT(ph)S(ph)SVATPS(ph)STIST(ph)PT(ph)KR 1 0 0 S 1 3 0.858673
S(ph)SHETLNIVEEK 1 1.3562 1.0807 S 1 3 0.848773
SHLS(ph)T(ph)AGGLAVPSLPT(ph)AGPYY(ph)S(ph)PYALYGQR 5 2.509 1.2208 T 1 3 0.851058 +
SHLS(ph)T(ph)AGGLAVPSLPT(ph)AGPYY(ph)S(ph)PYALYGQR 4 2.509 1.2208 S 1 3 0.766145 +
SHLS(ph)T(ph)AGGLAVPSLPT(ph)AGPYY(ph)S(ph)PYALYGQR 16 2.509 1.2208 T 1 3 0.752798 +
STAPLLDVFS(ph)S(ph)MLKDTTS(ph)QHR 11 0.70068 0.61142 S 2 3 0.946406 +
STAPLLDVFS(ph)S(ph)MLKDTTS(ph)QHR 10 0.70068 0.61142 S 2 3 0.941476 +
T(ph)EEEIEM(ox)M(ox)KLMGFASFDSTK 1 0.7057 0.97952 T 4 3 0.997829 +
T(ph)EFLM(ox)QLDT(ph)VLT(ph)SAEDQIVVICATSK 1 0 0 T 4 3 0.990126 +
T(ph)EFLM(ox)QLDT(ph)VLT(ph)SAEDQIVVICATSK 9 0 0 T 1 3 0.884717 +
T(ph)FLHPEGDHFTLISIYK 1 1.1585 0.88084 T 3 3 0.999385 +
T(ph)GT(ph)PAVT(ph)STS(ph)SASSSLGEK 1 0.64191 0.71316 T 3 3 0.998091 +
T(ph)GT(ph)PAVT(ph)STS(ph)SASSSLGEK 3 0.64191 0.71316 T 3 3 0.923683 +
T(ph)GT(ph)PAVT(ph)STS(ph)SASSSLGEK 7 0.64191 0.71316 T 2 3 0.784398 +
T(ph)KSPTDDEVTPSAVVR 1 0.52839 0.61456 T 2 2 0.98241 +
T(ph)LAHGALAQLGS(ph)LQPLS(ph)VGCVEIR 12 0 0 S 1 3 1 +
T(ph)LAHGALAQLGS(ph)LQPLS(ph)VGCVEIR 17 0 0 S 1 3 1 +
T(ph)TEELNEALSAK 1 0.90643 0.75699 T 5 3 0.857802 +
T(ph)Y(ph)T(ph)VNHETS(ph)HPPPS(ph)K 3 0 0 T 1 2 0.997149 +
T(ph)Y(ph)T(ph)VNHETS(ph)HPPPS(ph)K 14 0 0 S 1 2 0.988568 +
T(ph)Y(ph)T(ph)VNHETS(ph)HPPPS(ph)K 1 0 0 T 1 2 0.987583 +
T(ph)Y(ph)T(ph)VNHETS(ph)HPPPS(ph)K 2 0 0 Y 1 2 0.986485
TFLTPS(ph)IFIIM(ox)VWY(ph)WR 6 0.4843 0.93855 S 1 3 0.775677
THNYSM(ox)AIT(ph)Y(ph)Y(ph)EAALK 10 0.67136 2.9971 Y 3 3 0.978973 +
THNYSM(ox)AIT(ph)Y(ph)Y(ph)EAALK 11 0.67136 2.9971 Y 1 3 0.978973 +
THNYSM(ox)AIT(ph)Y(ph)Y(ph)EAALK 9 0.67136 2.9971 T 1 3 0.975938 +
TLLTPHT(ph)GVT(ph)S(ph)QVLGVAAAVM(ox)TPLPGGHAAGR 7 0.14675 0.30174 T 2 5 0.788483 +

195
Peptide sequence Position
Ratio
SU5402/
FGF1
Ratio
dasatinib/
FGF1
Amino acid
No of
phosphosi
tes
ChargeLocalizati
on prob
Sensitive to
treatments
TLLTPHT(ph)GVT(ph)S(ph)QVLGVAAAVM(ox)TPLPGGHAAGR 10 0.14675 0.30174 T 1 5 0.788483 +
TLLTPHT(ph)GVT(ph)S(ph)QVLGVAAAVM(ox)TPLPGGHAAGR 11 0.14675 0.30174 S 1 5 0.788208 +
TSIIDAVELAKDHS(ph)DLSR 14 0.6999 0.83091 S 2 3 0.918179
TT(ph)LNQGS(ph)CLHNPPRLGEIFM(ox)LK 7 0.674 0.72307 S 1 3 0.808808
TVLFGVQPKFT(ph)NVDIR 11 0.85867 0.89044 T 2 3 0.998902
TVTGT(ph)T(ph)M(ox)T(ph)LIPSEMPTPPK 8 0.25593 0.24376 T 2 3 0.865637 +
VS(ph)PVIINT(ph)MITITSALY(ph)T(ph)T(ph)K 19 0.51028 1.0429 T 4 3 0.990055
VS(ph)PVIINT(ph)MITITSALY(ph)T(ph)T(ph)K 17 0.51028 1.0429 Y 4 3 0.986243
VS(ph)PVIINT(ph)MITITSALY(ph)T(ph)T(ph)K 18 0.51028 1.0429 T 2 3 0.990058
VT(ph)VNYYDEEGS(ph)IPIDQAGLFLT(ph)AIEIS(ph)LDVDADR 2 0.51581 10.971 T 3 4 0.841158 +
VT(ph)VNYYDEEGS(ph)IPIDQAGLFLT(ph)AIEIS(ph)LDVDADR 27 0.52948 7.0426 S 2 4 0.999879 +
VT(ph)VNYYDEEGS(ph)IPIDQAGLFLT(ph)AIEIS(ph)LDVDADR 11 0.51581 10.971 S 2 4 0.966652 +
VT(ph)VNYYDEEGS(ph)IPIDQAGLFLT(ph)AIEIS(ph)LDVDADR 22 0.52948 7.0426 T 1 4 0.999921 +
VTIS(ph)VHEKGFIEIK 4 0.76744 0.54445 S 3 3 0.999196
VVLAAASHFFNLM(ox)FT(ph)T(ph)NM(ox)LES(ph)K 16 0.48894 0.36648 T 2 3 0.995543 +
VVLAAASHFFNLM(ox)FT(ph)T(ph)NM(ox)LES(ph)K 21 0.48894 0.36648 S 2 3 0.990395 +
VVLAAASHFFNLM(ox)FT(ph)T(ph)NM(ox)LES(ph)K 15 0.48894 0.36648 T 1 3 0.995543 +
WLIGGPNPNS(ph)LS(ph)GIRTSK 10 0.65487 1.3571 S 5 3 0.996741
WLIGGPNPNS(ph)LS(ph)GIRTSK 12 0.65487 1.3571 S 5 3 0.971689
WPDLLT(ph)EM(ox)VNRFQSGDFHVINGVLR 6 0.83567 0.74258 T 5 3 0.999331
WY(ph)LAT(ph)GDDIY(ph)DVPHIR 5 0 0 T 4 3 1
WY(ph)LAT(ph)GDDIY(ph)DVPHIR 2 0 0 Y 4 3 1
WY(ph)LAT(ph)GDDIY(ph)DVPHIR 10 0 0 Y 1 3 1
Y(ph)ILQGVT(ph)SWGLGCARPNKPGVY(ph)AR 1 0.56516 0.73067 Y 2 4 0.899308
Y(ph)IWGGFAY(ph)LQDM(ox)VEQGIT(ph)R 18 0.70745 2.8826 T 2 3 1 +
Y(ph)IWGGFAY(ph)LQDM(ox)VEQGIT(ph)R 1 0.70745 2.8826 Y 2 3 1 +Y(ph)IWGGFAY(ph)LQDM(ox)VEQGIT(ph)R 8 0.70745 2.8826 Y 2 3 1 +
Y(ph)VM(ox)T(ph)FLNVLNFGDQGVYDIVNNLGSLVAR 1 0 0 Y 1 3 0.998426Y(ph)VM(ox)T(ph)FLNVLNFGDQGVYDIVNNLGSLVAR 4 0 0 T 1 3 0.995058
YILQGVT(ph)S(ph)WGLGCARPNKPGVY(ph)AR 7 0.97795 0.48898 T 1 4 0.836514

196
Appendix 2 DAVID analysis of the regulated phosphopeptides in
LC-FAIMS-MS/MS
Category Term
KEGG_PATHWAY Insulin signalling pathway
KEGG_PATHWAY Endocytosis
KEGG_PATHWAY Regulation of actin cytoskeleton
KEGG_PATHWAY Fc gamma R-mediated phagocytosis
KEGG_PATHWAY Tight junction
KEGG_PATHWAY G protein coupled receptors
KEGG_PATHWAY ErbB signalling pathway
KEGG_PATHWAY Base excision repair
KEGG_PATHWAY mTOR signalling pathway
KEGG_PATHWAY Thyroid cancer

197
Appendix 3 Peptide details of the SRM assay
Set 1
Peptide sequencePrecursor ion
(m/z)
Transition ion
(m/z)Ion type
Collision
energy (eV)
RT
window(min)
RLS(ph)STSLASGHSVR 513.254 437.19 b3 26 12.8 - 14.2
RLS(ph)STSLASGHSVR 513.254 480.595 precursor-98 26 12.8 - 14.2
RLS(ph)STSLASGHSVR 513.254 1268.563 y12 23 12.8 - 14.2
RLNSS(ph)PRAPVSPLK 534.622 501.963 precursor-98 27 13.6 - 14.7
RLNSS(ph)PRAPVSPLK 534.622 964.593 y9 27 13.6 - 14.7
RLNSS(ph)PRAPVSPLK 534.622 1131.592 y10 26 13.6 - 14.7
GAQASSGS(ph)PALPR 639.795 553.345 y5 25 13.8 - 15.1
GAQASSGS(ph)PALPR 639.795 590.807 precursor-98 25 13.8 - 15.1
GAQASSGS(ph)PALPR 639.795 777.365 y7 25 13.8 - 15.1
DINNIDY(ph)Y(ph)KK 723.291 761.266 y4 28 14.2 - 15.5
DINNIDY(ph)Y(ph)KK 723.291 876.293 y5 28 14.2 - 15.5
DINNIDY(ph)Y(ph)KK 723.291 989.378 y6 28 14.2 - 15.5
NFSAAKS(ph)LLNKK 467.583 434.923 precursor-98 24 14.5 - 16.3
NFSAAKS(ph)LLNKK 467.583 782.417 y6 24 14.5 - 16.3
NFSAAKS(ph)LLNKK 467.583 910.512 y7 24 14.5 - 16.3
STS(ph)WHTALR 569.756 520.767 precursor-98 23 14.7 - 15.7
STS(ph)WHTALR 569.756 783.426 y6 23 14.7 - 15.7
STS(ph)WHTALR 569.756 950.424 y7 23 14.7 - 15.7
RPHFPQFSY(ph)SASGRE 615.942 849.313 y7 30 14.7 - 16.2
RPHFPQFSY(ph)SASGRE 615.942 936.345 y8 30 14.7 - 16.2
RPHFPQFSY(ph)SASGRE 615.942 1240.529 b9 28 14.7 - 16.2
VTS(ph)GGVSESPSGFSK 753.33 704.341 precursor-98 29 14.7 - 16.2
VTS(ph)GGVSESPSGFSK 753.33 925.426 y9 29 14.7 - 16.2
VTS(ph)GGVSESPSGFSK 753.33 1305.535 y13 26 14.7 - 16.2
TPKDS(ph)PGIPPSANAHQLFR 705.012 442.229 b4 34 14.9 - 17.2
TPKDS(ph)PGIPPSANAHQLFR 705.012 609.227 b5 34 14.9 - 17.2
TPKDS(ph)PGIPPSANAHQLFR 705.012 672.354 precursor-98 34 14.9 - 17.2
RES(ph)VVNLENFRK 524.263 491.604 precursor-98 26 15 - 16.2
RES(ph)VVNLENFRK 524.263 552.217 b4 26 15 - 16.2
RES(ph)VVNLENFRK 524.263 920.494 y7 26 15 - 16.2
TPKDS(ph)PGIPPSAGAHQLFR 686.007 442.229 b4 33 15 - 17.2
TPKDS(ph)PGIPPSAGAHQLFR 686.007 609.227 b5 33 15 - 17.2
TPKDS(ph)PGIPPSAGAHQLFR 686.007 653.346 precursor-98 33 15 - 17.2
RNS(ph)FTPLSSSNTIR 553.933 521.274 precursor-98 28 15.1 - 16.5
RNS(ph)FTPLSSSNTIR 553.933 585.217 b4 28 15.1 - 16.5
RNS(ph)FTPLSSSNTIR 553.933 1222.642 y11 25 15.1 - 16.5
NYSVGSRPLKPLS(ph)PLR 622.001 589.341 precursor-98 31 15.5 - 16.7
NYSVGSRPLKPLS(ph)PLR 622.001 665.338 y5 31 15.5 - 16.7
NYSVGSRPLKPLS(ph)PLR 622.001 762.39 y6 31 15.5 - 16.7
EHIEIIAPS(ph)PQR 735.361 664.281 y5 28 15.6 - 16.8
EHIEIIAPS(ph)PQR 735.361 686.373 precursor-98 28 15.6 - 16.8
EHIEIIAPS(ph)PQR 735.361 961.486 y8 28 15.6 - 16.8
RYS(ph)DHAGPAIPSVVAYPK 669.994 487.17 b3 33 15.7 - 17
RYS(ph)DHAGPAIPSVVAYPK 669.994 602.197 b4 33 15.7 - 17

198
Set 1 continued
Peptide sequencePrecursor ion
(m/z)
Transition ion
(m/z)Ion type
Collision
energy (eV)
RT
window(min)
RYS(ph)DHAGPAIPSVVAYPK 669.994 637.336 precursor-98 33 15.7 - 17
NFS(ph)AAKS(ph)LLNKK 494.237 461.578 precursor-98 25 16 - 17.3
NFS(ph)AAKS(ph)LLNKK 494.237 782.417 y6 25 16 - 17.3
NFS(ph)AAKS(ph)LLNKK 494.237 1219.584 y10 23 16 - 17.3
HFM(ox)HQIITGMLYLHS(ph)HGILHR 879.765 732.426 y6 35 16.1 - 17.7
HFM(ox)HQIITGMLYLHS(ph)HGILHR 879.765 847.104 precursor-98 35 16.1 - 17.7
HFM(ox)HQIITGMLYLHS(ph)HGILHR 879.765 1036.483 y8 35 16.1 - 17.7
TTS(ph)FAESCKPVQQPSAFGSMK 771.009 203.102 b2 35 16.3 - 17.6
TTS(ph)FAESCKPVQQPSAFGSMK 771.009 370.1 b3 35 16.3 - 17.6
TTS(ph)FAESCKPVQQPSAFGSMK 771.009 738.35 precursor-98 35 16.3 - 17.6
RSDS(ph)ASSEPVGIYQGFEK 679.639 526.165 b4 33 16.4 - 18
RSDS(ph)ASSEPVGIYQGFEK 679.639 597.202 b5 33 16.4 - 18
RSDS(ph)ASSEPVGIYQGFEK 679.639 646.978 precursor-98 33 16.4 - 18
T(ph)TSFAESCKPVQQPSAFGSM(ox)K 776.341 182.021 b1 35 16.5 - 18
T(ph)TSFAESCKPVQQPSAFGSM(ox)K 776.341 743.682 precursor-98 35 16.5 - 18
T(ph)TSFAESCKPVQQPSAFGSM(ox)K 776.341 840.391 y8 35 16.5 - 18
VADPDHDHT(ph)GFLTEY(ph)VATR 768.65 689.301 y5 35 16.9 - 18.1
VADPDHDHT(ph)GFLTEY(ph)VATR 768.65 735.991 precursor-98 35 16.9 - 18.1
VADPDHDHT(ph)GFLTEY(ph)VATR 768.65 1068.378 b9 35 16.9 - 18.1
THFPQFS(ph)YSASIRE 583.926 551.267 y7 29 17.3 - 18.4
THFPQFS(ph)YSASIRE 583.926 825.409 y9 29 17.3 - 18.4
THFPQFS(ph)YSASIRE 583.926 1139.476 precursor-98 28 17.3 - 18.4
ALGERVS(ph)IL 519.273 470.285 precursor-98 21 18.2 - 19.4
ALGERVS(ph)IL 519.273 667.353 y5 21 18.2 - 19.4
ALGERVS(ph)IL 519.273 796.396 y6 21 18.2 - 19.4
S(ph)HNDFVAILDLPEGEHQYK 764.683 419.107 b3 35 18.6 - 19.9
S(ph)HNDFVAILDLPEGEHQYK 764.683 732.024 precursor-98 35 18.6 - 19.9
S(ph)HNDFVAILDLPEGEHQYK 764.683 1328.648 y11 34 18.6 - 19.9
DALDLSDINSEPPRGS(ph)FPSFEPR 876.066 843.407 precursor-98 35 19.7 - 22
DALDLSDINSEPPRGS(ph)FPSFEPR 876.066 879.435 y7 35 19.7 - 22
DALDLSDINSEPPRGS(ph)FPSFEPR 876.066 1356.609 y11 35 19.7 - 22

199
Set 2
Peptide sequencePrecursor ion
(m/z)
Transition ion
(m/z)Ion type
Collision
energy (eV)
RT
window(min)
RLSS(ph)TSLASGHSVR 513.256 357.224 y7 26 12.7 - 14
RLSS(ph)TSLASGHSVR 513.256 480.595 precursor-98 26 12.7 - 14
RLSS(ph)TSLASGHSVR 513.256 1181.531 y11 24 12.7 - 14
RLNSSPRAPVS(ph)PLK 534.624 501.963 precursor-98 27 13.9 - 14.7
RLNSSPRAPVS(ph)PLK 534.624 623.316 y5 27 13.9 - 14.7
RLNSSPRAPVS(ph)PLK 534.624 720.369 y6 27 13.9 - 14.7
LSEEAECPNPST(ph)PSK 834.845 512.211 y4 32 14.1 - 15.5
LSEEAECPNPST(ph)PSK 834.845 696.296 y6 32 14.1 - 15.5
LSEEAECPNPST(ph)PSK 834.845 785.856 precursor-98 32 14.1 - 15.5
RRSIQDLT(ph)VTGTEPGQVSSR 756.376 723.717 precursor-98 35 14.1 - 15.7
RRSIQDLT(ph)VTGTEPGQVSSR 756.376 1050.509 b8 35 14.1 - 15.7
RRSIQDLT(ph)VTGTEPGQVSSR 756.376 1149.577 b9 35 14.1 - 15.7
RLNSS(ph)PRAPVS(ph)PLK 561.278 524.247 28 14.4 - 15.6
RLNSS(ph)PRAPVS(ph)PLK 561.278 528.619 28 14.4 - 15.6
RLNSS(ph)PRAPVS(ph)PLK 561.278 1211.558 26 14.4 - 15.6
DINNIDY(ph)YKK 683.308 438.271 y3 27 14.4 - 15.8
DINNIDY(ph)YKK 683.308 909.411 y6 27 14.4 - 15.8
DINNIDY(ph)YKK 683.308 928.344 b7 27 14.4 - 15.8
T(ph)TSQCKSEPPLLR 513.913 182.021 b1 26 14.7 - 16.1
T(ph)TSQCKSEPPLLR 513.913 481.254 precursor-98 26 14.7 - 16.1
T(ph)TSQCKSEPPLLR 513.913 1358.709 y12 22 14.7 - 16.1
RPPGMEY(ph)SYDINR 559.908 533.252 y6 28 15 - 16.2
RPPGMEY(ph)SYDINR 559.908 767.368 y8 28 15 - 16.2
RPPGMEY(ph)SYDINR 559.908 1139.44 y10 27 15 - 16.2
TPKDSPGIPPS(ph)AGAHQLFR 686.009 653.346 precursor-98 33 15.1 - 16.9
TPKDSPGIPPS(ph)AGAHQLFR 686.009 1163.535 y10 32 15.1 - 16.9
TPKDSPGIPPS(ph)AGAHQLFR 686.009 1260.588 y11 31 15.1 - 16.9
LGS(ph)YSGPTSVSR 645.79 501.174 b4 25 15.2 - 16.3
LGS(ph)YSGPTSVSR 645.79 588.206 b5 25 15.2 - 16.3
LGS(ph)YSGPTSVSR 645.79 596.802 precursor-98 25 15.2 - 16.3
KLPS(ph)TTL 420.217 371.229 precursor-98 18 15.3 - 17.3
KLPS(ph)TTL 420.217 501.195 y3 18 15.3 - 17.3
KLPS(ph)TTL 420.217 598.248 y5 18 15.3 - 17.3
RNSFT(ph)PLSSSNTIR 553.935 521.274 precursor-98 28 15.4 - 16.8
RNSFT(ph)PLSSSNTIR 553.935 686.265 b5 28 15.4 - 16.8
RNSFT(ph)PLSSSNTIR 553.935 1155.54 y10 26 15.4 - 16.8
RIS(ph)LSDMPR 577.773 518.239 y4 23 15.8 - 16.9
RIS(ph)LSDMPR 577.773 605.271 y5 23 15.8 - 16.9
RIS(ph)LSDMPR 577.773 718.355 y6 23 15.8 - 16.9
NLQS(ph)PTQFQTPR 748.848 699.86 precursor-98 29 15.9 - 17.2
NLQS(ph)PTQFQTPR 748.848 974.505 y8 29 15.9 - 17.2
NLQS(ph)PTQFQTPR 748.848 1141.503 y9 27 15.9 - 17.2
RPHFPQFS(ph)Y(ph)SASGRE 642.596 609.937 precursor-98 32 16 - 17.5
RPHFPQFS(ph)Y(ph)SASGRE 642.596 849.313 y7 32 16 - 17.5
RPHFPQFS(ph)Y(ph)SASGRE 642.596 1016.312 y8 31 16 - 17.5
VADPDHDHTGFLT(ph)EYVATR 741.995 709.336 precursor-98 35 16.1 - 18.5

200
Set 2 continued
Peptide sequencePrecursor ion
(m/z)
Transition ion
(m/z)Ion type
Collision
energy (eV)
RT
window(min)
VADPDHDHTGFLT(ph)EYVATR 741.995 738.378 y6 35 16.1 - 18.5
VADPDHDHTGFLT(ph)EYVATR 741.995 919.391 y7 35 16.1 - 18.5
IADPEHDHTGFLT(ph)EYVATR 751.339 718.68 precursor-98 35 16.4 - 18.8
IADPEHDHTGFLT(ph)EYVATR 751.339 738.378 y6 35 16.4 - 18.8
IADPEHDHTGFLT(ph)EYVATR 751.339 1032.476 y8 35 16.4 - 18.8
NYS(ph)VGSRPLKPLS(ph)PLR 648.655 544.18 y4 32 16.7 - 17.7
NYS(ph)VGSRPLKPLS(ph)PLR 648.655 615.996 precursor-98 32 16.7 - 17.7
NYS(ph)VGSRPLKPLS(ph)PLR 648.655 665.338 b5 32 16.7 - 17.7
RPHFPQFS(ph)YSASGTA 866.878 656.288 y7 33 16.7 - 17.8
RPHFPQFS(ph)YSASGTA 866.878 817.889 precursor-98 33 16.7 - 17.8
RPHFPQFS(ph)YSASGTA 866.878 1098.413 y10 32 16.7 - 17.8
IADPEHDHT(ph)GFLTEY(ph)VATR 777.994 751.339 precursor-98 35 16.9 - 18.4
IADPEHDHT(ph)GFLTEY(ph)VATR 777.994 818.344 y6 35 16.9 - 18.4
IADPEHDHT(ph)GFLTEY(ph)VATR 777.994 1153.43 b10 35 16.9 - 18.4
VADPDHDHTGFLT(ph)EY(ph)VATR 768.653 689.301 y5 35 17 - 18.2
VADPDHDHTGFLT(ph)EY(ph)VATR 768.653 741.995 y6 35 17 - 18.2
VADPDHDHTGFLT(ph)EY(ph)VATR 768.653 1316.532 y10 34 17 - 18.2
RVS(ph)LSEIGFGK 636.821 423.175 b3 25 17.4 - 18.3
RVS(ph)LSEIGFGK 636.821 587.833 precursor-98 25 17.4 - 18.3
RVS(ph)LSEIGFGK 636.821 1017.465 y9 25 17.4 - 18.3
S(ph)GGGDLTLGLEPSEEEAPR 997.441 282.048 b3 35 18.3 - 19.5
S(ph)GGGDLTLGLEPSEEEAPR 997.441 948.453 precursor-98 35 18.3 - 19.5
S(ph)GGGDLTLGLEPSEEEAPR 997.441 1156.547 y10 35 18.3 - 19.5
AVLS(ph)PGSVFSPGR 677.332 628.343 precursor-98 26 19.1 - 20.3
AVLS(ph)PGSVFSPGR 677.332 806.415 y8 26 19.1 - 20.3
AVLS(ph)PGSVFSPGR 677.332 903.468 y9 26 19.1 - 20.3
ATDSFS(ph)GRFEDVYQLQEDVLGEGAHAR 1026.459 522.219 precursor-98 35 20 - 21.6
ATDSFS(ph)GRFEDVYQLQEDVLGEGAHAR 1026.459 746.239 y6 35 20 - 21.6
ATDSFS(ph)GRFEDVYQLQEDVLGEGAHAR 1026.459 993.8 b10 35 20 - 21.6
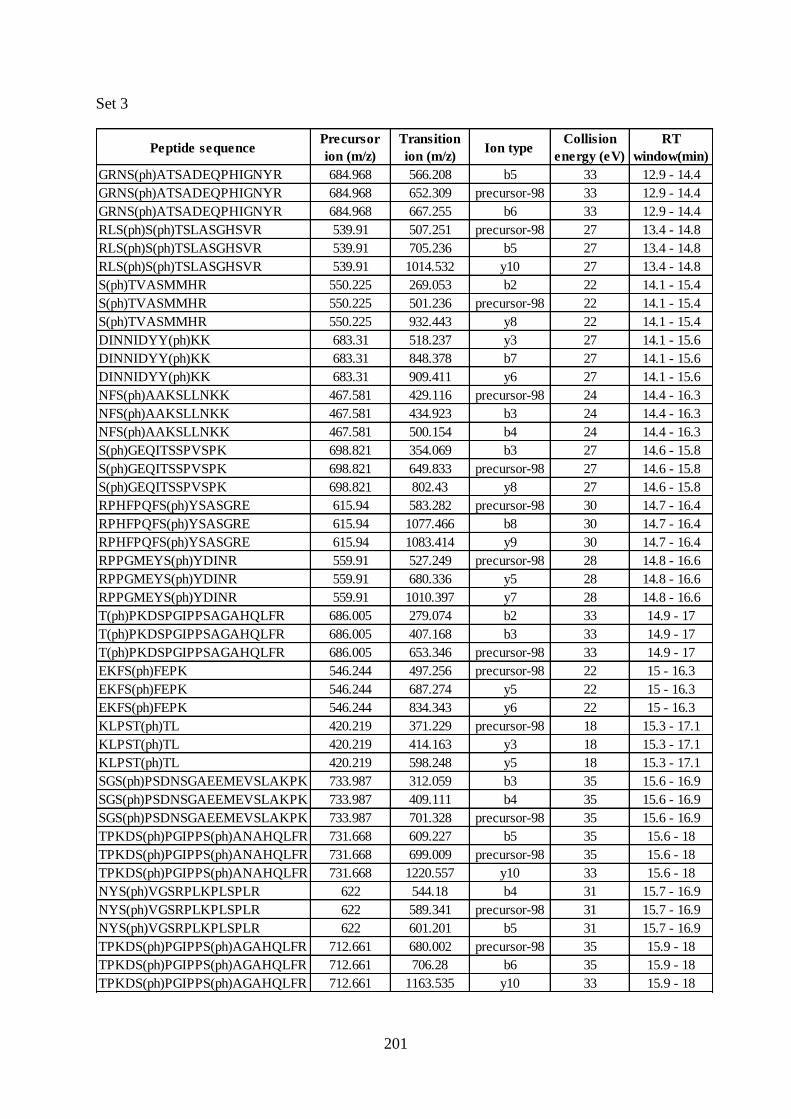
201
Set 3
Peptide sequencePrecursor
ion (m/z)
Transition
ion (m/z)Ion type
Collision
energy (eV)
RT
window(min)
GRNS(ph)ATSADEQPHIGNYR 684.968 566.208 b5 33 12.9 - 14.4
GRNS(ph)ATSADEQPHIGNYR 684.968 652.309 precursor-98 33 12.9 - 14.4
GRNS(ph)ATSADEQPHIGNYR 684.968 667.255 b6 33 12.9 - 14.4
RLS(ph)S(ph)TSLASGHSVR 539.91 507.251 precursor-98 27 13.4 - 14.8
RLS(ph)S(ph)TSLASGHSVR 539.91 705.236 b5 27 13.4 - 14.8
RLS(ph)S(ph)TSLASGHSVR 539.91 1014.532 y10 27 13.4 - 14.8
S(ph)TVASMMHR 550.225 269.053 b2 22 14.1 - 15.4
S(ph)TVASMMHR 550.225 501.236 precursor-98 22 14.1 - 15.4
S(ph)TVASMMHR 550.225 932.443 y8 22 14.1 - 15.4
DINNIDYY(ph)KK 683.31 518.237 y3 27 14.1 - 15.6
DINNIDYY(ph)KK 683.31 848.378 b7 27 14.1 - 15.6
DINNIDYY(ph)KK 683.31 909.411 y6 27 14.1 - 15.6
NFS(ph)AAKSLLNKK 467.581 429.116 precursor-98 24 14.4 - 16.3
NFS(ph)AAKSLLNKK 467.581 434.923 b3 24 14.4 - 16.3
NFS(ph)AAKSLLNKK 467.581 500.154 b4 24 14.4 - 16.3
S(ph)GEQITSSPVSPK 698.821 354.069 b3 27 14.6 - 15.8
S(ph)GEQITSSPVSPK 698.821 649.833 precursor-98 27 14.6 - 15.8
S(ph)GEQITSSPVSPK 698.821 802.43 y8 27 14.6 - 15.8
RPHFPQFS(ph)YSASGRE 615.94 583.282 precursor-98 30 14.7 - 16.4
RPHFPQFS(ph)YSASGRE 615.94 1077.466 b8 30 14.7 - 16.4
RPHFPQFS(ph)YSASGRE 615.94 1083.414 y9 30 14.7 - 16.4
RPPGMEYS(ph)YDINR 559.91 527.249 precursor-98 28 14.8 - 16.6
RPPGMEYS(ph)YDINR 559.91 680.336 y5 28 14.8 - 16.6
RPPGMEYS(ph)YDINR 559.91 1010.397 y7 28 14.8 - 16.6
T(ph)PKDSPGIPPSAGAHQLFR 686.005 279.074 b2 33 14.9 - 17
T(ph)PKDSPGIPPSAGAHQLFR 686.005 407.168 b3 33 14.9 - 17
T(ph)PKDSPGIPPSAGAHQLFR 686.005 653.346 precursor-98 33 14.9 - 17
EKFS(ph)FEPK 546.244 497.256 precursor-98 22 15 - 16.3
EKFS(ph)FEPK 546.244 687.274 y5 22 15 - 16.3
EKFS(ph)FEPK 546.244 834.343 y6 22 15 - 16.3
KLPST(ph)TL 420.219 371.229 precursor-98 18 15.3 - 17.1
KLPST(ph)TL 420.219 414.163 y3 18 15.3 - 17.1
KLPST(ph)TL 420.219 598.248 y5 18 15.3 - 17.1
SGS(ph)PSDNSGAEEMEVSLAKPK 733.987 312.059 b3 35 15.6 - 16.9
SGS(ph)PSDNSGAEEMEVSLAKPK 733.987 409.111 b4 35 15.6 - 16.9
SGS(ph)PSDNSGAEEMEVSLAKPK 733.987 701.328 precursor-98 35 15.6 - 16.9
TPKDS(ph)PGIPPS(ph)ANAHQLFR 731.668 609.227 b5 35 15.6 - 18
TPKDS(ph)PGIPPS(ph)ANAHQLFR 731.668 699.009 precursor-98 35 15.6 - 18
TPKDS(ph)PGIPPS(ph)ANAHQLFR 731.668 1220.557 y10 33 15.6 - 18
NYS(ph)VGSRPLKPLSPLR 622 544.18 b4 31 15.7 - 16.9
NYS(ph)VGSRPLKPLSPLR 622 589.341 precursor-98 31 15.7 - 16.9
NYS(ph)VGSRPLKPLSPLR 622 601.201 b5 31 15.7 - 16.9
TPKDS(ph)PGIPPS(ph)AGAHQLFR 712.661 680.002 precursor-98 35 15.9 - 18
TPKDS(ph)PGIPPS(ph)AGAHQLFR 712.661 706.28 b6 35 15.9 - 18
TPKDS(ph)PGIPPS(ph)AGAHQLFR 712.661 1163.535 y10 33 15.9 - 18

202
Set 3 continued
Peptide sequencePrecursor
ion (m/z)
Transition
ion (m/z)Ion type
Collision
energy (eV)
RT
window(min)
VADPDHDHTGFLTEY(ph)VATR 741.997 446.272 y4 35 16 - 18.4
VADPDHDHTGFLTEY(ph)VATR 741.997 689.301 y5 35 16 - 18.4
VADPDHDHTGFLTEY(ph)VATR 741.997 715.34 y7 35 16 - 18.4
IADPEHDHTGFLTEY(ph)VATR 751.341 689.301 y5 35 16.3 - 17.3
IADPEHDHTGFLTEY(ph)VATR 751.341 724.683 y6 35 16.3 - 17.3
IADPEHDHTGFLTEY(ph)VATR 751.341 818.344 y7 35 16.3 - 17.3
RS(ph)DSASSEPVGIYQGFEK 679.637 324.106 b2 33 16.4 - 17.8
RS(ph)DSASSEPVGIYQGFEK 679.637 439.133 b3 33 16.4 - 17.8
RS(ph)DSASSEPVGIYQGFEK 679.637 646.978 precursor-98 33 16.4 - 17.8
IADPEHDHTGFLT(ph)EY(ph)VATR 777.996 751.339 y6 35 16.8 - 18.3
IADPEHDHTGFLT(ph)EY(ph)VATR 777.996 818.344 y7 35 16.8 - 18.3
IADPEHDHTGFLT(ph)EY(ph)VATR 777.996 1112.442 y8 35 16.8 - 18.3
GLCTSPAEHQYFMTEY(ph)VATR 795.341 689.301 y5 35 16.9 - 18.4
GLCTSPAEHQYFMTEY(ph)VATR 795.341 768.686 precursor-98 35 16.9 - 18.4
GLCTSPAEHQYFMTEY(ph)VATR 795.341 818.344 y6 35 16.9 - 18.4
GAILTTM(ox)LVS(ph)R 629.317 580.329 precursor-98 25 17.4 - 18.5
GAILTTM(ox)LVS(ph)R 629.317 701.305 y5 25 17.4 - 18.5
GAILTTM(ox)LVS(ph)R 629.317 802.352 y6 25 17.4 - 18.5
GFS(ph)FVATGLM(ox)EDDGKPR 641.617 608.958 precursor-98 32 18.5 - 19.8
GFS(ph)FVATGLM(ox)EDDGKPR 641.617 618.232 b5 32 18.5 - 19.8
GFS(ph)FVATGLM(ox)EDDGKPR 641.617 1076.504 y9 31 18.5 - 19.8
LQPFHST(ph)ELEDDAIYSVHVPAGLYR 979.799 710.361 b6 35 19.4 - 20.6
LQPFHST(ph)ELEDDAIYSVHVPAGLYR 979.799 947.14 precursor-98 35 19.4 - 20.6
LQPFHST(ph)ELEDDAIYSVHVPAGLYR 979.799 1020.418 b8 35 19.4 - 20.6
S(ph)VVGTPAYLAPEVLR 826.426 366.142 b3 31 19.7 - 21
S(ph)VVGTPAYLAPEVLR 826.426 777.438 precursor-98 31 19.7 - 21
S(ph)VVGTPAYLAPEVLR 826.426 1128.641 y10 30 19.7 - 21
EYGS(ph)PLKAYT(ph)PVVVTQWYR 806.371 614.185 b5 35 20.3 - 22
EYGS(ph)PLKAYT(ph)PVVVTQWYR 806.371 773.712 precursor-98 35 20.3 - 22
EYGS(ph)PLKAYT(ph)PVVVTQWYR 806.371 1328.639 y10 35 20.3 - 22

203
Appendix 4 Quantitation results of SRM assay
Figure 1 Phosphorylation profile of ALGERVpSIL in response to FGF1
Figure 2 Phosphorylation profile of AVLpSPGSVFSPGR in response to FGF1

204
Figure 3 Phosphorylation profile of DALDLSDINSEPPRGpSFPSFEPR in response to FGF1
Figure 4 Phosphorylation profile of EHIEIIAPpSPQR in response to FGF1

205
Figure 5 Phosphorylation profile of EKFpSFEPK in response to FGF1
Figure 6 Phosphorylation profile of KLPpSTTL in response to FGF1

206
Figure 7 Phosphorylation profile of LGpSYSGPTSVSR in response to FGF1
Figure 8 Phosphorylation profile of LSEEAECPNPSpTPSK in response to FGF1
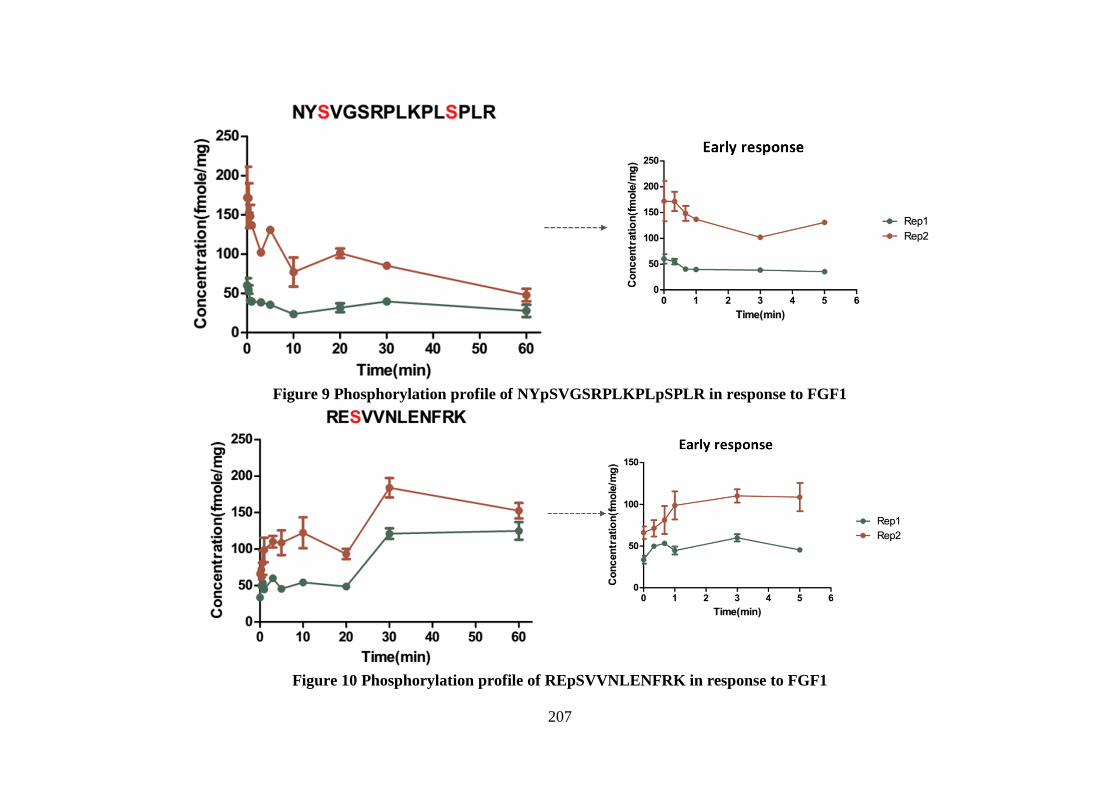
207
Figure 9 Phosphorylation profile of NYpSVGSRPLKPLpSPLR in response to FGF1
Figure 10 Phosphorylation profile of REpSVVNLENFRK in response to FGF1

208
Figure 11 Phosphorylation profile of RIpSLSDMPR in response to FGF1
Figure 12 Phosphorylation profile of RLNSpSPRAPVSPLK in response to FGF1
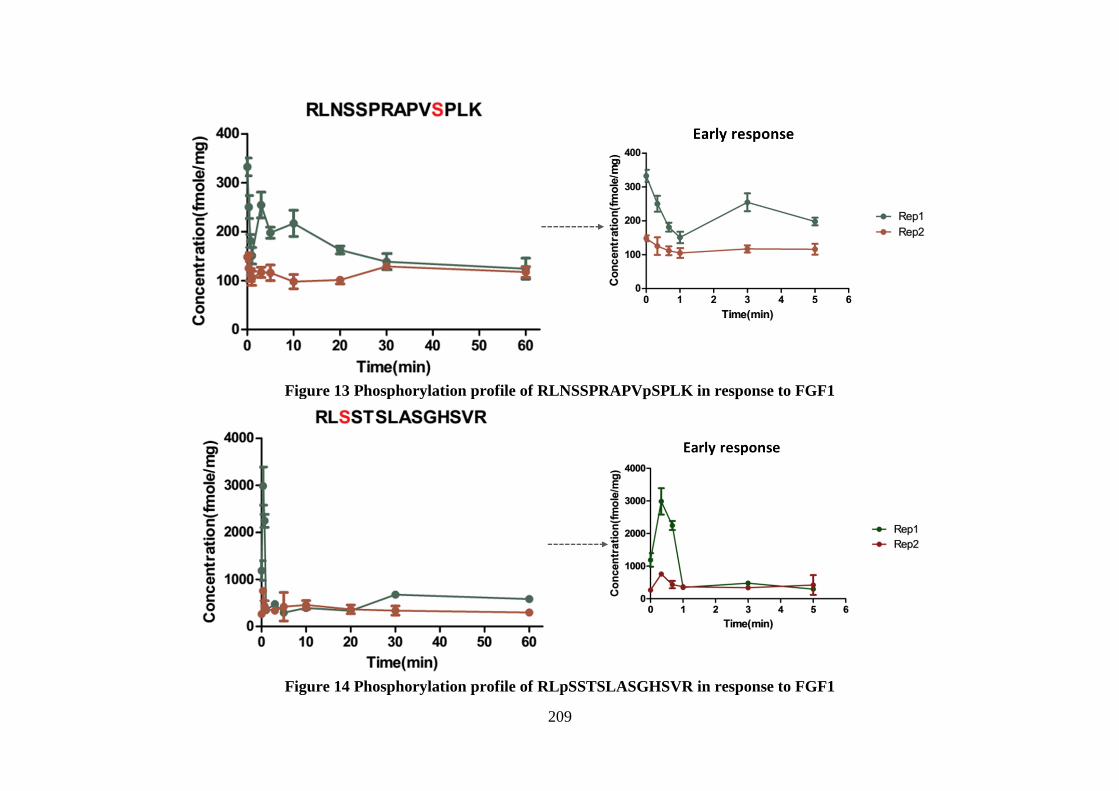
209
Figure 13 Phosphorylation profile of RLNSSPRAPVpSPLK in response to FGF1
Figure 14 Phosphorylation profile of RLpSSTSLASGHSVR in response to FGF1
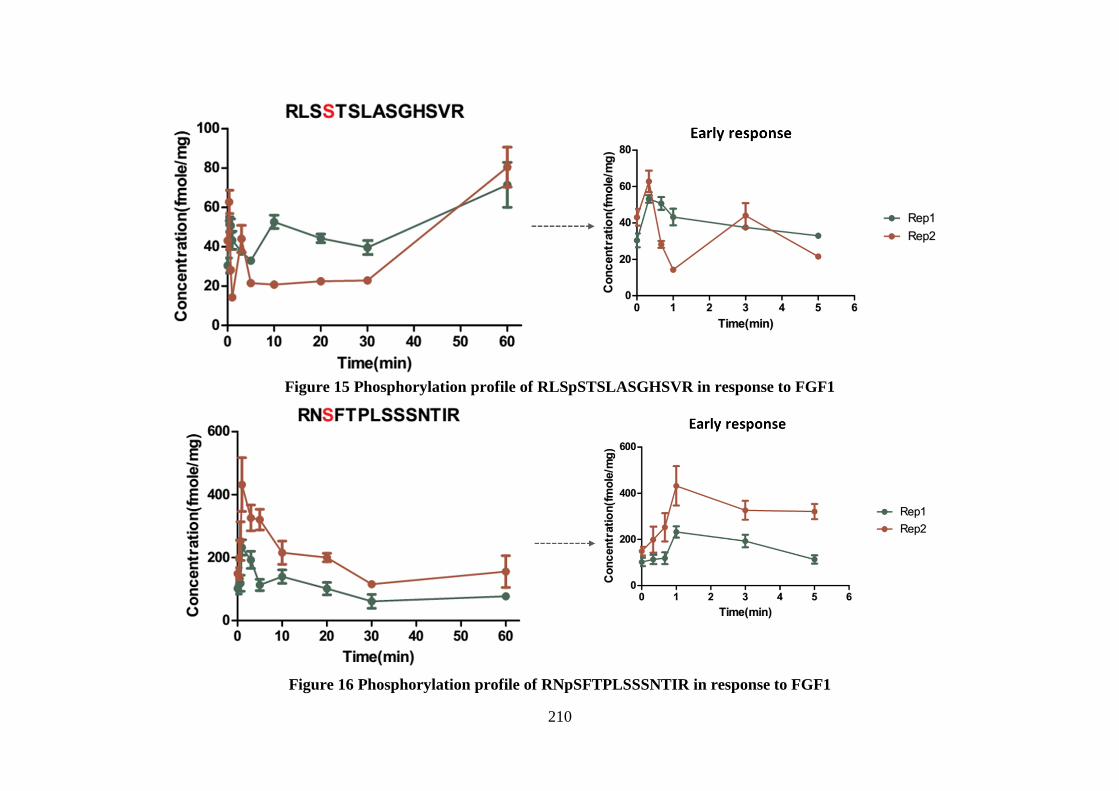
210
Figure 15 Phosphorylation profile of RLSpSTSLASGHSVR in response to FGF1
Figure 16 Phosphorylation profile of RNpSFTPLSSSNTIR in response to FGF1

211
Figure 17 Phosphorylation profile of RPHFPQFpSpYSASGRE in response to FGF1
Figure 18 Phosphorylation profile of RPHFPQFpSYSASGTA in response to FGF1

212
Figure 19 Phosphorylation profile of RPPGMEpYSYDINR in response to FGF1
Figure 20 Phosphorylation profile of RRSIQDLpTVTGTEPGQVSSR in response to FGF1

213
Figure 21 Phosphorylation profile of RpSDSASSEPVGIYQGFEK in response to FGF1
Figure 22 Phosphorylation profile of RYpSDHAGPAIPSVVAYPK in response to FGF1

214
Figure 23 Phosphorylation profile of pSGEQITSSPVSPK in response to FGF1
Figure 24 Phosphorylation profile of STpSWHTALR in response to FGF1

215
Figure 25 Phosphorylation profile of pSVVGTPAYLAPEVLR in response to FGF1
Figure 26 Phosphorylation profile of pTTSQCKSEPPLLR in response to FGF1

216
Appendix 5 Publications
Zhao H, Cunningham DL, Creese AJ, Heath JK, Cooper HJ. FAIMS and Phosphoproteomics
of Fibroblast Growth Factor Signaling: Enhanced Identification of Multiply Phosphorylated
Peptides. 2015, 14(12), 5077-87