development and analysis of inverted-v mppt …
TRANSCRIPT
179
Copyright © Authors ISSN (Print): 2204-0595
ISSN (Online): 2203-1731
IT in Industry, Vol. 9, No.1, 2021 Published Online 28-02-2021
DEVELOPMENT AND ANALYSIS OF INVERTED-V MPPT
TECHNIQUE FOR PHOTOVOLTAIC SYSTEM
Sheilza Jaina1*, Megha Chambyal2 1,2 Department of Electronics Engineering, J. C. Bose University of Science and Technology, YMCA, Faridabad, Haryana, India
1*[email protected],[email protected]
Abstract: Three main factors which affect the efficiency
of any Photovoltaic system are, the efficiency of the
Photovoltaic pane used, efficiency of the inverter used and
efficiency of the maximum power point tracking (MPPT)
algorithm used. MPPT techniques are widely used in the
Photovoltaic (PV) system to extract the maximum power
from the Photovoltaic system. MPPT aims that in any
environmental conditions i.e for any irradiation or
temperature, maximum possible energy is extracted from
PV systems. In this paper, Perturb & Observe (P&O),
Incremental conductance techniques of MPPT are
implemented and analyzed. On the basis of the output
voltage, power, current, duty cycle and efficiency of the
boost converter, comparison of these techniques has been
done. To extract the maximum power from the
Photovoltaic system, Inverted-V Method has been
developed and compared with Perturb & Observe,
Incremental conductance method with the help of
MATLAB Simulink software. In this paper, it has been
concluded that Inverted V methods has more efficiency
and performs better as compared to the other two
methods. This paper could be beneficial as a quick
reference for MPPT users and future research application
for PV system.
Keyword: Photovoltaic system, Solar system, MPPT,
MATLAB and Simulink
Introduction
Energy sources which rely on fossil fuels, takes a lot of years
for their formation and causes negative impacts on the
environment due to the mining and burning. There is a need of
renewable energy sources that are sustainable and
inexhaustible [1]. The most effective solution is to use solar
power owing to its abundant availability and easy
accessibility. Conversion of solar power into electric power is
done through PV panels using photovoltaic effect. The basic
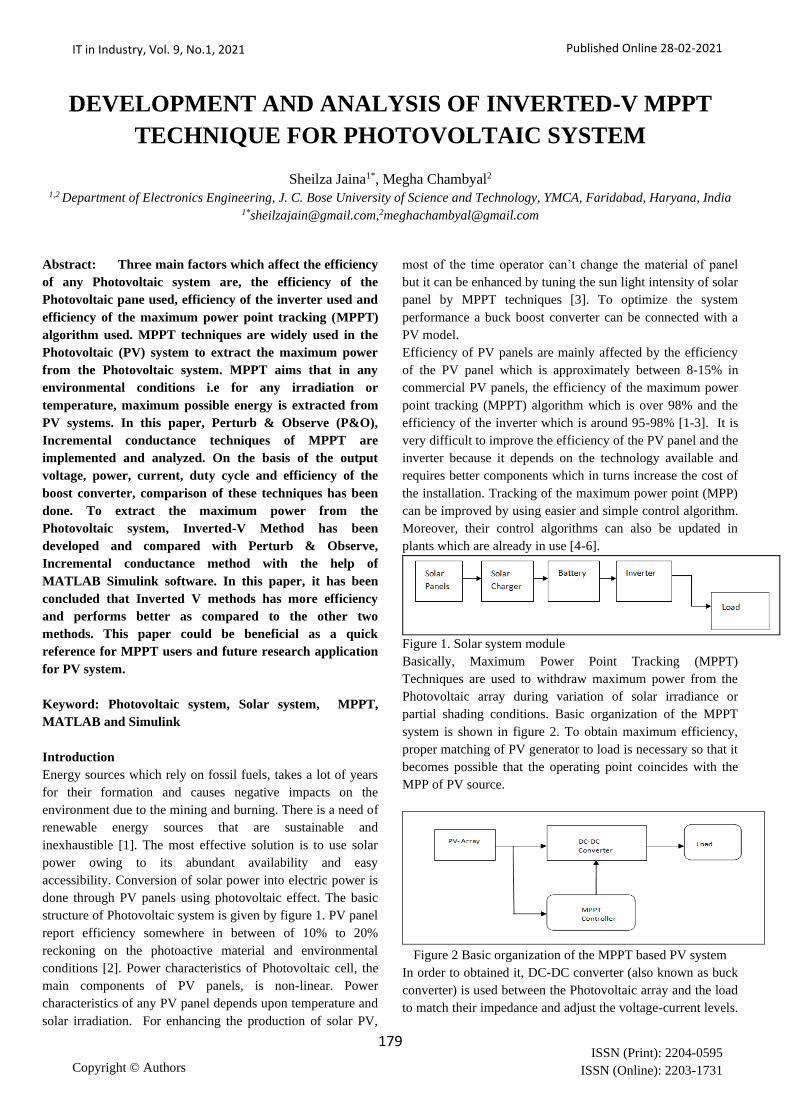
structure of Photovoltaic system is given by figure 1. PV panel
report efficiency somewhere in between of 10% to 20%
reckoning on the photoactive material and environmental
conditions [2]. Power characteristics of Photovoltaic cell, the
main components of PV panels, is non-linear. Power
characteristics of any PV panel depends upon temperature and
solar irradiation. For enhancing the production of solar PV,
most of the time operator can’t change the material of panel
but it can be enhanced by tuning the sun light intensity of solar
panel by MPPT techniques [3]. To optimize the system
performance a buck boost converter can be connected with a
PV model.
Efficiency of PV panels are mainly affected by the efficiency
of the PV panel which is approximately between 8-15% in
commercial PV panels, the efficiency of the maximum power
point tracking (MPPT) algorithm which is over 98% and the
efficiency of the inverter which is around 95-98% [1-3]. It is
very difficult to improve the efficiency of the PV panel and the
inverter because it depends on the technology available and
requires better components which in turns increase the cost of
the installation. Tracking of the maximum power point (MPP)
can be improved by using easier and simple control algorithm.
Moreover, their control algorithms can also be updated in
plants which are already in use [4-6].
Figure 1. Solar system module
Basically, Maximum Power Point Tracking (MPPT)
Techniques are used to withdraw maximum power from the
Photovoltaic array during variation of solar irradiance or
partial shading conditions. Basic organization of the MPPT
system is shown in figure 2. To obtain maximum efficiency,
proper matching of PV generator to load is necessary so that it
becomes possible that the operating point coincides with the
MPP of PV source.
Figure 2 Basic organization of the MPPT based PV system
In order to obtained it, DC-DC converter (also known as buck
converter) is used between the Photovoltaic array and the load
to match their impedance and adjust the voltage-current levels.

180
Copyright © Authors ISSN (Print): 2204-0595
ISSN (Online): 2203-1731
IT in Industry, Vol. 9, No.1, 2021 Published Online 28-02-2021
MPPT control algorithms contains two loops; main loop for
MPPT and secondary loop for the output protection. During its
normal operation, system operates in MPPT mode., but when
the load is unable to absorb all the power produced by PV, and
when its current or/and voltage exceed beyond the limit.,
second loop becomes active to control the system. Second
loop regulates the output not to exceed the limit [7]. Utility
grid or battery is also estimated as constant voltage loads [8-
9]. Maximum Power Point Controller has been used to
increase the efficiency. It withdraws maximum power from the
PV array and then send it to the load. In order to implement
and analyze the behavior of various MPPT techniques, it is
necessary to understand the characteristics and model of PV
panel/cell which are discussed in the next section.
P-V & I-V Characteristics of Solar Panel
Power and Voltage (P-V) and Current and Voltage (I-V )
characteristics of a PV panel are shown in figure 3. As shown
by figure, there is a point on the characteristic curve at which
the panels functioning permits maximum power. Already
existing, PV modules are having low efficiency problems
making it is necessary to track this Maximum Power Point
(MPP) to use the full power of the PV panel [10-11].
Figure 3 P-V and I-V characteristics of solar panel [8,10]
P-V and I-V characteristics changes as irradiation level and
temperature changes. These characteristics given above are
check at the standard temperature and irradiation i.e. 25 degree
Celsius and 1000 W/m2. At the top of the curve, there is MPP.
Characteristics of a PV panel/cell for different values of solar
irradiation and temperature are given in Figure 4 a) and b)
respectively.
Figure 4 Photovoltaic Power Characteristics for (a) Different
Irradiation levels, (b) Different Temperature levels [6]
As depicted from the figures, the non-linear characteristics of
PV are strongly affected by the environment changes. The
MPPT system is tuned to have a point of operation of the PV
panel directly at the high-power point. To achieve this, an
effective MPPT strategy must be developed with the following
properties such as it must have the ability to attain the global
point of MPPT and the tracking speed of MPPT strategy
should be high. Slow tracking speed results in decrease in the
output power as well as reduces the performance of the
photovoltaic system, The MPPT strategy should work properly
in any environmental condition whether it is uniform
insolation or partial shading, the MPPT strategy should have
minimum variations and the MPPT strategy should be able to
track the maximum energy of panel even after the sudden
changes in irradiation.
Mathematical Modeling of a PV Module
The circuit diagram of a Photovoltaic cell is given in figure 5.
In this Simplest model, the diode and the current source are
connected in parallel. PV cell, the main component of PV
panel, has non- linear characteristics due to the insertion of
Series and Parallel Resistances i.e. Rs and Rp respectively.
This single diode/ cell has following five parameters: Ipv :
photovoltaic current, A: diode’s ideality factor, Is : diode’s
saturation current, Rs: series resistance and Rp: shunt
resistance.

181
Copyright © Authors ISSN (Print): 2204-0595
ISSN (Online): 2203-1731
IT in Industry, Vol. 9, No.1, 2021 Published Online 28-02-2021
Figure 5 Single Diode Model [6]
I-V characteristics of single diode of the PV cell is expressed
by the equation given as.
(1)
where;
V= Output voltage of PV, Photocurrent,
Saturation Current, q = Electric Charge
k= Boltzmann Constant , and T= Temperature in Kelvin
Equation (1) can be altered in order to get a null root, when I
react like real Photovoltaic Current.
Then equation (1) will be modified as;
(2)
Current I whose initial value is null, will be used in the process
known as iterative process that approximates equation 2 of its
roots. This will be obtained by the Newton – Raphson Method.
General Equation of Newton Raphson method is;
(3)
Derivative of equation 2 is represented in equation shown
below;
(4)
The model shown in figure 6 is used as a source voltage,
integrator in the model shows the capacitance that will stores
the current which is injected in the PV panel.
Figure 6 Simulink Model of a Photovoltaic system [6]
Organization of MPPT
The Maximum Power Point Tracking
(MPPT) Techniques are used to withdraw maximum power
from photovoltaic array during variation of solar irradiance or
partial shading conditions. There are many types of MPPT
techniques. This paper is an attempt to analyze and compare
some of the simplest, latest and most commonly used methods
of the MPPT algorithm such as Perturb & Observe (P&O)
method, Incremental & Conductance(IC) method. In this
paper, a new Method known as inverted-V has been
introduced which will overcome all the disadvantages of the
above algorithms.
All the above methods are studied,
implemented and compared in MATLAB Simulink and their
efficiency based on parameters like steady state oscillations
which are produced at the vicinity of a MPP and their response
time has been calculated.
Perturb & Observe (P&O) Method
MPPT is an algorithm to withdraw high
power from Photovoltaic array in different environmental
conditions. Maximum power point (MPP) is a point at which
photovoltaic array delivers high power to the load. This MPP
point is also known as Peak Power voltage. In perturb and
Observe method, perturbation will be applied. It is used to
minimize the parameter control that measures the effect of PV
before and after the deviation. By applying perturbation in
voltage, power is sensed. If power accelerates, then it will go
in the same direction otherwise it will be reversed. If the step
size of perturbation is reduced then oscillation can be
decreased but this will slow down the process of reaching the
Maximum Power Point (MPP). This technique results that
when the Perturb and Observe is reached then it starts
producing oscillations in the vicinity of the MPP.
Disadvantage of this algorithm is that if irradiation changes
swiftly then it can easily lose the track of MPP due to which at
vicinity of MPP, there exists a steady state error and
oscillations are also produced [2,12].
Major drawback of this algorithm is the
power loss during the change in environmental conditions. The
performance of this method can be enhanced by improving the
algorithm of Perturb and Observe (P&O) by two methods: in
first method by examining the process when Perturb and
Observe is reached and by comparing the parameters of two
preceding cycles. In second method, by changing the step size
of perturbation, power loss can be decreased.
The implementation of this P&O Maximum
Power Point Method with increasing rate of current perturb
has two requirements; First, sampling rates should be high and
the value of samples of Voltage and current should reflect the
propensity of Po when the reference signal is changed for the
MPPT power converter.
Second, when the response time of MPPT is
fast , frequency should be low. To enhance the performance of
the system, comparison between Vpv & Ipv is done. Switch
will be turned on with the help of a clock signal and switch

182
Copyright © Authors ISSN (Print): 2204-0595
ISSN (Online): 2203-1731
IT in Industry, Vol. 9, No.1, 2021 Published Online 28-02-2021
will be turned off when the actual current reaches at the
reference current. Therefore, reference current can be
perturbed in every switching cycle as explained above, which
means that perturb cycle and switching cycle are equal.
Perturb and Observe Method with fixed perturb
A new method with modification in P&O
method is ‘Perturb and Observe with Fixed Perturb’ which
signifies that fixed perturbation value is employed and it gives
rise to reference signal for the second loop of figure 7. Second
loop is the outer control loop. The perturb signal can be array
reference V. According to system designs, perturb value is
defined. So, solution provided by the Perturb and Observe
method is not common and self-reliant. The tracking will be
small for smaller perturbation step size whereas the
oscillations produced are minimum and vice-versa. Hence,
perturb and observe scheme with fixed perturb size will
tolerate an immanent tracking-oscillations trade off problem.
A Proportional Integral (PI) controller following the MPPT is
utilized to curb the power converter. Perturbation size is
selected according to inductor size as well as clock (clk)
frequency. The P&O method is used in many Photovoltaic
systems. P&O helps in moving operating point towards the
MPP. It is used to minimize the parameter control that
measures the effect of PV before and after the deviation. By
applying perturbation in voltage, power is sensed. When
power goes up, the algorithm continues to attack the system on
the other side, otherwise the system twists backwards [13]
Figure 7 given below is the Simulink Model
of Perturb and Observe. The components used in this model
are solar panel, boost converter, sample & hold circuit, Pulse
Width Modulator (PWM) and P&O algorithm.
Figure 7 Simulink Model of Perturb and observation Method
Incremental Conductance Method (IC)
In Incremental Conductance (IC) , controller
continuously measures the incremental changes in
photovoltaic module current and voltage to forecast the effects
of change in voltage. In this Method, derivative of
Photovoltaic array is null (zero), positive, negative at a point
of maximum power (MPP), at the left side of the MPP and at
the right side of the MPP respectively. Point of maximum
power, MPP can be obtained by comparing the instantaneous
conductance (I/V) operation with continuous boost or
instantaneous conductance (∆I / ∆V) operation. It can work for
large-scale tracking of maximum power points under rapidly
changing irradiation conditions with high accuracy and can
operate directly under rapidly changing environmental
conditions [14]. The mathematical relation of this technique is;
(5)
which implies that
at point of MPP
(6)
at left side of MPP
(7)
at right side of MPP
(8)
Main disadvantage of P&O method to extract maximum
power under different environmental conditions is resolved by
Incremental Conductance Method. The Incremental
Conductance can easily determine whether the Maximum
Power Point Tracking has reached the MPP and when it
reaches the MPP, it stops perturbing. If the condition is not
matched, the direction of operation of maximum power point
will perturbed according to relation of dI/dV and –I/V given
by equations 6-8 [15,16]. Figure 8 given below plot between
Power and voltage for IC Algorithm.
Figure 8 Power versus Voltage Curve for Incremental
Conductance algorithm [16]
As depicted from figure 8, at MPP the slope of photovoltaic
array is 0. This method helps the utmost usage of the
assumption that proportion of change in output (O/P)
conductance is same as that of negative output instantaneous
conductance. As,
P=VI
(9)
Chain rule for derivatives is applied
dp/dv = [d(VI)]/dV
(10)
183
Copyright © Authors ISSN (Print): 2204-0595
ISSN (Online): 2203-1731
IT in Industry, Vol. 9, No.1, 2021 Published Online 28-02-2021
At MPP
dP/dV = 0
(11)
Equation shown above is expressed in the terms of array
voltage & current:
dI/dV = -I/V
(12)
Pulse width modulated signal of DC to DC boost converter is
controlled by MPPT until the desired condition is fulfilled.
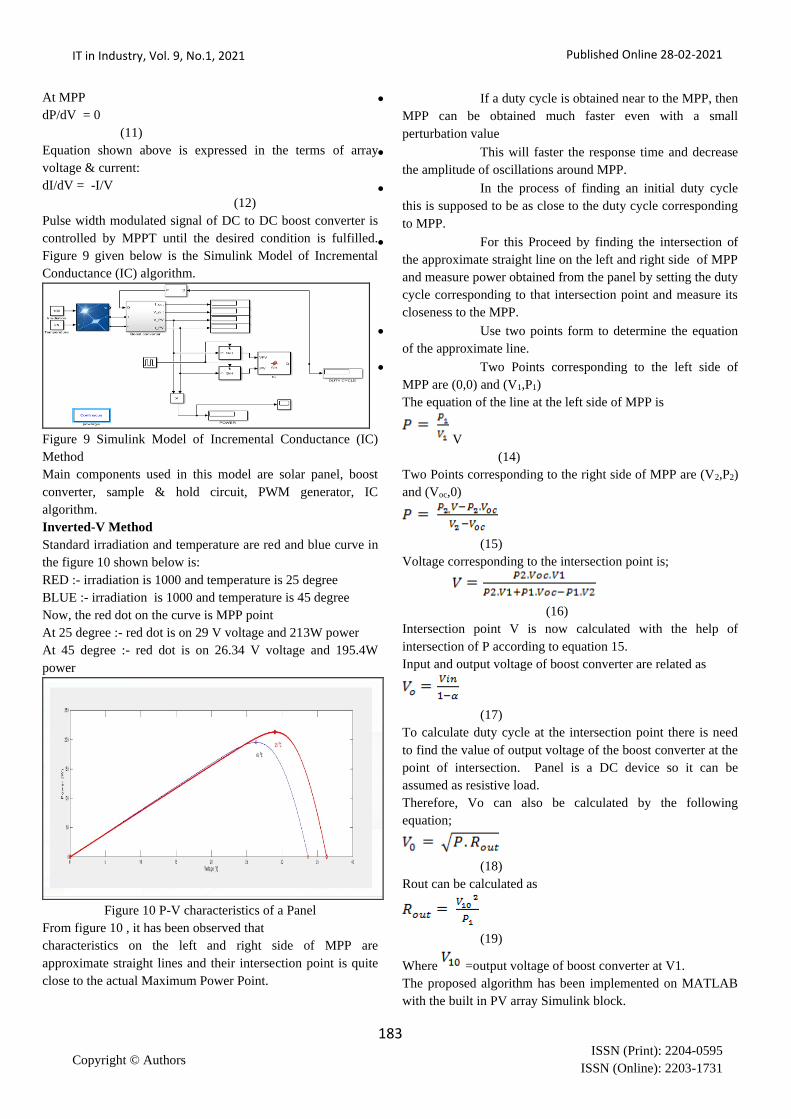
Figure 9 given below is the Simulink Model of Incremental
Conductance (IC) algorithm.
Figure 9 Simulink Model of Incremental Conductance (IC)
Method
Main components used in this model are solar panel, boost
converter, sample & hold circuit, PWM generator, IC
algorithm.
Inverted-V Method
Standard irradiation and temperature are red and blue curve in
the figure 10 shown below is:
RED :- irradiation is 1000 and temperature is 25 degree
BLUE :- irradiation is 1000 and temperature is 45 degree
Now, the red dot on the curve is MPP point
At 25 degree :- red dot is on 29 V voltage and 213W power
At 45 degree :- red dot is on 26.34 V voltage and 195.4W
power
Figure 10 P-V characteristics of a Panel
From figure 10 , it has been observed that
characteristics on the left and right side of MPP are
approximate straight lines and their intersection point is quite
close to the actual Maximum Power Point.
• If a duty cycle is obtained near to the MPP, then
MPP can be obtained much faster even with a small
perturbation value
• This will faster the response time and decrease
the amplitude of oscillations around MPP.
• In the process of finding an initial duty cycle
this is supposed to be as close to the duty cycle corresponding
to MPP.
• For this Proceed by finding the intersection of
the approximate straight line on the left and right side of MPP
and measure power obtained from the panel by setting the duty
cycle corresponding to that intersection point and measure its
closeness to the MPP.
• Use two points form to determine the equation
of the approximate line.
• Two Points corresponding to the left side of
MPP are (0,0) and (V1,P1)
The equation of the line at the left side of MPP is
V
(14)
Two Points corresponding to the right side of MPP are (V2,P2)
and (Voc,0)
(15)
Voltage corresponding to the intersection point is;
(16)
Intersection point V is now calculated with the help of
intersection of P according to equation 15.
Input and output voltage of boost converter are related as
(17)
To calculate duty cycle at the intersection point there is need
to find the value of output voltage of the boost converter at the
point of intersection. Panel is a DC device so it can be
assumed as resistive load.
Therefore, Vo can also be calculated by the following
equation;
(18)
Rout can be calculated as
(19)
Where =output voltage of boost converter at V1.
The proposed algorithm has been implemented on MATLAB
with the built in PV array Simulink block.
184
Copyright © Authors ISSN (Print): 2204-0595
ISSN (Online): 2203-1731
IT in Industry, Vol. 9, No.1, 2021 Published Online 28-02-2021
Duty cycle at point V1 and P1 was 0.9 and at V2 and P2 was
0.1
The test was carried out at various irradiation and temperature
details of which are summarized below;
Table 1 Result of Inverted –V method
Irradiatio
n
Temperatur
e
Pmpp Duty
Cycle
Power at
calculate
d duty
cycle
1000 25 36.3
3
213.1
5
0.79
7
212.82
1000 45 33.6
8
195.4
2
0.80
7
195.21
500 25 35.2
2
108 0.71
3
108
100 25 32.8
1
20.68 0.37
3
20.68
Parallel String -1; Series String-1
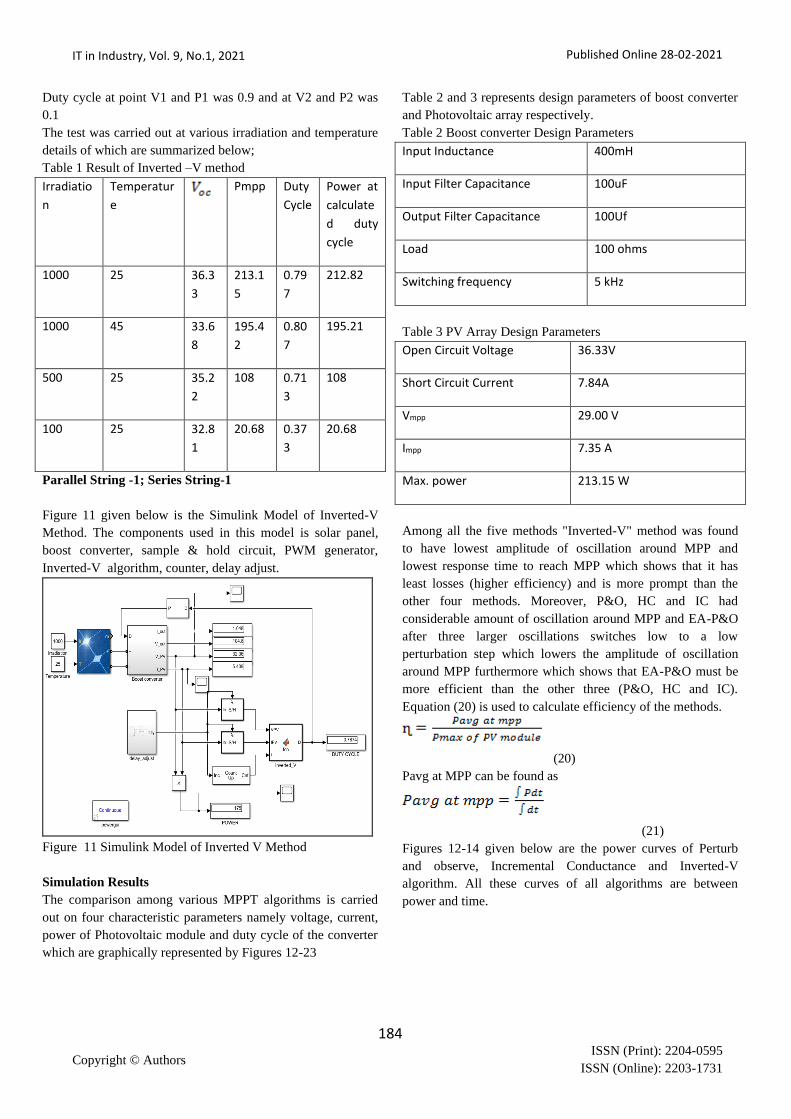
Figure 11 given below is the Simulink Model of Inverted-V
Method. The components used in this model is solar panel,
boost converter, sample & hold circuit, PWM generator,
Inverted-V algorithm, counter, delay adjust.
Figure 11 Simulink Model of Inverted V Method
Simulation Results
The comparison among various MPPT algorithms is carried
out on four characteristic parameters namely voltage, current,
power of Photovoltaic module and duty cycle of the converter
which are graphically represented by Figures 12-23
Table 2 and 3 represents design parameters of boost converter
and Photovoltaic array respectively.
Table 2 Boost converter Design Parameters
Input Inductance 400mH
Input Filter Capacitance 100uF
Output Filter Capacitance 100Uf
Load 100 ohms
Switching frequency 5 kHz
Table 3 PV Array Design Parameters
Open Circuit Voltage 36.33V
Short Circuit Current 7.84A
Vmpp 29.00 V
Impp 7.35 A
Max. power 213.15 W
Among all the five methods "Inverted-V" method was found
to have lowest amplitude of oscillation around MPP and
lowest response time to reach MPP which shows that it has
least losses (higher efficiency) and is more prompt than the
other four methods. Moreover, P&O, HC and IC had
considerable amount of oscillation around MPP and EA-P&O
after three larger oscillations switches low to a low
perturbation step which lowers the amplitude of oscillation
around MPP furthermore which shows that EA-P&O must be
more efficient than the other three (P&O, HC and IC).
Equation (20) is used to calculate efficiency of the methods.
(20)
Pavg at MPP can be found as
(21)
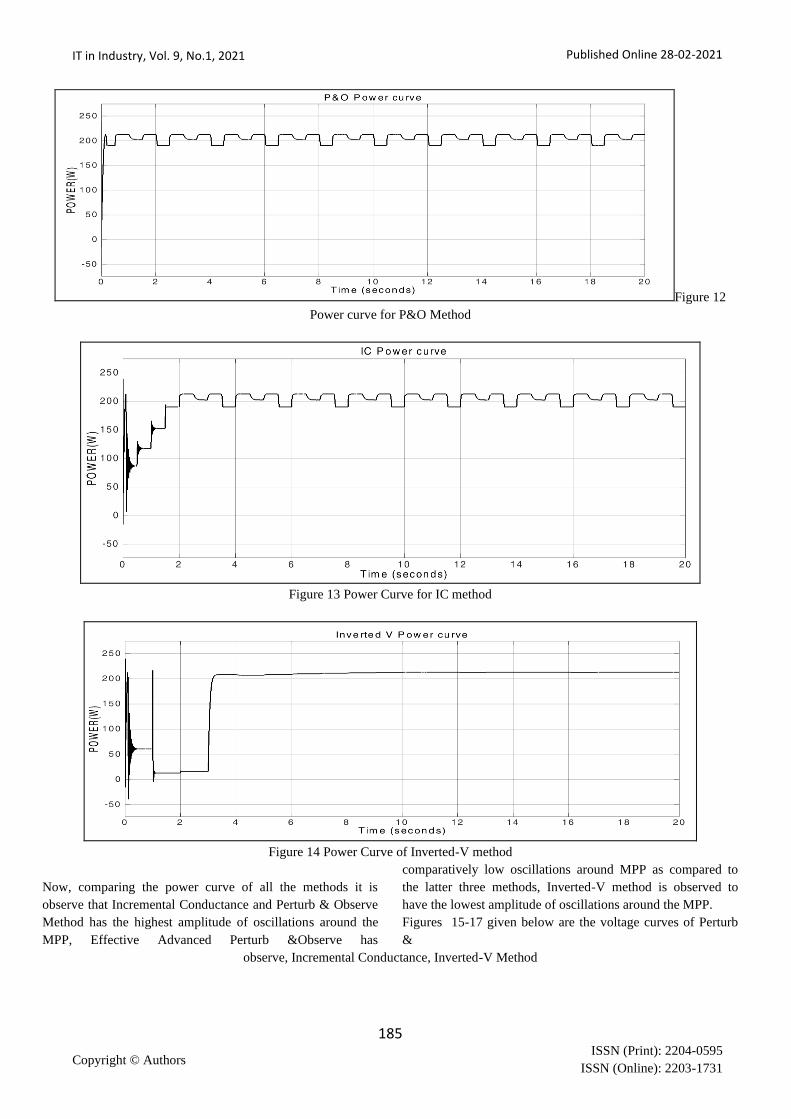
Figures 12-14 given below are the power curves of Perturb
and observe, Incremental Conductance and Inverted-V
algorithm. All these curves of all algorithms are between
power and time.
185
Copyright © Authors ISSN (Print): 2204-0595
ISSN (Online): 2203-1731
IT in Industry, Vol. 9, No.1, 2021 Published Online 28-02-2021
Figure 12
Power curve for P&O Method
Figure 13 Power Curve for IC method
Figure 14 Power Curve of Inverted-V method
Now, comparing the power curve of all the methods it is
observe that Incremental Conductance and Perturb & Observe
Method has the highest amplitude of oscillations around the
MPP, Effective Advanced Perturb &Observe has
comparatively low oscillations around MPP as compared to
the latter three methods, Inverted-V method is observed to
have the lowest amplitude of oscillations around the MPP.
Figures 15-17 given below are the voltage curves of Perturb
&
observe, Incremental Conductance, Inverted-V Method

186
Copyright © Authors ISSN (Print): 2204-0595
ISSN (Online): 2203-1731
IT in Industry, Vol. 9, No.1, 2021 Published Online 28-02-2021
Figure 15 Voltage curve for P&O Method
Figure 16 Voltage curve for IC method
Figure 17 Voltage curve for Inverted-V method
Now, comparing the voltage curve of all the methods it
has been observed that Incremental Conductance and Perturb
& Observe Method has the highest amplitude of oscillations
around the MPP, Effective Advanced Perturb &Observe has
comparatively low oscillations around MPP as compared to
the latter three methods, Inverted-V method is observed to
have the lowest amplitude of oscillations around the MPP.
Figures 18-20 given below are the current curves of Perturb &
observe, Incremental Conductance, Inverted-V Method.
187
Copyright © Authors ISSN (Print): 2204-0595
ISSN (Online): 2203-1731
IT in Industry, Vol. 9, No.1, 2021 Published Online 28-02-2021
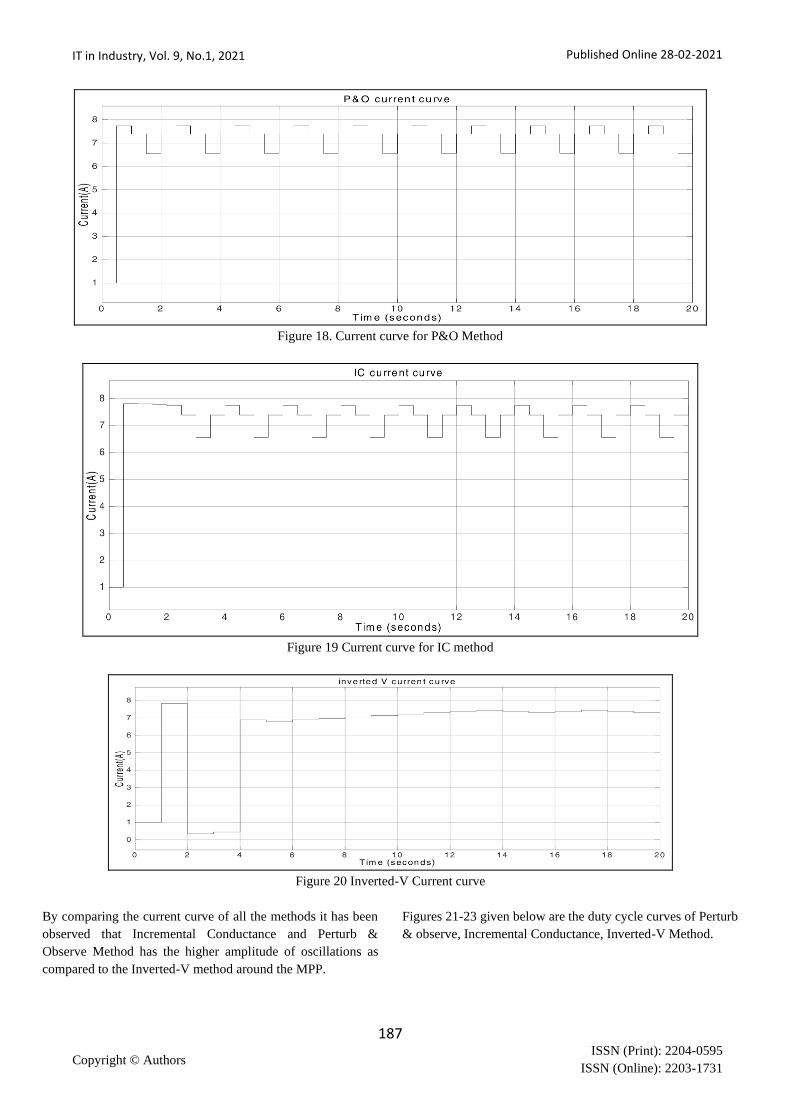
Figure 18. Current curve for P&O Method
Figure 19 Current curve for IC method
Figure 20 Inverted-V Current curve
By comparing the current curve of all the methods it has been
observed that Incremental Conductance and Perturb &
Observe Method has the higher amplitude of oscillations as
compared to the Inverted-V method around the MPP.
Figures 21-23 given below are the duty cycle curves of Perturb
& observe, Incremental Conductance, Inverted-V Method.
188
Copyright © Authors ISSN (Print): 2204-0595
ISSN (Online): 2203-1731
IT in Industry, Vol. 9, No.1, 2021 Published Online 28-02-2021
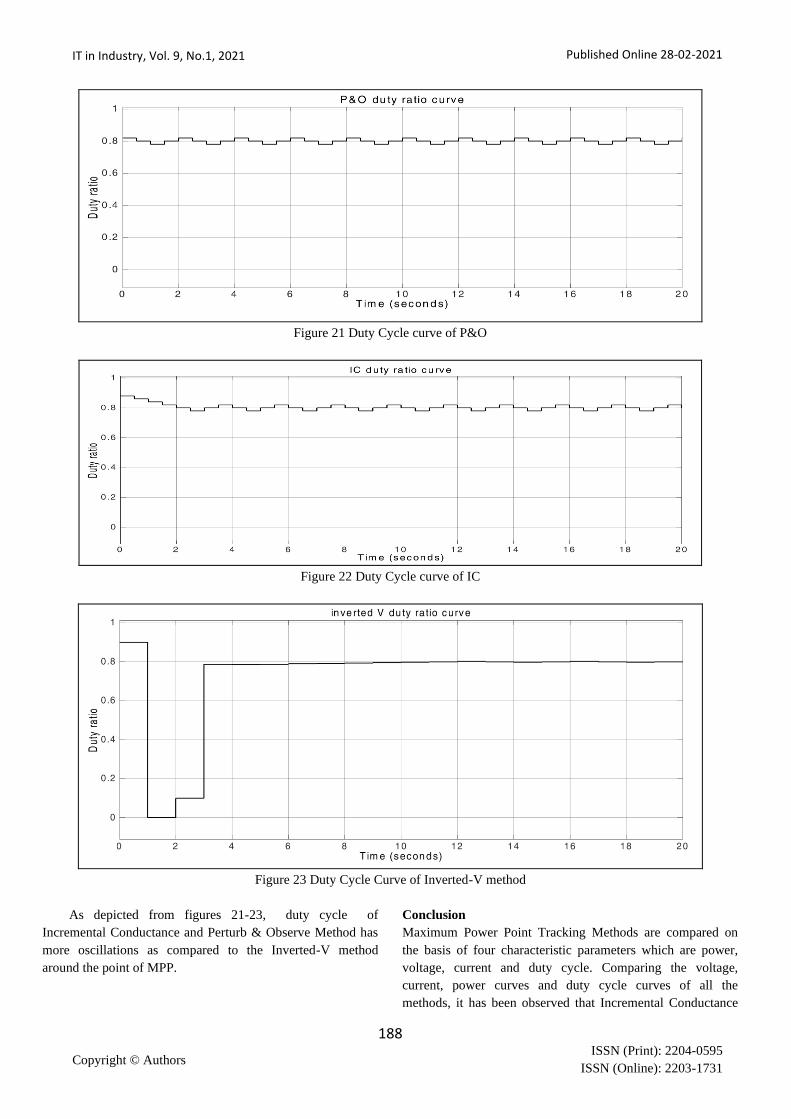
Figure 21 Duty Cycle curve of P&O
Figure 22 Duty Cycle curve of IC
Figure 23 Duty Cycle Curve of Inverted-V method
As depicted from figures 21-23, duty cycle of
Incremental Conductance and Perturb & Observe Method has
more oscillations as compared to the Inverted-V method
around the point of MPP.
Conclusion
Maximum Power Point Tracking Methods are compared on
the basis of four characteristic parameters which are power,
voltage, current and duty cycle. Comparing the voltage,
current, power curves and duty cycle curves of all the
methods, it has been observed that Incremental Conductance
189
Copyright © Authors ISSN (Print): 2204-0595
ISSN (Online): 2203-1731
IT in Industry, Vol. 9, No.1, 2021 Published Online 28-02-2021
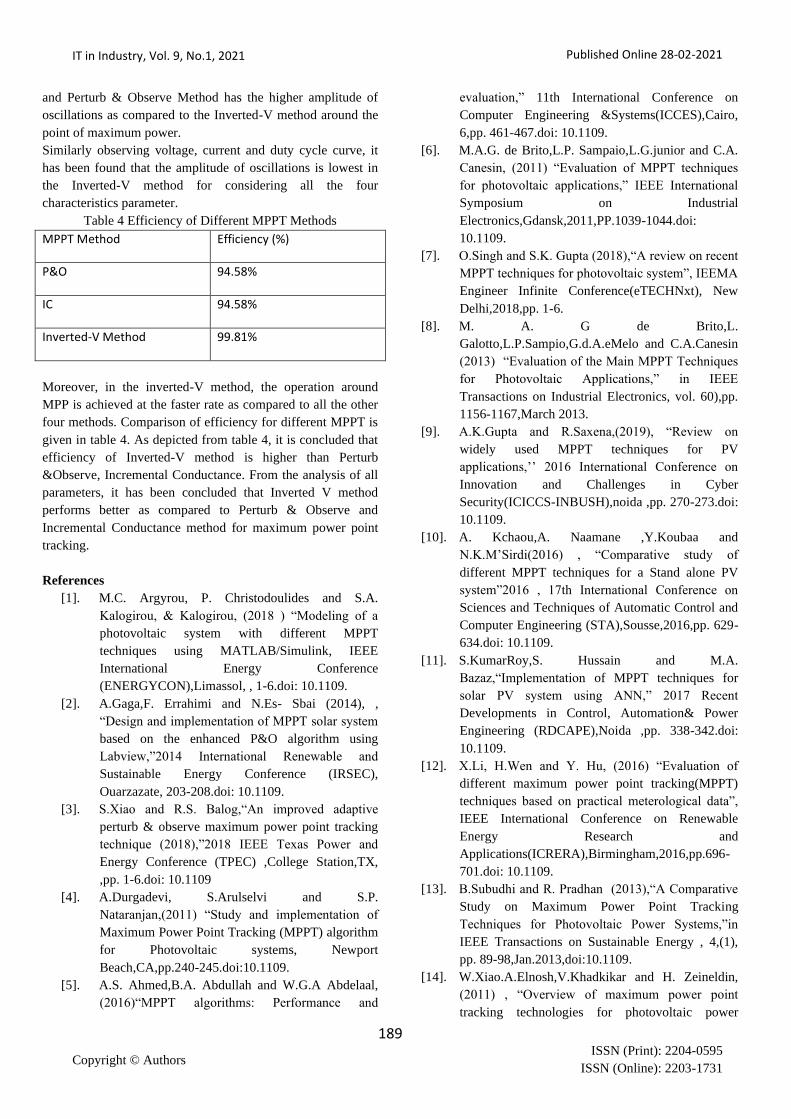
and Perturb & Observe Method has the higher amplitude of
oscillations as compared to the Inverted-V method around the
point of maximum power.
Similarly observing voltage, current and duty cycle curve, it
has been found that the amplitude of oscillations is lowest in
the Inverted-V method for considering all the four
characteristics parameter.
Table 4 Efficiency of Different MPPT Methods
MPPT Method Efficiency (%)
P&O 94.58%
IC 94.58%
Inverted-V Method 99.81%
Moreover, in the inverted-V method, the operation around
MPP is achieved at the faster rate as compared to all the other
four methods. Comparison of efficiency for different MPPT is
given in table 4. As depicted from table 4, it is concluded that
efficiency of Inverted-V method is higher than Perturb
&Observe, Incremental Conductance. From the analysis of all
parameters, it has been concluded that Inverted V method
performs better as compared to Perturb & Observe and
Incremental Conductance method for maximum power point
tracking.
References
[1]. M.C. Argyrou, P. Christodoulides and S.A.
Kalogirou, & Kalogirou, (2018 ) “Modeling of a
photovoltaic system with different MPPT
techniques using MATLAB/Simulink, IEEE
International Energy Conference
(ENERGYCON),Limassol, , 1-6.doi: 10.1109.
[2]. A.Gaga,F. Errahimi and N.Es- Sbai (2014), ,
“Design and implementation of MPPT solar system
based on the enhanced P&O algorithm using
Labview,”2014 International Renewable and
Sustainable Energy Conference (IRSEC),
Ouarzazate, 203-208.doi: 10.1109.
[3]. S.Xiao and R.S. Balog,“An improved adaptive
perturb & observe maximum power point tracking
technique (2018),”2018 IEEE Texas Power and
Energy Conference (TPEC) ,College Station,TX,
,pp. 1-6.doi: 10.1109
[4]. A.Durgadevi, S.Arulselvi and S.P.
Nataranjan,(2011) “Study and implementation of
Maximum Power Point Tracking (MPPT) algorithm
for Photovoltaic systems, Newport
Beach,CA,pp.240-245.doi:10.1109.
[5]. A.S. Ahmed,B.A. Abdullah and W.G.A Abdelaal,
(2016)“MPPT algorithms: Performance and
evaluation,” 11th International Conference on
Computer Engineering &Systems(ICCES),Cairo,
6,pp. 461-467.doi: 10.1109.
[6]. M.A.G. de Brito,L.P. Sampaio,L.G.junior and C.A.
Canesin, (2011) “Evaluation of MPPT techniques
for photovoltaic applications,” IEEE International
Symposium on Industrial
Electronics,Gdansk,2011,PP.1039-1044.doi:
10.1109.
[7]. O.Singh and S.K. Gupta (2018),“A review on recent
MPPT techniques for photovoltaic system”, IEEMA
Engineer Infinite Conference(eTECHNxt), New
Delhi,2018,pp. 1-6.
[8]. M. A. G de Brito,L.
Galotto,L.P.Sampio,G.d.A.eMelo and C.A.Canesin
(2013) “Evaluation of the Main MPPT Techniques
for Photovoltaic Applications,” in IEEE
Transactions on Industrial Electronics, vol. 60),pp.
1156-1167,March 2013.
[9]. A.K.Gupta and R.Saxena,(2019), “Review on
widely used MPPT techniques for PV
applications,’’ 2016 International Conference on
Innovation and Challenges in Cyber
Security(ICICCS-INBUSH),noida ,pp. 270-273.doi:
10.1109.
[10]. A. Kchaou,A. Naamane ,Y.Koubaa and
N.K.M’Sirdi(2016) , “Comparative study of
different MPPT techniques for a Stand alone PV
system”2016 , 17th International Conference on
Sciences and Techniques of Automatic Control and
Computer Engineering (STA),Sousse,2016,pp. 629-
634.doi: 10.1109.
[11]. S.KumarRoy,S. Hussain and M.A.
Bazaz,“Implementation of MPPT techniques for
solar PV system using ANN,” 2017 Recent
Developments in Control, Automation& Power
Engineering (RDCAPE),Noida ,pp. 338-342.doi:
10.1109.
[12]. X.Li, H.Wen and Y. Hu, (2016) “Evaluation of
different maximum power point tracking(MPPT)
techniques based on practical meterological data”,
IEEE International Conference on Renewable
Energy Research and
Applications(ICRERA),Birmingham,2016,pp.696-
701.doi: 10.1109.
[13]. B.Subudhi and R. Pradhan (2013),“A Comparative
Study on Maximum Power Point Tracking
Techniques for Photovoltaic Power Systems,”in
IEEE Transactions on Sustainable Energy , 4,(1),
pp. 89-98,Jan.2013,doi:10.1109.
[14]. W.Xiao.A.Elnosh,V.Khadkikar and H. Zeineldin,
(2011) , “Overview of maximum power point
tracking technologies for photovoltaic power

190
Copyright © Authors ISSN (Print): 2204-0595
ISSN (Online): 2203-1731
IT in Industry, Vol. 9, No.1, 2021 Published Online 28-02-2021
systems,”IECON 2011-37 th Annual Conference of
the IEEE Industrial Electronics
Society,Melbourne,VIC,2011,PP. 3900-3905.doi:
10.1109.
[15]. L.Omine,M.Brito and J.Onofre,(2018) “Analysis of
Hybrid MPPT Techniques for Photovoltaic
Systems,” 2018A. RezaeeJordehi,“Maximum power
point tracking in photovoltaic (PV) systems: A
review of different approaches” ,pp. 1127-1138.
[16]. J.SuryaKumari,Ch. SaiBabu,A. KamalakarBabu,
(2012) “Design and Analysis of P&O and IP&O
MPPT Techniques for Photovoltaic System”,
International Journal of Modern Engineering
Reseaarch (IJMER)Vol. 2, pp-2174-2180.