developing the solution process for related rates problems...
TRANSCRIPT

Developing the Solution Process for Related Rates Problems Using Computer Simulations
Nicole Engelke
Cal State Fullerton
Related rates problems are a source of difficulty for many calculus students. There has been little
research on the role of the mental model when solving these problems. Three first semester
calculus students participated in a teaching experiment focused on solving related rates
problems. The results of this teaching experiment were analyzed using a framework based on
five phases: draw a diagram, construct a functional relationship, relate the rates, solve for the
unknown rate, and check the answer for reasonability. A particularly interesting aspect of the
relate the rates phase was the development of what the students called “delta equations.” The
creation of the delta equation differs from a traditional approach to solving related rates problems
and may facilitate the students’ understanding of the solution process.
Background
Little research has been published on the solution process for related rates problems in
first semester calculus. The research to date suggests that students have a procedural approach to
solving related rates problems (Clark et al., 1997; Martin, 1996, 2000; White & Mitchelmore,
1996). It has also been reported that students’ difficulties appear to stem from their
misconceptions about variable, function, and derivative – particularly the chain rule (Carlson,
1998; Clark et al., 1997; Engelke, 2004; White & Mitchelmore, 1996). The ability to engage in
transformational and covariational reasoning allows a problem solver to construct a mental
model of the problem situation that may be manipulated to understand how the system works
(Carlson, Jacobs, Coe, Larsen, & Hsu, 2002; Saldanha & Thompson, 1998; Simon, 1996). The
ability to engage in transformational and covariational reasoning appears to be critical for
success when solving related rates problems (Engelke, 2004). The purpose of this study was to
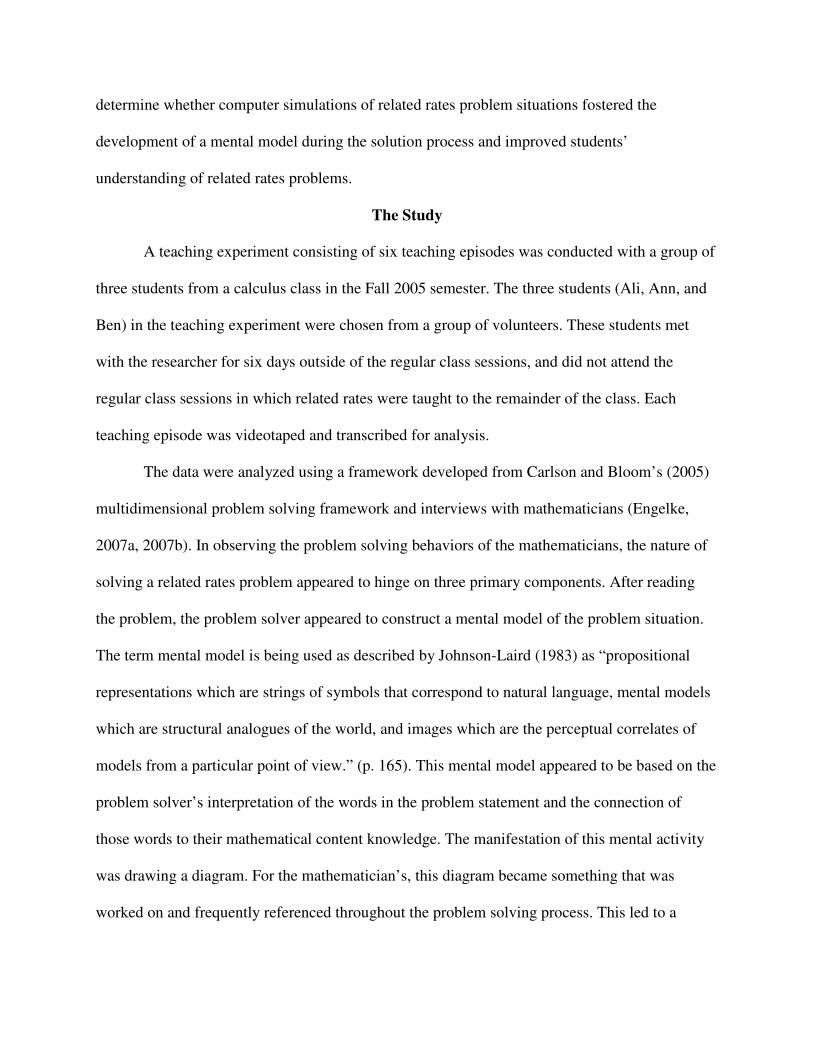
determine whether computer simulations of related rates problem situations fostered the
development of a mental model during the solution process and improved students’
understanding of related rates problems.
The Study
A teaching experiment consisting of six teaching episodes was conducted with a group of
three students from a calculus class in the Fall 2005 semester. The three students (Ali, Ann, and
Ben) in the teaching experiment were chosen from a group of volunteers. These students met
with the researcher for six days outside of the regular class sessions, and did not attend the
regular class sessions in which related rates were taught to the remainder of the class. Each
teaching episode was videotaped and transcribed for analysis.
The data were analyzed using a framework developed from Carlson and Bloom’s (2005)
multidimensional problem solving framework and interviews with mathematicians (Engelke,
2007a, 2007b). In observing the problem solving behaviors of the mathematicians, the nature of
solving a related rates problem appeared to hinge on three primary components. After reading
the problem, the problem solver appeared to construct a mental model of the problem situation.
The term mental model is being used as described by Johnson-Laird (1983) as “propositional
representations which are strings of symbols that correspond to natural language, mental models
which are structural analogues of the world, and images which are the perceptual correlates of
models from a particular point of view.” (p. 165). This mental model appeared to be based on the
problem solver’s interpretation of the words in the problem statement and the connection of
those words to their mathematical content knowledge. The manifestation of this mental activity
was drawing a diagram. For the mathematician’s, this diagram became something that was
worked on and frequently referenced throughout the problem solving process. This led to a

differentiation between artifacts (things written down as part of the solution process) and
solution artifacts (things written down during the solution process which became an additional
resource for the problem solver). It appeared to be the case that after a solution artifact was
generated; the problem solver revisited the mental model of the problem situation and sometimes
the original problem statement before continuing. This cycle is represented in Figure 1. From
these observations, the five phase framework was developed. The five phases are: draw a
diagram, construct a functional relationship, relate the rates, solve for the unknown rate, and
check the answer for reasonability. Each phase can be described by the content knowledge the
problem solver accesses, the mental model that is developed, and the solution artifacts that are
generated. The framework is presented in Table 1.
Figure 1: The solution process for related rates problems.
Problem Statement
Solution Artifact
Mental Model
PS
Content
Knowledge
Previous
Solution
Artifacts Heuristics
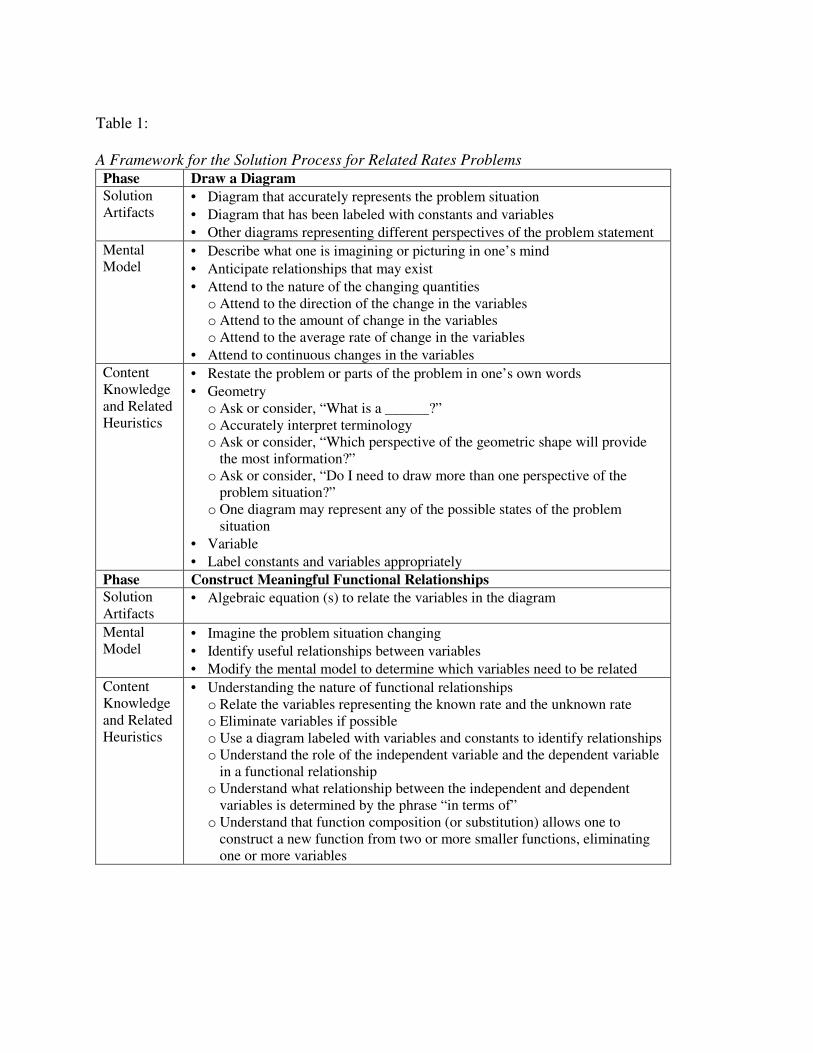
Table 1:
A Framework for the Solution Process for Related Rates Problems
Phase Draw a Diagram
Solution
Artifacts • Diagram that accurately represents the problem situation
• Diagram that has been labeled with constants and variables
• Other diagrams representing different perspectives of the problem statement
Mental
Model • Describe what one is imagining or picturing in one’s mind
• Anticipate relationships that may exist
• Attend to the nature of the changing quantities
o Attend to the direction of the change in the variables
o Attend to the amount of change in the variables
o Attend to the average rate of change in the variables
• Attend to continuous changes in the variables
Content
Knowledge
and Related
Heuristics
• Restate the problem or parts of the problem in one’s own words
• Geometry
o Ask or consider, “What is a ______?”
o Accurately interpret terminology
o Ask or consider, “Which perspective of the geometric shape will provide
the most information?”
o Ask or consider, “Do I need to draw more than one perspective of the
problem situation?”
o One diagram may represent any of the possible states of the problem
situation
• Variable
• Label constants and variables appropriately
Phase Construct Meaningful Functional Relationships
Solution
Artifacts • Algebraic equation (s) to relate the variables in the diagram
Mental
Model • Imagine the problem situation changing
• Identify useful relationships between variables
• Modify the mental model to determine which variables need to be related
Content
Knowledge
and Related
Heuristics
• Understanding the nature of functional relationships
o Relate the variables representing the known rate and the unknown rate
o Eliminate variables if possible
o Use a diagram labeled with variables and constants to identify relationships
o Understand the role of the independent variable and the dependent variable
in a functional relationship
o Understand what relationship between the independent and dependent
variables is determined by the phrase “in terms of”
o Understand that function composition (or substitution) allows one to
construct a new function from two or more smaller functions, eliminating
one or more variables
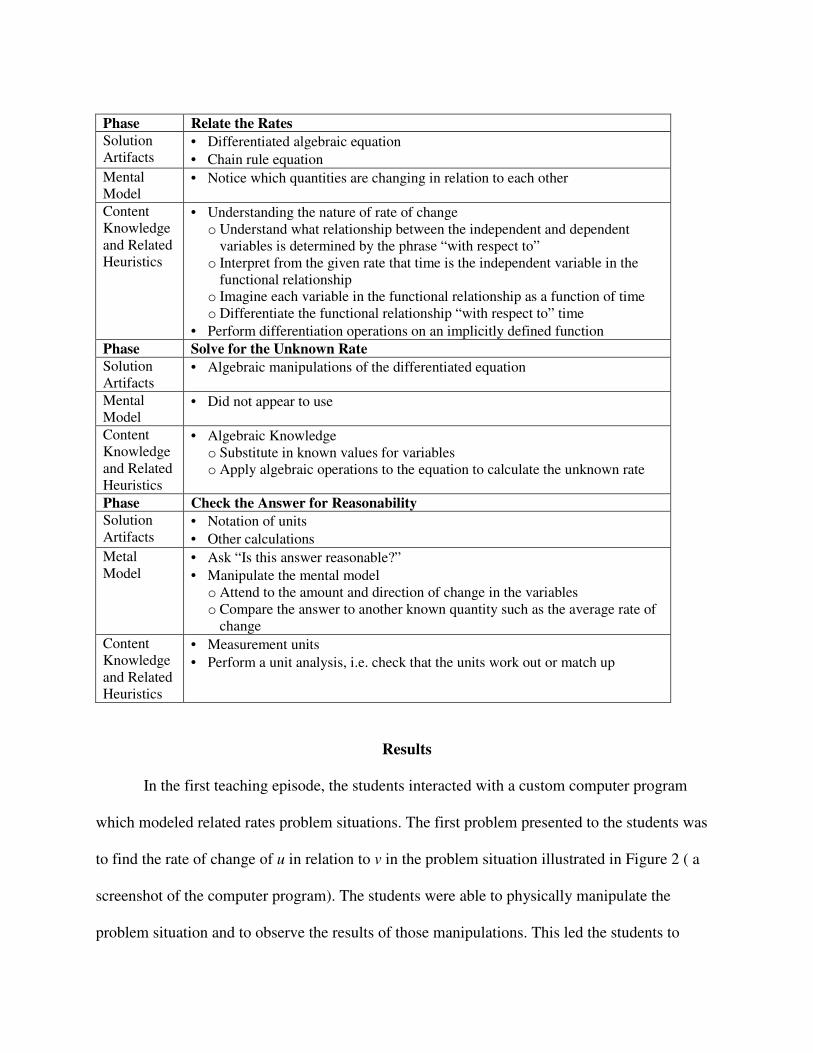
Phase Relate the Rates
Solution
Artifacts • Differentiated algebraic equation
• Chain rule equation
Mental
Model • Notice which quantities are changing in relation to each other
Content
Knowledge
and Related
Heuristics
• Understanding the nature of rate of change
o Understand what relationship between the independent and dependent
variables is determined by the phrase “with respect to”
o Interpret from the given rate that time is the independent variable in the
functional relationship
o Imagine each variable in the functional relationship as a function of time
o Differentiate the functional relationship “with respect to” time
• Perform differentiation operations on an implicitly defined function
Phase Solve for the Unknown Rate
Solution
Artifacts • Algebraic manipulations of the differentiated equation
Mental
Model • Did not appear to use
Content
Knowledge
and Related
Heuristics
• Algebraic Knowledge
o Substitute in known values for variables
o Apply algebraic operations to the equation to calculate the unknown rate
Phase Check the Answer for Reasonability
Solution
Artifacts • Notation of units
• Other calculations
Metal
Model • Ask “Is this answer reasonable?”
• Manipulate the mental model
o Attend to the amount and direction of change in the variables
o Compare the answer to another known quantity such as the average rate of
change
Content
Knowledge
and Related
Heuristics
• Measurement units
• Perform a unit analysis, i.e. check that the units work out or match up
Results
In the first teaching episode, the students interacted with a custom computer program
which modeled related rates problem situations. The first problem presented to the students was
to find the rate of change of u in relation to v in the problem situation illustrated in Figure 2 ( a
screenshot of the computer program). The students were able to physically manipulate the
problem situation and to observe the results of those manipulations. This led the students to

generate time as a variable that would allow them to determine the average rate of change for
each variable.
Figure 2: Computer simulation of the plane problem.
The rates of change in this problem situation could be thought of as a ratio of rates and related
this to the multiplication of the rates. The students looked at problems requiring the use of the
chain rule to relate given rates in the second teaching episode. At the end of this session, the
students were identifying what they later called “a middle man,” a variable through which they
could relate two other variables.
In the third through sixth teaching episodes, the students solved related rates problems.
The problems presented to the students in the third and fourth teaching episodes had most of the
numeric data stripped from them in attempt to focus the students’ attention on the relationships
that existed between the variables. In the fifth and sixth teaching episodes, the problems were
stated in a traditional textbook manner.

During the third teaching episode, the students were given the following related rates
problem:
A plane flying horizontally at an altitude of 3 miles and a speed of 600 mi/hr passes
directly over a radar station. Let the distance from the plane to the radar station be
represented by z. What is the rate of change of the distance from the plane to the radar
station with respect to time?
This version of the plane problem differs from what is traditionally seen in a textbook in that
most of its numeric data has been removed. It was hoped that this would encourage the students
to focus on constructing the necessary functional relationships before attempting to substitute in
values. The students had previously modeled a plane problem with the computer program in the
first teaching episode.
The diagram the students drew on their paper was the only indication of what their
mental image was. Ali and Ben questioned where they should put their radar station in relation to
the plane and looked to Ann for guidance. The students’ also appeared to have a heuristic that
caused them to label their diagram. They labeled the constants in their diagrams and then
assigned letters to any quantities that were unknown. They did not talk about any quantities
changing. This suggests that they held a static mental image of the problem situation. They did
not appear to be imagining the quantities changing nor did they provide any evidence that they
were engaging in covariational reasoning to explore and understand the problem situation. It
would appear that the students’ understanding of how to label a diagram involved assigning only
one letter to each unknown. Thus, the diagrams that the students drew to represent the problem
situation appear to provide only superficial information.
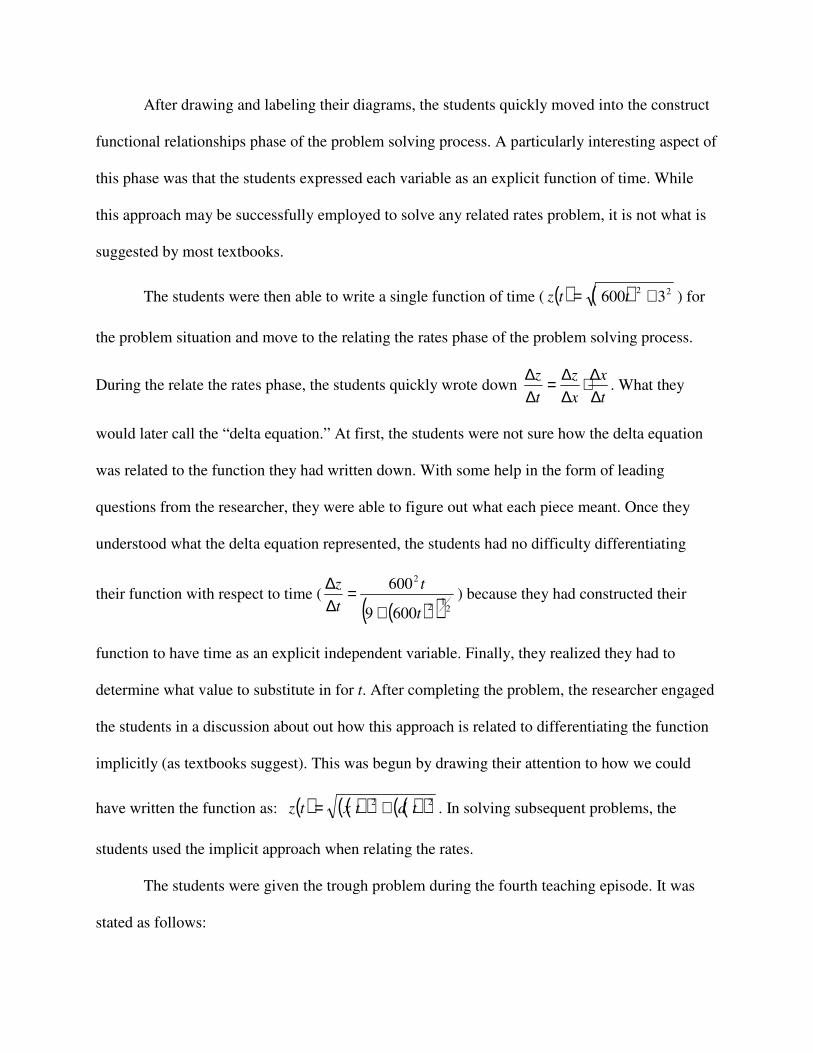
After drawing and labeling their diagrams, the students quickly moved into the construct
functional relationships phase of the problem solving process. A particularly interesting aspect of
this phase was that the students expressed each variable as an explicit function of time. While
this approach may be successfully employed to solve any related rates problem, it is not what is
suggested by most textbooks.
The students were then able to write a single function of time ( ( ) ( ) 223600 += ttz ) for
the problem situation and move to the relating the rates phase of the problem solving process.
During the relate the rates phase, the students quickly wrote down t
x
x
z
t
z
∆∆⋅
∆∆=
∆∆
. What they
would later call the “delta equation.” At first, the students were not sure how the delta equation
was related to the function they had written down. With some help in the form of leading
questions from the researcher, they were able to figure out what each piece meant. Once they
understood what the delta equation represented, the students had no difficulty differentiating
their function with respect to time (
( )( ) 21
2
2
6009
600
t
t
t
z
+=
∆∆
) because they had constructed their
function to have time as an explicit independent variable. Finally, they realized they had to
determine what value to substitute in for t. After completing the problem, the researcher engaged
the students in a discussion about out how this approach is related to differentiating the function
implicitly (as textbooks suggest). This was begun by drawing their attention to how we could
have written the function as: ( ) ( )( ) ( )( )22tdtxtz += . In solving subsequent problems, the
students used the implicit approach when relating the rates.
The students were given the trough problem during the fourth teaching episode. It was
stated as follows:
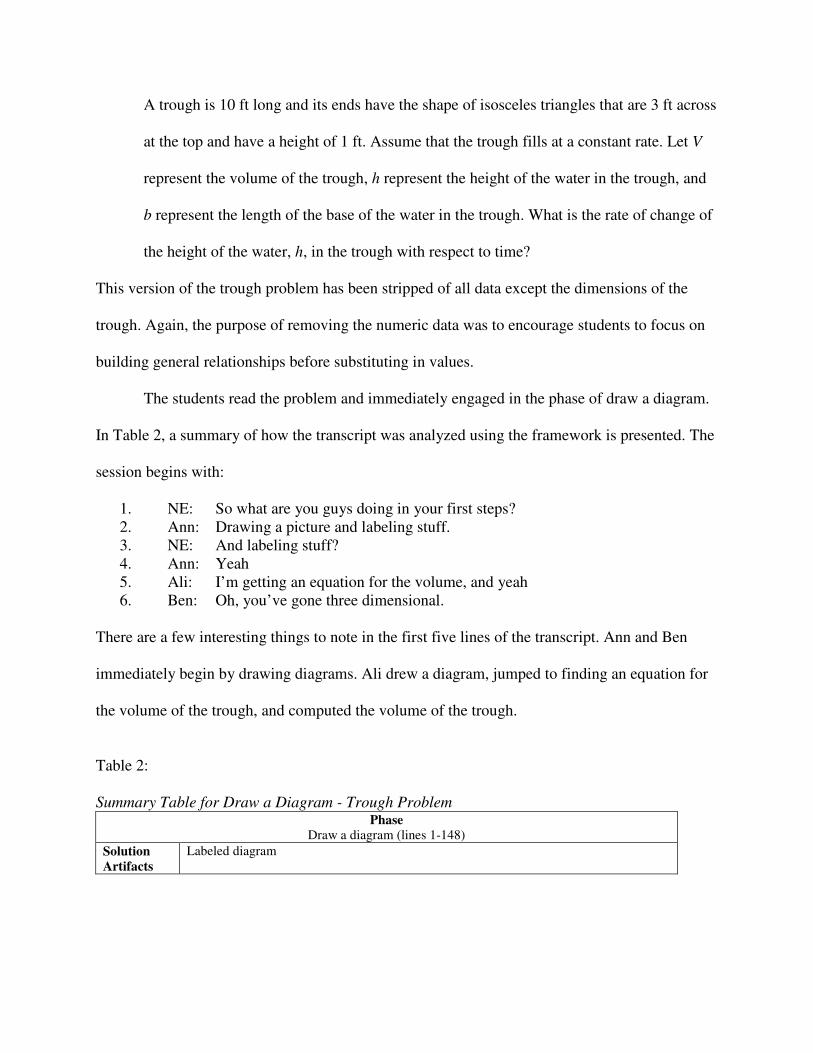
A trough is 10 ft long and its ends have the shape of isosceles triangles that are 3 ft across
at the top and have a height of 1 ft. Assume that the trough fills at a constant rate. Let V
represent the volume of the trough, h represent the height of the water in the trough, and
b represent the length of the base of the water in the trough. What is the rate of change of
the height of the water, h, in the trough with respect to time?
This version of the trough problem has been stripped of all data except the dimensions of the
trough. Again, the purpose of removing the numeric data was to encourage students to focus on
building general relationships before substituting in values.
The students read the problem and immediately engaged in the phase of draw a diagram.
In Table 2, a summary of how the transcript was analyzed using the framework is presented. The
session begins with:
1. NE: So what are you guys doing in your first steps?
2. Ann: Drawing a picture and labeling stuff.
3. NE: And labeling stuff?
4. Ann: Yeah
5. Ali: I’m getting an equation for the volume, and yeah
6. Ben: Oh, you’ve gone three dimensional.
There are a few interesting things to note in the first five lines of the transcript. Ann and Ben
immediately begin by drawing diagrams. Ali drew a diagram, jumped to finding an equation for
the volume of the trough, and computed the volume of the trough.
Table 2:
Summary Table for Draw a Diagram - Trough Problem Phase
Draw a diagram (lines 1-148)
Solution
Artifacts
Labeled diagram
Content
Knowledge
Geometry
• Know what an isosceles triangle is.
• Volume of triangular prism.
Variable
• Label everything that is unknown with a variable.
o Each student labeled the height, width, and length.
o Ann labeled the height of the water with x−1 . (lines 51, 53, 55)
o Ann believes that h represents two things, the height of the water and the
height of the trough. (line 76)
o The researcher clarifies the problem statement that h represents the height of
the water in the trough. (line 81)
o The students label the height of the trough with one variable which is equal
to 1, but the height of the water in the trough with h.
Function
• Ali wrote down a formula for the volume of the trough. (line 5) She also computed
the total volume that the trough can hold. (line 25) Ann and Ben followed her lead
and computed it for themselves. (lines 26-41) When asked how that will help them,
they did not have an answer.
Derivative
• Ann identified that she is looking for delta h over delta t. (line 20)
Mental
Model • Ben initially drew a 2-dimensional triangle, but noticed “oh you’ve gone three
dimensional” when he looked at Ann’s and Ali’s diagrams. (line 6) Then, he changed
his diagram to look like Ann’s. However, the researcher suggested that they consider
just the cross-section in line 95.
• Ann identified that she wanted to find t
h
∆∆
. (line 20)
• When prompted to identify which quantities are changing, the students quickly
identified, volume, height, and time. Ali then suggested the width. (lines 62-75)
Heuristics • Label everything that is unknown with a variable.
• Check your work against your neighbors’.
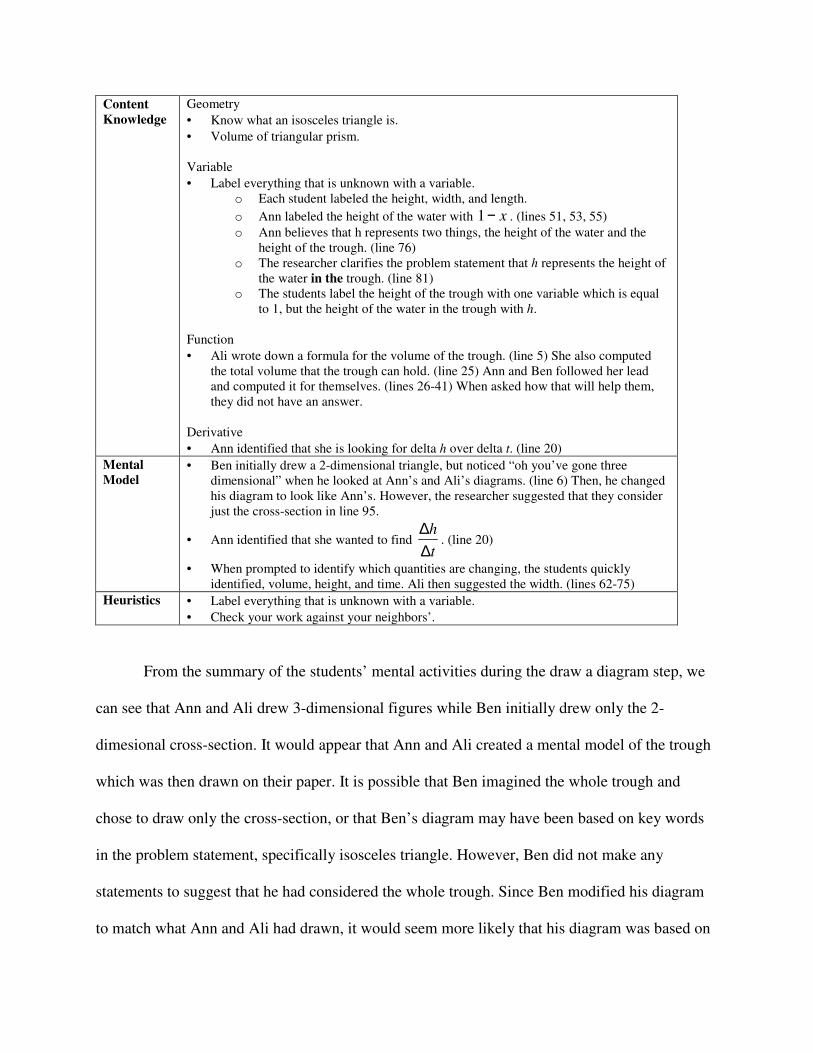
From the summary of the students’ mental activities during the draw a diagram step, we
can see that Ann and Ali drew 3-dimensional figures while Ben initially drew only the 2-
dimesional cross-section. It would appear that Ann and Ali created a mental model of the trough
which was then drawn on their paper. It is possible that Ben imagined the whole trough and
chose to draw only the cross-section, or that Ben’s diagram may have been based on key words
in the problem statement, specifically isosceles triangle. However, Ben did not make any
statements to suggest that he had considered the whole trough. Since Ben modified his diagram
to match what Ann and Ali had drawn, it would seem more likely that his diagram was based on
key words in the problem statement. Each student labeled the dimensions of the trough with the
appropriate numeric value. The students accessed their content knowledge of geometry to write
down the formula for the volume of the trough and computed the maximum volume of the
trough. However, they could not elaborate on how they thought that this would help them. As
they proceeded to label their diagrams with variables, Ann appeared to have the same difficulty
she had in the plane problem. She could not let h represent the height of the water in the trough
and the height of the trough. Thus, she labeled the height of the water with x−1 , where x
represented the difference between the height of the water and the top of the trough.
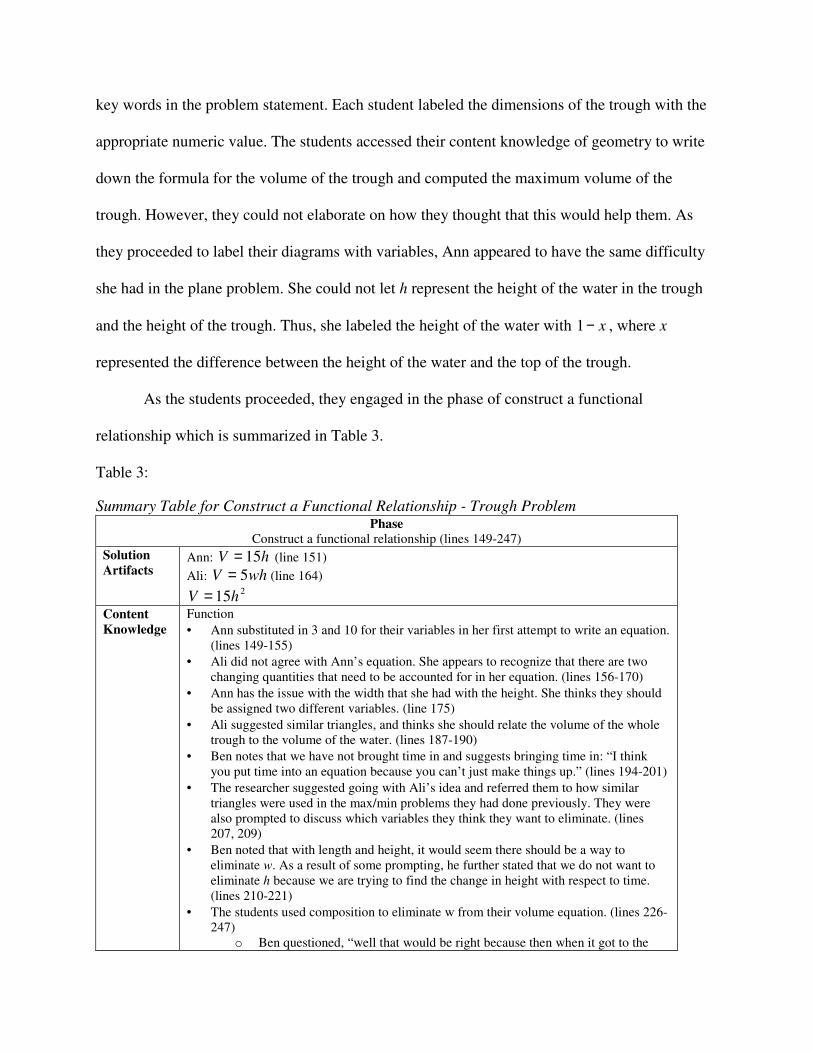
As the students proceeded, they engaged in the phase of construct a functional
relationship which is summarized in Table 3.
Table 3:
Summary Table for Construct a Functional Relationship - Trough Problem
Phase
Construct a functional relationship (lines 149-247)
Solution
Artifacts Ann: hV 15= (line 151)
Ali: whV 5= (line 164) 215hV =
Content
Knowledge
Function
• Ann substituted in 3 and 10 for their variables in her first attempt to write an equation.
(lines 149-155)
• Ali did not agree with Ann’s equation. She appears to recognize that there are two
changing quantities that need to be accounted for in her equation. (lines 156-170)
• Ann has the issue with the width that she had with the height. She thinks they should
be assigned two different variables. (line 175)
• Ali suggested similar triangles, and thinks she should relate the volume of the whole
trough to the volume of the water. (lines 187-190)
• Ben notes that we have not brought time in and suggests bringing time in: “I think
you put time into an equation because you can’t just make things up.” (lines 194-201)
• The researcher suggested going with Ali’s idea and referred them to how similar
triangles were used in the max/min problems they had done previously. They were
also prompted to discuss which variables they think they want to eliminate. (lines
207, 209)
• Ben noted that with length and height, it would seem there should be a way to
eliminate w. As a result of some prompting, he further stated that we do not want to
eliminate h because we are trying to find the change in height with respect to time.
(lines 210-221)
• The students used composition to eliminate w from their volume equation. (lines 226-
247)
o Ben questioned, “well that would be right because then when it got to the

maximum the width would be three.” (line 238, 240)
o After setting up her ratio, Ann stated, “then you cross multiply and you get w
equals 3 h.” (line 230)
o Ann used substitution and stated, “so now the volume equation’s like all in
complete terms of h not that that’s anything but it is.” (line 243)
Geometry
• Rectangular prism
o The students know what the volume of a rectangular prism is.
• Ali asked, “could we find the the angle using the whole trough the angle of this so we
can use a different equation to like so we can find w with height in the other value?”
This did not lead to any discussion. (line 224)
• Ann suggested, “you could have um 3 over w equals one over h for the equation of
the ratios.” (line 226)
Mental
Model • Ali again identified that the width of the water was changing, but now has a context to
discuss why it is important. (line 159)
Heuristics • Ali appears to have some heuristic that causes her to always think about angles (line
224). She also brought up angles in the plane problem.
• Compare your work to your neighbors’.
The students spent the majority of their time for this problem determining an appropriate
functional relationship. Ann substituted 3 and 10 into her volume formula with which Ali
disagreed. Ali again stated that the width of the water is a changing quantity, so one cannot
substitute in that value. She had noted that the width of the water was changing earlier, but did
not have a context in which to discuss why it was important. Relating her mental model of the
problem situation to the algebraic representation gave Ali the context to discuss why the width of
the water was an important changing quantity. She could now identify that the width of the water
was part of the algebraic representation of the volume of the trough which could not be replaced
by a numeric value because it was not constant. Ali suggested using similar triangles to relate the
volume of the whole trough to the volume of the water in the trough. Thus, Ali accessed another
part of her content knowledge of geometry. Using similar triangles may be a heuristic Ali
developed as a result of solving max/min problems earlier in the semester. However, it is not
clear if she understands how they are useful and when they are appropriate because she later
suggests that they will allow her to determine angles. Ben thought that time had to be brought

into the function which may be the result of how the plane problem was solved in the previous
session. Recall that the students were able to solve the plane problem by explicitly expressing
each function in terms of time. The idea that each function must be explicitly represented in
terms of the independent and dependent variables suggests that the students’ understanding of
the concept of function is still developing. They do not appear to be able to think about each
variable as a function of time unless they have expressed it the form ( )tf .
The researcher encouraged the students to pursue Ali’s similar triangle approach and
referred them to the max/min problems they solved earlier in the semester. It was noted that in
solving extreme value problems, extra variables were frequently eliminated. This prompted them
to think about which variables should be eliminated. Ben concluded that w should be eliminated
because we were interested in the rate of change of the height with respect to time. Ann used
similar triangles to set up a proportional relationship and determined that hw 3= . Thus, the
students used composition to express the volume of the water in the trough in terms of height.
However, it was not clear to them that this would be useful.
After they had successfully related the variables in the problem with an algebraic
representation of the functions, the students continued with the phase of relate the rates.
Table 4:
Summary Table for Relate the Rates - Trough Problem
Phase
Relate the rates (lines 248 -315)
Solution
Artifacts
t
h
h
V
t
V
∆∆⋅
∆∆=
∆∆
, hh
V30=
∆∆
, h
t
V
t
h
30
∆∆
=∆∆
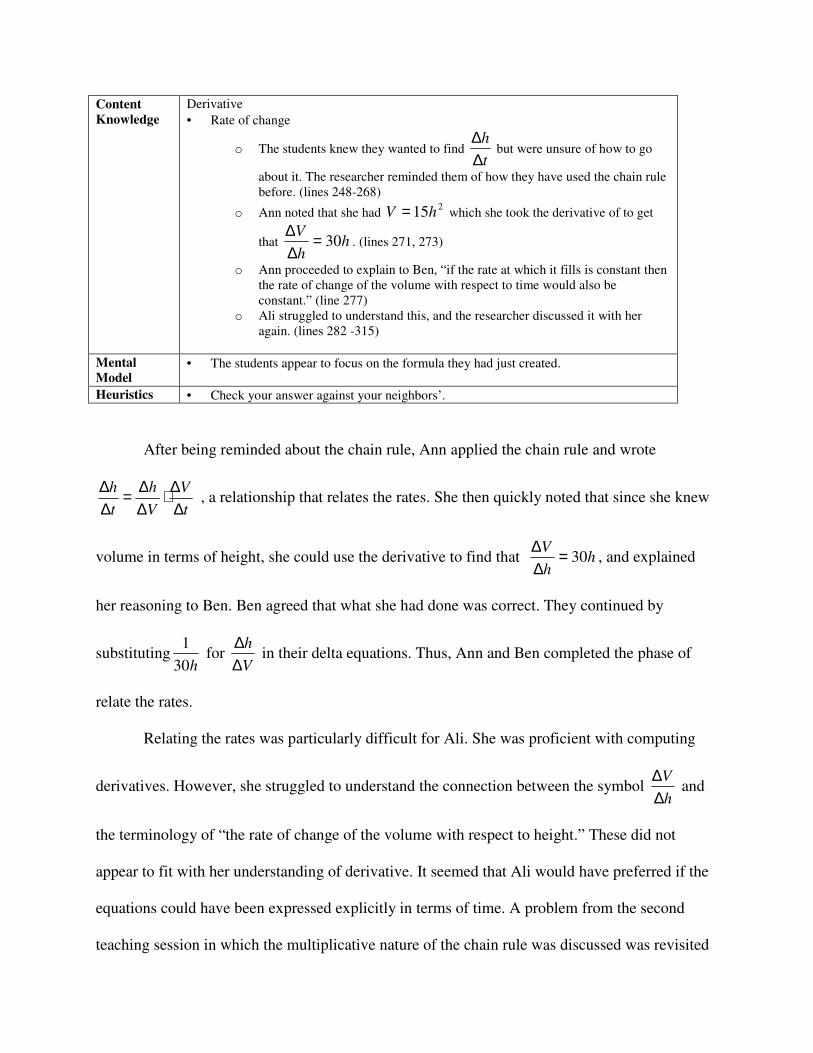
Content
Knowledge
Derivative
• Rate of change
o The students knew they wanted to find t
h
∆∆
but were unsure of how to go
about it. The researcher reminded them of how they have used the chain rule
before. (lines 248-268)
o Ann noted that she had 215hV = which she took the derivative of to get
that hh
V30=
∆∆
. (lines 271, 273)
o Ann proceeded to explain to Ben, “if the rate at which it fills is constant then
the rate of change of the volume with respect to time would also be
constant.” (line 277)
o Ali struggled to understand this, and the researcher discussed it with her
again. (lines 282 -315)
Mental
Model • The students appear to focus on the formula they had just created.
Heuristics • Check your answer against your neighbors’.
After being reminded about the chain rule, Ann applied the chain rule and wrote
t
V
V
h
t
h
∆∆⋅
∆∆=
∆∆
, a relationship that relates the rates. She then quickly noted that since she knew
volume in terms of height, she could use the derivative to find that hh
V30=
∆∆
, and explained
her reasoning to Ben. Ben agreed that what she had done was correct. They continued by
substitutingh30
1 for
V
h
∆∆
in their delta equations. Thus, Ann and Ben completed the phase of
relate the rates.
Relating the rates was particularly difficult for Ali. She was proficient with computing
derivatives. However, she struggled to understand the connection between the symbol h
V
∆∆
and
the terminology of “the rate of change of the volume with respect to height.” These did not
appear to fit with her understanding of derivative. It seemed that Ali would have preferred if the
equations could have been expressed explicitly in terms of time. A problem from the second
teaching session in which the multiplicative nature of the chain rule was discussed was revisited

to allow her to identify how it is not necessary to be able to explicitly express the functions in
terms of time.
Thus, the students had created a general algebraic representation for the relationship
between the rates in the trough problem as stated. The researcher then provided them with
numeric values for some of the unknown quantities which they successfully substituted into their
equation.
After the students had completed the problem, they were asked how the problem would
have been different if they had been asked to find the rate of change of the width of the water
with respect to time. Without hesitation, they all answered that they would have solved for h
instead of w in the proportional relationship that they had defined.
At the end of this session, the students were asked how they would tell someone else how
to solve a problem like this. Ann summarized the problem solving process as: draw a picture,
label everything, find a formula for the volume, eliminate variables if you can, and draw yourself
a delta equation. Ann further explained the delta equation:
1. Ann: They show you the composition of what, what you’re trying to find is, like it shows you the steps of what you’re actually trying to find
2. NE: Ok
3. Ann: Like delta h over delta t is delta h over delta v times delta v over delta t, and those are like the steps you have to get to, and the things you have to figure out before you, so you can find out what the rate of change is
This suggests that Ann uses the chain rule to relate the rates in an equation which then guides her
solution process.
The students were asked to write up the solution to this problem as homework. Ben did
not turn it in as he did not complete the study beyond this point. Ali and Ann turned in their
solutions which are presented in Figures 3 and 4.
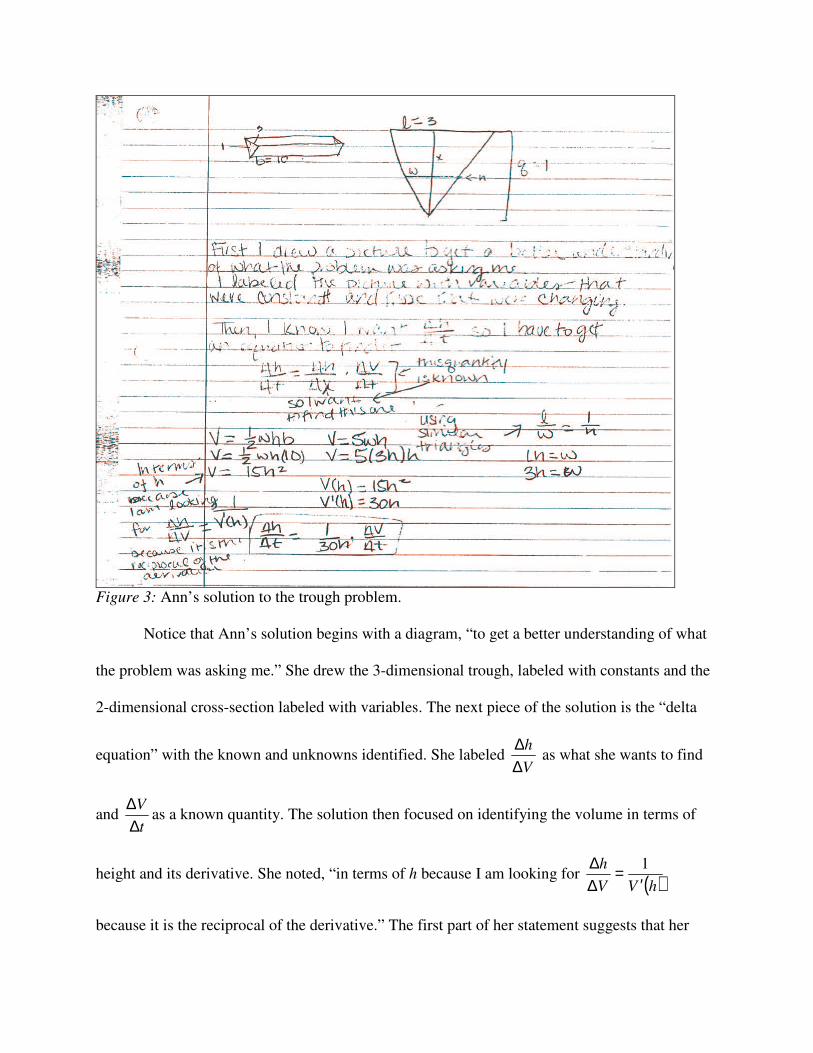
Figure 3: Ann’s solution to the trough problem.
Notice that Ann’s solution begins with a diagram, “to get a better understanding of what
the problem was asking me.” She drew the 3-dimensional trough, labeled with constants and the
2-dimensional cross-section labeled with variables. The next piece of the solution is the “delta
equation” with the known and unknowns identified. She labeled V
h
∆∆
as what she wants to find
and t
V
∆∆
as a known quantity. The solution then focused on identifying the volume in terms of
height and its derivative. She noted, “in terms of h because I am looking for ( )hVV
h
′=
∆∆ 1
because it is the reciprocal of the derivative.” The first part of her statement suggests that her

concept of rate may now include some sort of relationship between the independent and
dependent variables. However, the second because indicates that the relationship is not fully
developed.
Figure 4: Ali’s solution to the trough problem.
Ali’s solution is not as clear as Ann’s. It seems that Ali is just trying to remember the
steps in a procedural manner to obtain a numeric solution. Ali attempted to recall the numeric
values that were used to illustrate how a numeric solution might be found. She incorrectly
recalled that 5.0=∆∆
t
h(0.5 had actually been given as the height of the water in the trough).
Thus, she solved for the height. This suggests that she had not yet recognized the basic pattern of
the problems, solve for the unknown rate. In contrast, Ann stopped when she had successfully
answered the question as stated in the original problem.
Another interesting difference between Ann and Ali’s solutions is the voice they chose to
use. Ann wrote in the first person, “I did…” and “I know…” This suggests that Ann is taking
ownership of the solution and the mathematics. Ali wrote in the second person, “You do…” This
suggests that Ali is not taking ownership of the solution nor the mathematics. Rather, it is merely
a procedure that must be carried out. Another explanation for Ali’s choice to use the commands
could be her “inner teacher.”
Conclusions
For the students in this study, their conceptual knowledge appears to be
compartmentalized. They could recall geometric formulas, but they could not relate them to their
function knowledge to determine that they needed, say, volume as a function of height. This
suggests that their knowledge of geometry is segmented from their knowledge of functions. This
calls for an increased effort on the part of educators to ensure that students build connections
between concepts. Students should also be encouraged to construct mental models rather just
mental images. The use of the computer program to visualize related rates problem situations
appears to have fostered a slightly better ability to engage in covariational reasoning. While the
students did not usually address the nature of the changing quantities of their own accord, they
were readily able to answer most questions the researcher asked about them. In Table 3, Ali’s
mental model developed so as to incorporate why the width of the water as a changing quantity
was important and related to the equation for volume.
One of the most interesting results was the emergence of the “write a delta equation” as a
step in the students’ solution process. Knowing the chain rule and using it to construct a “delta
equation” may be a natural way to understand what is happening in a related rates problem. This
step appeared to help the students identify the known rate, the unknown rate, and the appropriate
functional relationship between the variables. Indeed, even Adam, the mathematician who had
not taught calculus for the longest time, used a “delta equation” to relate the rates. Adam used
basic principles of calculus to solve these problems. He knew the chain rule and wrote out an
equation that related the rates he had. Then, he identified either a numeric value or a function for
each rate and made the appropriate substitutions. Clearly, the chain rule equation approach
appears to be a useful tool for the related rates problem solver.
Another particularly interesting finding of the study was the role of time as a variable.
While the mathematicians could image each variable as a function of time and operate on
functional relationships without expressing them as explicit functions of time, the students could
not. For example, the mathematicians expressed the functional relationship in the plane problem
with 222cba =+ , but they were actually thinking about it as ( )[ ] ( )[ ] ( )[ ]222
tctbta =+ . In
contrast, the students needed to see time explicitly represented as a variable. The computer
program appeared to foster the students’ recognition of time as a variable in the problem.
However, in the plane problem, they wanted to express each variable as an explicit function of
time and capitalize on their knowledge of distance equals rate times time. The students solved
the problem using this approach and then the researcher related it to the traditional implicit
differentiation with respect to time approach. The researcher did not encourage the students to
pursue this approach after the first problem. While each problem may be solved by representing
the functions as explicit functions of time, the algebra can get very involved and lead to errors.
On the other hand, it could be an even more natural approach to solving related rates problems
and needs to be studied in future research.
References
Carlson, M. (1998). A Cross-Sectional Investigation of the Development of the Function
Concept. Research in Collegiate Mathematics Education III, Conference Board of the
Mathematical Sciences, Issues in Mathematics Education, 7, 114-163.
Carlson, M., & Bloom, I. (2005). The Cyclic Nature of Problem Solving: An Emergent
Multidimensional Problem-Solving Framework. Educational Studies in Mathematics, 58,
45-75.
Carlson, M., Jacobs, S., Coe, E., Larsen, S., & Hsu, E. (2002). Applying Covariational
Reasoning While Modeling Dynamic Events: A Framework and a Study. Journal for
Research in Mathematics Education, 33(5), 352-378.
Clark, J. M., Cordero, F., Cottrill, J., Czarnocha, B., Devries, D. J., St. John, D., et al. (1997).
Constructing a Schema: The Case of the Chain Rule? Journal of Mathematical Behavior,
16(4), 345-364.
Engelke, N. (2004). Related Rates Problems: Identifying Conceptual Barriers. Paper presented
at the 26th Annual Conference of the North American Chapter of the International Group
for the Psychology of Mathematics Education.
Engelke, N. (2007a). A Framework to Describe the Solution Process for Related Rates Problems
in Calculus. Paper presented at the 29th Annual Meeting of the North American Chapter
of the International Group for the Psychology of Mathematics Education.
Engelke, N. (2007b). Students’ Understanding of Related Rates Problems in Calculus.
Unpublished Doctoral Dissertation, Arizona State University, Tempe, AZ.
Johnson-Laird, P. N. (1983). Mental Models. Cambridge: Press Syndicate of the University of
Cambridge
Martin, T. S. (1996, October 12-15). First-Year Calculus Students' Procedural and Conceptual
Understandings of Geometric Related Rate Problems. Paper presented at the
International Group for the Psychology of Mathematics Education, North American
Chapter, Panama City, FL.
Martin, T. S. (2000). Calculus Students' Ability to Solve Geometric Related-Rates Problems.
Mathematics Education Research Journal, 12(2), 74-91.
Saldanha, L. A., & Thompson, P. W. (1998). Re-thinking Covariation form a Quantitative
Perspective: Simultaneous Continuous Variation. Paper presented at the Annual Meeting
of the Psychology of Mathematics Education - North America, Raleigh, N. C.: North
Carolina State University.
Simon, M. A. (1996). Beyond Inductive and Deductive Reasoning: The Search for a Sense of
Knowing. Educational Studies in Mathematics, 30, 197-210.
White, P., & Mitchelmore, M. (1996). Conceptual Knowledge in Introductory Calculus. Journal
for Research in Mathematics Education, 27(1), 79-95.