developing test methods for the evaluation of scooter ... · ii developing test methods for the...
TRANSCRIPT

Developing Test Methods for the Evaluation of Scooter Performance in Winter Conditions
by
Varun Ohri
A thesis submitted in conformity with the requirements for the degree of Master of Applied Science in Biomedical Engineering
Institute of Biomaterials and Biomedical Engineering University of Toronto
© Copyright by Varun Ohri 2013

ii
Developing Test Methods for the Evaluation of Scooter
Performance in Winter Conditions
Varun Ohri
Master of Applied Science in Biomedical Engineering
Institute of Biomaterials and Biomedical Engineering
University of Toronto
2013
Abstract
Electric mobility scooters are increasing in popularity and are used extensively by individuals
with mobility impairments to conduct activities of daily living. Scientific literature on the safety
and efficacy of scooters in winter conditions is sparse and the current technical standards for
scooters do not mandate testing in these conditions. This study paves the way for more rigorous
standard testing by: 1) Describing a novel, motion-capture based method to quantify the tractive
performance of scooters; 2) Describing methods to create a wide variety of simulated winter
conditions; 3) Presenting pilot-test results of a scooter driven in these winter conditions. The
outcomes of this study are significant because it is the first study to evaluate the performance of a
scooter in winter conditions. Furthermore, it constitutes the first phase of a broader initiative to
develop a rigorous, new winter test method for scooters and drive improvements in safety,
performance and design.

iii
Acknowledgments
First and foremost, I would like to acknowledge the support of my supervisor Dr. Geoff Fernie.
Under his supervision, I was given the opportunity to be part of something very exciting. The
creation of CEAL is the culmination of Geoff’s long standing vision for rehab research. The
facility is part of a larger environment in which prevention is emphasized as being the best cure
and the term ‘multi-disciplinary’ truly comes to life. I have been afforded the opportunity to
work in this excellent facility with world-class colleagues, and have learned and grown
immensely in my time under Geoff. My views on rehabilitation and the role that engineers can
play in it have been changed forever. For these reasons and more, I am truly blessed to have
worked with him. I sincerely hope that he will remain a mentor and an inspiration to me for years
to come.
I would like to thank my committee members: Dr. Karl Zabjek and Dr. Brian Maki for
accommodating me into their busy schedules and providing a fresh perspective and constructive
feedback during all of our meetings.
I would like to acknowledge funding contributions from the Canadian Institutes of Health
Research (CIHR) and the Toronto Rehabilitation Institute (TRI). This research was also
supported by funding from the National Institute on Disability and Rehabilitation Research
(NIDRR) through the Rehabilitation Engineering Research Center on Universal Design and the
Built Environment (grant #H133E100002), a partnership with the Center for Inclusive Design
and Environmental Access (IDeA). I would also like to thank Shoppers Home Healthcare for
their in-kind donation of the Fortress 1700 DT scooter that was used in this study.
I am indebted to members of the Winter Team for their support and methodological advice.
Thank you Jen, Yue and Kathleen! I could not ask for cooler colleagues.
Thank you to the team of CEAL engineers: Susan, Larry, and Bruce, for ensuring that CEAL and
dozens of other devices ran smoothly. I am sincerely grateful for all the time you spent (often
after-hours) to make this happen.
Thank you to Colin H. for your invaluable help with designing and building things. You started
out providing friendly advice and eventually ended up as an integral part of this project!

iv
For your contributions and generally making the lab a great place to be for two years, thank you
Tilak, Pam, Emily, Cesar, Dan V., Vicki, Robert, Rowa, Alison, Dan S., Steve P., Adam, Colin
B. and Aaron. You were great colleagues but more importantly, you were all fantastic friends.
For all the logistical and scheduling support you provided, thank you Lois, Aoife and Shoshana. I
would never have been able to schedule a meeting, pay a bill or receive a pay-check without you.
A special thank you to my friends, Justin and Kevin for coming in on weekends to help me
collect data and for reminding me that there is a life outside of school!
Last but certainly not least, I would like to thank my family for visiting countless times and for
maintaining a constant supply of food and support for two years. I would not be where I am
today without your help and guidance. Thank you Anitha, Vimal and Anu!

v
Table of Contents
Acknowledgments .......................................................................................................................... iii
Table of Contents ............................................................................................................................ v
List of Tables ............................................................................................................................... viii
List of Figures ................................................................................................................................ ix
List of Abbreviations ...................................................................................................................... x
List of Appendices ......................................................................................................................... xi
Chapter 1: Introduction ................................................................................................................... 1
1.1 Motivation and Rationale .................................................................................................... 1
1.2 Background Information and Literature Review ................................................................ 2
1.2.1 On the need for mobility scooters ........................................................................... 2
1.2.2 Accidents and injuries in scooter users ................................................................... 3
1.2.3 Challenges faced by WMA users in winter ............................................................ 4
1.2.4 Regulations and Standards for Electric Scooters .................................................... 6
1.2.5 Tribology and Classification of Winter Surfaces .................................................... 9
1.2.6 Test Methods for Winter Tires .............................................................................. 11
Chapter 2: A Novel Method to Measure Coefficient of Friction .................................................. 13
2.1 Introduction ....................................................................................................................... 13
2.1.1 Conceptual Quantification of Tractive Performance ............................................ 13
2.1.2 Physical Capture of Scooter Performance ............................................................ 13
2.2 Methods ............................................................................................................................. 14
2.2.1 Instrumentation ..................................................................................................... 14
2.2.2 Scooter .................................................................................................................. 16
2.2.3 Surface Conditions ................................................................................................ 16
2.2.4 Protocol ................................................................................................................. 16
vi
2.2.5 Data Analysis ........................................................................................................ 17
2.3 Results ............................................................................................................................... 18
2.4 Discussion ......................................................................................................................... 21
2.4.1 Significance ........................................................................................................... 21
2.4.2 Limitations ............................................................................................................ 22
2.5 Conclusion ........................................................................................................................ 22
Chapter 3: Pilot Testing of Scooter on Winter Surfaces ............................................................... 23
3.1 Introduction ....................................................................................................................... 23
3.1.1 Simulating Realistic Winter Conditions in WinterLab ......................................... 23
3.1.2 Quantifying Scooter Performance in Winter Conditions ...................................... 24
3.2 Methods ............................................................................................................................. 24
3.2.1 Creation of Winter Conditions .............................................................................. 24
3.2.2 Characterization of Winter Conditions ................................................................. 30
3.2.3 Measuring Scooter Performance ........................................................................... 32
3.2.4 Protocol ................................................................................................................. 37
3.2.5 Data Analysis ........................................................................................................ 37
3.3 Results and Discussion ..................................................................................................... 38
3.3.1 Ice .......................................................................................................................... 38
3.3.2 Snow ..................................................................................................................... 39
3.3.3 Scooter Performance ............................................................................................. 42
3.3.4 Revised Table of Conditions ................................................................................. 45
3.3.5 Limitations ............................................................................................................ 46
3.4 Conclusion ........................................................................................................................ 47
Chapter 4: Conclusion ................................................................................................................... 48
4.1 Conclusion ........................................................................................................................ 48
4.2 Future Work ...................................................................................................................... 49

vii
References ..................................................................................................................................... 50
Appendix A ................................................................................................................................... 56
Copyright Acknowledgements ...................................................................................................... 65
viii
List of Tables
Table 2.3-1: Statistical comparison of measurement methods ..................................................... 21
Table 3.2-1: ASTM Recommended Course Characteristics [57], [58] ........................................ 25
Table 3.2-2: Definition and description of observed 𝝁 values ..................................................... 37
Table 3.3-1: Surface and ambient room temperatures recorded during testing ............................ 39
Table 3.3-2: Snow hardness readings vs. number of trials ........................................................... 41
Table 3.3-3: Summary of scooter performance on snow, ice and dry ice .................................... 42
Table 3.3-4: Revised recommendations for course characteristics ............................................... 45
Table 3.3-5: Summary of revisions to ASTM recommended conditions ..................................... 45
ix
List of Figures
Figure 1.2-1: Relationship between Coefficient of Friction and Diameter of Grains [45] ........... 10
Figure 2.2-1: Marker placement on scooter tires and body .......................................................... 15
Figure 2.2-2: Overhead view of test setup .................................................................................... 15
Figure 2.2-3: Vinyl test surface clamped to force plates .............................................................. 17
Figure 2.3-1: Sample plot of raw acceleration from motion capture (top) and horizontal forces
from motion capture and force plates (bottom) ............................................................................ 19
Figure 2.3-2: Sample CoF curves generated by force plates versus motion capture .................... 20
Figure 2.3-3: CoF readings from force plates vs. motion capture across all test surfaces ............ 20
Figure 3.2-1: Picture of the dry (top) and wet (bottom) ice floor in WinterLab .......................... 26
Figure 3.2-2: Snow Tech all-weather snowmaker producing snow (cooler absent) ..................... 28
Figure 3.2-3: Hard packed snow base in WinterLab .................................................................... 29
Figure 3.2-4: Custom snow leveling tool being used to create flat driving surface ..................... 29
Figure 3.2-5: CTI Penetrometer .................................................................................................... 31
Figure 3.2-6: Overhead view of test setup in WinterLab (not to scale) ........................................ 33
Figure 3.2-7: Marker placement and vector definitions used to calculate speed of wheels ......... 34
Figure 3.3-1: Snow hardness readings vs. number of trials .......................................................... 40
Figure 3.3-2: Tractive performance of scooter on snow ............................................................... 43
Figure 3.3-3: Tractive performance of scooter on dry ice ............................................................ 44
Figure 3.3-4: Tractive performance of scooter on wet ice ............................................................ 44

x
List of Abbreviations
ACCC Australian Competition and Consumer
Commission
ANSI American National Standards Institute
ASTM American Society for Testing and Materials
CCMTA Canadian Council of Motor Transport
Administrators
CEAL Challenging Environment Assessment
Laboratory
CEN European Committee for Standardization
CIHR Canadian Institutes of Health Research
CMS Centre for Medicare and Medicaid Services
CoF Coefficient of Friction
FDA Food and Drug Administration
Hz Hertz
ISO International Organization for
Standardization
RESNA Rehabilitation Engineering and Assistive
Technology Society of North America
SWE Snow Water Equivalent
TRI Toronto Rehabilitation Institute
VA Veterans Administration
WMA Wheeled Mobility Aid
xi
List of Appendices
Appendix A ................................................................................................................................... 56
A1 Introduction ....................................................................................................................... 56
A2 Tension Load Cell Testing ................................................................................................ 56
A3 Incline Testing .................................................................................................................. 59
A4 Driveway Panel Instrumented with Load Cells ................................................................ 62
1
Chapter 1 Introduction
1.1 Motivation and Rationale
Electrically powered Wheeled Mobility Aids (WMAs) are used extensively by individuals with
mobility limitations [3]. These devices are either classified as “electric wheelchairs” or “electric
scooters”. Electric wheelchairs are 4-wheeled devices equipped with joystick controls while
electric scooters are 3 or 4-wheeled devices with a handlebar steering apparatus [4], [5]. The
estimated numbers of scooter and wheelchair users are substantial. Over 1.7 million Americans
rely on these devices as their primary mode of transport. This translated to over $245 million
dollars in scooter sales in the year 2000 alone [3], [6]. A Statistics Canada survey in 2006
indicated that over 66,000 Canadians use scooters and over 36,000 use electric wheelchairs [7].
Scooter use is predicted to grow substantially in the coming years with sustained growth as high
as 7% being reported [6]. While already true in Canada, the number of scooter users is predicted
to eventually exceed the number of power wheelchair users in the United Kingdom and the
United States [8].
Canada and many other countries in the Northern Hemisphere experience winters that last for
several months every year. Winter is challenging for individuals with mobility limitations and
WMA users are no exception [9]. A survey study of spinal cord injury patients conducted in
Japan found that 90% of manual wheelchair users needed to use their wheelchairs in the winter
for a range of activities such as shopping and attending medical appointments. Of these,
approximately 65% of users reported encountering potentially hazardous situations such as
slipping on an icy road, with approximately 42% of users risking collisions with motor vehicles
[10]. This study is one of a handful which examines the challenges of using WMAs during the
winter and highlights the risks facing WMA users worldwide. It is also surprising that despite the
seemingly widespread use of WMAs in the winter, the body of knowledge concerning their
usability and safety is extremely limited. For instance, no biomechanical studies on wheelchair
propulsion in weather conditions currently exist [9]. There is a need for more rigorous testing
and improvement of the standards governing WMA devices, particularly mobility scooters, in
winter conditions. The objectives of this study are to develop the methods to create winter
conditions for testing and also to conduct tests with one scooter in these conditions.

2
1.2 Background Information and Literature Review
1.2.1 On the need for mobility scooters
Canada is on the cusp of a large demographic shift. In 2006, approximately one third of
Canadians aged 65 or older had a mobility disability [7]. Between 2006 and 2011, the number of
Canadians aged 65 and older increased by 14% and now stands at close to 5 million [11], [12].
Between 2009 and 2036, the number of adults aged 65 or older is expected to double to 10
million [13]. The ‘baby boom’ is larger in Canada than other G8 nations and is expected to have
a profound impact on the healthcare system [14]. This is highly relevant in the context of
mobility because walking ability diminishes with age. Brandt et al. [5] estimate that 20%-25% of
older adults aged 67-79 years cannot walk more than 400m without difficulty and the numbers
rise sharply to 39%-58% for adults aged 79 and older.
Older adults who lack the ability to walk long distance or drive a car will seek out alternatives
for their mobility needs. There are three main options for wheeled mobility: 1) manual
wheelchairs, 2) motorized/powered wheelchairs and 3) motorized/powered scooters [15]. For
many older adults, using a manual wheelchair is infeasible either owing to the physical exertion
that it entails or the reliance on a caregiver for support [16]. In general, power wheelchairs and
power scooters are a better choice for people with limited upper body strength and mobility
because they require minimal exertion and caregiver assistance. Wheelchairs and scooters are
differentiated primarily by their control mechanisms. Wheelchairs are controlled via a joystick
whereas scooters are controlled using a tiller system, with two handlebars for throttle control and
manual directional control [4]. The distinction between the two is expected to blur. In their paper
on trends in wheeled mobility technologies, Cooper et al. [6] comment that “scooters and electric
powered wheelchairs are going to become more similar.” They assert that “the demand for
mobility devices that do not look like wheelchairs and that can provide both indoor and outdoor
mobility is creating innovation in the marketplace. [6]” Mobility scooters in particular “are
starting to be viewed by older people as an alternative to the motor vehicle rather than only as an
aid for those who have trouble walking any distance due to a physical disability or a health
condition. [17]” With the steady growth in popularity of mobility scooters comes the need for
improved safety during a wide range of functional activities [6], [8].

3
Disability, poor health or the loss of the ability to drive a car can quickly reduce the options for
autonomy and mobility for an older adult. Driving in particular has been linked with identity and
a sense of independence [18]. The cessation of driving is a strong predictor of depressive
symptoms in older adults and has been associated with downward social mobility and a reduction
in quality of life [18], [19]. Brand et al. [5] found the literature on WMA usage outcomes to be
scarce and the few studies that did exist indicated that users felt that their mobility problems
were not being solved as much as they had expected, in some cases due to physical,
environmental barriers. For instance, WMA use was found to be significantly lower during the
winter. Nevertheless, the vast majority of older adults who use WMA considered their device to
be important, that it gave them independence and all of them use it. On the whole, the use of
WMAs is beneficial because it enables users to stay active longer and mitigates restrictions on
social participation stemming from disability [5].
A study by Davies et al. examining the changes in quality of life after the administration of
WMA devices concluded that, even though participant perception of overall health,
independence and social life did not appear to improve, perceptions of mobility, quality of life
and pain/discomfort, did improve [1]. Evans et al. found that WMAs were useful for most older
adults but these individuals only made moderate use of the chair outdoors because of outdoor
barriers and insecurity about chair safety, among other reasons [2]. These are a few of the studies
that underscore the benefits of WMAs and the need for improved safety testing and standards.
1.2.2 Accidents and injuries in scooter users
Data describing the incidence of accidents and injuries in scooter users in Canada are non-
existent. There are many potential reasons for this lack of information but chief among them are
lack of reporting and lack of research on these accidents. A 2010 report on personal mobility
devices by the Canadian Council of Motor Transport Administrators (CCMTA) points out that
there are no major sources for scooter safety data and accident statistics in Canada [20].
Anecdotal stories of injuries and fatalities occasionally appear in mainstream media [21], but in
general, there is a lack of public awareness. The only formal study focused on scooter use in
Canada is a survey study by Steyn and Chan [22] from Abbottsford, British Columbia. They
found that 30% of respondents had been in an accident with their scooters and that the numbers
are probably higher due to near misses and minor accidents that went unreported.
4
While relatively obscure in North America, scooter safety has received more attention overseas,
particularly in Australia and the UK. A study from the Australian state of Victoria found that
there were 151 hospital-treated injury cases related to scooters from 2000-2005. The number of
injury cases had doubled from 2000-2001 to 2004-2005 [17]. A separate study commissioned by
the Australian Competition and Consumer Commission (ACCC) [23] sought to examine injury
data of motorized mobility devices. The study written by Gibson et al. found 442 reported
scooter fall injury hospitalizations in Australia between 2006 and 2008. In Victoria alone, the
frequency of emergency department admissions as a result of scooter accidents had increased
approximately 255% over a 10 year period. Furthermore, between 2000 and 2010, there were 62
fatalities related to mobility scooters. In people under the age of 80, the largest proportion of
these deaths was a result of falls. There was strong support from scooter users who participated
in the study for a set of standardized design and safety guidelines. Furthermore, many users
raised concerns about the wide variability in scooter designs which was believed to contribute to
poor scooter selection by some older adults [23]. Many of these concerns with general scooter
safety have been picked up and circulated by print media sources in Australia [24], [25].
In the UK, the advent of mobility scooters resulted in an inquiry by the House of Commons
Transport Committee. Much like their counterparts in Canada, the committee noted that there
was a lack of “hard evidence, beyond such anecdotal reports, about the extent of accidents and
injuries involving mobility scooters. [26]” The emergence of scooters has been picked up by
mainstream media in the UK as demonstrated by several news articles listed in the committee’s
report.
Injuries sustained as a result of falls are a serious burden on scooter users as well as the
healthcare system. There have already been calls for better design and safety guidelines
governing scooters. With our study, we are looking to address these calls, particularly in the
context of challenging Canadian winters. By doing so, we hope to lower the risk of injury for the
ever growing population of scooter users.
1.2.3 Challenges faced by WMA users in winter
As mentioned previously, the body of knowledge on the safety and efficacy of wheelchairs and
scooters in winter conditions is very small. Few studies have examined the challenges of manual

5
and electrical wheelchairs in winter conditions and even fewer have examined scooters in any
capacity. These studies and their key findings are summarized below.
The most comprehensive study on mobility scooters and their usage has been written by Steyn
and Chan [22]. Their exploratory research study explored a breadth of topics pertaining to
scooter use including the profile of users, the activities they engage in and the challenges that
they face. The overarching conclusion of their study was that scooters are very important in
maintaining and enhancing the quality of life of their users and scooter use is something that
should be protected. Of particular relevance to were their findings on the winter usage of
scooters. Bearing in mind the small sample size and restricted geographical area of the survey,
they found a clear trend of diminished scooter use during winter months. There is no discussion
around the possible reasons for this decline in Steyn and Chan's report.
Lemaire et al. [9] conducted a study on manual wheelchair navigation on simulated snowy and
icy ramps. In their paper they note that prior wheelchair mobility studies have not factored in the
effects of snow, ice and rain on ramp traversal. Furthermore they state that no studies exist which
investigate the biomechanics of wheelchair propulsion in winter conditions. Some ramp angles
with snow were insurmountable without assistance. Even with grit to mitigate diminished
friction, study participants had problems with slipping wheels and had to utilize two railings to
propel themselves on the ramp, a strategy that may not be feasible for electric WMA users. The
study by Lemaire et al. makes the case for further exploring WMA mobility in winter conditions.
A study on manual wheelchairs in winter conditions was conducted in Hokkaido, Japan by
Shirado et al. [10]. Theirs was a cross-sectional, survey-based study which sought to gauge the
difficulties encountered by wheelchair users in the winter. To summarize the study’s findings,
90% of the spinal cord patients indicated that it was necessary for them to go outside in the
winter for shopping, doctor’s appointments or other activities. Approximately 64% of study
respondents who went out in the winter reportedly encountered hazardous conditions and 78% of
respondents said that wheels should be designed to minimize sinking in snow and slipping on
ice. This study and its findings are important because it is one study that examines the challenges
faced by WMA users in winter conditions. The most important finding of this study was that
individuals with mobility limitations need to go out during the winter for a variety of social and
personal activities and in doing so, they risk encountering challenging and hazardous conditions.

6
A large proportion of study participants (62%) indicated their willingness to invest in a device
specially designed for outdoor winter use. There is both a great need and great opportunity to
explore WMA safety and usability in the context of winter conditions.
This sentiment is echoed by Rodriguez et al. [27] who conducted a study to determine the effort
needed to climb accessibility ramps in a manual wheelchair. The authors indicate that the “study
did not consider climatic factors such as wind, ice, snow and rain, which may influence the effort
and safety involved in climbing, and even more in descending, an access ramp. Furthermore,
they state that “additional research dealing with climatic factors and the physical effort and risks
of descending access ramps is worthy of further exploration. [27]”
The studies discussed above are the few that have looked at the challenges of winter mobility for
WMA users in any capacity. The underlying message from these studies is clear; there is a need
to better understand and eventually improve the safety of WMAs for winter use. Doing so will
allow individuals who use these devices to participate in their communities and socialize year
round with the assurance that their devices have been tested and certified for safety.
1.2.4 Regulations and Standards for Electric Scooters
In Ontario, the Ministry of Health will partially reimburse the cost of a mobility scooter through
the Assistive Devices Program [28]. To be eligible for reimbursement, a registered Physical or
Occupational Therapist must assess functional mobility status and recommend a device
appropriate for an individual’s needs. In context, a scooter is classified as a “Class 1 Medical
Device” by Canada’s national regulatory body, Health Canada [29]. Class 1 Medical Devices are
regarded as posing the “lowest potential risk” [30] and are not required to be licensed for sale in
Canada. Under Ministry of Transportation guidelines, scooters are treated in the same way as
pedestrians and as such, “do not require registration, license plates, driver's license or vehicle
insurance. [31]“ Steyn and Chan [22] document similar regulations in Australia, the UK and
several other European countries.
Cooper [32] describes, in great detail, the evolution of standards in the United States dating back
to 1979. He describes the development of the first wheelchair standards by the Rehabilitation
Engineering and Assistive Technology Society of North American (RESNA) and subsequent
recommendations by the Veterans Administration (VA) and Food and Drug Administration

7
(FDA) to wheelchair manufacturers to use the standards. Today there are three organizations that
develop standards for wheelchairs and scooters:
1) Rehabilitation Engineering and Assistive Technology Society of North American &
American National Standards Institute (RESNA/ANSI)
2) International Organization for Standardization (ISO)
3) European Committee for Standardization (CEN)
All of these standards bodies have no governmental affiliation and as such, the standards that
they release are adopted voluntarily and are not legally binding until adopted [33]. However, an
uncertified device will face many challenges in the market and may not meet reimbursement
criteria laid out by organizations like the VA [33]. Despite this, Cooper described a “virtual flea
market for testing, as manufacturers and distributors pick and choose which tests to apply, create
their own tests, or even choose to ignore the issue altogether. [32]” The Centre for Medicare and
Medicaid Services (CMS) sought to address this issue by tightening the classification and coding
of wheelchairs and scooters in 2005 [32]. In Canada however, more needs to be done to ensure
that the standards are relevant and actually protecting wheelchair and scooter users. The next
section discusses the current standards in greater detail and outlines areas for improvement.
The RESNA/ANSI and ISO working groups collaborate very closely in the development of their
standards [32]. While there are minor differences in some of the RESNA/ANSI and ISO
standards, for this study we were primarily interested in the following two climatic testing
standards:
1. ISO 7176-9:2001: Wheelchairs – Climatic tests for electric wheelchairs [34]
2. RESNA WC-2, Section 9: Climatic tests for electrically powered wheelchairs
It is important to note that scooters are included under the umbrella of ‘wheelchairs’ by the
RESNA and ISO standards. In comparing Rentschler’s evaluation [35] of the RESNA standard
with the ISO standard, there appear to no major differences between the two standards. Devices
in Canada are governed by the ISO standards and hence further discussion will focus exclusively
on the ISO standards.
The ISO climatic wheelchair tests, in principle are designed to test the “functioning of the
wheelchair […] after it has been exposed to environmental conditions which are expected in
normal use, storage and transportation. [34]” The tests described within the standard are simple

8
and seek to evaluate whether the scooter will start and stop after being exposed to the cold and
whether it can traverse a preset course within 60 seconds. The efficacy of braking systems and
other dynamic tests on challenging surfaces like ice and snow are not included. More on test
surfaces is discussed in the next section.
The ISO 7176-13:1989 standard [36] titled ‘Determination of coefficient of friction of test
surfaces’ describes a method to measure the friction of the test surface on which the previously
described scooter tests are conducted. A five-kilogram steel block with a vulcanized rubber base
is dragged across the test surface several times to determine the coefficient of friction (CoF) of
the surface. If the calculated CoF is between 0.75 and 1.0, the surface is deemed acceptable for
testing. There are two weaknesses to this approach. Firstly, the range of CoF values being tested
(i.e. 0.75 to 1.0) does not adequately represent the range of CoF values a scooter user will
encounter in the real world. For example, a study on the CoF of various types of footwear on ice
and snow found that typical CoF values range from 0.065 on ice to 0.28 on ice coated with grit
(sand) [37]. A study of tires on real world snowy roads registered peak friction values ranging
from 0.3 to 0.4 [38]. Walus et al. [39] found CoF values of tires on ice to be as low as 0.019 and
as high as 0.95 in deep snow. The second weakness of the ISO approach is the method of
measuring friction. Gronqvist et al. [40] describe the existence of over 30 portable devices to
take slipperiness measurements. The American Society for Testing and Materials (ASTM)
F2508-11 Standard [41] lays out a method to validate and calibrate these tribometers and ensure
they operate within a set of uniform guidelines. The ISO method, while well-accepted, can be
subjective and prone to human error. For instance, the ISO standard instructs the researcher to
“pull the test block with the test rubber attached, by hand or machine, parallel to and over the test
surface through a distance of 200mm in approximately 10 seconds. [36]” This method is
adequate for simple, uniform surfaces like vinyl tile or concrete but may not be suitable for
surfaces like snow and ice. The properties of snow and ice are dependent on several factors such
as temperature, humidity, etc. The ISO standards are problematic in two main ways. First, they
do not include the range of surface conditions that are encountered in the real world. Second, the
methods to measure tractive coefficient that they use are inadequate for winter conditions. Our
objective is to address both these weaknesses in the ISO standards.

9
1.2.5 Tribology and Classification of Winter Surfaces
Tribology is the field of science dedicated to the study of “friction, wear and lubrication of
interacting surfaces in relative motion [42].” Studies of friction on snow and ice surfaces are
important because of their potential for widespread application to a wide variety of subjects
including skiing, automotive winter tires, off-road vehicles, etc. [43]. Tribological considerations
of winter surfaces are of central importance in the context of improving scooter test methods and
safety standards. In particular, automotive research is relevant to the study of scooters due to the
parallels in tire and surface interaction. Three topics of winter tribology are discussed below:
friction on snow and ice, tire traction on snow and ice and surface characterization.
The study of friction on snow and ice dates back to the early 1950s. Bowden’s work [44] in the
context of skiing is one of the first comprehensive examinations of the physics underlying
friction on snow and ice. Bowden proposed that low friction on snow and ice surfaces is a result
of pressure melting when temperatures are near 0°C. At low sliding speeds (few centimetres per
second), kinetic friction is very similar to static friction but at higher speeds kinetic friction was
significantly lower due to a lubricating water film formed through frictional melting [44].
Ericksson’s work [45] detailing the friction of runners on snow and ice is significant in its
investigation snow with various characteristics. He found that friction decreases on older snow
with coarse grains because snow did not conform as easily to the runner surface as new, finely
grained snow. Furthermore, he stated that the magnitude of sliding friction on snow can very
approximately be determined based on the grain size of the snow, as shown in Figure 1.2-1. The
applicability of these findings to tire friction is limited due to the obvious differences between
wooden/polymeric sled runners and rubber tires. Nevertheless, the existence of a relationship
between snow microstructure and friction is important in the context of winter mobility.
In a tire-surface system, the coefficient of friction is called the “traction coefficient” [39]. In their
review of snow mechanics, Shapiro et al. define traction as the “ability of a vehicle’s running
gear to engage the terrain and the strength of the terrain to resist horizontal shear deformation”
[46]. Niven’s work [47] on the friction of tires on ice was one of the earliest forays into the
science of tire-surface interaction in a winter setting. Niven explains that there is a discontinuity
in the value of friction at or very near 0°C and very difficult driving conditions develop around
this temperature. Niven’s findings indicate that values of friction change unexpectedly at 0°C

10
due to the formation of a water film or loose ice crystals at the surface. He also recommends that
torque be applied gently to avoid spinning in low friction conditions. The importance of testing
at 0°C is evident from Niven’s findings.
Figure 1.2-1: Relationship between Coefficient of Friction and Diameter of Grains [45]
In order to develop a reproducible test method, it is necessary to develop a protocol to
characterize the winter surfaces that will be created and tested. Snow and ice are the two primary
constituents of winter surfaces in the real world. From a characterization perspective, snow is far
more complex and challenging to analyze than ice.
The properties of snow can vary greatly, especially as a function of temperature, as described by
Libbrecht [48]. In 1966, De Quervain [49] described this dependence on temperature as the most
complex problem underlying our lack of understanding of the bulk properties of snow. In 1988,
at the First International Conference on Snow Engineering, Brown [50] echoed this sentiment by
stating that “…the properties of snow are not yet well enough known for use with a high degree
of confidence. Snow, as a natural geological material, is found in a wide range of densities, stage
of metamorphism, free water content, etc., and its properties have been determined only for a
few cases.” This lack of understanding has persisted for decades and as recently as 2002, the
problem remains unsolved [51]. In lieu of a detailed theoretical framework relating bulk snow

11
properties (dependent variables) to factors like temperature (independent variables), researchers
have developed rigorous empirical methods to characterize snow properties.
The most comprehensive methods for snow characterization are described in “The International
Classification for Seasonal Snow on the Ground” [52]. This document outlines several
characteristic parameters including microstructure, grain size and shape, density, hardness,
temperature, etc. For instance, Kinosita et al. [53] proposed a classification of snow and ice on
roads based primarily upon the density of snow. Density is considered a very important property
of snow because “it establishes the relationship between snow and its water content, correlates
with snow strength and ease of removal and is an input parameter in a snow accumulation
algorithm used to estimate new snow depths. [54]” Measuring density and snow water equivalent
(SWE) is primarily utilized by avalanche researchers to document and study snow pack
conditions. For a tire-surface interaction system, the mechanical properties of snow are crucial
but can be hard to measure due to dependence on density, temperature and microstructure [55].
A great deal of research has been put into this area by researchers from the automotive industry
seeking to test winter tires in a repeatable fashion. The next section details surface
characterization standards from the ASTM test methods for winter tires.
1.2.6 Test Methods for Winter Tires
Tire manufacturers have been developing and applying winter test methods for decades.
Unfortunately, many of the data acquisition and analysis techniques employed by the tire
industry are proprietary [56]. There are two specific ASTM Standards related to traction testing
in winter conditions that were examined in detail:
1. ASTM F1805-06: Standard Test Method for Single Wheel Driving Traction in a Straight
Line on Snow- and Ice-Covered Surfaces [57]
2. ASTM F1572-08: Standard Test Methods for Tire Performance Testing on Snow and Ice
Surfaces [58]
Both these standards outline the apparatus and procedures for winter tire testing and also include
details about environmental parameters and surface characterization. As discussed in previous
sections, there are numerous guidelines in the literature around the classification of winter
surfaces. However, it can be challenging to select and justify the use of one particular
classification scheme over another. The guidelines in the ASTM standards around surface

12
characterization and standardization were created specifically in the context of tire-surface
interaction and as such they are relevant in the context of studying mobility scooters. The
standards define the range of friction values and snow hardness values for five different classes
of snow; soft, medium pack, medium hard pack, hard pack and dry ice. The standards also
provide a formula to calculate traction coefficient for snow tires which will be referenced in this
study. We will be using elements of the ASTM methods to guide our surface creation and
characterization methods.

13
Chapter 2 A Novel Method to Measure Coefficient of Friction
2.1 Introduction
As described in Chapter 1, literature on the testing and performance of scooters in winter
conditions is sparse. The most comprehensive, comparable body of work comes from the
automotive tire industry. Automotive tire testing in winter conditions has been ongoing since the
1970s and is well established from a standards and methodological perspective. Since the
underlying mechanics of automobiles and scooters are similar (i.e. tire-surface interaction), and
no other literature was available, we used automotive literature and standards to inform our
methods.
The primary outcome measure used to quantify the performance of tires in automotive testing is
tractive coefficient or coefficient of friction (CoF). This chapter describes the development of a
novel method to measure the tractive coefficient of scooters on any surface.
2.1.1 Conceptual Quantification of Tractive Performance
The methodology for the performance testing of the Fortress 1700 DT (Handicare Canada, North
York, ON) 4-wheeled scooter was derived largely from the protocols employed for winter tire
testing. The primary outcome measure being sought was tractive coefficient (also referred to as
coefficient of friction). The definition of tractive coefficient is universally accepted as the ratio
between the horizontal or longitudinal force and the vertical normal force [57], [59], [60].
𝜇 =𝐹𝑥
𝐹𝑧 Equation 2.1.1
𝜇 = coefficient of friction (CoF)
𝐹𝑥 = longitudinal force
𝐹𝑧 = vertical force
2.1.2 Physical Capture of Scooter Performance
The new WinterLab climatic test chamber at the Toronto Rehabilitation Institute (TRI) was
designed to enable researchers to simulate winter conditions and study winter mobility in a
tightly controlled environment. The ambient temperature of WinterLab can be lowered to -10°C

14
and glycol tubes in the floor can be used to create a sheet of ice similar to an ice-rink. Testing the
performance of scooters in WinterLab poses a unique challenge. Automotive tire researchers use
vehicles with instrumented axles to capture kinetic and kinematic data and to quantify tractive
performance. This approach is feasible and indeed preferable when testing different tires on the
same vehicle. However, it becomes impractical when testing multiple vehicles, as is the case
with scooters. We had to devise a method to capture kinetic and kinematic data while the scooter
was being driven inside WinterLab. Kinetic data were particularly challenging to capture. We
designed and built several apparatuses and used a wide variety of measurement tools while
developing the methodology for our winter tests. The unsuccessful methods and a brief
discussion of their respective drawbacks are briefly described in Appendix A.
In our preliminary tests, we had minimal success with traditional biomechanical tools (like force
plates and load cells) to measure the tractive force generated by the scooter. Instead, we turned to
Newton’s second law. We hypothesized that we could capture the horizontal force Fx underlying
the acceleration of the scooter ax using only motion capture.
𝐹x = m ∙ 𝑎𝑥 Equation 2.1.2
m = mass of scooter + driver
𝑎𝑥 = longitudinal acceleration
Having calculated 𝐹𝑥 using Equation 2.1.2 and knowing the mass of the scooter and driver, it was
a simple computation to calculate 𝜇 using Equation 2.1.1.
Our hypothesis was that the horizontal force, and by extension, the CoF measured via motion
capture would be the same as the horizontal force measured by the force plates. We created an
experimental setup that would allow us to test this hypothesis.
2.2 Methods
2.2.1 Instrumentation
Three tri-axial BP12001200 force plates (AMTI Inc., Watertown, MA, USA) were used to
capture the forces generated by the scooter. Force plate data were sampled at a rate of 200 Hertz
(Hz). Four motion capture cameras (Motion Analysis Corporation, Santa Rosa, CA, USA) were
used to capture the position of the scooter as it was driven over the force plates. Reflective
15
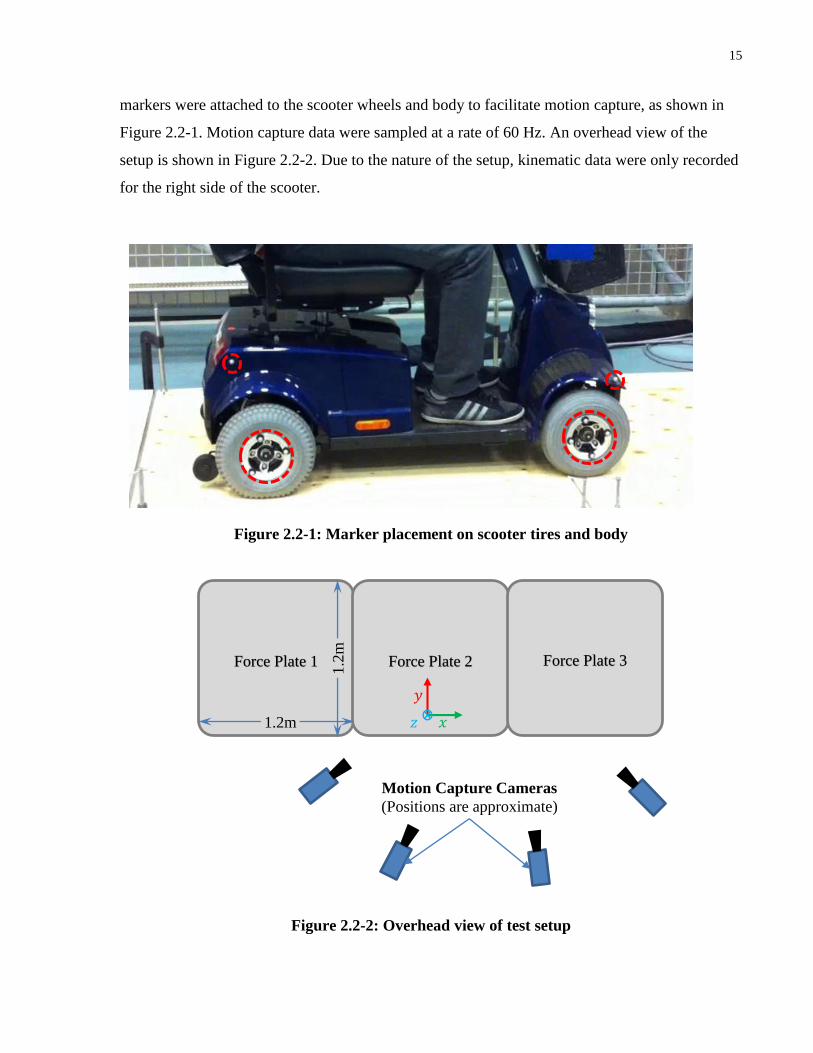
markers were attached to the scooter wheels and body to facilitate motion capture, as shown in
Figure 2.2-1. Motion capture data were sampled at a rate of 60 Hz. An overhead view of the
setup is shown in Figure 2.2-2. Due to the nature of the setup, kinematic data were only recorded
for the right side of the scooter.
Figure 2.2-1: Marker placement on scooter tires and body
Figure 2.2-2: Overhead view of test setup
Force Plate 1 Force Plate 2 Force Plate 3
Motion Capture Cameras
(Positions are approximate)
1.2m
1.2
m
𝑥
𝑦
𝑧

16
2.2.2 Scooter
A Fortress 1700 DT mobility scooter was used for testing. The scooter was acquired as an in-
kind donation from Shoppers Home Healthcare (Toronto, ON). The Fortress scooter was a good
choice for this study because it is described as a mid-sized scooter suitable for both indoor and
outdoor use [61]. The scooter was tested in its stock form, without any modifications to the tires,
drivetrain, etc.
2.2.3 Surface Conditions
To ensure that our hypothesis was valid and applicable across a wide range of conditions, we
conducted tests on four different surfaces in this study:
1. Vinyl
2. Wet Vinyl
3. Plywood
4. Steel
Adhesive backed vinyl tiles were contiguously installed on a plywood sheet to create a smooth,
‘vinyl’ driving surface. A 6” paintbrush was used to apply a thin layer of water to the vinyl
surface to create the ‘wet vinyl’ condition. The plywood sheet with the vinyl tiles was fastened to
the force plate using clamps as shown in Figure 2.2-3. To create the ‘plywood’ surface condition,
this plywood sheet was simply turned over so the vinyl side was in contact with the force plate.
For the ‘steel’ condition, the scooter was driven on the bare, metallic surface of the force plates.
2.2.4 Protocol
Two types of tests were conducted. The first type included starts and stop, the second focused
only on stops. For the first type, the scooter was started with its rear wheels on force plate 2 and
front wheels on force plate 3(see Figure 2.2-2 for force plate numbering). The scooter was
accelerated briefly and brought to a stop before the rear tires left force plate 2. These tests
enabled us to study both the acceleration and deceleration of the scooter. The second type of test
focused primarily on stops. For these trials, the scooter was started with all wheels on force plate
1 and stopped with all wheels on force plate 3. This allowed us to study the constant velocity and
deceleration performance of the scooter.

17
Figure 2.2-3: Vinyl test surface clamped to force plates
The maximum speed setting on the Fortress scooter is ‘10’ which is reported by the manufacturer
to be approximately 5.5 miles per hour or approximately 2.5 meters per second (m/s). Our tests
were conducted at speed settings ‘1’, ‘5’and ‘8’, which were measured to be approximately 0.20
m/s, 1.00 m/s and 1.35 m/s respectively. On all surfaces, we conducted one trial of each type
(start/stop and stop) at the three different speed settings. Hence, we conducted 6 trials per surface
and 24 trials in total.
2.2.5 Data Analysis
Raw kinetic and kinematic data were processed in Matlab (The MathWorks, Inc., Natick, MA,
USA). Force plate data were filtered using a low-pass, fourth-order, zero-lag digital Butterworth
filter. The cutoff frequency was set at 20 Hz. The force plate data were also down-sampled to 60
Hz to enable direct comparison with the motion capture data. Down-sampling was done by
retaining force plate readings when there was an increment in the motion capture frame number.
The force plate data changed more frequently than the motion capture data due to their higher

18
sampling frequency. The intermediate kinetic data points between kinematic readings were
effectively discarded.
Motion capture data were processed using a low-pass, fourth-order, zero-lag digital Butterworth
filter at a cutoff frequency of 5 Hz. Cutoff frequencies were chosen using residual analysis as
suggested by Winter [62]. Due to latency in the motion capture system, the kinematic data were
shifted by two frames when being compared to the kinetic data (for e.g., we compared frame 100
of the force plate data to frame 102 of the motion capture data). This lag was confirmed using the
cross-correlation function in Matlab.
The CoF from the force plates was calculated by simply dividing the longitudinal force readings
(Fx) by the vertical force readings (Fz). The acceleration of the scooter (ax) was calculated by
twice differentiating the longitudinal positions of the body markers. This acceleration was used
to calculate (Fx) and subsequently CoF (𝜇), as explained in Section 2.1. The agreement between
the CoF values calculated from the force plates versus the values calculated from motion capture
was assessed using Pearson correlation in SPSS (IBM Corp., Armonk, NY, USA).
2.3 Results
Overall, there was very strong agreement between the CoF measured using force plates and
motion capture. Figure 2.3-1 shows a sample trial conducted on steel. The top plot shows the
acceleration of the scooter in meters per second. The bottom plot shows both the horizontal force
calculated from the motion capture and the raw horizontal force from the force plates. As the
bottom plot shows, there were substantial ‘negative’ forces registered during this trial because
the scooter was decelerating and hence the ground reaction force is negative and opposite to the
direction of motion. Figure 2.3-2 shows the CoF curves for the data shown in Figure 2.3-1.
Negative CoF values are seen for the same reason as negative forces (as explained above).
Qualitatively speaking, the CoF curves from both measurement tools are closely aligned
temporally and in amplitude and appear to support the hypothesis that motion capture is an
adequate surrogate for force plates.
Figure 2.3-3 is a plot of CoF from force plates versus CoF from motion capture. The plot
includes over 7000 paired CoF readings across all four test surfaces. The plot shows strong
correlation between the two measurement tools with an R2 of 0.981 (Pearson correlation of

19
0.991). Table 2.3-1 summarizes the Pearson correlation statistics for each individual test surface.
One trial on plywood was excluded from analysis due to outliers in the motion capture data for
that trial.
Figure 2.3-1: Sample plot of raw acceleration from motion capture (top) and horizontal
forces from motion capture and force plates (bottom)

20
Figure 2.3-2: Sample CoF curves generated by force plates versus motion capture
Figure 2.3-3: CoF readings from force plates vs. motion capture across all test surfaces
R2 Linear = 0.981
21
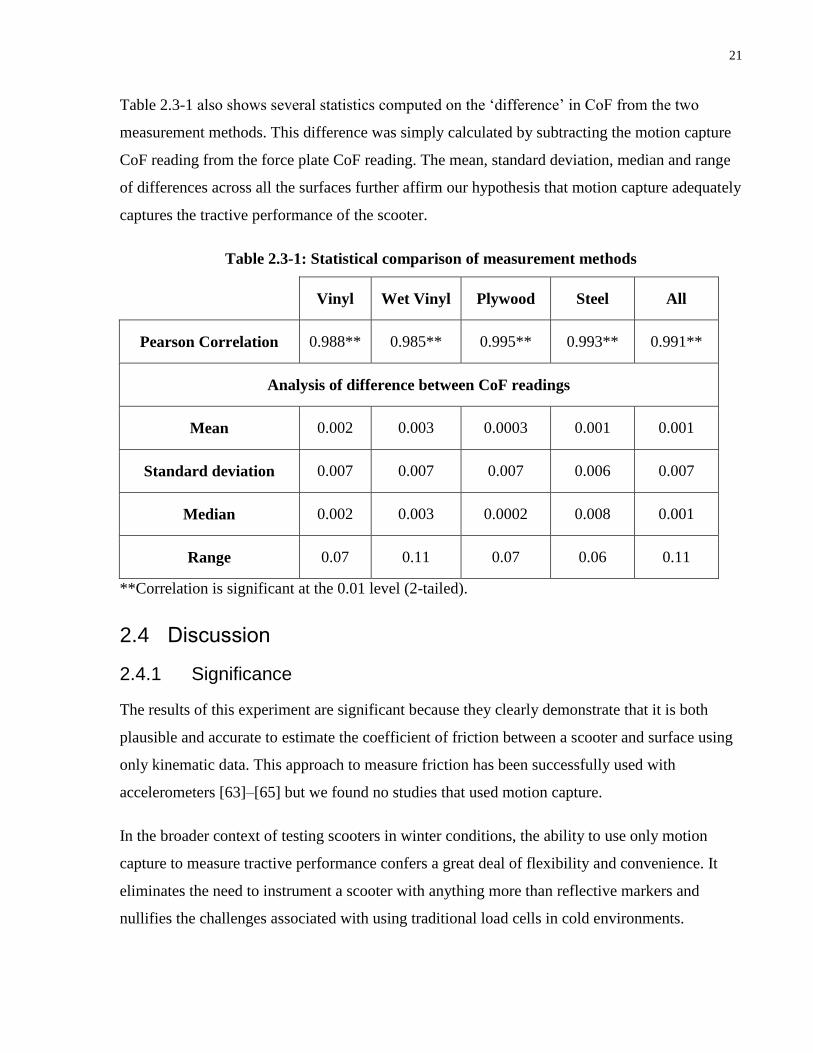
Table 2.3-1 also shows several statistics computed on the ‘difference’ in CoF from the two
measurement methods. This difference was simply calculated by subtracting the motion capture
CoF reading from the force plate CoF reading. The mean, standard deviation, median and range
of differences across all the surfaces further affirm our hypothesis that motion capture adequately
captures the tractive performance of the scooter.
Table 2.3-1: Statistical comparison of measurement methods
Vinyl Wet Vinyl Plywood Steel All
Pearson Correlation 0.988** 0.985** 0.995** 0.993** 0.991**
Analysis of difference between CoF readings
Mean 0.002 0.003 0.0003 0.001 0.001
Standard deviation 0.007 0.007 0.007 0.006 0.007
Median 0.002 0.003 0.0002 0.008 0.001
Range 0.07 0.11 0.07 0.06 0.11
**Correlation is significant at the 0.01 level (2-tailed).
2.4 Discussion
2.4.1 Significance
The results of this experiment are significant because they clearly demonstrate that it is both
plausible and accurate to estimate the coefficient of friction between a scooter and surface using
only kinematic data. This approach to measure friction has been successfully used with
accelerometers [63]–[65] but we found no studies that used motion capture.
In the broader context of testing scooters in winter conditions, the ability to use only motion
capture to measure tractive performance confers a great deal of flexibility and convenience. It
eliminates the need to instrument a scooter with anything more than reflective markers and
nullifies the challenges associated with using traditional load cells in cold environments.

22
2.4.2 Limitations
There are two limitations to using the motion capture method. First, since we are measuring CoF
using the acceleration of the scooter as a whole, we are calculating the tractive performance of
the whole device and not individual tires. However, considering that there have only been three
studies on wheeled mobility aids in winter conditions, and that two of those have been survey
studies, our findings are a significant step forward. Furthermore, our goal is not to measure the
performance of different tires but rather measuring the performance of different models of
scooters. The motion capture method is adequate for this purpose.
Second, we are not able to quantify the effects of rolling resistance using motion capture. Rolling
resistance is defined as “the effort required to keep a given tire rolling [66].” Rolling resistance is
an important concept in the context of automobiles as it influences fuel efficiency and
recommendations for tire pressure [67]. This information is not as relevant in the context of
scooters. Furthermore, the accurate quantification of rolling resistance would necessitate
instrumenting the scooter axles with load cells, which is impractical and expensive to do for
every device we test.
2.5 Conclusion
This study has demonstrated the feasibility of using kinematic data and Newton’s second law to
accurately estimate the tractive coefficient of a scooter on a multitude of surfaces. This was a
novel finding and one that simplifies the measurement of scooter performance, particularly in
winter environments.
23
Chapter 3 Pilot Testing of Scooter on Winter Surfaces
3.1 Introduction
As described in Chapter 1, there has been very little in the way of rigorous testing of scooters in
winter conditions. In the real world, ‘winter conditions’ are the manifestation of several complex
factors including temperature, wind, humidity, air pressure, altitude, time of day, etc. It is
impossible to recreate the infinite range of real world conditions in a laboratory setting. Instead,
researchers do their utmost to emulate realistic conditions using the tools at their disposal. For
instance, Lemaire et al. [9] used a climatic chamber to conduct their testing. They manually
packed snow by foot, on a ramp to create a “realistic winter scenario”. In the winter tire industry,
testing is typically conducted outdoors where conditions can change rapidly and there is no
guarantee that the required test conditions will ever materialize. For instance, Phetteplace et al.
[59] conducted testing at a facility in West Yellowstone, Montana. The authors describe their
intention to test ice, packed snow and fresh snow but despite “testing over nearly a month in the
combined 2004 and 2005 seasons, fresh snow was never received in sufficient quantities for a
meaningful test.” Conducting testing indoors affords more control and flexibility and was the
preferred approach for this study.
There were two main objectives for this study. First, we sought to create and characterize
realistic winter surface conditions using the tools at our disposal. The second objective was to
test the tractive performance of a mobility scooter in the conditions we created. This chapter will
describe the methods used to accomplish both these objectives and the outcomes of the study as a
whole.
3.1.1 Simulating Realistic Winter Conditions in WinterLab
One of the primary challenges when conducting winter related research is maintaining consistent
conditions and ultimately ensuring the reproducibility of test results. A study by Lemaire et al.
[9] involving winter conditions cites difficulties in maintaining consistent snow conditions as a
major limitation. As described in Chapter 2, Section 2.1.2, the WinterLab has been designed to
enable researchers to simulate winter conditions and study winter mobility in a tightly controlled

24
environment. Section 3.2 describes how we utilized the WinterLab and other tools at TRI to
conduct our testing.
3.1.2 Quantifying Scooter Performance in Winter Conditions
Based on automotive tire testing literature, we sought to measure two primary outcome variables.
The first was slip velocity. In general, slip is defined as the difference in velocity of the driven
wheel and the velocity of the vehicle as a whole. There are several variations of this definition in
the literature [56], [57], [60], [68]. Our definition of slip was adapted from the work by
Phetteplace et al. [59] and is described in detail in Section 3.2.3.
The primary application of slip velocity is the determination of which tractive coefficient value
to report. For instance, the SAE J2246-1992 standard [60] plots tractive coefficients over the
entire range of slip values. The peak value of the curve represents the peak tractive capability of
the given tire-surface interface and the ‘maximum static coefficient of friction’ [68]. As the slip
increases, the tractive coefficient starts to diminish and the tire operates at the dynamic
coefficient of friction. At 100% slip, the coefficient of friction is called the ‘sliding coefficient of
friction’ [60]. Conversely, the ASTM F1805 standard [57] suggests reporting the average tractive
coefficient when the slip velocities are between 1.6 km/h and 24 km/h.
The second variable we sought to measure was tractive coefficient (also referred to as coefficient
of friction). The definition of tractive coefficient is universally accepted as the ratio between the
horizontal or longitudinal force and the vertical normal force [57], [59], [60]. We measured
tractive coefficient using motion capture as described in Chapter 2. The test method and protocol
is described in the next section.
3.2 Methods
3.2.1 Creation of Winter Conditions
3.2.1.1 ASTM Recommendations
As described in Section 1.2.6 of the background, ASTM F1805-06 [57] and F1572-08 [58] are
two standard test methods to evaluate the tractive performance of tires on snow and ice surfaces.
Both these standards include a table of standardized test-course characteristics. The table of
conditions is reproduced in Table 3.2-1. With the exception of the ‘Ice-Wet’ condition, all other

25
conditions and their descriptors are reproduced verbatim. We used the conditions in Table 3.2-1
as a guide for our testing and sought to create as many of them as possible. The following
sections describe the creation and characterization of ice and snow.
Table 3.2-1: ASTM Recommended Course Characteristics [57], [58]
Surface
Description
Temperatures Penetrometer
Snow
Compaction
Surface and
Footprint
Characteristics
Remarks Ambient
Max
Surface
Min Max
Soft Pack
(new) Snow +3°C -15°C -4°C 50-70
5-7.5cm loose
snow, distinctive
footprint
Freshly fallen
snow or deeply
groomed base
snow
Medium
Pack Snow +3°C -15°C -4°C 70-80
2.5-5cm loose
snow, distinctive
footprint
Generally
obtained by
grooming packed
base prior to
morning testing
Medium
Hard Pack
Snow
+3°C -15°C -4°C 80-84 1-2cm loose snow,
slight footprint
Typical surface
for tire/vehicle
handling tests
Hard Pack
Snow +3°C -15°C -4°C 84-93
No loose snow,
little to no footprint
Packed base with
no grooming
Ice-Dry 0°C -20°C -4°C 93-98
Smooth ice with no
loose materials, no
footprint
Avoid bright sun
on course. Broom
or resurface as
required
Ice-Wet* 0°C -1°C +1°C 93-98 Smooth ice with
liquid surface layer
*Not in original
ASTM Standards
3.2.1.2 Creation of Ice
Icy roadways and sidewalks are synonymous with mobility challenges during the winter. As
described previously, the floor of the WinterLab is specifically designed to allow researchers to
create a robust ice surface which does not melt easily, even when ambient conditions are above
0°C. Ice is created by flooding the floor of the WinterLab with water and then cooling the glycol
cooling tubes to a temperature below 0°C. When fully frozen, the resultant ice surface was
classified as the ‘Ice-Dry’ condition. A wet mop was used to apply a layer of water to the surface
of the dry ice and create the ‘Ice-Wet’ condition. Figure 3.2-1 shows both the dry and wet ice
conditions.

26
Figure 3.2-1: Picture of the dry (top) and wet (bottom) ice floor in WinterLab

27
3.2.1.3 Creation of Snow
While an artificial ice surface is relatively easy to make, the production of artificial snow is not
as straightforward. There are companies which specialize in the production of artificial snow for
aesthetic purposes [69]. However, from a mechanical perspective, the materials used to simulate
the appearance of snow are nowhere near natural snow. The livelihood of many modern ski
slopes depends on the creation of realistic, artificial snow. Water is pumped at high pressure
through nozzles and subsequently crystallizes around a nucleus (for e.g., magnesium ions) and
falls as snow on ski hills [70]. The ‘Backyard Blizzard’ home snowmaker is one of the few off-
the-shelf, consumer models of the ski-slope design [71]. Unfortunately, for nozzle based systems
like the Backyard Blizzard, the ambient temperature and relative humidity are crucial in
determining the quality of snow produced. The WinterLab is not capable of maintaining the
temperature and humidity within the band (≤ − 6℃ and ≤100% relative humidity) to successfully
produce snow using the Backyard Blizzard. Despite attempts to lower the temperature and
compensate for the humid environment, snow would not form in the WinterLab.
To reliably produce snow of uniform consistency on demand, a self-contained system was
necessary. The Snow Tech all-weather snowmaker (Chungbuk, Korea) produces snow within a
climate controlled chamber, as shown in Figure 3.2-2. The temperature of the chamber can be
maintained at 0°C to ensure that the snow is well preserved. The machine produces snow by
spraying water onto a cooled metallic plate and then scraping off the ice that forms. Over a
period of four to five hours, the machine can produce enough snow to cover a surface
approximately one meter wide and four meters long to a depth of five centimeters.
The first step to creating snow for a trial was to place a large, wheeled cooler inside the
snowmaker (this cooler is not shown in Figure 3.2-2). The machine was then turned on for
several hours and snow would begin to accumulate inside the cooler. Once full, the cooler was
moved inside WinterLab and the snow was emptied onto a pre-fabricated hard packed snow
base. As pointed out by the ASTM F1805 standard document [57], and as we found through our
own preliminary tests, the creation of this hard packed base was an integral step in facilitating
our snow testing. Without the hard packed base (Figure 3.2-3), the scooter would simply plough
through the snow or the tires would penetrate to the ice surface beneath the snow layer. The hard
packed base was created by allowing manually packed snow to harden overnight on the ice floor.

28
After the snow had been emptied on the hard packed base, the final step was to manually spread
and level the snow. We used a snow shovel and custom-built leveling tool (as shown in Figure
3.2-4) to accomplish this task.
Once the snow was spread and leveled, we were ready to begin testing. This snow condition was
classified as the ‘soft pack’ or ‘new’ snow. Driving on this fresh snow compressed it and would
create a ‘track’ where the wheels had been. Increasingly packed snow conditions (i.e. medium
pack and hard pack) were created by repeatedly driving the scooter over the same track.
Figure 3.2-2: Snow Tech all-weather snowmaker producing snow (cooler absent)

29
Figure 3.2-3: Hard packed snow base in WinterLab
Figure 3.2-4: Custom snow leveling tool being used to create flat driving surface

30
3.2.2 Characterization of Winter Conditions
3.2.2.1 Characterizing Ice
As outlined in Table 3.2-1 on page 25, temperature and hardness are the two primary quantitative
characteristics of ice that we monitored. The temperature of the ice itself was captured from a
thermistor embedded in the ice surface. Qualitative surface ‘wetness’ was also a characteristic of
the ice that we monitored.
3.2.2.2 Characterizing Snow
As discussed in Section 1.2.5, there are multiple methods to characterize the properties of snow.
Characterization methods with the greatest relevance to traction testing were sought for this
study. Phetteplace et al. [59] use temperatures and density to distinguish between different snow
condition. Conversely, the ASTM standards for tire testing [57], [58] rely on temperatures and
penetrometer compaction to differentiate snow conditions. We elected to quantify density, snow
hardness and temperature. The rationale for these selections and the methodology of their
measurement is described below. We also recorded the qualitative ‘footprint’ left by the scooter
on the snow.
Temperature
As Nakaya [72] demonstrated, atmospheric temperature plays a key role in determining the
morphology of snow crystals. More recent studies have shown that temperature also affects the
frictional [73] and mechanical properties of snow [74]. As shown in Table 3.2-1, the ASTM
standards make a distinction between ambient and surface temperatures and hence we recorded
both types of temperature independently.
We used a SmartReader multi-channel configurable temperature logger (ACR Systems Inc.,
Surrey, BC). Two temperature probes were embedded in the snow and one was left exposed to
the air. The logger was configured to take a temperature measurement every 30 seconds for the
entire duration of the experiment.

31
Snow Hardness
The International Classification for Seasonal Snow on the Ground [52] defines snow hardness as
the “resistance to penetration of an object into snow.” Shapiro et al. [46] suggest using
penetration hardness as an index property of snow. In the context of winter tire traction testing,
the CTI snow penetrometer (Smithers Rapra, Akron, OH) is the only device officially sanctioned
by the ASTM standards [57], [58]. This penetrometer yields a standardized hardness reading
(designated Penetrometer Snow Compaction in Table 3.2-1) on a 100-point scale. In keeping
with the guidelines of the ASTM standards, we acquired and used the CTI penetrometer (shown
in Figure 3.2-5) to measure snow hardness during our testing.
Figure 3.2-5: CTI Penetrometer
To measure hardness, the base of the penetrometer was first placed on the surface of the snow.
The knob was manually raised to its highest position and then released. The penetrometer tip
would then fall and penetrate the snow. As soon as the penetrometer tip came to a rest, the scale
was placed on the penetrometer and the hardness value was recorded.
Knob
Scale
Base
32
Density
Density is an important characteristic of snow. As Judson et al. [54] put it, “[density] establishes
the relationship between snow and its water content, correlates with snow strength and ease of
removal”. The International Classification for Seasonal Snow on the Ground recommends that
the measurement of snow density be included in all snow characterization schemes[52].
However, it also notes that density is a bulk property of snow and not indicative of
microstructure. Mellor notes that it is important to characterize microstructure alongside density
to determine the mechanical properties of snow [46], [75]. This is because snow samples with
similar density and physical characteristics can exhibit different properties based on compaction
or sintering history [46]. Essentially, the properties of snow vary not only with environmental
conditions but temporally as well. To complicate matters, as Shapiro puts it, there are currently
no easy methods to “relate easily observed physical features of snow to its deformational
response to an applied load. [46]” While intricate stereological methods to characterize snow
microstructure yield detailed information about bond structure and mechanical properties; they
are difficult and time consuming. Hence, despite its limitations, density was chosen as a
rudimentary measure of microstructure and as one of the primary snow characteristics in this
study.
To measure density, we used the Brooks-Range Pocket Snow Density Gauge 100 (Brooks-Range
Mountaineering Equipment, Fremont, CA, USA). The standardized volume of the cylindrical
gauge yields a density measurement when filled with snow and weighed.
3.2.3 Measuring Scooter Performance
3.2.3.1 Instrumentation
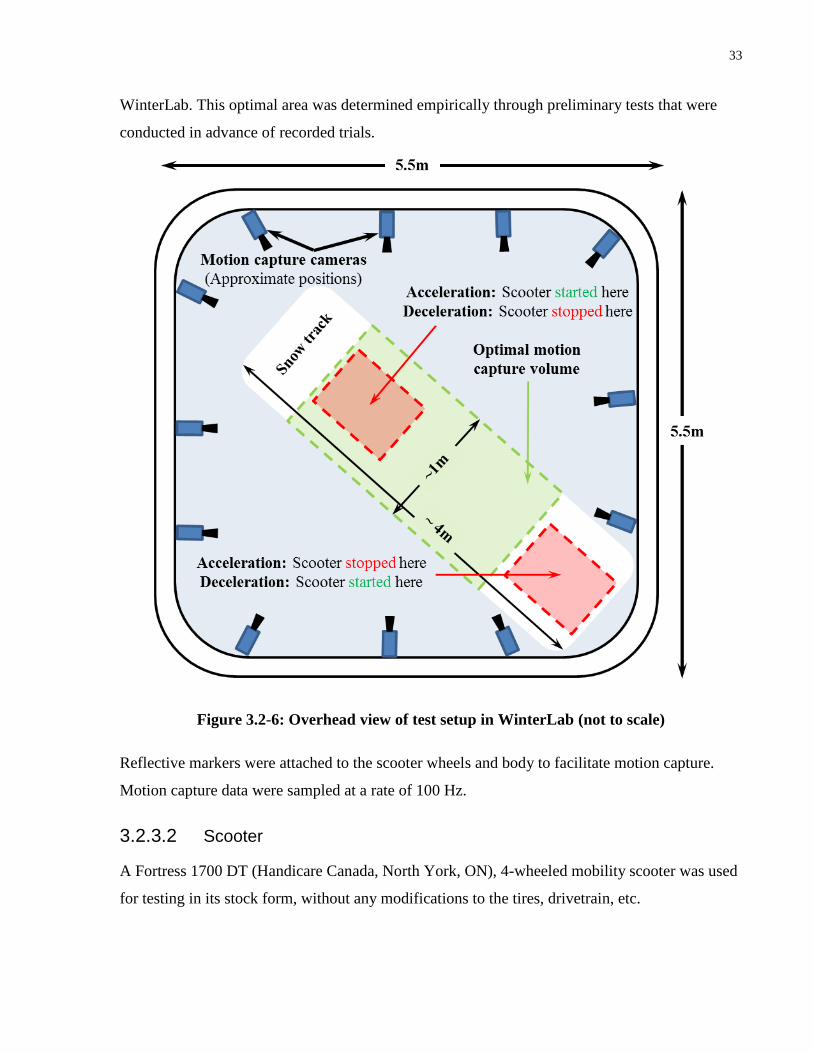
Twelve motion capture cameras (Motion Analysis Corporation, Santa Rosa, CA, USA) were
mounted inside WinterLab to track the scooter. The cameras are designed to capture the three-
dimensional positions of reflective markers within a ‘capture volume’. The size and location of
the capture volume is determined by the focal length of the cameras and their orientation. We
optimized the placement and orientation of the cameras to capture the best data in the middle of
the WinterLab as opposed to the edges. An overhead view of the setup in WinterLab is shown in
Figure 3.2-6. The figure shows an approximation of where the optimal capture volume was in
33
WinterLab. This optimal area was determined empirically through preliminary tests that were
conducted in advance of recorded trials.
Figure 3.2-6: Overhead view of test setup in WinterLab (not to scale)
Reflective markers were attached to the scooter wheels and body to facilitate motion capture.
Motion capture data were sampled at a rate of 100 Hz.
3.2.3.2 Scooter
A Fortress 1700 DT (Handicare Canada, North York, ON), 4-wheeled mobility scooter was used
for testing in its stock form, without any modifications to the tires, drivetrain, etc.

34
3.2.3.3 Performance Measures
Slip
As described in Section 3.1.2, slip and tractive coefficient were the two outcome variables being
sought in this study. To determine the slip velocityV𝑠, it was necessary to determine the
longitudinal speed of the scooter V𝑙 and the speed of the driven wheels V𝑤.
𝐕𝒔 = 𝑽𝒍 − 𝑽𝒘 Equation 3.2.1
V𝑠 = Slip velocity in meters per second (m/s)
V𝑙 = Scooter longitudinal speed (m/s)
V𝑤 = Speed of driven wheels (m/s)
Slips were classified as ‘significant’ if the slip velocity V𝑠 exceeded 0.1 m/s for at least 50 frames
or half a second. The threshold was developed empirically from the results of this study.
Figure 3.2-7: Marker placement and vector definitions used to calculate speed of wheels
C1 = Center marker on front wheel C2 = Center marker on rear (driven) wheel
T1, T2, T3 = Tire markers on rear (driven) wheel 𝑟 = Radius of tire (meters)
The longitudinal velocity of the scooter was calculated by averaging the velocities of individual
body markers. Calculating the speed of the driven wheels was a three-step process. First, the
angular distance (in degrees) travelled by the wheel between frames was calculated. This was
Front Wheel Rear Wheel
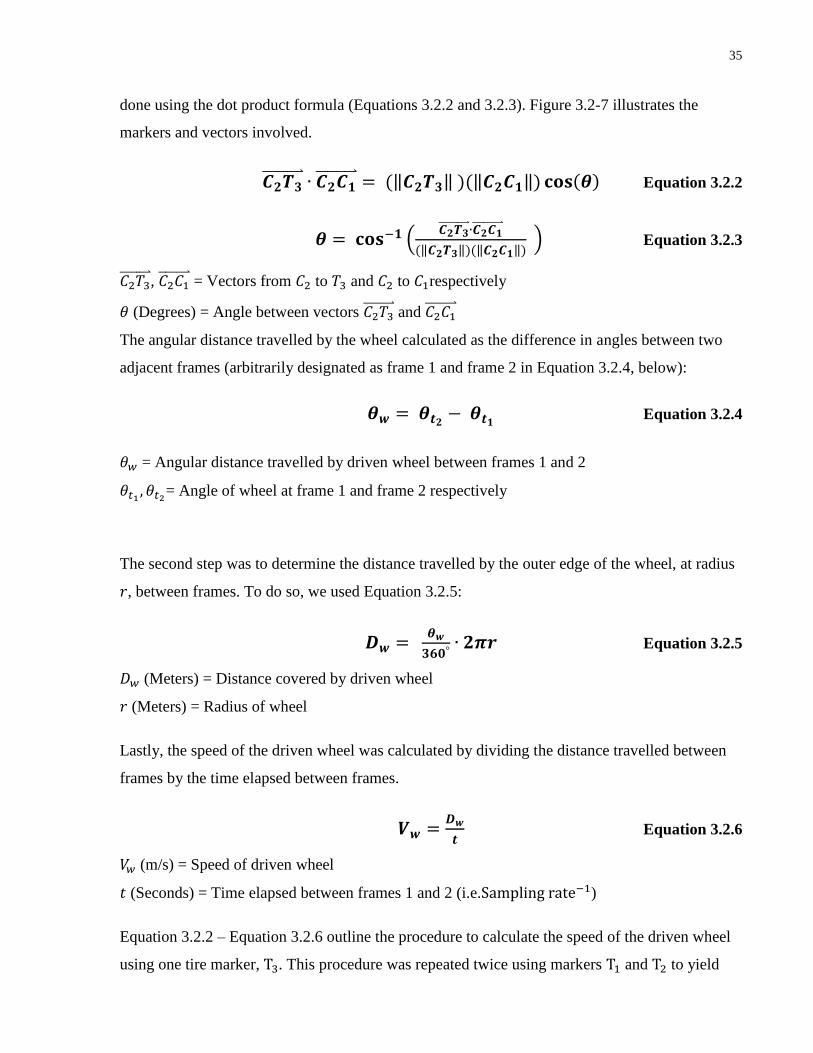
35
done using the dot product formula (Equations 3.2.2 and 3.2.3). Figure 3.2-7 illustrates the
markers and vectors involved.
𝑪𝟐𝑻𝟑 ∙ 𝑪𝟐𝑪𝟏
= (‖𝑪𝟐𝑻𝟑‖ )(‖𝑪𝟐𝑪𝟏‖) 𝐜𝐨𝐬(𝜽) Equation 3.2.2
𝜽 = 𝐜𝐨𝐬−𝟏 (𝑪𝟐𝑻𝟑 ∙𝑪𝟐𝑪𝟏
(‖𝑪𝟐𝑻𝟑‖)(‖𝑪𝟐𝑪𝟏‖) ) Equation 3.2.3
𝐶2𝑇3 , 𝐶2𝐶1
= Vectors from 𝐶2 to 𝑇3 and 𝐶2 to 𝐶1respectively
𝜃 (Degrees) = Angle between vectors 𝐶2𝑇3 and 𝐶2𝐶1
The angular distance travelled by the wheel calculated as the difference in angles between two
adjacent frames (arbitrarily designated as frame 1 and frame 2 in Equation 3.2.4, below):
𝜽𝒘 = 𝜽𝒕𝟐 − 𝜽𝒕𝟏 Equation 3.2.4
𝜃𝑤 = Angular distance travelled by driven wheel between frames 1 and 2
𝜃𝑡1 , 𝜃𝑡2= Angle of wheel at frame 1 and frame 2 respectively
The second step was to determine the distance travelled by the outer edge of the wheel, at radius
𝑟, between frames. To do so, we used Equation 3.2.5:
𝑫𝒘 = 𝜽𝒘
𝟑𝟔𝟎°∙ 𝟐𝝅𝒓 Equation 3.2.5
𝐷𝑤 (Meters) = Distance covered by driven wheel
𝑟 (Meters) = Radius of wheel
Lastly, the speed of the driven wheel was calculated by dividing the distance travelled between
frames by the time elapsed between frames.
𝑽𝒘 =𝑫𝒘
𝒕 Equation 3.2.6
𝑉𝑤 (m/s) = Speed of driven wheel
𝑡 (Seconds) = Time elapsed between frames 1 and 2 (i.e.Sampling rate−1)
Equation 3.2.2 – Equation 3.2.6 outline the procedure to calculate the speed of the driven wheel
using one tire marker, T3. This procedure was repeated twice using markers T1 and T2 to yield

36
two additional speed readings. The speed of the wheel as a whole was computed as the mean of
these three readings. The overall speed of the driven wheels (i.e. both back wheels) was
calculated by taking the mean of the speeds of the left wheel and right wheel. This mean speed
was then used in Equation 3.2.1 to compute slip velocity.
Tractive coefficient
The horizontal force exerted by the scooter on the surface was calculated using Newton’s second
law, as described in Chapter 2.
𝑭𝒙 = 𝒎 ∙ 𝒂𝒙 Equation 3.2.7
𝑚 = mass of scooter + driver
𝑎𝑥 = longitudinal acceleration
Tractive coefficient (also referred to as CoF) was calculated by dividing the horizontal force by
the vertical, normal force.
𝝁 =𝑭𝒙
𝑭𝒗 Equation 3.2.8
µ = coefficient of friction
𝐹𝑥 = longitudinal force
𝐹𝑣 = vertical force
If no significant slips occurred during a trial, we designated 𝜇 as 𝜇𝑢𝑡𝑖𝑙𝑖𝑧𝑒𝑑. This value was
computed by finding the maximum observed 𝜇 over the course of the trial and represents the
maximum CoF ‘utilized’ by the scooter to either accelerate or decelerate.
If a significant slip did occur during a trial, we designated 𝜇 as 𝜇𝑎𝑣𝑎𝑖𝑙𝑎𝑏𝑙𝑒. This value was
computed by taking the average CoF over the duration of frames when the significant slip
occurred (i.e. the average CoF for the 50 or more frames when V𝑠 > 0.1 m/s). In this case, the
scooter attempted to utilize more CoF than was available on the surface and hence, a significant
slip was observed. These relations are summarized in Table 3.2-2 below:

37
Table 3.2-2: Definition and description of observed 𝝁 values
Significant
Slip?
Slip
Velocity
(𝐕𝒔)
Designation
of 𝝁 Calculation of 𝝁 Remark
No
<0.1 m/s
OR
≥0.1 m/s for
<50 frames
𝜇𝑢𝑡𝑖𝑙𝑖𝑧𝑒𝑑 Maximum 𝜇 observed
in entire trial
𝜇𝑢𝑡𝑖𝑙𝑖𝑧𝑒𝑑 < 𝜇𝑎𝑣𝑎𝑖𝑙𝑎𝑏𝑙𝑒,
hence no slip
Yes ≥0.1 m/s for
≥50 frames 𝜇𝑎𝑣𝑎𝑖𝑙𝑎𝑏𝑙𝑒
Average of 𝜇 while
significant slip
occurred
𝜇𝑢𝑡𝑖𝑙𝑖𝑧𝑒𝑑 > 𝜇𝑎𝑣𝑎𝑖𝑙𝑎𝑏𝑙𝑒,
hence slip occurred
3.2.4 Protocol
The first step was creating the test conditions as described in Section 3.2.1. Due to the size of the
capture volume, we could not capture acceleration, steady speed driving and deceleration in one
trial. Hence, we separated our tests into two categories: acceleration and deceleration. Since the
system was calibrated to yield the best data in the center of the room, the scooter was either
accelerated from rest or decelerated to rest in the middle of the room. This location is shown in
Figure 3.2-6 as the red box within the green ‘optimal capture volume’. When accelerating, the
tiller was depressed as far as it could go and when decelerating, the tiller was released and
allowed to return to its rest position. The speed setting on the scooter was maintained at ‘5’ of
‘10’ for all tests.
For tests on snow, temperature collection was initiated at the start of each trial by embedding two
probes into the snow and leaving one probe exposed to the air. Three hardness measurements
were taken on the fresh snow. Three measurements were also made on the test track after each
trial. Density measurements were taken only at the start of each trial to ensure that the fresh snow
was consistent each time. Trials on snow were conducted until hardness readings began to
plateau and no less than six trials were conducted per session.
For tests on ice, three hardness measurements were taken before tests began. For the ‘wet ice’
condition, water was applied to the surface of the ice using a mop after three to five trials.
3.2.5 Data Analysis
Raw motion capture data were processed in Cortex (Motion Analysis Corporation, Santa Rosa,
CA, USA) to ensure any missing or erroneous marker data were properly treated. Data were then
38
exported to Visual 3D (C-Motion, Inc., Germantown, MD, USA). Virtual markers demarcating
the center of each tire were added in Visual 3D and the data were subsequently exported to
Matlab (The MathWorks, Inc., Natick, MA, USA) for analysis. In Matlab, the motion capture
data were filtered using a low-pass, fourth-order, zero-lag Butterworth filter at a cutoff frequency
of 6 Hz. The cutoff frequency was chosen using residual analysis, as outlined by Winter [62].
Slip and tractive coefficient were calculated using the filtered data as described in Section
3.2.3.3.
3.3 Results and Discussion
3.3.1 Ice
We successfully created dry and wet ice conditions using the aforementioned protocols. Testing
on dry and wet ice was conducted during the same session. Surface and ambient temperatures
recorded during testing are shown in Table 3.3-1. Unfortunately, the climate control mechanism
responsible for maintaining the temperature below 0°C was malfunctioning during our tests and
the ambient temperature was higher than the temperature recommended in Table 3.2-1. The
climate control will be fixed and the temperatures adjusted within the recommended range for
future tests.
We also realized that the methodology to create the wet ice condition was not well defined.
Going forward, we plan to experiment with a finite amount of liquid water being added to a fixed
surface area of ice. The ratio of water volume to ice surface area would need to be determined in
future testing but as an example, the ratio may be 100 milliliters of water per square foot of ice.
The water would be poured onto the ice and spread out over the surface using a damp mop.

39
3.3.2 Snow
Temperature
We conducted four batches of snow tests and successfully created the range of conditions (from
soft to hard pack) that we were seeking. The ambient and surface temperatures recorded during
each batch of testing are summarized in Table 3.3-1. As mentioned in Section 3.3.1, the ambient
temperatures during testing were not within the desired range due to a malfunction in the climate
control system. This is not expected to be the case for future tests.
Table 3.3-1: Surface and ambient room temperatures recorded during testing
Condition Surface
Temperature (°C) Room
Temperature (°C) Snow Batch 1 -0.17 5.84 Snow Batch 2 -1.52 4.79 Snow Batch 3 -0.18 4.28 Snow Batch 4 -0.55 3.73
Ice -6.00 5.00
Hardness
The trial-by-trial hardness readings for the four batches of snow tests are presented in Figure
3.3-1. These data are also presented in tabular form to clearly show the standard deviations of
individual readings (Table 3.3-2). The general trend is for hardness to rise as more trials are
conducted. This is the expected result. However, Figure 3.3-1 also clearly shows that there is a
large amount of variability associated with each hardness reading.

40
Figure 3.3-1: Snow hardness readings vs. number of trials
One possible explanation for this variability is the unevenness of the hard pack base. The uneven
base resulted in small ‘peaks’ and ‘valleys’ of the surface layer of snow. The peaks that were
formed on the test track were compressed more than the valleys. This is because some valleys
were smaller than the contact area of the tires and hence were shielded from the compressive
force applied by the tires. If a hardness reading was taken on a peak that was heavily
compressed, it yielded a higher value than a hardness reading taken in a valley with softer,
uncompressed snow. It is essential to ensure that the surface of the hard pack base layer is
smooth and free of bumps to maximize consistency of hardness readings in future tests.
70
75
80
85
90
95
0 1 2 3 4 5 6 7 8 9 10
Hard
nes
s (C
TI
Com
pact
ion
Nu
mb
er)
Trial Number
Batch 4 Batch 3 Batch 2 Batch 1

41
Table 3.3-2: Snow hardness readings vs. number of trials
Batch Trial Mean Hardness Standard Deviation
1 1 78.00 2.83
1 2 84.67 1.89
1 3 85.33 1.89
1 4 84.33 2.87
1 5 80.33 3.68
1 6 84.67 2.87
2 1 80.00 0.82
2 2 79.67 0.94
2 3 81.67 0.47
2 4 85.67 1.70
2 5 87.67 1.70
2 6 88.67 1.25
2 7 87.00 2.83
2 8 87.67 2.62
3 1 79.33 1.25
3 2 84.33 0.47
3 3 85.00 1.63
3 4 85.00 1.41
3 5 89.67 3.09
3 6 86.67 1.70
3 7 89.33 0.94
4 1 81.00 6.16
4 2 84.33 2.49
4 3 82.67 0.47
4 4 85.67 0.94
4 5 84.33 2.87
4 6 85.00 2.45
4 7 86.33 0.94
4 8 89.00 0.82
4 9 86.67 1.25
Density
At the outset of our testing, we sought to obtain density readings both prior to and during testing.
Our preliminary readings on fresh snow ranged from 225 kilograms per cubic meter (kg/m3) to
275 kg/m3. While it was straightforward to take density readings on fresh snow, we noted that it
became increasingly challenging to measure density as the snow was increasingly packed. It was
very challenging to fill the standardized cylindrical volume of the Brooks Range density gauge

42
with packed snow. Forcing the snow into the gauge necessitated the exertion of a large amount
of force. However, the act of force exertion itself results in snow compression and thus
diminished our confidence in the accuracy of the density readings we were obtaining.
There is no simple strategy to mitigate our inability to measure the density of packed snow.
Instead, for future testing, our recommendation is to measure the density of fresh snow prior to
any driving. While not ideal, this will ensure consistency in the fresh snow condition.
3.3.3 Scooter Performance
Figure 3.3-2, Figure 3.3-3 and Figure 3.3-4 illustrate the performance of the Fortress 1700 DT
scooter on snow, dry ice, and wet ice respectively. Table 3.3-3 summarizes the performance of
the scooter on all these surfaces. The range of values recorded in Table 3.3-3 represent the
minimum and maximum values of CoF observed under the given conditions.
Table 3.3-3: Summary of scooter performance on snow, ice and dry ice
Surface 𝝁𝒖𝒕𝒊𝒍𝒊𝒛𝒆𝒅 𝝁𝒂𝒗𝒂𝒊𝒍𝒂𝒃𝒍𝒆
Acceleration Deceleration Acceleration Deceleration
Snow 0.05 – 0.09 0.14 – 0.22 - -
Dry Ice 0.05 – 0.07 0.12 – 0.13 - -
Wet Ice 0.05 – 0.06 - - 0.05 – 0.06
The CoF utilized ( 𝜇𝑢𝑡𝑖𝑙𝑖𝑧𝑒𝑑) was higher for deceleration than for acceleration on snow and dry
ice. This was because the acceleration of the scooter was more gradual and gentle than the
braking. As a result, the horizontal forces, the CoF values observed during deceleration were
higher. The 𝜇𝑢𝑡𝑖𝑙𝑖𝑧𝑒𝑑on snow and dry ice never exceeded the 𝜇𝑎𝑣𝑎𝑖𝑙𝑎𝑏𝑙𝑒 and hence, we did not
observe any significant slips on these surfaces even during deceleration. The absence of slips on
snow and dry ice indicates that the Fortress 1700 DT is adequately equipped for these conditions,
‘off-the-shelf’. While this is true at moderate or low speed settings, it may not hold true at higher
speed settings and will certainly not hold true on inclines.

43
Even at a moderate speed in the absence of inclines, we observed significant slips during
deceleration on wet ice. As Figure 3.3-4 shows, the scooter was utilizing almost all the available
CoF during acceleration. Hence, when the more forceful deceleration maneuver was attempted, it
resulted in significant slippage. This behavior is problematic and poses a potential safety hazard.
The deceleration performance of the Fortress 1700 DT is evidently inadequate at moderate
speeds on wet ice.
The ‘acceleration profile’ of the scooter was not analyzed during this study. The primary reason
for this is that the control system of the scooter manages both the acceleration and deceleration
of the scooter and the user has little to no control over characteristics like the magnitude and
length of acceleration. To ensure that the performance of the scooter was not skewed by the way
the user applied the throttle or brake, the protocol (Section 3.2.4) instructed users to fully depress
or fully release the throttle. This ensured that the acceleration and deceleration was fully
managed by the scooter and a minimal amount of human error was introduced during testing.
The consistency of CoF values between trials (Figure 3.3-2, Figure 3.3-3, and Figure 3.3-4)
affirms the consistency of the acceleration profile between trials and the validity of our approach.
Figure 3.3-2: Tractive performance of scooter on snow
0.00
0.05
0.10
0.15
0.20
0.25
0 2 4 6 8 10
𝜇
Trial Number
Deceleration on Snow (Utilized CoF) Acceleration on Snow (Utilized CoF)

44
Figure 3.3-3: Tractive performance of scooter on dry ice
Figure 3.3-4: Tractive performance of scooter on wet ice
0.00
0.05
0.10
0.15
0.20
0.25
0 1 2 3 4 5 6
𝜇
Trial Number
Deceleration on Dry Ice (Utilized CoF) Acceleration on Dry Ice (Utilized CoF)
0.00
0.05
0.10
0.15
0.20
0.25
0 1 2 3 4 5 6
𝜇
Trial Number
Deceleration on Wet Ice (Available CoF) Acceleration Wet Ice (Utilized CoF)

45
3.3.4 Revised Table of Conditions
Based on our tests of the Fortress 1700 DT in winter conditions, we have made minor
modifications to the table of ASTM recommended course characteristics, as shown in Table
3.3-4. The list of revisions and the rationale for each is presented in Table 3.3-5.
Table 3.3-4: Revised recommendations for course characteristics
Surface
Description
Temperatures Penetrometer
Snow
Compaction
Surface and Footprint
Characteristics Ambient
Max
Surface
Min. Max.
Soft Pack
Snow +3°C -15°C -4°C 50-70
2.5cm – 5cm loose snow,
distinctive footprint
Medium
Pack Snow +3°C -15°C -4°C 71-84
No loose snow, somewhat
distinct footprint
Hard Pack
Snow +3°C -15°C -4°C 84-93
No loose snow, little to no
footprint
Ice-Dry 0°C -20°C -4°C 93-98 Smooth ice with no loose
materials
Ice-Wet 0°C -1°C 1°C 93-98 Smooth ice with liquid surface
layer (standard volume)
Table 3.3-5: Summary of revisions to ASTM recommended conditions
Condition Revision Rationale
Soft Pack
Snow
Reduced depth
of snow from ‘5-
7.5cm’ to ‘2.5-
5cm’
A snow depth of 5-7.5cm is appropriate for automotive
testing but is inappropriate for scooter testing. The ground
clearance of the Fortress 1700 DT is a mere 10cm. It would
be infeasible for a scooter user to go outside when the depth
of snow is >75% of their ground clearance and hence we feel
it is excessive to conduct snow testing at depths of up to
7.5cm
Medium
Pack Snow
Reduced depth
of snow from
‘2.5-5cm’ to ‘no
loose snow’
This change was made to adequately reflect the change to the
soft pack condition. From our testing, we noted minimal
loose snow when the snow was medium packed.
Medium
Hard Pack
Snow
Removed
The medium hard pack snow condition in the ASTM
recommendations encompasses a hardness range of 4. With
the variability of hardness readings that we saw (Figure
3.3-1), this condition was unduly narrow in its definition.
Hence, in the interest of simplicity, this condition was
removed and the hardness range of medium pack snow was
46
expanded to reflect the change.
Ice-Wet
Added
stipulation of
standard volume
As discussed in Section 3.3.1, we felt that the directions for
creating the wet ice surface were vague and hence we added
the stipulation of a standard volume of water for future tests.
3.3.5 Limitations
Rolling resistance
As discussed briefly in Section 2.4.2, the inability to measure rolling resistance using motion
capture is a limitation. The effects of rolling resistance are negligible on smooth surfaces like ice
and vinyl but the same cannot be said of snow. By virtue of the fact that snow has some depth
and is deformable, it will resist the motion of the scooter and affect its ability to accelerate. This
subtle but important effect cannot be capture using motion capture. Measuring this effect would
necessitate the installation of load cells on the scooter itself.
Temperature
As alluded to in Sections 3.3.1 and 3.3.2, the climate control functionality of WinterLab was
impaired during our testing. Sections 1.2.5 and 3.2.2 describe how temperature plays a very
important role in the mechanical and frictional properties of snow and ice. As such, our inability
to control the ambient temperature within the recommended boundaries could very well have
affected our performance measurements. We anticipate that this issue will be resolved ahead of
future testing.
Scooter
In this study, we only tested the Fortress 1700 DT, 4-wheeled scooter. We also conducted all
tests with one set of tires. While we believe that this scooter and its stock tires are a good
representation of an ‘average’ device with outdoor capabilities, there is undoubtedly the need to
test a broader range of devices and types of tires (including both ‘new’ and ‘worn’ tires), in the
future.

47
Inclines and cross-slopes
We conducted a very preliminary test with the Fortress 1700 DT on dry ice and noted that it
could not ascend a slope of four degrees when starting from rest and showed signs of slippage
while stopping on slopes of three degrees or more. This behavior is in stark contrast to the
completely ‘slip free’ performance of the device on flat, dry ice, as discussed in Section 3.3.3.
Scooter users in the real world will encounter a plethora of different conditions including uphill
slopes, downhill slopes and even cross slopes. In the interest of testing and understanding the
performance of scooters in the most realistic conditions possible, future tests on inclines are a
necessity.
3.4 Conclusion
This study is significant because it represents the first foray into the development of a rigorous
test method for scooters in winter conditions. Using the WinterLab and other tools at TRI, we
have demonstrated the ability to create a wide range of winter conditions in a controlled, indoor
environment. Furthermore, through the use of our novel motion capture based method, we were
able to quantify the tractive performance of a Fortress 1700 DT mobility scooter in these
simulated winter conditions.
We achieved the two primary objectives that we set out for this study and have produced: 1) a
revised list of recommended test conditions, 2) a detailed set of methods to create and
characterize these conditions, and 3) demonstrated our ability to quantify the performance of a
mobility scooter in these conditions.

48
Chapter 4 Conclusion
4.1 Conclusion
As Canada confronts an impending demographic shift brought on by the ‘baby boom’, the use of
powered WMAs is predicted to grow steadily in the coming years. Scooters in particular, are
expected to grow in popularity as older adults seek out alternative means of mobility.
Unfortunately, todays scooters are ill prepared to handle the challenging winter conditions that
are prevalent in Canada for up to six months per year. In fact, the user manuals of many scooters
will instruct owners not to go outdoors if it is raining or snowing. We believe that such
requirements are unacceptable and we are seeking to develop more rigorous, standardized tests to
ensure that scooters are safe and usable year-round.
We successfully met both of our objectives for this study:
1) To create and characterize a range of winter conditions, as outlined in the ASTM F1805-
06 and F1572-08 standards [57], [58].
2) To evaluate the tractive performance of a mobility scooter in these conditions.
There were three primary outcomes from this study:
1) A novel method to measure tractive coefficient using kinematic data from a motion
capture system
2) Methods to create and characterize a wide range of winter conditions including snow, dry
ice and wet ice
3) The straight line tractive performance characteristics of a Fortress 1700 DT, 4-wheeled
scooter in the winter conditions we created
This study is significant because it is the first to evaluate the performance of a mobility scooter
in winter conditions. The three outcomes of this study have paved the way for a much larger
study of scooter performance and safety at Toronto Rehab. The ultimate goal is to better inform
scooter designers and manufacturers, clinicians, and particularly users, on the safety and efficacy
of the devices on the market.

49
4.2 Future Work
Future work at Toronto Rehab is expected to include the following:
1) Tests on slopes including uphill, downhill and cross-slopes
2) Tests involving steering maneuvers
3) Tests with drivers of different skill levels
4) Tests with different makes, models and styles of scooters (for instance 3-wheeled and 4-
wheeled devices)
5) Tests in real world environments
Our long-term goal is to develop a rigorous, winter test method for scooters and incorporate this
method into existing technical standards. Doing so will ensure that scooters are adequately
designed and tested for safe, year-round use.

50
References
[1] A. Davies, L. H. De Souza, and A. O. Frank, “Changes in the quality of life in severely
disabled people following provision of powered indoor/outdoor chairs,” Disability &
Rehabilitation, vol. 25, no. 6, pp. 286–290, Jan. 2003.
[2] S. Evans, “Older adults’ use of, and satisfaction with, electric powered indoor/outdoor
wheelchairs,” Age and Ageing, vol. 36, no. 4, pp. 431–435, Jan. 2007.
[3] A. M. Koontz, “Design Features That Affect the Maneuverability of Wheelchairs and
Scooters,” Archives of Physical Medicine and Rehabilitation, vol. 91, no. 5, pp. 759–764,
May 2010.
[4] T. Dutta, “Design of built environments to accommodate mobility scooter users: part I,”
Disability & Rehabilitation: Assistive Technology, vol. 6, no. 1, pp. 67–76, Jan. 2011.
[5] Brandt Å., Iwarsson S., and Ståhle A., “Older peoples use of powered wheelchairs for
activity and participation,” Journal of Rehabilitation Medicine, vol. 36, no. 2, pp. 70–77,
2004.
[6] R. Cooper, “Trends and Issues in Wheeled Mobility Technologies,” Department of
Rehabilitation Science and Technology, University of Pittsburgh, 01-Oct-2003. [Online].
Available: http://www.ap.buffalo.edu/ideaproto/Space%20Workshop/Papers/WEB%20-
%20Trends_Iss_WC%20%28Cooper%29.htm. [Accessed: 26-Oct-2011].
[7] “Participation and Activity Limitation Survey (PALS),” Statistics Canada. [Online].
Available: http://www.statcan.gc.ca/cgi-
bin/imdb/p2SV.pl?Function=getSurvey&SDDS=3251&lang=en&db=imdb&adm=8&dis=2
. [Accessed: 28-Oct-2011].
[8] E. Steinfeld, V. Paquet, and D. Feathers, “Space Requirements for Wheeled Mobility
Devices,” Proceedings of the Human Factors and Ergonomics Society Annual Meeting, vol.
48, no. 8, pp. 1121 –1125, 2004.
[9] E. D. Lemaire, P. A. O’Neill, M. M. Desrosiers, and D. G. Robertson, “Wheelchair Ramp
Navigation in Snow and Ice-Grit Conditions,” Archives of Physical Medicine and
Rehabilitation, vol. 91, no. 10, pp. 1516–1523, Oct. 2010.
[10] O. Shirado, M. Shundo, K. Kaneda, and T. E. Strax, “Outdoor winter activities of spinal
cord-injured patients. With special reference to outdoor mobility,” Am J Phys Med Rehabil,
vol. 74, no. 6, pp. 408–414, Dec. 1995.
[11] “Population by broad age groups and sex, 2011 counts for both sexes, for Canada,
provinces and territories,” Statistics Canada, 2011. [Online]. Available:
http://www12.statcan.gc.ca/census-recensement/2011/dp-pd/hlt-fst/as-
sa/Pages/highlight.cfm?TabID=1&Lang=E&Asc=1&PRCode=01&OrderBy=999&Sex=1&
View=1&tableID=21&queryID=1. [Accessed: 26-Sep-2012].

51
[12] B. Curry, “Highlights: Canada’s baby boom larger than in other G8 countries,” The Globe
and Mail, 29-May-2012. [Online]. Available:
http://www.theglobeandmail.com/news/politics/highlights-canadas-baby-boom-larger-than-
in-other-g8-countries/article4217072/. [Accessed: 26-Sep-2012].
[13] Statistics Canada, “Population Projections for Canada, Provinces and Territories 2009-
2036,” Jun. 2010.
[14] B. Campion-Smith, “2011 Census: Canada is getting older,” The Toronto Star, 29-May-
2012.
[15] M. P. LaPlante and H. S. Kaye, “Demographics and Trends in Wheeled Mobility
Equipment Use and Accessibility in the Community,” Assistive Technology, vol. 22, pp. 3–
17, Mar. 2010.
[16] D. J. Barker, D. Reid, and C. Cott, “The experience of senior stroke survivors: factors in
community participation among wheelchair users,” Can J Occup Ther, vol. 73, no. 1, pp.
18–25, Feb. 2006.
[17] E. Cassell and A. Clapperton, “Consumer product-related injury (2): Injury related to the
use of motorised mobility scooters,” Monash University, 62, 2006.
[18] J. A. Davey, “Older people and transport: coping without a car,” Ageing & Society, vol. 27,
no. 01, pp. 49–65, 2007.
[19] M. Gilhooly, K. Hamilton, M. O’Neill, J. Gow, N. Webster, F. Pike, and D. Bainbridge,
“Transport and ageing: extending quality of life for older people via public and private
transport,” 2002.
[20] Motorized Personal Mobility Devices Working Group, “CCMTA Discussion Paper and
Recommendations Regarding Issues of Managing Motorized Personal Mobility Devices
(MPMDs),” Canadian Council of Motor Transport Administrators, Oct. 2010.
[21] J. McKinnell, “Beware of seniors driving scooters,” Maclean’s, vol. 122, no. 45, p. 75, 23-
Nov-2009.
[22] P. V. Steyn and A. S. Chan, “Mobility Scooter Research Project,” University of the Fraser
Valley, Abbottsford, British Columbia, Mar. 2008.
[23] K. Gibson, J. Ozanne-Smith, A. Clapperton, F. Kitching, and E. Cassell, “Targeted study of
injury data involving motorised mobility scooters,” Product Safety Australia, 24-Mar-2011.
[Online]. Available:
http://www.productsafety.gov.au/content/index.phtml/itemId/985925/fromItemId/973401.
[Accessed: 20-Aug-2012].
[24] A. Lawes, “Invasion of the scooters,” Drive. [Online]. Available:
http://news.drive.com.au/drive/motor-news/invasion-of-the-scooters-20100225-p4nr.html.
[Accessed: 20-Aug-2012].

52
[25] “Mobility scooters’ fatal role,” Australian Doctor. [Online]. Available:
http://www.australiandoctor.com.au/News/Latest-News/Mobility-scooters--8217;-fatal-role.
[Accessed: 20-Aug-2012].
[26] The Royal Society for the Prevention of Accidents, “House of Commons Transport
Committee Inquiry ‘Mobility Scooters’,” Jan. 2010.
[27] Canada Mortgage and Housing Corporation., Measuring the effort needed to climb access
ramps in a manual wheelchair. [Ottawa]: CMHC, 2005.
[28] M. of H. and L.-T. C. Government of Ontario, “Assistive Devices Program- Categories of
Assistive Devices Covered by the Ministry of Health and Long-Term Care - Public
Information - MOHLTC,” 26-Jun-2012. [Online]. Available:
http://www.health.gov.on.ca/en/public/programs/adp/categories.aspx. [Accessed: 09-Oct-
2012].
[29] C. E. Harnett, “Scooters becoming a hazard, police say; Drivers untested, uninsured and
sometimes unmanageable: [1],” Times - Colonist, Victoria, B.C., Canada, 01-Aug-2010.
[30] Canadian Agency for Drugs and Technologies in Health, “Medical Device Regulation In
Canada: A Primer,” Health Technology Update, no. 5, Jan. 2007.
[31] M. of T. Government of Ontario, “New and Alternative Vehicles: Personal Mobility
Devices (Motorized Wheelchairs and Medical Scooters),” 27-Apr-2012. [Online].
Available: http://www.mto.gov.on.ca/english/dandv/vehicle/emerging/index.shtml.
[Accessed: 09-Oct-2012].
[32] R. A. Cooper, “Wheelchair Standards: It’s All About Quality Assurance and Evidence-
based Practice,” J Spinal Cord Med, vol. 29, no. 2, pp. 93–94, 2006.
[33] C. A. McLaurin and P. Axelson, “Wheelchair standards: an overview.,” Journal of
rehabilitation research and development. Clinical supplement/Veterans Administration, no.
2, p. 100, 1990.
[34] I.-I. O. for Standardization, “ISO 7176-9:2009 Wheelchairs -- Part 9: Climatic tests for
electric wheelchairs.” [Online]. Available:
http://www.iso.org/iso/catalogue_detail.htm?csnumber=50102. [Accessed: 27-Oct-2011].
[35] A. J. Rentschler, R. A. Cooper, S. G. Fitzgerald, M. L. Boninger, S. Guo, W. A. Ammer,
M. Vitek, and D. Algood, “Evaluation of selected electric-powered wheelchairs using the
ANSI/RESNA standards,” Archives of Physical Medicine and Rehabilitation, vol. 85, no. 4,
pp. 611–619, Apr. 2004.
[36] I.-I. O. for Standardization, “ISO 7176-13:1989 Wheelchairs -- Part 13: Determination of
coefficient of friction of test surfaces.” [Online]. Available:
http://www.iso.org/iso/catalogue_detail.htm?csnumber=13789. [Accessed: 27-Oct-2011].

53
[37] J. Abeysekera and C. Gao, “The identification of factors in the systematic evaluation of slip
prevention on icy surfaces,” International Journal of Industrial Ergonomics, vol. 28, no. 5,
pp. 303–313, Nov. 2001.
[38] F. Gustafsson, “Slip-based tire-road friction estimation,” Automatica, vol. 33, no. 6, pp.
1087–1099, 1997.
[39] K. J. Walus and Z. Olszewski, “Analysis Of Tire-road Contact Under Winter Conditions,”
in Proceedings of the World Congress on Engineering 2011, London, England, 2011, vol.
3, pp. 2381–2384.
[40] R. Grönqvist, M. Hirvonen, and A. Tohv, “Evaluation of three portable floor slipperiness
testers,” International Journal of Industrial Ergonomics, vol. 25, no. 1, pp. 85–95, Jan.
2000.
[41] F13 Committee, “Standard Practice for Validation and Calibration of Walkway Tribometers
Using Reference Surfaces,” ASTM International, 2011.
[42] G. W. Stachowiak and A. W. Batchelor, Engineering tribology, 3rd ed. Butterworth-
Heinemann, 2005.
[43] S. C. Colbeck, “A review of the processes that control snow friction,” DTIC Document,
1992.
[44] F. P. Bowden, “Friction on Snow and Ice,” Proceedings of the Royal Society of London.
Series A, Mathematical and Physical Sciences, vol. 217, no. 1131, pp. pp. 462–478, 1953.
[45] R. Ericksson, “Friction of runners on snow and ice,” DTIC Document, 1955.
[46] L. H. Shapiro, J. B. Johnson, M. Sturm, and G. L. Blaisdell, “Snow Mechanics: Review of
the State of Knowledge and Applications,” Aug. 1997.
[47] C. D. Niven, “On the Friction of Inflated Rubber Tires on Ice,” Canadian Journal of
Physics, vol. 36, no. 5, pp. 599–610, May 1958.
[48] K. G. Libbrecht, “The physics of snow crystals,” Reports on Progress in Physics, vol. 68, p.
855, 2005.
[49] M. R. De Quervain, “Problems of avalanche research,” in International Symposium on
Scientific Aspects of Snow and Ice Avalanches, 1966, pp. 15–22.
[50] R. L. Brown, “Perspective on mechanical properties of snow,” in Proceedings of the 1st
International Conference on Snow Engineering, 1989, pp. 89–6.
[51] J. Schweizer and C. Camponovo, “The temperature dependence of the effective elastic
shear modulus of snow,” Cold Regions Science and Technology, vol. 35, no. 1, pp. 55–64,
Jun. 2002.

54
[52] C. Fierz, R. L. Armstrong, Y. Durand, P. Etchevers, E. Greene, D. M. McClung, K.
Nishimura, P. K. Satyawali, and S. A. Sokratov, The international classification for
seasonal snow on the ground. UNESCO/IHP, 2009.
[53] S. Kinosita, E. Akitaya, M. E. Volz, and A. Poulin, “Classification of Snow and Ice on
Roads,” Highway Research Board Special Report, no. 115, 1970.
[54] A. Judson and N. Doesken, “Density of Freshly Fallen Snow in the Central Rocky
Mountains.,” Bulletin of the American Meteorological Society, vol. 81, pp. 1577–1588, Jul.
2000.
[55] M. Stoffel, Numerical Modelling of Snow Using Finite Elements. vdf Hochschulverlag AG,
2006.
[56] W. R. Janowski, “Tire Traction Testing in the Winter Environment,” SAE International,
Warrendale, PA, 800839, Jun. 1980.
[57] F09 Committee, “Test Method for Single Wheel Driving Traction in a Straight Line on
Snow- and Ice-Covered Surfaces,” ASTM International, 2006.
[58] F09 Committee, “Test Methods for Tire Performance Testing on Snow and Ice Surfaces,”
ASTM International, 2008.
[59] G. Phetteplace, S. Shoop, and T. Slagle, “Measuring Lateral Tire Performance on Winter
Surfaces,” Tire Science and Technology, vol. 35, no. 1, p. 56, 2007.
[60] Brake Forum Steering Committee, “Antilock Brake System Review.” 01-Jun-1992.
[61] “Fortress 1700 DT/TA - Handicare Canada,” Handicare Canada. [Online]. Available:
http://www.handicare.ca/1/Products/Scooters/Fortress/Fortress-1700-DTTA/. [Accessed:
30-Jan-2013].
[62] D. A. Winter, Biomechanics and motor control of human movement. John Wiley & Sons
Inc, 2009.
[63] J. F. Brown, K. S. Obenski, and T. R. Osborn, Forensic engineering reconstruction of
accidents. Charles C Thomas Publisher, 2002.
[64] T. Haavasoja, J. Nylander, and P. Nylander, “Experiences of Mobile Road Condition
Monitoring,” in 16th SIRWEC Conference, 2012.
[65] T. Haavasoja and Y. Pilli-Sihvola, “Friction as a measure of slippery road surfaces,” in
Proceedings of SIRWEC 15th International Road Weather Conference, 2010, pp. 5–7.
[66] A. N. Gent and J. D. Walter, “Pneumatic Tire.,” National Highway Traffic Safety
Administration, 2006.
[67] J. Y. Wong, Theory of Ground Vehicles. John Wiley & Sons, 2001.
[68] R. Stone and J. K. Ball, “Automotive Engineering Fundamentals,” 2004.

55
[69] “Snow Business - World Leaders in Artificial Snow and Winter Effects,” Snow Business.
[Online]. Available: http://www.snowbusiness.com/. [Accessed: 24-Jan-2013].
[70] “C&EN: What’s that stuff? - Artificial Snow,” Chemical and Engineering News, 19-Jan-
2004. [Online]. Available:
http://pubs.acs.org.myaccess.library.utoronto.ca/cen/whatstuff/stuff/8203snow.html.
[Accessed: 24-Jan-2013].
[71] “Make snow at home with Backyard Blizzard home snowmaking machine.,” Backyard
Blizzard Home Snowmaker. [Online]. Available:
http://www.backyardblizzard.com/index.htm. [Accessed: 24-Jan-2013].
[72] U. Nakaya, Snow crystals: natural and artificial. Harvard University Press, 1954.
[73] D. Buhl, M. Fauve, and H. Rhyner, “The kinetic friction of polyethylen on snow: the
influence of the snow temperature and the load,” Cold regions science and technology, vol.
33, no. 2–3, pp. 133–140, 2001.
[74] J. Schweizer and C. Camponovo, “The temperature dependence of the effective elastic
shear modulus of snow,” Cold Regions Science and Technology, vol. 35, no. 1, pp. 55–64,
Jun. 2002.
[75] M. Mellor, C. R. Research, and E. L. (US), A review of basic snow mechanics. US Army
Cold Regions Research and Engineering Laboratory, 1974.
[76] G. L. Blaisdell and W. L. Harrison, “Measurement of Snow Surfaces and Tire Performance
Evaluation,” SAE International, Warrendale, PA, 820346, Feb. 1982.
56
Appendix A
A1 Introduction
The biggest challenge we faced in attempting to quantify the tractive performance of our Fortress
1700 DT scooter was capturing kinetic data. In the automotive tire testing world, standard
practice is to use an instrumented test vehicle. For instance, the vehicle described by Blaisdell
and Harrison [76] features tri-axial load cells installed into the front wheel assemblies and a fifth
wheel to measure speed and distance. While it is not impossible to instrument the Fortress 1700
DT, our goal was to develop a test method that is easily reproducible but also accurate. As such,
we decided to collect kinetic and kinematic data from external sensors in the test environment, as
opposed to sensors housed within the scooter itself.
This approach is common in biomechanics research. Force plates and motion capture systems are
commonly used to collect kinetic and kinematic data respectively. However, adapting traditional
sensors to collect data from a scooter and in a simulated winter environment was a technical
challenge. Several different apparatuses were designed, built and tested before we arrived at our
final set-up. This section outlines the various methods we tried to quantify the tractive
performance of the Fortress 1700 DT scooter.
A2 Tension Load Cell Testing
Overview: The objective of this test was to determine whether a single-axis load cell could be
used to accurately capture the horizontal shear force generated by the scooter and ultimately,
calculate the coefficient of friction between the scooter and a test surface.
Method: The scooter was tied to a LPO-2K (Transducer Techniques, Temecula, CA, USA)
single-axis, tension and compression load cell which was then tied to a scissor-lift outside
WinterLab. This was equivalent to the scooter being tied to an immobile post. The test set-up is
shown in Figure A1. Data were sampled at a rate of 1000 Hz and filtered using a low-pass, fourth
order, zero phase-lag Butterworth filter with a cutoff frequency of 45 Hz.
Testing was conducted with three participants of different weights and with different speed
selections on the scooter, ranging from slowest to fastest. Tests were conducted on ice and
concrete. At the start of each trial, the scooter was in a position which allowed for some slack in

57
the attachment rope. Next, each subject drove the scooter forward until the attachment rope was
taut. The throttle was held at max for several seconds before being gradually released. The
scooter was then reversed back to the starting position.
Outcome: This method yielded horizontal shear force data like the ones shown in Figure A2
which shows results for six trials on ice. Each trial represents a different speed setting on the
scooter. The primary drawback of using this method is the quality and accuracy of the results. As
shown in Figure A2, there are large spikes in the force readings as the scooter initially wrenches
on the load cell. These spikes were not systematic and their magnitudes depended on how the
scooter operator applied the throttle prior to the tautening of the rope. If the scooter got up to a
higher speed and wrenched on the load cell, the spike was higher and vice-versa if the speed was
lower.
After the rope was taut, the rear (driven) wheels spun freely on the ice surface but not on the
concrete surface. This indicated that the available coefficient of friction between the tires and the
ice surface was being exceeded. The force data from this free spinning showed up as a plateau
after the initial spike and were prone to noise (as shown in Figure A2). The horizontal force in
this region was calculated as a mean over the range of the plateau.
One additional concern with using this method is the effect it has on the ice surface. Due to the
repeated spinning of the scooter’s tires on one region of the ice, the ice eroded over time and two
small depressions were formed under the rear tires. While problematic on ice, this surface
erosion would be particularly ineffective on snow, which is far more deformable than ice.
Summary: Due to challenges with large spikes in the force data, noisy plateaus and surface
erosion, the tension based method of friction measurement was not used as the primary test
method.

58
Figure A1: Scooter in WinterLab, tied to tension load cell and scissor-lift
Figure A2: Sample results from tension testing on ice

59
A3 Incline Testing
Overview: The objective of this test was to determine the efficacy of using slopes to determine
the static tractive performance of a scooter. By recording the angle at which the scooter began to
slip, we sought to quantify the static traction of the scooter.
Method: A wooden container was filled with several inches of water and frozen over several
days in Winter Lab. This ice ‘tray’ was then mounted on a trolley jack such that it tipped when
the jack was raised. An analog inclinometer was mounted on the tray to quantify tip angles.
Varying weights were added to the scooter seat and the scooter was then lowered onto the ice
tray using an overhead crane, as shown in Figure A3. Once the scooter was in position, the tip
angle was incrementally increased until the scooter slipped, as shown in Figure A4.
Combinations of three different weights and tip directions (forwards, backwards and cross) were
tested. Three trials were conducted for each condition. As soon as slippage was observed, the
angle was read from the inclinometer and recorded.
Outcome: The results for all test conditions are shown in Table A1. There were several
shortcomings in the method we used. Firstly and most importantly, the accuracy and precision of
the measured tip angle was low. This was because we used an analog inclinometer and took data
readings manually. As a result, the angle readings were accurate to a quarter of a degree at best.
Second, the way we incremented tip angle was imprecise. The trolley jack was more a tool of
convenience than accuracy. Third, our testing was conducted in a room temperature environment
which resulted in rapid melting and degradation of our ice surface. The scooter tires created
depressions in the ice after several trials and the ice began to crack and fragment at the corners of
the tray. Lastly, the way we detected slipping was very informal and prone to human error.
Researchers carefully watched the scooter tires and called for a stop in increasing the angle when
they felt the scooter was sliding.
Summary: Overall, the method we used was inaccurate for formal testing and future studies,
however, the underlying rationale behind the tests was sound. We did see different results
depending on the direction of tipping and this is an important finding in the context of real world
scooter use. As each device has a different weight distribution on the front and back wheels,
naturally each device will have a different maximal angle that it can traverse uphill, downhill or
sideways.
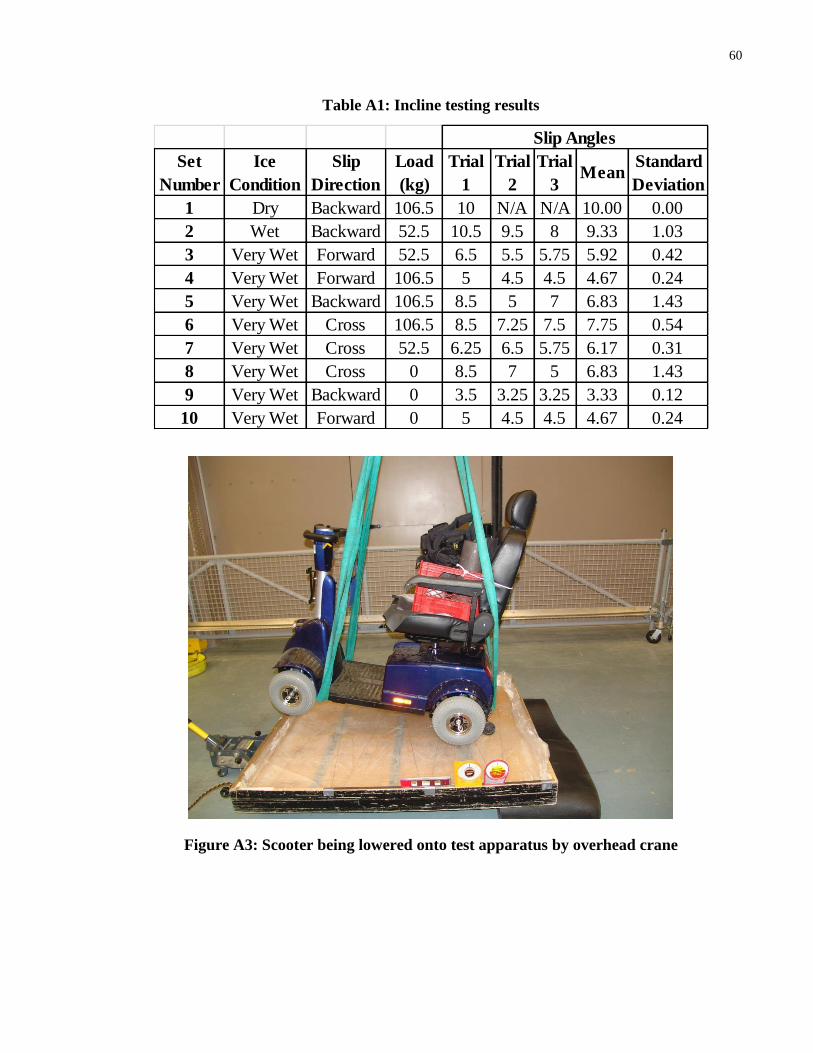
60
Table A1: Incline testing results
Figure A3: Scooter being lowered onto test apparatus by overhead crane
Set
Number
Ice
Condition
Slip
Direction
Load
(kg)
Trial
1
Trial
2
Trial
3Mean
Standard
Deviation
1 Dry Backward 106.5 10 N/A N/A 10.00 0.00
2 Wet Backward 52.5 10.5 9.5 8 9.33 1.03
3 Very Wet Forward 52.5 6.5 5.5 5.75 5.92 0.42
4 Very Wet Forward 106.5 5 4.5 4.5 4.67 0.24
5 Very Wet Backward 106.5 8.5 5 7 6.83 1.43
6 Very Wet Cross 106.5 8.5 7.25 7.5 7.75 0.54
7 Very Wet Cross 52.5 6.25 6.5 5.75 6.17 0.31
8 Very Wet Cross 0 8.5 7 5 6.83 1.43
9 Very Wet Backward 0 3.5 3.25 3.25 3.33 0.12
10 Very Wet Forward 0 5 4.5 4.5 4.67 0.24
Slip Angles
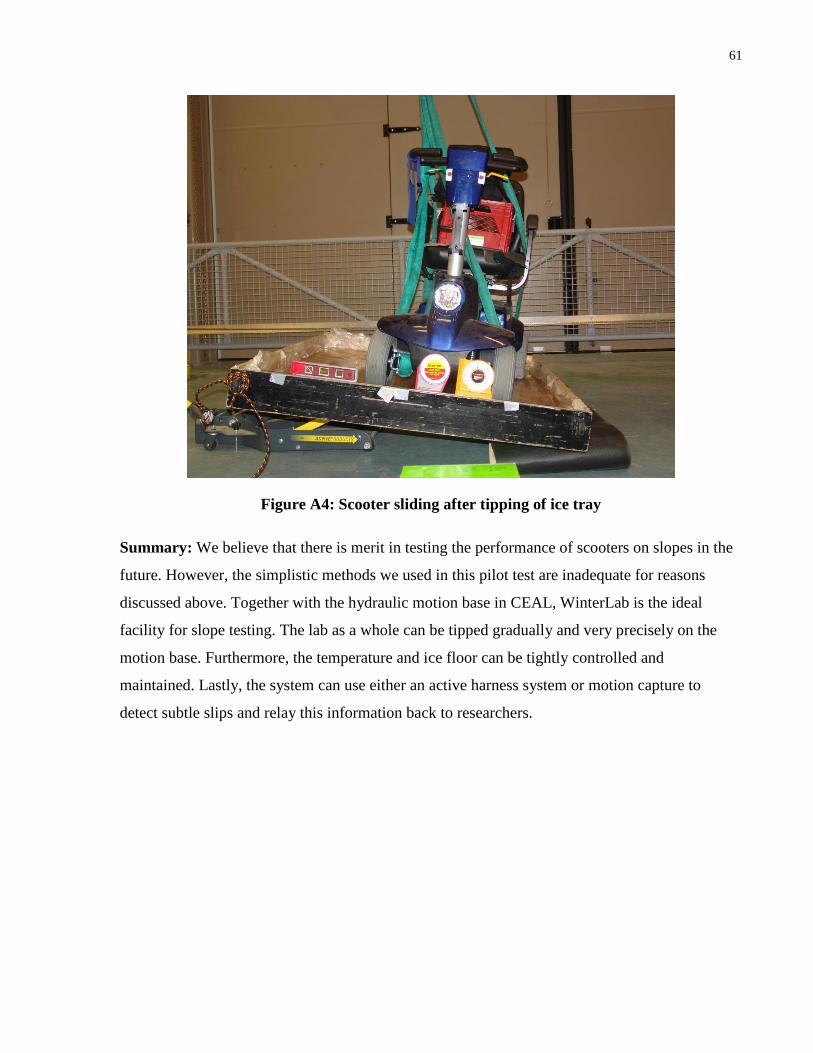
61
Figure A4: Scooter sliding after tipping of ice tray
Summary: We believe that there is merit in testing the performance of scooters on slopes in the
future. However, the simplistic methods we used in this pilot test are inadequate for reasons
discussed above. Together with the hydraulic motion base in CEAL, WinterLab is the ideal
facility for slope testing. The lab as a whole can be tipped gradually and very precisely on the
motion base. Furthermore, the temperature and ice floor can be tightly controlled and
maintained. Lastly, the system can use either an active harness system or motion capture to
detect subtle slips and relay this information back to researchers.

62
A4 Driveway Panel Instrumented with Load Cells
Overview: The objective of these tests was to design and implement an instrumented ‘panel’
which would enable the collection of kinetic (tri-axial force) data. We sought to capture both
normal and shear forces, and by extension Coefficient of Friction (CoF) from this panel as the
scooter drove over it. We built and pilot-tested two panel designs to determine whether this
approach was feasible.
Method: For our first panel design, we used four MC3A (AMTI Inc., Watertown, MA, USA)
six-axis load/torque cells. We designed and built a single platform panel using 2x4 sections and
3/4" plywood that would possess the structural strength to support the weight of a scooter and
operator. We also designed special aluminum mounting plates to attach the load cells to the
panel. Figure A5 shows a CAD drawing of the setup.
For our second panel design, we used two BP400600, weather-resistant force plates (AMTI Inc.,
Watertown, MA, USA). We built a 12 foot x 3 foot ‘deck’ using 3/4" plywood sheets and
mounted this deck on two, 4” side aluminum beams. These beams were then mounted to the
force plates. Figure A6 shows a picture of the assembled setup.
Outcome: Conceptually, there should be no forces in the horizontal direction while the scooter is
stationary. The only force that should register is the normal force. However, this was not the
result we observed during our discreet load cell tests. There was a noticeable spike in one of the
two horizontal forces despite the fact that the scooter was stationary. Furthermore, when the
scooter was driven on the platform, forces were detected in both horizontal axes despite motion
in just one axis.
We believe that this result was a symptom of bending in the panel. A diagonal force was exerted
on the load cells because the longitudinal beams of the panel bent under the load of the scooter.
This diagonal force equated to a ‘horizontal’ force when resolved into its component parts.
Furthermore, the erroneous horizontal forces reported by the load cells were not consistent or
systematic in nature. As a result, it was not possible to account for this error in post-processing.
Similarly, we encountered problems using force plates in the WinterLab. Instead of bending, the
primary problem with using force plates arose from expansion and contraction. Even with no
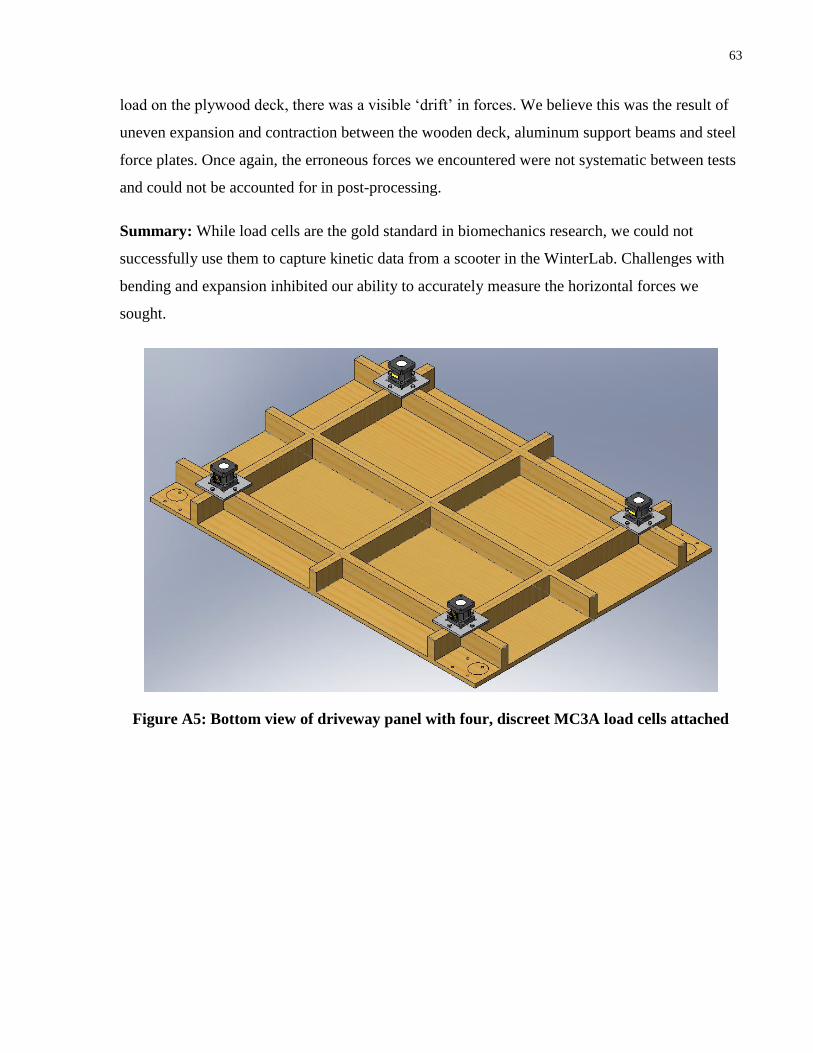
63
load on the plywood deck, there was a visible ‘drift’ in forces. We believe this was the result of
uneven expansion and contraction between the wooden deck, aluminum support beams and steel
force plates. Once again, the erroneous forces we encountered were not systematic between tests
and could not be accounted for in post-processing.
Summary: While load cells are the gold standard in biomechanics research, we could not
successfully use them to capture kinetic data from a scooter in the WinterLab. Challenges with
bending and expansion inhibited our ability to accurately measure the horizontal forces we
sought.
Figure A5: Bottom view of driveway panel with four, discreet MC3A load cells attached

64
Figure A6: Assembled (top) and disassembled (bottom) views of driveway panel mounted
on weather resistant force plates

65
Copyright Acknowledgements
Figure 1.2-1: Relationship between Coefficient of Friction and Diameter of Grains [45] was
reproduced from a Defense Technical Information Center (DTIC) report:
R. Ericksson, “Friction of runners on snow and ice,” DTIC Document, 1955.
DTIC copyright guidelines state that:
“U.S. Government works prepared by officers and employees of the U.S. Government as part of
their official duties are not protected by copyright in the U.S. These works may be copied and
distributed in their entirety without permission. Users should note and attribute the U.S.
Government agency and private author when incorporating works of the U.S. Government in a
copyrighted publication.”
Available: http://www.dtic.mil/dtic/pdf/announcements/CopyrightGuidance.pdf [Accessed: 14-
Aug-2013].