developing regional connectivity between countries of the
TRANSCRIPT

Developing Regional Connectivity Between Countries of the Guyana Shield and South America
Andy RicoverNovember of 2015

2
Objectives of the Report
§ To investigate the current level of connectivity of the countries of the Guyana Shield with the rest of South America
§ To investigate the main causes of the constraints to regional air connectivity between countries of the Guyana Shield and with the other UNASUR states

3
Assessment rationale
Connectivity of the Guyana Shield
Refocusing ofScope:Guyana andSuriname
Study Scope
Assessment sections
The state of the Airport Infrastructure
The cost of the Airport Infra-structure
Air Service Agreements
Market Outlook
Institutional Framework
Recommendationsand Next Steps

4
Current connectivity of the countries of the Guyana Shield
International connectivity of Brazil and Venezuela
Source: OAG and ANAC Brazil.

5
Current connectivity of the countries of the Guyana Shield
International connectivity of Guyana and Suriname
No direct services to countries in South America
(except Brazil for PBM)
Source: OAG and ANAC Brazil.

6
Current connectivity of the countries of the Guyana ShieldAnnual International seats, international airports and number of international markets
Connectivity levels similar to the most developed economies
Source: OAG and ANAC Brazil.
4
8
12
16
20
10 20 30 40 50 60 70
Airports with regular international services
Number of international markets served
Size of bubble: number of international annual departing seats - in millions
21.9
2.7
BrazilVenezuela
Guyana - 0.5
Surinam - 0.3

7
Assessment rationale
Connectivity of the Guyana Shield
Refocusing ofScope:Guyana andSuriname
Study Scope
Assessment sections
The state of the Airport Infrastructure
The cost of the Airport Infra-structure
Air Service Agreements
Market Outlook
Institutional Framework
Recommendationsand Next Steps

8
Analysis of Airport Infrastructure in Guyana and Suriname
§ Objective: determine if existing airport infrastructure poses constraints to the development of regional connectivity
§ Analysis focuses on potential capacity and technical constraints, both on airside and landside facilities

9
Airport Infrastructure - Guyana
§Airside
§ 2 paved runways
§ Capable of Code E aircraft (747s, 777s) for long haul services
Georgetown Cheddi Jagan Intl. Airport (GEO)
§ Terminal building - issues
§ Crowded terminal during peak periods (twice per day)
§ Delays in processing departures due to operational bottlenecks
Peak hour issues

10
Airport Infrastructure - Guyana
Ogle International Airport (OGL)
§Airside
§ Runway 07/25: concrete, no ILS (no reduced visibility capabilities)
§ Suitable for small turboprop operations of up to (approximately) 50 seats

11
Airport Infrastructure - Suriname
§Airside
§ One runway
§ ICAO Code E aircraft (747s, 777s)
§ ILS, VOR, DME: reduced visibility capabilities
Paramaribo Johan Adolf Pengel Intl. Airport (PBM)
§ Terminal building - expansion plan
§ In 2012, Government initiated expansion plan at PBM: initial projected investment of USD 70m
§ Between 2012-2013, investments carried out for USD 28.5 million

12
Airport Infrastructure - Suriname
Zorg En Hoop Airport (ORG)
§Airside
§ Runway 11/29 paved with asphalt
§ Capable of short haul services of turboprop ops of up to 19 seaters

13
Airport Infrastructure - main conclusions
§ Current state of infrastructure of GEO and PBM is no constraint to the development of the regional air connectivity
§ Runway determines capacity, and both airports have enough capacity to support growth
§ If needed investments (for passenger terminals) are not carried out, Level of Service could be reduced in the future, but will not limit growth

14
Assessment rationale
Current Connectivity of the Guyana Shield
Refocusing of scope:Guyana andSuriname
Study Scope
Assessment sections
Airport Infrastructure
The cost of Airport Infra-structure
Air Service Agreements
Market Outlook
Institutional Framework
Recommendationsand Next Steps
15
Analysis of the cost of Airport Infrastructure
§ Objective: to identify if the related cost to operate at PBM andGEO is comparatively high, and if it could hamper traffic development
§ A Benchmarking analysis was performed to assess the pricing positioning of GEO and PBM with another 12 airports in main cities of South America

16
0
25
50
75
100
125
150
PFC Security & Other fixed fees Taxes on ticket
Sample Average: USD 91.7
The cost of Airport Infrastructure
Passenger charges at 14 South American airports
In USD per embarked passenger
Source: consultant, consultant using information from ORSNA (Argentina), Galeao International Airport (Rio de Janeiro), Guarulhos International Airport (Sao Paulo), OPAIN S.A. (Bogota), DGAC Chile, Montevideo International Airport, SABSA Bolivia, Lima Airport Partners, Johan Adolf Pengel International Airport (Paramaribo), Copa Airlines, Caribbean Airlines, Suriname Airways and IATA Airport, ATC and Fuel Charges Monitor 2014.Note*: Taxes on ticket assume a return-ticket cost of USD 500.

17
0
200
400
600
800
1,000
1,200
Landing fees Parking fees
Sample Average: USD 537.3
The cost of Airport Infrastructure
Charges on airlines at 14 South American airports
In USD, assuming a 2 hour turnaround
Source: consultant, consultant using information from ORSNA (Argentina), Galeao International Airport (Rio de Janeiro), Guarulhos International Airport (Sao Paulo), OPAIN S.A. (Bogota), DGAC Chile, Montevideo International Airport, SABSA Bolivia, Lima Airport Partners, Johan Adolf Pengel International Airport (Paramaribo), Copa Airlines, Caribbean Airlines, Suriname Airways and IATA Airport, ATC and Fuel Charges Monitor 2014.

18
0
2,000
4,000
6,000
8,000
10,000
12,000
14,000
16,000
18,000
20,000
Pax charges Charges on airlines
Sample Average: USD 12,574
The cost of Airport Infrastructure
Charges on passengers and charges on airlines at 14 South American airports
In USD, assuming a 2 hour turnaround
Source: consultant, consultant using information from ORSNA (Argentina), Galeao International Airport (Rio de Janeiro), Guarulhos International Airport (Sao Paulo), OPAIN S.A. (Bogota), DGAC Chile, Montevideo International Airport, SABSA Bolivia, Lima Airport Partners, Johan Adolf Pengel International Airport (Paramaribo), Copa Airlines, Caribbean Airlines, Suriname Airways and IATA Airport, ATC and Fuel Charges Monitor 2014.Note*: Taxes on ticket assume a return-ticket cost of USD 500.

19
Cost of Airport Infrastructure - main conclusions
§ The cost of airport infrastructure at GEO and PBM is within the average of that of South America’s largest airports
§ The pricing positioning of GEO and PBM with regards to the main airports of South America does not pose any constraints to the development of traffic

20
Assessment rationale
Connectivity of the Guyana Shield
Refocusing of Scope:Guyana andSurinam
Study Scope
Assessment sections
Airport Infrastructure
The cost of Airport Infra-structure
Air Service Agreements
Market Outlook
Institutional Framework
Recommendationsand Next Steps

21
Analysis of the Institutional framework
§ Analysis of the institutional framework: essential for development of a healthy sector
§ Assessment of bodies responsible for the different functions ofthe institutional framework
§ Special focus on situations that could jeopardize the development of commercial air transport in the near future

22
Institutional framework - Guyana
§ Conflicts of interest
§ GCAA in Category 2 of IASA program: no Guyanese airline can access US markets
Policy makingPolicy making Technical RegulationTechnical Regulation OperationsOperations Accidents
InvestigationAccidents
Investigation
ATCATC AirportsAirports AirlinesAirlines
Guyana Civil Aviation Authority (GCAA)
Guyana Civil Aviation Authority (GCAA)
GCAAGCAA GCAAGCAATrans Guyana
Airways /Air Guyana /
Others
Trans Guyana Airways /
Air Guyana / Others
GCAAGCAA
Cheddi JaganInternational
Airport Corporation
Cheddi JaganInternational
Airport Corporation

23
Institutional framework - proposed reforms - Guyana
§ Policy making functions should be transferred to a different entity than GCAA, potentially the Minister of Public Works
§ Air traffic control operations should be transferred to another entity (independent from GCAA)
§ Independent committee or board should be created to investigate accidents and incidents§ Report directly to the President or the Guyanese Parliament

24
Institutional framework - Suriname
§ Conflict of interest
§ Proposed reform: creation of independent board for accidents and incidents investigation
§ Report directly to the President or the Surinamese Parliament
Policy makingPolicy making Technical RegulationTechnical Regulation OperationsOperations Accidents
InvestigationAccidents
Investigation
ATCATC AirportsAirports AirlinesAirlines
Ministry of Transport, Communic. and Tourism
(MTCT)
Ministry of Transport, Communic. and Tourism
(MTCT)
Civil Aviation Safety
Authority Suriname (CASAS)
Civil Aviation Safety
Authority Suriname (CASAS)
Department of Civil Aviation
(DCA)
Department of Civil Aviation
(DCA)
Suriname Airways /
Fly All Ways / Others
Suriname Airways /
Fly All Ways / Others
CASASCASASAirport
Management Ltd.
Airport Management
Ltd.

25
Institutional framework - main conclusions
§ Existing conflicts of interest in Guyana and Surinam are no constraints to development of connectivity
§ However, they could potentially affect the proper functioning oflocal airlines in the future
§ Clear separation of functions would foster unrestricted market access and a competitive environment

26
Assessment rationale
Current Connectivity of the Guyana Shield
Refocusing of scope:Guyana andSurinam
Study Scope
Assessment sections
Airport Infrastructure
The cost of Airport Infra-structure
Air Service Agreements
Market Outlook
Institutional Framework
Recommendationsand Next Steps

27
Analysis of Air Service Agreements
§ Objective: to determine if the conditions stated in the ASAs are currently acting as constraints to the development of the regional connectivity
§ ASAs were analyzed in terms of available capacities, airline designation and the grant of fifth, sixth and seventh freedom rights
28
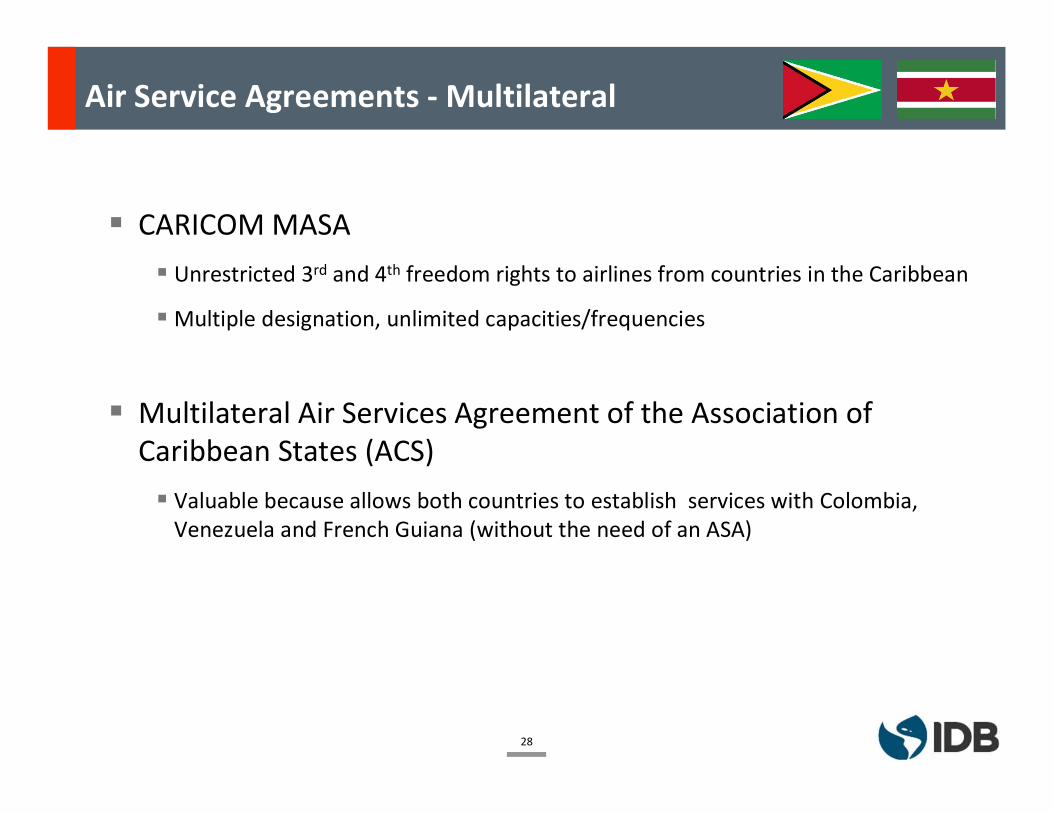
Air Service Agreements - Multilateral
§ CARICOM MASA§ Unrestricted 3rd and 4th freedom rights to airlines from countries in the Caribbean
§Multiple designation, unlimited capacities/frequencies
§ Multilateral Air Services Agreement of the Association of Caribbean States (ACS)§ Valuable because allows both countries to establish services with Colombia,
Venezuela and French Guiana (without the need of an ASA)
29
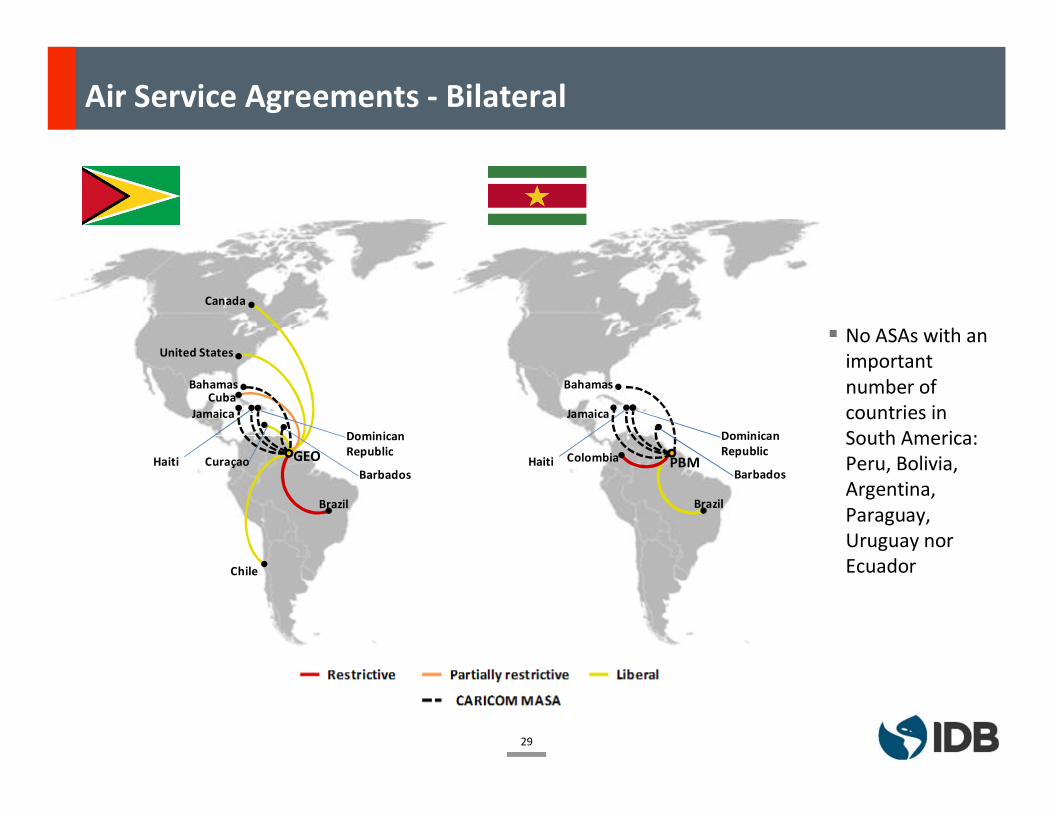
Restrictive Partially restrictive Liberal
CARICOM MASA
PBM
Brazil
Colombia
Jamaica
Haiti
Dominican Republic
Barbados
Bahamas
Air Service Agreements - Bilateral
Brazil
Restrictive Partially restrictive Liberal
GEO
Cuba
United States
Canada
Chile
Jamaica
CARICOM MASA
Haiti
Dominican Republic
Bahamas
CuraçaoBarbados
§ No ASAs with an important number of countries in South America: Peru, Bolivia, Argentina, Paraguay, Uruguay nor Ecuador

30
Air Service Agreements - Guyana
§Only 4 of Guyana's 20 ASAs are currently being exploited:
§ United states (with regular services to Miami, New York and Orlando)
§ Canada (with services to Toronto)
§ Curacao
§ Cuba (only a few seasonal services to La Habana)
Source: consultant, based on information from World Trade Organization, "Trade Policy Review - Report by the Secretariat - Guyana", June of 2009.
Capacity, designation and code sharing restrictions in Guyana's ASAs

31
2
00
1
2
3
Available freqs. Used freqs.
Air Service Agreements - Suriname
§ Brazil - ASA not constraining connectivity§ Up to 21 weekly frequencies granted - with fifth freedom rights
§ Colombia - restrictive ASA§ Surinamese airlines can only reach Cali or Barranquilla; Colombian airlines
can reach Paramaribo
21
10
5
10
15
20
25
Available freqs. Used freqs.
ASA Suriname - Brazil: frequencies ASA Suriname - Colombia: frequencies
Current ASA grants 3 daily
services per side
Only 2 weekly frequencies: ASA should
be renegotiated to develop any connectivity
with BOG
32
Air Service Agreements - Main conclusions
§ The conditions of Guyana’s and Surinam’s ASAs are not acting as constraints to the development of connectivity
§ Multilateral and most bilateral agreements are liberal enough toallow development of connectivity and market forces
§ Lack of ASAs with South American countries
§ If market demand arises in the future , ASAs should be celebrated with these countries

33
Assessment rationale
Current Connectivity of the Guyana Shield
Refocusing of scope:Guyana andSurinam
Study Scope
Assessment sections
Airport Infrastructure
The cost of Airport Infra-structure
Air Service Agreements
Market Outlook
Institutional Framework
Recommendationsand Next Steps

34
Market Outlook Analysis
§ Objective: to obtain a clear picture of the current connectivitylevels of Guyana and Suriname, and to propose measures to increase them in the short term
§ Main focus on existing connectivity, airline competition, available frequencies and recent development of air transport market

35
23.3%
17.7%
11.2% 9.2% 8.5% 7.9% 6.7%4.5% 4.0%
1.5%
Market Outlook - Introduction
§ International tourist arrivals to Guyana and Suriname have grown at larger rates than Brazil and Argentina between 2010 and 2013
§ However, Guyana and Suriname are the countries with least tourist arrivals of South America - without considering French Guiana
International tourist arrivals: South America
Source: World BankNote*: Guyana’s latest informed value is of 2012
CAGR 2010-2013 (%)
5,813 5,571
3,576 3,164 2,683 2,2881,364 986 249 177
Tourist arrivals (in thousands), 2013
36
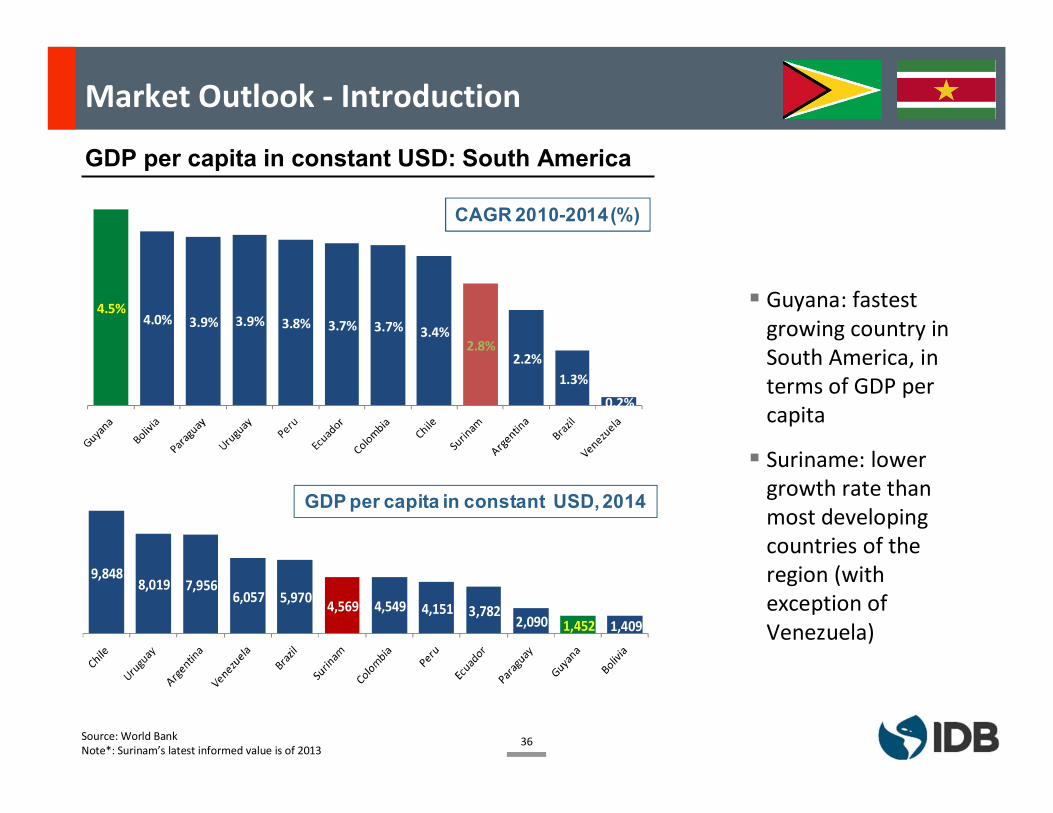
9,8488,019 7,956
6,057 5,970 4,569 4,549 4,151 3,7822,090 1,452 1,409
4.5%4.0% 3.9% 3.9% 3.8% 3.7% 3.7% 3.4%
2.8%2.2%
1.3%0.2%
CAGR 2010-2014 (%)
GDP per capita in constant USD, 2014
Market Outlook - Introduction
§ Guyana: fastest growing country in South America, in terms of GDP per capita
§ Suriname: lower growth rate than most developing countries of the region (with exception of Venezuela)
GDP per capita in constant USD: South America
Source: World BankNote*: Surinam’s latest informed value is of 2013

37
Port of Spain
Panama City
GEO
Kingston8%
22%To New York
3%To Miami
Other destinations (7%):• Toronto - 2%• Aruba - 2%• Curaçao - 2%• Puerto Ordaz - 1%• Orlando - 0.5%
Paramaribo
§ Port of Spain: more than half of international seats out of GEO
§ 2 Airports concentrate 84% of GEO’sseats: POS, JFK and KIN
§ Guyanese Shield: PBM 3%, and Puerto Ordaz only 1%
Departing seats out of GEO by destination market
Source: OAG, 2015.
Market Outlook - Guyana

38Source: OAG.
§ GEO: two major growth periods (2010 to 2012 and 2013 to 2015)
§ Significant overall growth since 2010: 8.2% CAGR
§ Caribbean Airlines: has given burst to GEO’sgrowth (36% increase in seats between 2010 and 2015)
309 326413 393
444 458
2010 2011 2012 2013 2014 2015
CAGR 2010-15: 8.2%
CAGR 2010-12: 15.6%CAGR 2013-15: 8.0%
Market Outlook - Guyana
Evolution of departing seats out of GEO

39Source: OAG.
Departing seats out of GEO by destination region
68%
28%
4%
Caribbean and Central AmericaNorth AmericaUpper South America
GEO by destination region 2015
85%
15%
Caribbean and Central America North America
GEO by destination region 2010
GEO
§ Caribbean and Central America: main destination region out of GEO (POS main market)
§ North America -JFK, MIA, YYZ and MCO-: increasing share (from 15% in 2010 to 28% in 2015)
Market Outlook - Guyana

40
66%
12%
8%
6%4% 4% Caribbean Airlines
Fly Jamaica
Dynamic Airways
Surinam Airways
Insel Air
OthersOthers
Source: OAG, 2015.
Airline competition: seats out of GEO by carrier - 2015
Main 8 routes out of GEO by operating carrier - 2015
§ Caribbean Airlines: over 65% of seats out of GEO
― Has dominant position in GEO-POS route (100%)
― Has 55% share in POS-JFK route
§ 4 carriers (Caribbean Airlines, Fly Jamaica, Surinam Airways and Dinamic Airways) concentrate 92% of capacity share
§ Surinam Airways has 100% of seats in GEO-MIA route (continuation flight from PBM)
Market Outlook - Guyana

41Source: OAG, 2015.
§ 6 short haul destinations with less than 5x per week and only one carrier
ParamariboCuracao
New York
Panama TorontoKingston
Miami
ArubaOrlando
Port of Spain
Pto Ordaz0
5
10
15
20
25
30
35
0 1000 2000 3000 4000 5000
Long haulShort haul
Frequenciesper week
Distance (Km.)Operated by:
One foreign airline Two foreign airlines 3 foreign foreign airlines
Twice per day
Long haulShort haul
Frequenciesper week
Distance (Km.)Operated by:
One foreign airline Two foreign airlines 3 foreign foreign airlines
Short haul, more than twice a day
Short haul, less than twice a day Long haul, less
than twice a day
More than twice a day
Less than twice a day
Market Outlook - Guyana

42Source: OAG, 2015.
§ >80% of routes with 3 flights per week or less, >80% of routes operated by one carrier
§ Real competition only present in 2 of 11 routes out of GEO
3 markets
6 markets
2 markets
1 per week 2 or 3 per week 4 or more per week
9 markets
1 market 1 market
1 airline 2 airlines 3 airlines
GEO - distribution of markets by weekly frequencies
GEO - distribution of markets by number of carriers
Market Outlook - Guyana

43
PBM
Port of Spain
Curaçao11%Aruba
10%
Cayenne 6%Belem4%
Georgetown
Market Outlook - Suriname
Source: OAG, 2015.
§ Amsterdam: almost half of international seats out of PBM
§ 4 Airports concentrate 85% of PBM’sseats: AMS, POS, CUR and AUA
§ Guyana Shield: Cayenne 6%, Georgetown 5% and Belem 4%
Departing seats out of PBM by destination market

44Source: OAG.
§ PBM: important growth between 2010 and 2013 (4.2% CAGR)
§Overall growth explained by increase of available seats to Central America, the Caribbean and Upper South America
Evolution of seating capacity out of PBM - 2010 to 2015
274 267 284 310 306 325
2010 2011 2012 2013 2014 2015
CAGR 2010-15: 3.5%
CAGR 2010-13: 4.2%
Market Outlook - Suriname

45Source: OAG.
§ Amsterdam: decreased from 54% to 46 in capacity share, slow growth (0.2% CAGR)
§ Guyana Shield: increased capacity share from 0.5% to 11%
§ Central America and Caribbean: same capacity share as 2010 (39%)
Seats out of PBM by destination region - 2010 to 2015
Market Outlook - Suriname

46
100%
61%
43%
48%
57%
100%
39%
52%
Cayenne
Aruba
Curacao
Port of Spain
Amsterdam
Surinam Airways
Caribbean Airlines
Insel Air
KLM
Annual departing seats (K)
150
59
36
32
21
49%
24%
15%
10% 2%Surinam Airways
KLM
Insel Air
Caribbean Airlines
OthersOthers
Source: OAG, 2015.
Airline competition: seats out of PBM by carrier - 2015
Main 8 routes out of PBM by operating carrier - 2015
§ Capacity share evenly distributed between foreign carriers and Surinam Airways
§ 4 carriers (Surinam Airways, KLM, Insel Air and Caribbean Airlines) concentrate 98% of capacity share
§ Surinam Airways has presence in 6 of the 7 routes out of PBM
Market Outlook - Suriname

47Source: OAG, 2015.
Aruba
Georgetown
Curaçao
Port of Spain
Belem
Amsterdam
Cayenne
0
1
2
3
4
5
6
7
8
9
- 1,000 2,000 3,000 4,000 5,000 6,000 7,000 8,000
4x per week
Long haulShort haul
Frequenciesper week
Short haul, lessthan 4x per week
Short haul, more than 4x per week
Long haul, more than 4x per week
Distance (Km.)Operated by:
Surinam Airways Surinam Airways and foreign carrier Foreign carrier
§ Surinam Airways: has presence in 6 of 7 markets out of PBM (5 short haul and 1 long haul market
More than 4x per week
Less than 4x per week
Market Outlook - Suriname

48
126
126
419
6 to 7 PM
5to 6 PM
4 to 5 PM
3 to 4 PM
2 to 3 PM
1 to 2 PM
12 to 1 PM
11 AM to 12 PM
10 to 11 AM
9 to 10 AM
8 to 9 AM
7 to 8 AM
Arriving Seats Departing Seats
To Aruba
To Belem
From Amsterdam
Source: prepared by consultant with information from OAG (2015) and airlines schedules.
Examples of Surinam Airways schedule out of PBM
317
252
557
80
8 to 9 PM7 to 8 PM6 to 7 PM
5to 6 PM4 to 5 PM3 to 4 PM2 to 3 PM
1 to 2 PM12 to 1 PM
11 AM to 12 PM10 to 11 AM
9 to 10 AM8 to 9 AM7 to 8 AM
6 to 7 AM5 to 6 AM4 to 5 AM3 to 4 AM
2 to 3 AM1 to 2 AM
12 to 1 AM
Arriving Seats Departing Seats
To Amsterdam
To Port of Spain,Georgetown
From Amsterdam, Belem
From Aruba
Monday, September 14th of 2015 Tuesday, September 15th of 2015
§ Flights departing from PBM do not take advantage of incoming flights
§ Re-scheduling of Surinam Airways’services would improve connectivity
Market Outlook - Suriname

49Source: OAG, 2015.
§ AMS and POS: 8x per week and two carriers serving these routes
§ Remaining 5 markets: either low number of freqs. or low number of carriers (or both)
3 markets
2 markets 2 markets
Less than 4per week
Between 4 and 6per week
7 or moreper week
3 markets
4 markets
1 airline 2 airlines
PBM - distribution of markets by weekly frequencies
PBM - distribution of markets by number of carriers
Market Outlook - Suriname

50Source: OAG, 2015.
The idea of developing a hub
§ Any airport hub is not the creation of an airport operator or a policy maker, but the derived action of an airline willing to establish and operational base
§ The O&D traffic subsidizes the connecting traffic, as O&D traffic represents to the airline a higher yield
§ Thus, an airline will select an airport to develop a hub whenever the local mass of O&D traffic is substantial enough
§ For this reason, the possibility of developing a hub at either PBM or GEO is impracticable: no airline could a viable business by connecting other cities through either of these capitals

51Source: OAG, 2015.
§ Copa reaches 72 airports in the American continent and the Caribbean
§ Copa operates PTY-GEO 2x per week, with the intention of increasing to 4x per week
PTYSan Jose
Miami / Orlando / Ft. Lauderdale
Lima
Mexico City
Santiago
Sao Paulo
Guatemala City
Los Angeles
New York
Caracas
Buenos Aires
Rio de Janeiro
BogotaGeorgetown (2x per week)
GuayaquilQuito
La Habana
Santo Domingo / Punta Cana
Cancun
Copa Airlines networkMain routes out of PTY - Copa Airlines
Development of connectivity through nearby hubs

52
8 to 9 PM
7 to 8 PM
6 to 7 PM
5to 6 PM
4 to 5 PM
Arriving flight Departing flights
From GEO
Departures to 24 destinations: 7 in NorthAmerica, 7 in South America, 4 in Central America and 2 in the Caribbean
Departures to 9 destinations: 1 in NorthAmerica, 3 in Central America, 2 in the Caribbean and 2 in Europe
Source: Copa Airlines, KLM, United Airlines and TAP Portugal schedules, and OAG (2015).Note*: for potential connections at PTY, only flights from Copa Airlines and other Star Alliance members were considered.Note**: only days of operation for Copa Airlines' flights from GEO were considered.Note***: Week of September 14th to September 20th of 2015
§ Potential to connect passengers with flights departing to other 27 destinations out of PTY within 2.5 hours after the arrival
§ It would be valuable for PBM to also establish services to PTY (either as non-stop service or as continuation of the service out of GEO)
Potential connections at PTY for Copa’s arriving flight from GEO
Development of connectivity through nearby hubs

53Source: OAG, 2015.
§ Caribbean Airlines reaches 16 airports in the American continent, the Caribbean and Europe
§ Despite being an interesting opportunity, there are problems at POS for connecting pax
Caribbean Airlines networkMain routes out of POS - Caribbean Airlines
POSGeorgetown (4x per day)
Paramaribo (4x per week)
New York
Barbados
Toronto
Caracas
Miami / Fort Lauderdale / OrlandoSt. Lucia
GrenadaKingston
Development of connectivity through nearby hubs

54
7 to 8 PM
6 to 7 PM
5 to 6 PM
4 to 5 PM
3 to 4 PM
2 to 3 PM
1 to 2 PM
12 to 1 PM
11 AM to 12 PM
10 to 11 AM
9 to 10 AM
8 to 9 AM
7 to 8 AM
6 to 7 AM
Departing flightsArriving flight Departing flights
From GEOFrom GEO
From GEO
From GEO
From GEO
7 destinations in the Caribbean and South America
Arriving flight Departing flights
From GEOFrom GEO
From GEO
From GEO
From GEO
Arriving flight
From GEOFrom GEO
From GEO
From GEO
From GEO
4 destinations in the Caribbean and North America
1 destination in the Caribbean
1 destination in the Caribbean
1 destination in the Caribbean
2 destinations in the Caribbean and North America
2 destinations in the Caribbean and North America
3 destinations in the Caribbean and South America
2 destinations in the Caribbean and South America
1 destination in the Caribbean
3 destinations in the Caribbean
2 destinations in the Caribbean and North America
1 destination to London
Source: Caribbean Airlines and British Airways schedules, and OAG (2015).Note*: for potential connections at POS, only flights from Caribbean Airlines and British Airways were considered (given code-share agreement between these two carriers).Note**: only days of operation for Caribbean Airlines' flights from GEO were considered.Note***: Week of September 14th to September 20th of 2015
§ Sixteen destinations out of POS located in North America, South America, the Caribbean and Europe can be reached
§ High number of weekly frequencies (32), allows attractive connecting schedules
Connections at POS for Caribbean Airlines‘ arriving flight from GEO
Development of connectivity through nearby hubs

55
Source: Caribbean Airlines and British Airways schedules, and OAG (2015).Note*: for potential connections at POS, only flights from Caribbean Airlines and British Airways were considered (given code-share agreement between these two carriers).Note**: only days of operation for Caribbean Airlines' flights from PBM were considered.Note***: Week of September 14th to September 20th of 2015
§ Ten destinations out of POS can be reached
§ 6 in the Caribbean
§ 3 in North America
§ 1 in South America
Connections at POS for Caribbean Airlines‘ arriving flight from PBM
10 to 11 AM
9 to 10 AM
8 to 9 AM
7 to 8 AM
6 to 7 AM
Departing flightsArriving flight Departing flights
From GEOFrom GEO
From GEO
From GEO
Arriving flight Departing flights
From GEOFrom GEO
From GEO
From GEO
Arriving flight
From GEOFrom GEO
From PBM
From GEO
From GEO
7 destinations in the Caribbean and South America
4 destinations in North America and the Caribbean
1 destination in the Caribbean
1 destination in the Caribbean
Development of connectivity through nearby hubs

56Source: OAG, 2015.
Avianca networkMain routes out of BOG - Avianca
Mexico City
Lima
SantiagoBuenos Aires
Rio de Janeiro
Guayaquil
Quito
Sao Paulo
Miami / Orlando / Ft. Lauderdale
Los Angeles
New York
Cancun
Panama CityCaracasSan Jose
Santo Domingo / Pta Cana
Aruba
Washington
Guatemala City
La Paz
BOG
§ Avianca operates 29 routes out of BOG to destinations in the American continent, the Caribbean and Europe
§ In the present, no services to PBM nor to GEO
Development of connectivity through nearby hubs

57Source: OAG, 2015.
§ BSB: 40 domestic connections in Brazil
§ However, only 2 international routes to South America (reduced, compared to PTY and BOG)
Development of connectivity through nearby hubsInternational routes by frequencies and airlinesInternational routes out of BSB
Miami / OrlandoLa Habana
Buenos Aires
Panama City
Atlanta
Santiago
Punta Cana
BSB
Market WeeklyFrequencies Airlines
Miami / Orlando 14
Panama City 10
Buenos Aires 8
Lisbon 6
Atlanta 5
Paris 3
La Habana 1
Punta Cana 1
Santiago (Chile) < 1

58
Assessment rationale
Current Connectivity of the Guyana Shield
Refocusing of scope:Guyana andSuriname
Study Scope
Assessment sections
Airport Infrastructure
The cost of Airport Infra-structure
Air Service Agreements
Market Outlook
Institutional Framework
Recommendationsand Next Steps

59
Summary of Recommendations
Source: consultant.
GEOPanama City
Port of SpainCuraçao
Bogota PBM
Panama City Port of SpainCuraçao
Bogota
§ CUR: Insel Air operates 2x per week
§ POS: Caribbean airlines operates 32x per week
§ PTY: Copa operates 2x per week
§ BOG: no services currently
§ CUR: Insel Air operates 5x per week
§ POS: Caribbean airlines operates 4x per week
§ PTY: no services currently
§ BOG: no services currently
§ The connectivity of both countries will depend on how well connected GEO and PBM are to close regional hubs
§ Authorities should establish close dialog with the airlines that present connecting opportunities at hubs: Copa, Caribbean Airlines, Insel Air and Avianca (incentives could be offered)
§ Close attention to the development of TAM’s hub in Northeast Brazil, could be another important hub in the region (expected to be established by late 2016), specially to connect to South America and Europe

60
Proposed next steps
Source: consultant.
Objective Proposed actions Time-frameProbability of success
Increase/Establish CopaAirlines services to GEO and PBM
ü Engage with Copa: investigate requirements to establish services to PBMü Different options:
o Point to point flights to PBM and GEO from PTYo Rotating flights from PTY to GEO and PBM (requires 5th freedom
rights)o Round-trip flights from PTY with a connection at PBM or GEO
Short-term
Mid to High
Establish new Aviancaservices to GEO and PBM
ü Investigate interest for new services to GEO and PBMü Avianca might prefer not to compete with Star Alliance partner
o Cooperation of flights w/Copa through code shareo Combining services at alternative days of the week
ü Liberalize the existing ASA (now restricted to only 2 services per week)
Short- to mid term Mid
Increase Caribbean Airlines services to GEO and PBM
ü Investigate requirements to increase frequencies to GEO and PBMü Developing hub at POS requires efficiency improvements at border control
Short-term Mid
Increase Insel Air services to GEO and PBM ü Investigate requirements to increase frequencies to GEO and PBM Short-
term Mid
Increase/Establish Golservices to PBM and GEO
ü Investigate interest to develop non-stop services to GEOü Investigate interest to develop connections at Belen to points in South
AmericaShort-term Low
Explore evolution of declared intention of TAM to develop a Northeast hub
ü Engage in talks with TAM to explore interests (potential hub) Medium Term
Quite low

61
Agenda
Thank you / Obrigado