developing habitat models and monitoring techniques for
TRANSCRIPT

Developing Habitat Models and Monitoring Techniques for Nine Bird Species of Clark
County, 2008 - 2013
(2005-GBBO-581-P)
Elisabeth Ammon,
Jen Ballard, and Jock Young
Great Basin Bird Observatory

Project Objectives
• Establish population baselines for nine species: distribution, abundance
• Model habitats for nine species
• Establish monitoring program for landbirds

Nine MSHCP Priority Species
Covered: Evaluation:
Willow Flycatcher Bendire’s Thrasher
Vermilion Flycatcher Le Conte’s Thrasher
Phainopepla Gray Vireo
Summer Tanager
Bell’s Vireo
Blue Grosbeak
Vermilion Flycatchers at nest (photo by Jen Ballard)

Task 1: Developing Population Size Estimates
• Field Methods:
– Point count based surveys (in distance intervals)
– Double-sampling using intensive area searches
– Some double-observer sampling
– Multiple time intervals to allow for removal method

Task 1: Developing Population Size Estimates
• Draft Results: – Estimated populations without correction for
detectability
– Sample population estimates and inferential population estimates
– Inferential population differed primarily for salt desert habitats (due to DoD lands)

Task 2: Model Distribution and Habitats of Each Species
• Methods: – Random habitat-stratified survey design
– Restratification and drawing new sample in 2012
– Inclusion of all Nevada Bird Count data for Clark County (2003 – 2013) for distributions
– Predictive maps based on spatial habitat models
– (additional spatial and field vegetation data analyses before final report)

Task 2: Model Distribution and Habitats of Each Species
• Results: – Presence and absence maps for each species
– Predicted distributions and densities

Task 3: Establish Landbird Monitoring Plan
• Methods: – Original random scatter from Heaton et al.’s
2004/05 Clark County spatial data
– Restratification based on newly available layers from Clark County in 2012
– Tests of additional survey methods for effectiveness on rare species (call-playback)
– Testing various methods for detectability estimation

Clark County, 2008-13: Sampling and Detection Sites of all 9 Species Combined

Draft Results
• Bell’s Vireo
Photo by Martin Meyers

Population Size Estimates: Bell’s Vireo
# surveys (transect-year) # transects
Sample Pop
Inferential Pop
Agriculture 15 5 65 65
Coniferous Forest 39 13 0 0
Joshua Tree 110 51 0 0
Lowland Riparian 75 31 287 291
Mesquite-Catclaw 40 32 0 0
Mojave Scrub 92 53 0 0
Montane Riparian 1 1 0 0
Pinyon-Juniper 80 37 0 0
Sagebrush 20 7 0 0
Salt Desert 18 13 0 0
Total 490 243 352 356

Actual Distribution

Predicted Distribution
(birds/3.14 ha)

Bell’s Vireo Actual Habitat Use (from spatial data)

Draft Results
• Phainopepla
Photo by Scott Page

Population Size Estimates: Phainopepla
# surveys (transect-year) # transects
Sample Pop
Inferential Pop
Agriculture 15 5 183 183
Coniferous Forest 39 13 0 0
Joshua Tree 110 51 2062 2475
Lowland Riparian 75 31 530 538
Mesquite-Catclaw 40 32 465 470
Mojave Scrub 92 53 5102 5367
Montane Riparian 1 1 0 0
Pinyon-Juniper 80 37 0 0
Sagebrush 20 7 0 0
Salt Desert 18 13 113 483
Total 490 243 8455 9516

Actual Distribution

Predicted Distribution
(birds/3.14 ha)

Phainopepla Actual Habitat Use (from spatial data)

Draft Results
• Blue Grosbeak

Population Size Estimates: Blue Grosbeak
# surveys (transect-year) # transects
Sample Pop
Inferential Pop
Agriculture 15 5 15 15
Coniferous Forest 39 13 0 0
Joshua Tree 110 51 0 0
Lowland Riparian 75 31 320 325
Mesquite-Catclaw 40 32 0 0
Mojave Scrub 92 53 0 0
Montane Riparian 1 1 0 0
Pinyon-Juniper 80 37 163 172
Sagebrush 20 7 0 0
Salt Desert 18 13 0 0
Total 490 243 499 513

Actual Distribution

Predicted Distribution
(birds/3.14 ha)

Blue Grosbeak Actual Habitat Use (from spatial data)

Draft Results
• Summer Tanager
Photo by Jen Ballard

Population Size Estimates: Summer Tanager
# surveys (transect-year) # transects
Sample Pop
Inferential Pop
Agriculture 15 5 0 0
Coniferous Forest 39 13 0 0
Joshua Tree 110 51 0 0
Lowland Riparian 75 31 37 38
Mesquite-Catclaw 40 32 0 0
Mojave Scrub 92 53 0 0
Montane Riparian 1 1 0 0
Pinyon-Juniper 80 37 22 23
Sagebrush 20 7 0 0
Salt Desert 18 13 0 0
Total 490 243 59 61

Actual Distribution

Summer Tanager Actual Habitat Use (from spatial data)

Draft Results
• Vermilion Flycatcher
Photo by Jen Ballard

Population Size Estimates: Vermilion Flycatcher
# surveys (transect-year) # transects
Sample Pop
Inferential Pop
Agriculture 15 5 58 58
Coniferous Forest 39 13 0 0
Joshua Tree 110 51 0 0
Lowland Riparian 75 31 47 47
Mesquite-Catclaw 40 32 0 0
Mojave Scrub 92 53 0 0
Montane Riparian 1 1 0 0
Pinyon-Juniper 80 37 0 0
Sagebrush 20 7 0 0
Salt Desert 18 13 0 0
Total 490 243 105 105

Actual Distribution
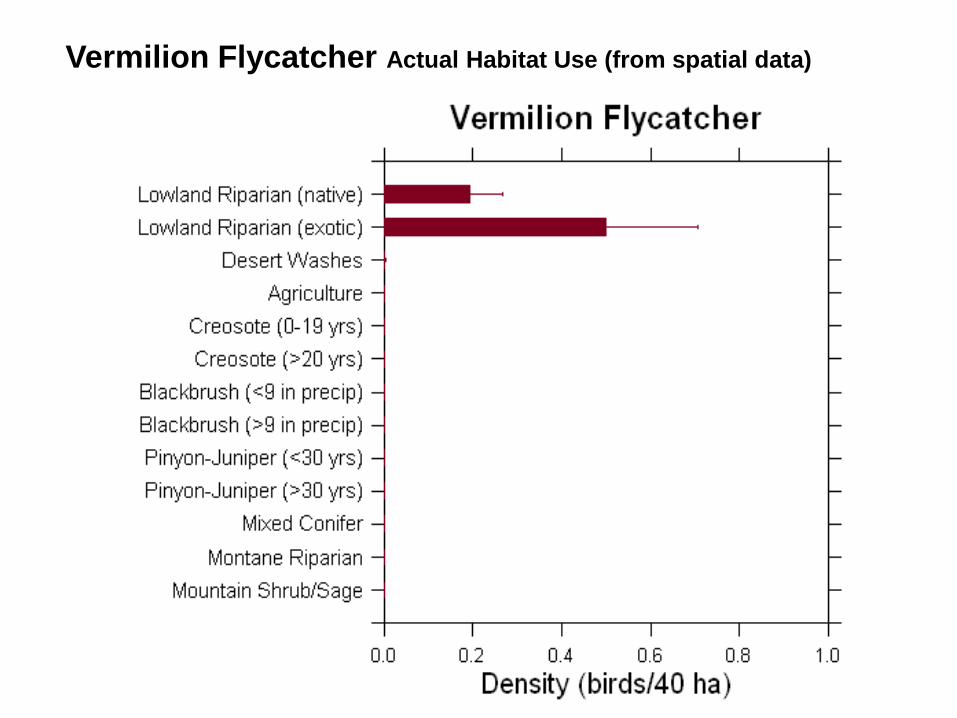
Vermilion Flycatcher Actual Habitat Use (from spatial data)

Draft Results
• Willow Flycatcher (may or may not be Southwestern subspecies)
Photo by Martin Meyers

Population Size Estimates: Willow Flycatcher
# surveys (transect-year) # transects
Sample Pop
Inferential Pop
Agriculture 15 5 0 0
Coniferous Forest 39 13 0 0
Joshua Tree 110 51 0 0
Lowland Riparian 75 31 3 3
Mesquite-Catclaw 40 32 0 0
Mojave Scrub 92 53 0 0
Montane Riparian 1 1 0 0
Pinyon-Juniper 80 37 0 0
Sagebrush 20 7 0 0
Salt Desert 18 13 0 0
Total 490 243 3 3

Actual Distribution

Willow Flycatcher Actual Habitat Use (from spatial data)

Draft Results
• Bendire’s Thrasher
Bendire’s Thrasher (photo by Martin Meyers)

Population Size Estimates: Bendire’s Thrasher
# surveys (transect-year) # transects
Sample Pop
Inferential Pop
Agriculture 15 5 0 0
Coniferous Forest 39 13 0 0
Joshua Tree 110 51 516 619
Lowland Riparian 75 31 0 0
Mesquite-Catclaw 40 32 20 20
Mojave Scrub 92 53 194 204
Montane Riparian 1 1 0 0
Pinyon-Juniper 80 37 0 0
Sagebrush 20 7 0 0
Salt Desert 18 13 0 0
Total 490 243 730 843

Actual Distribution

Bendire’s Thrasher Actual Habitat Use (from spatial data)

Draft Results
• Le Conte’s Thrasher

Population Size Estimates: Le Conte’s Thrasher
# surveys (transect-year) # transects
Sample Pop
Inferential Pop
Agriculture 15 5 0 0
Coniferous Forest 39 13 0 0
Joshua Tree 110 51 2320 2785
Lowland Riparian 75 31 0 0
Mesquite-Catclaw 40 32 170 172
Mojave Scrub 92 53 4567 4805
Montane Riparian 1 1 0 0
Pinyon-Juniper 80 37 8 9
Sagebrush 20 7 0 0
Salt Desert 18 13 136 584
Total 490 243 7202 8354

Actual Distribution

Le Conte’s Thrasher Actual Habitat Use (from spatial data)

Draft Results
• Gray Vireo

Population Size Estimates: Gray Vireo
# surveys (transect-year) # transects
Sample Pop
Inferential Pop
Agriculture 15 5 0 0
Coniferous Forest 39 13 769 872
Joshua Tree 110 51 1665 1998
Lowland Riparian 75 31 0 0
Mesquite-Catclaw 40 32 0 0
Mojave Scrub 92 53 737 775
Montane Riparian 1 1 0 0
Pinyon-Juniper 80 37 4797 5065
Sagebrush 20 7 189 209
Salt Desert 18 13 0 0
Total 490 243 8157 8920

Actual Distribution

Predicted Distribution
(birds/3.14 ha)

Gray Vireo Actual Habitat Use (from spatial data)

Take-Home Messages
• Distributions and predictive models are important for planners! Where to do/not do things on the landscape
• Site-specific habitat models are important for implementers! What to do/not do in a particular location
• Monitoring is important for all partners! Do Clark County land uses have a net impact or benefit on bird populations and bird distributions; does a particular project benefit a priority species

Next Steps (before draft report due date October 15, 2013)
• Statistical habitat models
• Predictive model refinement using different spatial data sets (2013)
• Formalization of final monitoring plan (2013)

Next Steps – cont’d
• Invitation to a ½ day meeting at Clark County offices in mid - late January, 2014
• You are all invited
• We will discuss specific applications of these data for land managers

Acknowledgments • Clark County Desert Conservation Program • The Nature Conservancy, Nevada Field Office • U.S. Fish and Wildlife Service • National Park Service • Bureau of Land Management • U.S. Forest Service • Bureau of Reclamation • Southern Nevada Water Authority • USGS Snake River Field Station • Nevada Department of Wildlife • Otis Bay Ecological Consultants • University of Nevada, Las Vegas • Many other Nevada Bird Count partners • GBBO field crews and volunteers • Ralph Phenix