developing an optimized sustainability assessment tool for
TRANSCRIPT

Developing an Optimized Sustainability Assessment Tool for Building Information Modelling (BIM) Systems - Incorporation of Hygrothermal Modelling into BIM
Marcela Brauner
PhD
2020

Developing an Optimized Sustainability Assessment Tool for Building Information Modelling (BIM) Systems - Incorporation of Hygrothermal Modelling into BIM
Marcela Brauner
A thesis submitted to Auckland University of Technology
in fulfilment of the requirements for the degree of Doctor of Philosophy (PhD)
2020
School of Future Environments
i
Abstract
The analysis of the New Zealand (NZ) housing indicated that a notable percentage of
dwellings is energy-inefficient, cold, mouldy, and damp which is likely to cause
significant health-related issues. Research has suggested that this longstanding
problem is rooted in potential systemic failures. However, apart from energy
modelling, sustainability assessment possesses a minimal presence in the used BIM
tools. Although the necessity to improve building hygrothermal performance is
increasingly recognized, the information and mechanisms on how to efficiently employ
hygrothermal modelling in the design process are still missing. This study offers a new
perspective on understanding the relationship between BIM and sustainability. It
introduces innovations through analysing hygrothermal relations in buildings and
specifying requirements for integration of hygrothermal modelling into BIM.
The necessary movement in the building industry needs to follow the socio-cultural
development into the second-tier thinking levels towards an integral system.
Therefore, this study presents an alternative perspective from which we look at the
challenging task of how to build better and healthier houses. From this integral
perspective, the design and construction process and its end-product, buildings, form
open systems that interact with other systems and the environment. The holistic
approach to sustainability pertains with the whole project by applying systems
engineering methodologies to the design and construction process.
This thesis gradually explores the research objectives from an individual to a collective
level. An experimental and numerical study on real houses (individual level) delivers
new data which demonstrate the fundamental importance of hygrothermal modelling
during the design process. The collective level examines general requirements for
incorporation of hygrothermal modelling into BIM and system approach to the design
of houses. In an interdisciplinary and systematic approach grounded in integral
thinking, this thesis focuses on possible BIM innovation and its implementation
strategy. The hygrothermal modelling integration into BIM enables competent
decisions about environmental impact of new buildings and retrofits to prevent
unintended moisture related problems. Suggested solutions inevitably require a
ii
restructuration and continual transformation of the whole design and construction
process to progressively eliminate design defects and leaky house syndrome in NZ.
The proposed Complex Integral Design New Zealand (CIDNZ) system accommodates
the capacity to integrate diverse perspectives in a unified and flexible framework. The
findings of the influence of various materials and construction types on indoor relative
humidity levels enhance the practical knowledge. The research results demonstrate
the benefits of hygrothermal modelling and the decisive use of hygroscopic materials
to sustainable design in NZ. This thesis contributes to knowledge firstly by instigating
integral thinking into the design process. Secondly, by applicating the systems
approach to buildings and complex construction processes that are seen as elements
of environmental systems. The proposed CIDNZ focuses on people by respecting a
broad spectrum of human needs. Consequently, the design process might shift the
forefront from prevailing aim for cheap and fast built to long-term energy and cost-
efficient, durable, and healthy buildings.
Keywords: hygrothermal modelling; BIM interoperability; sustainability assessment;
system approach; complex integral design
iii
Table of Contents
Chapter 1 Introduction ...................................................................................................... 1
1.1 Background ............................................................................................................ 3
1.2 Rationale and Significance of the Study ................................................................ 3
1.3 Research Focus ...................................................................................................... 5
1.4 Research Aim, Objectives, and Questions............................................................. 6
1.5 Research Scope ..................................................................................................... 8
1.6 Key Assumptions of the Study and Hypothesis ..................................................... 8
1.7 Limitations ........................................................................................................... 11
1.8 Thesis Contribution and Overview ...................................................................... 12
Chapter 2 Research Methods .......................................................................................... 14
2.1 Philosophical Position of Research ..................................................................... 14
2.1.1 Ontology and Epistemology ......................................................................... 15
2.1.2 Positivism, Interpretivism, and Phenomenology ......................................... 16
2.1.3 Critical Realism, Constructivism, and Relativism ......................................... 18
2.1.4 Empiricism and Rationalism ......................................................................... 20
2.1.5 Integral Theory ............................................................................................. 21
2.2 Research Approaches – Research Strategy ......................................................... 23
2.3 Influences on Research ....................................................................................... 25
2.4 Research Design .................................................................................................. 26
2.4.1 Survey ........................................................................................................... 27
2.4.2 Experiment ................................................................................................... 27
2.4.3 Case Study .................................................................................................... 29
2.4.4 Analysis of Knowledge .................................................................................. 31
2.4.5 Simulation and Modelling ............................................................................ 32
2.4.6 Evaluation of Theory .................................................................................... 32
2.5 Methodology of the Research ............................................................................. 35
2.5.1 Reasons for Choosing In-Field Experiment Combined With Simulation ...... 37
2.5.2 In-Field Experiment Design .......................................................................... 38
2.5.3 Simulation Design ......................................................................................... 40
2.5.4 Integration of Data ....................................................................................... 42
2.6 Methodology of the Literature Review ............................................................... 42
2.6.1 Methodology of the Literature Review of Hygrothermal Relations in Buildings ....................................................................................................... 43
2.6.2 Methodology of the Literature Review of Building Information Modelling (BIM) and Hygrothermal Simulation ............................................................ 44
2.6.3 Data Analysis ................................................................................................ 44
2.7 Ethics in Research ................................................................................................ 45
2.8 Summary ............................................................................................................. 46
iv
Chapter 3 Theoretical Framework – Literature Review .................................................. 47
3.1 The Nature of the Built Environment .................................................................. 47
3.1.1 Resources and Building Materials ................................................................ 49
3.1.2 Impact on the Environment and People ...................................................... 51
3.1.3 The Construction Industry in New Zealand .................................................. 55
3.1.4 Building Physics ............................................................................................ 60
3.2 Hygrothermal Relations in Built Environment .................................................... 62
3.2.1 High Relative Humidity and its Consequences ............................................. 66
3.2.2 Dew Point and Condensation ....................................................................... 74
3.2.3 Mould Growth .............................................................................................. 77
3.2.4 Building Materials and Moisture Buffering .................................................. 83
3.2.5 Sorption Active Thickness ............................................................................ 88
3.3 Hygrothermal Analyses and Modelling ............................................................... 91
3.3.1 Looking Back ................................................................................................. 92
3.3.2 HAM Models ................................................................................................. 94
3.3.3 Influence of Hygrothermal Interactions ....................................................... 99
3.3.4 Reasons for Limited Use of Hygrothermal Modelling ................................ 101
3.4 BIM and Interoperability ................................................................................... 102
3.4.1 BIM ............................................................................................................. 103
3.4.2 BIM in New Zealand ................................................................................... 106
3.4.3 Obstacles to BIM Adoption ........................................................................ 107
3.4.4 Interoperability .......................................................................................... 108
3.4.5 BIM and Hygrothermal Modelling ............................................................. 111
3.5 Conclusions ........................................................................................................ 113
3.6 Summary ........................................................................................................... 117
Chapter 4 Data Collection and Analysis – Quasi-Experiment ....................................... 118
4.1 Description ........................................................................................................ 118
4.2 Settings .............................................................................................................. 120
4.3 Results ............................................................................................................... 132
4.4 Data Analysis Process ........................................................................................ 134
4.4.1 Descriptive Statistics .................................................................................. 135
4.4.2 Testing of ANCOVA Preconditions ............................................................. 138
4.4.3 Analysis of Covariant – ANCOVA ................................................................ 143
4.5 Limitations and Challenges of the Quasi-Experiment ....................................... 152
4.6 Conclusion and Recommendations ................................................................... 153
4.7 Summary ........................................................................................................... 154
Chapter 5 Modelling of the Quasi-Experiment With WUFI Plus ................................... 156
5.1 Description ........................................................................................................ 156
5.1.1 WUFI Plus Settings ..................................................................................... 156
5.1.2 The Simulation Process .............................................................................. 161
v
5.2 Experimental Settings ....................................................................................... 162
5.3 Limitations and Challenges of the Simulation ................................................... 166
5.4 Results ............................................................................................................... 171
5.5 Analysis .............................................................................................................. 172
5.5.1 Descriptive Statistics .................................................................................. 172
5.5.2 Comparing Simulation and Quasi-Experiment Data .................................. 175
5.6 Conclusions and Recommendations ................................................................. 177
5.7 Summary ........................................................................................................... 177
Chapter 6 Interfacing BIM With Hygrothermal Modelling ........................................... 179
6.1 Interoperability .................................................................................................. 179
6.2 Settings in Revit and WUFI Plus ........................................................................ 185
6.2.1 Revit Settings .............................................................................................. 185
6.2.2 WUFI Plus Settings ..................................................................................... 193
6.2.3 Physical Properties of WUFI Hygrothermal Calculations ........................... 193
6.3 Limitations and Challenges of the Interoperability ........................................... 198
6.4 Conclusions and Recommendations ................................................................. 199
6.5 Summary ........................................................................................................... 200
Chapter 7 Discussion ..................................................................................................... 202
7.1 Quasi-Experiment – Hygrothermal Performance Examination ........................ 204
7.1.1 Levels of Relative Humidity in Different Settings ....................................... 204
7.1.2 The Influence of an Airtightness Layer ....................................................... 207
7.1.3 Comfort Zone Criteria ................................................................................ 209
7.2 Hygrothermal Simulation – Challenges in Hygrothermal Assessment ............. 211
7.2.1 Discussion About Differences Between Simulated and Measured Results .................................................................................................................... 212
7.3 Requirements for the Integration of Hygrothermal Simulation Into BIM ........ 214
7.4 Conclusions ........................................................................................................ 219
7.5 Summary ........................................................................................................... 219
Chapter 8 System Approach.......................................................................................... 220
8.1 Complex Integral Design New Zealand (CIDNZ) ................................................ 221
8.1.1 The Definition and Background of CIDNZ .................................................. 222
8.1.2 The Four Quadrants in CIDNZ..................................................................... 225
8.2 A Process of Transformation ............................................................................. 228
8.2.1 People ......................................................................................................... 232
8.2.2 Processes Across All Project Phases ........................................................... 233
8.2.3 Interoperable Technologies ....................................................................... 234
8.2.4 Environmental Systems .............................................................................. 236
8.3 Framework for Designers .................................................................................. 238
8.3.1 Step 1 – Construction Planning .................................................................. 240
8.3.2 Step 2 – Conceptual Design ........................................................................ 241
vi
8.3.3 Step 3 – Detail Design and Optimization ................................................... 243
8.3.4 Step 4 – Process Planning ........................................................................... 245
8.4 Integration of the System Approach ................................................................. 245
8.4.1 Evaluation of CIDNZ .................................................................................... 247
8.5 Conclusions ........................................................................................................ 255
Chapter 9 Conclusions ................................................................................................... 256
9.1 Rationale and Significance of the Study ............................................................ 256
9.2 Research Scope ................................................................................................. 258
9.3 Summary of Findings and Limitations ............................................................... 260
9.4 Recommendations for Further Research .......................................................... 262
9.5 Contribution of the Research ............................................................................ 263
References ..................................................................................................................... 265
Appendix A Blower Door Test Results for Test House and Control House .................. 393
Appendix B MgO Boards Laboratory Test Report ........................................................ 406
Appendix C Post-Formal Thinking ................................................................................ 415

vii
List of Figures
Figure 1 Reasoning Forms and Their Influence on Knowledge ................................................... 34
Figure 2 Frequency of Reviewed Publications Between 2000 and 2020 per Year of Publication .................................................................................................................................................... 45
Figure 3 Building Moisture Sources ............................................................................................ 63
Figure 4 Absolute Water Content in the Air by Different Temperature and RH ........................ 68
Figure 5 Testing Houses Aerial Photo ....................................................................................... 120
Figure 6 Photo of the T-House .................................................................................................. 121
Figure 7 Comparison of Wall Construction in T-House and C-House ....................................... 122
Figure 8 Floor Plan (not in Scale) With the Testing Room (Marked) ........................................ 123
Figure 9 Relay Setting ............................................................................................................... 127
Figure 10 Experimental Setting ................................................................................................. 130
Figure 11 Measured RH in T-House .......................................................................................... 133
Figure 12 Measured RH in C-House .......................................................................................... 134
Figure 13 Box Plot of Measured Data in T-House ..................................................................... 137
Figure 14 Box Plot of Measured Data in C-House ..................................................................... 137
Figure 15 Estimated Marginal Means of Inside RH by the Elimination of Exterior RH in T-House .................................................................................................................................................. 147
Figure 16 Estimated Marginal Means of Inside RH by the Elimination of Exterior RH in C-House .................................................................................................................................................. 148
Figure 17 Illustration of a Sorption Curve Example .................................................................. 151
Figure 18 Combination of WUFI Simulation Tools .................................................................... 158
Figure 19 WUFI Plus Tree Structure, Input Mask, 3D Preview of Building, and Output Window .................................................................................................................................................. 160
Figure 20 WUFI Plus Specification of Homogenous Layers in the Exterior Wall by T-House ... 164
Figure 21 Magnum Board Photo Showing Both Sides of the Sheet Material ........................... 169
Figure 22 Water Vapour Resistance Factor µ-Value Extrapolation for MgO Boards ................ 170
Figure 23 T-House Simulated RH Values ................................................................................... 171
Figure 24 C-House Simulated RH Values ................................................................................... 172
Figure 25 Box Plot of Simulated Data in T-House ..................................................................... 174
Figure 26 Box Plot of Simulated Data in C-House ..................................................................... 174
Figure 27 Illustration of the Discrepancies Observed by Scenario 3 When Comparing Experimental Data to Results From the Simulation With WUFI Plus in T-House ..................... 176
Figure 28 Illustration of the Discrepancies Observed by Scenario 3 When Comparing Experimental Data to Results From the Simulation With WUFI Plus in C-House ..................... 176
Figure 29 “Type Properties” in Revit2019 on an Example of a System Family “Basic Wall” .... 185
Figure 30 “Edit Assembly” in Revit2019 on an Example of a System Family “Basic Wall” ....... 186

viii
Figure 31 “Edit Assembly” With a Preview in Revit2019 on an Example of a System Family “Basic Wall” ............................................................................................................................... 187
Figure 32 “Assigning Assembly” in WUFI Plus on an Example of an Exterior Wall ................... 187
Figure 33 “Identity” of Vapour Retarder as Shown and Specified in the “Material Browser”, Revit2019 .................................................................................................................................. 188
Figure 34 Thermal Properties of Vapour Retarder as Shown and Specified in the “Material Browser”, Revit2019 ................................................................................................................. 189
Figure 35 Thermal Properties of Building Paper as Shown and Specified in the “Material Browser”, Revit2019 ................................................................................................................. 190
Figure 36 The Four Quadrants in CIDNZ ................................................................................... 225
Figure 37 Fundamental Aspects of CIDNZ and the Conceptual Framework for Transformation .................................................................................................................................................. 231
Figure 38 The Structural Relationship Model of the CIDNZ Framework, Influencing Factors, and Design Defects .......................................................................................................................... 240

ix
List of Tables
Table 1 Research Questions .......................................................................................................... 6
Table 2 Deductive Reasoning of the Conceptual Framework ....................................................... 9
Table 3 Mixed-Methods Research Strategies ............................................................................. 25
Table 4 Ways of Controlling RH Fluctuation and Their Impact on the Energy Consumption ..... 73
Table 5 Constants for Clausius-Clapeyron Equation ................................................................... 75
Table 6 Dew Point Temperatures (°C) by Initial RH und Temperature ....................................... 76
Table 7 Blower Door Test Results ............................................................................................. 125
Table 8 Daily Evaporated Water (litre/24 hours) During Individual Tests ................................ 128
Table 9 Relative Humidity Levels by Humidification and Different Materials Added............... 132
Table 10 Descriptive Statistics for Inside RH in T-House .......................................................... 136
Table 11 Descriptive Statistics for Inside RH in C-House .......................................................... 136
Table 12 Test for Homogeneity of Covariant (ANOVA for Outside RH) T-House...................... 139
Table 13 Test for Homogeneity of Covariant (ANOVA for Outside RH) C-House ..................... 139
Table 14 Levene’s Test of Homogeneity of Variances for T-House .......................................... 140
Table 15 Levene’s Test of Homogeneity of Variances for C-House .......................................... 141
Table 16 F-Test of Heteroscedasticity for T-House ................................................................... 141
Table 17 F-Test of Heteroscedasticity for C-House ................................................................... 141
Table 18 Two-Way ANOVA Tests of Between-Subjects Effects T-House .................................. 142
Table 19 Two-Way ANOVA Tests of Between-Subjects Effects C-House.................................. 143
Table 20 One-Way ANOVA Tests of Between-Subjects Effects T-House .................................. 144
Table 21 One-Way ANOVA Tests of Between-Subjects Effects C-House .................................. 144
Table 22 ANCOVA Tests of Between-Subjects Effects T-House ................................................ 145
Table 23 ANCOVA Tests of Between-Subjects Effects C-House ................................................ 145
Table 24 Interpolation Functions by Humidification in T- and C-House as Measured ............. 150
Table 25 Blower Door Test Results Summary and Air Infiltration Rate Calculation ................. 165
Table 26 Conversion Table of Diverse Hygrothermal Measures............................................... 167
Table 27 Descriptive Statistics for Simulated Inside RH in T-House ......................................... 173
Table 28 Descriptive Statistics for Simulated Inside RH in C-House ......................................... 173
Table 29 Differences Between Measured Data and Simulation ............................................... 175
Table 30 The General Areas Where the API is Suitable in Autodesk Revit ............................... 184
Table 31 Evaluation Characteristics of the People-Element ..................................................... 249
Table 32 Evaluation Characteristics of Processes Across All Project Phases ............................ 250
Table 33 Evaluation Characteristics of Technologies and Interoperability .............................. 251
Table 34 Evaluation Characteristics of Environmental Systems ............................................... 251
Table 35 Swift CIDNZ Assessment Tool Criteria ........................................................................ 253
x
List of Acronyms
0H Null Hypothesis
AEC Architecture, Engineering, and Construction
ANCOVA Analysis of covariance
ANOVA Analysis of variance
API Application Programming Interface
AQAL All Quadrants, All Levels
ASHRAE American Society of Heating, Refrigerating and Air-Conditioning Engineers
BEAM Building Environmental Assessment Methods
BEM Building Energy Model
BEM Building Energy Modelling
BES Building Energy Simulation
BEST Building Energy Software Tools
BIM Building Information Modelling
BRANZ Building Research Association of New Zealand
BREEAM Building Research Establishment’s Environmental Assessment Method
CAD Computer-Aided Design
CE Circular Economy
CFD Computational Fluid Dynamics
CIDNZ Complex Integral Design New Zealand
CO2 Carbon dioxide
CPM Critical Path Method
CPU Central Processing Unit
CV(s) Co-dependent variable(s)
DNA Deoxyribonucleic acid
DV Dependent Variable
EECA Energy Efficiency and Conservation Authority
EMPD Effective Moisture Penetration Depth
EPS Extracellular polysaccharides
EVA Earned Value Analysis
GBC Green Building Council
GBCs Green Building Councils
gbXML Green Building XML schema
GIS Geographical Information Systems
HAM Heat, Air, and Moisture
xi
HAMT Heat, Air, and Moisture Transfer
HVAC Heating, Ventilation and Air Conditioning
IAPWS International Association for the Properties of Water and Steam
IAQ Indoor Air Quality
IBP Institute for Building Physics
IBPSA International Building Performance Simulation Association
IDDS Integrated Design and Delivery Solutions
IEQ Indoor Environmental Quality
IFC Industry Foundation Classes
IPD Integrated Project Delivery
ISD Integral Sustainable Design
IVs Independent Variables
LBMS Location Based Management System
LCA Life Cycle Analysis
LEED Leadership in Energy and Environmental Design
LOB Line Of Balance
LPS Last Planner System
MBC Moisture Buffering Capacity
MBV Moisture Buffering Value
MgO Magnesium oxide
MVD Model View Definitions
MVOCs Microbial Volatile Organic Compounds
NESAQ National Environmental Standards for Air Quality
NZ New Zealand
NZGBC New Zealand Green Building Council
PGD Proper Generalised Decomposition
PVC Polyvinyl chloride
RH Relative Humidity
RNA Ribonucleic acid
RTA Residential Tenancies Act
TMPD Theoretical Moisture Penetration Depth
UMBV Ultimate Moisture Buffering Value
VOCs Volatile Organic Compounds
VTT Technical Research Centre of Finland Ltd
WHO World Health Organization
WHRS Weathertight Homes Resolution Service
WUFI Wärme Und Feuchte Instationär (heat and moisture transiency)

xii
WV Water Vapour
WVTR Water Vapour Transmission Rate
XML eXtensible Markup Language
xiii
Attestation of Authorship “I hereby declare that this submission is my own work and that, to the best of my
knowledge and belief, it contains no material previously published or written by
another person (except where explicitly defined in the acknowledgements), nor
material which to a substantial extent has been submitted for the award of any other
degree or diploma of a university or other institution of higher learning.”
Auckland, 07.07.2020
xiv
Acknowledgements
Foremost, I would like to express my sincere gratitude to Auckland University of
Technology (AUT) the Vice-Chancellor’s Doctoral Scholarship for making my study
possible. I would like to heartily thank my children Christian, Sophie, and Jim Brauner
for all their understanding and support during the time of this PhD. Further, I like to
thank my internal supervisors: Dr Ali GhaffarianHoseini, Professor John Tookey, and
Associate Professor Nicola Naismith; and my external supervisor Professor Mark
Bomberg. Associate Professor Nicola, your guidance throughout the PhD was of
substantial value. You always made yourself available, when needed and cheered me
up when I was feeling exhausted. Professor John, without you and your enthusiasm, I
would barely find the courage to step out of my comfort zone and start the doctoral
study. Dr Ali, your wealth of BIM knowledge and expertise were of significant value.
Professor Mark, I appreciate your time, unique expertise, and encouragement to
complex and holistic thinking. I would also like to express my deep thankfulness to
Roger Birchmore, senior lecturer at UNITEC Auckland, for supporting the in-field
experiment. Roger, your contribution to this PhD was exceedingly valuable. Without
your offer to use the UNITEC testing houses, the organization of humidifiers from
BRANZ, and professional assistance, the data collection would be impossible.
Simultaneously, I would like to express my thankfulness to the team of Fraunhofer
Institute for Building Physics IBP, Department Hygrothermics, particularly Professor Dr
Hartwig Künzel, Florian Antretter, and Matthias Pazold for their support by the
simulation. I also would like to thank Robin Curtis from Health Based Building™ and
Mike Olds from Resene Construction Systems for their donations of the testing
materials. In addition, I am grateful to my friends and family for their inspirations and
backing during the period of this study. To conclude, I cannot forget to thank the AUT
School of Future Environments and its member’s staff for all the considerate guidance
and funding for my conference presentations.
1
Chapter 1 Introduction
High relative humidity (RH) and water intrusion affect housing in New Zealand (NZ). A
recent BRANZ study revealed that cold and damp are common issues of NZ houses
(Pollard, 2018). From 83 measured homes across the country, 84% of the bedrooms
have not reached the WHO recommended benchmark of 18 °C (World Health
Organization, 2018) from which some houses had only 12 °C. Consequently, mould
growth is estimated in 50% of NZ houses (Plagmann, 2018). Energy Efficiency and
Conservation Authority (EECA) estimated that about two thirds of the NZ housing stock
are not insulated and inadequately heated (Bennett et al., 2016).
A large portion of NZ houses is energy-inefficient, unhealthy, cold, mouldy, and damp
(X. Li et al., 2019). Data from the 2018 General Social Survey shows over a third of NZ
homes are too cold (bellow 18 °C) in winter and too warm in summer. Inhabitants of
45% of the households with the recorded temperature lower than 16 °C could see their
breath inside during winter. About 10% of total dwellings, constructed between 1992
and 2008 by the use of monolithic cladding, contributed significantly to the building
failure known as “leaky building syndrome” (Shi et al., 2017). In 2009 the NZ
Government accepted PricewaterhouseCoopers’s consensus forecast that around
42,000 dwellings built between 1992 and 2008 could have been affected, which would
incur total economic costs of an estimated $11.3 billion (Williamson, 2009). However,
time showed that the weathertightness failures had been underestimated and they
occur in dwellings with all cladding types (Knox & Star, 2015). Therefore, questions
remain: Why the leaky homes crisis exists in NZ over 20 years? Why has the valuation
period for the Government’s Financial Assistance Package Scheme been set at the next
20 years until 2038 (New Zealand Government, 2018b)? Does it mean that the leaky
homes are still being built?
According to the Weathertight Homes Resolution Service (WHRS) claims statistics,
more than 7,000 claims have been lodged annually in the last five years (New Zealand
Government, 2020). However, these statistics relate only to claims that have met the
eligibility criteria set out in the Weathertight Homes Resolution Services Act 2006
(New Zealand Government, 2019c). Another analysis of building failures estimated that

2
among NZ dwellings built between 1985 and 2014, 27% (about 174,000) are ‘very likely
to leak’ (Knox & Star, 2015). The newly estimated remediation costs are exceeding
$47.7 billion (Dyer, 2019).
The change of the Residential Tenancies Act in 2016 made a declaration of the level of
insulation an obligatory part of the tenancy agreement (New Zealand Government,
2019b). These changes led to improved insulation of approximately 180,000 properties
by 2019, which has been projected to save 129 lives per year and $114.6 million per
year in avoided healthcare costs (BRANZ, 2018). The data indicates the scale of the
impact of housing quality on economy and health.
The risks associated with poor quality of houses contain diverse issues connected with
dampness, mould, and even rotting of building structure. Newly published research
suggests that the problem is much broader than initially thought and is rooted in
potential systemic failures (Duncan & Ward, 2017). Duncan and Ward (2017) argue
that no building pathology system exists in NZ. Therefore, the industry hardly learned
from past mistakes which partly led to today’s unsatisfactory situation in housing
quality. Therewith, this study is dedicated to the elimination of sick building syndrome
and leaky house syndrome, and generally to the improvements of hygrothermal
performance and quality of buildings.
Hygrothermal analysis constitutes a part of the science called either Building Physics in
Europe or Building Science in North America. Building physics is a relatively new
science (since the 1930s) which is based mainly on experimental studies and empirical
experience in the building industry (Bomberg, 2012). The fact is that little to no
building physics has been taught to architectural students at the Universities in New
Zealand (Rosemeier, 2010). The consequence of this situation is that even newly built
houses are often not performing well. Although numeric calculation in the field of
statics, construction and energy engineering are standard, the evaluation of
hygrothermal processes of building constructions are not common. This research
brings new knowledge in the field of construction in New Zealand with the intention to
encourage not only building science but the whole building industry to use
hygrothermal assessment appropriately wherever technical decisions about buildings
are made.
3
1.1 Background
Design of low or zero energy sustainable buildings is a complex task which requires a
broad scale of knowledge from different fields. The technology of the house moved far
beyond the traditional house equipment (similarly to a modern car), the climate is
changing, and the transition into the fourth industrial revolution is bringing new
technology into the design process of houses. Therefore, a new approach to building
design is necessary to pursue the fast changes. The holistic design process requires a
total paradigm shift in thinking and applying new technology. The investigation of the
influence of different building materials on indoor RH levels, as described in this thesis,
represents a part of a complex holistic design process. Other components of the
holistic design process are, for example, the elaboration of building structure,
durability, weathertightness, energy efficiency, moisture-related issues, indoor air
quality, lighting, human aspect, and impact on the environment. The movement in the
architecture, engineering, and construction (AEC) industry needs to follow the socio-
cultural development into the second-tier thinking levels towards an integral system
by adding the human aspect (Sepers, 2017). The same integrated design paradigm,
where the whole design team engages with these factors, needs to be applied by new
built and retrofits (Bomberg, Gibson, et al., 2015).
1.2 Rationale and Significance of the Study
With a fast-growing population of NZ, there is an urging need for more homes,
especially in agglomeration areas, such as Auckland, Christchurch, and Wellington.
Using consented dwellings and population growth as indicators of the balance
between housing supply and demand in Auckland, for example in the year ended June
2016, there was a surplus of demand for housing potentially 6,000 dwellings (Stats NZ,
2017). These figures, combined with the fact that many of NZ houses do not provide a
healthy indoor environment, indicate the importance of the housing sector in the NZ
economy. There is a significant need for improvements in the quality and durability of
NZ homes because the housing is becoming increasingly important to people’s health
due to demographic and climate changes (World Health Organization, 2018).
Despite the fact that the research on measured building moisture and respiratory or
allergic health effects is limited, associations are strong (Mendell et al., 2018). Newly

4
published NZ study by Ingham et al. (2019) emphasizes the impact of housing quality
on the health of children:
A dose–response relationship exists between housing quality measures, particularly dampness–mould, and young children’s acute respiratory infection (ARI) hospitalisation rates. Initiatives to improve housing quality and to reduce dampness–mould would have a large impact on ARI hospitalisation. (p. 849)
Asthma and other respiratory diseases affect 700,000 people in NZ and cost more than
$7 billion every year; asthma in NZ affects one in eight adults and one in seven children
(Barnard & Zhang, 2018).
The analysis of the NZ housing awoke the research idea. The subject was used for this
study because of an existing gap in knowledge of how to enable BIM (Building
Information Modelling) to participate in a design process that pursues a holistic
approach. Apart from energy modelling, sustainability assessment has a minimal
presence in the used BIM tools. To be able to take responsibility for our future, there is
a significant requirement for accountability and the ability to quantify the ecological,
social, and economic value of projects. For example, what is the impact of
improvements in the indoor environment on health issues, such as asthma, chronic
headaches, or burnout syndrome, and their macroeconomic costs? Consequently, how
can these building components have their environmental impact factored into the BIM
process?
This research concentrates on understanding the consequences of underestimating
hygrothermal relations in NZ buildings and specifying requirements for integration of
hygrothermal modelling into BIM. Consequently, the research contributes to an
understanding of why our current buildings are not always performing well and aims to
provide a framework for acceptable solutions and tools for designers to design
warmer, drier, and healthier houses. The thesis intends to find conditions and
requirements for BIM enabling assessment of construction projects in different stages
regarding hygrothermal relations, calculations, and optimization. The necessity to
improve building hygrothermal performance is increasingly recognized, but the
information on how to efficiently use the moisture buffering capacity in the design
process is still missing. Design and construction process of energy-efficient and

5
comfortable houses require the evaluation of indoor moisture and regulation of
excessive indoor humidity and temperature extremes. Simplifying the problematic of
building performance to thermal insulation and airtightness only, is not the solution to
the problem. With new technologies and materials used in the construction, the
complexity of dwellings is growing. This situation requires a new interdisciplinary
approach to the design process.
Therefore, in an interdisciplinary and systematic approach relating to construction
engineering, architecture, building physics, biology, building biology, chemistry,
psychology, and environmental studies the thesis focuses on BIM innovation and its
implementation strategy. It is essential to consider carefully both how buildings are
designed and the choice of materials used (Sacks et al., 2018). This thesis aims to
evaluate the risks of underestimating hygrothermal relations in buildings and suggest
possible solutions to design energy efficient, healthy, and durable buildings. Suggested
solutions are based on restructuration of the whole design and construction process,
which is aiming to find answers to the questions in the time when they are needed,
and prevent the building performance design defects. In this sense, the thesis is likely
to enhance the existing knowledge by introducing integral thinking to the design
process of sustainable houses.
1.3 Research Focus
This research focuses on possible ways how to improve the quality of houses in NZ,
particularly hygrothermal performance. As the construction industry is increasingly
complex and new technologies develop and are being incorporated in diverse stages of
the construction process, modelling gains on significance. This research’s intention is
to demonstrate that broadening of BIM in terms of sustainability assessment of
materials applied during the early stage of design might prevent moisture related
problems and improve the durability and quality of construction. Consequently,
negative impacts on the environment, human’s health, and life cycle costs of a building
can be minimized, energy efficiency and indoor air can be improved.
The problematic of energy-inefficient, unhealthy, cold, mouldy, and damp houses in NZ
couldn’t be solved with the same approach as it was created. A radical change in
thinking is necessary because as Albert Einstein has already said: “Problems cannot be
6
solved by the same level of thinking that created them” (as cited in German in
Stahlbaum, 2020 ). Therefore, the second part of the thesis focuses on the paradigm
shift in the architectural design process.
The research focus is depicted by research aim, objectives, and questions.
1.4 Research Aim, Objectives, and Questions
The aim of this research is to understand firstly the relationship between BIM and
sustainability assessment of materials during the early design stages of housing,
focusing on moisture related issues in New Zealand. Secondly, the research aim is to
understand the design process from a systemic point of view.
In order to achieve the research aim, the following objectives have been identified:
• Examine the hygrothermal performance of New Zealand housing construction,
focusing on internal envelope materials.
• To identify the challenges associated with undertaking effective hygrothermal
assessments during the early design stage of housing in New Zealand.
• Specify requirements for integration of hygrothermal simulation into BIM to
improve building sustainability.
• To develop a framework for designers to provide warmer, drier, and healthier
houses for the New Zealand context.
To achieve the research aim and objectives, the following questions, as shown in Table
1, are guiding the study:
Table 1
Research Questions

7
Research Objectives Research Questions
1. Examine the hygrothermal performance of New Zealand housing construction, focusing on internal envelope materials.
What levels of RH are reached in occupied NZ houses by different internal envelope materials?
What is the impact of different building materials used on the indoor side of walls on the hygrothermal performance of a building?
How do RH levels differ in NZ houses based on the presence/absence of airtightness membranes?
2. To identify the challenges associated with undertaking effective hygrothermal assessments during the early design stage of housing in New Zealand.
What are the most significant impacts of high humidity on NZ housing?
What are the requirements for undertaking an effective hygrothermal assessment of houses during the early design stage?
Which physical qualities of building materials influence hygrothermal performance most significantly?
3. Specify requirements for integration of hygrothermal simulation into BIM to improve building sustainability.
How can building sustainability be improved based on effective hygrothermal simulation?
What are the requirements for integration of hygrothermal modelling into BIM?
How can a BIM-integrated hygrothermal simulation tool improve the building performance?
How can a BIM-integrated hygrothermal simulation tool reduce errors affecting the hygrothermal performance of buildings?
How can a BIM-integrated hygrothermal simulation tool increase hygrothermal efficiency?
4. To develop a framework for designers to provide warmer, drier, and healthier houses for the New Zealand context.
How can integral principles be applied to determine potential building performance weakness during the design stage?
Considering building physics, what are the major differences of the design process, including hygrothermal simulation compared to the traditional design process?
What factors have the most influence on hygrothermal performance of houses in NZ?
What are the steps to design warmer, drier, and healthier houses for NZ context?
8
1.5 Research Scope
The research area will be explored gradually from an individual (in the form of two test
houses) to a collective level. The latter will examine general requirements for
incorporation of hygrothermal modelling into BIM and system approach to the design
of houses. The first part of the thesis will focus on data collection to test the
hypothesis. It will provide analysis and comparison of quasi-experiment and simulation
data for two test houses located in Auckland, New Zealand. The experiment ran from
January 9th, 2018 till February 19th, 2018.
The collective level of the thesis will cover two stages - rational and integral. The
rational stage is based on the analysis of interoperability requirements between BIM
and hygrothermal modelling. It will lead to a description of possible ways how to
incorporate hygrothermal modelling into BIM. The integral stage depicts a completely
different type of the collective level because it is not exclusive. In contrary, the integral
stage of thinking understands the importance of each of the previous stages in the
development of knowledge (Gallifa, 2019). This level is holistic and all inclusive. From
this level the necessary changes in the design process of houses will be discussed.
1.6 Key Assumptions of the Study and Hypothesis
Based on building physics knowledge about hygrothermal relations in buildings, the
researcher proposed the following hypothesis:
“If materials used in the building envelope have a significant influence on the
hygrothermal performance of the building, then the design of sustainable buildings
cannot be done without hygrothermal modelling.”
The hypothesis guided the direction of the research process and dictated quite
precisely its nature. The formulation of the thesis indicates the used systemic approach
with analytical quality. This research performed an in-field experiment and
hygrothermal simulation to test the validity of the first statement - namely, “Materials
used in the building envelope have a significant influence on the hygrothermal
performance of the building.”
9
After a rigorous literature review, the researcher developed a conceptual framework.
A conceptual framework is representing the context of the concept that the study is
based on. This study concept is based on two main pillars. The first part uses a classical
approach of testing the hypothesis with experiment (quasi-experiment) and
simulation. The two testing methods have been chosen deliberately in order to
determine the impact of different materials on indoor RH and to demonstrate the
significance of hygrothermal modelling integration into Building Information Modelling
(BIM). Data gained from testing the hypothesis have been analysed using statistical
methods. From the results of the analysis have been drawn conclusions supporting the
hypothesis. The hypothesis has been confirmed.
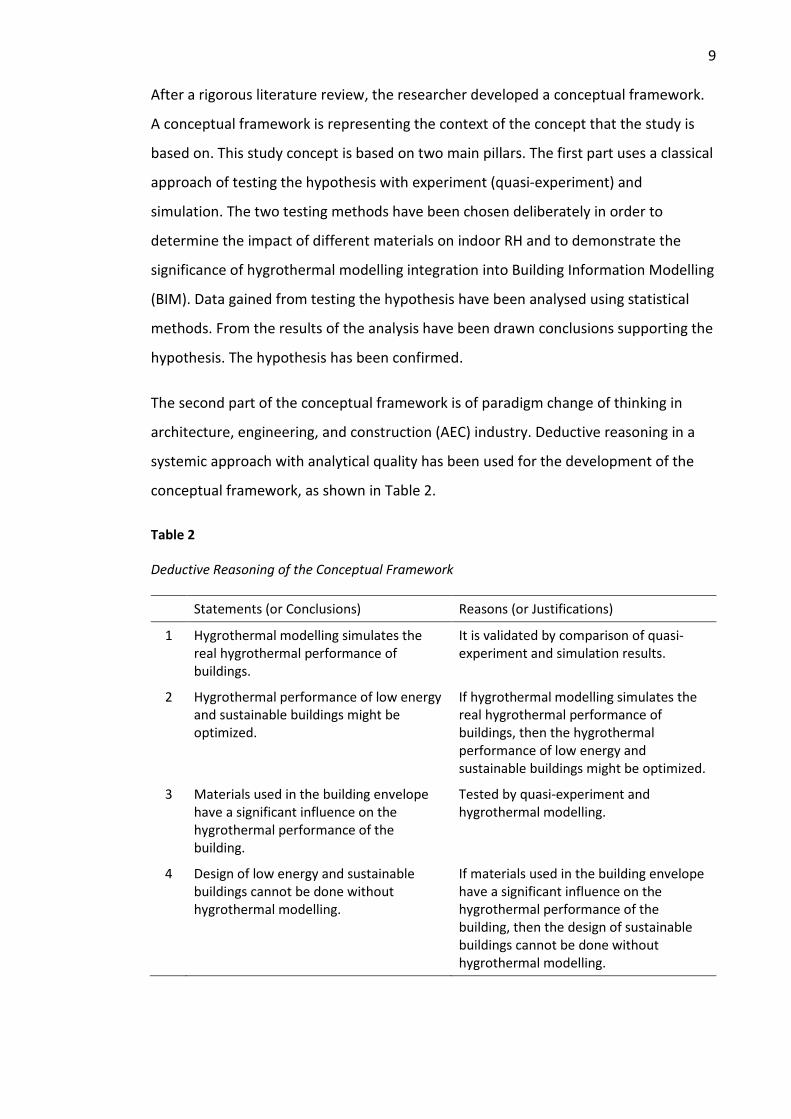
The second part of the conceptual framework is of paradigm change of thinking in
architecture, engineering, and construction (AEC) industry. Deductive reasoning in a
systemic approach with analytical quality has been used for the development of the
conceptual framework, as shown in Table 2.
Table 2
Deductive Reasoning of the Conceptual Framework
Statements (or Conclusions) Reasons (or Justifications)
1 Hygrothermal modelling simulates the real hygrothermal performance of buildings.
It is validated by comparison of quasi-experiment and simulation results.
2 Hygrothermal performance of low energy and sustainable buildings might be optimized.
If hygrothermal modelling simulates the real hygrothermal performance of buildings, then the hygrothermal performance of low energy and sustainable buildings might be optimized.
3 Materials used in the building envelope have a significant influence on the hygrothermal performance of the building.
Tested by quasi-experiment and hygrothermal modelling.
4 Design of low energy and sustainable buildings cannot be done without hygrothermal modelling.
If materials used in the building envelope have a significant influence on the hygrothermal performance of the building, then the design of sustainable buildings cannot be done without hygrothermal modelling.
10
The thesis is likely to reveal the reasons for necessary interoperability between
hygrothermal modelling and BIM. Consequently, a part of the thesis constitutes an
evaluation of requirements for hygrothermal simulation and suggested incorporation
of the hygrothermal model into BIM. The researcher selected two examples of
software - Revit representing BIM and WUFI Plus a whole building hygrothermal
simulation model.
Construction is a complex process which influences the environment and society. The
optimization of such a process often lies in the reorganization of existing procedures
and using known methods in a new way. Consequently, the proposed design process
has the capacity to integrate differentiations/different perspectives, such as outdoor
conditions or intended use of the building, in a unified framework. Therefore, the
thesis structure follows a logical construct which leads from a rational to an integral
stage. The chapters and the two main parts of the thesis are linked together by the
intention to find answers on how to optimize a sustainability assessment tool for BIM
systems and its practical application in the AEC industry. The study focuses on the
development of a framework for designers to provide warmer, drier, and healthier
houses for the NZ context.
The framework will lead to a conscious balancing of equal outcome (freedom to
choose what people like) with equal opportunity (economic and environmental
factors). Therefore, the suggested framework will allow for sustainable development in
harmony with changes in perspectives. An example of changing perspectives is the
influence of the energy crisis. By the time the energy crisis arose, the energy saving
perspective had brought a new reality into house design. The AEC industry focused on
super insulated houses with only energy in view; by some extremes ignoring the
natural and psychological human needs for the healthy indoor environment or natural
full spectrum light. The influence of the indoor environment on health was seen as
non-existing or limited because the science was unable to prove the causal relationship
between them. However, an increasing number of evidence-based studies indicated
the implications of the quality of housing for people’s health. For this reason, official
bodies, such as WHO acknowledged that healthy housing besides providing shelter
from the elements and from excess moisture, mould, pests, and pollutants “… supports
a state of complete physical, mental and social well-being” (World Health
11
Organization, 2018, p. 2). Therefore, this study is about the perspective from which we
look at the task of how to build better, healthier, warmer, and safer houses. This thesis
is of paradigm change of thinking in new, occupant centred design.
1.7 Limitations
The researcher is aware of the limitations of this study on both levels of the research
scope. On the individual level, the limitations related to the accuracy of any data. In
the quasi-experiment, the limited accuracy originated in the quality of available
technical equipment and uncontrollable factors, such as weather. In the simulation,
some input data, such as laboratory tested hygrothermal properties of used materials
have been unknown. Therefore, the study had to rely on estimated or software’s
library data. The major challenge of the experiment has been technical malfunctions of
one humidifier occurring during the validation process of the testing. Consequently,
the original quasi-experiment design had to be changed from simultaneous to
switching mode which resulted in different weather conditions by each setting. The
research was limited to indoor RH measurements. However, a complete assessment of
the hygrothermal performance of the house/compartment inclusive in-wall RH
measurements would be required to guide design decisions. From this reason, the
researcher is not taking the assessment of airtightness in the conclusions.
Other experienced limitations are of model predictions of RH development by using a
classic diffusive model. These limitations are well known because these models neglect
some phenomena, such as nonequilibrium behaviour between water vapour and
bound water, or transport by air convection (Busser et al., 2019). The comparison of
measured and simulated data demonstrated this limitation, especially due to the use
of hygroscopic fibrous materials. Additionally, as existing models rely on input data
which are man-prepared, the results are influenced by the quality of such data
(Antretter & Pallin, 2019). The program output and its interpretation often require
deeper knowledge in physics and material characteristics. Therefore, the researcher is
aware of the necessary condition of successful incorporation of hygrothermal
modelling into the design process, which is an adequate education for building
professionals.
12
On the collective level, the thesis is limited to a specification of requirements for
integration of hygrothermal simulation into BIM and a proposal of a framework for
designers.
1.8 Thesis Contribution and Overview
The thesis is likely to contribute to the existing knowledge in multiple ways. The
findings of the research confirmed the hypothesis: “If materials used in the building
envelope have a significant influence on the hygrothermal performance of the
building, then the design of sustainable buildings cannot be done without
hygrothermal modelling.” Therefore, the proposed integration of hygrothermal
modelling into BIM will enable optimization of the house design in the stage when the
costs for changes are the lowest. Consequently, building sustainability and quality of
houses might be improved.
With the analysis of hygrothermal performance of NZ houses, the thesis reveals that
hygrothermal modelling might assist the sustainable design. The findings of RH
development in real houses, which demonstrate the influence of different materials in
diverse construction types (existence or non-existence of airtightness membrane), are
bringing new knowledge in the NZ context.
The suggested integration of scientific achievements, available tools, and partial
knowledge into the design process of houses in a holistic way - named Complex
Integral Design New Zealand (CIDNZ) - is likely to change the outcome (quality of
houses). The proposed framework is introducing a new perspective on how to design
warmer, drier, and healthier houses for the NZ context. CIDNZ encourages
architectural and engineering design to gradually develop in an integrative and
interdisciplinary way. The design process will change the perspective from originally
cost-oriented view (cheap and fast built) to energy-efficient, zero-energy buildings
without negative influence on the environment. Therefore, the future housing (created
by the CIDNZ principles) will be durable, less disturbing to the natural habitat, less
polluting the environment, constructed from high quality, recyclable or reusable
materials, and have healthy indoor air. The proposed CIDNZ framework is flexible,
allowing the addition of new perspectives. It focuses on people by respecting a broad
spectrum of human needs, inclusive physical, psychological, social, and spiritual.

13
Therefore, the housing will enhance humans’ individual and social lives and be
adaptive to changing needs.
This thesis consists of two major parts. The structure of the first part (chapters 2 – 7)
follows a traditional, classical approach to thesis from the evaluation of the existing
knowledge in related fields to the examination of selected problems. This thesis chose
moisture related problems and building materials’ influence on indoor RH. The data
collection consists of quasi-experiment in real houses with real time measurements
and simulation of the same settings. Data have been validated by comparison of
measurements and simulation results for existing house setting without any changes.
Data implementation, analysis, and interpretation of results served to test the
hypothesis and demonstration of the complexity of moisture related problems in
buildings. After a description of requirements for interoperability between BIM and
hygrothermal modelling, the findings are discussed.
The theoretical knowledge applied and further developed in experimental studies led
to the demonstration of significance and feasibility of purposeful choice and
placement of building materials to design and build healthier and sustainable houses.
The findings have been translated into requirements for data needed for modelling of
different variants of projects, permitting early-stage identification and prevention of
environmental weak points. The idea is to apply BIM in stages, allowing for competent
decisions regarding environmental impact and sustainability of new buildings and
retrofits/rebuild to prevent unintended moisture related problems during construction
and whole life cycle of the building. A theoretical perspective, such as a conceptual
framework for allowing interoperability through the BIM platform guides the study.
Therefore, the second part of the thesis (Chapter 8) offers a new look out of existing
situation in the AEC industry. This part consists of defining the new set of operations
CIDNZ, which likely lead to healthy housing. Consequently, the integration of this
system approach will happen gradually through a transformation process.
14
Chapter 2 Research Methods
In this chapter, the researcher intends to debate research methodology and set a
philosophical background of the research. The structure of the chapter is conceived in
terms of general research methods and narrowed to the research method used by this
research. The chapter first examines the philosophical position of research in relation
to ontology and epistemology. This includes the description and brief characteristics of
major philosophical theories, such as positivism, interpretivism, phenomenology,
critical realism, constructivism, relativism, empiricism, and rationalism. This overview
of the theory is followed by research strategy analysis inclusive influences of different
factors on research. A comprehensive depiction of research design styles, such as
survey, experiment, quasi-experiment, archival analysis, history, case study, and
simulation, represent the next part of this chapter. The last part of the theoretical
explanation is dedicated to available reasoning methods for research in the evaluation
of theory. The whole chapter leads to the description of the methodology of this
research, where reasons for the chosen research strategy and style are explained.
After this sequence, the chapter focuses on experiment and simulation design, and
methodology of literature review. In the summary, the significant points of this
chapter are summarized.
2.1 Philosophical Position of Research
Research is defined as “… the systematic investigation into and study of materials and
sources in order to establish facts and reach new conclusions” (Lexico powered by
Oxford [Lexico], n.d.) . Research is a cognitive process often influenced by ontological
and epistemological beliefs (Bercht & Wijermans, 2018; Davies & Fisher, 2018).
Although the ontological and epistemological beliefs might not always be conscious,
they have a significant influence on the process and results of the research. Therefore,
consideration of philosophical position and methodology constitutes the crucial
segments of every scientific research. Despite some critics, the dominant philosophical
position of science is positivism, followed by its oldest opponent interpretivism, and
constructivism. Off cause, these are not the only philosophical theories today, but they
represent the mainstream to which scientists have to position themselves
methodologically (Gorski, 2013). As every philosophy has its position regarding to
15
ontology and epistemology, this chapter provides an overview of the philosophical
studies and theories.
2.1.1 Ontology and Epistemology
Ontology is a term which Lexico (n.d.) describes as:
1. “The branch of metaphysics dealing with the nature of being.
2. A set of concepts and categories in a subject area or domain that shows their
properties and the relations between them.”
In philosophy, ontology represents the study of the nature of being, in other words,
the study of existence. Ontology focuses on questions about what does exist, to what
does it belong, about objectivity, and meaning of existence. Ontology, in the sense of
proving something in existence, is the oldest form of philosophy. It served very good in
natural sciences. Objectivism is an ontological position introduced by Ayn Rand that
asserts that certain phenomena exist independently and separately from human
knowledge or perception (Peikoff & Ward, 1991). Objectivism has its origin in realism
and essentialism (Lakoff, 1987). Objectivism asserts that the world is real and
structured, and that there is an objective reality. Constructivism is an alternative
ontological position which states that the reality exists in the mind so it depends from
our construction of the knowledge (Jonassen, 1991). Constructivism has its origin in
rationalism and empiricism (Mahoney, 2004).
Epistemology is a branch of philosophy studying the nature of thought, in other words,
it is the study of knowledge. Epistemology is defined as: “The theory of knowledge,
especially with regard to its methods, validity, and scope, and the distinction between
justified belief and opinion” (Lexico, n.d.). The epistemological perspective influences
research in two ways; defining the researcher’s world view and informing the research
design (Chism et al., 2008).
Since humans have always been concerned with knowledge and thoughts, many
epistemological theories have been developed. The dominant epistemological theories
could be distinguished according to their relationship to foundationalism and if they
are explanatory or constitutive (Smith et al., 1996). Examples of epistemological
theories are foundationalism, coherentism, pragmatism, rationalism, empiricism,
positivism, realism, and reductionism.

16
2.1.2 Positivism, Interpretivism, and Phenomenology
Positivism is a philosophical theory which is deeply rooted in natural science and
mathematics. Despite the name, positivism has nothing in common with “positive
thinking”. Positivism philosophical ideology was formulated by the French philosopher
August Comte (1798-1857) (Hjørland, 2005). The positivist perspective assumes that
there is an absolute truth, that everything that exists can be proven by scientific
methods or logical reasoning, and that there is a clear division between facts and
values (Chism et al., 2008). From the ontological perspective, the researcher is
separated from reality. From the epistemological view, the reality, which is objective,
exists beyond the mind (Weber, 2004). Everything that is unverifiable is false or does
not have any meaning.
Positivism believes that scientific knowledge exists in universal laws and exception-less
statements that make a prediction and control of the future events possible (Gorski,
2013). According to Smith et al. (1996) positivism was the leading, scientific
epistemological position especially in the early 20th century but since the late 1980s,
the pure positivist theory has been rejected by most philosophers. However, positivist
way of thinking represents a dominant form of orthodoxy and is still the prevalent
theory, especially in natural sciences (Gorski, 2013). Even in social science, the
dominance of neopositivism is based on the argument that neopositivism is uniquely
scientific (Jackson, 2015).
One of the reasons for the prevailing influence of positivism is the ability to practically
guide the research process with a clear and understandable status. No other
philosophy has been able to position itself as an “invisible philosophy of science”.
Another reason for the prevailing influence of positivism might be a deficiency of clear
terminology in the philosophy of science (Hjørland, 2005). Postpositivism, although
being successful in criticizing positivism such as reflectivist theories, still believes in
objective reality.
Interpretivism represents a philosophical theory which is in contrast with positivism.
However, interpretivists distinguish between natural and social sciences. Natural
sciences according to interpretivism may be governed by general laws, but social
sciences are governed by meanings. Therefore, the methods and aims used by

17
interpretivism in social sciences are strongly dissimilar from the methods and aims
used in natural sciences (Gorski, 2013). Many of the qualitative research studies are
based on the interpretivist perspective (Chism et al., 2008). Interpretivism’s
metatheoretical assumption about ontology is based on the idea that the researcher
and reality are inseparable and interdependent. The epistemology of interpretivism
can be best described by a belief that knowledge is intentionally constituted through
social construction of the reality (Weber, 2004).
Phenomenology has its origin in the work of Brentano (Poli, 2017) and is defined as
… a radical, anti-traditional style of philosophising, which emphasises the attempt to get to the truth of matters, to describe phenomena, in the broadest sense as whatever appears in the manner in which it appears, that is as it manifests itself to consciousness, to the experiencer. (Moran, 2000, p. 4)
Phenomenology aims to understand phenomena without any impositions from
existing knowledge or beliefs posed a priori on experience. In this sense, a
phenomenological study focuses on the essence of an experience. Phenomenology
was seen as radicalization of empiricism by Husserl (2012) who added to two generally
accepted spheres of consciousness a third one. The two spheres are: material, factual
sphere called unity of things, and formal sphere called unity of essence. The “unity of
things” and the “unity of essence” are connected through mind only. Husserl believed
that there is a third sphere of absolute consciousness where intuition and experiences
add to knowledge. The sphere of absolute consciousness could be reached by using
the method of phenomenological reduction (Husserl, 2012). The Husserl’s theory of
absolute consciousness is further developed by new theories, such as morphogenetic
fields theory (Beloussov & Gordon, 2018; De Luca Picione & Freda, 2016) and
morphomechanics (Ermakov, 2018). Phenomenology as philosophy underpins every
qualitative research (Merriam, 2002). Although this research is based on logical
positivism, the researcher positions herself into supporting this statement. The logical
positivism serves the research well, however, to find solutions to environmental issues,
the research recommends a holistic and integral approach. The researcher believes
that morphogenetic fields theory and holistic approach might be applied to design and
architecture as well. Especially in solving of environmental questions, holistic approach
to sustainability opens a door for new resolutions. An example of new ways in
architecture represents an atmospheric approach to design. The atmospheric
18
approach might be detected in air design, meteorological architecture, and
atmospheric preservation (Corbo, 2018).
2.1.3 Critical Realism, Constructivism, and Relativism
Constructivism is a theory developed by Piaget and Inhelder (1967). Constructivism is
based on the idea that knowledge and reality are constructed through personal
experience, and that they are never staying the same as they are constantly formed
and transformed by means of personal experience (Ackermann, 2001). In other words,
researchers are in the role of actors while participating in the research process. Reality
is a social construction and is an interpretation of human sense making. This view is
inspired by the philosophical position of phenomenology (Edvardsson et al., 2011).
Constructivism has several differently interpreted meanings. Some versions of
constructivism accede that social life is linguistically compiled (Gorski, 2013). However,
they all have one philosophical position in common: knowledge is being constructed, is
based on interaction, and is under constant state of revision (Bryman, 2016). According
to constructivism, social structures do not have active causal powers (Harré, 2001).
Constructivists maintain the idea that the subject (researcher) and the object
(investigated phenomena) separation is not possible, nor the complete distinction
between theory and practice. In this sense, researchers cannot be deemed to be
objective or value neutral (Peters et al., 2013). Research commences “conversations”
within a “community” of scholarship based on assumptions. Constructivism constitutes
not only a theory but methodology as well (Mir & Watson, 2000).
Bryman (2016) writes in his description of constructionism that constructionism is
often referred to as constructivism. However, these two terms are not
interchangeable, as there are differences between these two theories.
Constructionism is a theory of learning developed by Seymour Papert on the basis of
Piaget’s constructivism. Constructionism adds to constructivism that learning happens
by conscious engagement of learner into expressing of ideas, in other words learning
by doing (Ackermann, 2001).
Realism is often seen as the opposite of constructivism. According to realism, the
world is real and not constructed. Everything that we perceive with our senses is real
and exists. Knowledge and truth are based on the real world, and do not depend on

19
constructions nor change by culture or history. On the scale of theories there are
different realism theories (Hunt, 2016). Naive realism asserts that reality is almost
exactly represented by current theories (Peters et al., 2013).
Critical realism adopted a transcendental realist ontology and an eclectic
realist/interpretivist epistemology (Easton, 2010). Critical realism is a philosophical
theory devised by Roy Bhaskar, in collaboration with Margaret Archer, Mervyn
Hartwig, Tony Lawson, Alan Norrie, and Andrew Sayer (Gorski, 2013). Although
constructivism and critical realism are opposite, they have some similarities as they
both are anti-positivist (Kwan & Tsang, 2001), non-reductionist, and share a common
notion of ontological realism in relation to the existence of natural phenomena (Mir &
Watson, 2000). Differences between critical realism and constructivism are distinctive
in their relation to epistemological relativism where knowledge is seen as concept-
dependent and fallible. Epistemological relativism is accepted by critical realism but
not blindly accepted by constructivism (Kwan & Tsang, 2001). Critical realism and
constructivism differ from each other in asserting if social structures and practices
have causal powers in the social world. Critical realists agree but constructivists
disagree with such causal powers. Critical realism asserts an underlying order of things,
which is independent from mind and is graspable by research, particularly in relation
to the natural world (Peters et al., 2013). Critical realism introduced an ontological
stratification by which the reality is represented by various layers or ‘‘strata’’ in the
natural and social worlds. Ontology is layered into three levels: the real (phenomena
generating mechanisms), the actual (occurring events), and the empirical (experience
of these events) (Bhaskar, 2008). The social reality depends on people and concepts,
but there is an unfolding objective world order which is structured in a hierarchy of
interacting domains and strata (Hartwig, 2015). In the early 2000s developed a new
philosophy — complex integral realism which is a pollination of three integrative
metatheories, such as Roy Bhaskar’s critical realism, Ken Wilber’s integral theory, and
Edgar Morin’s complex thought (Marshall, 2016). Integral theory (see p.21) contains
some aspects of critical realism and quantum mechanics (Wilber, 2019). Case studies
often benefit from accepting critical realism as their core philosophical position
(Easton, 2010).
20
Relativism is an epistemological term used to describe ideas about the relation of truth
and observer, which is seen as relative. Relativists argue that beliefs influencing human
behaviour are relative to the social value system and norms (Ryan et al., 2002).
Especially in social science by describing methodological approaches is the word
“relativism” often used by scholars without clarity about the possible meaning of
relativist position on the scientific knowledge (Jackson, 2015). The reason why
prevailing neopositivist theory is against relativism might be a profound
misunderstanding of methodological diversity and its consequences as Jackson (2015)
argues: “The danger is not relativism; the danger is the potential myopia produced by a
methodological and theoretical monoculture” (p. 21). Grounded theory, discovered by
Glaser and Strauss in 1967 (Glaser et al., 1968, p. 364), represents an example of a
compromise between extreme empiricism and complete relativism (Glaser & Strauss,
2017).
2.1.4 Empiricism and Rationalism
Empiricism and rationalism are two philosophical concepts about the nature of
knowledge, and therefore, they belong to the field of epistemology. Empiricism is the
view where knowledge is gained by observation and by sensing the world directly with
our senses. Empiricism as a concept has been used already by Aristotle (384-322 BC)
and generally played an important role to the history of science, as various scholars
have preferred empirical testing of knowledge to just cognitive experiments or rational
calculation (Hjørland, 2005). The inclination of scientific investigations to “value free”
science has beaconed to positivism which is one of the most significant philosophical
movement in the last two centuries (Ryan et al., 2002). Despite this fact, as with every
philosophical theory, empiricism is criticized by some scientists. One of the most
known philosophers who criticized empiricism was the American philosopher Wilfrid
Sellars (Sellars et al., 1997).
Empiricism is often contrasted with rationalism. Rationalism is the philosophical view
where knowledge arrives from logic and a certain kind of intuition - an immediate
knowing something to be true without deduction. Already the Greek philosopher Plato
(429-347 BC) emphasized mind’s rational abilities and logical intuition. However, the
term “rationalism” has been first used by the French philosopher-mathematician Rene´
21
Descartes (1596–1650) while defining his world view (Ryan et al., 2002). Rationalism in
its extreme form does not accept any experiences because sense perceptions are not
provable without preliminary concepts. Geometry represents an example of science
which is possible to construct without any observations (Hjørland, 2005).
However, in practice almost all philosophers and scientists use a combination of
empiricism and rationalism. Rationalism and empiricism both play a role in science,
though they correspond to different branches of science. Rationalism corresponds
mostly to mathematical analysis, whereas empiricism corresponds to experiments and
observation. Of course, the best route to knowledge combines rational contemplation
and empirical observation. Rationalists and empiricists agree on that; they just
disagree on which one is more important (Hjørland, 2005). Rationalism in the
twentieth century has been epitomized by logical positivism, which attempts to unite
rationalism and empiricism (Smith, 1986). Constructivism is another effort to combine
empiricism and rationalism. For a description of constructivism see the previous
section, Critical Realism, Constructivism, and Relativism.
Controversies between rationalists and empiricists were resolved to some extent by
Immanuel Kant (1724–1804) who tried to show that empiricism and rationalism were
both true in their own ways. Metaprinciples, as a part of Kant’s philosophy, allow us to
establish a relation to and sense of the world what we experience. People learn about
the world from observations, but observations are also based on specific ways of
innate reasoning. This way Kant agreed with rationalism that knowledge is proceeded
by thinking mind and that way reality is mentally constructed. Kant’s transcendental
idealism was not the final solution to the debate between empiricism and rationalism
but definitely influenced many social thinkers (Ryan et al., 2002).
2.1.5 Integral Theory
Integral theory is a school of philosophy which seeks to joint “… assets of premodern,
modern and postmodern thinking systems; and helps in going beyond the nowadays
syncretism of many perspectives” (Gallifa, 2019, p. 15). The word “integral” originated
from late Latin integralis, from integer “whole” and signifies “Necessary to make a
whole complete; essential or fundamental” with attributes, such as “Having or
containing all parts that are necessary to be complete”, and/or “Included as part of a

22
whole rather than supplied separately” (Lexico, n.d.) . Integral theory started in the
1970s with the publication of The Spectrum of Consciousness (Wilber, 1993) and was
further developed by the work of Ken Wilber (Wilber, 2000a, 2000b, 2019) and other
philosophers and thinkers (Gallifa, 2019; Grof, 2016; Marshall, 2016; Murphy, 2011).
The core of the integral theory builds on the foundations of evolutionary theory,
expending the theory from the exterior forms of reality (matter and organisms) to the
interior spaces of reality, namely in the development of culture and consciousness. A
comprehensive map of human potentials distills the major human growth components
into five factors, namely quadrants, levels, lines, states, and types. Wilber, in his “all
quadrants, all levels” (AQAL) approach defines nine altitudes of development
containing three states of consciousness (tiers) and introduces four quadrants of
reality. The grid of the quadrants, along the axes of interior-exterior and individual-
collective, offers four complementary perspectives upon which all human knowledge
and experience might be placed (Wilber, 2000a). The individual perspective refers to
the interior-individual (thoughts, emotions, state of mind, perceptions, etc.) and the
exterior-individual (aspect of individual as subject and object, or aspect of depth and
surface). The collective perspective refers to the interior-collective (cultural, e.g.
shared values, language, relationships, cultural background, etc.) and the exterior-
collective (social, e.g. system, networks, technology, government, etc.) (Wilber,
2014a).
The four quadrants jointly represent a holon. The integral thinking uses the concept of
the holon where holons are complete entities or unities of consciousness seen as
whole/part. Each holon is made up of smaller holons and also incorporated in larger
holons (Wilber, 2000a). Every holon contains four dimensions: agency, communion,
self-transcendence, and self-dissolution or self-immanence (Gallifa, 2019). The agency,
named by Wilber “deep structure” is the tendency of each holon to be whole,
structuring, and optimized. The communion dimension is evolutionary and represents
the holon’s tendency to the relationship with other holons. The self-transcendence
brings the holon’s ability to change. In contrary, the fourth dimension, self-dissolution
focuses on the preservation of itself, of the current level, but also the potential to
evolve (Gallifa, 2019).
23
2.2 Research Approaches – Research Strategy
Every research is a process of finding answers to one or more research questions. The
way how researchers approach the process is based on the idea of research strategy.
Research strategy is a description or distinction of different ways of how researchers
construct the research. Quantitative and qualitative are two main identified research
strategies.
Quantitative research strategy uses, as the name already suggests, measurements and
quantitative methods for the analysis of data. The researched phenomena is
fragmented into measurable or common categories, which are applicable to other
subjects or similar situations (Winter, 2000). Quantitative research attributes are
validity and reliability. “… The aggregated definition of 'validity' could be that of
accuracy, and the definition of 'reliability' that of replicability” (Winter, 2000, p. 3).
Often is quantitative research understood as the traditional scientific method because
from epistemological orientation it has adapted natural science methods, particularly
positivism. Quantitative research strategy is explanatory. This means that the research
explains and tests propositions and hypotheses, which are drawn from precise aims
and objectives by which it utilizes a deductive form of reasoning. Quantitative
approach’s ontological orientation is objectivism (Bryman, 2016).
Qualitative research strategy is exploratory, and usually draws attention to words than
to quantifications. However, qualitative research needs to test and demonstrate its
credibility, transferability, and trustworthiness (Golafshani, 2003). The exact definition
of qualitative research is not possible as qualitative research is based on different
theoretical perspectives, methodologies, and methods (Koro-Ljungberg & Douglas,
2008). Qualitative research refuses positivism, and is often based on interpretative
epistemological orientation. The question of relationship between theory and research
is approached from an inductive way of reasoning to assess individual interpretations
and generate new theory (Bryman, 2016). Diverse techniques for collecting, analysing,
interpreting, and reporting findings have been developed for qualitative research
strategies to study people in their natural settings, or clarify phenomena in relation to
people and their understanding (Denzin & Lincoln, 1994). Qualitative research
comprises naturalistic, interpretive approach to the subject that is researched and
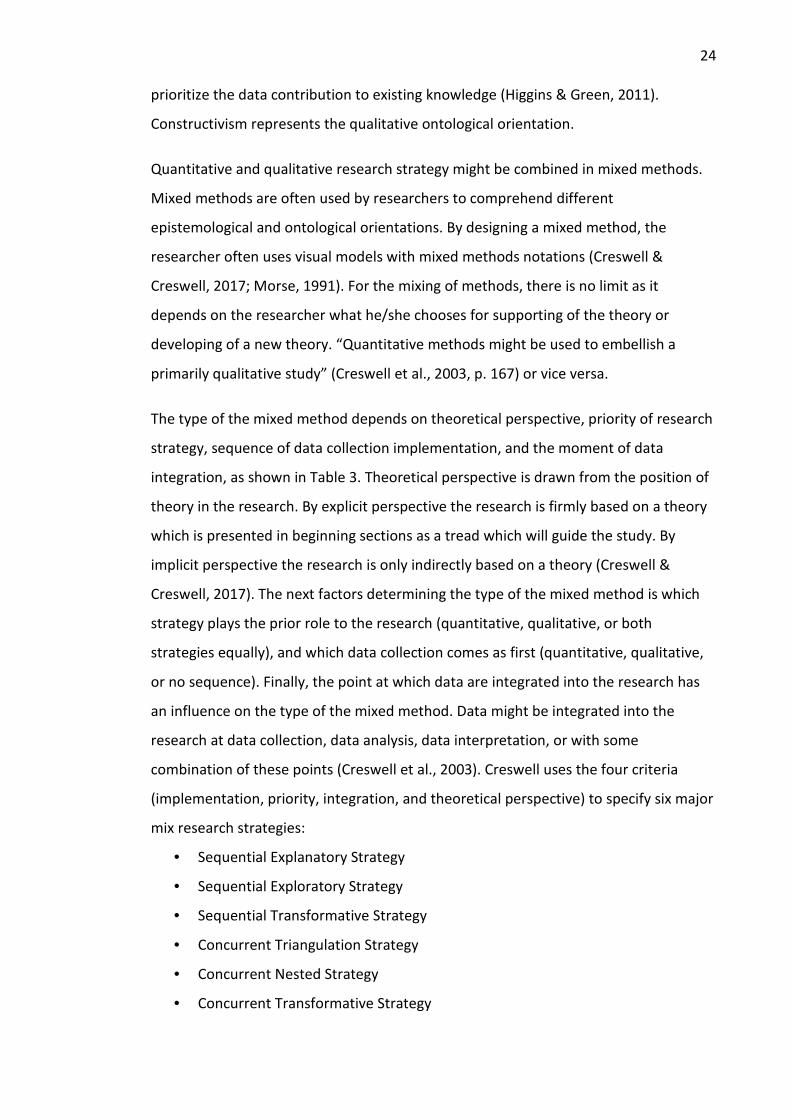
24
prioritize the data contribution to existing knowledge (Higgins & Green, 2011).
Constructivism represents the qualitative ontological orientation.
Quantitative and qualitative research strategy might be combined in mixed methods.
Mixed methods are often used by researchers to comprehend different
epistemological and ontological orientations. By designing a mixed method, the
researcher often uses visual models with mixed methods notations (Creswell &
Creswell, 2017; Morse, 1991). For the mixing of methods, there is no limit as it
depends on the researcher what he/she chooses for supporting of the theory or
developing of a new theory. “Quantitative methods might be used to embellish a
primarily qualitative study” (Creswell et al., 2003, p. 167) or vice versa.
The type of the mixed method depends on theoretical perspective, priority of research
strategy, sequence of data collection implementation, and the moment of data
integration, as shown in Table 3. Theoretical perspective is drawn from the position of
theory in the research. By explicit perspective the research is firmly based on a theory
which is presented in beginning sections as a tread which will guide the study. By
implicit perspective the research is only indirectly based on a theory (Creswell &
Creswell, 2017). The next factors determining the type of the mixed method is which
strategy plays the prior role to the research (quantitative, qualitative, or both
strategies equally), and which data collection comes as first (quantitative, qualitative,
or no sequence). Finally, the point at which data are integrated into the research has
an influence on the type of the mixed method. Data might be integrated into the
research at data collection, data analysis, data interpretation, or with some
combination of these points (Creswell et al., 2003). Creswell uses the four criteria
(implementation, priority, integration, and theoretical perspective) to specify six major
mix research strategies:
• Sequential Explanatory Strategy
• Sequential Exploratory Strategy
• Sequential Transformative Strategy
• Concurrent Triangulation Strategy
• Concurrent Nested Strategy
• Concurrent Transformative Strategy
25
Table 3
Mixed-Methods Research Strategies
Mixed method
Theoretical perspective
Priority of strategy
Sequence of data collection implementation
The point at which the data are integrated
Sequential Explanatory Strategy
explicit equal quantitative first during interpretation
Sequential Exploratory Strategy
implicit equal (but can be given to either)
qualitative first during interpretation
Sequential Transformative Strategy
The theoretical perspective guides the study.
to either or both
no sequence during interpretation
Concurrent Triangulation Strategy
confirmation, corroboration or cross-validation
equal (but can be given to either)
two concurrent data collections
during interpretation or analysis
Concurrent Nested Strategy
A theoretical perspective may or may not guide the design.
to the primary data collection approach
two data collections, one embedded (i.e., nested) within the other
data are mixed during the analysis phase
Concurrent Transformative Strategy
The specific theoretical perspective guides the study.
equal (but can be given to either)
two concurrent data collections
during analysis or possibly during interpretation phase
Note. Adapted from Terrell (2012).
One of the mixed methods often used in construction is Triangulation with two
concurrent data collections by which priority of strategy should be the same but might
be given to either quantitative or qualitative methods (Fellows & Liu, 2015).
2.3 Influences on Research
Research is a cognitive process often influenced by ontological and epistemological
beliefs, which might not always be recognized (Bryman, 2016). Research is done by a
researcher who is not isolated from society and environment. Therefore, research is
influenced to a greater or lesser extent by exterior and/or interior factors, by

26
environmental and/or subject variables. The fact that the observer might influence the
observation, especially by qualitative studies has been documented by Mayo (2014)
and described by Jorgensen (2015). However, there are still questions remaining about
how and to what extent this influence takes place. Quantum physics studies have
brought an explanation to the phenomenon of “participating observer” on the
quantum theory level (Stapp, 2011). Values and science influence each other
reciprocally. Values are based on science, knowledge, and human beliefs. However,
science is influenced by values which reveal themselves for example in choices of
research area, strategy, methods, in the formulation of research question, or in the
interpretation of data (Bryman, 2016). Scientific research intention is to be objective,
however, contextual factors, such as environmental and subject variables, even by
strict precautions have influence on research results (Fellows & Liu, 2015).
Environmental variables are very important to be considered. This study has been
confronted with an influence of uncontrollable factors, such as outdoor RH and
temperature, evaporation rate of the humidifier, and generally outside weather
conditions. This fact was noticed to have an influence on results. However, as this
research intended to imitate real house conditions where uncontrollable variables are
always present, environmental variables have been welcomed as a part of real
weather influence and an imitation of uncontrollable behaviours of occupants.
2.4 Research Design
Research design is the underlying structure of the generation of evidence that leads to
answering research questions. The chosen framework for the collection and analysis of
data has to follow certain quality criteria, such as validity, reliability, and replication.
The chosen methods have to evaluate causal connections between variables (Bryman,
2016). Research methods are sometimes called research style or strategy, which is a
technique for collecting and analysing data. The main research design styles are:
survey, experiment, quasi-experiment, archival analysis, history, and case study (Yin,
2017). Runeson and Höst (2009) distinguish between theoretical and empirical studies,
and compare survey, experiment inclusive quasi-experiment, and action research with
case study. Unfortunately, definitions of research styles vary, therefore, it is not
possible to set clear boundaries between the styles (Fellows & Liu, 2015). From
27
growing computation of data and developing of computer software, a new entity
arisen in the scientific world - simulation. Modelling and simulation reside in the
intersection between theory and experiment (Morgan & Morrison, 1999).
2.4.1 Survey
Surveys are usually based on statistical sampling, as full population surveys are not
possible from practical or economic reasons. Surveys are proceeded through
questionnaires or interviews. By the survey it is crucial to choose a representative
sample to assure the validity of data. Sample size, response rate, and the number of
obtained responses should be considered regarding to the subject matter of the study
(Fellows & Liu, 2015).
2.4.2 Experiment
Experiment is: “1. A scientific procedure undertaken to make a discovery, test a
hypothesis, or demonstrate a known fact. 1.1. A course of action tentatively adopted
without being sure of the outcome” (Lexico, n.d.). What all experiments have in
common is that they vary something (cause) to discover what happens to something
else (effect). Causal relations are very often not as simple as sometimes a combination
of certain causes is required for an effect to happen. This means that many causal
relations are context dependent and we rarely know all of the factors and how they
interact (Shadish et al., 2002). Although cause and effect are a part of the everyday
life, scientists and philosophers are still not in agreement about clear semantics for
causal relationships. The Scottish philosopher David Hume (1711-1776) described
causation in a counterfactual model (Hannart et al., 2016). “Counterfactual” expresses
something contrary to fact. The logical structure of counterfactuals is the
mathematical basis of causal theory. David Hume defined causality as “Y is caused by X
if Y would not have occurred were it not for X” (Hannart et al., 2016, p. 101). The
counterfactual reasoning is based on fundamentally qualitative causal reasoning,
therefore, the counterfactual reasoning in experiments is fundamentally qualitative
(Shadish et al., 2002).
Experiments in their classical form tend to hold a strong internal validity. To prove the
external validity of the experiment there has to be a control group of data besides the
experimental group of data. According to the place where experiments proceed, a
28
distinction between laboratory and field experiments is made. As the term suggests,
the laboratory experiment is carried out in laboratory controlled settings, and the field
experiment in real-life settings (Bryman, 2016). Laboratory settings offer a possibility
to test causal relationships between variables by changing only one independent
variable and holding all the other independent variables constant. That way, influences
from other independent variables are eliminated. However, the laboratory settings,
although proving causalities between two variables, are often not reflecting the real-
life situation where multiple variables might independently change and influence the
dependent variable. Such experiments are called quasi-experiments. By quasi-
experiments the possibility to control independent and environmental variables is
constrained (Fellows & Liu, 2015).
The counterfactual framework, the econometric tradition, and the structural causal
model (symbiosis between these two models) framework constitute current
approaches to causal analysis (Pearl, 2009). The structural causal model framework
enables a combination of data from different research designs, which is essential by
analysis of big data. This way, data from multiple heterogeneous datasets, such as data
from observational and experimental studies, dissimilar populations, and sampling
selection bias can be used for one causal analysis (Bareinboim & Pearl, 2016).
Very often a correlation is used in studies to demonstrate the dependency of two
variables. However, we have to keep in mind that correlation does not prove causation
as correlation does not say which variable came first, and if there are other factors
influencing the relation of these variables. Thus identification and understanding of
different elements, which may have influence on the outcome of the experiment,
constitutes a central task in experimental research (Shadish et al., 2002).
The experimental design has two basic forms: classical experiment and quasi-
experiment. Quasi-experiments are similar to controlled experiments, as their primary
objective is explanatory, primary data quantitative, and both have fixed design. The
exception by quasi-experiment is that subjects are not randomly assigned to
treatments. Quasi-experiments conducted in an industry setting are sometimes called
case studies as they may have many characteristics in common with case studies’
research strategy (Runeson & Höst, 2009).
29
Generally, the experimental design follows certain stages. In the first stage of the
experimental design the aim of the research is determined. The aim of the experiment
may be to test a theory, hypothesis, or claim. Before the actual experiment could be
started, the researcher has to specify the objectives of the study to decree what is to
be tested. By this stage limits of the test are specified. Based on theory and literature
review, the researcher identifies variables and formulates the hypothesis. After the
theoretical preparation the decision about the experiment procedure is made,
inclusive practical thoughts about the length of the test, time, necessary equipment,
and costs involved. By conducting the experiment, all possible effort has to be put into
sustaining constant known conditions to assure the validity and consistency of results.
The monitoring of conditions and accurate collecting of data is an essential
precondition of data analysis which is the next stage of the experimental design. After
testing the hypothesis with appropriate analytical and statistical tools, the results are
discussed in relation to conditions of the experiment and to existing theory. On the
base of results and the existing knowledge researcher decides whether to accept,
reject, or suspend judgement on the hypothesis. In conclusions are incorporated
restrictions and constraints on conclusions due to objectives and limits, used
methodology and methods. During the last stage of experimental design researcher
depicts recommendations for future research (Fellows & Liu, 2015).
2.4.3 Case Study
Case study is traditionally connected to the qualitative research style. However, there
is no scientific consensus about case study definition. The reason for that is that case
study as a research style may relate to more than one epistemological view (Mitchell,
1983). Easton (2010) defines a case study as:
Case research can … be defined as a research method that involves investigating one or a small number of social entities or situations about which data are collected using multiple sources of data and developing a holistic description through an iterative research process (p. 119).
Yin (2017) describes a case study as the ethnographic, clinical, participant-observation,
or otherwise “in the field” research which method is qualitative. George and Bennett
(2005) state that the research of case study is characterized by process-tracing and
define a case as an instance of a class of events what refers to a phenomenon of
30
scientific interest. These definitions are seen by Gerring (2004) as certain kinds
(subtypes) of case studies. Although agreeing with the definition of case study as an
investigation of a phenomenon, instance, or example, Gerring (2004) proposes “… to
define the case study as an intensive study of a single unit for the purpose of
understanding a larger of (similar) units” (p. 342).
Runeson and Höst (2009) characterize case study as a flexible type of study, which is
coping with complex and dynamic real-world phenomena, has its conclusions based on
clear qualitative or quantitative chain of evidence, and is based on theory or develops
new theory. Case study is distinguished by an in-depth investigation of a system in
which boundaries may be determined in terms of time, space, or participants
(Merriam, 2002). Case study may be rather seen as a frame providing boundaries for
the study than certain research method. The case study gives direction to the research
with many kinds of insights based on a different kind of information. The case study
does not analyse causal relationships as the experiment offers, but it is possible to
include an experiment into a case study. There are no strict rules, therefore, any
method for the data gathering, such as interviews, observations, statistics etc. can be a
part of a case study (Thomas, 2015).
George and Bennett (2005) identify four advantages of case studies which make them
utilitarian especially in testing hypotheses and for developing new theory. Case studies
have the potential to achieve high levels of conceptual validity, develop new
hypotheses, exploring causal mechanism under certain conditions, and assess or
model complex causal relations. On the other hand, case studies are weak at assessing
how much the causal weight of variables is. An exception to this limitation represents
the situation when a very well controlled comparison data about only one
independent variable is available, alternatively, when very similar cases differ in only
one variable. In such situation case study may be more persuasive about an estimation
of causality. Other weakness of case studies may be seen in selection biases in the
statistical sense. However, a case study with its assessing how and whether a variable
mattered to the outcome is sometimes deliberately choosing cases on the dependent
variable (George & Bennett, 2005).
31
2.4.4 Analysis of Knowledge
Critical analysis of literature, history, and archival documents depicts a crucial
component of research in any discipline. To assess current knowledge, theory
development, and areas where further research is needed, it is vital to establish a set
of methodological principles which are relevant to the research. Literature review
enables to understand the research topic, what and how it has been researched. The
process of literature review is iterative and has two phases – a literature search and
literature review. The literature search is a systematic search that includes justifiable
vocabulary and is based on a robust scheme for the management of information. A
literature review is a critical evaluation of synthetized and analysed existing
knowledge, theories, and methods. Scholastic (traditional) review and interventionist
(systematic) review are two main types of literature review (Hart, 2018).
The scholastic literature review is about an acquisition of knowledge and an
enhancement of understanding through reading existing contemporary and previous
research, history, and archives. Other objectives of the scholastic review might be
examination and evaluation of theory to describe a phenomenon or inform research.
The interventionist literature review is often but not exclusively used in medical and
social sciences, or by different government departments. More commonly term used
for interventionist review is “systematic review” or “evidence-based practice”.
Interventionist review is usually presented in an article or research report to guide
decision making by providing evidence from primary research or evaluation. Literature
review needs to be clear, consistent, and coherent (Hart, 2018). A combination of
scholastic and interventionist review is called integrative research.
Meta-analysis is a kind of systematic review using usually statistical analysis. Meta-
analysis is a method based on a statistical combination of results from separate
studies. Alternative methods to Meta-analysis are: Mante-Haenszel method, the Peto
method, and the Random effect inverse-variance model (Higgins & Green, 2011).
These methods are mostly used in medicine studies; therefore, no further description
of these methods is part of this thesis.

32
2.4.5 Simulation and Modelling
Computer simulations are techniques for studying complex systems which are
translated into mathematical functions (Winsberg, 2003). Simulations are based on the
existing knowledge, as computer software is an expression of the theory. Therefore,
the epistemic value of the new knowledge produced by modelling is not better than
the theory from which calculation originated. However, results retrieved from the
simulation may have sources independent of the theory, as the computer program
reflects theoretical assumptions used by its creation (Humphreys, 2004; Morgan, 2002;
Winsberg, 2010). Model and its associated implementation in software are an
expression of theory, theoretical ideas, analogies, encoding, ingenuity, and necessity
(Roush, 2017).
In the last two decades, a philosophical discussion developed between scientists about
the epistemic superiority of experiment over the computer simulation. The privileged
status of experiments over simulations is usually based on the mistakenly generalized
belief that experiments generate greater external validity, and that experiments are
the only source of truly new insights (Parke, 2014).
Epistemically there is no difference in the value of simulation or experiment because
simulation may be viewed as an experiment – virtual experiment. Roush (2017) argues
that this is only truth for the use of simulation for explorative purposes, or as a tool to
support classic experiments, or for pedagogical reasons. Roush (2017) implies that
“The superiority thesis I will defend concerns simulations that aim to answer a specific,
determinate question about the actual world, a question of the sort an experiment is
often used to answer” (p. 2). In any case, modelling and simulation should never
intend to replace actual experiments in the real-world. As research tools, modelling
and simulation provide additional insights, serve to compliment experimental and
theoretical scientific methods, and inform theory.
2.4.6 Evaluation of Theory
The consideration of the relationship between theory and research is based on
reflection on what type of theory and what approach is used. Theory is a statement of
ideas about how, why, and when constructs or variables relate to each other or more
detailed, “…. a theory may be viewed as a system of constructs and variables in which
33
the constructs are related to each other by propositions and the variables are related
to each other by hypotheses” (Bacharach, 1989, p. 498). Variables mean units which
are observable and measurable. Constructs are approximated units which are not
possible to observe directly (Bacharach, 1989). Constructs have two types of meaning
– systematic and observational (Kaplan, 2017). Systemic meaning reflects the theory in
which the construct is embedded. Observational meaning refers to the notion that a
construct, in order to have an explanatory power, has to be directly or indirectly
operationalized (Torgerson, 1958). In other words, if a construct has no systemic
meaning, it is just an observation, and if a construct has no observational meaning, it is
solely a metaphysical term (Peter, 1981).
In empirical sciences, scientific statements are represented by hypotheses or systems
of theories which scientists test against experience by observation and experiment. A
hypothesis is “… a supposition or proposed explanation made on the basis of limited
evidence as a starting point for further investigation” (Lexico, n.d.). From a new idea
formulated as a hypothesis or theoretical system, conclusions are drawn in the process
of logical deduction, which have to be critically tested. The testing of a theory may be
done in four different ways. Firstly, the internal consistency of the system is tested by
a logical comparison of conclusions among one another. In the second line, the logical
form of the theory (for example: empirical, scientific, tautological) is explored. The
third way consists of the question if the theory is of scientific advance in comparison to
other theories. Fourthly, empirical applications of conclusions, which can be derived
from the theory, are tested (Popper, 2005, p. 9).
Deduction, induction, and abduction are forms of inference from the cognitive process
or forms of reasoning. The deductive approach represents a research process by which
theory guides the research. By the inductive approach, theory is the research outcome.
The abductive approach is comparable to induction. However, it may be rather
subjective and not based on statistical data (Fellows & Liu, 2015).
Deductive reasoning is used within the limits of existing theory. The process of
deduction involves specific steps: theory, hypothesis, collection of data, findings, a
hypothesis confirmed or rejected, revision of theory (Bryman, 2016). Deduction starts
with existing knowledge. Based on theory and literature, researcher formulates a
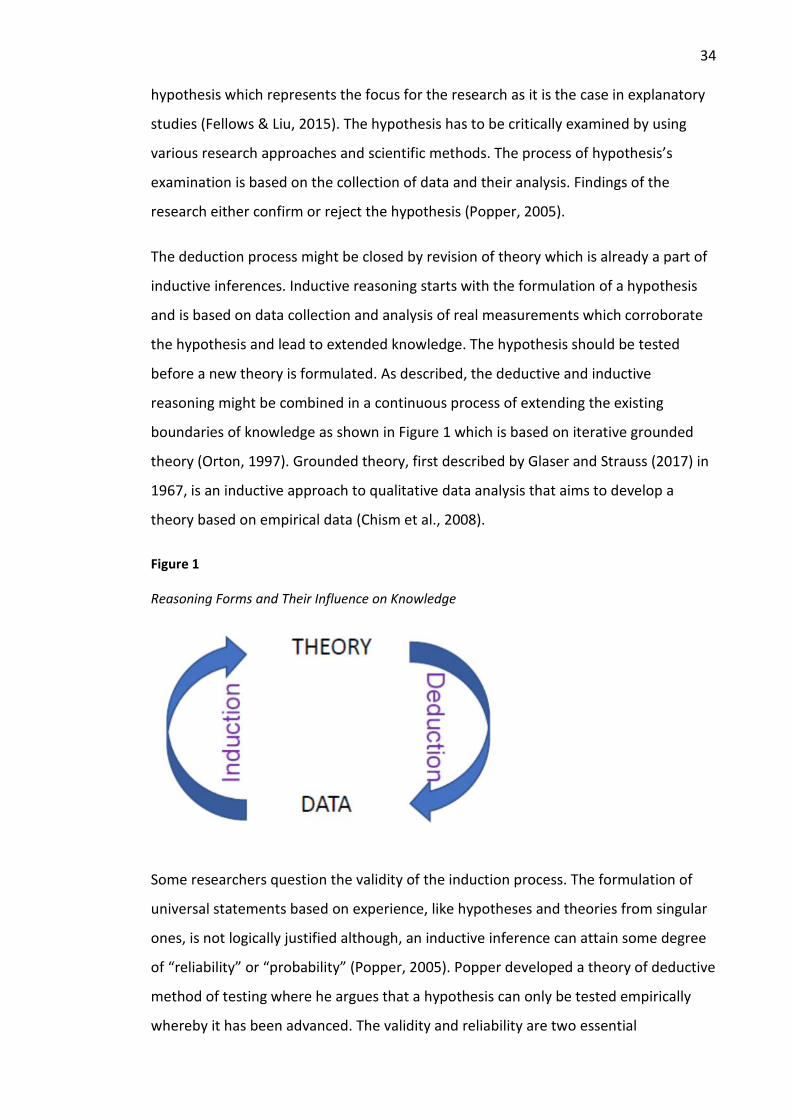
34
hypothesis which represents the focus for the research as it is the case in explanatory
studies (Fellows & Liu, 2015). The hypothesis has to be critically examined by using
various research approaches and scientific methods. The process of hypothesis’s
examination is based on the collection of data and their analysis. Findings of the
research either confirm or reject the hypothesis (Popper, 2005).
The deduction process might be closed by revision of theory which is already a part of
inductive inferences. Inductive reasoning starts with the formulation of a hypothesis
and is based on data collection and analysis of real measurements which corroborate
the hypothesis and lead to extended knowledge. The hypothesis should be tested
before a new theory is formulated. As described, the deductive and inductive
reasoning might be combined in a continuous process of extending the existing
boundaries of knowledge as shown in Figure 1 which is based on iterative grounded
theory (Orton, 1997). Grounded theory, first described by Glaser and Strauss (2017) in
1967, is an inductive approach to qualitative data analysis that aims to develop a
theory based on empirical data (Chism et al., 2008).
Figure 1
Reasoning Forms and Their Influence on Knowledge
Some researchers question the validity of the induction process. The formulation of
universal statements based on experience, like hypotheses and theories from singular
ones, is not logically justified although, an inductive inference can attain some degree
of “reliability” or “probability” (Popper, 2005). Popper developed a theory of deductive
method of testing where he argues that a hypothesis can only be tested empirically
whereby it has been advanced. The validity and reliability are two essential
35
characteristics of any research project. However, the term “validity” has no
scientifically agreed definition as validity can be exercised differently depending upon
stages of the research process and the research strategy being used (Winter, 2000).
Abductive reasoning is a creative process of discovery which has been first defined in
1903 by Peirce (1997) in Harvard lectures on pragmatism with the title “Pragmatism as
a Principle and Method of Right Thinking”. According to Peirce, abduction is the only
way which creates new knowledge. Abductive reasoning is a logical operation based on
causal hypothetical explanation of unexpected observations caused by unobserved
causes (Dowson, 2017). Abduction has become a part of the grounded theory as
“analytic induction” which is a research process using a comparative method with
theory while combining deductive and inductive inferences (Suddaby, 2006). Abductive
reasoning process has been the core for developing “systematic combining” where
empirical fieldwork in the form of case study is simultaneously confronted with theory
(Dubois & Gadde, 2002).
2.5 Methodology of the Research
Ontological position of this research is objectivism and epistemological perspective is
based on integral theory. This research reasoning is fundamentally qualitative as it is
based on causal reasoning, which is fundamentally qualitative (Shadish et al., 2002).
The main theory is based on the following reasoning: when materials used in the
building envelope have a significant influence on the hygrothermal performance of the
building, then targeted specification of these materials during the design stage of
construction has an influence on the as built hygrothermal performance. Therefore,
the design of sustainable buildings cannot be done without hygrothermal modelling. A
theoretical perspective, such as a conceptual framework for allowing interoperability
through the BIM platform guides the study.
This research uses quantitative methods for testing the hypothesis. Prior to the
decision about the research style, thoughts have been done about what design of the
study would suit the research aim the best. This research utilizes a model of research
strategy where experimental and simulation design are combined. A real-life setting
was chosen for the generation of evidence that leads to answering research questions.
The intention is to demonstrate the importance of using simulation during the
36
construction design process because there are significant differences between
materials regarding to their relation to water vapour. The in-field experiment delivers
data not only for the testing of the hypothesis but for comparison to simulation data as
well. Therefore, for the collection of data, a combination of experiment and
simulation was chosen.
The data collection for this research is done in two sequences:
1. Step: the in-field/quasi-experiment with real-life experiment collecting data
about the causal relationship between building materials and relative humidity.
2. Step: the simulation as a virtual experiment using the hygrothermal model for
simulation of the quasi-experiment.
These steps rest upon inspecting the theoretical and practical understanding for the
objective by analysing the reviewed papers and the background of building physics,
building materials, moisture buffering, mould growth, BIM, and hygrothermal
modelling.
The experiment is done in a real-life situation. Such experiments are called quasi-
experiments or in-field experiments. To critically test the hypothesis the experiment
style contains a combination of a virtual and in-field experiment. As the aim of the
study is to demonstrate that expanding BIM in terms of the hygrothermal assessment
of materials might prevent moisture related problems, the experimental method is
applied in two ways. First, for real-life measurements, in-field experiment data are
collected, second, for the satisfaction of the aim of the study, simulation data are
drawn from a virtual experiment. For data analysis, this study chooses deductive
reasoning methods, and statistical methods, such as analysis of variance and
covariance. The used methods serve to the testing of empirical applications of
conclusions which are derived from the theory, and to the evaluation of causal
connections between variables.
The chosen framework for the collection and analysis of data follows quality criteria,
such as validity and reliability. Particularly, in the initial stage of the research, which
involves data gathering, the aim constitutes a high level of descriptive and
interpretative validity with factual accuracy in the description and interpretation of
what is observed and experienced.
37
2.5.1 Reasons for Choosing In-Field Experiment Combined With Simulation
Reasons for choosing in-field experiment and simulation in this research are:
• Testing the hypothesis in real-life situation.
• Testing the hypothesis in virtual-world situation – in simulation.
• Demonstrate that even minor changes to used building materials on the indoor
side of the building have a measurable impact on hygrothermal performance of
the building.
• Provide an example to New Zealand typical constructions.
• Compare hygrothermal performance of two construction types used in New
Zealand.
• Generate new knowledge about different material scenarios.
• Use the experiment data for comparison with the hygrothermal model.
• Conduct induction reasoning about requirements for incorporation of
hygrothermal modelling into BIM based on in-field study experience.
• Through creating high quality but imperfect source of counterfactual inference
to generate a platform for understanding how this source differs from the
treatment conditions.
• To identify the scope conditions of theory and assess arguments about causal
relations in a particular case rather than generalize how much RH changes in
different scenarios.
• To provide measurements for the demonstration of results from modelling.
• By quasi-experiment the ability to control environmental variables is limited.
This corresponds to a real situation in real buildings.
• Testing the hypothesis in a real situation where the goal is to gain data for
rather a tendency than absolute data for empirical/statistical generalization.
• The limitation of ability to control independent variables has been purposely
chosen to demonstrate the influence of building materials on RH in as-built
environment.
This research design is specifically chosen to demonstrate besides the hypothesis’s
testing the theory in both, sometimes controversially seen research styles, such as
experiment and simulation. Not many researchers have an opportunity to face an
other-things-equal comparison from practical reasons, such as feasibility, budgets, and
38
boundaries (Roush, 2017). Through this combination of methods, new knowledge has
been gained.
2.5.2 In-Field Experiment Design
Research design style generally represents the underlying structure of the generation
of evidence that leads to answering research questions. This research uses experiment
and simulation design style.
Aim
The aim of the experiment is to test the hypothesis.
Objectives
In the experiment, the relations between indoor RH and different building materials
are tested. RH levels are measured by four different scenarios in two buildings. The
scope of the experiment is limited by the technical equipment and by the influence of
weather as the experiment proceeds over a time span of seven weeks. As only one
humidifier is available, it is not possible to test the same scenario in two houses
simultaneously.
Variables
RH represents the centre of the research interest. However, as the indoor RH is
influenced by temperature and outside humidity, these variables depict another vital
part of the monitoring. Diverse building materials epitomize other variables described
by their physical characteristics, such as water vapour resistance factor, permeance,
density, etc.
Hypothesis
“Materials used in the building envelope have a significant influence on the
hygrothermal performance of the building.”
Experiment Design
The research measures indoor RH, temperature, and due point by different room
scenarios in two test houses while introducing water vapour into the room to simulate
occupancy. The test houses are identical in size and cardinal direction but not identical
in construction. Measurements for each scenario are done every hour for five
consecutive days. The intervals are chosen with regards to data analysis and
39
comparison requirements to data from the simulation. The length of each test is
chosen with regards to practicability and the total time of the experiment. The
experiment design is described in detail in Chapter 4 (p. 118).
Conduct of the Experiment
During the experiment, all possible effort is made to maintain constant and known
conditions to achieve high validity and consistency of results. The mechanical
ventilation is switched off and ventilation out- and in-lets are sealed with plastic foil.
No unauthorized person has access to the testing room and test houses in general. The
data are collected and after each testing period downloaded from the EasyLog USB to
a computer.
Data Analysis
For data analysis, the research uses EasyLog, Excel, and IBM SPSS Statistics software.
The combination of these analytics tools enables the researcher to conduct a
multilevel analysis using statistics, visual methods (descriptive geometry), and
deductive reasoning.
Discussion
Discussion part of the experiment consists of a comparison of RH levels by different
scenarios in the context of existing knowledge. Some thoughts are given to the
presumable influence of experimental conditions on results.
Conclusion
Based on the results of the experiment, the analysis of data, and the discussion
conclusions are drawn.
Limitations of the Experiment
The major limitation of the experiment is that the maximum reached RH is not
applicable in any generalizations or as a ground for any decisions about the materials.
The reason for this limitation is that many factors, some of them uncontrollable, such
as weather, initial temperature, initial RH etc. have an influence on the maximal level
of RH.

40
Further Research
Based on experiences from this experiment, further testing with more sophisticated
humidifiers running in both buildings simultaneously is advisable.
2.5.3 Simulation Design
Modelling and simulation, although based on existing theory, provide additional
insights, serve to compliment experimental and theoretical scientific methods, and
inform theory.
Aim
The aim of the simulation is to test the hypothesis and provide data for comparison
with experiment data.
Objectives
In the simulation, the relation between indoor RH and different building materials is
tested. RH levels are simulated for four different scenarios in two types of
construction.
Variables
Variables for simulation are set the same as in the experiment (see p. 38).
Hypothesis
“Materials used in the building envelope have a significant influence on the
hygrothermal performance of the building.”
Simulation Design of This Research
The research uses for the simulation WUFI Plus, which is a software developed by the
Department of Hygrothermics at Fraunhofer IBP for hygrothermal modelling
(Fraunhofer Institute for Building Physics, n.d.-e). WUFI Plus is a holistic model based
on the coupled heat and moisture transfer model developed by Künzel (1994). Prior to
performing the dynamic simulation, specification of boundary conditions and
construction data inclusive room geometry, cardinal direction, construction details,
and material properties, such as water vapour resistance factor, the geographical
location of the house, etc. are required.
41
Conduct of the Simulation
During the experiment, all possible effort is made to achieve high validity and
consistency of results. The WUFI software has been validated worldwide (Antretter et
al., 2011; Marincioni et al., 2014). WUFI Plus provides a realistic simulation of
hygrothermal performance of buildings under realistic climate conditions in the
specific location as described in Chapter 5 in detail.
Data Analysis
For data analysis, the research uses WUFI Plus software. The software models the
coupled heat and moisture transfer in the building envelope. It calculates diffusion,
vapour adsorption and desorption, thermal performance, and capillary action. The
coupling of heat and mass transfer represents a strong feature of the model (Antretter
et al., 2011).
Discussion
Discussion part of the simulation compares simulated RH levels by different scenarios
among themselves and with measured results from quasi-experiment in the context of
existing knowledge. Some thoughts are given to the reasons for differences between
model and experiment results.
Conclusion
Based on the results of the simulation, analysis of data, and discussion conclusions are
drawn.
Limitations of the Simulation
The simulation software works with weather data based on supplied measurements
from Unitec. However, the data set is missing accurate measurements about diffuse
and global solar radiation giving only “solar radiation” without any distinction between
the diffuse and direct component. Therefore, the data is not fully comparable with the
experiment. However, this limitation does not interfere with the validity of simulation
data as the weather, although not identical every week, follows a specific pattern
typical for the region.
42
Further Research
Based on the experience from this simulation, further modelling of different scenarios
with different materials would be beneficial. The results of such simulation in the form
of a table of material performance would provide a supporting tool for architectural
designers and specifiers.
2.5.4 Integration of Data
Data from the experiment and the simulation are integrated into the research at two
points: data analysis and data interpretation. Reasons for collecting both forms of data
are firstly, the comparison of the data in regards to the testing of the hypothesis, and
secondly, the demonstration for the usefulness of the hygrothermal simulation for an
optimization of the hygrothermal performance of the building. This way, the
combination of two data collections serve the aim of this research: to clearly
demonstrate that broadening of BIM in terms of hygrothermal assessment of materials
applied during the early stage of design might prevent moisture related problems and
improve durability and quality of construction.
2.6 Methodology of the Literature Review
The topic of this research is an improvement to BIM with a system extension based on
the implementation of hygrothermal aspects to the decision process about building
projects. The question on how to use BIM to achieve goals, such as healthy indoor
environment, reduction of internal moisture fluctuations to minimize the negative
impact of high RH on buildings, improve comfort, and sustainability are addressed. The
subsequent step is a specification of requirements for integration of hygrothermal
simulation, systems and databanks involving a sustainability assessment in relation to
moisture into BIM.
The project started with a literature review on building physics, indoor environment,
hygrothermal modelling, mould, condensation, moisture buffering, and BIM with a
focus on the implementation of BIM into the construction process. Simultaneously, an
analysis was carried out of the most advanced experiences with BIM by institutions
and companies already working with this modelling tool. For this purpose, industry
related documentation and personal discussions with experts in the field of design,
construction and facility management have been conducted.
43
Further, information has been collected about the properties of construction materials
related to hygrothermal modelling, and about the impact of different materials on
moisture levels in buildings, ecology, health, and long-term costs. An essential part of
the research was a critical review of existing knowledge about complex sustainability
assessment including energy and hygrothermal modelling, life cycle assessment and
costing. The theoretical knowledge applied and further developed in the study led to
the demonstration of significance and feasibility of purposeful choice and placement of
building materials to design and build of healthier and sustainable houses.
2.6.1 Methodology of the Literature Review of Hygrothermal Relations in Buildings
To examine the consequences of underestimating or neglecting hygrothermal relations
in buildings, a three-step approach has been adopted.
Step 1
The first stage inspected the theoretical and practical understanding for this objective
by analysing the reviewed papers and the background of building physics. Several
questions related to building performance were asked and answers were provided by
the latest research findings and the reevaluation of some older cognizance. For
example, this study analysed the consequences of high RH for building structure,
energy demands, and humans. Finally, after conducting an in-depth review of the
hygrothermal aspects of the built environment, the unintended consequences of
climate change, decarbonization process, and airtightness were outlined.
Step 2
Next, this research inspected the potential of selected building materials for passive
regulation of RH. Firstly, the current conditions of buildings related to indoor
dampness or mould were outlined by reviewing the latest indoor environment reports
in different countries, focusing on the cause-effect relationship between indoor
parameters, health and wellbeing of occupants. From this review moisture sources and
the possibilities for the reduction of indoor RH were compared in terms of mould
prevention. The study illustrates the applications of hygroscopic materials respectively
and introduces the moisture buffering value theme. Finally, by summarizing the
44
limitations of these characteristics of materials, the study gives a future direction to
overcome the existing issues.
Step 3
The final stage discusses a proposed holistic approach to the design process that takes
cognizance of the benefits of climate specific design principles and early determination
of building materials and their purposeful placement for minimization of condensation
and permanent wetting of the walls. This study examines the values of the building
performance analyses and building hygrothermal simulation tools. Simulations
evaluate the proposed construction and building materials and support decision during
the early stages of the design process when the costs for changes in the project are the
lowest.
2.6.2 Methodology of the Literature Review of Building Information Modelling (BIM) and Hygrothermal Simulation
To analyse the status quo in Building Information Modelling (BIM) and hygrothermal
simulation for building and its possible interoperability with BIM platform, two-step
approach has been selected.
Step 1
The first stage evaluated the state of the art in BIM and in hygrothermal modelling
internationally and in New Zealand by analysing the reviewed papers and relevant
industry documentation. This study focuses on the current situation in praxis.
Step 2
The second stage is based on a discussion on the research question of interoperability
between BIM and hygrothermal relations in the proposed building.
2.6.3 Data Analysis
A comprehensive literature search based on the “title/abstract/keyword” search
method was carried out. The keywords used in the literature search included, for
example, “indoor environment“, “indoor air”, “hygrothermal modelling”, “building
energy efficiency”, “mould”, “condensation”, “sick building syndrome”, “building
information modelling”, and “moisture buffering”. A range of highly regarded journals
appeared in the search including but not limited to: Building and Environment,
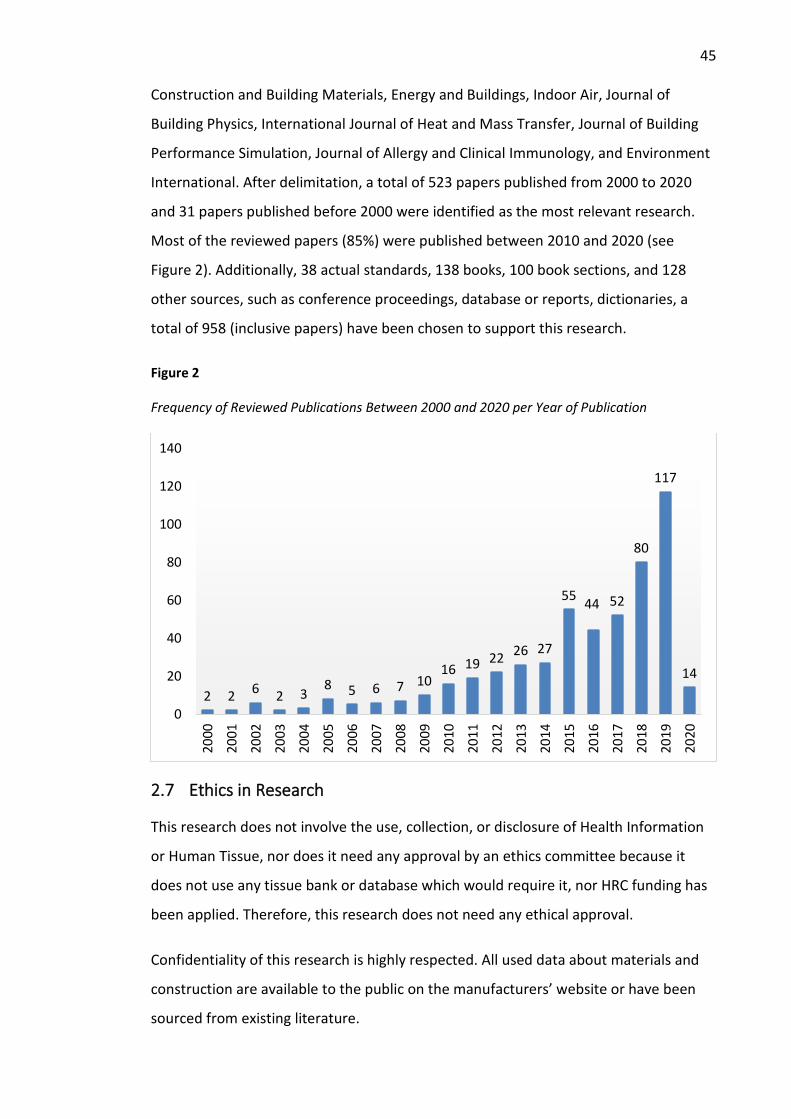
45
Construction and Building Materials, Energy and Buildings, Indoor Air, Journal of
Building Physics, International Journal of Heat and Mass Transfer, Journal of Building
Performance Simulation, Journal of Allergy and Clinical Immunology, and Environment
International. After delimitation, a total of 523 papers published from 2000 to 2020
and 31 papers published before 2000 were identified as the most relevant research.
Most of the reviewed papers (85%) were published between 2010 and 2020 (see
Figure 2). Additionally, 38 actual standards, 138 books, 100 book sections, and 128
other sources, such as conference proceedings, database or reports, dictionaries, a
total of 958 (inclusive papers) have been chosen to support this research.
Figure 2
Frequency of Reviewed Publications Between 2000 and 2020 per Year of Publication
2.7 Ethics in Research
This research does not involve the use, collection, or disclosure of Health Information
or Human Tissue, nor does it need any approval by an ethics committee because it
does not use any tissue bank or database which would require it, nor HRC funding has
been applied. Therefore, this research does not need any ethical approval.
Confidentiality of this research is highly respected. All used data about materials and
construction are available to the public on the manufacturers’ website or have been
sourced from existing literature.
2 2 6 2 38 5 6 7 10
16 19 22 26 27
55 44 52
80
117
14
0
20
40
60
80
100
120
140
2000
2001
2002
2003
2004
2005
2006
2007
2008
2009
2010
2011
2012
2013
2014
2015
2016
2017
2018
2019
2020

46
2.8 Summary
Research is a cognitive process often influenced by ontological and epistemological
beliefs. In other words, the way how the researcher perceives and understands the
material and non-material world and life in general. Consideration of philosophical
position and methodology constitutes to crucial segments of this research because it is
searching a new way to address an existing problem. This chapter focuses on the
research perspective and explains how it fits in the general picture. This research
perspective is based on integral theory and objectivism. This is conforming with the
well approved position of the research in engineering.
This chapter concentrates on providing an overview of the general approach to
research and on describing the primary research methods. After the description of
research styles and methods, the chosen design of the study, which seemed to suit the
research aim the best, is depicted. Realizing that each model should be simplified, this
research resorts to experimental design which is combined with simulation design. A
real-life setting was chosen for the generation of evidence that is expected to lead to
answering research questions. Reasoning about the choice of approach builds a vital
part of this chapter, but the researcher also finds that this case is somewhat
undescribed in the formal research classifications.
47
Chapter 3 Theoretical Framework – Literature Review
This chapter addresses the theoretical framework of the study subject. Therefore, a
comprehensive review of the existing literature is divided into four major topics. The
methodology of the literature review forms a part of Chapter 2 (section 2.6). The
literature review starts with an examination of the built environment nature. The
investigations are especially related to resources, building materials, and the impact of
the building industry on the environment. After the broader description of the
sustainability issues, the research narrows to the New Zealand (NZ) construction
industry and building physics. The first topic is followed by the review of existing
knowledge in hygrothermal relations in the built environment, particularly the
consequences of high relative humidity (RH) levels, condensation, and mould growth.
Consequently, other moisture related phenomena, such as moisture buffering and
sorption active thickness, are reviewed.
The literature review in hygrothermal analysis and modelling forms the third topic of
the theoretical framework. The study examines the history and the status quo of
indoor airflow models; heat, air, and moisture (HAM) models, and the coupling of
these tools. After a description of the models, praxis-oriented themes, such as the
influence of hygrothermal interactions and reasons for the limited use of hygrothermal
models, are explored. The building information modelling (BIM) and software
interoperability constitute the fourth topic of the literature review. After the short
description of BIM, history and praxis worldwide and in NZ, the chapter focuses on the
interoperability, particularly between BIM and hygrothermal modelling. The
conclusions drawn from the literature review delineate the existing gaps in the current
knowledge. In the summary the major points of this chapter are outlined.
3.1 The Nature of the Built Environment
Physical, economic, ecological and environmental factors stimulate the improvement
of the construction process (Bomberg et al., 2016). Looking back at the beginning of
the building industry, the original focus of interest was to enhance the stability and
durability of the structure (Bomberg & Onysko, 2002). However, the same economic
laws, as in any other branch of commercial activity, determine business-wise the
48
building industry (Kurth et al., 2019). Higher investment efficiency, building cheaper
houses in a shorter time, minimizing costs and time by maximizing the gain are the
main interests of the stakeholders (Kristensen, 2011; Nuñez-Cacho et al., 2018). In
spite of the fact that these attributes are still valid, humanity is facing new challenges.
The natural resources are limited and the ecological system of the Earth is heavily
threatened (Berthelsen et al., 2020; Rehman et al., 2020). The question, how to create
indoor comfort and damage free construction without a negative impact on the
ecology and the environment, is motivating research and encouraging changes in the
whole building industry (Hart et al., 2019).
One of the suggested ways to reduce the impact of the built environment on nature is
the circular economy (CE) concept (van Stijn & Gruis, 2019), first introduced in the
1960s in the United States as a part of the environmental protection movement (Shen
& Qi, 2012). The CE approach promotes the transformation of the production model
from traditional linear development to responsible and cyclical use of resources
(Moraga et al., 2019). Although various definitions of CE have been developed, the
applied principles remain the same. The CE principles aim to keep the materials in
circulation, remove waste from the cycle for maximum possible time, and minimize the
exploitation of primary resources (Kiser, 2016). Additionally, the CE principles might be
extended to reduce the embodied carbon in building materials (Densley Tingley et al.,
2018). However, the CE principles in the construction industry are used very sparingly,
decreasing the applications to waste management only (Adams et al., 2017).
Designing an optimized building in terms of energy efficiency, sustainability, and
comfort need comprehension of the building as a part of a complex and interchanging
ecosystem (Brauner et al., 2016). Since the 70’s oil crisis, followed by the global
warming process, the main interest of governments and research are energy savings
and low carbon buildings. Therefore, official bodies in many countries evaluate and
supervise the energy efficiency of buildings during the design stage of the construction
process (Carlton et al., 2019; Dawood et al., 2013; Thomson et al., 2013; Tonn et al.,
2018). However, simplifying the issues to insulation and airtightness only is not the
solution (Gasiorowski-Denis, 2015; Hall et al., 2013; Vereecken, Van Gelder, et al.,
2015). The praxis has shown that the as-built reality might be different from the
designed performance of the building (Bauwens & Roels, 2014; Fokaides et al., 2011;
49
Hörner & Lichtmeß, 2019). Therefore, Mitterer et al. (2012) argue that “Whether the
targeted savings potentials can be achieved in practice depends not only on the used
technology but also on degree to which the design process is integrated and on the
quality of craftsmanship” (p. 230).
Energy efficiency of residential and commercial buildings is influenced by outdoor
climate as well as by the intended use of the building. The climate, which is undergoing
significant changes, represents an essential factor in the energy demand of buildings
(Fisk, 2015; Levesque et al., 2018; Samuel et al., 2013). The necessary terms,
definitions and symbols for the assessment of the building energy performance are
provided in ISO/TR 16344:2012 (British Standards, 2012a). However, the scope of
building performance objectives became a multidisciplinary task that necessitates an
interdisciplinary approach and optimization of all the components and stages in the life
cycle of the building (Mendes & Mendes, 2019; Tweed & Zapata-Lancaster, 2018). Not
only that, the acceleration of the building performance optimization process requires a
holistic and systematic approach (Brauner et al., 2016; Gasiorowski-Denis, 2017; ISO,
2017). A relatively new way of how to enhance building performance depicts the
integrated design process. In the integrated design process, several architectural
concepts, such as a passive house, solar engineering, and integration of mechanical
services, are combined (Romanska-Zapala et al., 2018). It leads to the following
research question: What are the steps to design warmer, drier, and healthier houses
for NZ context?
The role of the built environment and its influence on ecology are largely determined
by resources and materials used during the whole building life cycle (IEA EBC, n.d.).
Therefore, the following literature review investigates resources, building materials
and their impact on the environment.
3.1.1 Resources and Building Materials
Prior to the twentieth century, most of the building materials were sourced from the
surrounding nature (Jester, 2014). However, the development of the chemical industry
brought synthetic building materials that replaced and are still replacing a significant
part of the natural matter (Zimmer & Ha, 2017). Although plastic and other
petrochemical products have many advantages, they purvey a cocktail of irritant, non-
50
biodegradable, and toxic emissions into the environment (Ding, 2019) at every life
cycle stage of the synthetic building products (Hess-Kosa, 2017).
Building materials, their sourcing, transport, and waste have an immense impact on
the ecological ramifications caused by the construction industry (Heeren & Hellweg,
2019). However, although the building stock represents a significant consumer of
resources, the existing buildings incorporate a potential for the future resource supply
(Kleemann et al., 2017). Therefore, diverse building stock models are developed, such
as bottom-up three-dimensional models and geographical information systems (GIS)
data (Heeren & Hellweg, 2019). The purpose of these databases is to determine
volumetric and spatial information of the material stocks to enable future use of
certain materials. Ostermeyer et al. (2018) developed a component-based building
inventory database to reduce both the embodied impact of the building stock and the
consumption of resources. The organization of the database distinguishes and clusters
the building stock according to building typology, year of construction, and the main
building components. For each building component, the database allows for listing the
material input and output in the form of waste for diverse refurbishment options.
Therefore, the extendable data set enables flexible refurbishment alternatives and
their holistic optimization to minimize the environmental or economic impact
(Ostermeyer et al., 2018).
However, despite any attempt to manage the building stock, the adopted materials in
the building components determine the factual reusability (Akanbi et al., 2019).
Consequently, the end of building life decisions about reusability might lead to
selective deconstruction and the incorporation of some building parts into the new
construction rather than complete demolition. Therefore, a complex analysis using the
life cycle assessment tool supports the repurposing decisions to minimize the
environmental impact (Assefa & Ambler, 2017). The end-of-life assessment of the
building helps to determine the life span of the building materials and the quality of
the recoverable materials while the building is still in use (Akanbi et al., 2019).
Alternatively, the coupling of radio frequency identification technology with BIM may
enable tracking and importing of materials to support the process of reuse and
therefore improve their efficiency (Ness et al., 2015).
51
The building performance evaluation has developed from separated characteristics,
such as thermal performance to a system approach where building materials
contribute to this system (Bomberg et al., 2017). Therefore, the quality and physical
characteristics of building materials represent another field of interest. Researchers
and building practitioners are looking for new materials to improve the thermal and
hygrothermal performance of the built environment. Most of the targeted and newly
developed materials are based on the demand principle. This means that these
materials absorb/store surplus of heat energy or moisture and discharge it when the
temperature or RH drops. With other words, when needed (Medjelekh et al., 2016;
Nore et al., 2017). Such promising materials are many traditional materials (e.g. stone,
solid bricks, concrete, timber, and fabrics) and new materials, e.g. phase change
materials (Jeon et al., 2019; Salloum et al., 2015; Wu et al., 2018; H. Zhang et al.,
2017). Consequently, researchers develop diverse thermal energy storage systems and
moisture buffering systems. These systems usually include sensible heat, latent heat,
and ventilation systems to optimize the energy use in buildings (Zeinelabdein et al.,
2018). However, despite any optimization processes used in the built environment, the
construction and buildings have an immense impact on the environment and people.
3.1.2 Impact on the Environment and People
Nowadays, it is no longer sufficient to build a robust and durable construction but
simultaneously to eliminate the negative impact on the environment (Adams et al.,
2017). Therefore, a sustainable building design focuses on three bioclimatic
perspectives, such as ecology, humans, and energy. The bioclimatic aspects allow
evaluating thermal comfort of building inhabitants and regulating the temperature by
diverse features, such as urban heat islands, roof ponds, and strategic trees and
vegetation (Nag, 2019). Generally, the success in the construction of optimized
buildings depends on the comprehension of multiple factors inclusive the climate-
responsive and climate-adequate design principles (Rempel et al., 2016). Already in
2008, Stopp and Strangfeld emphasized the complexity of the thermal improvements:
In this context it is not enough to improve the thermal insulation of outside walls, roofs and so on. We have to consider the envelope parts as an element of a reactive surface. It is necessary to prefer a climate-adequate building as opposed to building an adequate air condition. (p. 244)
52
The motivational research problem behind this statement is the recognition of the fact
that many of the modern dwellings do not perform as anticipated during the design
stage of the projects. Although written more than ten years ago, the industry is still
facing the same problems. The real energy demand of the building is often significantly
higher than calculated, indoor air quality (IAQ) is poor, and the running costs of
climate-inadequate buildings are high (Hörner & Lichtmeß, 2019; Wingfield et al.,
2011; Shui Yu et al., 2012). It leads to the following research question: How can
building sustainability be improved based on effective hygrothermal simulation?
Hence buildings are responsible for approximately one third to 40% of the world total
energy consumption and about 25% of the greenhouse gas emissions (Levesque et al.,
2018; Y. L. Li et al., 2019; Robati et al., 2019). Therefore, energy savings, low and net-
zero energy houses are the main focus of architects, designers and engineers (Ajayi et
al., 2019). The need for energy efficiency is also recognized and supported by
governments and standards, such as ISO/TR 16344:2012 (British Standards, 2012a), ISO
52000-1:2017 (ISO, 2017), and EN 16798-1:2019 (European Standard, 2019).
Consequently, with increased energy efficiency, the selection of building materials will
gain on importance (Belussi et al., 2019; Bennai et al., 2018). In spite of the fact that
the operational energy will be minimized in the future and the environmental impact
of the operational face relatively small, the buildings will still have a significant impact
on the environment (Ezema, 2019). The embodied energy and durability of materials
will more significantly impact the final sustainability measure of the built environment
(Crawford et al., 2018; Davies & Trabucco, 2018; Hammad et al., 2018). However, the
current life cycle analysis (LCA) confirms that the operational phase still represents the
major energy consumer in the life cycle of buildings (Abd Rashid & Yusoff, 2015).
Diverse building materials consist of different amount of embodied energy (Crawford
et al., 2018). Nevertheless, the decisions based on this measure might not be correct
(Densley Tingley et al., 2018). Therefore, it is crucial to use LCA for the complete
assessment of the environmental impact, as the embodied energy index might be
misleading (Kovacic & Zoller, 2015). The final environmental impact depends on many
factors and is not limited to the climate specific situation, the durability of materials,
and the construction methods (in situ or prefabricated) (Abd Rashid & Yusoff, 2015;
Utama & Gheewala, 2008). For example, Longo et al. (2020) introduce a user-friendly
53
tool ELISA to improve the estimation of the life-cycle impact of the solar air-
conditioning technologies. The ELISA depicts a design tool which might assist the early
design phase of heating and cooling systems. Therefore, it enables an energy design
optimization process (Mugnier, 2019).
The building envelope plays a crucial role in the energy performance of the house.
Therefore, minimizing the energy losses, caused by infiltration, uncontrolled vapour
transfer, and condensation are desirable (Bhandari et al., 2018; Domínguez-Amarillo et
al., 2019). To solve this problem, air, wind and vapour barriers, retarders and control
layers are used. Nevertheless, these membranes are influencing or some of them even
blocking the interaction of the building with the environment (Cho et al., 2016).
Therefore, the correct ventilation, customized on every building reveals to be vital to
enhance building performance and minimize the impact on the environment (Crawley
et al., 2019; McNeil, 2018; McNeil et al., 2015). Additionally, sustainable energy system
design enables optimization of energy supply and management. Therefore, credible
and innovative strategies, and technology, such as solar walls or passive cooling
systems might replace traditional forms of heating and cooling in buildings (Maas et
al., 2013; Saadatian et al., 2013).
In addition to the environmental pollution and energy demand of buildings (Levesque
et al., 2018; Y. L. Li et al., 2019; Lichtfouse et al., 2015), the built environment causes
fragmentation and diminution of natural habitat, and therefore, the loss of biodiversity
(Zari, 2014). However, on the other hand, the built environment might support
biodiversity and serve the human needs for connection with nature in the form of
green urban spaces (Lepczyk et al., 2017; Nilon et al., 2017). As the biodiversity offers
social, economic and environmental advantages beyond the protection of habitat, its
embodiment into the urban environment is essential to the sustainability of the built
environment and health of occupants (Hoisington et al., 2019; Opoku, 2019).
Despite the evident impact of the building sector on the environment, society, and the
economy, the industry, to make a change, requires instant measures (Mahmoud et al.,
2019; Nuñez-Cacho et al., 2018). However, there is an uncertainty about what to be
measured because the used indicators may have an influence on the conclusions
(Moraga et al., 2019). Nuñez-Cacho et al. (2018) suggest eight dimensions of indicators
54
in the construction industry: negative externalities, emissions, waste generated,
energy management, water management, materials management, the 3R principles
(reduce, recycle, and reuse), and general indicators of transition to the CE. Mahmoud
and Zayed (2017) distinguish and specify seven criteria for determination of buildings
impact on the environment. Site, transportation, energy efficiency, water use, material
and waste, indoor environmental quality, and building management.
To control and manage the undesirable impacts of buildings on the environment, many
sustainability rating and certification systems have been developed. The Building
Research Establishment’s Environmental Assessment Method (BREEAM) and
Leadership in Energy and Environmental Design (LEED) represent two examples of
internationally known sustainability rating systems (Yosun et al., 2018). Green building
councils (GBCs) have been formed in the USA, Canada, Japan, Australia, New Zealand,
and many other countries (Ade & Rehm, 2019). However, the GBCs are non-
governmental organizations, financially dependent on the private sector. They
generate income through providing of training, membership, and certification fees.
Therefore, the GBCs are not independent research institutions (Ade & Rehm, 2019;
Sedlacek & Maier, 2012). In New Zealand Green Star is considered one of the most
utilized sustainability assessment tools (GhaffarianHoseini, Doan, et al., 2017).
However, the Green Star certification uptake is facing several challenges leading to lack
of its attraction to clients and building developers (Doan et al., 2019). For the
residential sector, the Homestar rating tool was developed by New Zealand Green
Building Council (NZGBC), Building Research Association of New Zealand (BRANZ), and
Beacon Pathway (Ade & Rehm, 2019).
Generally, most of the attributes of the assessment tools are based on their local
context (Mahmoud & Zayed, 2017). Therefore, the green building industry, similarly to
other industries, might benefit from the implementation of a macro-environmental
assessment as an integral part of systematic strategic planning. For the improvement
of the decision-making process, Ulubeyli and Kazanci (2018) and Mahmoud et al.
(2019) recommend fuzzy models of the macro-environmental assessment.
Environmental health represents another aspect of the environmental assessment. “A
holistic definition of environmental health would include physical, chemical, biological,
55
social, and behavioural factors that influence the environment” (Schaffer et al., 2018,
p. 97). The broad definition of environmental health indicates that buildings have a
significant impact on environmental health. Therefore, indoor environmental quality
represents one of the most critical characteristics of buildings. Indoor environmental
quality (IEQ) is determined by IAQ, thermal conditions, illumination, and acoustics
(Lawrence et al., 2018). However, this view is limited to the physical and chemical
properties of the indoor environment. The researcher suggests that there are many
more aspects of indoor environmental quality. Aesthetics, use of colours, and a
functionality of spaces, inclusive intentional zoning should be assessed, in order to
achieve a healthy environment for human beings. Some issues connected to public
health are addressed by Gibberd (2015), who proposes two measurements of
sustainability. Beside the assessment of the environmental footprint, the impact of
buildings on sustainability is evaluated by the measure of the quality of life, using the
Human Development Index. The capability of buildings to support sustainability is
conducted by proposing a Built Environment Sustainability Tool, which combines
human development with the ecological carrying capacity. This view of environmental
health is broadened by Hoisington et al. (2019) who raises questions about the
influence of the built environment on public and particularly mental health.
After the examination of the building sector’s impact on the environment, the
researcher reviews the nature of the construction industry and buildings in New
Zealand.
3.1.3 The Construction Industry in New Zealand
This research is concerned with methods leading to improving the NZ housing quality.
The current NZ housing condition might be described as substandard (Chisholm et al.,
2019; Leardini et al., 2012). Dwelling and household estimates for the June 2019
quarter show there were 1.9 million private dwellings (homes) in New Zealand (Stats
NZ, n.d.-a). A large portion of the NZ housing stock is energy-inefficient, unhealthy,
cold, mouldy, and damp (Bennett et al., 2016; Gillespie-Bennett, 2013; X. Li et al.,
2019). About 50% of NZ residential houses are affected by mould (Plagmann, 2018).
Approximately 10% of total dwellings, constructed between 1992 and 2008 by the use

56
of monolithic cladding contributed significantly to the building failure, known as “leaky
building syndrome” (Shi et al., 2017).
The latest BRANZ 2015 House Condition Survey reveals that in 49% of surveyed houses
was visible mould and 51% of houses did not heat children’s bedrooms (White et al.,
2017). The survey emphasizes the fact that mould is a key indicator of poor indoor
environmental quality (IEQ), and is correlated to the lack of effective heating,
ventilation, and insulation. Therefore, BRANZ research provided evidence to support
the Residential Tenancies Act (RTA) changes that are expected by 2019. Consequently,
approximately 180,000 residential rentals require upgrades to the ceiling and/or
underfloor insulation (BRANZ, 2018). Although the improvements of thermal insulation
and heating to existing homes have positive impacts on the health of occupants
(Howden-Chapman & Chapman, 2012; Howden-Chapman et al., 2008), there might be
diverse “psychosocial factors” linked to affordability and household functioning effects
too (Howden-Chapman, 2015). Not deniable, but very often are ignored issues with
indoor chemical pollution and radon concentration in well-sealed and insulated
buildings (Walls et al., 2014). The solution of this issue offers a holistic approach
consisting of coupling airtightness design, high efficiency, and ventilation strategy
(British Standards, 2019a; Crawley et al., 2019; Quaglia & McNeil, 2012).
However, the situation of newly built NZ residential buildings is not much better (Cox-
Smith, 2015). The number of defects and poor quality, especially weathertightness
problems, demand attentiveness (Rotimi et al., 2015). According to the BRANZ New
House Owner’s Satisfaction Survey, call-backs by new owners reached 88% in 2014.
Alarming is the rising up of this percentage compared to 73% in the previous year
(Page, 2015). Additionally, to the quality issue of housing NZ experiences a shortage of
affordable homes. Therefore, “… the government has proposed a 10-year strategy to
build 100,000 affordable homes with the aim of providing assurances that the policy
will not contribute to a weakening of construction activity” (Political Risk Services,
2017, p. U2). However, prices of real estate in NZ are continuously rising and pushing
the inflation rate up (Susan, 2017). NZ “… average property values rose by 2.4% in the
year to September 2019” (CoreLogic, 2019, p. 18).
57
All homes in NZ, without regard to affordability, have to be built to the minimum legal
standards. However, the NZ Building Code is behind the international standards for
comparable climate (International Energy Agency, 2017; OECD, 2017). Therefore, the
costs over the whole life cycle of the houses built to the minimum legal standards are
much higher than by houses built to a higher standard (Ade & Rehm, 2019). The
economic consultancy Sense Partners assessed the New Zealand Government’s
KiwiBuild programme costs over the next 30 years. The estimated financial and social
losses from constructing the 100,000 homes to the minimum legal standards
compared to the adoption of 6-Homestar independent standard reach more than $680
million (Eaqub & de Raad, 2018). Of concern is the existing resistance of homeowners
and building practitioners to improvements and complex solutions (Chisholm et al.,
2019).
The other problem with NZ housing is resulting from demographic changes in the
population. The resident population of NZ rose since June 2012 from an estimated 4.41
million to 4.79 million in June 2017 (Stats NZ, 2017) and 4.93 million in December 2018
(Stats NZ, n.d.-b). Simultaneously, like many other countries, the NZ population is
ageing and NZ is experiencing a significant change in the structure of its population
(Statistics New Zealand, 2013). From these population changes unfold increasing
demands on housing and communal dwellings. To suit these demands, Yavari et al.
(2018) suggest alternative design options inclusive a conversion of existing dwellings
based on a life cycle energy analysis.
The environmental impact of the building sector in NZ is gaining importance. A
significant number of commercial dwellings demand high energy to operate (Ghose,
McLaren, et al., 2017). However, before deciding about office buildings refurbishment,
different potential policies concerning not only operational energy but resource
management are recommended (Ghose, Pizzol, et al., 2017). Therefore, increasing
renewable energy supply, better construction practices, and building-specific
properties (location, size, construction material, etc.) are important to reduce the
environmental impact of existing buildings in NZ (Ghose et al., 2019).
As briefly described above, the building system legislative in NZ requires a reform
(Leardini et al., 2012). NZ government finally released a discussion paper on proposed

58
changes to the building regulatory system inclusive an improvement to the Building
Act. The proposal addresses building products information and certification,
environmental impacts of the products, and building performance (New Zealand
Government, 2019d). However, the adoption of innovation in the construction
industry worldwide is knowingly very slow. The NZ construction industry, with its
complexities, seems to be resistant again advancements (Hunt & Gonzalez, 2018). The
building construction industry has difficulty in managing costs arising from
uncertainties and is resisting to new technology for buffer management (Poshdar et
al., 2018). Approval process delays for new and “not used before” products or
systems, and building compliance requirements cost time and money. The fact is that
“The building industry is based around selling and installing products not solutions with
measurable performance benefits” (New Zealand Business Council for Sustainable
Development, 2003, p. 6). Therefore, in this highly competitive environment, it is often
easier to build the “usual” way rather than aim improvements and innovations.
The researcher finds that the building consent process in NZ significantly influences the
innovations. In spite of the fact that Duncan (2005) critiqued the performance-based
building code (adopted in NZ 1992) more than one and a half decade ago, the lessons
are still valid. The researcher’s personal experience is that local authorities still largely
demand the “Acceptable Solutions” to be followed. This practice hinders innovations.
The NZ government is aware of this problem for a long time: “We’re focused on
meeting improved minimum standards rather than enabling people to get ahead of
them” (New Zealand Business Council for Sustainable Development, 2003, p. 7). Many
of the descriptors of the performance requirements of the NZ Building Code are
provided in a non-quantifiable manner, in words or terms, such as “reasonable”,
“adequate”, or “acceptable” (New Zealand Legislation, 2017). Additionally, the non-
existence of mandatory means of demonstrating compliance and incomplete building
performance measures (Meacham, 2016) might lead to unintended consequences.
Structural failures due to moisture-related issues of enclosed structural systems
(Mumford, 2011; Shi et al., 2017), mould growth due to weather-tight buildings
(Mudarri, 2010), or health and fire hazards due to thermal insulating materials
(Babrauskas et al., 2012) represent some examples of these unintentional
consequences.
59
Sustainability continues to gain interest in NZ (New Zealand Government, 2019d). For
more than 15 years, the NZ government has continued effort towards sustainability in
the form of waste management (New Zealand Government, 2007, n.d.). To reduce
plastic waste and improve resource efficiency, the government has recently proposed
a program for the transition to a circular economy (New Zealand Government, 2019a).
This includes initiatives, such as the NZ Plastic Packaging Declaration signed in June
2018. Here, committed business groups who declared to use 100 per cent reusable,
recyclable, or compostable packaging by 2025 (New Zealand Government, n.d.).
To improve housing quality, Stats NZ released a document defining four elements of
housing quality, such as housing habitability, environmental sustainability, housing
functionality, and social and cultural sustainability (Stats NZ, 2019). Housing
habitability relates to physical qualities of housing design, materials, construction, and
services. Environmental sustainability addresses housing interaction with an impact on
the natural environment, and it focuses on the resource efficiency, durability, and
resilience of housing. Housing functionality describes the degree to which housing
supports the specific physical, mental, emotional, cultural, and social needs of
individuals, families, and whānau in their kāinga and communities (Stats NZ, 2019).
However, NZ has no guidelines or recommended maximum levels of VOCs for IAQ
(Berry et al., 2017). Although the high levels of indoor pollutants have been recognized
(Taptiklis & Phipps, 2017), the only regulations are the National Environmental
Standards for Air Quality (NESAQ). The NESAQ are made under the Resource
Management Act 1991, which set a maximum level for some outdoor air pollutants
(New Zealand Government, 2017). The only existing guidelines in NZ for ambient air
(Ministry for the Environment, 2002) are more than 17 years old. The researcher notes
that these guidelines ignore IAQ and indoor sources of pollution. Generally,
information on indoor air quality in New Zealand is limited, which is alarming because
people spend typically about 80 to 90% of the time inside (Ministry for the
Environment & Stats NZ, 2018).
To examine the scientific background leading to possible improvements in NZ housing
quality, the following section reviews the knowledge of building physics/building
science.

60
3.1.4 Building Physics
Building physics is concerned with diverse phenomena, such as sick buildings, the
energy crisis and sustainability, and considers the performance of buildings in terms of
climatic loads and indoor thermal and hygrothermal conditions (Bomberg, Kisilewicz,
et al., 2015). Hens (2017) defines building physics:
As an applied science, building physics studies the hygrothermal, acoustic and visual performance of materials, building assemblies, spaces, whole buildings and, be it under the name urban physics, the built environment. The constraints faced are the user demands related to overall comfort, health and safety, together with architectural facts and figures, durability issues, economic restrictions and sustainability-related requirements. (p. 1)
Building physics/science developed as a branch of building engineering in Russia,
Germany, and Sweden during the twentieth century (Bomberg, 2012). “Building
physics surged at the crossroads of several disciplines: applied physics, comfort and
health, building services, building design and construction” (Hens, 2017, p. 5). The
engineering knowledge merged with architectural science from the UK and Australia
and formed an academic discipline in Central and Northern Europe in the 1970s.
However, in North America, very little or no building physics have been included in
universities’ curriculum (Bomberg, 2012). A similar situation has occurred in New
Zealand (Rosemeier, 2010). Generally, the discipline of building physics in the English-
speaking countries is poorly taught to architectural students or more often it is not
taught at all (Bomberg, Kisilewicz, et al., 2015). The Victoria University of Wellington
has recently renewed the building science subjects, such as Project Management and
Sustainable Engineering Systems (Victoria University of Wellington, n.d.). However, to
the opinion of the researcher, it is questionable what the discipline of project
management has in common with building physics/science? Project managers are
usually appointed during the construction phase of the building process. Therefore,
they have little or no influence on the design and specification of the buildings.
Additionally, the separate subjects do not guarantee the level of knowledge taught to
the architectural designers. Therefore, until the building science/physics will be taught
to each and every architectural designer in NZ we still will face serious problems in NZ
house performance.

61
Building physics is developing sustainability solutions, as the pressure on saving energy
and raw materials is growing (Padfield et al., 2018; Romanska-Zapala et al., 2019). The
praxis of the past 30 years has shown that the intense improvements in thermal
insulation, air- and vapour-tightness of buildings might bring dramatic consequences
(Winkler et al., 2018). For example, mould and microbiological growth on the surfaces
or inside of walls and air conditioning systems (Bomberg, Gibson, et al., 2015;
Boudreaux et al., 2018; Cho et al., 2016; Crawley et al., 2019; Straube, 2002). Building
physics, architectural studies, and practical experience advocate that an improvement
to the built environment is not possible by a one-sided solution, such as increasing the
thermal insulation only (Smith, 2017; Tweed & Zapata-Lancaster, 2018; Vereecken,
Van Gelder, et al., 2015). Consequently, without simultaneous consideration of energy
efficiency, quality of the indoor environment, and moisture management, the
achievement of sustainability is hardly feasible (Yarbrough et al., 2019). Therefore, a
new approach to building envelope design, called the Environmental Quality
Management is proposed by Yarbrough et al. (2019). The described factors in achieving
sustainability lead to another research question: Considering building physics, what are
the major differences in the design process, including hygrothermal simulation
compared to the traditional design process?
Energy savings are crucial for reducing or slowing down the process of global warming
of the Earth (Zakula et al., 2019). One of the current tasks of the construction industry
is to build houses which do not have a negative impact on the health of their
inhabitants and the environment (ASHRAE, 2017b). In the area of building physics,
hygrothermal models are widely used to simulate and prevent building pathologies
originated by moisture (Delgado et al., 2013). The design and construction process of
energy-efficient and comfortable houses should respect building physics (Hens, 2016;
Mitterer et al., 2012), and sustainability factors (Gervásio et al., 2014; Suzer, 2015).
However, despite new technology and simulation software, a significant uncertainty
factor in the prevention of moisture-related problems remains (Hens, 2015; Künzel,
2014). Therefore, a new holistic approach to the construction process is needed
(Bomberg et al., 2016). This approach is based on the conceptual design of the whole
system as a set of design principles, rather than a description of a specific construction
62
technology (Romanska-Zapala et al., 2019). In this context, Bomberg et al. (2017)
write:
Yet, the building physics is changing. It merges with building science in the quest of predicting building performance, it merges concepts of passive houses with solar engineering and integrates building shell with mechanical services, but is still missing an overall vision. Physics does not tell us how to integrate people with their environment. (p. 193)
Therefore, the contribution of building physics to the sustainable built environment
should be based on harmony between diverse aspects of the environment, society,
and economy. Consequently, the building design should be re-directed towards
people. The indoor environment, its quality, thermal and hygrothermal relations depict
the crucial characteristics of people-oriented, sustainable design (Yarbrough et al.,
2019).
3.2 Hygrothermal Relations in Built Environment
Research has shown that heat movement correlates to moisture (Bomberg & Onysko,
2002; Hens, 2017). The heat and moisture transport for porous materials was first
described by Philip and De Vries (1957) and Luikov (1964). Subsequently, Künzel (1994)
applied this physical phenomenon to building components using one- and two-
dimensional calculations (Künzel, 1995). However, water as the most important
substance in existence has a vast variation of properties. Therefore, “… a continuous
description of the thermodynamic properties of water over the entire thermodynamic
surface can only be achieved with a suitable equation of state that is able to represent
all the data considered to be reliable to within their experimental uncertainty”
(Wagner & Pruß, 2002, p. 395). The IAPWS-95 formulation explicit in Helmholtz free
energy, developed by Wagner and Pruß (2002), is the best equation of state of fluid
water proposed until now (Mao et al., 2011). The International Association for the
Properties of Water and Steam (IAPWS) is responsible for the international standards
for several thermophysical properties. From the IAPWS-95 formulation, all
thermodynamic properties, inclusive the saturated properties of water can be derived
for general and scientific use (Mao et al., 2011).
The term “hygrothermal” is used as of, or pertaining to both humidity and
temperature in the field of transmission of mass (especially moisture or air) by various
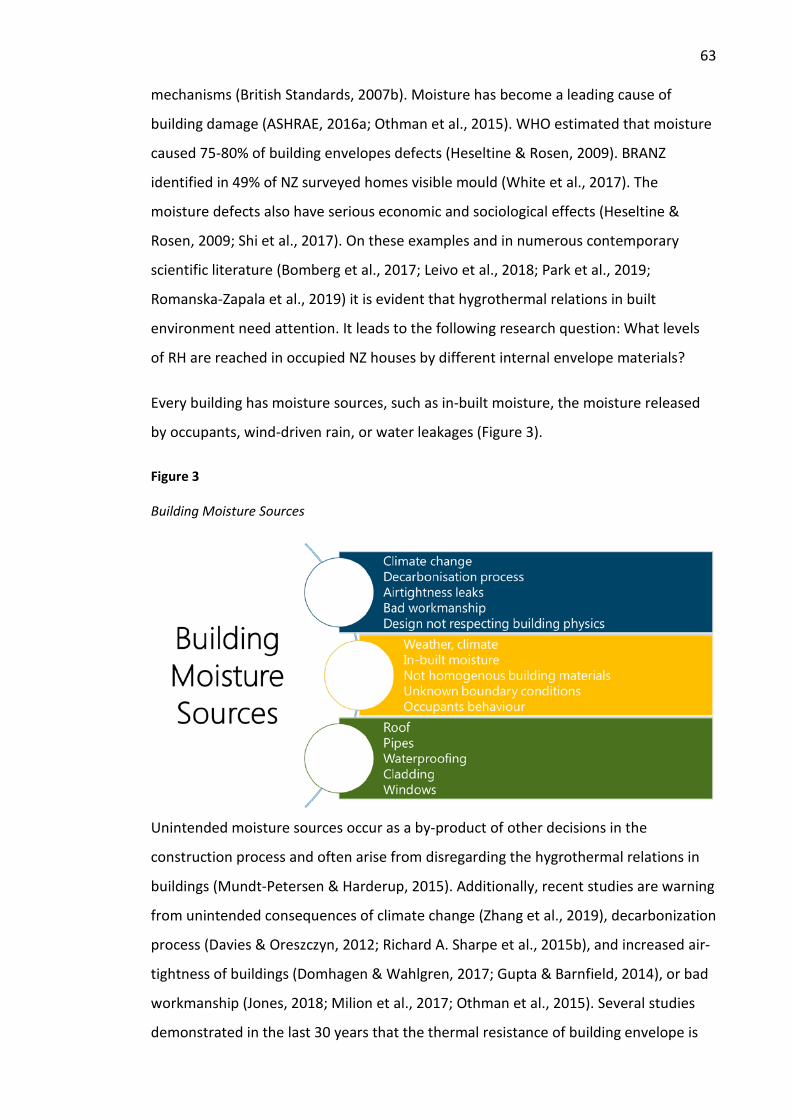
63
mechanisms (British Standards, 2007b). Moisture has become a leading cause of
building damage (ASHRAE, 2016a; Othman et al., 2015). WHO estimated that moisture
caused 75-80% of building envelopes defects (Heseltine & Rosen, 2009). BRANZ
identified in 49% of NZ surveyed homes visible mould (White et al., 2017). The
moisture defects also have serious economic and sociological effects (Heseltine &
Rosen, 2009; Shi et al., 2017). On these examples and in numerous contemporary
scientific literature (Bomberg et al., 2017; Leivo et al., 2018; Park et al., 2019;
Romanska-Zapala et al., 2019) it is evident that hygrothermal relations in built
environment need attention. It leads to the following research question: What levels
of RH are reached in occupied NZ houses by different internal envelope materials?
Every building has moisture sources, such as in-built moisture, the moisture released
by occupants, wind-driven rain, or water leakages (Figure 3).
Figure 3
Building Moisture Sources
Unintended moisture sources occur as a by-product of other decisions in the
construction process and often arise from disregarding the hygrothermal relations in
buildings (Mundt-Petersen & Harderup, 2015). Additionally, recent studies are warning
from unintended consequences of climate change (Zhang et al., 2019), decarbonization
process (Davies & Oreszczyn, 2012; Richard A. Sharpe et al., 2015b), and increased air-
tightness of buildings (Domhagen & Wahlgren, 2017; Gupta & Barnfield, 2014), or bad
workmanship (Jones, 2018; Milion et al., 2017; Othman et al., 2015). Several studies
demonstrated in the last 30 years that the thermal resistance of building envelope is
64
significantly reduced by defective or partial installation of insulation products
(Antretter, Pazold, et al., 2013; Brown et al., 1993; Cho et al., 2016; Silberstein & Hens,
1996). The fact that approximately one third of the energy used for residential heating
and cooling is lost due to the unintentional air leakage (Spengler, 2012) is not only the
energy performance issue (Belleudy et al., 2015). Air leakages influence the ventilation
performance and the quality of the indoor air (Guyot et al., 2019). Consequently, air
movement through the building envelope brings moisture into the construction (Hens,
2017). This phenomenon is unintended and often ignored or unknown (Bomberg &
Onysko, 2002; Hens, 2015). Therefore, a consensus about the definition of the best
practice for different construction types would allow using hygrothermal simulation for
building forensics. Such practice may help to determine whether the designer or the
builder is responsible for failures (Künzel, 2014).
Unavoidable moisture sources exist due to external factors, such as weather, non-
homogenous building materials, unknown or variable contact and boundary settings.
The geometry of building envelopes, inclusive gaps, cracks, voids etc. remains
unidentified (Hens, 2012). “Although the theory looks well established and the
computer software, actually available, quite complete, still it does not always help
explaining and curing the damage cases, encountered in practice” (Hens, 2015, p. 138).
In-built moisture as a result of the construction processes, such as concrete or
plastering, is unavoidable. However, wetting of timber members during construction
should be avoided and moisture-trapping details already prevented in the design
(Schmidt & Riggio, 2019). Outdoor climatic conditions and uncontrolled occupant
behaviours count to the unavoidable and hardly predictable moisture sources (Bagge
et al., 2014; Labat et al., 2015). However, the occupant behaviours might be changed
or adjusted by relevant information and users’ education (Optis et al., 2012).
Nevertheless, the determination of occupant behaviours is essential to achieve
accurate energy building simulation results (De Simone et al., 2018).
The humidity levels in the indoor air affect occupant comfort, health, indoor
environmental quality (Derby et al., 2017), and durability of the building construction
(Bomberg, Gibson, et al., 2015). Thermal comfort is a condition of mind resulting from
satisfaction with the thermal environment (Bano & Tahseen, 2017; Rahmillah et al.,
2017). Comfort depends on multiple factors that are based on the subjective

65
perception of the thermal environment, clothing insulation, humidity, air movement
(ASHRAE, 2017b), outdoor climatic conditions, and buildings orientation (Asif et al.,
2018). The BS 5250:2011+A1:2016 standard sets the human comfort conditions in the
range from 45% RH to 60% RH at 18 °C to 24 °C (British Standards, 2016). The EN
16798-1:2019 standard sets the levels for medium indoor environmental quality at
25% RH for humidification and 60% RH for dehumidification. The temperature limits
for heating between 20 °C and 25 °C and for cooling between 23 °C and 26 °C
(European Standard, 2019).
However, the maintaining of thermal comfort for building occupants with HVAC is
energy consuming (Schiavon et al., 2014). Therefore, the adaptive thermal comfort
theory proposes to set the indoor temperature in relation to the outside temperature.
Consequently, the neutral temperatures proposed by the hybrid or mixed mode model
might be lower than by the ASHRAE 55 model (ASHRAE, 2017b) and the EN 16798-1
(European Standard, 2019) for the natural ventilation buildings (Barbadilla-Martín et
al., 2017). Therefore, from the indoor temperatures adjusted to the outdoor climate
and humidity levels derives the potential for energy savings by natural ventilation
mode (S. Kumar et al., 2016; Rupp et al., 2018). Another opportunity for energy savings
represents the correct dimensioning of HVAC installations. An in-situ determination of
the room hygric inertia as proposed by Vereecken et al. (2011) allows for evaluation of
ventilation rate by using the effective moisture penetration depth and effective
capacitance models. These models are further addressed in section 3.3.
Statistics and research show that the energy performance based on in-situ
measurements, such as coheating test (Alzetto et al., 2018; Bauwens & Roels, 2014;
Johnston et al., 2013), of newly erected dwellings may differ from the predicted energy
efficiency (Latif, Lawrence, et al., 2016). This phenomenon, known as the energy
performance gap, reveals that the real savings of energy demand of buildings are often
not achieving the aimed values (Farmer et al., 2016; Roels, 2017). Building energy
performance gap, according to recent studies, might reach twice to five times higher
energy consumption than predicted during the design stage (Zou et al., 2019).
However, the achieving of targeted thermal performance depends not only on the
used materials and technology but also on the design process integration and the
quality of craftsmanship (Mitterer et al., 2012). Unless taking into account the
66
problematics of moisture-related issues, improvements in the real energy performance
of new or refurbished buildings might be accompanied by serious unintended
problems in the future (Romanska-Zapala et al., 2019). This fact was already
emphasized by McLeod and Hopfe (2013) with the suggestion for widespread building
physics training schemes for building professionals in the UK. Consequently, the
researcher suggests that this extension of knowledge would be beneficial for
architectural designers in any and every country without exception.
Hygrothermal relations in the built environment, as described above, play an
important role in building performance. Therefore, the next section deals with the high
RH and its consequences.
3.2.1 High Relative Humidity and its Consequences
The interconnectedness of heat and mass explains why every change in the building
envelope influences simultaneously both — energy and moisture. Therefore,
improving the thermal performance of the building envelope and airtightness of the
building has changed the moisture movement as well (Bomberg, Kisilewicz, et al.,
2015). To manage moisture in buildings BS 5250:2011+A1:2016 informs: “Excess
moisture in a building can lead to condensation and mould growth which represent
risks to the structural integrity of the building and the health of its occupants” (British
Standards, 2016, p. 13).
Based on studies from the 1960s and 1970s, Bomberg and Onysko (2002) show that
indoor RH is influenced by changes in the efficiency of natural ventilation and the
position of the neutral pressure plane. Additionally, moisture from the construction
phase (inbuilt moisture) and the rate at which occupants generate humidity have a
major influence on the indoor RH level (Winkler et al., 2018). Missing airtightness
membrane or air leakages impact indoor comfort, energy consumption (Domínguez-
Amarillo et al., 2019), and humidity levels inside the construction (Hurel et al., 2016).
However, as shown in Finish study, airtightness levels do not influence the average
values of moisture excess in the indoor environment (Vinha et al., 2018). Nevertheless,
even relative minor air leakages through construction elements have a substantial
impact on humidity levels within the building envelope (Belleudy et al., 2015; Kölsch et
al., 2016). Consequently, when moisture levels exceed the tolerance of structure for

67
extended time period biodeterioration in the form of mould, fungi, decay, or insect
damage may occur (Plagmann, 2018; H. Viitanen et al., 2010; Hannu Viitanen et al.,
2010). It leads to the following research question: How do RH levels differ in NZ houses
based on the presence/absence of airtightness membranes?
Morris and Langari (2016) define RH as follows:
Relative humidity is the ratio of the actual water vapor density in air to the saturation vapor density, usually expressed as a percentage. The saturation vapor density varies with temperature, and so the relative humidity also varies with temperature for any given measured value of actual vapor density. (p. 659)
RH inside of buildings has occupant, structural, and energy aspects. Before addressing
those aspects, it is important to mention that the absolute water content per volume
air by constant RH and barometric pressure is dependent on the given temperature
(Parish & Putnam, 1977). The absolute mass of water vapour (𝑚𝑚𝑤𝑤) in the air could be
calculated as shown in formula ( 1 ) based on Dengler (1997).
( 1 )
𝑚𝑚𝑤𝑤 =𝑀𝑀 · 𝑝𝑝𝑝𝑝𝑅𝑅 · 𝑇𝑇
Where 𝑝𝑝𝑝𝑝 represents the actual partial vapour pressure (Pa) and T - thermodynamic
temperature (K). M - molecular weight of water (H2O) has been calculated from the
sum of the atomic masses of its constituent atoms and has a value of 18.015 g mol−1
(Haynes, 2015). R represents the molar gas constant ( 8.3144598 J mol-1 K-1 ) (The
National Institute of Standards and Technology, 2019). Therefore, the absolute mass of
water vapour calculation formula might be written as follows:
( 2 )
𝑚𝑚𝑤𝑤 = 18.015·𝑝𝑝𝑝𝑝8.3144598·𝑇𝑇
Results of the calculation demonstrate that with higher temperature by the same RH
more water is contained in the air (Figure 4). The actual water content in the air is
dependent on the moisture release, ventilation, dehumidification, and moisture
storage/release in/from building materials (TenWolde & Walker, 2001).
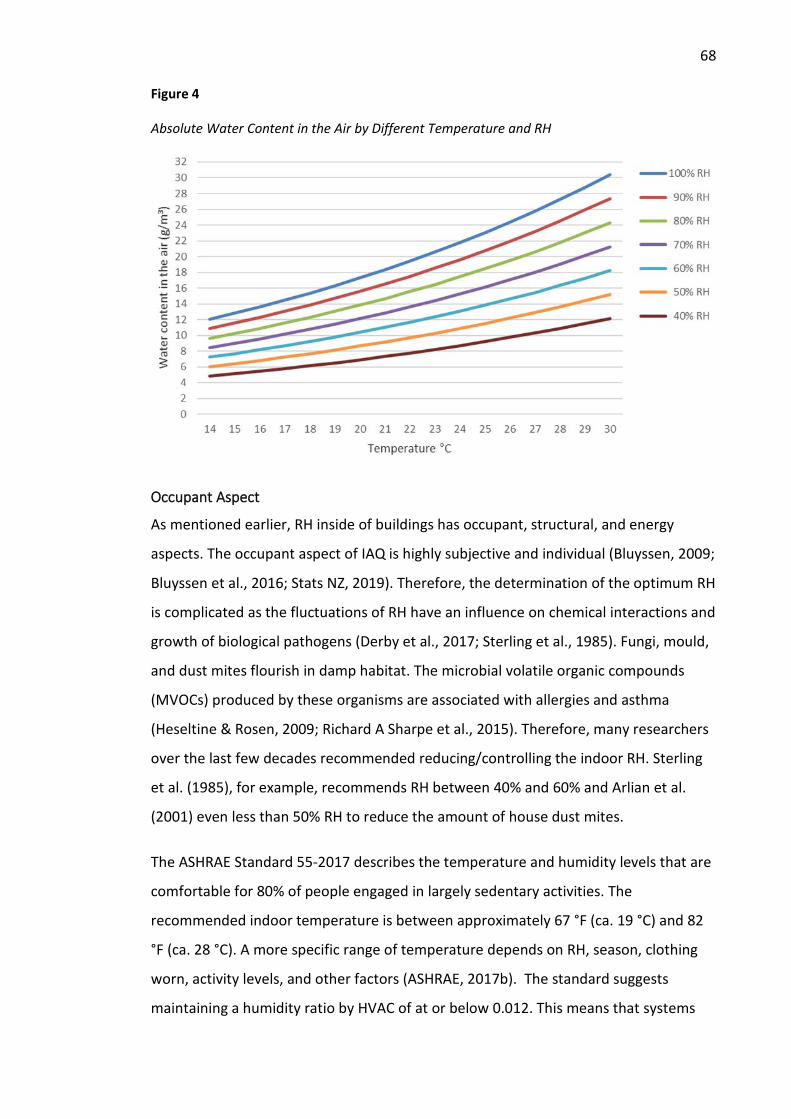
68
Figure 4
Absolute Water Content in the Air by Different Temperature and RH
Occupant Aspect
As mentioned earlier, RH inside of buildings has occupant, structural, and energy
aspects. The occupant aspect of IAQ is highly subjective and individual (Bluyssen, 2009;
Bluyssen et al., 2016; Stats NZ, 2019). Therefore, the determination of the optimum RH
is complicated as the fluctuations of RH have an influence on chemical interactions and
growth of biological pathogens (Derby et al., 2017; Sterling et al., 1985). Fungi, mould,
and dust mites flourish in damp habitat. The microbial volatile organic compounds
(MVOCs) produced by these organisms are associated with allergies and asthma
(Heseltine & Rosen, 2009; Richard A Sharpe et al., 2015). Therefore, many researchers
over the last few decades recommended reducing/controlling the indoor RH. Sterling
et al. (1985), for example, recommends RH between 40% and 60% and Arlian et al.
(2001) even less than 50% RH to reduce the amount of house dust mites.
The ASHRAE Standard 55-2017 describes the temperature and humidity levels that are
comfortable for 80% of people engaged in largely sedentary activities. The
recommended indoor temperature is between approximately 67 °F (ca. 19 °C) and 82
°F (ca. 28 °C). A more specific range of temperature depends on RH, season, clothing
worn, activity levels, and other factors (ASHRAE, 2017b). The standard suggests
maintaining a humidity ratio by HVAC of at or below 0.012. This means that systems

69
designed to control humidity must be able to maintain a dew point temperature of
16.8 °C (62.24 °F). The humidity ratio or moisture ratio determines the mass of water
vapour per unit mass of the dry air (Hens, 2017). Therefore, the humidity ratio 0.012
corresponds to the maximal humidity level about 83% RH by recommended 19.44 °C
and about 52% RH by 27.78 °C. Although the standard does not specify a minimal
humidity limit, it provides information about the possible impact of low humidity on
the inhabitants. Very low humidity environments might cause factors, such as skin
drying, irritation of mucus membranes, dry eyes, and static electricity (Derby & Pasch,
2017; Wolkoff, 2018b).
However, low RH usually does not have a negative impact on the building rather than
directly affects IAQ (Angelon-Gaetz et al., 2015; Wolkoff & Kjærgaard, 2007).
Nevertheless, by extremely low RH (under 30%) timber, paper, and textiles might
shrink and crack (Hens, 2016). Temperature and humidity have an influence on the
perception of IAQ and the chemical and volatile organic compounds (VOCs) emissions
of building materials (Sarigiannis et al., 2011; Simonson et al., 2002; Sterling et al.,
1985; Wolkoff, 2018a). Consequently, airtightness and therefore, the level of
infiltration influence temperature, humidity, and VOCs levels (Berry et al., 2017;
Poppendieck et al., 2015). Additionally, some evidence suggests that the perceived air
quality decreases with higher temperature and humidity, regardless of the actual air
quality (Fang et al., 1998; J. Liu et al., 2019; Wolkoff & Kjærgaard, 2007). High RH and
dampness are often associated with health problems and sick building syndrome
(Hahm et al., 2014; Molina et al., 1989; Sahlberg et al., 2013; Saijo et al., 2011),
especially with recent energy efficiency improvements (Howden-Chapman, 2015;
Richard A. Sharpe et al., 2015b; Sutcliffe et al., 2015; Švajlenka et al., 2017). Howden-
Chapman, Benett, Chisholm, and others describe the users’ experiences of the indoor
environment in New Zealand (Bennett et al., 2016; Chapman et al., 2016; Chisholm et
al., 2019; Howden-Chapman, 2004; Howden-Chapman et al., 2008).
Structural Aspect
Especially during the last two decades, researchers and official bodies gained interest
in the structural aspect of high RH (Champiré et al., 2016; Mijakowski & Sowa, 2017;
Strangfeld & Kruschwitz, 2018). High RH and dampness cause moisture-related issues,
such as mould growth, condensation, deterioration of building materials, and frost
70
damage (Feng et al., 2019; Harriman, 2012). Dampness is associated with the risk of rot
in timber and other organic matter, therefore, causing decomposition of materials
(Riggio et al., 2015). ASHRAE standards 62.1 and 62.2 recommend maintaining average
RH for mechanical systems with dehumidification capability in occupied spaces below
65% to reduce the likelihood of microbial growth (ASHRAE, 2019a, 2019b).
However, for simple mechanical system types or spaces without any mechanical
systems, ASHRAE standard 62.1 has no humidity limitations. The mould growth criteria
are set in the ASHRAE standard 160. The new standard 160 (ASHRAE, 2016a)
incorporates several changes focused on simplifying the conditions necessary to
minimize mould growth. A new feature of the standard is the mould index (MI) that
predicts the risk of mould growth. The mould index accounts for the type of material,
the surface temperature, and the surface RH (Glass et al., 2017). The standard
recommends limiting indoor RH to 70% or less in the design analysis and revising the
residential design moisture generation rates. Additionally, the calculation procedure
for wind-driven rain is simplified without significantly impacting the accuracy of results
(ASHRAE, 2016a).
Energy Aspect
The energy aspect of high RH represents the energy needed for dehumidification,
heating, cooling, and ventilation (Logue et al., 2016). Until now, there are only a few
studies of coupling HVAC to RH level (Krus et al., 2011; Winkler et al., 2018). Apart
from the ventilation adjustments, the energy needed for the regulation of air humidity
could be reduced by using moisture buffering property of building materials (Winkler
et al., 2014). This potential direct energy savings combined with well-controlled
ventilation systems are relevant for reducing the total building energy demand
(Osanyintola & Simonson, 2006; Romanska-Zapala et al., 2018). However, this positive
effect of demand-controlled ventilation, combining a RH sensitive ventilation system
with indoor hygroscopic materials, may bring some disadvantages. For example,
indoor pollutants, such as CO2 levels may exceed recommended limits (Woloszyn et al.,
2009). Lower fluctuations of indoor RH would allow for indirect energy savings, such as
reducing outdoor ventilation, reducing the indoor temperature in winter, and
increasing the indoor temperature in summer (Asif et al., 2018; P. Kumar et al., 2016).
The adjustment of temperature to outdoor conditions and indoor RH is in accordance

71
with the theory of heat index, where the perception of dry bulb temperature is
dependent on the level of RH (ASHRAE, 2017b; Steadman, 1979). However, recent
improvements in energy efficiency and thermal comfort seem to overlook the IAQ
issues (Fisk, 2015; Markopoulos et al., 2013). The issues reviewed in this section lead
to the following research question: What are the most significant impacts of high
humidity on NZ housing?
Ways of Controlling Indoor Relative Humidity
Unfavourable indoor climate conditions with high RH have a negative impact on
human health, may lead to degradation of building parts, mould growth, or damage to
artefacts (Davies & Oreszczyn, 2012; Plagmann, 2018; Todorović et al., 2015). It is
important to mention that the indoor moisture level should not exceed for longer time
periods the critical limit for risk of damage (ASHRAE, 2016a). Thus, for the protection
against failures caused by high moisture, maintaining the correct relations between
moistening and drying are essential (Delgado, 2014; Zirkelbach, 2013). Especially for
timber constructions and bio-based building materials, as long as the construction can
dry out, the risk of damage is minimized (Colinart & Glouannec, 2014; Delgado, 2014;
Verbist et al., 2019). However, extreme wetting of the construction influences the
structural timber stiffness and dissipation capacity (Poletti et al., 2019).
In the context of controlling moisture, the suggestion for decreasing of the ventilation
rate is in contrast to other researchers who promote the opposite. The increasing of
ventilation rate is beneficial to RH reduction, supports moisture buffering, and
improves air quality (Fisk et al., 2011; Mendell et al., 2008). However, too high ratio of
exchanged air might have some unintended effects, such as draft and energy loss
(Schiavon et al., 2016). The researcher agrees with the suggestion that the discussion
about the ventilation rate would be beneficial to shift from the amount of fresh air into
a more purposeful approach to a higher quality of indoor air. This means to approach
the ventilation and IAQ problematic from a holistic point of view (Bomberg, Gibson, et
al., 2015; Brauner et al., 2016; Yarbrough et al., 2019). The ventilation rate should be
rather demand controlled by measured indoor humidity and CO₂ levels than pre-set
just by volume (Osanyintola & Simonson, 2006; Persily, 2015). The HVAC setpoints
should be optimized to the local climate conditions without compromising energy
consumption and thermal comfort (Papadopoulos et al., 2019). European standard EN

72
16798-1:2019 sets limit values of substance concentration of CO2 and RH, which might
be used as set up points for demand-based ventilation (European Standard, 2019).
However, the minimum outdoor air exchange, particularly with the increasing air-
tightness of the building envelope, must be guaranteed to provide a healthy indoor
environment (Wolkoff, 2018a).
With the emphasis on energy savings, research and praxis are coming with new
ventilation alternatives. For example, studies based on BIM, such as wind-driven
natural ventilation at top floors of residential high-rise buildings in suitable climates
(Weerasuriya et al., 2019), or using natural ventilation during certain seasons when the
thermal comfort could be maintained (Gan et al., 2019). On a similar idea is based a
hybrid ventilation system with an overpressure of the supply air proposed for houses
with environmental quality management (Romanska-Zapala et al., 2019). Another
alternative to HVAC systems could be natural ventilation with parallel-action opening
windows regulated by an automatic control mechanism as proposed by Pazold et al.
(2014).
Another option represents IEQ management by decisive use of heat storage systems
operating on thermal energy, sensible heat, and/or latent heat. To this category belong
direct ventilation and evaporating cooling (Johnston et al., 2016). These systems use
climate variables, like temperature and humidity, as the cooling potential for a passive
cooling system (Campaniço et al., 2019). The latent heat storage systems follow a
similar concept in offering free cooling based on phase change materials (Zeinelabdein
et al., 2018). Today’s technology enables an automatic ventilation control system
based on an algorithm considering the IEQ factors and occupant ventilation behaviour
(H. Kim et al., 2019). Therefore, the demand-controlled ventilation would improve the
building operations’ adaptability to variable occupancy and save operational energy
(Ouf et al., 2019).
The different ways of controlling the RH fluctuation and their impact on the total
energy consumption are shown in Table 4.

73
Table 4
Ways of Controlling RH Fluctuation and Their Impact on the Energy Consumption
Passive control
Active control
Energy consumption
References
Mechanical ventilation √ +
(Barbosa & Mendes, 2008; Crawley et al., 2019; Fisk et al., 2011; H. Kim et al., 2019; Leardini et al., 2012; McNeil et al., 2015; Mendell et al., 2008; Romanska-Zapala et al., 2019)
Dehumidifier, air conditioning √ + (Asif et al., 2018; Galvin, 2010; Krus
et al., 2011; Winkler et al., 2018)
Moisture buffering materials
√ -
(Osanyintola & Simonson, 2006; Ramos & de Freitas, 2009; Shi et al., 2018; Soudani et al., 2016; Wan et al., 2019; Winkler et al., 2014; Wu et al., 2018; H. Zhang et al., 2017)
Moisture release reduction
√ - (Lawrence et al., 2018; Nazaroff, 2013; Nevalainen et al., 2015)
The review of possible ways how to control indoor environment reveals the need for a
holistic and sustainable approach to building performance (Brauner et al., 2016; Lan et
al., 2019; Weerasuriya et al., 2019). However, building performance analysis is a
complex activity for which does not exist a generally accepted evaluation framework
(de Wilde, 2019). Building performance is described by de Wilde (2019) as a concept
allowing to quantify the degree to which a building fulfils its functions and can be
studied from an engineering, process, and aesthetic point of view. Complex
assessment of building performance is crucial for the design of sustainable houses
(Ahmad et al., 2019). Therefore, improved hygrothermal models should be connected
with energy modelling (Romanska-Zapala et al., 2019) because moisture buffering
beside influencing the indoor RH also reduces peak energy loads (Fadejev et al., 2017).
High RH might lead by certain circumstances to condensation. Therefore, the following
section reviews the existing research concerning physical processes in condensation
and dew point.

74
3.2.2 Dew Point and Condensation
Condensation represents a physical process of conversion of water vapour (WV) to
liquid water (Camuffo, 2014). Development of condensation depends on the complex
interrelationships between heat, moisture, air movement, building layout, and the
physical properties of building materials (British Standards, 2016). Condensation
develops where the vapour pressure exceeds the vapour saturation pressure (Simões
et al., 2002), with other words, where the temperature reaches or falls below the dew
point at initial pressure and water content (Jensen et al., 2014). This means that the
condensation is dependent on indoor temperature, indoor RH, outdoor temperature,
air movement (air leakages), and thermal resistance of the weakest element in the
building envelope (Belleudy et al., 2015). Condensation might occur on surfaces or
within layers of a construction (interstitial condensation) (British Standards, 2016).
Nevertheless, damage caused by condensation can occur to the building body and
contents (Karagiannis et al., 2018). Condensation also affects to different degree the
thermal conductivity of insulation. The water sensitivity of thermal insulation depends
on the material hygroscopic capability (the degree of wettability) and the impact of the
water content on the reduction of thermal resistance (Gullbrekken et al., 2019; Jerman
et al., 2019; Kosiński et al., 2018). Additionally, the dampness and associated mould
growth can be distressing to occupants and causing respiratory and other health issues
(Carlton et al., 2019; Fisk et al., 2010). The control of condensation is an essential
factor in building design and construction. Consequently, the design process needs to
implement a hygrothermal performance assessment into calculations of energy
efficiency and/or conservation measures (Oladokun et al., 2017).
The amount of WV content in the air is in correlation with temperature and follows an
exponential curve (Hens, 2017). By sufficient water availability, the evaporation
continues until the vapour pressure reaches the saturation point. To provide the
temperature dependence of the saturated vapour pressure (𝑝𝑝𝑠𝑠) most scientific
textbooks use the Clausius-Clapeyron equation (Rittner & Bailey, 2016; Velasco et al.,
2009; Zhang et al., 2019). The most accurate approximation of saturated vapour
pressure based on Dengler (1997) and Hens (2017) is:
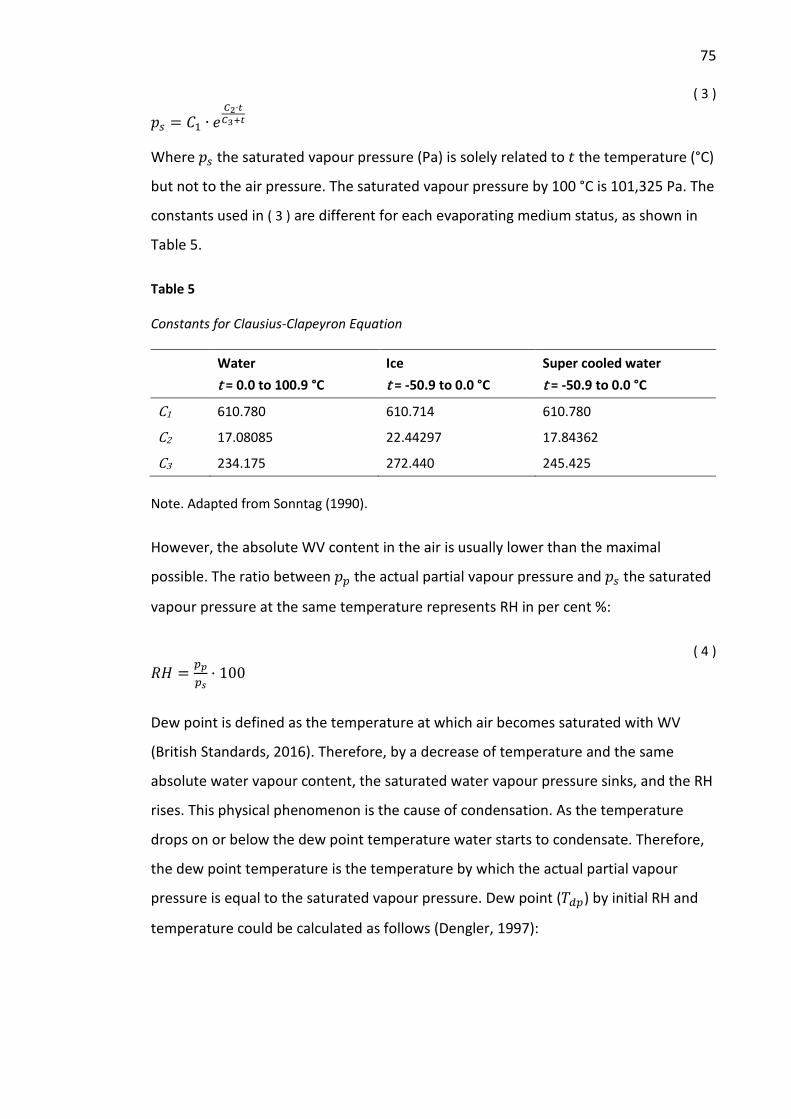
75
( 3 )
𝑝𝑝𝑠𝑠 = 𝐶𝐶1 ∙ 𝑒𝑒𝐶𝐶2∙𝑡𝑡𝐶𝐶3+𝑡𝑡
Where 𝑝𝑝𝑠𝑠 the saturated vapour pressure (Pa) is solely related to 𝑡𝑡 the temperature (°C)
but not to the air pressure. The saturated vapour pressure by 100 °C is 101,325 Pa. The
constants used in ( 3 ) are different for each evaporating medium status, as shown in
Table 5.
Table 5
Constants for Clausius-Clapeyron Equation
Water t = 0.0 to 100.9 °C
Ice t = -50.9 to 0.0 °C
Super cooled water t = -50.9 to 0.0 °C
C1 610.780 610.714 610.780
C2 17.08085 22.44297 17.84362
C3 234.175 272.440 245.425 Note. Adapted from Sonntag (1990).
However, the absolute WV content in the air is usually lower than the maximal
possible. The ratio between 𝑝𝑝𝑝𝑝 the actual partial vapour pressure and 𝑝𝑝𝑠𝑠 the saturated
vapour pressure at the same temperature represents RH in per cent %:
( 4 ) 𝑅𝑅𝑅𝑅 = 𝑝𝑝𝑝𝑝
𝑝𝑝𝑠𝑠· 100
Dew point is defined as the temperature at which air becomes saturated with WV
(British Standards, 2016). Therefore, by a decrease of temperature and the same
absolute water vapour content, the saturated water vapour pressure sinks, and the RH
rises. This physical phenomenon is the cause of condensation. As the temperature
drops on or below the dew point temperature water starts to condensate. Therefore,
the dew point temperature is the temperature by which the actual partial vapour
pressure is equal to the saturated vapour pressure. Dew point (𝑇𝑇𝑑𝑑𝑝𝑝) by initial RH and
temperature could be calculated as follows (Dengler, 1997):

76
( 5 ) 𝑇𝑇𝑑𝑑𝑝𝑝 = 𝐶𝐶3 ∙ 𝑙𝑙𝑙𝑙
𝑝𝑝𝑝𝑝𝐶𝐶1
/(𝐶𝐶2 − 𝑙𝑙𝑙𝑙 𝑝𝑝𝑝𝑝𝐶𝐶1
)
Dew point temperatures for selected initial temperatures and RH are shown in Table 6.
Table 6
Dew Point Temperatures (°C) by Initial RH und Temperature
Initial Temperature
°C
Initial RH
75% 80% 85% 90% 95%
14 9.8 10.8 11.6 12.5 13.3
15 10.8 11.7 12.6 13.5 14.3
16 11.8 12.7 13.6 14.5 15.2
17 12.8 13.7 14.6 15.5 16.2
18 13.8 14.7 15.6 16.4 17.2
19 14.7 15.7 16.6 17.4 18.2
20 15.7 16.7 17.6 18.4 19.2
21 16.7 17.7 18.6 19.4 20.2
22 17.7 18.7 19.6 20.4 21.2
23 18.7 19.6 20.6 21.4 22.2
24 19.7 20.6 21.5 22.4 23.2
25 20.6 21.6 22.5 23.4 24.2
26 21.6 22.6 23.5 24.4 25.2
The initial RH above 75% represent the critical moisture levels in buildings because the
air is already saturated with WV from three quarters or more. Therefore, in such a
case, a fall of temperature just about 4.5 to 1 degree Celsius (depending on the initial
RH) would reach saturation point, and the WV would condensate. Consequently, for
the description of moist air is dew point not sufficient because a second parameter,
such as the initial temperature or initial RH is needed (Hens, 2017).
With the recognition of the moisture impact on buildings during the last century,
diverse methods for the moisture performance in building physics have been
developed. The most significant and known method is the Glaser method (Glaser,
1959). However, the Glaser method has several limitations which often lead to false
77
predictions (Schwaller et al., 2016). These limitations are based on the assumption that
moisture transfer is exclusively affected by diffusion, whereas thermal conductivity
and thermal resistance of materials stay constant (Künzel & Sedlbauer, 2015).
Therefore, this method ignores the effects of phase changes, the specific heat capacity
of materials, diurnal temperature changes (British Standards, 2016), the effects of
solar radiation, and air movement (Schwaller et al., 2016). On the contrary, many
hygrothermal simulations allow for detailed moisture analysis with simultaneous
consideration of the most relevant and concomitant factors (Zirkelbach, 2013). The
moisture analysis might be used for mould growth prediction, as described in the
following section.
3.2.3 Mould Growth
Mould is a type of fungus which thrives in warm and humid conditions (Pizzorno,
2016). Mould is, therefore associated with temperature, substrate conditions, and
humidity (Glass et al., 2017; Johansson et al., 2012; Vinha et al., 2018). “Mould growth
remains a highly complex microbiological process consisting of hyphal tip extension,
hyphal branching, conidiophore formation, sporulation and so on. Small differences in
water activity, temperature, nutrient availability, stress conditions and so on can
induce totally different microbiological processes” (Vereecken, Vanoirbeek, et al.,
2015b, p. 119). Indoor dampness or mould are estimated to be present in the order of
10-50% of indoor environments depending on climate among the most countries
(Heseltine & Rosen, 2009; Mudarri & Fisk, 2007; Plagmann, 2018).
As already mentioned in section 3.1.2, IEQ plays a vital role in human health. Fungi
spores constitute biological components which are ubiquitous in the indoor air. Even
though mould growth as a biological process has an inhibition effect on formaldehyde
emission (Liang et al., 2019), it negatively impacts human health. Fungi and fungi
spores pollute the indoor environment and cause severe damage to the building
interior and building envelope (Khan & Karuppayil, 2012; Nevalainen et al., 2015;
Viitanen et al., 2011). Indoor fungi might cause biodeterioration of structural integrity
in building materials, such as gypsum boards, wood, polyvinyl chloride (PVC), natural
fibres, etc. (Kazemian et al., 2019).
78
Therefore, several recent studies are warning from unintended consequences of
climate change and decarbonization process, especially by vulnerable population
impacted by fuel poverty (Domínguez-Amarillo et al., 2019; Eisenberg, 2016; Fisk,
2015; Richard A. Sharpe et al., 2015a; Yavari et al., 2018). In spite of the fact that
mould growth often occurs in poorly insulated houses (Künzel, 1999; Plagmann, 2018),
mould damages could also occur in low or zero-energy houses when very high RH
persists over longer time periods (Sedlbauer & Krus, 2003; Smith, 2017). Therefore, the
improvements in thermal properties, especially by applying interior insulation (Jerman
et al., 2019; Krus & Sedlbauer, 2011) might cause cold hygrothermal bridges,
condensation, mould growth, and decay (Antretter, Pazold, et al., 2013; Davies &
Oreszczyn, 2012; dos Santos & Mendes, 2014; Hildebrandt et al., 2019). Especially
highly insulated wood-frame walls are sensitive to moisture and moisture changes
(Ameri & Rüther, 2019). The thick insulation minimizes the heat flow in assembly, and
therefore, in the case of moisture entrance into the envelope, the drying-out process is
very slow (Lacasse et al., 2016). However, the design based on a good understanding
of building physics will preclude most of the unintended consequences of thermal
improvements (Smith, 2017).
Human beings and their relationships with the environment are complex and still not
completely known or understood (Mendell & Heath, 2005; Zhang et al., 2015).
Nevertheless, the evidence for the significant association of high indoor RH with
negative health effects is present (Bornehag et al., 2001; Sahlberg et al., 2013;
Shrestha et al., 2019; J. Wang et al., 2019; Zhang et al., 2012). Although the clinical
effects of mycotoxins have been widely researched in the respiratory region (Pizzorno,
2016), the research of non-respiratory effects of mycotoxins is limited (Pizzorno &
Shippy, 2016). However, the mould toxicity-related symptoms, such as headache,
fatigue, weakness, lack of concentration, difficulty focusing, red eyes, blurred vision,
multiple chemical sensitivities, allergies, and nosebleeds to name just a few, are well-
known (Lane, 2019). Meta-analyses have been used to show that building dampness
and mould are associated with respiratory tract infections and bronchitis (Carlton et
al., 2019; Fisk et al., 2010), rhinitis (Jaakkola et al., 2013), and increases of 30-50% of
asthma-related health effects (Al-Ahmad et al., 2019; Fisk et al., 2007).
79
However, the science is still not able to successfully assess the cause-effect
relationships between factors, such as chemical, biological, or physical indoor
parameters, and health and well-being of occupants (Pizzorno & Shippy, 2016).
“Dampness is the driving factor and yet health effects are mostly considered to be
associated with microbial exposure, even though the specific causative agent is still
unknown” (Sauni et al., 2015, p. 3). A possible reason for this unsatisfactory situation
might be the synergistic effect of many stressors which act in unison or add together
(Bluyssen et al., 2011; Piggott et al., 2015; Saijo et al., 2011; Wolkoff, 2018a).
Additionally, the state of immune system may be different for each person (Tuuminen
et al., 2019). One other reason might be that fungi are just a part of a complex
community of biological agents. Fungal components and products relevant for indoor
air sciences are fragments of fungal origin, mycotoxins, MVOCs, glucans, ergosterol,
extracellular polysaccharides (EPS), fungal allergens, and fungal nucleic acids. The
fungal nucleic acids contain the genetic information of a fungal DNA or act in
converting of the genetic information carried in RNA (Nevalainen et al., 2015).
Generally, the ability of fungi to affect human health is still not fully apprehended.
However, recently published research is warning about the worldwide unprecedented
emergence rate of pathogenic fungi (Rhodes, 2019). Therefore, more multidisciplinary
research by adopting toxicological and immuno-toxicological methods is needed
(Janbon et al., 2019; Nevalainen et al., 2015). The fact that the mechanisms behind the
association between dampness, mould, and health are not proven to be causal (Crook
& Burton, 2010; Sauni et al., 2015) may not be the validation of their nihility. A recent
NZ study proved a dose-response relationship between dampness/mould and acute
respiratory infection hospitalization rates of young children (Ingham et al., 2019).
Therefore, it seems to be more effective to focus on source control and avoid
dampness and high RH in buildings (Nevalainen et al., 2015; Yarbrough et al., 2019).
Dampness sources are not only water damage or poor maintenance of buildings but
more prevalent and always present is moisture generated by humans (Huang et al.,
2011). A household with two children, for example, generates and releases into the
indoor air between 6 and 14 kg of water each day (ASHRAE, 2016a; British Standards,
2016).

80
Ventilation, dehumidification, and moisture buffering are the most effective means of
controlling IAQ and reducing moisture content. However, these means are inadequate
when indoor emission rates of pollutants and WV are superfluous (Nazaroff, 2013).
Therefore, ventilation (HVAC systems) as prevention of high RH and condensation
should be accurately commissioned to each project (Barbosa & Mendes, 2008; British
Standards, 2019a) and regularly maintained (Angelon-Gaetz et al., 2015; Fisk &
Seppanen, 2007). The maintenance and cleaning of the ventilation systems prevent
additional contamination of indoor air (Mendell et al., 2008; Totaro et al., 2019).
Consequently, the problem of condensation and mould growth could not solve without
reduction of RH under a critical level of 70% or less (ASHRAE, 2016a). Decrease of
indoor RH is a crucial factor in avoiding mould growth, particularly in buildings with
inadequate thermal insulation (Künzel, 2006; Richard A. Sharpe et al., 2015a). The
fastest way how to decrease indoor RH recommended by Galvin (2010) is
dehumidification. However, although a dehumidifier is practical and easy to use, it
might cause high energy consumption and low IAQ due to insufficient air exchange
(Bomberg et al., 2017; Osanyintola & Simonson, 2006; Shehadi, 2018).
Mould or fungi growth may occur not only on interior surfaces but inside of the wall
construction (due to the interstitial condensation or long-term wetting) or on the
outside of the building (Knudsen et al., 2017). Another widespread potential for mould
growth is found in insulated and uninsulated suspended timber ground floors
(Pelsmakers et al., 2019), or cold attics (Hagentoft & Kalagasidis, 2013). Thermally
insulated building envelopes reduce the heat movement through walls (Krus et al.,
2013; Krus et al., 2009). This means, from a building physics point of view, that the
walls are not drying out. In some cases, as an effect of transient wetting, RH,
temperature, and material properties, the high moisture content will support
microbiologic growth, such as mould or algae and discolouration on the exterior side of
the building (Krus et al., 2013). This might happen on wooden claddings (Lie et al.,
2019) or by external thermal insulation composite systems (Barreira & de Freitas,
2013). Some indoor fungi cause biodeterioration upon building material substrates,
such as gypsum board, wood, polyvinyl chloride (PVC), etc. (Kazemian et al., 2019). In
the case of infestation with wood-destroying fungi, buildings are severely damaged
and potentially not safe (Haas et al., 2019). Although the biodegradation of wooden
81
structures might be prevented with biocidal chemical preservatives, the toxicity of this
treatment affects the environment and is hazardous for human health (Ringman et al.,
2019). Therefore, the assessment of the mould growth prediction depicts an essential
part of the building physics and design decision process (Hensen & Lamberts, 2019).
Despite diverse available mould growth models, their results are not always reliable as
they are widely varying (Vereecken, Vanoirbeek, et al., 2015b). Several mould
prediction models are based on material-specific mould growth curves so-called
isopleths. Isopleth diagrams describe critical conditions for germination or growth
rates of mould in relation to temperature and RH (Sedlbauer et al., 2011). With
isopleths, it is possible to predict critical conditions regarding temperature and RH, or
assess different building materials for propensity to mould growth (Johansson et al.,
2013).
Biohygrothermal IBP modelling, as another mould growth prediction tool, allows for a
dynamic hygrothermal description of mould or fungi spore behaviour depending on
surface temperature, RH, and substrate material (Sedlbauer & Krus, 2003; Viitanen et
al., 2011). The current WUFI Bio 3.5 is a biohygrothermal model for assessing indoor
mould growth under transient hygrothermal boundary conditions (Fraunhofer Institute
for Building Physics, 2017a). The WUFI Bio models the growth of a mould hyphen as a
function of the transient ambient conditions (Viitanen et al., 2015).
The next most used mould growth model is the VTT model. The VTT model was
originally developed by Finnish research institute VTT for wood but might be used for
some other materials as well (Vereecken, Vanoirbeek, et al., 2015a). The VTT model is
an experimentally validated empirical model based on visually assessed mould growth
(Ojanen & Viitanen, 2016). The new ASHRAE Standard 160 adapted the Hannu Viitanen
Mould Index (MI) as improved moisture performance criteria (ASHRAE, 2016a).
Therefore, Fraunhofer IBP developed in collaboration with the Finish research institute
VTT the WUFI Mould Index VTT postprocessor (add-in) which contains the mould
growth criteria according to the ASHRAE standard 160 (Fraunhofer Institute for
Building Physics, 2017b).
82
Natural or “green” building materials are suspected to be more prone to the microbial
growth than conventional materials. Therefore, the selection of building materials that
can withstand expected higher moisture level in specific situations might be used as a
way of minimizing the mould growth risk (Johansson et al., 2014; Kukletova &
Chromkova, 2019). However, the propensity to mould growth tests, material-specific
isopleth curves, and settings of critical moisture levels for building materials are usually
based on laboratory conditions (Vereecken, Vanoirbeek, et al., 2015a). These
conditions are without house dust and mostly over a limited time span. However,
house dust is a source of biological nutrients which promote mould growth on nearly
every material when conditions for such are ideal (Mensah-Attipoe et al., 2015). Even
materials that are non-biodegradable may support mould growth over time when they
are covered by organic matter contained in the dust (Hoang et al., 2010), paint, or
wallpaper (Giosuè et al., 2017). Therefore, natural building materials are neither more
inclined nor more resistant to fungal growth than conventional materials. The
susceptibility of mould growth on any material is correlated to the presence of organic
matter and the equilibrium moisture content (Hoang et al., 2010). Based on this
knowledge, logically, the selection of mould resistant or treated materials is not a
“cure it all” solution. Therefore, the researcher suggests that we need to address the
mould growth conditions and not to try to stop or modify the effects of the
unfavourable situation.
In contrary, the advantages of natural or “green” building materials have been proven.
Qualities, such as low toxicity, carbon neutrality (Labat et al., 2016), minimal VOC
emissions (Maskell et al., 2015), and high moisture buffering capacity (Barclay,
Holcroft, Patten, et al., 2014; Jerman et al., 2019; McGregor et al., 2014) have been
recognized. Some of these materials, such as hemp-lime plasters have hygric and
thermal qualities which can be used to reduce energy consumption (Barclay, Holcroft,
& Shea, 2014; Mazhoud et al., 2016). However, all cellulose-containing, organic-based
materials, such as wall paper and plasterboard top layer, are more susceptible to
microbiological growth than inorganic materials (Hoang et al., 2010). Therefore, some
research recommends antifungal additives as prevention to mould growth (Latif et al.,
2015). However, the antifungal treatment seems not to be an environmentally friendly
solution to the mould growth problem. Fungicides have very limited effectiveness
83
(Krueger et al., 2013), the addition of poisonous chemicals to the building fabric may
pollute the indoor air (Horn et al., 2003; Taptiklis & Phipps, 2017), and the
environment (Krus et al., 2009).
Taptiklis and Phipps (2017) argue:
The need to control moisture is consistently made throughout much of the literature. This is obviously a challenge in New Zealand’s maritime climate. More studies investigating the incidence of mould and other biological agents is required as a means to reduce moisture, dampness and mould. Greater understanding of the health effects of dampness and biological agents is also recommended (p. 80).
The moisture-related issues and the need for more NZ studies lead to the research
objective: Examine the hygrothermal performance of NZ housing construction,
focusing on internal envelope materials. Consequently, the topic of the following
section leads to the research question: What is the impact of different building
materials used on the indoor side of walls on the hygrothermal performance of a
building? As mould and fungi thrive in the moist environment, it is desirable to
regulate the RH in buildings. One of the suggested methods for moisture management
is to use hygroscopic building materials and moisture buffering. Therefore, the
following section reviews the existing knowledge in the moisture buffering.
3.2.4 Building Materials and Moisture Buffering
Temperature and RH levels in buildings are often regulated by large, costly, and
energy-consuming HVAC (Van Belleghem et al., 2011). The literature review and praxis
reveal that moisture buffering might assist the humidity control in buildings.
Consequently, a significant decrease in indoor RH might be achieved with a targeted
selection of construction materials and finishes (Brauner et al., 2019). Steady indoor
humidity environment in an optimal range of 40-70% RH can be achieved with some
existing materials or new developed composite hygroscopic materials (De Rossi et al.,
2018; Xie et al., 2018). These materials are capable to absorb moisture and quickly dry
out when the RH drops (Winkler et al., 2018). However, other factors have to support
the moisture buffering to enhance the building hygrothermal performance (Romanska-
Zapala et al., 2019). Thus, the consideration of complex processes and factors, such as
thermal and moisture loads, materials, ventilation, airtightness, insulation, and drying
possibility are necessary (Bomberg, Gibson, et al., 2015). Consequently, the design

84
process has to take into account the evaluation of moisture buffering capacity (MBC),
sufficient thickness and surface area of hygroscopic materials together with diffusion
open surface protection (Maskell et al., 2018; Woods & Winkler, 2018). This leads to
the research objective concerning development of a framework for designers to
provide warmer, drier, and healthier houses for the NZ context. A research gap exists
in the knowledge of an optimal design for hygrothermal performance, as stated by
Wan et al. (2019):
However, there is little study about the optimal design when hygroscopic materials are taken into application. It is better to know what type of hygroscopic material is suitable, how much area of the material is sufficient, and what thickness is best for moisture buffering at the design stage (p. 2).
Consequently, from this arises the following research question: What factors have the
most influence on hygrothermal performance of houses in NZ?
Despite ISO 24353:2008 and JIS A 1470-1 standards, and various protocols to
characterize moisture buffering potential (MBP) of single matter (Delgado et al., 2006;
ISO, 2008; JIS, 2014; Rode et al., 2005), there is still not reliable moisture buffering
characterization reflecting different moisture production regimes (Janssen & Roels,
2009; Roels & Janssen, 2006). The standard ISO 24353:2008 specifies a test method
used for determination of moisture adsorption/desorption properties of building
materials in response to humidity variation. This standard was last reviewed and
confirmed in 2018. Therefore, this version remains current, although, it is more than
10 years old (ISO, 2018a). However, the current methods reveal to be unsuitable for
the representation of the actual hygroscopic material performance in real buildings
(Cascione et al., 2019). Therefore, M. Zhang et al. (2017) proposed basic moisture
buffering value (MBVbasic) which is a new mathematical expression for moisture
buffering value (MBV).
MBV was originally defined in the NORDTEST protocol with the assumption that the
thickness of the material is greater or equal to the moisture penetration depth of the
material (Rode et al., 2005). In the case when the thickness of the used building
material is smaller, the retrieved MBV is lower. Therefore, MBV should be a product
property provided by the manufacturer and not a material property (Roels & Janssen,
85
2005). The NORDTEST distinguishes between the standardized MBV and the practical
MBV:
The standardized Moisture Buffer Value (MBV) indicates the amount of water that is transported in or out of a material per open surface area, during a prescribed period of time, when it is subjected to specific variations in relative humidity of the surrounding air with a specified velocity. When the moisture exchange during the period is reported per open surface area and per % RH variation, the result is the MBV. Standardized exposure is 8 h of 75% RH, and 16 h of 33% RH. The unit for MBV is kg/( m2⋅% RH) (Rode & Grau, 2008, p. 339).
The practical Moisture Buffer Value (MBVpractical) indicates the amount of water that is transported in or out of a material per open surface area, during a certain period of time, when it is subjected to variations in relative humidity of the surrounding air. When the moisture exchange during the period is reported per open surface area and per % RH variation, the result is the MBVpractical. The unit for MBVpractical is kg/(m2⋅% RH) (Rode et al., 2005, p. 18).
The experimental determination of the MBVpractical is based on an exposure of the
material sample to cyclic step-changes in RH for 8 hours at 75% RH and 16 hours at
33% RH (Rode et al., 2005). As the phase change of water from liquid to vapour in the
form of adsorption and desorption requires energy (Collet, 2017), the moisture
buffering of hygroscopic materials influence the energy efficiency and potential energy
savings (Osanyintola & Simonson, 2006; Rempel & Rempel, 2016). By using appropriate
hygroscopic materials, the potential energy-saving rate might reach 25–30% (Kreiger &
Srubar, 2019; M. Zhang et al., 2017). Recently published studies about the cooling
potential of moisture buffering depict another field of interest (Campaniço et al., 2019;
Rempel & Rempel, 2016; Xie et al., 2018). However, the complex building-scale
benefits are still unknown and require further research (Kreiger & Srubar, 2019). As
MBV is related to the hygroscopicity of the material, protective coatings might have an
influence on the actual moisture buffering (Ramos et al., 2010). Therefore, coatings
depending on their diffusion qualities have an impact on the MBV and the hygroscopic
inertia of the room (Colinart et al., 2016). The hygroscopic inertia classes theory,
introduced by Ramos in 2007 originally in Portuguese, shows that the RH peaks could
be reduced by the use of hygroscopic materials (Ramos & de Freitas, 2009).
For some extreme subtropical conditions during the summer and winter period, Wu et
al. (2015) suggested for hygroscopic characterization of composite materials ultimate
86
moisture buffering value (UMBV). The UMBV is a testing method to different RH and
temperature in three stages in the 24-hour cycle. The first stage is set at 50% RH at 23
°C for 12 hours, the second stage at 98% RH at 40 °C for 8 hours, and the third stage at
3% RH at 18 °C for 4 hours (Wu et al., 2015). This method demonstrates the strong
relation of moisture buffering ability of materials to RH, temperature, and time the
materials are exposed to certain humidity. However, the researcher notes that the
only difference between MBV and UMBV is due to the different water region of the
sorption isotherm. The sorption isotherm covers the hygroscopic and capillary water
region where the moisture transport is conducted by a different physical
phenomenon. Up to 95% RH, the adsorption is governed by vapour diffusion, and over
95% RH by capillary water transport (Lakatos, 2014; Tariku et al., 2010). Therefore, by
the liquid water transport, the pores of the material are filled with water which
promotes mould growth (Kazemian et al., 2019).
The exposed surface area of the indoor hygroscopic material determinates the effect
of hygroscopic inertia (Ramos & de Freitas, 2012), and has an inevitable impact on the
IAQ and thermal/hygrothermal performance of the whole building (Shehadi, 2018;
Soudani et al., 2016). Accordingly, moisture buffering materials as a passive factor in
the regulation of RH are preferably used as a finishing layer (De Rossi et al., 2018; H.
Zhang et al., 2017) or separate features (Brauner et al., 2016). An example of a
separate feature is a solar-regenerated rotating hygroscopic curtain system proposed
by Salloum et al. (2015). Another is a desiccant coated air-to-air energy wheel in the
HVAC system (Fauchoux et al., 2014). The finishing layer stands for an exposed indoor
layer of walls and ceilings, but not an in-wall material. However, the vapour
permeability of hygroscopic materials is significantly influenced by coatings and/or
primers which can reduce their moisture absorbance (Brauner et al., 2019; Ramos et
al., 2010; Santos et al., 2019). Consequently, the hygric properties of coating layers
affect the inner layers by changing their MBV (Giosuè et al., 2017; Kaczorek, 2019).
During the last decades, new materials and admixtures are developed which support
moisture buffering, such as a composite based on Typha Australis reeds and clay soil
(Niang et al., 2018). Or a combination of insulation materials based on technical hemp,
cultivated flux, or jute with plant facades (Korjenic et al., 2016). To maintain MBV but
decrease the undesirable liquid water intake into materials, Jiang et al. (2018) tested a
87
surface application of silica nanoparticles to hemp shiv. Consequently, the appropriate
surface treatment might reduce water adsorption and the hysteresis between
adsorption and desorption isotherms (Jiang et al., 2018). Another example of
mechanical and physical properties’ improvement of hygroscopic materials is the
stabilization of hypercompacted earth by alkaline activation and silicon-based
admixture (Bruno et al., 2017).
As already mentioned, the moisture buffering effect is based on continuous adsorption
and desorption physical processes. Therefore, the drying time of the buffering material
and the desorption phase are the key factors to moisture buffering (Aït Oumeziane et
al., 2014). To evaluate the relationship between the moisture adsorption effect (MBEa)
and moisture desorption effect (MBEd) of the hygroscopic materials H. Zhang et al.
(2017) proposed a new index of MBEa/ MBEd.
For example, hygric properties of different natural fibre insulation could influence the
hygrothermal performance of building thermal envelope (Latif et al., 2014; Latif,
Tucker, et al., 2016). However, the use of insulation as a moisture buffering material is
not desirable because the absorbed moisture might be locked inside of the wall
construction and eventually cause its permanent wetting (Latif et al., 2015). As the
drying phase is so important, especially biomaterials due to their thermal and hygric
properties are potentially applicable for insulation on the indoor side of historical
building envelopes (Jerman et al., 2019). Alternatively, using the hygroscopic natural
insulation, such as sheep wool as an excellent acoustic insulating material (Zach et al.,
2012) for internal walls (Brauner et al., 2016). High water content in porous material
not only increases the density of the material, but it might influence the thermal
conductivity and vapour diffusion resistance factor too (Collet, 2017). Therefore, the
thermic characteristics of insulation are dependent on water content (Palumbo et al.,
2018; Stazi et al., 2014). However, rather the cycle of wetting and drying than the
actual water content of the insulation influences the energy performance of the
building (Abdou & Budaiwi, 2013).
The idea to use hygroscopic qualities of insulation thus is controversial to the energy
efficiency of the envelope. Besides that, considering a moisture buffering by insulation
conflicts with the definition of moisture buffering capacity (MBC) (Padfield, 1999).

88
Insulation in the conventional building is usually encapsulated in a cavity and screened
from the indoor by painted plasterboard and vapour barrier without any contact with
surrounding air (Bomberg & Onysko, 2002; McNeil, 2018). Therefore, the drying
potential of such construction is unknown. Due to the physical processes of phase-
change, the mass transfer in hygroscopic materials has a significant impact on heat
transfer (Collet, 2017; Lakatos, 2014). Therefore, the use of MBC of in-wall insulation is
a risky attitude, which might cause several unintended problems, such as wetting and
decay of the construction, and/or decreasing the thermal resistance of the building
envelope (Latif et al., 2015). A different situation, as already mentioned, exists by
retrofits of existing and historic buildings. Insulating materials with unique properties,
such as capillary active thermal insulation calcium silicate boards, are applicable for
the insulation of buildings with a high degree of wetting (Břenek et al., 2015).
However, to avoid possible failures by energy retrofits, hygrothermal analysis and risk
assessment shall constitute vital parts of the design decision process (Vereecken, Van
Gelder, et al., 2015). Therefore, the next section deals with the depth of water
penetration into building materials.
3.2.5 Sorption Active Thickness
Sorption consists of two physical processes — adsorption and desorption. The sorption
isotherm is a function between RH and absolute moisture content (Hens, 2017).
Therefore, the sorption isotherm depicts the relation of the equilibrium moisture
content to the ambient relative humidity by constant temperature (Mazhoud et al.,
2016). The determination of hygroscopic sorption properties of porous building
materials, as specified in ISO 12571:2013, consists of two alternative methods, such as
desiccator and a climatic chamber. Both methods measure the steady-state water
content after establishing the equilibrium at each RH by constant temperature of (23 ±
0,5) °C or (27 ± 0,5) °C in tropical countries (ISO, 2013). However, the built
environment is rarely in steady-state. Thus, to simulate the real situation in building
Růžička and Diviš (2019) developed a full-scale test of dynamic sorption for building
structures. Unfortunately, for most building materials, the exact sorption isotherm is
unknown (Strangfeld & Kruschwitz, 2018). Alternatively, by some materials, such as
cement-based products, sorption isotherms are influenced by the test method used
(Krejcirikova et al., 2018). Therefore, the experimental results for the description of
89
water transport might differ depending on the used assumptions and concepts
(Korecký et al., 2015), or the material tested (Hansen et al., 1999). Consequently, the
exactness of laboratory-measured material characteristics is often insufficient for use
in advanced hygrothermal models (Bomberg & Pazera, 2010).
Adsorption at low moisture contents, called mono-molecular adsorption, is based on
water physically bound to the pore surfaces in the porous material. The water
molecules form a monolayer to which adhere further water molecules when RH
increases. The second stage calls the poly-molecular adsorption. When the water
content in the pores reaches the critical moisture saturation degree, the water forms a
liquid bridge and the adsorption is based on capillary condensation on the menisci in
the pores (Collet, 2017). S. Yu et al. (2012) describe the critical moisture content in this
stage as: “Moisture content at which capillary liquid flow carries more moisture than
the WV diffusion (so called transition point). Typically, it happens between 80% and
95% RH but generally is unknown” (p. 209). This process is graphically plotted as the
sorption isotherm, which describes the moisture storage capacity for porous materials
at equilibrium with the ambient air (Eriksson et al., 2019). However, the actual
hygroscopicity of a material depends on the pore size. As the smaller the pore size, the
higher the specific pore surface and the sooner the capillary condensation (Hens,
2017). Therefore, by larger pore diameters higher ambient RH is needed before the
capillary condensation starts. This phenomenon explains the strong increase in
moisture content by most building materials above 90% RH (Hens, 2017).
The desorption process usually progresses differently from the adsorption process.
Therefore, a difference between water content by the same ambient RH might appear
between adsorption and desorption. This difference is called hysteresis (Alioua,
Agoudjil, Chennouf, et al., 2019). The hysteresis has many causes. According to
Strangfeld and Kruschwitz (2018), the hysteresis is due to trapped water in the pore
system. However, the water uptake and release represent very slow processes which
are often not respected while testing. These processes depend largely on the pore size,
the contact angle of the meniscus, the salts content, and temperature (Hens, 2017).
However, the water penetrates during the sorption process in the normal
circumstances only to a certain depth of the material (Maskell et al., 2018). The

90
aspiration to reflect the influence of the cyclic variations in indoor humidity on mass-
based moisture content led to the development of the effective penetration depth
concept (Cunningham, 1992; Kerestecioglu et al., 1990). The penetration depth is a
material property determining the thickness of hygroscopic material, which is
subjected to RH variations at its surface in a periodic way (Rode et al., 2005).
Therefore, beyond the thickness of material determined as the effective penetration
depth, the MBC does not increase (Maskell et al., 2018). On the contrary, if the
thickness of the outer layer in a wall assembly is less than the penetration depth, the
WV reaches the next layer in the assembly. The whole MBC of the assemblies are
therefore determined by MBV and thickness of the outer layers (Kaczorek, 2019).
However, as the models due to approximations tend to overestimate the moisture
penetration depth, Maskell et al. (2018) recommends direct measurement of the
penetration depth. Therefore, the researcher suggests using for the penetration depth
measurements a device based on the non-destructive method of gamma rays
attenuation, introduced by Guimarães et al. (2018).
Similar to the effective penetration depth concept, the sorption-active thickness
introduced by Hens (2017) depicts an attribute of each hygroscopic surface. The
sorption-active thickness is defined as “the distance between the inside surface and
the interface where the vapour pressure amplitude due to a 1 Pa periodic oscillation at
the inside surface dampens to 0.368 Pa” (Hens, 2017, p. 283). Therefore, the moisture
buffering/hygric inertia has only an impact when the vapour pressure indoors and/or
outdoors change (Růžička & Diviš, 2019). In the context of sorption, the capillary
absorption coefficient and the capillary moisture content represent two important
hygric material properties. However, until now, any full agreement regarding the data
processing and the experimental protocol of the capillary absorption has been reached
between researchers (Feng & Janssen, 2018).
The moisture penetration depth concept was further developed in the effective
moisture penetration depth (EMPD) model (Cunningham, 1992; Kerestecioglu et al.,
1990). The EMPD model calculates the moisture buffering by accounting for the
diffusion resistance of the material, and the resistance between the air and the surface
(Cascione et al., 2019). Therefore, the EMPD model is a compromise between the
simple, effective capacitance model and the complex finite-difference approach
91
(Woods et al., 2013). The original EMPD model calculates for one buffering layer only
and constitutes a part of EnergyPlus v7.2 as a fixed model (EnergyPlus, n.d.). However,
the improved EMPD model accounts for the moisture transfer between the air and two
layers with uniform moisture content. The first layer is the surface, short-term
moisture buffering layer and the second is the deep, long-term buffering layer (Woods
& Winkler, 2018). Generally, the advantages of EMPD models are especially a
reasonable accuracy and short computing time (Wan, Xu, & Li, 2017). The EPDM
models are widely used among the HAM models addressed in the following section.
However, if the hygroscopic material is thinner than its moisture penetration depth,
the simulation results of the original EMPD model might be inaccurate. Therefore,
Wan, Xu and Li (2017) proposed a theoretical moisture penetration depth (TMPD)
model. The TMPD model evaluates the conditions of the moisture permeation through
the building wall materials. For example, the gypsum board daily TMPD is 0.064 m but
its real thickness is usually 0.01 m. Therefore, already during the first 24 hours, the WV
penetrates the material (Wan, Xu, & Li, 2017, p. 6), and the amount of absorbed WV
drops (Wan et al., 2019). To determine the optimal thickness for the maximum
possible MBC Wan et al. (2019) proposed a method for the optimal moisture buffering
thickness of hygroscopic material. Another improvement of EMPD models, to make
them suitable for thin and limited moisture buffering materials, represents a double
effective moisture penetration depth (DEMPD) model developed by Wan, Xu, Gao, et
al. (2017).
Based on moisture buffering, effective moisture penetration depth, and other physical
properties of materials, hygrothermal analyses and modelling deal with moisture
transport in buildings (Wan, Xu, & Li, 2017). This leads to the research question: What
are the requirements for undertaking an effective hygrothermal assessment of houses
during the early design stage? Before going more into the depth of hygrothermal
modelling, a brief history and an overview of the methods for hygrothermal analyses
are addressed in the following section.
3.3 Hygrothermal Analyses and Modelling
In the 21st century, saving energy and reducing CO2 emissions became the priorities of
politics and the economy. Researchers are therefore focusing on the reduction of the
92
negative impact of buildings on the environment, and developing diverse analytical
and simulation tools to improve the thermal and hygrothermal performance of
buildings.
3.3.1 Looking Back
Hygrothermal analyses and modelling emerged as a result of expanding moisture
problems in buildings (Bomberg & Onysko, 2002). Since Philip and De Vries (1957),
Krischer and Kröll (1963), and Luikov (1964) published their work, several researchers
developed mathematical models based on numerical methods for calculation of
distributions and fluxes of heat and moisture transfer in buildings. The first models
were utterly based on water vapour diffusion (ASHRAE, 1977; Glaser, 1959; Kieper et
al., 1974). Vos (1969) added to the diffusion capillary suction and explained the
process of condensate deposits in assemblies and their influence on water adsorption.
Bomberg (1974) united capillary suction and diffusion in a generalized suction concept.
However, the moisture and heat transfer, as a very complex phenomenon (TenWolde,
1989), is affected by variable material properties and different time scale for each
physical process (Gasparin et al., 2018a). In spite of the fact that the role of air
movement in the hygrothermal condition of buildings was already mentioned by
Rowley et al. (1941), air convection and ventilation were not modelled until the 1980s
(Cunningham, 1988; Haghighat et al., 1989; Kronvall, 1980; TenWolde, 1985).
Several improvements to the traditional diffusive models enable researchers and
building practitioners for the evaluation and analysis of the hygrothermal performance
of buildings (Busser et al., 2019). Based on De Vries, Krischer, and Luikov, Kießl (1983)
introduced moisture potential of materials and modelled heat and mass transfer in
building components. Neiß (1982), although dealing with soil, successfully integrated
complex frost phenomenon of capillary media into existing models. The mathematical
formulas of heat transfer dependent on water content and temperature above and
under freezing point represent an important improvement to the hygrothermal
models (Neiß & Winter, 1982). Pedersen (1990) modelled some consequences of unfit
moisture tolerance in building constructions. Wang et al. (1991) studied influences of
air infiltration on the airflow and contaminant distribution in a ventilated isothermal
two-zone enclosure.

93
Based on moisture buffering, Kerestecioglu et al. (1990) and Cunningham (1992)
developed an effective moisture penetration depth (EMPD) model. Another
improvement to the modelling of moisture transport was a single moisture transport
coefficient formulated by Garrecht (1992). The united coefficient reflects the fact that
the water phases – fluid and vapour are not possible to measure separately but only as
moisture transport. The moisture transport coefficient is determined by experimental
measures. Garrecht also investigated the influence of different salts on sorption
isotherms by diverse building materials and simulated complex 2D building structures
(Grunewald, 1997). Häupl et al. (1993) described coupled moisture, air, and heat
transport in capillary building materials. The development of whole building heat, air,
and moisture (HAM) analysis started with the introduction of inter-zonal airflow
patterns within a building (Allard et al., 1990). Baker et al. (1994) applied
Computational Fluid Dynamics (CFD) models to predict indoor room air motion.
However, the CFD models as a vital part of HAM modelling exist already since the
1980s (Maas, 1992).
Another significant milestone in the hygrothermal simulation represents the work of
Künzel (Künzel, 1995; Künzel, 2014; Künzel et al., 2012). Künzel (1994) implemented air
moisture gradient and water vapour pressure gradient into hygrothermal models and
developed hygrothermal simulation software (Fraunhofer Institute for Building Physics,
n.d.-b). Grunewald (1997) added to the diffusion in porous materials convective flows
as heat and moisture transport phenomenon. Janssens (1998) originated a 2D model
for HAM calculation in lightweight roofs. Janssen investigated thermal diffusion as a
complementary force to vapour pressure gradients in WV transport in porous
materials. His investigation confirmed that the thermal diffusion, due to its low
magnitude in WV transport, could be neglected. Therefore, vapour pressure
represents the sole significant transport driver of WV in porous materials (Janssen,
2011).
The improved convection/diffusion method takes the air in- and exfiltration, and
related bulk heat and vapour flow into account (Busser et al., 2019). Therefore, at the
beginning of the 21st century, the convection/diffusion method was, besides the Glaser
method, the most used simplified HAM simulation (Hens, 2002). However, more
sophisticated models have been developed. For example, models dealing with mould
94
growth (Ojanen et al., 1994; Ojanen & Viitanen, 2016; Sedlbauer & Krus, 2003;
Viitanen & Ojanen, 2007), or simulating wind-driven rain loads on envelopes (Blocken
et al., 2003; Janssen et al., 2007; Kalagasidis, 2004; Künzel & Zirkelbach, 2013).
Consequently, the aim for more energy efficiency of built environment led to the
coupling of hygrothermal models to Building Energy Simulation (BES) models, or
Computational Fluid Dynamics (CFD) models (Van Belleghem et al., 2011). Van
Belleghem et al. (2014) introduced a coupled heat, vapour and liquid moisture
transport model for porous materials implemented in CFD. The presented differential
formulation in the air domain coupled with moisture transfer allows for a simultaneous
modelling of convective and diffusive HAM transport in porous materials (Ayres de
Mello et al., 2019). Another example of an improved model is the hygro-thermo-
mechanical multiphase model which accounts for long-term water absorption into air
pores (Eriksson et al., 2019).
The most common use of HAM models in building physics is to investigate the physical
phenomena (Mendes et al., 2019). However, some researchers use numerical methods
for solving inverse problems in building physics. Thus, it is possible to estimate, for
example, the material properties from experimental data (J. Berger et al., 2018).
Generally, the numerical methods used by hygrothermal simulation models are well
described in Numerical methods for diffusion phenomena in building physics: A
practical introduction (Mendes et al., 2016). The new edition of this book intends to
encourage new ways of hygrothermal simulation in building physics (Mendes et al.,
2019). Mendes et al. (2019) introduce innovative approaches, such as reduced order
models, boundary integral approaches, and spectral methods into the field of building
energy simulation tools.
3.3.2 HAM Models
HAM models allow to simultaneously quantify heat, air, and mass transfer in buildings.
Therefore, HAM models are suitable for simulation of the thermal and hygrothermal
interactions in building elements or whole buildings (Van Belleghem et al., 2011).
Some HAM models additionally deal with consequences of moisture related issues,
such as mould, corrosion, frost damage, and salt transport (Kalagasidis et al., 2008).

95
Examples of HAM models are MATCH, WUFI, Latenite, Delphin, UMIDUS, HAM-Tools,
EMPD, MOIST, and HygIRC (Boudreaux et al., 2017; Gasparin et al., 2018b; Woloszyn &
Rode, 2008). Annex 41 named seventeen HAM tools capable of whole building
hygrothermal simulation. One of the named simulations has been HAM-Tools
(Woloszyn & Rode, 2008). HAM-Tools might be rather described as a modular system,
using the graphical programming language Matlab/Simulink, and being more suitable
for research and education than for commercial use (Kalagasidis et al., 2008).
However, HAM-Tools is not a whole building simulation tool but a one-dimensional
HAM transfer simulation model (Delgado et al., 2013). The software, originally
developed by Kalagasidis (2004) is since 2012 no more available (International Building
Physics Toolbox, 2012).
However, the number of available HAM tools is continually changing. Although
proceeding a comprehensive search, the researcher was not able to determine the
exact count of current HAM tools. In 2008 there have been seventeen tools used for
IEA-Annex 41 analysis (Rode et al., 2008). According to López et al. (2017), fourteen
programs have been publicly available in 2017. However, these programs vary in
mathematical complexity (Karagiannis et al., 2018). The sophistication of each
software depends on various parameters, such as input material properties (López et
al., 2017), moisture transfer dimension, and type of flow (steady-state, quasi-static or
dynamic) (Delgado et al., 2013).
Most of the HAM simulation tools are based on mass and energy conservative
modelling using standard discretization techniques (Berger, Mendes, et al., 2017). The
discretization process concerns time and space. The implicit time discretization scheme
solves the mathematical problem through matrix inversion. By non-linear problems,
which is the case by hygrothermal processes, the solution is calculated in sequential
steps (Janssen et al., 2007; Mendes & Philippi, 2005; Rieth et al., 2018). The explicit
time discretization scheme solves the mathematical problem through diagonal matrix
inversion, which includes inversion of the terms on the diagonal only (Kalagasidis et al.,
2007; Kovács & Ván, 2015). The majority of the HAM programs use the Euler and
Crank-Nicolson (Crank & Nicolson, 1947) implicit scheme with finite-element, finite-
difference, or control-volume spatial discretization methods (Janssen et al., 2007;
Mendes & Philippi, 2005; Steeman et al., 2009). Nevertheless, transient models of

96
moisture transfer through porous materials, based on the diffusion process, struggle
with the simulation of the moisture advection transfer (Colinart et al., 2016; Labat et
al., 2015; McClung et al., 2014). To overcome the discrepancies between the
simulation and experimental results, Berger, Gasparin, et al. (2017) proposed the
Scharfetter and Gummel (1969) numerical scheme. However, this scheme is not
unconditionally stable as the Crank–Nicolson scheme. Therefore, the calculation with
the Scharfetter-Gummel method is possible with the Courant-Friedrichs-Lewy
condition (Gosse, 2018). The inclusion of an advective term in the diffusive model may
improve the results (Berger, Gasparin, et al., 2017).
However, the implicit methods require sub-iterations by treatment of nonlinear
problems, which increase the total central processing unit (CPU) time - computational
run time (Gasparin et al., 2018b). Therefore, Berger et al. (2016) investigated the use
of model reduction techniques, so-called Proper Generalised Decomposition (PGD), for
building physics applications. PGD represents an option to reduce computational costs
at different levels (Berger, Mendes, et al., 2017).
Despite all the developmental process, the complex heat, air, and moisture
phenomena requires the solution of large algebraic systems for the whole building
modelling (Berger, Mendes, et al., 2017). To further minimize CPU time, Gasparin et al.
(2018c) proposed the use of improved DuFort-Frankel explicit scheme. The DuFort-
Frankel scheme proved to be unconditionally stable and twice faster than the Crank-
Nicolson approach (Gasparin et al., 2018c). The driving force behind this and other
model reduction techniques represents the intention of producing efficient methods
for moisture diffusive transfer through porous materials with a reduced CPU time
(Gasparin et al., 2018a).
Gasparin et al. (2018a) argue:
It is important to mention that the computational resources available in a computer are not increasing any more [emphasis added] (Waldrop 2016). Thus, it is worth investigations to develop numerical models based on an optimal usage of the available computational resources. (p. 967)
However, this argument is not correct. The in the quote cited author, Waldrop (2016)
describes the limitations of semiconductors while they get too hot by smaller and

97
smaller silicon circuits. But he does not write that the computer’s resources are
stagnating:
For the past five decades, the number of transistors per microprocessor chip — a rough measure of processing power — has doubled about every two years, in step with Moore’s law... Chips also increased their ‘clock speed’, or rate of executing instructions, until 2004, when speeds were capped to limit heat. (Waldrop, 2016, p. 146)
The researcher agrees that the classical computer chips are down for Moore’s law
because of the heat problem. However, scientific and industrial communities are
working on the increasing semiconductor device integration density using new
technologies and new materials (Oh et al., 2019). For example, Mizsei and Lappalainen
(2019) introduced new phonsistor (phonon transistor) based thermal-electronic logic
system or thermal-electronic logic circuit. Nanoelectronics (Ahopelto et al., 2019),
carbon nanotube and nanowire (Chaudhury & Sinha, 2019), ultrathin wafer (Dong &
Lin, 2020), or hybrid spintronic materials (W. Liu et al., 2019) to name a few, are new
technologies in computing. Simultaneously, new ways of digital communication are
accompanying the technical development of the chip production. Fibre-optic
communication with the application of high-speed digital signal processing (DSP)
enables to maximize system performance (Hui, 2020).
Therefore, the argument that the computational resources in a computer are not
increasing any more is unfounded. Nevertheless, the reduction of CPU time for
hygrothermal simulations is crucial to the implementation of these techniques into the
construction design process based on optimal usage of the available hardware
(Gasparin et al., 2018a). Therefore, the calculation method has to be chosen with the
consideration of the computational cost (CPU time) and required solution accuracy
(Berger et al., 2019).
Building Energy Simulation Tools and Hygrothermal Analysis
To evaluate and test the thermal performance of buildings, several building energy
simulation tools have been developed (Campana & Morini, 2019). The International
Building Performance Simulation Association (IBPSA) lists in the Building Energy
Software Tools (BEST) directory currently 68 whole building energy simulation tools
(International Building Performance Simulation Association, n.d.). However, although
98
the web page offers search under diverse capabilities of the listed software,
hygrothermal simulation or HAM is not an option. In the BEST directory, amongst
others are tools, such as TRNSYS, ESP-r, Autodesk Green Building Studio, IES VE, and
EnergyPlus. However, not all the programs in the BEST directory are coupled HAM
transfer models and some are not listed at all, such as WUFI Plus or Delphin. Schmidt
et al. (2012) compared TRNSYS with WUFI Plus and found out that the simulation
results are similar with quite small distinctions. Another software in the BEST list is IES
Virtual Environment (IES VE). IES VE is a suite of building performance analysis tools,
such as Apache, Apache HVAC, and MacroFlo (Integrated Environmental Solutions,
n.d.). Apache is a module for heat transfer by conduction, convection, and radiation;
Apache HVAC is a module for heating, ventilation and air conditioning, and MacroFlo
deals with moisture balance (Corrado & Fabrizio, 2019).
EnergyPlus is often used to evaluate the energy performance of buildings (Krone et al.,
2015). Additionally, EnergyPlus offers a heat, air, and moisture transfer (HAMT) model
of a building component in the form of a one-dimensional model (EnergyPlus, n.d.).
However, the EnergyPlus HAMT model with assumptions and simplifications neglects
some physical phenomenon, such as sensible and latent heat effects or multiple
condensation planes (Antretter & Pallin, 2019). Therefore, EnergyPlus as “The user
defined model relies completely on a good user input for the resulting air flow and it
applies one static number over the whole simulation period” (Antretter & Pallin, 2019,
p. 6).
However, the building energy modelling (BEM), to be reasonably accurate, require a
large computer memory and CPU time (Gao et al., 2019). Therefore, researchers
investigate the employment of artificial intelligence in the form of intelligent co-
simulation to dramatically reduce the building performance simulation CPU time
(Julien Berger et al., 2018). Nevertheless, most energy simulation tools do not
adequately model the hygrothermal performance of buildings (Ferroukhi et al., 2016).
The BEM are still not able to systematically deal with temperature, heat, and RH nor to
adopt an integrated modelling approach (Harish & Kumar, 2016). Although several
times have proven that the coupled HAM transfer influences the cooling and heating
energy consumption (Jerman et al., 2019; Khoukhi, 2018), the current conventional
BEM ignore the hygrothermal interactions in building envelopes (Yu et al., 2019).
99
Additionally, the BEM require accurate data; otherwise, their results might not be
reliable (Prada et al., 2018). The researcher notes that the accuracy of data is equally
important for the hygrothermal models.
3.3.3 Influence of Hygrothermal Interactions
Based on the existing literature and praxis, it is evident that the coupled HAM transfer
influences the indoor environment, the energy demand, and the durability of
buildings. The investigation of hygrothermal risk analysis gains importance especially
under the ongoing climate changes (Gaur et al., 2019). Therefore, the assessment of
the critical hygrothermal parameters should constitute a part of the construction
design process (Ameri & Rüther, 2019).
Consequently, to make buildings more resilient, architectural design has to be
informed by the investigation of the hygrothermal interactions (Tariku et al., 2011).
Factors, such as wind-driven rain exposure, plaster capillarity, or presence of a vapour
barrier affect the hygrothermal performance (Bastien & Winther-Gaasvig, 2018;
Carbonez et al., 2015). Therefore, HAM models enable the simulation of leaks at
specified locations (Carbonez et al., 2015) or the moisture control and energy
efficiency potential of construction components (Antretter et al., 2019). As the coupled
HAM transfer leads to the change of latent heat in the building envelope, the
hygrothermal processes influence the total energy balance of the building (Liu et al.,
2017; Yu et al., 2019). Therefore, Steeman et al. (2009), Woloszyn et al. (2009), and
Rempel and Rempel (2016) investigated moisture buffering capacity of building
materials for evaporative cooling while using hygrothermal simulations. Leroux et al.
(2019) studied a low-energy evaporative cooling system based on the porous
evaporator wall. The moisture buffering impacts the indoor environment by reducing
or delaying peaks in the indoor humidity (Winkler et al., 2018). Therefore, using
different building materials leads to notable differences in hygrothermal performance
(Radon et al., 2018). It leads to the research question: Which physical qualities of
building materials influence hygrothermal performance most significantly?
As the hygrothermal interactions influence the building performance (Ferroukhi et al.,
2016), many researchers scrutinize existing and new materials on their hygrothermal
properties. Alioua, Agoudjil, et al. (2019a) used a combination of experiment and

100
numerical modelling to test the hygrothermal properties of innovative concrete based
on date palm fibres. Hygrothermal models proved to be sustainable for studies of
hygrothermal behaviours of bio-based building materials and walls (Alioua, Agoudjil, et
al., 2019b). The hygrothermal material properties are considerably influenced by water
content and temperature of the material (Ferroukhi et al., 2019). Therefore, the
knowledge of hygrothermal material properties enables informed design decisions by
using hygrothermal simulation (López et al., 2017). The hygrothermal parameters and
hygrothermal simulation provide a comprehensive reference for sustainability
assessment of building materials. For example, a substitution of timber by bamboo
reveals to be feasible in lightweight construction in hot and temperate regions where
the bamboo grows (Huang et al., 2017). Another area of interest represents the
improvement of thermal insulation by existing buildings. Especially interior insulation
requires a careful approach to potential moisture risks and benefits from an analysis by
hygrothermal simulation (Jerman et al., 2019; Knarud & Geving, 2017).
The airflow through air leakages transports water vapour into the building envelope
(Künzel et al., 2012). Particularly in lightweight wall assemblies, the airflow through
leakages influenced by pressure difference might cause convective moisture entry and
interstitial condensation (Kölsch et al., 2016). Consequently, cracks in construction
timber, such as engineered wood, glulam beams, or CLT panels considerably impact
their water vapour resistance properties (Fortino et al., 2019; Kukk et al., 2017).
However, not only engineered timber products but generally all laminated composites
are influenced by temperature and intruding water. As a result of these processes,
laminated composites are affected by hygrothermal ageing (Rocha et al., 2017).
Therefore, the influence of cracks on the hygrothermal performance of lightweight
construction needs further analysis, particularly in high RH environment (Ameri &
Rüther, 2019; Schmidt & Riggio, 2019).
The correlation of temperature and high humidity by timber products was already
emphasized by Baker et al. (2009). The permeability of timber-based materials, notably
at RH above 70%, is influenced by temperature (Chiniforush, Valipour, et al., 2019).
However, the moisture transfer in the most porous building materials is mainly driven
by the vapour pressure gradient and not significantly temperature dependent (Baker
et al., 2009). Therefore, particularly by timber-based products sorption/desorption

101
tests and the comprehensive numerical multi-scale and micro-scale experimental
studies need to support the hygro-thermo-mechanical and long-term analysis of
engineered timber (Chiniforush, Akbarnezhad, et al., 2019). The data from such studies
would be similarly vital for hygrothermal modelling as the numerical simulations in the
classic diffusive model tend to underestimate the adsorption process (Busser et al.,
2019).
3.3.4 Reasons for Limited Use of Hygrothermal Modelling
Although numerous HAM models, such as WUFI, EnergyPlus or ESP-r, are available the
applying of hygrothermal simulation in the design process is not common (Jaques et
al., 2016). Possible reasons for the limited use of hygrothermal modelling in
architectural practice are various. The primary barrier to the more widespread use of
hygrothermal simulation by architectural designers is the missing knowledge of
building science (Romanska-Zapala et al., 2019). The hygrothermal models require
regional weather data, prediction of indoor conditions, and correct material
properties. Additionally, some models require a high level of user input (Antretter &
Pallin, 2019). Therefore, user errors remain a significant cause of unreliable (Zakula et
al., 2019) and sometimes legally actionable building performance simulation results
(Melton & Yost, 2014). Consequently, the careful use of HAM models needs correct
boundary conditions and hygric material properties (Desta et al., 2011; Feng et al.,
2015).
The shortage of complete sets of hygroscopic material property data represents
another barrier to the use of HAM models in design praxis (Barclay, Holcroft, & Shea,
2014). Additionally, current material data is sometimes incorrect (Prada et al., 2018),
not reproducible (Feng et al., 2015), or varies in its detail (Melton & Yost, 2014).
Therefore, to enhance the reliability of HAM analysis determination of accurate
material properties depending on temperature is necessary (Feng & Janssen, 2016).
However, full consensus about the capillary absorption test and the processing of
experimental data does not exist (Feng & Janssen, 2018). Consequently, some
published data are presented with deficient hygric material properties. For example,
the presentation of incorrect vapour permeability of wood-fibre insulation in
Vololonirina et al. (2014) led to misinterpretation of air-gap-corrected vapour
102
permeabilities by several authors. Janssen (2018) writes in this matter: “… the
measurement, the calculation and the presentation of this vapour permeability has
suffered from various errors, invalidating the obtained intrinsic vapour permeabilities
of wood-fibre insulation” (p. 39). Another issue exists with the adsorption process
measuring in most of the over-hygroscopic range. Therefore, to solve the
unsatisfactory experimental protocols for the measuring of moisture storage curves,
Feng and Janssen (2019) proposed the semi-permeable membrane method and the
psychrometer method.
Early integration of building performance simulation tools in the design process could
support the aim to reduce the energy consumption of buildings (Yigit & Ozorhon,
2018). However, architectural designers find most of the tools inadequate in
supporting the design decision process (Attia et al., 2012). Thus, the research question
developed: How can integral principles be applied to determine potential building
performance weakness during the design stage?
After the description of the state-of-the-art in hygrothermal modelling, the literature
review addresses changes in the building process from traditional to interdisciplinary
and collaborative practices. Therefore, the following section examines Building
Information Modelling (BIM) and interoperability.
3.4 BIM and Interoperability
The tools and techniques brought by Building Information Modelling (BIM) are
reforming how the modern construction industry operates (Ghaffarianhoseini, Tookey,
et al., 2017). Therefore, BIM represents a paradigm shift in construction
(Khosrowshahi, 2017). The traditional building process in separate stages is
transforming into a dynamic operation with shifting important decisions ahead
towards design stage (Borrmann, König, et al., 2018; Sacks et al., 2018). BIM
constitutes a vital part of digital transformation in the built environment and supplying
manufacturers (The British Standards Institution, 2018). Consequently, BIM is
described in the relevant standards, such as the ISO 19650 series as a process (British
Standards, 2019c; NBS, 2019). The whole procedure of building is becoming more
complex from concept, through design, construction, maintenance and operation to
decommissioning (Doumbouya et al., 2017; Kent & Becerik-Gerber, 2010). Therefore,
103
interdisciplinary and collaborative practices within the built environment are pivotal to
the efficiency in delivery and operation of assets (British Standards, 2019b).
Consequently, interoperability between diverse BIM tools enables the comprehension
of diverse factors in the process (Dixit et al., 2019; Yan et al., 2013).
3.4.1 BIM
BIM is a term that represents simultaneously a business process, the digital
representation of physical and functional characteristics of a facility, and the
organization and control of the business process over the entire life cycle of a building
(National Institute of Building Sciences, 2015). From the BIM original goal of achieving
more efficiency and economic gain of an investment, is BIM increasingly considered as
a method for optimization of economic aspects as well as ecological and
environmental issues (Chong et al., 2017). The processes and technologies behind BIM
are based on parametric design, using computers, calculations and modelling, deriving
2D and 3D drawings from a model and a single integrated database for visual and
quantitative analyses (Howden, 2015). The BIM models can also incorporate time and
scheduling resulting in 4D data, cost elements (5D), and asset management (6D) during
the whole life cycle of a building (Georgiadou, 2019). Each D indicates the data
dimension affiliated to the BIM model, such as 7D for sustainability measures (Mayouf
et al., 2019).
BIM creates and uses standardized information about the building during the whole
life span of the asset (Dastbaz et al., 2017). The standardization includes design,
calculations, economic and ecological considerations, construction process, scheduling
and materials ordering, operation, rebuild to demolition, and recycling of materials
(Jensen et al., 2013). BIM exploits the potential to manage data about the life cycle of
an asset, inclusive the potential for sustainable building refurbishment (Kim, 2019).
Consequently, the synchronization of BIM data with the real-life construction process
constitutes a vital part of the BIM process (Chen et al., 2015). Additionally, the
emergence of spatial information by integrated BIM-GIS data improves the potential
for energy efficiency and sustainable energy management (H. Wang et al., 2019). BIM
can also be used in diverse fields of the design decision process, such as path planning
in fire safety (Lin et al., 2013) or for fire emergency management (Ma & Wu, 2020).
104
During the design process of sustainable assets, it is important to evaluate the project
from different points of view, for example, by using the integrated design process
approach (Romanska-Zapala et al., 2019). Focusing on building design and assembly,
including operation costs, sustainability issues, and preventing premature failures have
an impact on the building life cycle costs and the environment (Bryde et al., 2013).
Continuous life cycle costing and LCA through the life of assets, on the other hand,
contribute to BIM by maintaining data of financial and environmental impacts (Tam &
Le, 2019). Therefore, building sustainability assessment methods might benefit from
BIM (Carvalho et al., 2019).
“BIM … contains all the data needed for supporting sustainable design of projects
throughout its whole life cycle, particularly when coupled with relevant performance
analyses tools” (Khosrowshahi, 2017, p. 54). However, the researcher notes that this
statement is true in theory only as a potential of BIM. In reality, there are many known
interoperability issues and factual lack of data for sustainability assessment (Akanbi et
al., 2019; Carvalho et al., 2019). Nevertheless, modelling allows the variation of
parameters in calculations for better decisions on the concrete design at the stage
when the costs for changes are the lowest (Azhar et al., 2015). Every dollar spent
properly at the design stage could save 20 dollars in construction and 60 dollars during
the operation of the building (Lopez & Love, 2012).
The traditional method to construct a building is logical and linear. In essence, the
sequence is to fully design the building, tender the project, select a contractor,
construct the building, and finally hand over the project to the occupant (Sacks et al.,
2018). However, as timelines have contracted and expectations have risen, the
building industry has reached a turning point (Carvalho et al., 2019). The traditional
linear way of the design and construction process is increasingly incompatible with the
technology used for those activities and the growing demand for sustainability and
efficiency (Alwan et al., 2017). The use of 2D and 3D modelling and large amounts of
data have traditionally served architectural designers well (Sacks et al., 2018).
However, the traditional way is lacking cooperation during the building process itself
(Azhar, 2011). Between the architectural designer and the contractor, there is a risk
gap based on the lack of cooperation or willingness to share information, and non-
existence of an agreement or contract (Lopez & Love, 2012). Additionally, the often
105
poor architectural designer – client relationship, described as a “wicked problem” has
multiple causes (Frimpong & Dansoh, 2018). As a result of this situation, today’s
building costs are too high, they do not work as well as they could, and they do not last
long enough - in other words, they are not sustainable enough (Georgiadou, 2019).
BIM implementation process requires besides the firm technical knowledge of the
highly complex building model human intervention (Dimyadi et al., 2016). The
successful data exchange between project stakeholders form a vital part in the
ultimate success of BIM (Nawari, 2012). However, the architecture, engineering, and
construction (AEC) industry with its fragmented nature delays the widespread use of
BIM (Borrmann, König, et al., 2018). Therefore, the social proactive and reactive
opportunities for enhancing BIM benefits include collaboration, transparency, and
clear communication (Blay et al., 2019). The most reported BIM benefits relate to the
cost control and reduction, and to time savings (Bryde et al., 2013). However, the
unavailability of data limits the numerical cost-benefit analysis of BIM implementation
(Lu et al., 2014).
Apart from the energy modelling (Shoubi et al., 2015; Stegnar & Cerovšek, 2019),
sustainability assessment has a minimal presence in the used BIM tools (Carvalho et
al., 2019). To be able to take the responsibility for our future there is a significant
requirement for accountability and the ability to quantify the ecological, social and
economic value of the projects (Chong et al., 2017). For example, quantification of the
impact of reducing volatile organic compounds (VOCs), maximizing day light use and
fresh air, reducing noise or humidity in buildings on health issues, such as asthma,
chronic headaches, burnout syndrome and their macroeconomic costs (Hoisington et
al., 2019; Lane, 2019). Consequently, how can these building components have their
environmental impact factored into the BIM process (Jin et al., 2019)?
Green BIM faces several challenges, such as weak interoperability of green building
tools and lack of holistic industry standards (Lu et al., 2017). However, some
researchers use BIM for modelling of the social housing requirements (Baldauf et al.,
2013), natural ventilation, and thermal comfort (Gallardo et al., 2017; Gan et al., 2019).
Others investigate the daylight analysis by using BIM (Welle et al., 2012; Yan et al.,
106
2013). Rahmani Asl et al. (2015) and Natephra et al. (2018) introduced BIM-based
optimization of energy performance into the energy-efficient building design.
In response to the changing construction process sequence, BIM is increasingly being
implemented around the world. In particular, BIM is used widely in the USA, UK,
Scandinavian countries and Singapore (Ghaffarianhoseini, Tookey, et al., 2017). Due to
the significant UK government decision in 2011, about BIM level two becoming
mandatory for all public construction projects by 2016, the UK became a global leader
in the employment of BIM (Georgiadou, 2019). Other countries are following these
pioneers and have the opportunity to learn from their experiences. New Zealand and
Australia are considered “fast followers” of these BIM adopting countries (Bernstein,
2014). However, this information was published in a commercially-driven industry
report. Generally, research-based analysis of macro BIM adoption allowing for
evaluation or comparison of BIM policies worldwide are not available (Succar &
Kassem, 2015). Therefore, Kassem and Succar (2017) assessed macro BIM adoption
across markets using five conceptual models validated through capturing data from 21
countries.
3.4.2 BIM in New Zealand
New Zealand (NZ) needs a new approach to waste minimization (New Zealand
Government, 2019a) and to improve urban development and housing affordability
(New Zealand Government, n.d.). The increase in productivity and affordability of
construction sector is partly dependent from the level of BIM integration (Jowett,
2015). Therefore, NZ is accelerating the adoption of BIM since the first BIM handbook
was published in 2014 (BIM Acceleration Committee, 2019). However, according to
BIM macro maturity components, NZ ratings are equal or below 25% with a gap in
learning and education (Kassem & Succar, 2017, p. 291, Table 8). To improve the level
of BIM adoption, NZ established the National Technical Standards Committee in 2012
and the National BIM Education Working Group in 2014 (Puolitaival et al., 2016).
Recently some NZ companies use accurate BIM model of the building for off-site
manufacturing resulting in dramatically shortened building times and more housing
(Barton, 2019). However, the level of BIM implementation in NZ is still low (Doan et al.,
2019). This comes down to education around what BIM is, what are the uses and
107
benefits for stakeholders, and how the BIM knowledge is transferred (Rotimi et al.,
2019). Simultaneously to support BIM implementation for NZ towns and cities, the
development of data infrastructures inclusive geospatial information are necessary
(Ivory et al., 2019). Another issues represent the prevailing lack of BIM-based building
life cycle considerations in NZ (Tran et al., 2012) and the lack of client demand for
either BIM or Green Star projects (Doan et al., 2018). Nevertheless, “BIM is expected
to aid designers to shift the construction industry towards more environmentally and
economically sustainable construction practice” (GhaffarianHoseini, Doan, et al., 2017,
p. 696).
3.4.3 Obstacles to BIM Adoption
Although the BIM advantages are well-known (Ghaffarianhoseini, Tookey, et al., 2017;
Olawumi & Chan, 2019), the rate of BIM worldwide adoption is still slow (Charef et al.,
2019). Chien et al. (2014) identify thirteen risk factors in diverse dimensions, such as
technical, management, environmental, financial, and legal risk. Similarly, Sun et al.
(2017) allocate BIM limitations into five categories, such as technology, cost,
management, personnel, and legal. Remaining challenges lie in the requirements for
technical expertise and in the high implementation and training costs (Charef et al.,
2019; Dixit et al., 2019; Schlueter & Thesseling, 2009). Another hindrance seems to be
the reluctancy to the radical change of a project approach from linear to collaborative,
interdisciplinary, and long-term (Migilinskas et al., 2013).
The BIM requirement of sharing information might clash with the intellectual property,
copyrights, and cybersecurity (Ghaffarianhoseini, Tookey, et al., 2017). Considering
cybersecurity in the AEC industry, Halmetoja (2019) suggests compliance with the PAS
1192-5:2015 specification for security-minded building information modelling, digital
built environments and smart asset management (British Standards, 2015). Software
updates and new versions of software often invoke restrictions in multi-user access to
the model (Azhar et al., 2015). For example, a model created in a recent version of
software will not open in the older version of the program (Dixit et al., 2019).
The BIM tools are being used across a range of different construction projects inclusive
of infrastructure, commercial and residential sectors of the industry (Dave et al., 2013).
The significant barrier in achieving the higher efficiency and advantages offered by BIM
108
is due to a widespread lack of knowledge in new processes, possibilities and their
potential (Dave et al., 2013). This corresponds with the findings of Oesterreich and
Teuteberg (2019) who determined the lack of expertise, lack of training, and shortage
of skilled personnel as the major barriers affecting the BIM socio-technical system.
Another barrier to broader implementation of BIM represents the persistent
fragmentation of the industry as the relationship between stakeholders is still lacking
communication and trust (Piroozfar et al., 2019). Therefore, “The promise of BIM use
during the whole life cycle of the building is a dream far from being realized”
(Miettinen & Paavola, 2014, p. 86). Additionally, BIM transparency might have a
negative influence on contractors' interests and further on BIM adoption as
contractors are reluctant to share information with owners (Guo et al., 2019).
From the technical dimension, broader BIM implementation requires an automatic
information exchange based on interoperability of diverse BIM tools. Therefore, the
following section analyses the status-quo in interoperability.
3.4.4 Interoperability
Interoperability represents the ability of computer-based tools to exchange
information and use it for further processing (Chituc, 2017). However, the term
“interoperability” is defined in the ISO/IEC/IEEE 24765:2017 international standard by
using the definitions from four other standards, such as ISO/IEC 25010:2011, ISO/IEC
19500-2:2012, ISO/IEC 2382:2015, and ISO/IEC 10746-2:2009. Thereby, exchange and
use of information, ability to cooperate, the capability to communicate, execute
programs, transfer data, and collaboration of objects are the main attributes of
interoperability. In order to prevent an interpretation of compatibility as replaceability,
the ISO/IEC/IEEE 24765:2017 international standard uses interoperability instead of
compatibility (ISO/IEC/IEEE International Standard, 2017).
BIM enables the digital transfer of building data. Therefore, all BIM data exchange
operations are based on the consistent utilization of a comprehensive building model
(Borrmann, König, et al., 2018). However, in the building industry, most software
applications are becoming more complex but not fully interoperable (Smith & Tardif,
2009; Tchouanguem Djuedja et al., 2019). The ways of achieving software
interoperability in the construction and facility management industry sector are
109
numerous. The most known are using standard data formats, such as Industry
Foundation Classes (IFC), and eXtensible Markup Language (XML) (Adamus, 2013).
The IFC format is a common data schema and together with four other open standards
of the buildingSMART portfolio enables holding and exchanging relevant data between
different software applications (buildingSMART International, n.d.-a). The IFC is
translated into the open international standard IFC ISO 16739-1:2018 specifying BIM
data schema and an exchange file format structure among software applications (ISO,
2018b). IFC includes definitions of data required for buildings and infrastructure assets
over their life cycle (buildingSMART International, n.d.-a). IFC describes the data
schema in EXPRESS data specification language, defined in ISO 10303-11:2004 (ISO,
2004).
XML is standardized by The World Wide Web Consortium (W3C), an international
community that develops open Web standards (The World Wide Web Consortium,
n.d.). ISO 10303-28:2007 specifies the XML schema definition and the way in which
XML representation can be used in the exchange of data (ISO, 2007). Consequently,
XML can be used as a data model in the form of XML schema file, and in the form of
XML data file to hold the actual data (Koch & König, 2018). Therefore, for the
exchanging and sharing data from one computer system to another can be used XML
exchange format or clear text encoding of the exchange structure, defined in ISO
10303-21:2016 (ISO, 2016). Alternatively, other exchange file formats conforming to
the IFC data schemas might be used (Borrmann, Beetz, et al., 2018).
Other ways to achieve interoperability represent Application Programming Interfaces
(APIs) or proprietary data exchange formats (Jeong et al., 2016; Smith & Tardif, 2009).
These ways are proprietary methods for information exchange between diverse
software. Therefore, software vendors need agreements in order to develop and use
the proprietary interoperability formats (Borrmann, Beetz, et al., 2018).
Although the importance of interoperability in BIM process has often been mentioned
(Grilo & Jardim-Goncalves, 2010; Kadadi et al., 2014), there is a general shortage of
studies on interoperability (Chen et al., 2015). Recently, da Silva Serapião Leal et al.
(2019) presented a detailed systematic literature review of interoperability assessment

110
related articles. Out of 22 compared interoperability assessment approaches, only
seven are suggesting improvements to interoperability based on the assessment
results (da Silva Serapião Leal et al., 2019). Contemporaneously, the researcher notes
that data about the actual costs of inadequate interoperability are not available. Only
in 2004, NIST published the results of a survey estimating $15.8 billion as the annual
cost of inadequate interoperability in the U.S. capital facilities (Gallaher et al., 2004). In
the U.S. aerospace and automotive industry, the total estimated organizational cost of
inadequate interoperability in one company, on average, ranged in 2012 from $1,7 to
$2 billion (Sigo, 2012). In the U.S. health care, the medical device interoperability and
the adoption of commonly accepted standards for interoperability might annually save
$30 billion (West Health Institute, 2013). Generally, interoperability plays a crucial role
in the internet-based enterprises, such as cloud architecture (Panetto et al., 2016).
Although the current AEC industry aims in many countries for energy efficiency, the
actual information exchange between the building and energy modelling encounters
numerous challenges (Guzmán Garcia & Zhu, 2015). The issues range from object
parametric information deficiencies, geometric misrepresentations to the need to re-
input data. Often, the interoperability issues are semantic, causing diverse technical
problems (Davies et al., 2020; Steel et al., 2012). Therefore, multiple research areas in
the application of information technology are emerging in the AEC industry. The
architectural designers would appreciate a BIM-based BEM method for early design
stage (Gao et al., 2019) and BIM enabled building performance simulation (BPS) within
the context of life-cycle (Jin et al., 2019). However, due to the missing knowledge of
materials and processes in the early design stage, the evaluation of the environmental
performance is uncertain. Therefore, the LCA in the early stages could guide the design
optimization process in order to select more sustainable materials and lower the
environmental impact of the building (Rezaei et al., 2019).
BEM based on BIM is often a time-consuming task involving several tools. Therefore,
Reynders et al. (2017) propose a novel tool chain for the direct coupling between BIM
and BEM implemented in Modelica model. For window thermal performance
simulation C. Kim et al. (2019) propose a method to automatically extract and convert
BIM data to improve the productivity of the simulation process. Nonetheless, BIM, BPS
and building environmental assessment methods (BEAM) are currently not fully
111
interoperable. In other words, there is still not possible to fill the BEAM forms directly
from BIM or to use any intuitive interface to do this (Calquin, 2017).
3.4.5 BIM and Hygrothermal Modelling
The energy performance of a building depends on the specific outdoor environment
and is essentially determined by the hygrothermal characteristics of the building
elements, installed services, and building usage (ASHRAE, 2016a; Hensen & Lamberts,
2019). As the building usage is not easy to predict nor control, the building elements
and installed services are decisive in achieving the envisaged building energy
performance (European Standard, 2019). Therefore, the interactions of the external
and internal building surfaces with the outdoor and indoor climate components are
determining the as-built performance (Romanska-Zapala et al., 2019).
However, there is limited research on the practical incorporation of hygrothermal
modelling into BIM although the knowledge about the early design impact on the final
building energy performance is available (Gao et al., 2019). From this reason, BIM
should be extended in the direction of energy assessment of the buildings, with
dynamic correlative methods analysing hygrothermal performance in real climate and
orientation of the building in the early stage of design (Fedorik et al., 2017). This
existing gap in the knowledge led to the research question: What are the requirements
for integration of hygrothermal modelling into BIM? Consequently, the BIM extension
will allow for adjustments or changes to the design in the phase of the project when
the costs to do so are the lowest (Gao et al., 2019). Therefore, the right usage of the
hygrothermal modelling will close or narrow the existing gap between the calculated
and the real as-built energy performance, and will help to create a permissible indoor
climate in winter and summer periods (Kubilay et al., 2019).
Climate adequate buildings have low maintenance costs and minimal need for air-
conditioning (Mitterer et al., 2012). Therefore, the combined assessment of HAMT
allows to decrease the risks associated with moisture and increase the energy savings
potential (Antretter & Pallin, 2019). For this purpose, the building performance and
hygrothermal modelling has to be strictly dynamic, regularly revised and improved
according to the in-field testing and measurements of realized projects (Clarke &
Hensen, 2015; Hensen & Lamberts, 2019). Therefore, the automatic and effortless
112
exchange of relevant building information between BIM and analytical applications,
such as hygrothermal modelling and simulation, are vital to minimize the impact of
buildings on the environment (Hensen & Lamberts, 2019). This awoke another
research question: How can a BIM-integrated hygrothermal simulation tool improve
the building performance? However, current BIM lacks sufficient information to enable
automatic building performance analysis (Gao et al., 2019). Building performance is a
complex issue where the whole building performance cannot be based on the
performance of the individual components (Augenbroe, 2019). Consequently, full scale
dynamic hygrothermal testing and analyses methods under real outdoor and indoor
conditions can improve the real building performance. Reciprocally, the full scale
dynamic testing can help to validate the calculation tools, such as building energy
simulation models (Roels, 2017).
The common praxis in determination and evaluation of energy efficiency in buildings is
to use heat transfer coefficient (U-Value) or its reciprocal, thermal resistance
coefficient (R-Value) measures. However, these values are not always representing the
real as-built performance of the building components because they are set as constant
values under uniform conditions, such as temperature gradient of 24 °C (75 °F) and RH
50% with no wind (constant air pressure) (Dastbaz et al., 2017). Nevertheless, in the
real life these conditions vary and the thermic properties are dependent on humidity,
temperature amplitude, air pressure, orientation, and hygroscopic characteristics of
the material (Flood et al., 2017). For this reason, to realistically evaluate the energy
performance it is crucial to determine and assess the hygrothermal behaviour of
materials and whole buildings based on dynamic total energy consumption and
climatic data (Hopfe & McLeod, 2015). Therefore, in the field of real building energy
performance assessment exists a potential for bridging the performance gap and use
the assessment of different designs for energy efficiency enhancement (Roels, 2017).
This led to the next research question: How can a BIM-integrated hygrothermal
simulation tool reduce errors affecting the hygrothermal performance of buildings?
Energy efficient buildings feature a high level of thermal insulation and airtightness.
Thus, the temperatures and RH levels between indoor and outdoor often differ. Praxis
and research have shown that high and uncontrolled RH has negative consequences
for the buildings and indoor air quality (see section 3.2). However, there exists a gap in

113
the current knowledge as formulated by Fedorik et al. (2017): “Implementing the
hygro-thermal control together with the mold growth risk analysis provides additional
tool to be developed into future BIM systems to promote and balance the health
control and energy efficiency requirements” (p. 138). Therefore, using critical
hygrothermal material characteristics, and merging energy and hygrothermal models
are necessary for the building performance assessment (Romanska-Zapala et al., 2019;
S. Yu et al., 2012). Consequently, the following research question was formed: How
can a BIM-integrated hygrothermal simulation tool increase hygrothermal efficiency?
3.5 Conclusions
This chapter discusses in detail diverse aspects of the AEC industry to examine
possibilities of interoperation between BIM and sustainability tools, particularly
hygrothermal modelling. The new challenges in the AEC industry are related to
worldwide necessity to reduce the negative impact of buildings on the environment
and improve energy efficiency. In order to control and manage the undesirable
impacts of buildings on the environment, many sustainability ratings and certification
systems have been developed. However, some non-governmental sustainability
assessing organizations, such as Green building councils are not financially
independent research institutions. Therefore, to enhance the overall quality of houses,
the architectural designers would appreciate a BIM-based BEM method for the early
design stage. However, most of the research and initiatives concentrate on the
improvements of building thermal performance. In spite of the fact that research has
shown that heat movement correlates with moisture, the majority of research ignores
hygrothermal processes. The interconnectedness of heat and mass explains why every
change in the building envelope has an influence on both - energy and moisture.
Therefore, improving the thermal performance of the building envelope and
airtightness of the building simultaneously change the moisture movement.
Moisture defects have become a leading cause of building damage and also have
serious economic and sociological effects. For the protection against failures caused by
high moisture, maintaining the correct relations between moistening and drying are
essential. The researcher agrees with the suggestion that the discussion about the
ventilation rate would be beneficial to shift from the amount of fresh air to higher
114
quality of indoor air. This means to approach ventilation, building performance, and
IAQ problematic from a holistic point of view. Therefore, a complex assessment of
building performance is crucial for the design of sustainable houses. Based on the
literature review, it is evident that hygrothermal relations in the built environment
need attention. However, despite new technology and simulation software, a
significant uncertainty factor in the prevention of moisture related problems still
remains. Unless taking into account the problem of moisture related issues,
improvements in the real energy performance of new or refurbished buildings might
be accompanied by serious unintended problems in the future. Therefore, improved
hygrothermal models should be connected with energy modelling.
A significant part of the NZ housing stock is energy-inefficient, unhealthy, cold, mouldy,
and damp. Nevertheless, the new houses in NZ are built to the minimum legal
standards, which are below the international standards for comparable climates.
Therefore, the houses are not durable and the costs over the whole life cycle of the
houses are much higher than by houses built to a higher standard. The researcher’s
personal experience is that local, territorial authorities still largely demand the
“Acceptable Solutions” to be followed. This practice hinders innovations. In order to
improve the housing quality Stats NZ released in 2019 a document defining four
elements of housing quality, such as housing habitability, environmental sustainability,
housing functionality, and social and cultural sustainability. However, practical tools on
how to achieve these targets are missing. Similarly, as in most English-speaking
countries, very little or no building physics have been taught to architectural students
in NZ universities. Additionally, anecdotal evidence based on personal conversations
with building professionals would appear that building physics education to
architectural designers is lacking. Therefore, until the building physics/science will be
taught to each and every architectural designer in NZ, we still might face serious
problems in NZ house performance.
As mould and fungi thrive in the moist environment, it is desirable to regulate the RH
in buildings. One of the suggested methods for moisture management is to use
hygroscopic building materials and moisture buffering. The fact that the mechanisms
behind the association between dampness, mould, and health are not proven to be
causal may not be the validation of their non-existence. Therefore, it seems to be more
115
effective to focus on moisture source control and avoid high RH levels in buildings. The
susceptibility to mould growth on any material is correlated to the presence of organic
matter and the equilibrium moisture content. Thus, the selection of mould resistant or
treated materials is not a “cure it all” solution. Therefore, the researcher suggests that
we need to address the mould growth conditions and not to try to stop or modify the
effects of the unfavourable situation. The hygrothermal modelling might be used for
mould growth prediction.
The heat, air, and moisture (HAM) models are suitable for investigation of the thermal
and hygrothermal interactions in building elements or in whole buildings. Some HAM
models additionally deal with consequences of moisture related issues, such as mould,
fungi, corrosion, frost damage, and salt transport. Despite all the developmental
process, the complex HAM phenomena require the solution of large algebraic systems
for the whole building modelling. In this context, the researcher agrees with Gasparin
et al. (2018a) that the classical computer chips are down for Moore’s law because of
the heat problem but strongly disagrees that the computational resources are
stagnating. Scientific and industrial communities are working on the increasing
semiconductor device integration density using new technologies and new materials.
Therefore, the argument that the computational resources in a computer are not
increasing any more is unfounded. Nevertheless, the reduction of CPU time for
hygrothermal simulations is crucial to the implementation of these techniques into the
construction design process based on an optimal usage of the available hardware.
In order to evaluate and test the thermal performance of buildings, several building
energy models (BEM) are available. However, the search for hygrothermal simulation
or HAM in the BEST directory (International Building Performance Simulation
Association, n.d.) are not available under the offered capabilities of the listed software.
Although the literature review revealed that the coupled HAMT influences the indoor
environment, energy consumption, and durability of buildings, the current
conventional BEM ignore the hygrothermal interactions in building envelopes. The
researcher agrees with Prada et al. (2018) that the BEM require accurate data
otherwise, their results might not be reliable. However, the accuracy of data is equally
important for both the HAM models and BEM.

116
In spite of the fact that the literature analysis confirms that the assessment of
hygrothermal building performance should be a part of the design process, the
application of hygrothermal simulation in the design process is not common. There are
diverse reasons for limited use of hygrothermal modelling in architectural practice,
such as the missing knowledge of building science, a high level of user input which
connotes possible errors, unreliability, and sometimes legally actionable simulation
results. Another barrier to the use of HAM models in the design process represents a
shortage of data and sometimes incorrectness or incompleteness of hygroscopic
material property data.
The literature review of BIM and interoperability confirms that interdisciplinary and
collaborative practices within the built environment are pivotal to the efficiency in
delivery and operation of assets. Consequently, interoperability between diverse BIM
tools enables the digital transfer of building data and the comprehension of diverse
factors in the construction process. However, the statement that BIM contains all
supporting data to sustainable design throughout the asset’s life cycle (Khosrowshahi,
2017) is correct in theory as a possibility only. Contemporary studies point towards
many interoperability issues and factual lack of data for sustainability assessment. In
spite of the fact that several studies mention the interoperability financial impact, data
about the actual costs of inadequate interoperability are not available. Additionally,
there is a limited research on the practical incorporation of hygrothermal modelling
into BIM. However, the automatic and effortless exchange of relevant building
information between BIM and analytical applications, such as hygrothermal modelling,
are vital to minimize the impact of buildings on the environment.
As discussed with Fraunhofer Institute for Building Physics IBP, Department of
Hygrothermics Germany, the incorporation of hygrothermal modelling into BIM is not
researched yet. There are software products available for calculations and modelling in
the field of energy and hygrothermal performance assessment. However, a knowledge
gap exists on the parameters and specifications needed for standardized data libraries,
practical solutions for BIM and simulation models to be used as viable tools for
effective decision-making process regarding sustainability and energy performance of
the building. Fedorik et al. (2017), Romanska-Zapala et al. (2019), and others have
recognized the need for the development of future BIM systems implementing the
117
hygrothermal and mould growth risk analysis. The possibility and ability to make
decisions about the quality and physical characteristics of the future construction in
the early design stage will have many advantages. These improvements will contribute
to the reduction of the life cycle costs, minimization of later claims, and enhance the
quality and performance of buildings.
3.6 Summary
This chapter provides a review and analysis of factors affecting the indoor environment
with a view to understand the consequences of underestimating hygrothermal
relations in buildings and to investigate the integration of hygrothermal modelling into
BIM. This research intended to demonstrate that BIM can be broadened in terms of
sustainability assessment. If the hygrothermal modelling would agree with the
measured control values one could apply modelling during the early stage of design to
improve the durability and quality of the construction and prevent moisture related
problems. Consequently, negative impacts on the environment and life cycle costs of a
building can be minimized, and return of investment, energy efficiency, and indoor air
can be improved.
The literature review inspects the theoretical and practical understanding for this
objective by analysing reviewed papers and the background of building physics, BIM
and hygrothermal modelling. After the broader description of the sustainability issues
in the architecture, engineering, and construction (AEC) industry, the analysis narrows
to the NZ construction industry. Next, this research inspects hygrothermal relations in
the built environment and the potential of building materials for the regulation of RH.
BIM and software interoperability constitute the fourth topic of the literature review.
After the short description of BIM history and praxis worldwide and in NZ, the chapter
focuses on the interoperability, particularly between BIM and hygrothermal modelling.
The conclusions outline gaps in the knowledge and discuss a proposed holistic
approach to the design process that takes cognizance of the benefits of BIM with
respect to the hygrothermal performance of buildings.

118
Chapter 4 Data Collection and Analysis – Quasi-Experiment
This chapter deals with quasi-experiment which forms the first part of data collection
and analyses. Chapter 5 contains the second part of data collection (simulation). After
a description of the experiment and its settings, this chapter presents results in
graphical and numerical form. The data analysis process consists of different statistical
methods, such as descriptive statistics and analysis of covariant. This leads to a
comparison of the results. Next, the text focuses on the limitations and challenges of
the quasi-experiment. From the results are drawn conclusions and recommendations.
In the summary section, the major points of this chapter are summarized.
4.1 Description
This research utilizes (as described in Chapter 2 above) a combined model of design
using a combination of experimental and simulation design (Li et al., 2013; Mathy &
Chekaf, 2018; Xing et al., 2018). Radon et al. (2018) used the combination of
experimental and simulation study on long-term hygrothermal performance of
different outer assemblies in passive houses. The difference between the Radon et al.
(2018) study and this study comprises different climate (middle Europe), construction
and materials, not controlled amount of released water vapour, and active mechanical
ventilation.
Consequently, the research intention is to create a supportive environment for using
both in-field experiment and simulation for the collection of data. With this
combination of methods, the research demonstrates the importance of using
simulation during the construction design process (Antretter, Klingenberg, et al., 2013;
Bomberg et al., 2017). This way, existing differences between physical qualities of
materials might be purposely used to enhance the hygrothermal performance of
houses. The in-field experiment delivers data for the testing of the hypothesis and for
the comparison to simulation data as described below. Therefore, for the collection of
data experiment and simulation are selected.
The experiment’s goal is to gain data for the following purposes:
• Monitor indoor humidity in two houses with different room settings/scenarios
while introducing water vapour into the room to simulate occupancy.

119
• Compare relative humidity (RH) in the same room (size, position in the house,
cardinal direction) by two houses. Where the only difference between them is
that the control house (C-house) has traditional NZ exterior wall construction
and the test house (T-house) has airtightness membrane and installation cavity
on exterior walls.
• Compare RH levels while introducing new materials into the room.
• Compare the data with hygrothermal simulation results for the same scenarios.
• Test the hypothesis: “Materials used in the building envelope have a significant
influence on the hygrothermal performance of the building.”
For the testing, this study chooses RH, dew point, and temperature as parameters
measured in one-hour step for consecutive 5 days (120 steps in total) for each
scenario. Independent variables represent weather conditions, materials with different
moisture buffering qualities, amount of water vapour released during every day in the
24-hour cycle, and different type of exterior walls. Weather conditions are described
by outside RH, temperature, dew point, solar radiation, rain, wind, and atmospheric
pressure. The study compares the measured data with data from the hygrothermal
simulation. The hygrothermal modelling tool, WUFI Plus and the simulation are
described in detail in Chapter 5 (p. 156).
For the understanding of this research, it is important to emphasize that RH represents
the characteristic of the interest. The question of RH and indoor environment is
addressed in Chapter 3 (p. 62) and further discussed in Chapter 7 (p. 202). Generally,
under atmospheric conditions, RH is influenced by two significant factors: the absolute
amount of water vapour in the air and temperature (Hens, 2017). This fact is
demonstrated in scenario 1 where RH is periodically changing, although there is no
additional moisture introduced to the room. The RH fluctuations are mainly caused by
the change of the temperature as no water is evaporated into the room. However, as
the exterior walls are not entirely sealed the researcher notices some influence of the
exterior level of humidity and temperature too.
The research introduces interpolation functions to analyse the development of the RH
level. For the relatively short time period (5 days) of each test, a lineal interpolation
proves to be sufficient. Although being very simple, linear interpolation functions

120
effectively demonstrate differences between tested scenarios. Nevertheless, as many
times it has been proven (Bomberg, Kisilewicz, et al., 2015; Hens, 2017) that air
saturation process with water is nonlinear this research introduces natural exponential
functions also. Natural exponential functions express the relations of the air saturation
process more accurately, therefore, they might be used for an extrapolation.
4.2 Settings
Data for the study are drawn from an experiment with real time measurements in real
houses. The experiment ran from January 9th, 2018 till February 19th, 2018. The
experimental set-up has been situated in two test buildings located for the time of the
measurements in Auckland, New Zealand (-36.882533, 174.707651) as shown on the
aerial photo (Figure 5).
Figure 5
Testing Houses Aerial Photo
Note. (R. Birchmore, personal communication, 11.04.2019). Reprinted with permission.
The houses have been constructed by students as a part of the Unitec carpentry
programmes. They are single storied, relocatable, complete with electrical and
plumbing fittings, without floor coverings or wall finishes. The C-house has been built
using conventional New Zealand construction methods and the T-house using diffusion
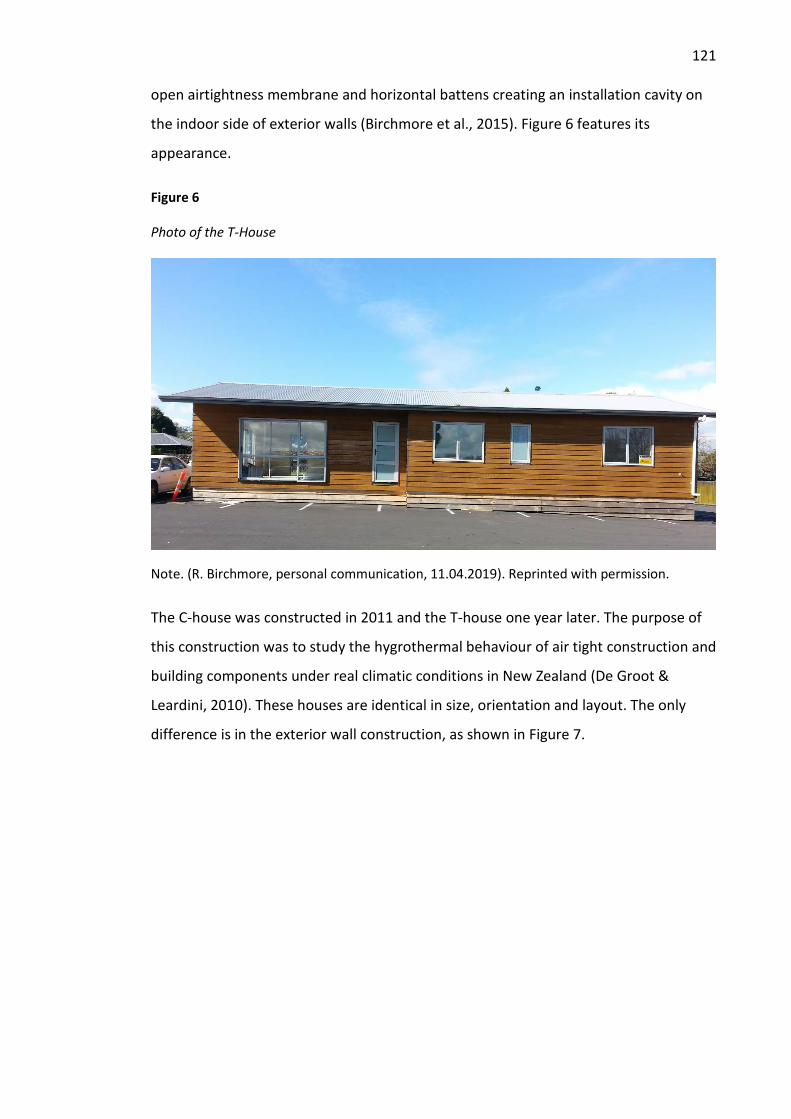
121
open airtightness membrane and horizontal battens creating an installation cavity on
the indoor side of exterior walls (Birchmore et al., 2015). Figure 6 features its
appearance.
Figure 6
Photo of the T-House
Note. (R. Birchmore, personal communication, 11.04.2019). Reprinted with permission.
The C-house was constructed in 2011 and the T-house one year later. The purpose of
this construction was to study the hygrothermal behaviour of air tight construction and
building components under real climatic conditions in New Zealand (De Groot &
Leardini, 2010). These houses are identical in size, orientation and layout. The only
difference is in the exterior wall construction, as shown in Figure 7.
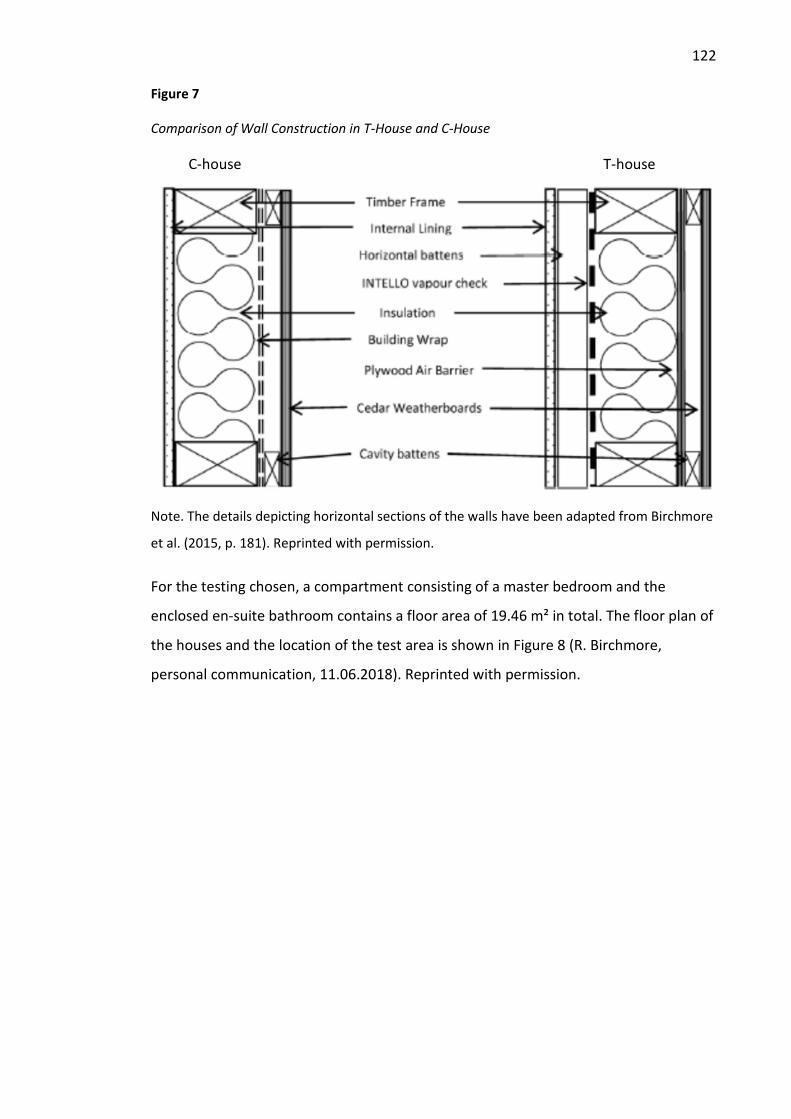
122
Figure 7
Comparison of Wall Construction in T-House and C-House
C-house T-house
Note. The details depicting horizontal sections of the walls have been adapted from Birchmore
et al. (2015, p. 181). Reprinted with permission.
For the testing chosen, a compartment consisting of a master bedroom and the
enclosed en-suite bathroom contains a floor area of 19.46 m² in total. The floor plan of
the houses and the location of the test area is shown in Figure 8 (R. Birchmore,
personal communication, 11.06.2018). Reprinted with permission.

123
Figure 8
Floor Plan (not in Scale) With the Testing Room (Marked)

124
The orientation of the compartment is North (Azimuth 340°) with the longer exterior
wall (6.16 m) and West (Azimuth 250°) with the shorter exterior wall (3.78 m). The
indoor side with the total surface wall area of 43.8 m² and ceiling area of 19.46 m² is
provided with unpainted plasterboard (10 mm).
The basic configuration of exterior walls in both houses consists of 90 mm timber
frame with polyester insulation (90 mm) in between. From outside the load-bearing
construction is sheathed with a building wrap by the C-house and with 7 mm thick
plywood air barrier by the T-house. The plywood is treated to H3.2 CCA (Copper
Chrome Arsenate) in accordance with AS/NZS 1604.3 (Standards New Zealand, 2012b)
to meet AS/NZS 2269.0 (Standards New Zealand, 2012a). Both houses external wall
cladding consists of cedar horizontal weatherboards fitted to cavity battens. The cavity
is not vented, although fitted with cavity closer at the bottom of the wall in accordance
with the NZ Building Code acceptable solution E2/AS1 Paragraph 9.1.8.3 (New Zealand
Government, 2018a, p. 101). The cavity closer provides holes or slots between 3 mm
and 5 mm with an area of opening of 1000 mm² per linear metre of wall in order to
provide draining and venting of the cavity. However, as there is no opening on the top
of the wall cladding, the cavity from building physics point of view has to be seen as
not vented.
From inside of exterior walls is plasterboard fixed directly to the frame in the C-house.
The composition of the inside of exterior walls in the T-house consists of an
airtightness membrane fixed directly to the indoor side of the frame, followed by an
installation cavity, and plasterboard. To minimize openings in the airtightness
membrane, an installation cavity consisting of horizontal timber battens and
plasterboard is implemented. All openings in the air tightness membrane are sealed
with tape and special grommets. Both buildings’ airtightness has been tested with
Blower door test. The test results are shown in Appendix A and summarized in Table 7.
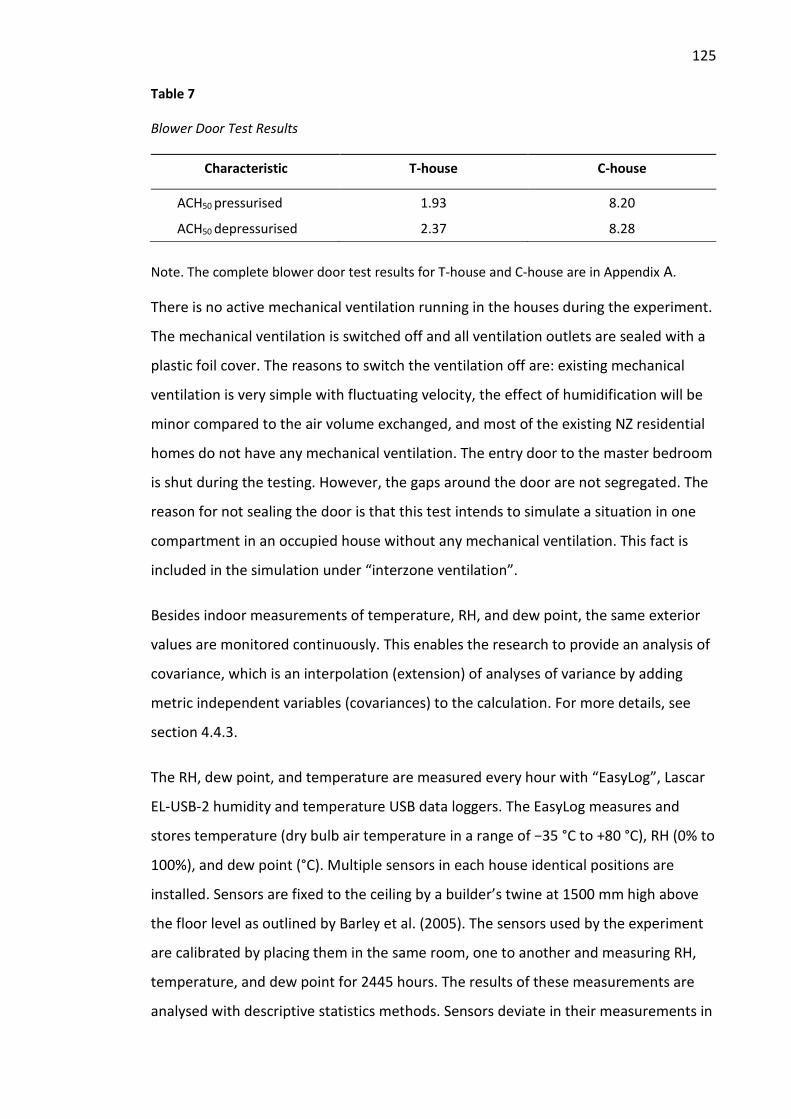
125
Table 7
Blower Door Test Results
Characteristic T-house C-house
ACH50 pressurised 1.93 8.20
ACH50 depressurised 2.37 8.28
Note. The complete blower door test results for T-house and C-house are in Appendix A.
There is no active mechanical ventilation running in the houses during the experiment.
The mechanical ventilation is switched off and all ventilation outlets are sealed with a
plastic foil cover. The reasons to switch the ventilation off are: existing mechanical
ventilation is very simple with fluctuating velocity, the effect of humidification will be
minor compared to the air volume exchanged, and most of the existing NZ residential
homes do not have any mechanical ventilation. The entry door to the master bedroom
is shut during the testing. However, the gaps around the door are not segregated. The
reason for not sealing the door is that this test intends to simulate a situation in one
compartment in an occupied house without any mechanical ventilation. This fact is
included in the simulation under “interzone ventilation”.
Besides indoor measurements of temperature, RH, and dew point, the same exterior
values are monitored continuously. This enables the research to provide an analysis of
covariance, which is an interpolation (extension) of analyses of variance by adding
metric independent variables (covariances) to the calculation. For more details, see
section 4.4.3.
The RH, dew point, and temperature are measured every hour with “EasyLog”, Lascar
EL-USB-2 humidity and temperature USB data loggers. The EasyLog measures and
stores temperature (dry bulb air temperature in a range of −35 °C to +80 °C), RH (0% to
100%), and dew point (°C). Multiple sensors in each house identical positions are
installed. Sensors are fixed to the ceiling by a builder’s twine at 1500 mm high above
the floor level as outlined by Barley et al. (2005). The sensors used by the experiment
are calibrated by placing them in the same room, one to another and measuring RH,
temperature, and dew point for 2445 hours. The results of these measurements are
analysed with descriptive statistics methods. Sensors deviate in their measurements in

126
temperature with an absolute average deviation of 0.44 °C, and RH with an absolute
average deviation of 2.55% RH. The arithmetic mean of deviation is by temperature -
0.19 °C and by RH -1.48% RH. The deviation range was caused by only a few higher
deviations, which is visible from the harmonic mean of deviation. The harmonic mean
of deviation is by temperature 0.00 °C and by RH -0.50% RH. The results of the
calibration are well within the accuracy stated for the sensors to be ±0.5 °C (Birchmore
et al., 2015).
The relatively high measurement uncertainties by RH are common issues, not only by
field testing but by laboratory testing as well. According to Desta et al. (2011) and Van
Belleghem et al. (2011) improved accuracy (absolute deviation of less than 1.5% RH) is
achievable by controlled conditions after calibrating the sensors. In long-term
measurements, which are taken in uncontrolled and dynamic conditions, the response
time of sensors has to be considered as well. Therefore, the uncertainty of ±5% RH and
±0.8 °C in field studies seems realistic (Labat et al., 2015, p. 138).
Additional humidity, in order to simulate inhabitancy, is provided by humiDisk10 with
the maximal production of around 1 kg/h of atomized water. To assure the faultless
functioning of the humidifier, the researcher uses distilled water during the
experiment. HumiDisk utilizes an adiabatic humidification process by which liquid
water is sprayed into a relatively dry, warm air stream in a tower. By this process,
some water evaporates, the temperature of the air stream decreases and its moisture
content increases. Required daily evaporation is controlled by a relay operating on
switch on and off mode. A relay is “… an electrical device, typically incorporating an
electromagnet, which is activated by a current or signal in one circuit to open or close
another circuit” (Lexico, n.d.). To set up a correct amount of switching cycles, a
calibration method based on a trial of different relay’s settings is employed. The
closest possible setting with given technical equipment is to run the HumiDisk daily for
12 hours from 7 pm till 7 am in a mode of 3 min turned on and 7 min turned off as
shown in Figure 9.

127
Figure 9
Relay Setting
This allows for a simulation of an occupancy of two people based on Straube (2002)
with the following calculation:
2 people 1.2 * 2 = 2.4 l
2 showers 0.5 * 2 = 1.0 l
Total 3.4 l/24 h
The only disadvantage of this type of evaporation is in the variation of the amount of
water released each time. The humidifier diverts a portion of the water into an
overflow container, which has to be refilled by the researcher into the supply
container on a regular basis. The amount of daily evaporated water varies between
3.18 and 3.32 litres/24 hours, with an average of 3.28 l/24h and variance of 0.0227, as
shown in Table 8. Variational span is 0,14 l. Although the actual amount of evaporated
water is lower than the originally intended evaporation, the results are suitable for
analyses. The reason for the good usability of the results is that this research intention
is to demonstrate a tendential influence of different materials on the RH in real
houses.
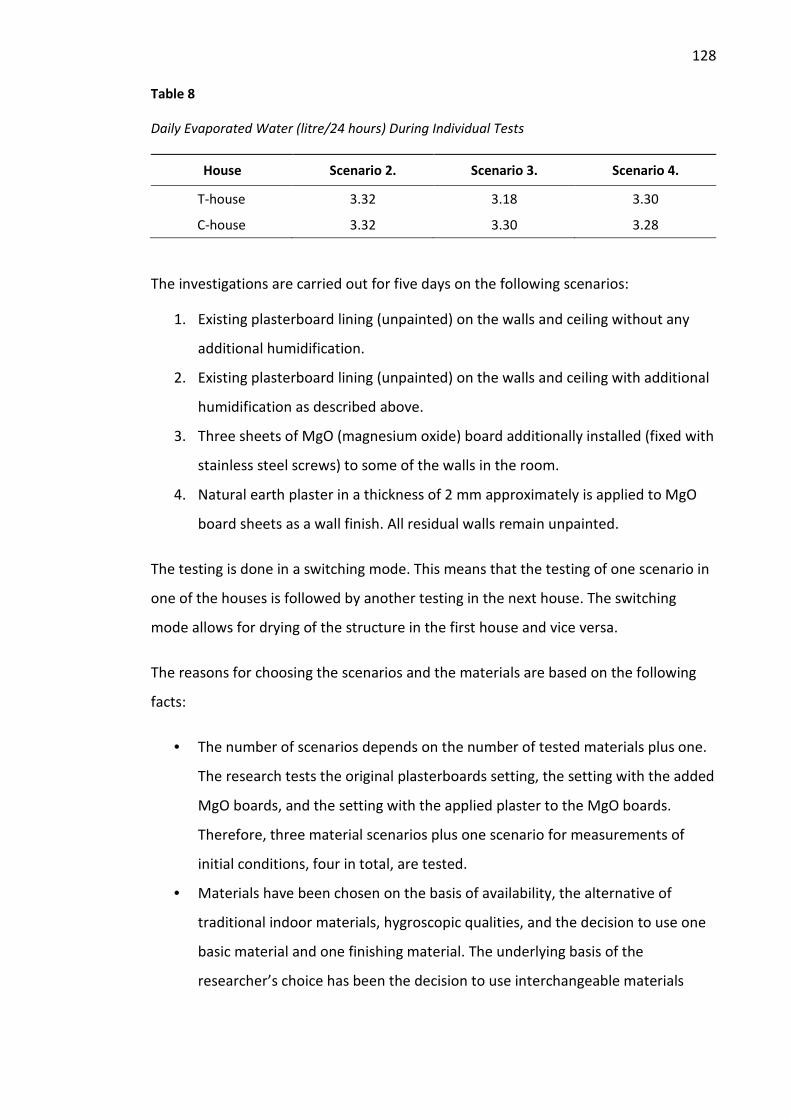
128
Table 8
Daily Evaporated Water (litre/24 hours) During Individual Tests
House Scenario 2. Scenario 3. Scenario 4.
T-house 3.32 3.18 3.30
C-house 3.32 3.30 3.28
The investigations are carried out for five days on the following scenarios:
1. Existing plasterboard lining (unpainted) on the walls and ceiling without any
additional humidification.
2. Existing plasterboard lining (unpainted) on the walls and ceiling with additional
humidification as described above.
3. Three sheets of MgO (magnesium oxide) board additionally installed (fixed with
stainless steel screws) to some of the walls in the room.
4. Natural earth plaster in a thickness of 2 mm approximately is applied to MgO
board sheets as a wall finish. All residual walls remain unpainted.
The testing is done in a switching mode. This means that the testing of one scenario in
one of the houses is followed by another testing in the next house. The switching
mode allows for drying of the structure in the first house and vice versa.
The reasons for choosing the scenarios and the materials are based on the following
facts:
• The number of scenarios depends on the number of tested materials plus one.
The research tests the original plasterboards setting, the setting with the added
MgO boards, and the setting with the applied plaster to the MgO boards.
Therefore, three material scenarios plus one scenario for measurements of
initial conditions, four in total, are tested.
• Materials have been chosen on the basis of availability, the alternative of
traditional indoor materials, hygroscopic qualities, and the decision to use one
basic material and one finishing material. The underlying basis of the
researcher’s choice has been the decision to use interchangeable materials
129
only. Consequently, the researcher intended to demonstrate the influence of
realistic indoor materials on the room humidity level.
• The number and size of the MgO sheets have been determined by practical
measures, such as the availability of suitable walls without any fittings or
openings. The owner of the houses has not permitted any alterations to the
construction. Therefore, the research was limited by the wall area, allowing for
a direct sheet’s installation without any wall variations. Additionally, the fact
that the researcher had to install the materials by herself represents another
restricting factor on the number of the installed sheets.
The complete experimental setting is shown in Figure 10.
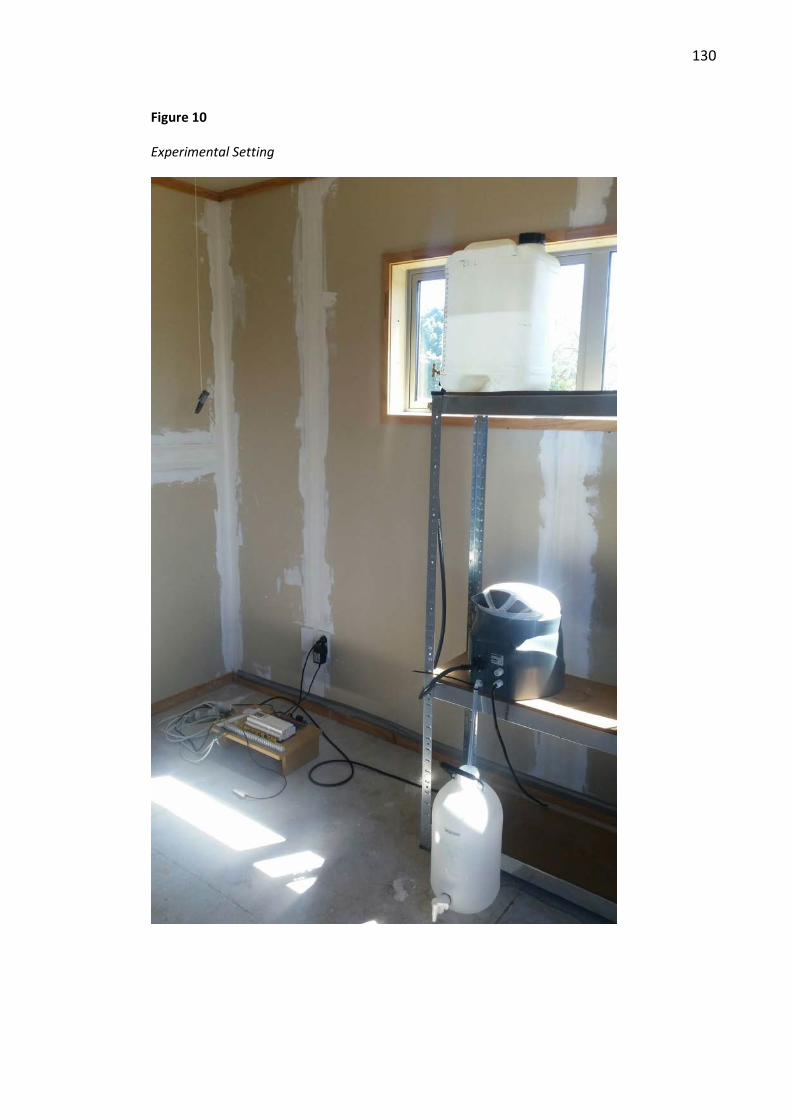
130
Figure 10
Experimental Setting
131
The settings of each scenario are as following:
1. scenario
Before the actual testing of indoor humidity development comparison data is needed.
Five days measurements of hourly indoor air temperature, RH, and dew point are
monitored by existing plasterboard lining (unpainted) on the walls and ceiling without
any additional humidification.
2. scenario
Five days measurements of hourly indoor air temperature, RH, and dew point are
monitored by existing plasterboard lining (unpainted) on the walls and ceiling by
additional humidification. The goal of this setting is to gain data about the
development of indoor RH while releasing additional humidity to the room as-built.
3. scenario
Three sheets of Magnumboard (MgO - magnesium oxide) are additionally installed
onto some of the walls in the room. One sheet on the North exterior wall, one sheet
on the East internal wall, and one sheet on the South internal wall. The area of the
MgO boards is 8.28 m² which covers 18.9% of the wall area in the room. Over five
days, additional moisture is released into the room. The goal of this setting is to
demonstrate that materials on the indoor side of walls have an influence on the level
of indoor RH.
MgO board is sheathing board used for exterior and interior sheathing. However,
under high outdoor humidity (above approximately 84%) the water droplets forming
on the surface contain soluble chloride ions that might cause serious corrosion damage
to nearby metal fixtures (Hansen et al., 2016). Therefore, the MgO boards are fixed
with stainless steel screws according to the supplier’s specifications (Health Based
Building, 2017). Nghana and Tariku (2018) showed that the moisture buffering
potential (MBP) of MgO boards may be comparable to MBP of gypsum boards.
4. scenario
Natural earth plaster in a thickness of 2mm is applied to MgO board sheets as a final
wall finish. Prior to the application of plaster, the MgO boards have been primed with
a resin diluted in water (1:5). The resin (Acrylbond) ensures the plaster’s bonding to
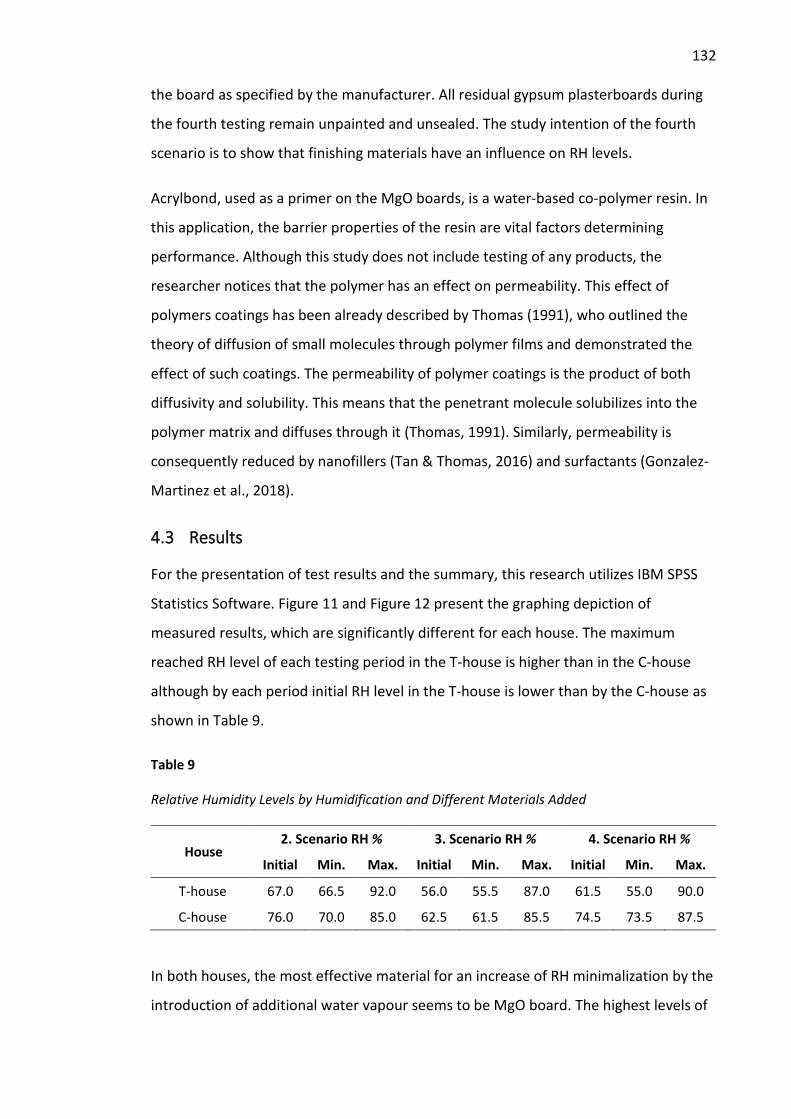
132
the board as specified by the manufacturer. All residual gypsum plasterboards during
the fourth testing remain unpainted and unsealed. The study intention of the fourth
scenario is to show that finishing materials have an influence on RH levels.
Acrylbond, used as a primer on the MgO boards, is a water-based co-polymer resin. In
this application, the barrier properties of the resin are vital factors determining
performance. Although this study does not include testing of any products, the
researcher notices that the polymer has an effect on permeability. This effect of
polymers coatings has been already described by Thomas (1991), who outlined the
theory of diffusion of small molecules through polymer films and demonstrated the
effect of such coatings. The permeability of polymer coatings is the product of both
diffusivity and solubility. This means that the penetrant molecule solubilizes into the
polymer matrix and diffuses through it (Thomas, 1991). Similarly, permeability is
consequently reduced by nanofillers (Tan & Thomas, 2016) and surfactants (Gonzalez-
Martinez et al., 2018).
4.3 Results
For the presentation of test results and the summary, this research utilizes IBM SPSS
Statistics Software. Figure 11 and Figure 12 present the graphing depiction of
measured results, which are significantly different for each house. The maximum
reached RH level of each testing period in the T-house is higher than in the C-house
although by each period initial RH level in the T-house is lower than by the C-house as
shown in Table 9.
Table 9
Relative Humidity Levels by Humidification and Different Materials Added
House 2. Scenario RH % 3. Scenario RH % 4. Scenario RH %
Initial Min. Max. Initial Min. Max. Initial Min. Max.
T-house 67.0 66.5 92.0 56.0 55.5 87.0 61.5 55.0 90.0
C-house 76.0 70.0 85.0 62.5 61.5 85.5 74.5 73.5 87.5
In both houses, the most effective material for an increase of RH minimalization by the
introduction of additional water vapour seems to be MgO board. The highest levels of
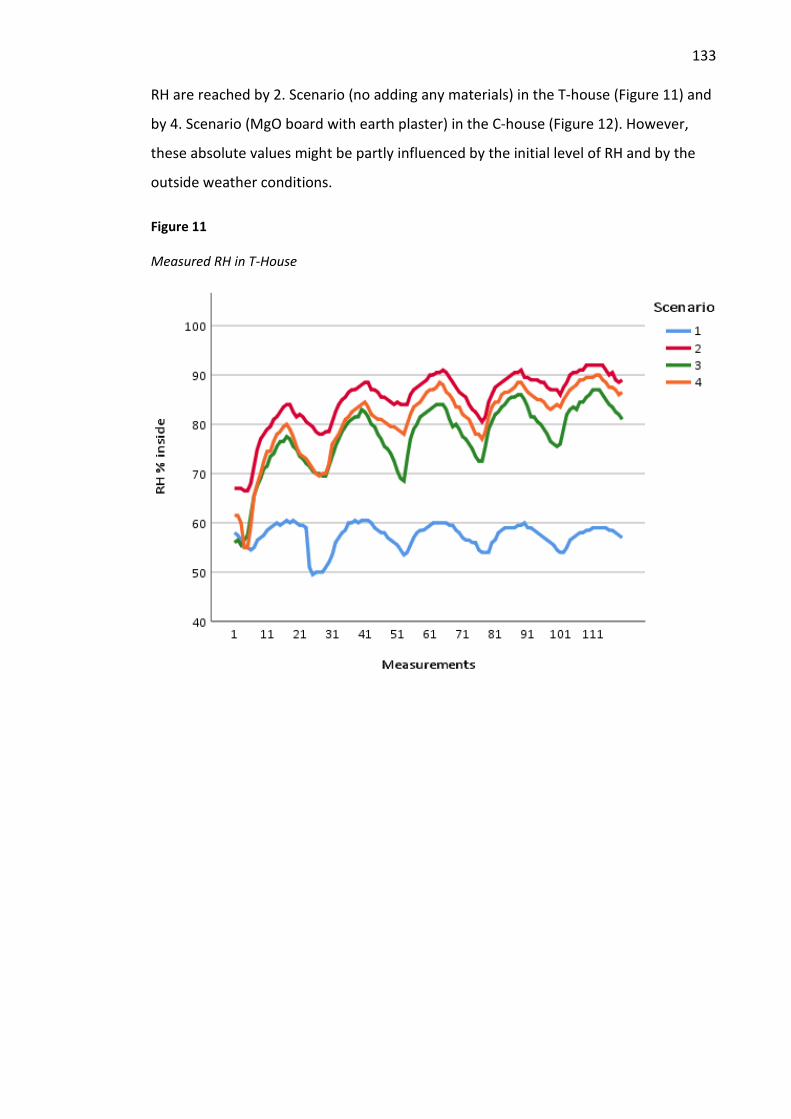
133
RH are reached by 2. Scenario (no adding any materials) in the T-house (Figure 11) and
by 4. Scenario (MgO board with earth plaster) in the C-house (Figure 12). However,
these absolute values might be partly influenced by the initial level of RH and by the
outside weather conditions.
Figure 11
Measured RH in T-House
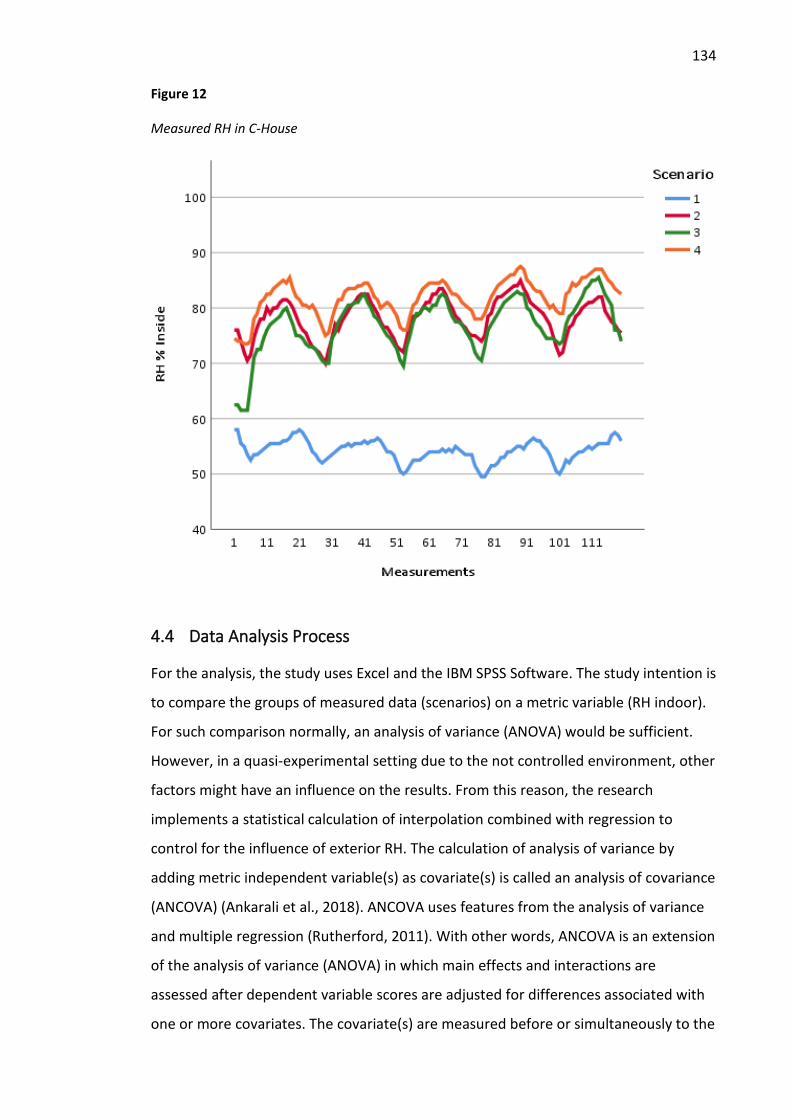
134
Figure 12
Measured RH in C-House
4.4 Data Analysis Process
For the analysis, the study uses Excel and the IBM SPSS Software. The study intention is
to compare the groups of measured data (scenarios) on a metric variable (RH indoor).
For such comparison normally, an analysis of variance (ANOVA) would be sufficient.
However, in a quasi-experimental setting due to the not controlled environment, other
factors might have an influence on the results. From this reason, the research
implements a statistical calculation of interpolation combined with regression to
control for the influence of exterior RH. The calculation of analysis of variance by
adding metric independent variable(s) as covariate(s) is called an analysis of covariance
(ANCOVA) (Ankarali et al., 2018). ANCOVA uses features from the analysis of variance
and multiple regression (Rutherford, 2011). With other words, ANCOVA is an extension
of the analysis of variance (ANOVA) in which main effects and interactions are
assessed after dependent variable scores are adjusted for differences associated with
one or more covariates. The covariate(s) are measured before or simultaneously to the
135
dependent variable and are correlated with it. Therefore, ANCOVA is a way of
controlling for initial individual differences that could not be randomized (Huitema,
2011). The focus is one of determining the effects of the independent variable on the
dependent variable adjusted for the presence of covariate(s) in the model. Due to
these characteristics, ANCOVA is often used in quasi-experimental research
(Rutherford, 2011). Purposes for implementation of ANCOVA into the data analysis
are:
• To increase the sensitivity of the test for main effects and interactions by
reducing the error term. The error term is adjusted for, and hopefully reduced
by the relationship between the dependent variable (DV) and the co-dependent
variable(s) CV(s) (Ankarali et al., 2018).
• To adjust the means on the levels of DV itself to what they would be if all
subjects scored equally on the CV(s). Differences between subjects on CV(s) are
removed so that, presumably the only differences that remain are related to
the effects of the grouping independent variable(s) IV(s). The CV(s) enhance
prediction of the DV, but there is no implication of causality (Huitema, 2011).
• The adjustments depending on the relationship between CV(s) and DV are
determined empirically from measured data (Rutherford, 2011).
From the visual analysis of measured data, the research assumes an influence of
exterior RH on reached levels of indoor RH. To prove this assumption, an analysis of
variance (ANOVA) and analysis of covariance (ANCOVA) are implemented. The
research uses exterior RH as CV to control for the possible influence of exterior
conditions on indoor RH.
4.4.1 Descriptive Statistics
The descriptive statistics include data in the form of mean, minimum RH, maximum
RH, range, and counts (number of measurements) for each scenario calculated from
the measured data. Comparing the data, the study found out that in each scenario the
values for mean RH, maximum RH and the range are lower in the C-house (Table 11)
than in the T-house (Table 10).

136
Table 10
Descriptive Statistics for Inside RH in T-House
Dependent variable: RH inside
Scenario Mean Minimum Maximum Range Counts
1. 57.367 49.5 60.5 11.0 120
2. 85.050 66.5 92.0 25.5 120
3. 77.492 55.5 87.0 31.5 120
4. 80.746 55.0 90.0 35.0 120
Table 11
Descriptive Statistics for Inside RH in C-House
Dependent variable: RH inside
Scenario Mean Minimum Maximum Range Counts
1. 54.200 49.5 58.0 8.5 120
2. 78.117 70.0 85.0 15.0 120
3. 76.746 61.5 85.5 24.0 120
4. 81.854 73.5 87.5 14.0 120
In descriptive statistics, another method for depicting groups of numerical data by
their quartiles is a box plot, as demonstrated in Figure 13 and Figure 14.
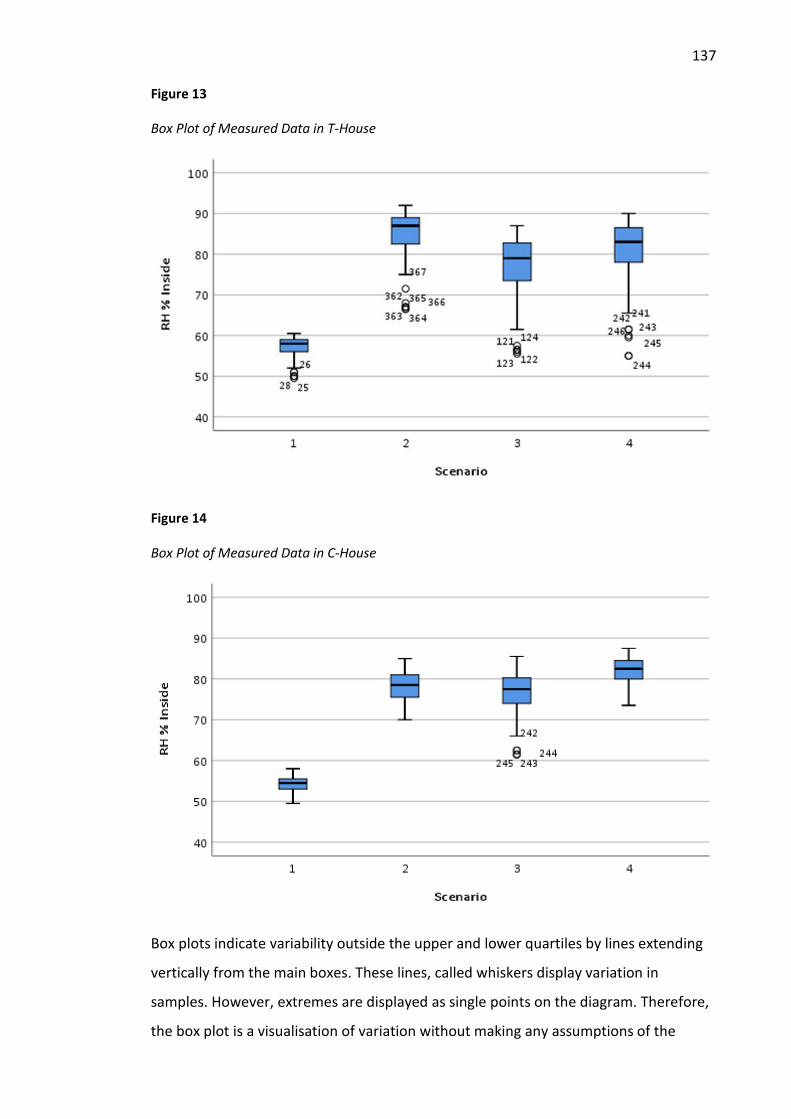
137
Figure 13
Box Plot of Measured Data in T-House
Figure 14
Box Plot of Measured Data in C-House
Box plots indicate variability outside the upper and lower quartiles by lines extending
vertically from the main boxes. These lines, called whiskers display variation in
samples. However, extremes are displayed as single points on the diagram. Therefore,
the box plot is a visualisation of variation without making any assumptions of the
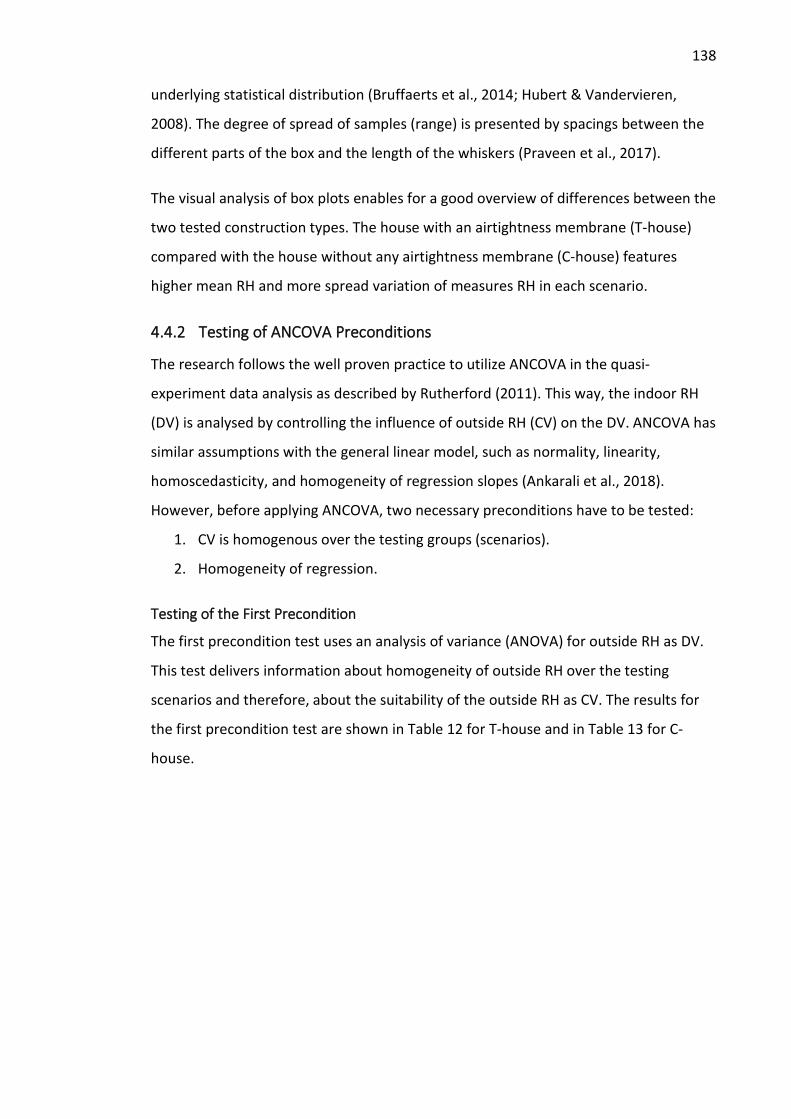
138
underlying statistical distribution (Bruffaerts et al., 2014; Hubert & Vandervieren,
2008). The degree of spread of samples (range) is presented by spacings between the
different parts of the box and the length of the whiskers (Praveen et al., 2017).
The visual analysis of box plots enables for a good overview of differences between the
two tested construction types. The house with an airtightness membrane (T-house)
compared with the house without any airtightness membrane (C-house) features
higher mean RH and more spread variation of measures RH in each scenario.
4.4.2 Testing of ANCOVA Preconditions
The research follows the well proven practice to utilize ANCOVA in the quasi-
experiment data analysis as described by Rutherford (2011). This way, the indoor RH
(DV) is analysed by controlling the influence of outside RH (CV) on the DV. ANCOVA has
similar assumptions with the general linear model, such as normality, linearity,
homoscedasticity, and homogeneity of regression slopes (Ankarali et al., 2018).
However, before applying ANCOVA, two necessary preconditions have to be tested:
1. CV is homogenous over the testing groups (scenarios).
2. Homogeneity of regression.
Testing of the First Precondition
The first precondition test uses an analysis of variance (ANOVA) for outside RH as DV.
This test delivers information about homogeneity of outside RH over the testing
scenarios and therefore, about the suitability of the outside RH as CV. The results for
the first precondition test are shown in Table 12 for T-house and in Table 13 for C-
house.
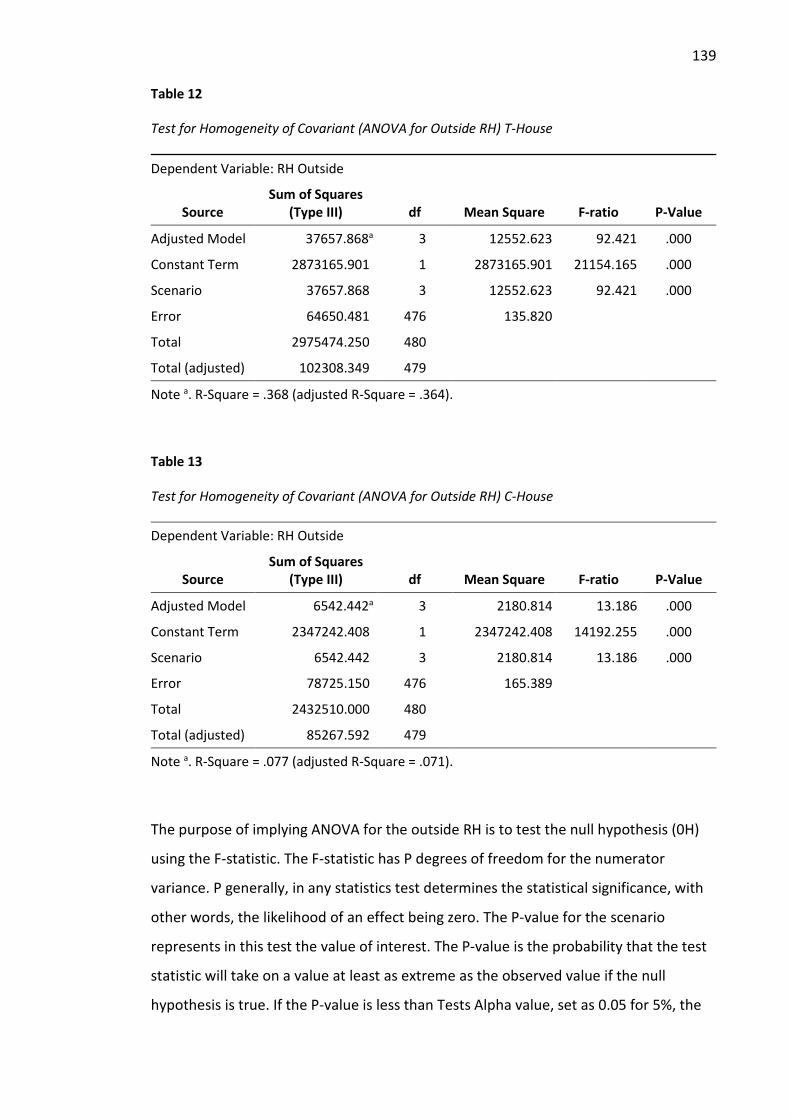
139
Table 12
Test for Homogeneity of Covariant (ANOVA for Outside RH) T-House
Dependent Variable: RH Outside
Source Sum of Squares
(Type III) df Mean Square F-ratio P-Value
Adjusted Model 37657.868a 3 12552.623 92.421 .000
Constant Term 2873165.901 1 2873165.901 21154.165 .000
Scenario 37657.868 3 12552.623 92.421 .000
Error 64650.481 476 135.820
Total 2975474.250 480
Total (adjusted) 102308.349 479
Note a. R-Square = .368 (adjusted R-Square = .364).
Table 13
Test for Homogeneity of Covariant (ANOVA for Outside RH) C-House
Dependent Variable: RH Outside
Source Sum of Squares
(Type III) df Mean Square F-ratio P-Value
Adjusted Model 6542.442a 3 2180.814 13.186 .000
Constant Term 2347242.408 1 2347242.408 14192.255 .000
Scenario 6542.442 3 2180.814 13.186 .000
Error 78725.150 476 165.389
Total 2432510.000 480
Total (adjusted) 85267.592 479
Note a. R-Square = .077 (adjusted R-Square = .071).
The purpose of implying ANOVA for the outside RH is to test the null hypothesis (0H)
using the F-statistic. The F-statistic has P degrees of freedom for the numerator
variance. P generally, in any statistics test determines the statistical significance, with
other words, the likelihood of an effect being zero. The P-value for the scenario
represents in this test the value of interest. The P-value is the probability that the test
statistic will take on a value at least as extreme as the observed value if the null
hypothesis is true. If the P-value is less than Tests Alpha value, set as 0.05 for 5%, the

140
null hypothesis is rejected. If the P-value is greater than Tests Alpha value, then the
null hypothesis is accepted.
In both cases, in T-house and C-house, the P = 0.000 which, is smaller than 0.05. This
means that the null hypothesis (0H) that no significant statistical differences in outside
RH exist is not true. Therefore the 0H is rejected. With other words, this means that
the outside, exterior RH might have an influence on the inside, indoor RH.
Testing of the Second Precondition
The second precondition tests homogeneity of regression slope. This test is done by
applying ANCOVA while determining the terms and interactions of sources. For the
purposes of this test, the research defines the scenario, RH outside, and the
interaction of scenario and outside RH as sources. To test the second precondition, the
researcher analyses results of Levene’s test of homogeneity of variances, F-Test of
heteroscedasticity, and the test of between-subjects effects.
The Levene’s Test, as shown in Table 14 and Table 15, proves the 0H that the variance
of DV errors in all groups (scenarios) remains the same. The fact that P-value for both
houses is less than 0.05 (P = 0.000) leads to a rejection of the 0H. Therefore, the
conclusion from the Levene’s test is that the variances of inside RH are not equal.
Nevertheless, as the sample sizes are absolutely equal in each scenario, the RH
variance does not need to be equal to get valid ANCOVA results.
Table 14
Levene’s Test of Homogeneity of Variances for T-House
Dependent Variable: RH Inside
Levene Statistic (F) df1 df2 P-Value
28.175 3 476 .000
Note. Design: Constant Term + Scenario + RH Outside + Scenario * RH Outside.
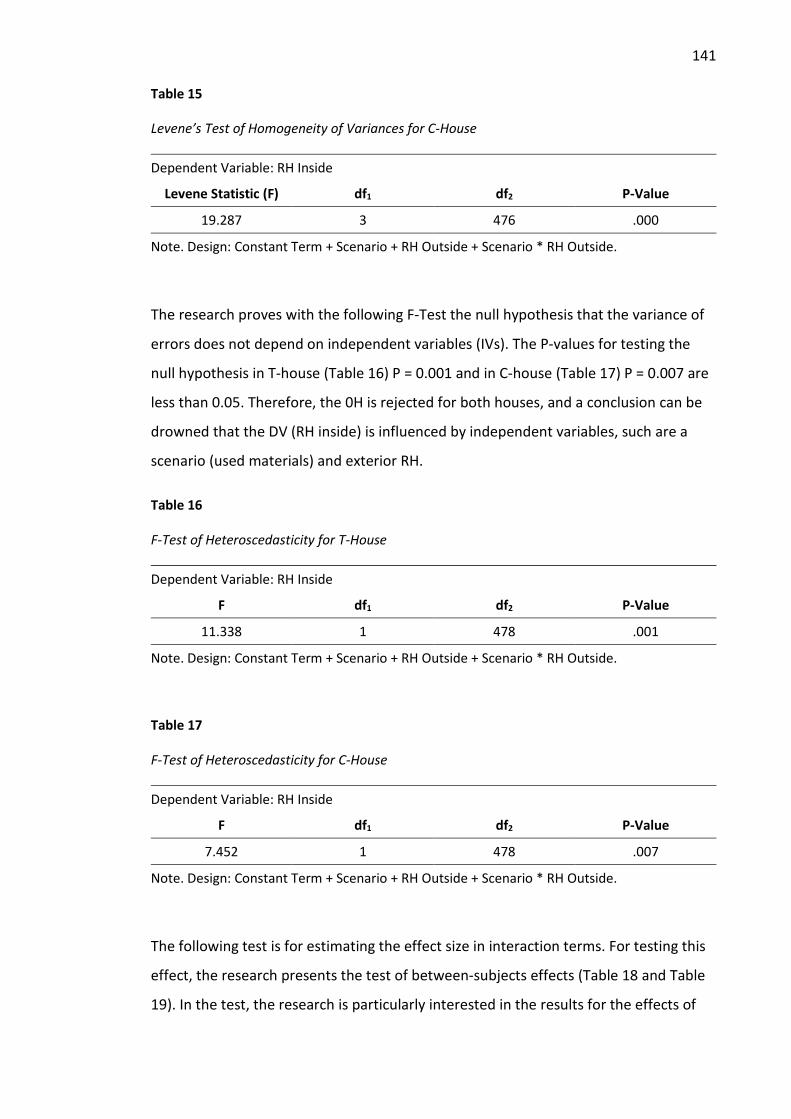
141
Table 15
Levene’s Test of Homogeneity of Variances for C-House
Dependent Variable: RH Inside
Levene Statistic (F) df1 df2 P-Value
19.287 3 476 .000
Note. Design: Constant Term + Scenario + RH Outside + Scenario * RH Outside.
The research proves with the following F-Test the null hypothesis that the variance of
errors does not depend on independent variables (IVs). The P-values for testing the
null hypothesis in T-house (Table 16) P = 0.001 and in C-house (Table 17) P = 0.007 are
less than 0.05. Therefore, the 0H is rejected for both houses, and a conclusion can be
drowned that the DV (RH inside) is influenced by independent variables, such are a
scenario (used materials) and exterior RH.
Table 16
F-Test of Heteroscedasticity for T-House
Dependent Variable: RH Inside
F df1 df2 P-Value
11.338 1 478 .001
Note. Design: Constant Term + Scenario + RH Outside + Scenario * RH Outside.
Table 17
F-Test of Heteroscedasticity for C-House
Dependent Variable: RH Inside
F df1 df2 P-Value
7.452 1 478 .007
Note. Design: Constant Term + Scenario + RH Outside + Scenario * RH Outside.
The following test is for estimating the effect size in interaction terms. For testing this
effect, the research presents the test of between-subjects effects (Table 18 and Table
19). In the test, the research is particularly interested in the results for the effects of
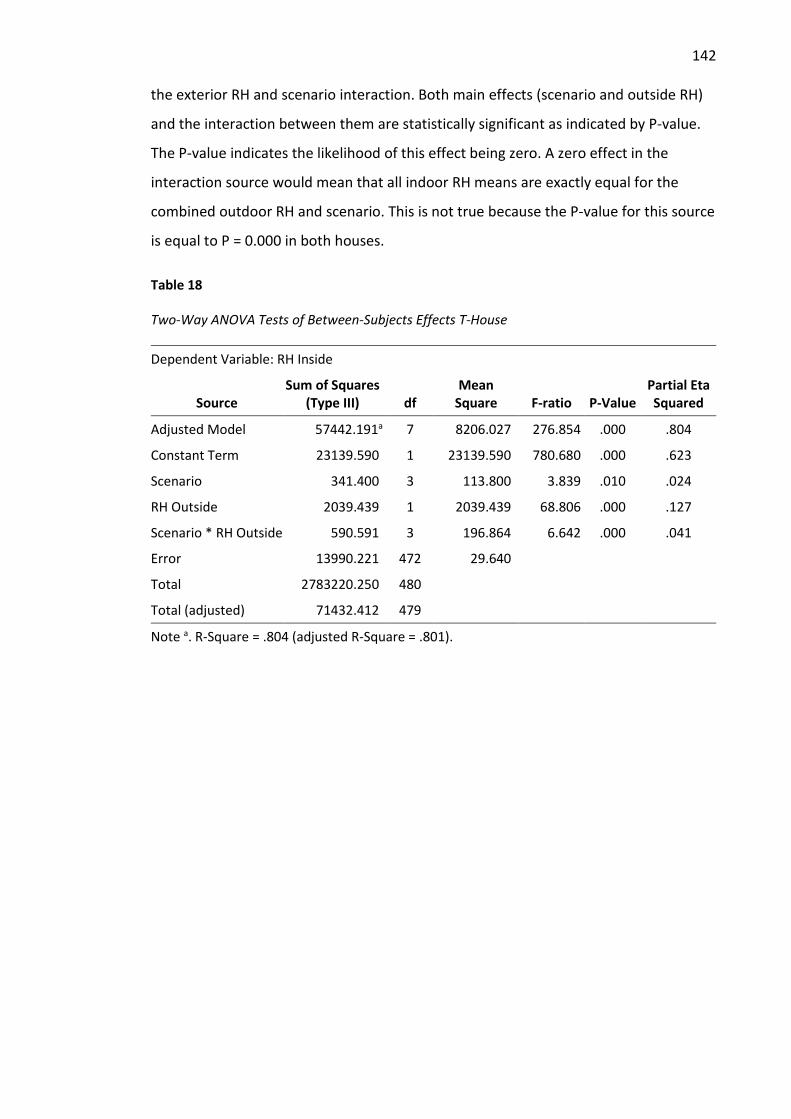
142
the exterior RH and scenario interaction. Both main effects (scenario and outside RH)
and the interaction between them are statistically significant as indicated by P-value.
The P-value indicates the likelihood of this effect being zero. A zero effect in the
interaction source would mean that all indoor RH means are exactly equal for the
combined outdoor RH and scenario. This is not true because the P-value for this source
is equal to P = 0.000 in both houses.
Table 18
Two-Way ANOVA Tests of Between-Subjects Effects T-House
Dependent Variable: RH Inside
Source Sum of Squares
(Type III) df Mean
Square F-ratio P-Value Partial Eta Squared
Adjusted Model 57442.191a 7 8206.027 276.854 .000 .804
Constant Term 23139.590 1 23139.590 780.680 .000 .623
Scenario 341.400 3 113.800 3.839 .010 .024
RH Outside 2039.439 1 2039.439 68.806 .000 .127
Scenario * RH Outside 590.591 3 196.864 6.642 .000 .041
Error 13990.221 472 29.640
Total 2783220.250 480
Total (adjusted) 71432.412 479
Note a. R-Square = .804 (adjusted R-Square = .801).
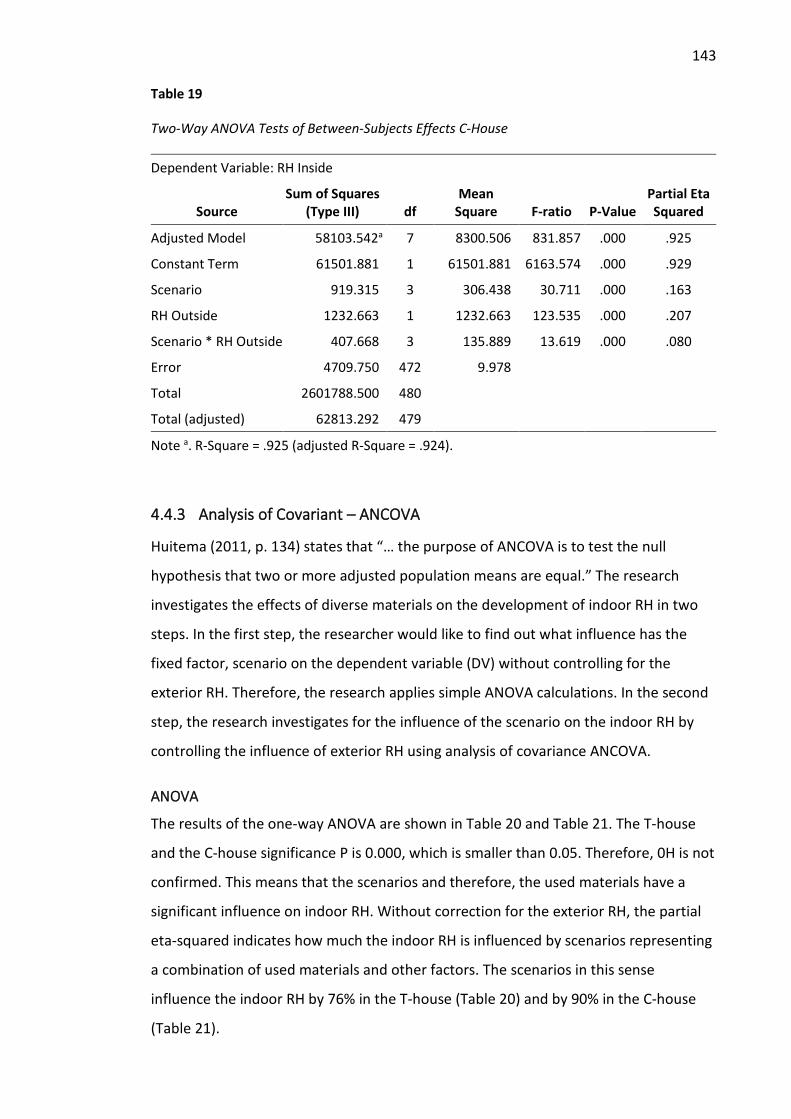
143
Table 19
Two-Way ANOVA Tests of Between-Subjects Effects C-House
Dependent Variable: RH Inside
Source Sum of Squares
(Type III) df Mean
Square F-ratio P-Value Partial Eta Squared
Adjusted Model 58103.542a 7 8300.506 831.857 .000 .925
Constant Term 61501.881 1 61501.881 6163.574 .000 .929
Scenario 919.315 3 306.438 30.711 .000 .163
RH Outside 1232.663 1 1232.663 123.535 .000 .207
Scenario * RH Outside 407.668 3 135.889 13.619 .000 .080
Error 4709.750 472 9.978
Total 2601788.500 480
Total (adjusted) 62813.292 479
Note a. R-Square = .925 (adjusted R-Square = .924).
4.4.3 Analysis of Covariant – ANCOVA
Huitema (2011, p. 134) states that “… the purpose of ANCOVA is to test the null
hypothesis that two or more adjusted population means are equal.” The research
investigates the effects of diverse materials on the development of indoor RH in two
steps. In the first step, the researcher would like to find out what influence has the
fixed factor, scenario on the dependent variable (DV) without controlling for the
exterior RH. Therefore, the research applies simple ANOVA calculations. In the second
step, the research investigates for the influence of the scenario on the indoor RH by
controlling the influence of exterior RH using analysis of covariance ANCOVA.
ANOVA
The results of the one-way ANOVA are shown in Table 20 and Table 21. The T-house
and the C-house significance P is 0.000, which is smaller than 0.05. Therefore, 0H is not
confirmed. This means that the scenarios and therefore, the used materials have a
significant influence on indoor RH. Without correction for the exterior RH, the partial
eta-squared indicates how much the indoor RH is influenced by scenarios representing
a combination of used materials and other factors. The scenarios in this sense
influence the indoor RH by 76% in the T-house (Table 20) and by 90% in the C-house
(Table 21).
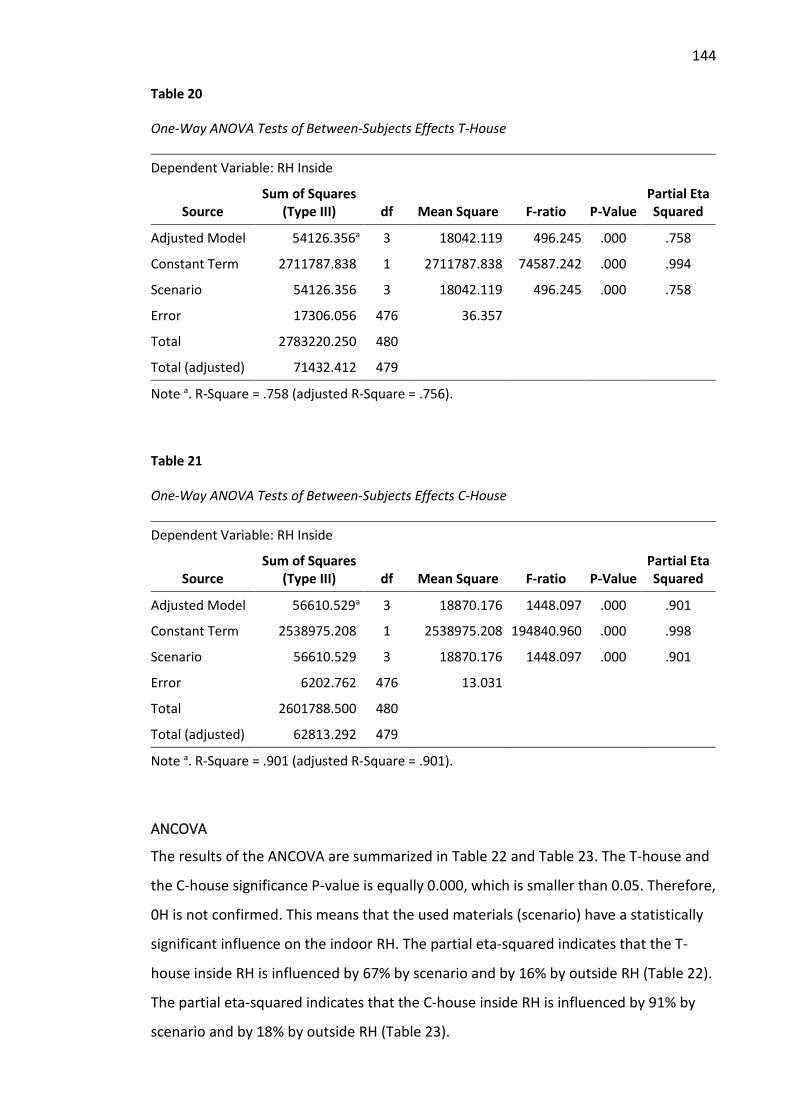
144
Table 20
One-Way ANOVA Tests of Between-Subjects Effects T-House
Dependent Variable: RH Inside
Source Sum of Squares
(Type III) df Mean Square F-ratio P-Value Partial Eta Squared
Adjusted Model 54126.356a 3 18042.119 496.245 .000 .758
Constant Term 2711787.838 1 2711787.838 74587.242 .000 .994
Scenario 54126.356 3 18042.119 496.245 .000 .758
Error 17306.056 476 36.357
Total 2783220.250 480
Total (adjusted) 71432.412 479
Note a. R-Square = .758 (adjusted R-Square = .756).
Table 21
One-Way ANOVA Tests of Between-Subjects Effects C-House
Dependent Variable: RH Inside
Source Sum of Squares
(Type III) df Mean Square F-ratio P-Value Partial Eta Squared
Adjusted Model 56610.529a 3 18870.176 1448.097 .000 .901
Constant Term 2538975.208 1 2538975.208 194840.960 .000 .998
Scenario 56610.529 3 18870.176 1448.097 .000 .901
Error 6202.762 476 13.031
Total 2601788.500 480
Total (adjusted) 62813.292 479
Note a. R-Square = .901 (adjusted R-Square = .901).
ANCOVA
The results of the ANCOVA are summarized in Table 22 and Table 23. The T-house and
the C-house significance P-value is equally 0.000, which is smaller than 0.05. Therefore,
0H is not confirmed. This means that the used materials (scenario) have a statistically
significant influence on the indoor RH. The partial eta-squared indicates that the T-
house inside RH is influenced by 67% by scenario and by 16% by outside RH (Table 22).
The partial eta-squared indicates that the C-house inside RH is influenced by 91% by
scenario and by 18% by outside RH (Table 23).
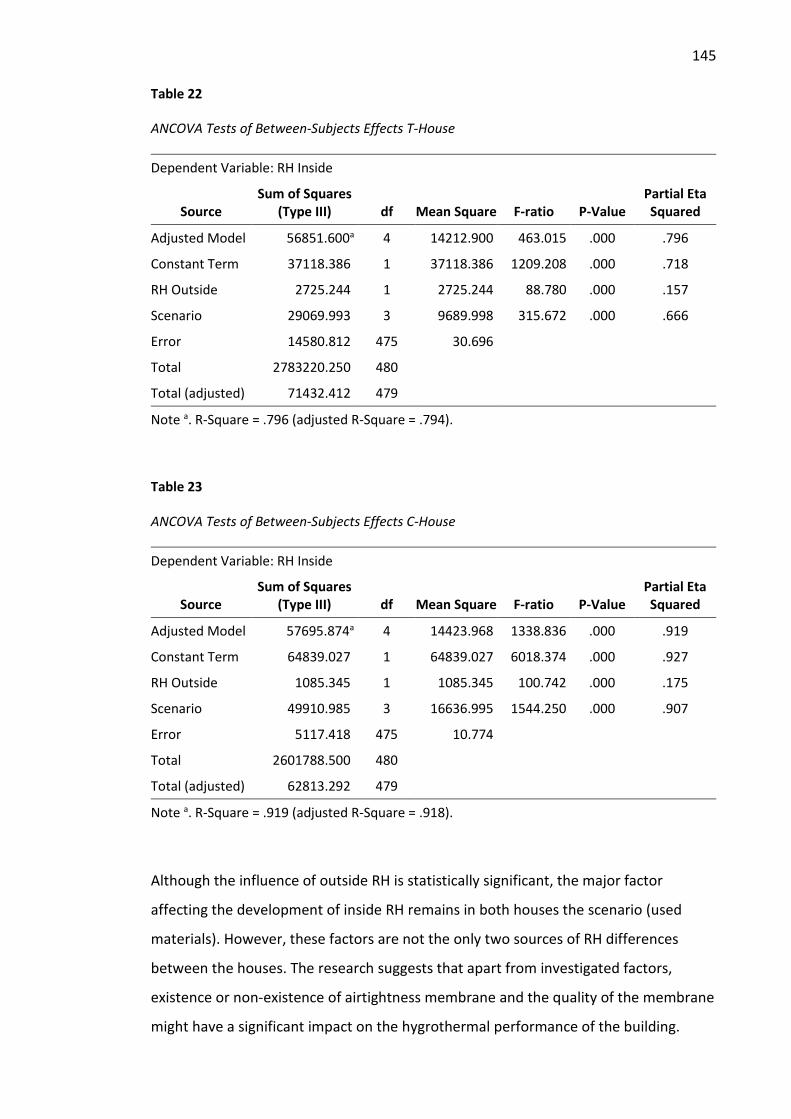
145
Table 22
ANCOVA Tests of Between-Subjects Effects T-House
Dependent Variable: RH Inside
Source Sum of Squares
(Type III) df Mean Square F-ratio P-Value Partial Eta Squared
Adjusted Model 56851.600a 4 14212.900 463.015 .000 .796
Constant Term 37118.386 1 37118.386 1209.208 .000 .718
RH Outside 2725.244 1 2725.244 88.780 .000 .157
Scenario 29069.993 3 9689.998 315.672 .000 .666
Error 14580.812 475 30.696
Total 2783220.250 480
Total (adjusted) 71432.412 479
Note a. R-Square = .796 (adjusted R-Square = .794).
Table 23
ANCOVA Tests of Between-Subjects Effects C-House
Dependent Variable: RH Inside
Source Sum of Squares
(Type III) df Mean Square F-ratio P-Value Partial Eta Squared
Adjusted Model 57695.874a 4 14423.968 1338.836 .000 .919
Constant Term 64839.027 1 64839.027 6018.374 .000 .927
RH Outside 1085.345 1 1085.345 100.742 .000 .175
Scenario 49910.985 3 16636.995 1544.250 .000 .907
Error 5117.418 475 10.774
Total 2601788.500 480
Total (adjusted) 62813.292 479
Note a. R-Square = .919 (adjusted R-Square = .918).
Although the influence of outside RH is statistically significant, the major factor
affecting the development of inside RH remains in both houses the scenario (used
materials). However, these factors are not the only two sources of RH differences
between the houses. The research suggests that apart from investigated factors,
existence or non-existence of airtightness membrane and the quality of the membrane
might have a significant impact on the hygrothermal performance of the building.
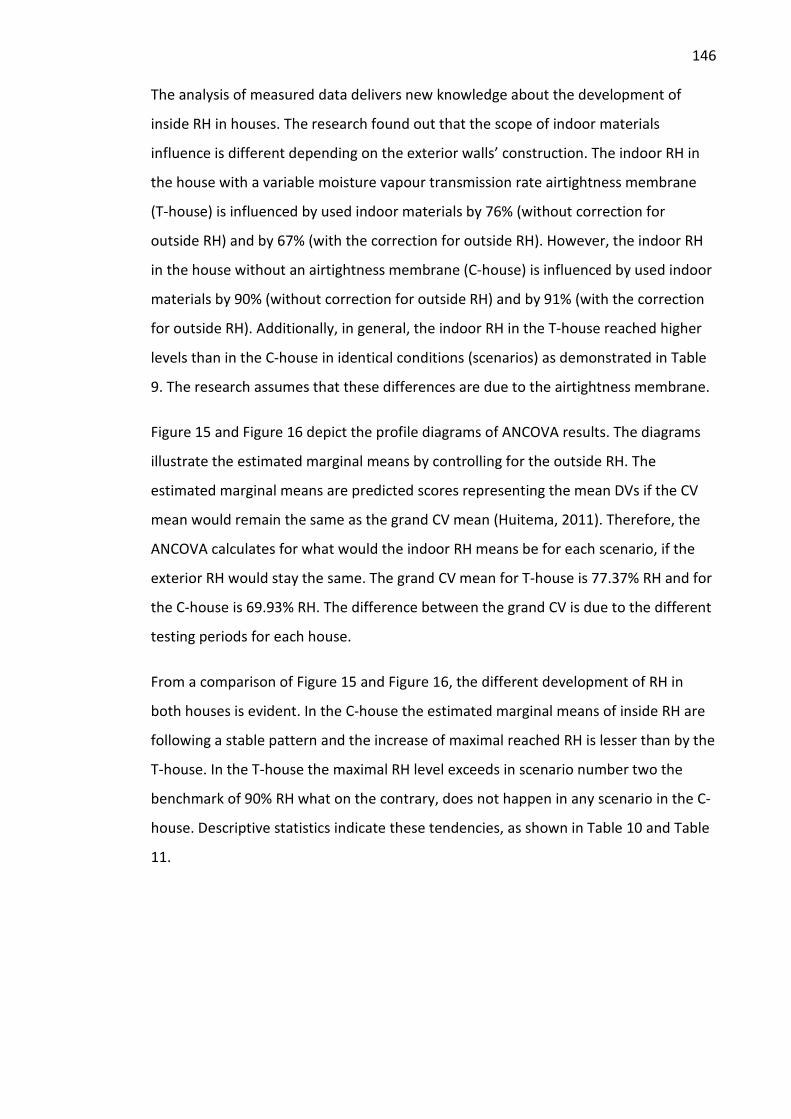
146
The analysis of measured data delivers new knowledge about the development of
inside RH in houses. The research found out that the scope of indoor materials
influence is different depending on the exterior walls’ construction. The indoor RH in
the house with a variable moisture vapour transmission rate airtightness membrane
(T-house) is influenced by used indoor materials by 76% (without correction for
outside RH) and by 67% (with the correction for outside RH). However, the indoor RH
in the house without an airtightness membrane (C-house) is influenced by used indoor
materials by 90% (without correction for outside RH) and by 91% (with the correction
for outside RH). Additionally, in general, the indoor RH in the T-house reached higher
levels than in the C-house in identical conditions (scenarios) as demonstrated in Table
9. The research assumes that these differences are due to the airtightness membrane.
Figure 15 and Figure 16 depict the profile diagrams of ANCOVA results. The diagrams
illustrate the estimated marginal means by controlling for the outside RH. The
estimated marginal means are predicted scores representing the mean DVs if the CV
mean would remain the same as the grand CV mean (Huitema, 2011). Therefore, the
ANCOVA calculates for what would the indoor RH means be for each scenario, if the
exterior RH would stay the same. The grand CV mean for T-house is 77.37% RH and for
the C-house is 69.93% RH. The difference between the grand CV is due to the different
testing periods for each house.
From a comparison of Figure 15 and Figure 16, the different development of RH in
both houses is evident. In the C-house the estimated marginal means of inside RH are
following a stable pattern and the increase of maximal reached RH is lesser than by the
T-house. In the T-house the maximal RH level exceeds in scenario number two the
benchmark of 90% RH what on the contrary, does not happen in any scenario in the C-
house. Descriptive statistics indicate these tendencies, as shown in Table 10 and Table
11.
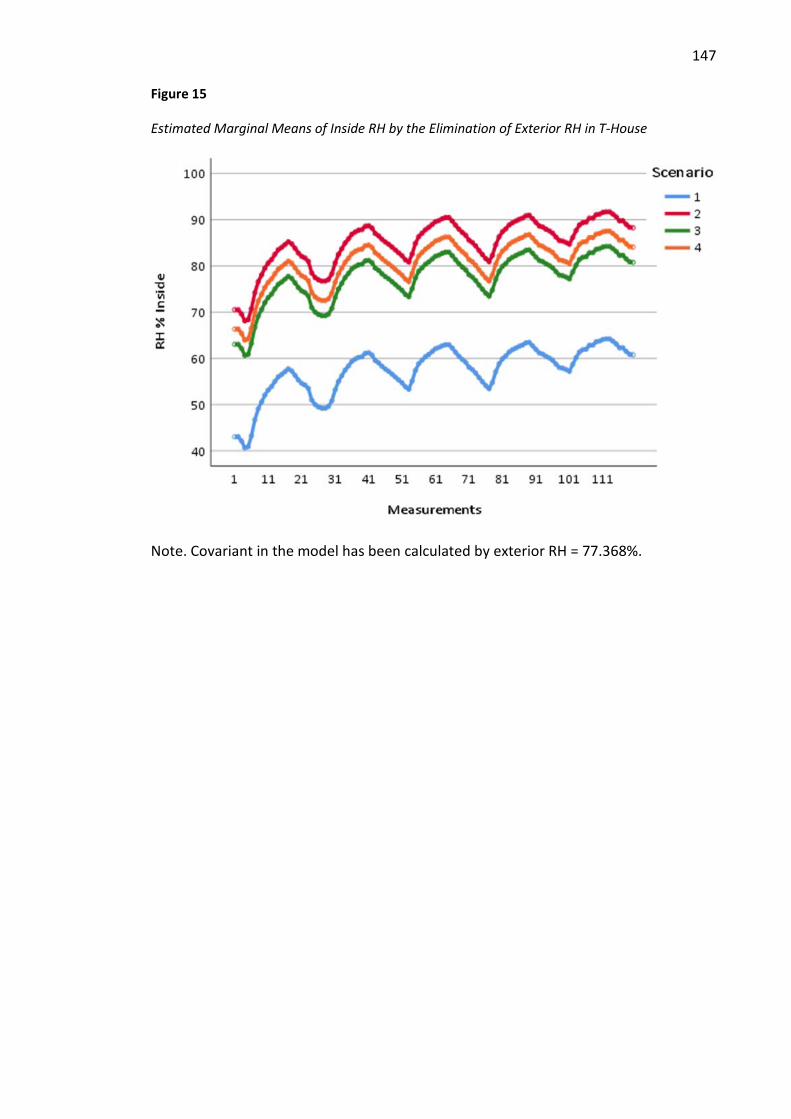
147
Figure 15
Estimated Marginal Means of Inside RH by the Elimination of Exterior RH in T-House
Note. Covariant in the model has been calculated by exterior RH = 77.368%.
148
Figure 16
Estimated Marginal Means of Inside RH by the Elimination of Exterior RH in C-House
Note. Covariant in the model has been calculated by exterior RH = 69.929%.
Comparing the analysis of measured data and the analysis of covariance, where the
influence of exterior RH development is controlled, the ranking of materials’
effectiveness stays the same. The most effective material for minimalization of
increase of RH is MgO board in both houses. The highest levels of RH are by no adding
any materials in the T-house (Figure 11 for measured data and Figure 15 for estimated
data) and by MgO board with earth plaster in the C-house (Figure 12 for measured
data and Figure 16 for estimated data).
The analysis of covariance delivers different results by the elimination of exterior
influence for each house. However, for the first scenario without any humidification
nor added materials, this study prefers to use the original data without covariance. The
reason for this decision is that the measurements are done in the same period of time
with identical exterior conditions as there is no need for the switching mode by the
testing. In the first scenario, the study observes the average RH in the C-house to be
lower (3.17 percentage points) than in the T-house. Initial RH levels are different too.
149
In C-house the initial RH is 54.8% and in T-house 56.9%. The percentage difference is
2.1 percentage points (Table 10 and Table 11). For the 5 days-period the measured
data could be described using linear regression:
T-house: y = 0.007x + 56.943
C-house: y = -0.0106x + 54.842
The negative slope of the interpolation function of the C-house data in the first
scenario is a depictive representation of drying out of the indoor space. As the first
layer of materials from inside of the house is identical by both houses, the difference is
assumed to be influenced by several factors, such as the existence of airtightness
membrane and infiltration rate. The airtightness membrane installed in the T-house is
a humidity-variable vapour control layer with a vapour resistance between an Sd of
0.25 m and 10 m according to the direction of heat flow and the RH between both
sides of the membrane (British Board of Agrément, 2015). The lower vapour resistance
in the summer allows moisture to pass through the membrane from the wall back into
the room. As the quasi-experiment proceeds during summer, this might explain the
higher RH level in the T-house by the first scenario when no additional water vapour is
introduced. Besides this feature of the membrane, the infiltration rate (natural air
movement) in the T-house is four times lower than in the C-house (see Table 25).
Although the vapour resistance of the airtightness membrane is in the time of the
experiment (summer) relatively low, the in-wall materials are still less available for
adsorption than in the C-house. The in-wall materials in the T-house are therefore,
partly blocked and the natural infiltration rate is low due to the airtightness
membrane. This would explain the higher level of reached RH (Table 10 and Table 11)
and a significantly higher slope of the interpolation functions (Table 24) in the T-house
compared to the C-house by each scenario.
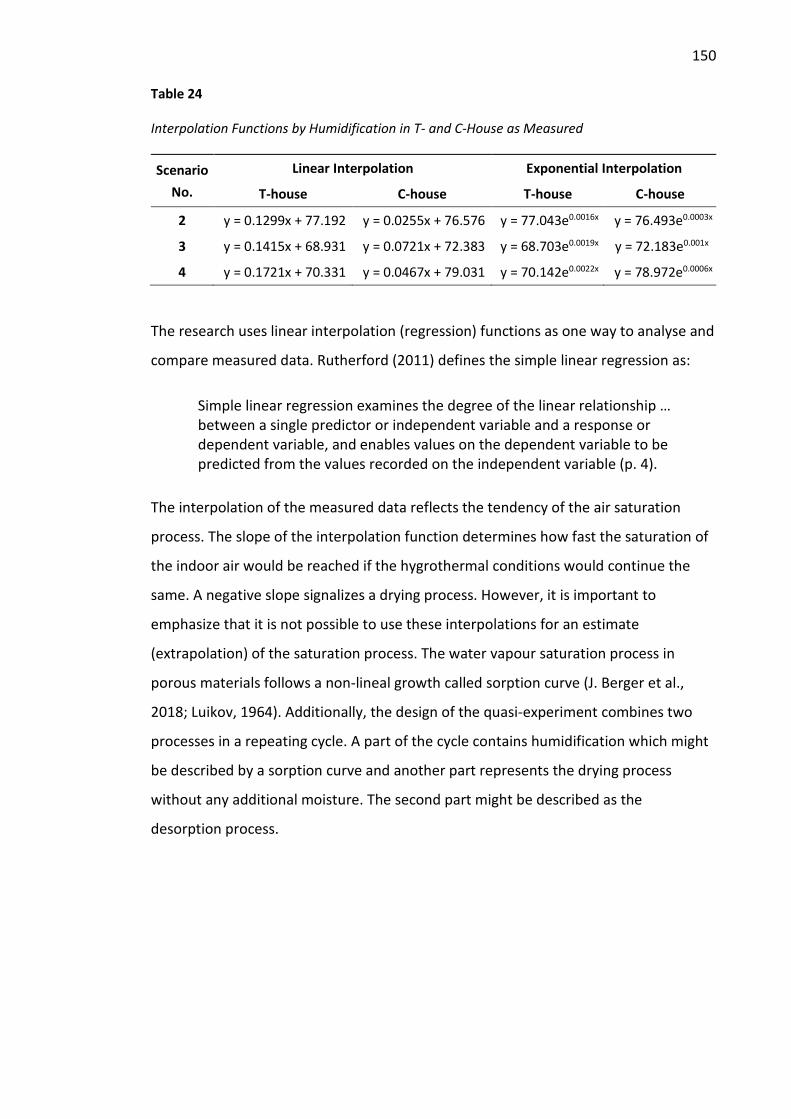
150
Table 24
Interpolation Functions by Humidification in T- and C-House as Measured
Scenario No.
Linear Interpolation Exponential Interpolation
T-house C-house T-house C-house
2 y = 0.1299x + 77.192 y = 0.0255x + 76.576 y = 77.043e0.0016x y = 76.493e0.0003x
3 y = 0.1415x + 68.931 y = 0.0721x + 72.383 y = 68.703e0.0019x y = 72.183e0.001x
4 y = 0.1721x + 70.331 y = 0.0467x + 79.031 y = 70.142e0.0022x y = 78.972e0.0006x
The research uses linear interpolation (regression) functions as one way to analyse and
compare measured data. Rutherford (2011) defines the simple linear regression as:
Simple linear regression examines the degree of the linear relationship … between a single predictor or independent variable and a response or dependent variable, and enables values on the dependent variable to be predicted from the values recorded on the independent variable (p. 4).
The interpolation of the measured data reflects the tendency of the air saturation
process. The slope of the interpolation function determines how fast the saturation of
the indoor air would be reached if the hygrothermal conditions would continue the
same. A negative slope signalizes a drying process. However, it is important to
emphasize that it is not possible to use these interpolations for an estimate
(extrapolation) of the saturation process. The water vapour saturation process in
porous materials follows a non-lineal growth called sorption curve (J. Berger et al.,
2018; Luikov, 1964). Additionally, the design of the quasi-experiment combines two
processes in a repeating cycle. A part of the cycle contains humidification which might
be described by a sorption curve and another part represents the drying process
without any additional moisture. The second part might be described as the
desorption process.

151
Figure 17
Illustration of a Sorption Curve Example
A sorption curve depicts the relation between RH and moisture content. The
development of RH for an indoor space is dependent on moisture sources and
hygroscopic qualities of sorption active surfaces of installed materials (Hens, 2012).
Measurements of sorption isotherms represent a crucial task for accurate calculations
of heat and mass transfers (Lakatos, 2014). Although every material depicts different
sorption isotherm, the sorption curve might be generally illustrated by an S-shape, as
shown in Figure 17. Therefore, the sorption curve might be replaced by a linear
regression for RH between 20% and 80% (Hens, 2017).
Consequently, for the short time of the testing, the analysis of the slope by the linear
function is sufficient. The linear interpolations show similar results to the analysis of
exponents in the exponential interpolations. Both of these characteristics signalize
how quickly the air would be saturated with water vapour until a benchmark of 80-
85% RH. However, by RH above 80%, the saturation process is non-linear and increases
very fast. The y-intercept in the linear interpolation specifies the level of humidity at
the beginning of the testing. This factor might be influenced by exterior conditions,
initial interior conditions, and by the immediate effect of moisture buffering.
Alternatively, and more accurate for the description of the development of indoor RH
by normal conditions might be an exponential interpolation of the air saturation
152
process. Exponential interpolations are often used by modelling of physical processes
(Ammar et al., 1991). The exponential functions for the first scenario are:
T-house: y = 56.834e0.0001x
C-house: y = 54.814e-2E-04x
These exponential functions and the functions for scenarios with humidification, as
shown in Table 24, are derived from measured data. This means that the potential
influence of exterior weather is not eliminated or controlled. This would explain the
extremely low exponent by the second scenario without any added material in the C-
house. The researcher notes that the testing of this scenario was done during dry and
hot weather in comparison to the other testing.
4.5 Limitations and Challenges of the Quasi-Experiment
The researcher is aware of limitations related to the accuracy of the quasi-experiment
data. Due to or coming from available technical equipment, and limitations related to
uncontrollable factors, such as weather.
The major challenge of the experiment is the equipment, its inaccuracy, and technical
malfunctions occurring during testing. In the input data on the humidification process
simulating occupancy, the study has to rely on technical equipment supplied by a
sponsor. Initially, there were two identical humidifiers. However, after a simultaneous
trial measurement in both houses, the researcher ascertained some technical
problems causing unreliable outputs. One of the humidifiers was evaporating
uncontrollable and irregular quantities of water. Therefore, it is not suitable for further
testing. As a result, the research has to change the setup of the experiment from
simultaneous to switching mode experiments. While testing one scenario in one of the
houses, the other is on hold. The consequence of the switching mode is that each test
runs under different weather conditions.
Although indoor RH is the entity of interest, the complete assessment of the
hygrothermal performance of the house/compartment inclusive in-wall RH
measurements would be required to guide design decisions. Nevertheless, the results
of the experiment have proven that even small variations of the first layer from the
153
inside have a significant influence on the hygrothermal performance of the building in
real life situations.
4.6 Conclusion and Recommendations
Every building during its whole life span has an impact on the environment. This study
shows that even small changes in material specification can engender a significant
influence on indoor air quality and therefore, on the whole ecosystem. RH in houses is
influenced by several factors. Statistical analyses in this research demonstrate that one
of those factors are materials used in the first layer from inside of the house. The study
compares maximal reached RH in different settings in two houses while simulating
occupancy. The RH increase in each setting in the T-house (with airtightness
membrane) is significantly higher than in the C-house (without membrane), although,
the initial RH levels in the T-house are lower than in the C-house (see Table 9). This is a
new finding of the research.
Estimated marginal means of inside RH by the elimination of influence of fluctuations
in exterior RH reached by simulation of the habituated house the lowest level by
adding MgO boards. The highest level of RH was reached in the T-house with its
original construction of unpainted plasterboard and in the C-house by the addition of
MgO boards with earth plaster. These results might be influenced by the different
exterior wall structure and/or by the different infiltration rate. Airtightness membrane
prevents direct water vapour transport into the exterior wall. This means that for the
moisture buffering the most available layer/s are the sorption active surfaces in direct
contact with the indoor air. These facts would explain the generally lower levels of
maximum reached RH in the C-house by each scenario. This maximum of RH can
mistakenly be interpreted as a disadvantage of the airtightness membrane. However,
without testing the drying process in exterior walls and an assessment of complete
thermal and hygrothermal house performance, this statement would not be correct.
As this study has not done any testing of the drying/wetting process inside of the walls,
the evaluation of the airtightness membrane is not a part of this research.
From the visual analysis of the development of RH, the conclusion might be drawn that
the span between maximal and minimal reached RH each day by different scenarios is
higher in the T-house than in the C-house. This fact emphasizes the need for a
154
thorough hygrothermal assessment of the construction, especially of the first layer
from inside. Air open structures need more energy for heating and cooling the indoor
due to the infiltration. This is not viable because of the energy saving needs. The
solution would be a holistic approach to the combined heat, air, and moisture (HAM)
flow already in the design process.
Acknowledging the complexity of buildings’ hygrothermal performance, it is crucial to
note that this research covers only a segment of the whole. The study evaluates the
assessment of the first layer from the inside as an essential part of the design decision
process. Other parts leading to an integrated solution of HAM flow include but are not
limited to suitable ventilation, airtightness, the orientation of the house, use of passive
solar energy, shading, passive cooling, or thermal insulation.
The quasi-experiment confirmed the hypothesis: “Materials used in the building
envelope have a significant influence on the hygrothermal performance of the
building.” From the findings, a conclusion might be derived that the materials used as
the first layer from the inside of the house might loom large in the hygrothermal
performance of the building. Therefore, the research, especially in airtight houses,
recommends a hygrothermal simulation as a vital part of the design process.
For further research, this study recommends repeating the experiment with more
precise humidifiers allowing for simultaneous tests of each scenario in both houses to
eliminate different weather conditions. However, even by such configuration of the
experiment, there would be still different weather conditions for each scenario. The
industry would also benefit from knowledge about long term complete hygrothermal
performance inclusive in-wall processes in NZ houses.
4.7 Summary
The study’s data collection and testing the hypothesis consist of two parts. The first
part, described in this chapter, comprises the experiment in the form of in-field
experiment (quasi-experiment). The second part described in Chapter 5 comprises
simulation. The quasi-experiment confirmed the hypothesis: “Materials used in the
building envelope have a significant influence on the hygrothermal performance of the
building.”
155
New knowledge brought by this study could benefit the industry and supports the
suggestion of the importance to implement hygrothermal modelling into the design of
buildings. With real house measurements, this study demonstrates the differences
between diverse materials used as the moisture buffering. This research is based on
the theory of sorption (Hens, 2017; Woods & Winkler, 2018). The findings of RH
development in real houses in New Zealand, demonstrating the influence of different
materials in diverse construction types are new knowledge.
The study investigates the difference of RH development in two identical houses with
diverse wall structures. The materials introduced to the indoor side of the walls have a
diverging influence on the indoor environment in each house. With other words, the
effect of used materials depends on each situation. A building in its functions works as
a coherent entity (system) with interconnected parts. If one part is altered or changed,
other parts are affected. Therefore, the study emphasizes the viability of hygrothermal
analysis as a part of the BIM process.
The following Chapter 5 is dedicated to the second part of data collection. The chapter
investigates the simulation of the experiment described above. Therefore, these two
chapters form a database for proving the hypothesis and demonstrating the
importance of hygrothermal modelling beyond static models of the literature
discussions.
156
Chapter 5 Modelling of the Quasi-Experiment With WUFI Plus
This chapter deals with the description of the second part of data collection and
analysis. This chapter is devoted to the simulation. After a description of heat and
moisture numerical models, particularly WUFI Plus, and simulation settings modelling
results are presented in graphical and numerical form. These results are analysed and
compared with the results of quasi-experiment addressed in Chapter 4 above. From
the analysis process, conclusions and recommendations are drawn. In the summary
section, the major findings of this chapter are outlined.
5.1 Description
As already described in the previous chapter, this research utilizes a combined model
of design using a combination of experiment and simulation for the collection of data.
This chapter deals with the simulation using hygrothermal modelling tool WUFI Plus
provided by Fraunhofer Institute, Germany.
5.1.1 WUFI Plus Settings
Heat and moisture transport in porous materials was first described in the 1950’s and
1960’s (Luikov, 1964; Philip & De Vries, 1957). Since Künzel (1994) applied the
knowledge of the heat, air and moisture (HAM) physical phenomena to building
materials, diverse hygrothermal models have been developed (Mendes et al., 2016;
Woloszyn & Rode, 2008). For instance, WUFI (IBP, 2019), HAM-Tools (Kalagasidis,
2004), Passys (Rode & Grau, 2010), and Delphin (Bauklimatik, n.d.). HAM simulation
tools are developed and used for analysis and prediction of physical processes of heat
and moisture transfers in buildings. Therefore, they serve the AEC industry in the
analysis and prevention of moisture related issues in existing and most important
future buildings (Busser et al., 2019).
WUFI Plus is a dynamic hygrothermal building simulation tool commercially available
for practitioners in the field of analysis of heat and moisture in buildings (Fraunhofer
Institute for Building Physics, n.d.-e). WUFI Plus consists of a combination of a whole
building energy calculations model and HAM transfer model (Woloszyn & Rode, 2008).
Therefore, WUFI Plus is suitable for numerical modelling and analysis of HAM
performance of the whole building or separate zones in the building. WUFI Plus is in
157
accordance with the requirements of the EU-initiated heat and moisture standards
development-project (HAMSTAD, 2000-2002). This aims to standardize HAM-modelling
procedures (Adan et al., 2004). Consequently, HAM models are engineering tools for
the analysis and optimization of the hygrothermal performance of the building
components, and, as in the case of WUFI Plus, of the whole building and its zones. In
WUFI Plus, the user can choose between SI and US-IP units for data input,
computation, and output of results. The WUFI Plus user interface itself can be switched
between the following languages: German, English, Polish, Italian, and Chinese.
Prior to the practical use of any energy and moisture analysis numerical model, the
program has to be tested. WUFI Plus is used in multiple countries. Therefore, the WUFI
Plus evaluation process involves not only German standards but American as well.
WUFI Plus validation with The Association of German Engineers (VDI) (2001) is
described by Schöpfer et al. (2010) and the evaluation with ASHRAE (2017a) by Sauer
(2011). An overview of the validation process for WUFI Plus delivers Antretter et al.
(2011). WUFI Plus, as an essential member of “WUFI family” (Figure 18), focuses on a
room and/or the whole building, including building components, interactions between
the building envelope and indoor air, and the building envelope and outer climate.

158
Figure 18
Combination of WUFI Simulation Tools
Note. Adapted from “All-in-One Design Tool Solution for Passive Houses and Buildings -
Monthly Energy Balance and Hygrothermal Simulation” (Antretter, Klingenberg, et al., 2013, p.
8).
WUFI Plus calculations account for precipitation, solar radiation, local weather data, air
exchange, window ventilation, HVAC, inner moisture loads, the orientation of walls,
and construction details. Therefore, WUFI Plus provides dynamic building energy
simulations based on realistic calculations of the transient hygrothermal behaviour of
multi-layer building components exposed to natural climate conditions. Consequently,
the calculations enable for a comfort analysis on a room by room basis as per the
requirements of ASHRAE (2017b). By these calculations, the interaction with the room
combines two components - hygrothermal with thermal.
WUFI Plus contains different calculation scopes, such as WUFI Plus, DIN 4108-2
Thermal Protection / Building Simulation, and Passive House Verification. The
switching between these calculation scopes is possible at any time while building
inputs are carried automatically from one scope to the other. The German thermal
159
protection standard DIN Standards (2013) describes verification methods, such as
thermal building simulations, to achieve thermal protection and the energy economy
in buildings (Krone et al., 2015). The part 2 of this standard defines minimum
requirements to thermal insulation in order to minimize thermal bridges or to reduce
overheating during summer (Maas et al., 2013).
WUFI Plus is a user-friendly software with built-in assistance for missing or incorrect
data (Fraunhofer Institute for Building Physics, n.d.-e). Its advantages lay in the
uniqueness of a complete analysis for thermal and hygrothermal relations.
Subsequently, WUFI Plus enables for predictions of moisture damages, indoor climate
and energy demand (Antretter, Klingenberg, et al., 2013). The energy analysis contains
an energy flow and loss evaluation, which might benefit the design optimization
process. Additional features of WUFI Plus are ventilation analysis and an option to
evaluate dampness and mould growth (Antretter et al., 2017). Therefore, WUFI Plus
simulations require detailed building envelope data and additional information, such
as internal loads, set points, ventilation, and mechanical systems. For the building data
input, WUFI Plus offers two possibilities. Building Wizard, as a part of WUFI Plus,
supports building geometry input where a pre-set basic geometry might be used.
Alternatively, the geometry import is enabled from SketchUp or gbXML (e.g., from
Revit) (Antretter et al., 2017). The additional information input is provided by “User
interface”. The subdivision of the user interface enables customized entry or built-in
databases. Consequently, realistic mechanical systems profiles and daily usage might
be simulated. Alternatively, in a situation of unknown values, pre-set standard
schedules, internal loads, and engineering system components might be used for the
simulation (Fraunhofer Institute for Building Physics, n.d.-e).
The layout of WUFI Plus is divided into 4 windows/sections: a tree structure, input
mask, 3D preview of the building, and output window as shown on a project example
in Figure 19.

160
Figure 19
WUFI Plus Tree Structure, Input Mask, 3D Preview of Building, and Output Window
The tree structure allows for the management of the project, its description, division of
the project into cases, and data files, such as measured data input. Each project’s case
is described by location/climate, building, and HVAC. Building components are
subdivided into simulation zones, attached zones, 3D-Objects, and remaining
elements. Each simulated zone is specified by visualized components, not visualized
components, thermal bridges, internal loads/occupancy, design conditions, ventilation,
and other parameters.
The input mask structure enables case specific data entry and case related results. All
components of the building require a definition of structure, material, and
environment. Each component description consists of a general description, assembly,
surface, initial conditions, numerics, and report data/results. General description of a
component informs about the name of the component, type (opaque-walls,
transparent-windows, opening-not relevant), attachment to the interior and exterior
side of the component, area, inclination, orientation, perimeter, and essential physical

161
parameters, such as U-factor and thermal resistance. The section about internal
loads/occupancy enables for periodic day profiles or use of external files with
measured data. The internal loads represent heat (divided into convective and
radiant), moisture, CO2, and human activity. The internal loads are allocated to specific
periods during the 24-hour cycle. Ventilation is determined by natural ventilation, such
as infiltration due to air leakages, mechanical ventilation, and interzone ventilation,
such as gaps under internal doors. All these features allow for a specific determination
of hygro- and thermal conditions of the building. That way, the program is well suited
for research and calculation of project alternatives.
5.1.2 The Simulation Process
This chapter describes the carefully planned series of full-scale simulations with the
goal of generating data. The data can be used for testing the hypothesis, comparison
with the field experiment results under real climatic conditions, and analysis of the
requirements for integration of HAM models into BIM. The test case in this study is
unique in its complexity, configuration, and purpose. The experimental set up, as
described in Chapter 4, represents the input into the simulation program. This study
simulates the hygrothermal processes in the compartment with real boundary
conditions reflecting the real house settings. The intention is to create a supportive
environment for using both, in-field experiment and simulation. With this combination
of methods, the research demonstrates the importance of using simulation during the
construction design process. Consequently, existing differences between the physical
qualities of materials might be purposely selected to enhance the hygrothermal
performance of the house. The simulation delivers data for both, the testing of the
hypothesis and the comparison with in-field experiment data. Therefore, the
simulation represents a vital part of the data collection.
The study chooses RH and temperature as dependent variables calculated in one-hour
intervals for consecutive 5 days (120 measurements/counts in total) for each scenario.
Independent variables consist of weather data, different materials with different
physical properties, water vapour released during every day in the 24-hour cycle, and
different type of exterior walls. Weather conditions are described by outside RH,

162
temperature, and solar radiation. For the calculation, this research uses real measured
weather data in the form of an exterior weather data file.
5.2 Experimental Settings
The experimental set-up follows the description of the quasi-experiment above.
Therefore, the simulation setting reproduces the actual situation. However, WUFI Plus
enables diverse determinations and consequent visualizations of the simulated
compartment. The tested area might be specified as a zone in the whole building or as
a compartment only. In the second option, the compartment’s boundary conditions
have to be specified accordingly (Antretter et al., 2017). Therefore, the remaining
indoor space has to be determined as not visualized attached zone with not heated
indoor conditions. After careful evaluation of the advantages and disadvantages of
these options, the researcher decided to visualize the compartment only. This option
allows for an exact specification of the location and orientation of exterior walls, area,
wall properties, ventilation, solar radiation into the room, and initial conditions. The
visualization of the tested compartment is shown in Figure 19.
The actual simulation process contains eight cases where for each of the two houses,
four scenarios are calculated. Each case consists of two simulated zones. The visualized
zone represents the tested compartment with a user-defined net volume of 46.7 m³
and floor area of 19.46 m². The not visualized zone represents the remaining indoor
space of the house with the net volume of 226 m³ and a floor area of 94.85 m². The
simulation in each case runs simultaneously for the tested compartment and for the
remaining indoor space as a “not visualized” zone. This way, the whole building
hygrothermal and thermal performance is calculated. The settings of the scenarios are
as follows:
1. Scenario
In the first scenario, the development of RH is simulated in the existing compartment
without any changes of materials or any humidification. The results are used for
comparison with the measured data and as the initial data before any changes are
made. For the same five consecutive calendar days as in the in-field experiment, the
RH and indoor temperature are simulated in the one-hour step by existing
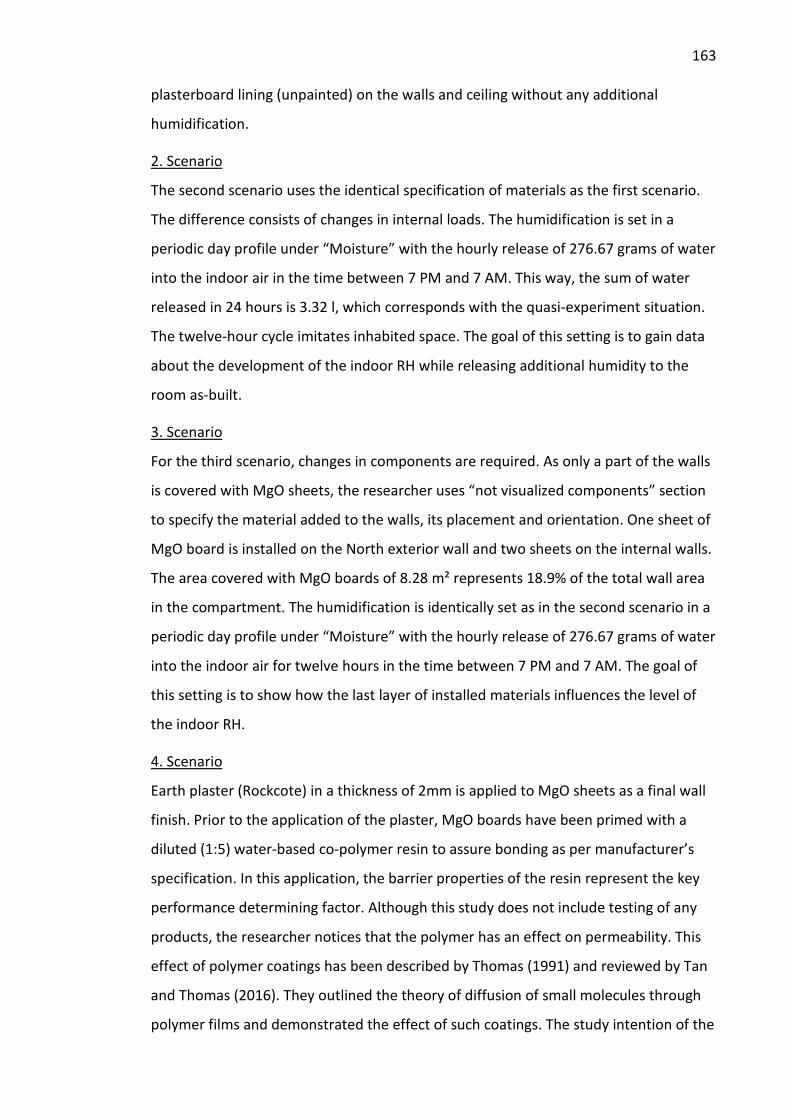
163
plasterboard lining (unpainted) on the walls and ceiling without any additional
humidification.
2. Scenario
The second scenario uses the identical specification of materials as the first scenario.
The difference consists of changes in internal loads. The humidification is set in a
periodic day profile under “Moisture” with the hourly release of 276.67 grams of water
into the indoor air in the time between 7 PM and 7 AM. This way, the sum of water
released in 24 hours is 3.32 l, which corresponds with the quasi-experiment situation.
The twelve-hour cycle imitates inhabited space. The goal of this setting is to gain data
about the development of the indoor RH while releasing additional humidity to the
room as-built.
3. Scenario
For the third scenario, changes in components are required. As only a part of the walls
is covered with MgO sheets, the researcher uses “not visualized components” section
to specify the material added to the walls, its placement and orientation. One sheet of
MgO board is installed on the North exterior wall and two sheets on the internal walls.
The area covered with MgO boards of 8.28 m² represents 18.9% of the total wall area
in the compartment. The humidification is identically set as in the second scenario in a
periodic day profile under “Moisture” with the hourly release of 276.67 grams of water
into the indoor air for twelve hours in the time between 7 PM and 7 AM. The goal of
this setting is to show how the last layer of installed materials influences the level of
the indoor RH.
4. Scenario
Earth plaster (Rockcote) in a thickness of 2mm is applied to MgO sheets as a final wall
finish. Prior to the application of the plaster, MgO boards have been primed with a
diluted (1:5) water-based co-polymer resin to assure bonding as per manufacturer’s
specification. In this application, the barrier properties of the resin represent the key
performance determining factor. Although this study does not include testing of any
products, the researcher notices that the polymer has an effect on permeability. This
effect of polymer coatings has been described by Thomas (1991) and reviewed by Tan
and Thomas (2016). They outlined the theory of diffusion of small molecules through
polymer films and demonstrated the effect of such coatings. The study intention of the
164
fourth scenario is to show that finishing materials have an influence on indoor RH
levels. Therefore, the permeability of such finishes has to be considered during the
specification process.
In order to receive correct simulation results, the detailed determination of all building
components is necessary. For this reason, WUFI Plus requires each component to be
described by the assembly, surface, and initial conditions. The assembly is specified by
homogenous layers from outside to inside where every material layer is described by
thickness, thermal resistance, heat transfer coefficient, equivalent air layer thickness
Sd, and other physical properties. The WUFI Plus assembly of homogenous layers is
shown on an example of north-facing exterior wall in Figure 20.
Figure 20
WUFI Plus Specification of Homogenous Layers in the Exterior Wall by T-House
After all homogenous layers are specified, WUFI Plus automatically calculates the total
thermal resistance and the heat transfer coefficient for the assembly. In the
simulation, the building component “Exterior wall” in the T-house has thermal
resistance 3.272 m²K/W and heat transfer coefficient (U-value) 0.291 W/m²K. In
comparison, the same component in the C-house has thermal resistance 2.973 m²K/W
and U-value 0.318 W/m²K.

165
The researcher is aware that the determination of all layers in the assembly is crucial
for the simulation. However, as no moisture dependent hygrothermal properties of
the primer nor the earth plaster are available, some adjusting decisions have to be
made. Therefore, in these layers, the study uses available data from other sources to
substitute for missing acrylic primer data. The data sources are published testing
results of water-based acrylic paints (Giosuè et al., 2017), polymers coatings (Tan &
Thomas, 2016; Thomas, 1991), and the design thermal values for materials in general
in building applications, as stated in BS EN 12524:2000 (British Standards, 2000). The
physical properties of earth plaster are replaced by the suitable physical characteristics
of similar material - clay plaster, which is provided by WUFI material data.
The next part of the settings consists of ventilation data. As mechanical ventilation is
out of order for the time of the experiment, the only air exchange sources represent
the infiltration and the interzone ventilation. The infiltration rate determines the air
flow through the exterior walls, floor, and roof space. In other words, the air exchange
through the building envelope between inside and outside. The air flow through the
building envelope measurements are provided by Blower door test. Consequently, the
research estimates the infiltration values (air change rate) from the Blower door test
results (see Appendix A). According to the recommendation of BRANZ, the natural air
change rate is possible to calculate using the following formula (McNeil et al., 2015;
Quaglia & McNeil, 2012):
ACHnat=ACH50 / 20,
Where ACHnat represents the natural air change rate and ACH50 the air change rate by
50 Pa air pressure difference, as measured in Blower door test. The results are shown
in Table 25.
Table 25
Blower Door Test Results Summary and Air Infiltration Rate Calculation
Characteristic Test House Control House
ACH50 pressurised 1.93 8.20
ACH50 depressurised 2.37 8.28
ACHnat estimation 0.1 0.4
166
5.3 Limitations and Challenges of the Simulation
Generally, model prediction of RH development using a classic diffusive model may be
devoid of accuracy, since numerical equations underestimate the nature of the
adsorption process by diverse moisture levels. Therefore, some phenomena, such as
nonequilibrium behaviour between water vapour and bound water or transport by air
convection, are neglected (Busser et al., 2019). The research results demonstrate this
limitation, primarily due to the use of hygroscopic fibrous materials, such as MgO
board and wood-based products.
The major challenge of the research represents unknown values of some data. For
example, the infiltration rate has to be set to allow for the specification of the natural
air movement between the indoor of the building and the outside air caused by
leakages. The infiltration values in the form of the natural air change rate have been
estimated as described above and shown in Table 25. Configuration of real exterior
weather data for the time of the experiment, conversion of permeance to water
vapour resistance factor, interzone ventilation rate, and material properties depict the
next challenges this research deals with.
For exterior weather data, the researcher created a new data set comprising
temperature, RH, and solar radiation. The measured weather data for the period of the
experiment have been kindly provided by Unitec. However, the data supplied in the
Excel sheet are not suitable for the WUFI calculation. WUFI’s webpage describes in
detail the weather file formats which WUFI can read (Fraunhofer Institute for Building
Physics, n.d.-a). For newly created weather data, WUFI recommends WAC format. The
WAC format is flexible with respect to the number of contained weather elements.
Thus, only weather elements which are needed for the concrete simulation are
required and therefore sufficient. Furthermore, directional weather elements, such as
radiation and rain, are automatically converted by WUFI for the orientation and
inclination of the component to be simulated.
The hygrothermal properties of the MgO boards have been provided in the form of
testing results from an independent laboratory. However, the testing results are not
directly suitable for the simulation as they are available for different board thicknesses
and in Perms only. Therefore, the research needs to proceed with a conversion

167
calculation of permeance into water vapour resistance factor µ-value (“mu-value”). For
the measures conversion, the researcher created a conversion table (Table 26) based
on BS 5250:2002 Annex E (British Standards, 2002).
Table 26
Conversion Table of Diverse Hygrothermal Measures
Measure Symbol Units Conversion to µ-value Sd-value
Vapour resistance
MNs/g − multiply by 0.2 gm/MNs
− divide by thickness of material in metres
− multiply by 0.2 gm/MNs (equivalent air layer thickness)
Vapour resistivity MNs/gm − multiply by 0.2 gm/MNs
− multiply by 0.2 gm/MNs
− multiply by thickness of material in metres
Water vapour resistance factor
µ
− multiply by thickness of material in metres
Equivalent air layer thickness
Sd m − divide by thickness of material in metres
Permeance US perm
grains/(ft²·h·inHg) − multiply by 0.0572 − reciprocate 1/result − multiply by 0.2 − divide by material
thickness in meter
− multiply by 0.0572 − reciprocate 1/result − multiply by 0.2
Permeance Metric perm
g/(m²·24h·mmHg) − multiply by 0.0968 − reciprocate 1/result − multiply by 0.2 − divide by material
thickness in meter
− multiply by 0.0968 − reciprocate 1/result − multiply by 0.2
Permeance (SI equivalent)
ng/sm2Pa − multiply by 0.001
− reciprocate 1/result − multiply by 0.2 − divide by material
thickness in meter
− multiply by 0.001 − reciprocate 1/result − multiply by 0.2
168
The laboratory test results are available for two MgO boards’ thicknesses: 3 mm and
18 mm. The samples for the testing have been derived from bigger pieces of the
material supplied by the manufacturer as representative samples. The MgO boards’
water vapour transmission has been tested in the laboratory in accordance with ASTM
E96 / E96M-05 (ASTM, 2005). The current version of the Standard Test Methods for
Water Vapor Transmission of Materials is ASTM E96 / E96M-16 (ASTM, 2016). For the
full test results, see Appendix B. Although the water vapour resistance factor µ-value is
a bulk material property, the results from the conversion of permeance for the
different board thicknesses into water vapour resistance factor are not equal. The
water vapour resistance factor µ, resulting from permeance’s conversion by 3 mm
board equals 131 and by the 18 mm board equals 57. The reason for such a significant
difference in µ-value is unknown to the researcher. Although the importer/producer of
the MgO boards states that the boards are not coated or treated, it seems that the
moisture-related hygrothermal property of the boards depends on their thickness. A
possible explanation of this phenomenon might be the different density across the
board, which is apparent from the visual examination of the boards. The increased
material density towards the front side of the MgO boards might be caused by the
nature of the boards’ production process. The boards are fabricated in a process
consisting of following procedures: forming of a mould, separating the panel from the
mould, drying of the panel, and sanding to the required board thickness. Due to this
process, the face side of the boards is denser and smoother than the back side, as
shown in Figure 21.

169
Figure 21
Magnum Board Photo Showing Both Sides of the Sheet Material
Note. The wall lining board is made from a fibre-reinforced magnesium oxide base. Reprinted
from Magnum Board Technical Information (Version 1.0, p.9), Copyright 2017 by Health Based
Building. Reprinted with permission.
As already mentioned earlier, the hygrothermal data is not available for the 9 mm
MgO board. To estimate the water vapour resistance factor µ the research uses a
natural logarithmic derivation function: µ = -41.3 ln(x) + 176.37, where x represents
the thickness of the board in millimetres (Figure 22). The calculation of the µ-value for
the 9 mm board is as follows:
µ = -41.3 ln(9) + 176.37 = 85.62

170
Figure 22
Water Vapour Resistance Factor µ-Value Extrapolation for MgO Boards
The next challenge of the simulation represents the interzone ventilation. Especially
for the scenarios with humidification, in a situation when no airflow measurements
inside of the house are available, setting up the correct interzone ventilation rate
influences the numerical outcomes. The interzone ventilation is mainly due to gaps
around the closed internal door and gaps in the internal walls between the tested
compartment and remaining indoor area. This research uses an estimate of 0.01m3/h
based on available literature (Maas, 1992; McNeil et al., 2015) and trial calculations for
the first scenario.
Another issue arises when comparing the simulation results to quasi-experiment data.
Numerical predictions often underestimate the adsorption process on one side and
overestimate the desorption process on the other side. Therefore, the simulated
moisture front rushes slower than the measured experimental moisture (Berger,
Gasparin, et al., 2017).
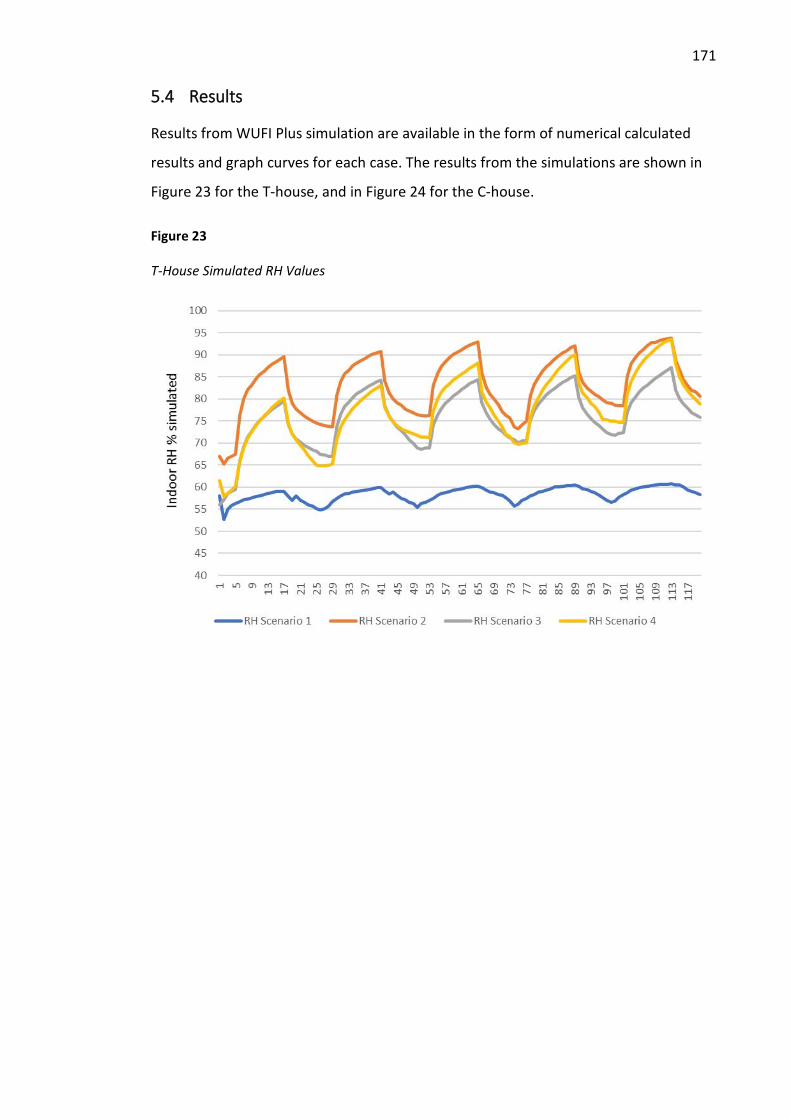
171
5.4 Results
Results from WUFI Plus simulation are available in the form of numerical calculated
results and graph curves for each case. The results from the simulations are shown in
Figure 23 for the T-house, and in Figure 24 for the C-house.
Figure 23
T-House Simulated RH Values

172
Figure 24
C-House Simulated RH Values
5.5 Analysis
The simulation results demonstrate the differences in the indoor RH levels while
testing various scenarios. For the analysis of the data, the study uses IBM SPSS
descriptive statistics.
5.5.1 Descriptive Statistics
The descriptive statistics include data in the form of mean, minimum RH, maximum
RH, range, and counts for each scenario calculated from simulated data. Comparing
the data, the study found out that in scenario number one, two, and three the values
for mean RH are lower in the C-house (Table 28) than in the T-house (Table 27). The
simulation results for scenario number four show that maximum reached RH is higher
in T-house however, the mean RH is higher in C-house.
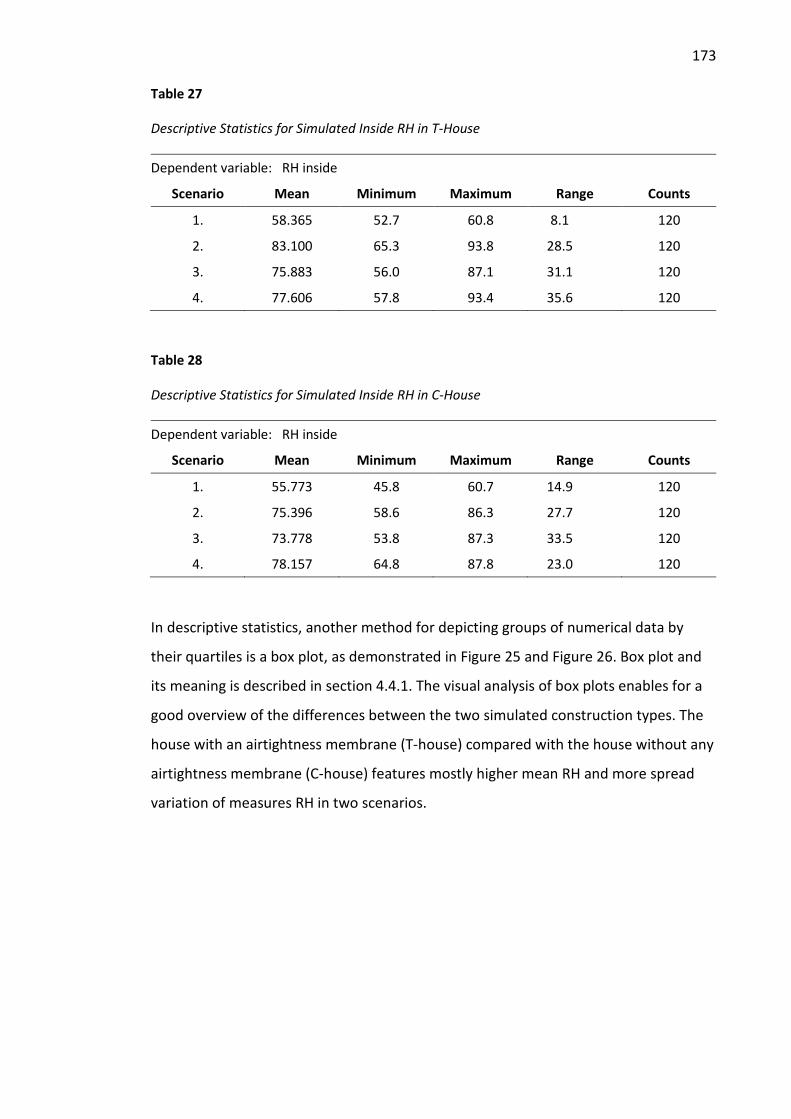
173
Table 27
Descriptive Statistics for Simulated Inside RH in T-House
Dependent variable: RH inside
Scenario Mean Minimum Maximum Range Counts
1. 58.365 52.7 60.8 8.1 120
2. 83.100 65.3 93.8 28.5 120
3. 75.883 56.0 87.1 31.1 120
4. 77.606 57.8 93.4 35.6 120
Table 28
Descriptive Statistics for Simulated Inside RH in C-House
Dependent variable: RH inside
Scenario Mean Minimum Maximum Range Counts
1. 55.773 45.8 60.7 14.9 120
2. 75.396 58.6 86.3 27.7 120
3. 73.778 53.8 87.3 33.5 120
4. 78.157 64.8 87.8 23.0 120
In descriptive statistics, another method for depicting groups of numerical data by
their quartiles is a box plot, as demonstrated in Figure 25 and Figure 26. Box plot and
its meaning is described in section 4.4.1. The visual analysis of box plots enables for a
good overview of the differences between the two simulated construction types. The
house with an airtightness membrane (T-house) compared with the house without any
airtightness membrane (C-house) features mostly higher mean RH and more spread
variation of measures RH in two scenarios.
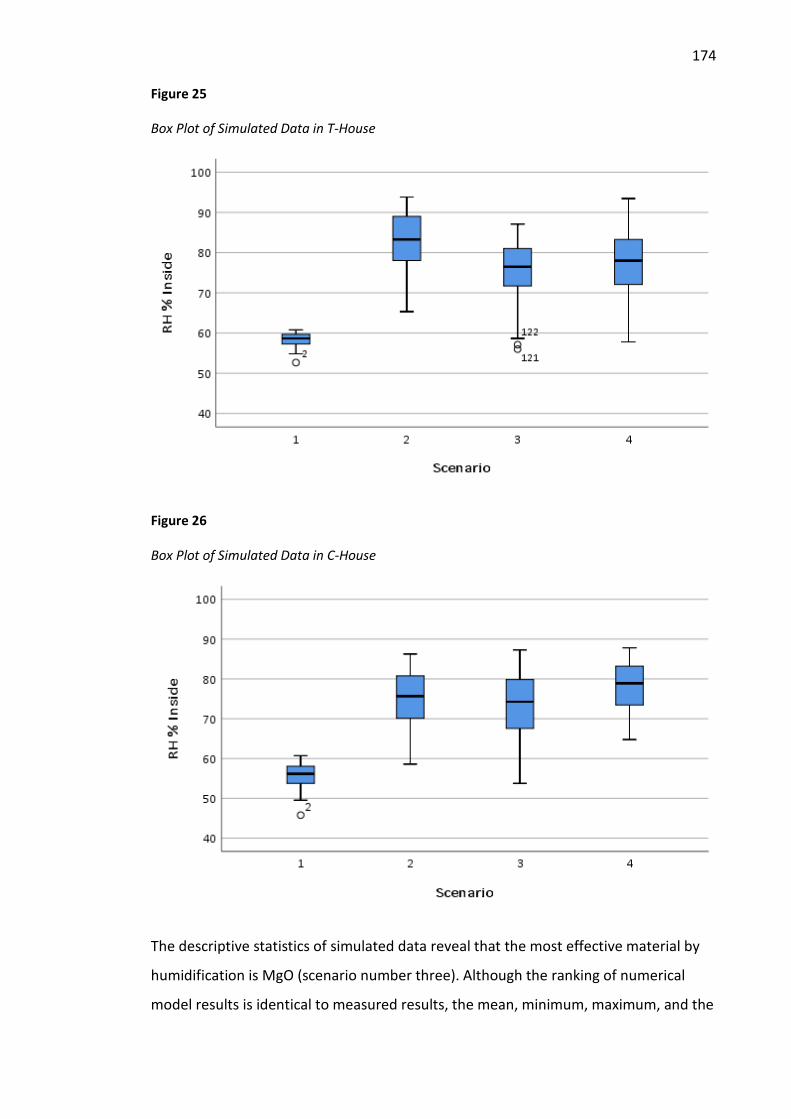
174
Figure 25
Box Plot of Simulated Data in T-House
Figure 26
Box Plot of Simulated Data in C-House
The descriptive statistics of simulated data reveal that the most effective material by
humidification is MgO (scenario number three). Although the ranking of numerical
model results is identical to measured results, the mean, minimum, maximum, and the
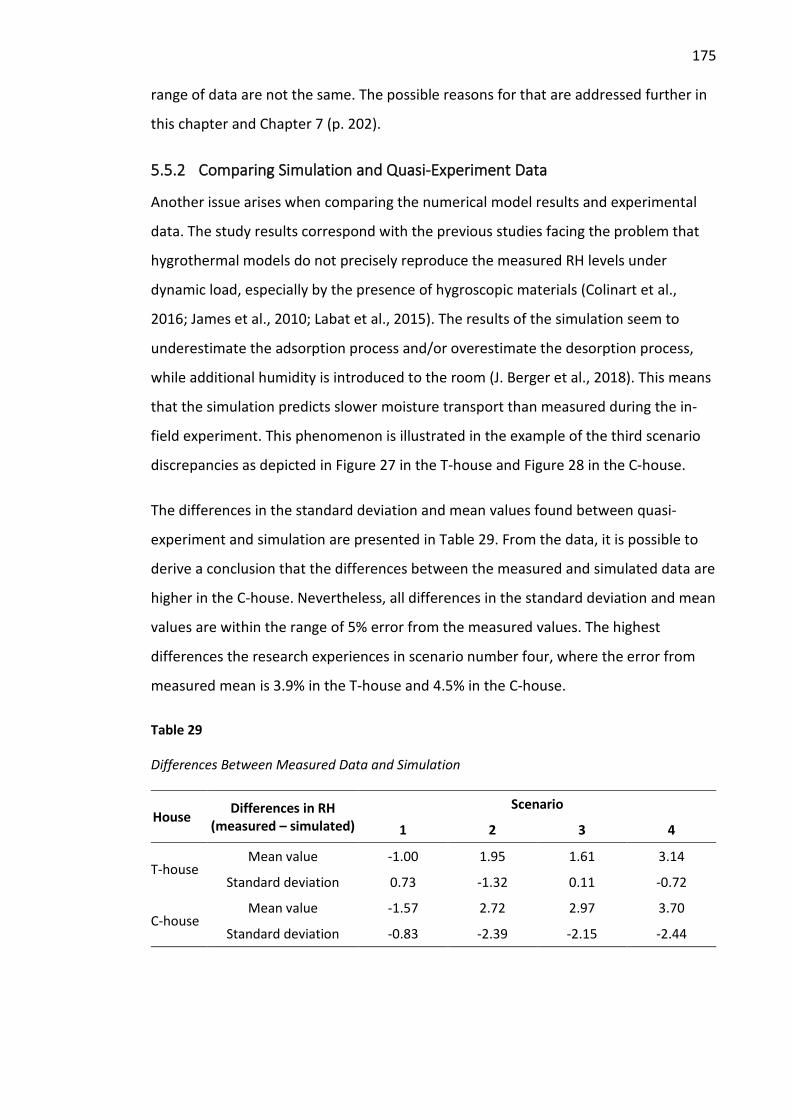
175
range of data are not the same. The possible reasons for that are addressed further in
this chapter and Chapter 7 (p. 202).
5.5.2 Comparing Simulation and Quasi-Experiment Data
Another issue arises when comparing the numerical model results and experimental
data. The study results correspond with the previous studies facing the problem that
hygrothermal models do not precisely reproduce the measured RH levels under
dynamic load, especially by the presence of hygroscopic materials (Colinart et al.,
2016; James et al., 2010; Labat et al., 2015). The results of the simulation seem to
underestimate the adsorption process and/or overestimate the desorption process,
while additional humidity is introduced to the room (J. Berger et al., 2018). This means
that the simulation predicts slower moisture transport than measured during the in-
field experiment. This phenomenon is illustrated in the example of the third scenario
discrepancies as depicted in Figure 27 in the T-house and Figure 28 in the C-house.
The differences in the standard deviation and mean values found between quasi-
experiment and simulation are presented in Table 29. From the data, it is possible to
derive a conclusion that the differences between the measured and simulated data are
higher in the C-house. Nevertheless, all differences in the standard deviation and mean
values are within the range of 5% error from the measured values. The highest
differences the research experiences in scenario number four, where the error from
measured mean is 3.9% in the T-house and 4.5% in the C-house.
Table 29
Differences Between Measured Data and Simulation
House Differences in RH (measured – simulated)
Scenario
1 2 3 4
T-house Mean value -1.00 1.95 1.61 3.14
Standard deviation 0.73 -1.32 0.11 -0.72
C-house Mean value -1.57 2.72 2.97 3.70
Standard deviation -0.83 -2.39 -2.15 -2.44
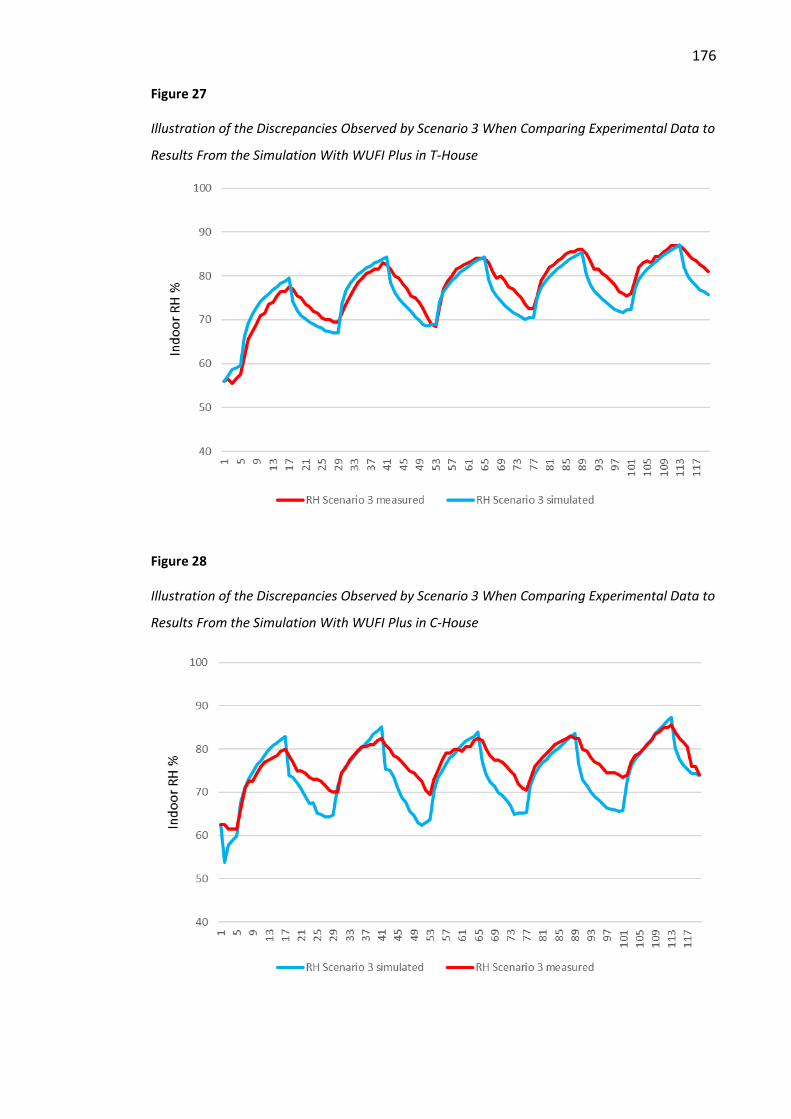
176
Figure 27
Illustration of the Discrepancies Observed by Scenario 3 When Comparing Experimental Data to
Results From the Simulation With WUFI Plus in T-House
Figure 28
Illustration of the Discrepancies Observed by Scenario 3 When Comparing Experimental Data to
Results From the Simulation With WUFI Plus in C-House
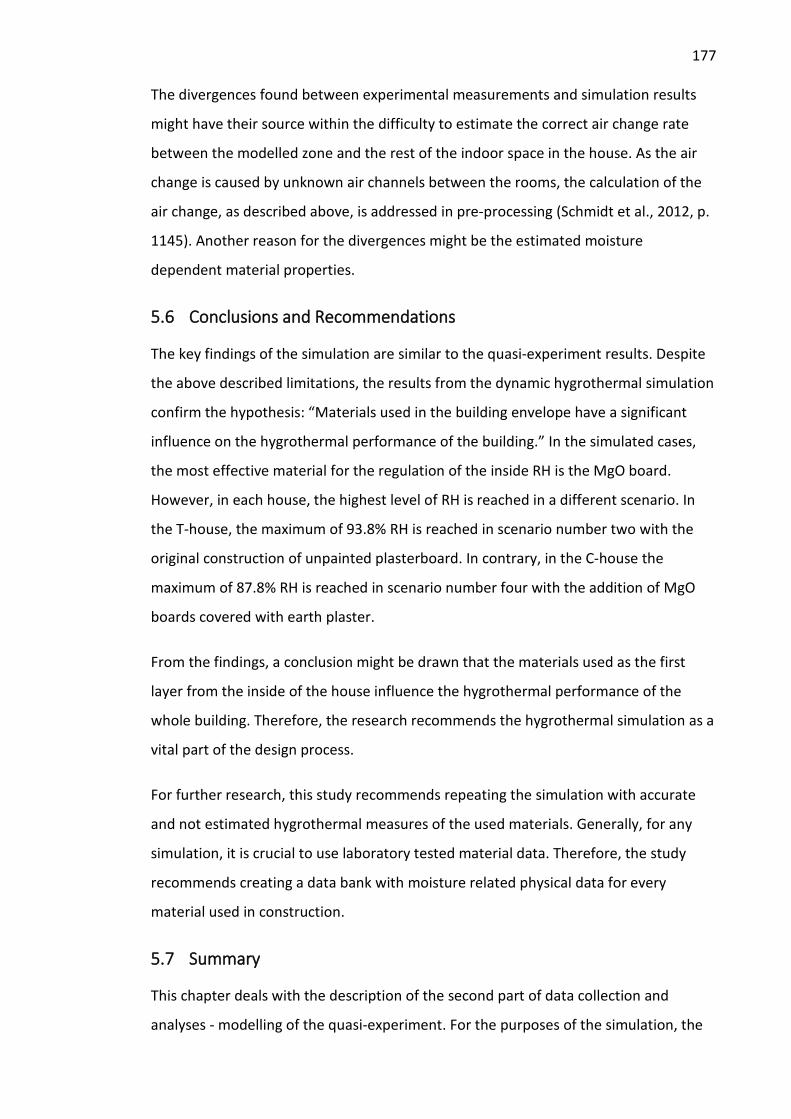
177
The divergences found between experimental measurements and simulation results
might have their source within the difficulty to estimate the correct air change rate
between the modelled zone and the rest of the indoor space in the house. As the air
change is caused by unknown air channels between the rooms, the calculation of the
air change, as described above, is addressed in pre-processing (Schmidt et al., 2012, p.
1145). Another reason for the divergences might be the estimated moisture
dependent material properties.
5.6 Conclusions and Recommendations
The key findings of the simulation are similar to the quasi-experiment results. Despite
the above described limitations, the results from the dynamic hygrothermal simulation
confirm the hypothesis: “Materials used in the building envelope have a significant
influence on the hygrothermal performance of the building.” In the simulated cases,
the most effective material for the regulation of the inside RH is the MgO board.
However, in each house, the highest level of RH is reached in a different scenario. In
the T-house, the maximum of 93.8% RH is reached in scenario number two with the
original construction of unpainted plasterboard. In contrary, in the C-house the
maximum of 87.8% RH is reached in scenario number four with the addition of MgO
boards covered with earth plaster.
From the findings, a conclusion might be drawn that the materials used as the first
layer from the inside of the house influence the hygrothermal performance of the
whole building. Therefore, the research recommends the hygrothermal simulation as a
vital part of the design process.
For further research, this study recommends repeating the simulation with accurate
and not estimated hygrothermal measures of the used materials. Generally, for any
simulation, it is crucial to use laboratory tested material data. Therefore, the study
recommends creating a data bank with moisture related physical data for every
material used in construction.
5.7 Summary
This chapter deals with the description of the second part of data collection and
analyses - modelling of the quasi-experiment. For the purposes of the simulation, the

178
study utilizes the dynamic hygrothermal building simulation tool WUFI Plus. The
simulation set-up is identical with the quasi-experiment settings. Therefore, the actual
simulation process contains eight cases where for each of the two houses, four
scenarios are calculated. The assembly of the boundary components is specified by
homogenous layers from outside to inside where every material layer is described by
thickness, thermal resistance, heat transfer coefficient, µ-value, and other physical
properties. The ventilation data represents the next vital part of the simulation
settings. As the mechanical ventilation is switched off for the time of the experiment,
the only air exchange sources consist of the infiltration and the interzone ventilation.
In both houses, the most effective material by the introduction of additional water
vapour seems to be MgO board (scenario number three). The highest levels of RH are
reached in scenario number two (unpainted plasterboard lining) in the T-house and
scenario number four (MgO board with earth plaster) in the C-house. After analysing
the simulation results, this chapter provides a comparison of the numerical model and
experimental data. Although the ranking of scenarios in the numerical model results is
identical to measured results, the mean, minimum, maximum, and the range of data
are not the same. The differences in the standard deviation and mean values found
between quasi-experiment and simulation are higher in the C-house. Nevertheless, all
differences are within the range of 5% error from the measured values.
The results of the simulation confirmed the results of the experiment. Therefore, the
study recommends the hygrothermal simulation as a suitable tool for an early
materials’ assessment and for the targeted specification of building materials. The
following chapter focuses on the incorporation of the hygrothermal simulation into
BIM. Primarily, the various possibilities of the interoperability between two virtual
tools, such as Revit and WUFI Plus, are investigated.
179
Chapter 6 Interfacing BIM With Hygrothermal Modelling
The research understands BIM as a process to achieve higher productivity in the
construction, sustainability, and quality of buildings. This chapter deals with
requirements for interoperability between architectural models and building
hygrothermal models in BIM. These requirements are based on the study of the
interoperation between BIM tools in general, modelling/simulation tools assessing the
hygrothermal performance of buildings, and on the in-field experiment. BIM and the
state-of-the-art BIM interoperability are analysed historically in Chapter 3, section 3.4.
The requirements for interfacing BIM with hygrothermal modelling in this chapter are
specifically related to Revit and WUFI Plus, as two representative tools widely used in
construction. After a description of the interoperability, the research dedicates the
next part of the chapter to an analysis of settings in Revit and material properties in
WUFI Plus, followed by the limitations and challenges of the BIM interoperability. At
the end of this chapter, the research draws conclusions and recommendations for
future research and summarizes the main findings.
6.1 Interoperability
This chapter addresses interoperability between the BIM architectural and
hygrothermal models. The online Oxford English Dictionary (n.d.) defines
interoperability in computing as “The ability of two or more computer systems or
pieces of software to exchange and subsequently make use of data.” The construction
industry implements computer-based information management and modelling at an
increasing rate. Therefore, interoperability is becoming a matter of vital concern.
“Interoperability is the fundamental characteristic of tools that are designed to work
together as part of an integrated system to complete complex tasks” (Smith & Tardif,
2009, p. 146).
The subject matter of interoperability, as already described in section 3.4.4, represents
a bottleneck in the BIM process (Ghaffarianhoseini, Tookey, et al., 2017). BIM
adoption requires an exchange of information between diverse stakeholders (Dixit et
al., 2019; Georgiadou, 2019). The inefficient data interoperability (Grilo & Jardim-
Goncalves, 2010) together with the lack of software compatibility (Sun et al., 2017),

180
and the lack of available skilled personnel (Georgiadou, 2019) are the significant risk
factors for BIM projects. These three factors and ten others are identified by Chien et
al. (2014) as critical risk factors related to the technical, management, personnel,
financial, and legal aspects of BIM adoption.
Intelligent system performance depends not only on the smart system design and
smart system lifecycle but on the interoperability of the system components from
multiple vendors (Horst et al., 2011). Therefore, measuring the interoperability failures
and risks might mitigate interoperability problems (Panetto et al., 2016).
Unfortunately, not many data on interoperability ROI (return of investment) are
available, nor unified guidance on the cost and risk uncertainty estimation (Horst et al.,
2011). For an illustration of the magnitude of the interoperability impact, information
published by the National Institute of Standards and Technology (NIST) might be used.
The cost of inadequate data interoperability in the U.S. capital facilities industry has
been estimated by NIST to be $15.8 billion per year (Gallaher et al., 2004; Sacks et al.,
2018). Additionally, besides the interoperability issues, the fast-growing field of
building simulation tools and their complexity is overwhelming to most architectural
practitioners (Attia et al., 2012; Charron et al., 2005; Georgiadou, 2019).
The specification of the interoperability requirements between BIM and hygrothermal
modelling forms one of the four research objectives described in section 1.4. The first
research objective is to examine the hygrothermal performance of New Zealand
housing construction, focusing on internal envelope materials. The second research
objective is to identify the challenges associated with undertaking effective
hygrothermal assessments during the early design stage of housing in New Zealand.
The third research objective, relevant to this chapter, is to specify requirements for
integration of hygrothermal simulation into BIM to improve building sustainability. The
fourth research objective is to develop a framework for designers to provide warmer,
drier, and healthier houses for the New Zealand context.
BIM, as a process, is a set of operations for constructing the digital building model
using BIM tools. Consequently, the BIM tools are object-based parametric models with
a set of properties. These properties are usually set to a minimal default level allowing
for an extension. The extensions provided by users or an application, enable a specific
181
type of simulation, analysis, data exchange, or interoperability of information (Sacks et
al., 2018). The current BIM generation tools are well suited for cost estimation, life
cycle management (Sacks et al., 2018), and some of them for energy analysis (Treeck
et al., 2018) and lighting (Mendes & Mendes, 2019). To suit the requirements for
interoperability, properties may be adjusted/added for diverse sets of applications.
One way for specifying the material properties is to use object libraries for predefining
properties (NATSPEC and Masterspec, 2018). However, the researcher notices that the
predefined properties, although being convenient to use, might not be suitable for
some hygrothermal assessments. Therefore, the second option, the addition of
properties by the user while creating the design model (Busser et al., 2019) allows for
project-specific data adjustments. This corresponds with the IFC model approach. IFC
define material characteristics in two ways: as static attributes within the schema and
as dynamic properties. The dynamically created properties in the form of subclasses of
IFC-Property can be defined and added freely without limitations on their number
(Borrmann, Beetz, et al., 2018). Another option for enhancement of interoperability
represents an automatic assignment of properties during the exportation to a
simulation tool (Sacks et al., 2018).
Although theoretical requirements for interoperability are well-known, the practical
application of using BIM generated models for more specialized functions is still not an
easy task. For example, the environmental analysis (Kent & Becerik-Gerber, 2010;
Motawa & Carter, 2013) and the structural analysis (Lee et al., 2012) face many
challenges. Similarly, analysis of building thermal performance (Gao et al., 2019;
Negendahl, 2015; Schlueter & Thesseling, 2009) or hygrothermal performance. These
challenges are generated by the reliability of the technology, cost-related issues, cyber
security, client demand, and organizational culture in the AEC industry (Georgiadou,
2019; Ghaffarianhoseini, Tookey, et al., 2017; Lu et al., 2017; Migilinskas et al., 2013;
Oduyemi et al., 2017). The reasons for this might be a high initial investment for
software and staff training representing a financial risk for the company (Chien et al.,
2014; Georgiadou, 2019). Other reasons might be the factual lack of software
compatibility (Migilinskas et al., 2013; Porwal & Hewage, 2013), or lack of interest in
long-term gains due to typical AEC industry contracts (Zheng et al., 2019). The
182
significance of the financial barrier of the BIM adoption is reported from 51 per cent of
UK organizations participating in the National BIM Report (NBS, 2019).
A deeper analysis of these reasons reveals that most of the hindrances to
interoperation are due to the stakeholders’ prevailing interest in short-term
investment returns only and no client demand on BIM (Georgiadou, 2019; Zheng et al.,
2019). Nevertheless, a successful enhancement of interoperability in BIM requires a
driving force, especially from stakeholders. Similar to environmental issues, the
behaviour is not rectified until an actual need for action has been developed due to
severe climate changes (Travers, 2019). Consequently, in today’s financially driven
world, people need to realize what impact a low-quality building has on, but not
limited to, living costs, health, and environment (Child Poverty Action Group, 2015; De
Groot & Leardini, 2010; Stats NZ, 2019; Yarbrough et al., 2019).
With the growing requirements for sustainability, CAD (computer-aided design) is no
longer sufficient because necessary building performance evaluation warrants the
additional time, personal input, and costs (The British Standards Institution, 2018). BIM
has the potential for automation of such processes and therefore, for contribution to
sustainable design (Autodesk, 2006). As a significant participant in the total world
energy consumption, the AEC industry needs to follow sustainability requirements
(Bomberg et al., 2016). Therefore, this research recommends an adaptation of a
holistic approach to the construction process. BIM can contribute to economic, social,
and environmental sustainability parameters in many ways. Through enabling
specialized examinations, such as energy modelling, daylight analysis, or life cycle
assessment (Dastbaz et al., 2017).
Interoperability in BIM enables direct use of physical material properties in simulation
and diverse analyses of buildings during the design process (Borrmann, König, et al.,
2018). Therefore, the relevant physical properties and the capability of their
modification constitute a part of BIM. However, this research found out that the
moisture related hygrothermal material properties are often missing. Although WUFI
offers product libraries (Fraunhofer Institute for Building Physics, n.d.-b), many
building products and their physical data are not available. This situation makes the
simulation process challenging. The results might not reproduce the current project
183
situation due to incorrect or insufficient material data. Coherent product libraries and
sharing structured product data represent crucial stipulations of continuous processes
in the AEC industry. Open BIM formats offer a solution to the requirements of the
better workflow. However, the existing proprietary data formats or viewable data
formats in PDF are often not suitable for the automatic data-flow (Palos et al., 2014).
Additionally, this research found out that the data formats often comprise non-
consistent naming of physical properties, attributes, or non-unified value range.
Product libraries very seldom consist of IFC-compatible library objects as defined in ISO
16739-1:2018 (ISO, 2018b). This means that the data can only be used with software
accepting their formats (Palos et al., 2014). The lack of data conformity hinders a
broader application of analytical and simulation tools in the construction industry.
Another hindrance in interfacing BIM with hygrothermal simulation exists in the
requirements for simplification of BIM data to envelopes and zones (Antretter et al.,
2017). Current WUFI Plus hygrothermal simulation tool supports building geometry
input by a built-in Building Wizard, or by geometry import from SketchUp or gbXML
(e.g., from Revit) (Fraunhofer Institute for Building Physics, n.d.-e). The Green Building
XML schema (gbXML) allows disparate 3D BIM models and engineering analysis
software to share information. “XML, eXtensible Markup Language, is a type of text-
friendly computer language that allows software programs to communicate
information with little to no human interaction” (gbXML, n.d.).
According to the WUFI Plus 3.1 Manual “… gbXML-files can be imported with an
external program, found in the Tools-folder of the WUFI Plus main installation folder”
(Antretter et al., 2017, p. 97). However, the researcher’s attempt to transfer the 3D
model of the test houses from AutoCAD Architecture into WUFI Plus, using gbXML
format was not successful. Therefore, the researcher entered the geometry of the
building, its orientation, and used materials in WUFI Plus manually. This process is very
time consuming and requires extensive knowledge of the software and material
properties. Consequently, the researcher examined “Software List - Software Tools
That Integrate With gbXML” (gbXML, 2019). The list of BIM authoring and analysis
software tools that integrate with gbXML confirms that the listed software successfully
imports or exports gbXML. However, this research found out that AUTODESK Revit and
AutoCAD software are on the software list, but WUFI Plus is not.

184
Based on the study of IFC standard (Borrmann, Beetz, et al., 2018), presupposition for
interoperability between the building and hygrothermal model would be an
implementation of the basic entity of the properties, such as IfcPropertySingleValue
with identical attributes in both models. To this static value can be dynamically added
by the placeholder entity IfcProxy semantic extensions for hygrothermal analysis. This
way, the building model would incorporate independent hygrothermal property value
sets. Each IfcPropertySingleValue would have allocated nominal value and unit.
However, the suggested (from this research) implementations need to be provided by
software vendors. Therefore, the proposed changes are possible in a cooperation
between software providers only.
Another option for interoperability between Revit and WUFI Plus might be an
integration of the hygrothermal simulation in Revit using an Application Programming
Interface (API) platform. The general areas where the API is suitable are stated in Table
30 based on Autodesk (n.d.-c).
Table 30
The General Areas Where the API is Suitable in Autodesk Revit
Add-ins improving Revit Add-ins improving interoperability
To automate repetitive tasks in the user interface.
To extract project data for analysis and to generate reports.
To enforce project design standards by checking for errors automatically.
To import external data for creating new elements or parameter values.
To create Revit project documentation automatically.
To integrate other applications, including analysis applications, into Revit products.
As programming skills are required to use the API effectively, this research
concentrates on the setting of parameters needed for the interoperation of Revit and
WUFI Plus only. Functionality through external applications might be added to Revit in
the form of an Add-In (Autodesk, n.d.-a). However, the research only makes
suggestions for further research or programming without testing the feasibility of such
applications. Integrating WUFI Plus analysis application as an Add-In into Revit would
enable to run the hygrothermal analysis automatically as a part of the optimization
process during the early design stage.
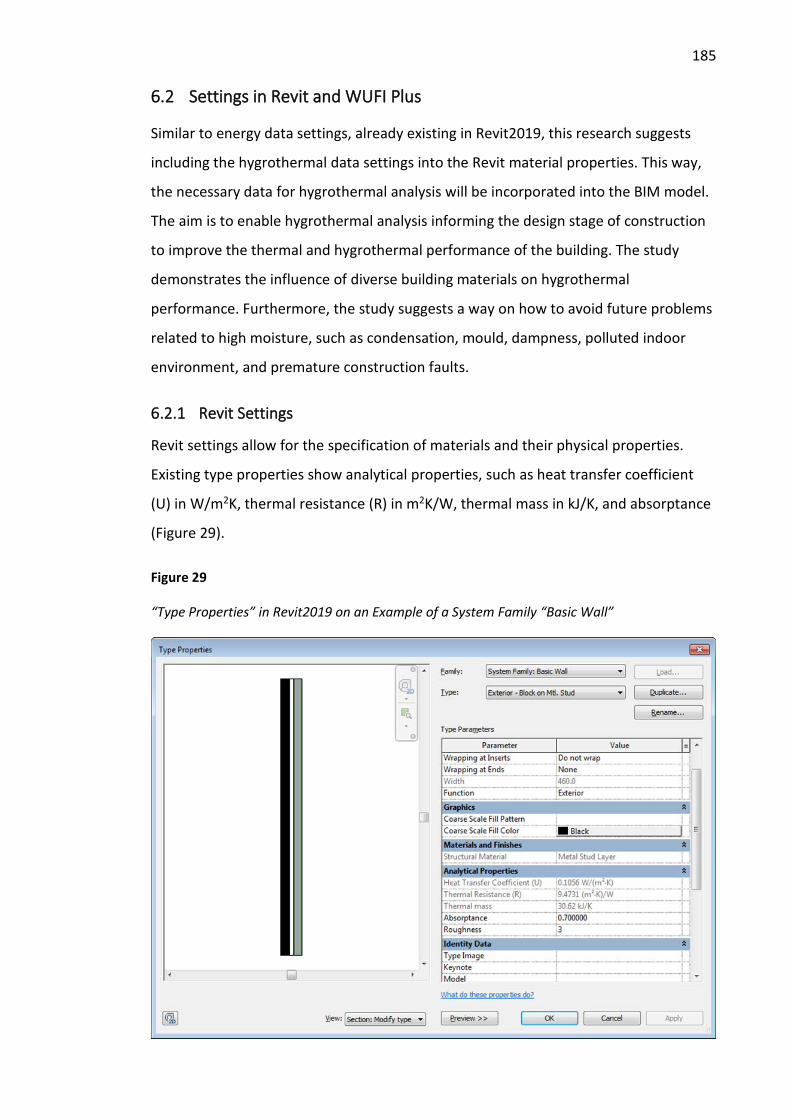
185
6.2 Settings in Revit and WUFI Plus
Similar to energy data settings, already existing in Revit2019, this research suggests
including the hygrothermal data settings into the Revit material properties. This way,
the necessary data for hygrothermal analysis will be incorporated into the BIM model.
The aim is to enable hygrothermal analysis informing the design stage of construction
to improve the thermal and hygrothermal performance of the building. The study
demonstrates the influence of diverse building materials on hygrothermal
performance. Furthermore, the study suggests a way on how to avoid future problems
related to high moisture, such as condensation, mould, dampness, polluted indoor
environment, and premature construction faults.
6.2.1 Revit Settings
Revit settings allow for the specification of materials and their physical properties.
Existing type properties show analytical properties, such as heat transfer coefficient
(U) in W/m2K, thermal resistance (R) in m2K/W, thermal mass in kJ/K, and absorptance
(Figure 29).
Figure 29
“Type Properties” in Revit2019 on an Example of a System Family “Basic Wall”
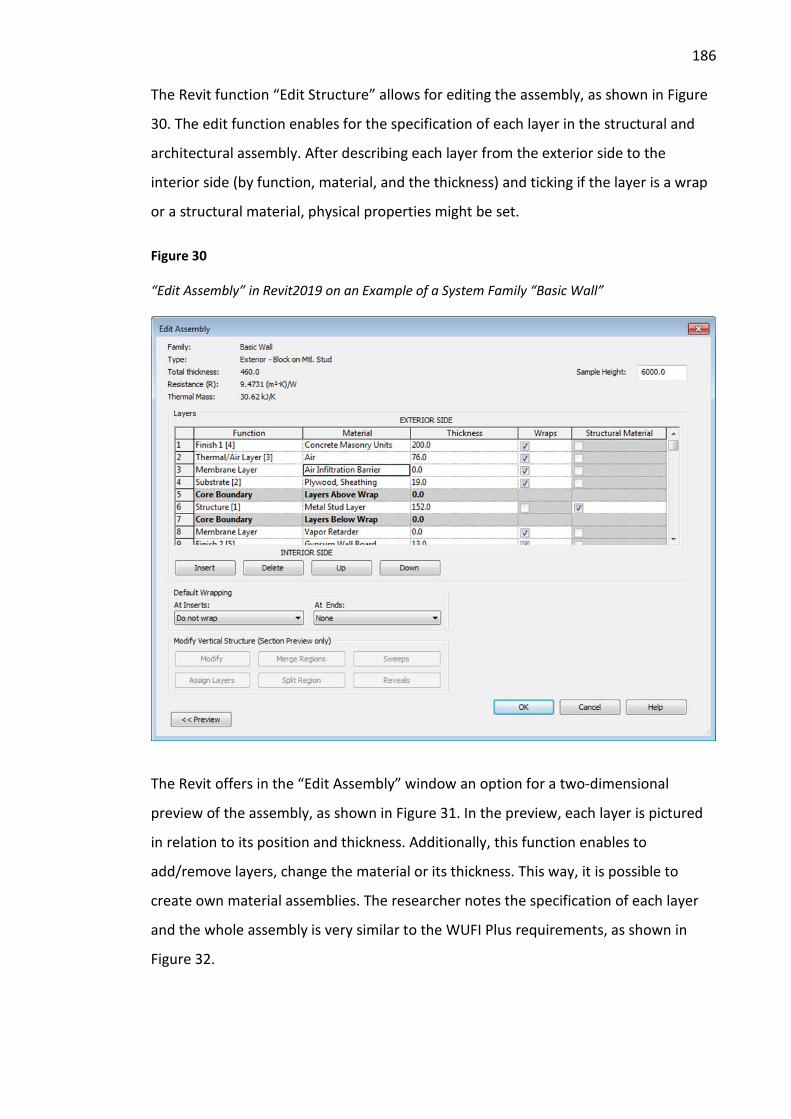
186
The Revit function “Edit Structure” allows for editing the assembly, as shown in Figure
30. The edit function enables for the specification of each layer in the structural and
architectural assembly. After describing each layer from the exterior side to the
interior side (by function, material, and the thickness) and ticking if the layer is a wrap
or a structural material, physical properties might be set.
Figure 30
“Edit Assembly” in Revit2019 on an Example of a System Family “Basic Wall”
The Revit offers in the “Edit Assembly” window an option for a two-dimensional
preview of the assembly, as shown in Figure 31. In the preview, each layer is pictured
in relation to its position and thickness. Additionally, this function enables to
add/remove layers, change the material or its thickness. This way, it is possible to
create own material assemblies. The researcher notes the specification of each layer
and the whole assembly is very similar to the WUFI Plus requirements, as shown in
Figure 32.

187
Figure 31
“Edit Assembly” With a Preview in Revit2019 on an Example of a System Family “Basic Wall”
Figure 32
“Assigning Assembly” in WUFI Plus on an Example of an Exterior Wall
The allocation of materials in Revit during the design stage of the project occurs in an
interface, where all the material properties are set. In the “Material Browser” menu, it
is possible to identify each material, describe its graphic and appearance, plus most
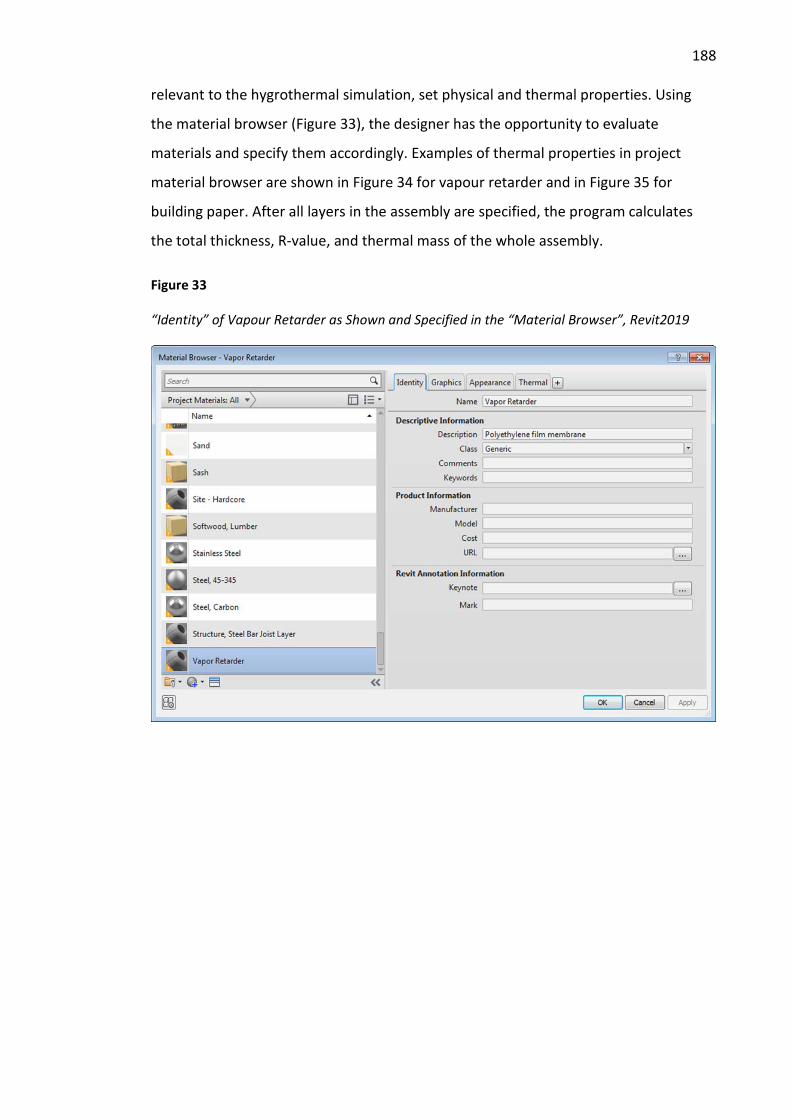
188
relevant to the hygrothermal simulation, set physical and thermal properties. Using
the material browser (Figure 33), the designer has the opportunity to evaluate
materials and specify them accordingly. Examples of thermal properties in project
material browser are shown in Figure 34 for vapour retarder and in Figure 35 for
building paper. After all layers in the assembly are specified, the program calculates
the total thickness, R-value, and thermal mass of the whole assembly.
Figure 33
“Identity” of Vapour Retarder as Shown and Specified in the “Material Browser”, Revit2019
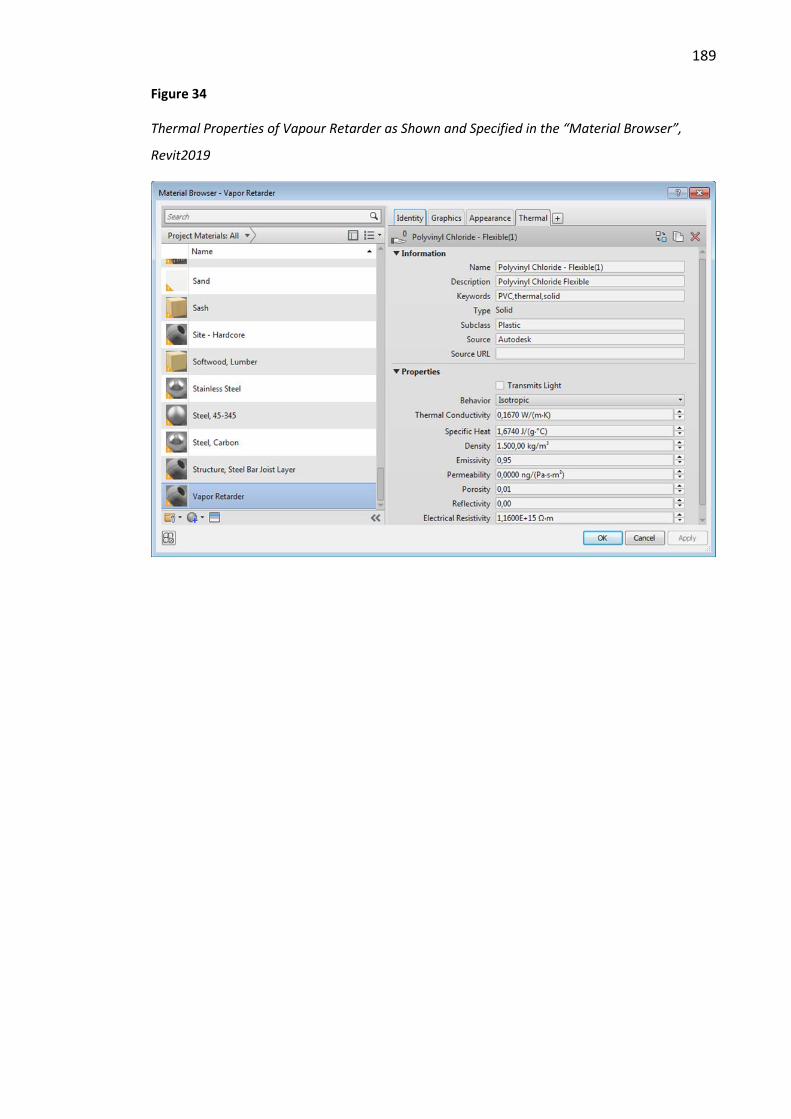
189
Figure 34
Thermal Properties of Vapour Retarder as Shown and Specified in the “Material Browser”,
Revit2019
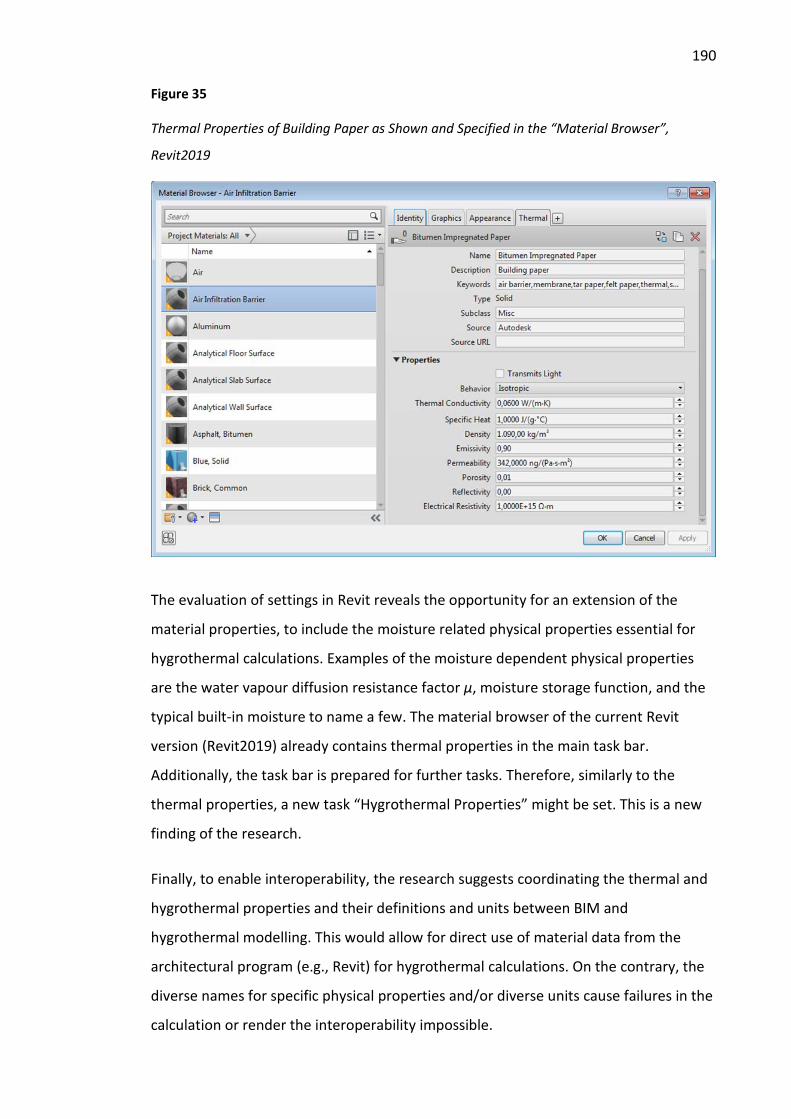
190
Figure 35
Thermal Properties of Building Paper as Shown and Specified in the “Material Browser”,
Revit2019
The evaluation of settings in Revit reveals the opportunity for an extension of the
material properties, to include the moisture related physical properties essential for
hygrothermal calculations. Examples of the moisture dependent physical properties
are the water vapour diffusion resistance factor µ, moisture storage function, and the
typical built-in moisture to name a few. The material browser of the current Revit
version (Revit2019) already contains thermal properties in the main task bar.
Additionally, the task bar is prepared for further tasks. Therefore, similarly to the
thermal properties, a new task “Hygrothermal Properties” might be set. This is a new
finding of the research.
Finally, to enable interoperability, the research suggests coordinating the thermal and
hygrothermal properties and their definitions and units between BIM and
hygrothermal modelling. This would allow for direct use of material data from the
architectural program (e.g., Revit) for hygrothermal calculations. On the contrary, the
diverse names for specific physical properties and/or diverse units cause failures in the
calculation or render the interoperability impossible.

191
Revit Energy Settings
The energy settings, as an integrated part of Revit, control the process of the energy
model creation and the use of the material and thermal space properties. Therefore,
the energy settings specify parameters for the direct generation of the energy
analytical model from the architectural model. Energy settings consist of energy
analytical model parameters and advanced energy settings. The energy analytical
model parameters are mode, ground plane, project phase, analytical space resolution,
analytical surface resolution, perimeter zone depth, and perimeter zone division
(Autodesk, n.d.-b).
Energy Analytical Model Parameters
Although Revit offers three modes for creating the energy model, it is recommended
to use the “Conceptual Masses and Building Elements” mode (Autodesk, n.d.-b). This
mode accepts models with only masses or only building elements, and it supports the
mixing of both types of elements. For the energy model correct function, the designer
has to specify in the ground plane the level which is in the direct contact with the
ground. This information is necessary for the calculation of heat transfer. In the case
where buildings are set partly underground, the ground plane forms the floor with the
most exposure to the ground.
The project phase information determines the specified phase and earlier building
phases included in the energy analysis. The analytical resolutions, such as space and
surface, represent important information necessary for the energy model algorithm.
These parameters influence the energy model accuracy and processing time.
Therefore, some adjustments, according to the size, complexity, and quality of the
Revit model, may be needed to regulate the accuracy-processing time relation.
Generally, for every computer-based model, higher settings of analytical resolution
lead to more accurate model results but increase the calculation time. The next
parameter, perimeter zone depth, should always be used in conjunction with the
perimeter zone division setting. These settings are important for the determination of
the building envelope area influenced by external weather conditions. A typical
perimeter zone depth, especially for large open plans is between 4 and 5 meters.
Generally, the perimeter zoning allows for passive solar energy analysis and results in
more accurate energy consumption simulation (Autodesk, n.d.-b).
192
Advanced Energy Settings
The advanced energy settings relate to the mode specified by the energy analytical
model parameters. In the default mode “Use Conceptual Masses and Building
Elements” the architectural designer might specify the following parameters: building
data, room/space data, and material thermal properties. However, the changes to the
building data affect the BIM setting and therefore, should be done only after
performing the initial energy analysis (Autodesk, n.d.-b).
The building data, such as building type, building operating schedule, HVAC system,
and outdoor air information, have an impact on the energy optimization for Revit. The
building type data are provided in the form of tables determining assumptions about
occupancy schedule, amount of people per 100 m², people sensible and latent heat
gain, lighting and equipment load density [W/m²], infiltration flow rate (ACH),
ventilation flow per person [l/s] and per area [m³/h], and unoccupied cooling set point
[C°]. The Revit default assumptions are based on ASHRAE 90.1 (2016b), ASHRAE 90.2
(2018), ASHRAE 62.1 (2019b) standards, Commercial Buildings Energy Consumption
Survey, and other surveys (Autodesk, n.d.-b). The researcher suggests that although
these assumptions are provided for energy analysis or heating and cooling loads
analysis, they are equally suitable for hygrothermal analysis.
The room/space data contains the export category setting determining which room or
space information is utilized in the analysis. However, these elements are only needed
if the architectural model contains the distinction between rooms and spaces residing
within analytical areas of the energy model. Otherwise, the room elements or space
elements are not essential for an energy model (Autodesk, n.d.-b).
The material thermal properties might be specified in three combinable ways. The
conceptual types represent the default thermal properties for typical mass
construction assemblies, such as exterior and internal walls, roof, slab, floor, glazing,
and skylights. Additionally, the conceptual types offer mass shades and overhangs to
reduce cooling loads, minimize solar heat gains, and increase comfort. The mass
openings conceptual type enables to include voids in surfaces that are exposed to
climatic conditions into the energy model. The conceptual types define default thermal
properties, such as R-value, density, and heat capacity in imperial (IP) and metric (SI)

193
values (Autodesk, n.d.-b). The values are the composite of individual material layers
per unit of the construction area.
The second way on how to define thermal properties is to specify schematic types
during schematic design. The researcher notes that Revit applies the default
conceptual types in any element categories not overridden by the schematic type.
However, the schematic and conceptual types might be overridden by material-based
thermal properties defined in the detailed elements option. The detailed elements
represent the third way to specify material thermal properties of building elements for
the energy analysis (Autodesk, n.d.-b).
6.2.2 WUFI Plus Settings
WUFI Plus settings’ description consists of a part of Chapter 5 (p. 156).
6.2.3 Physical Properties of WUFI Hygrothermal Calculations
Material data needed for WUFI hygrothermal calculations might be divided into two
categories. The first paragraph lists the indispensable data, which is vital for a WUFI
calculation. Without these data, no hygrothermal calculation is possible. The second
paragraph lists and explains additional data, such as moisture storage function, liquid
transport coefficients, moisture dependent heat conductivity, and moisture dependent
diffusion resistance factor. The additional data, as listed in the second paragraph, may
be optional for some calculations, but may be necessary for another, depending on the
intention of the calculation (Fraunhofer Institute for Building Physics, n.d.-c).
Indispensable Data
One of the major requirements for interfacing BIM with hygrothermal modelling is the
coupling of physical material data with materials in assemblies. Indispensable physical
data for hygrothermal calculations are:
Bulk Density
Symbol: ρ
Units: kg/m³
Definition: Mass divided by volume occupied by the material (Radu et al., 2012, p. 15).

194
Bulk density serves to calculate the specific heat value by volume. According to the
Fraunhofer Institute for Building Physics (n.d.-c), the hygrothermal simulations do not
depend sensitively on the bulk density value. Therefore, the bulk density value does
not need to be of high accuracy.
Porosity
Symbol: ξ
Units: m3/m³
Definition: Total volume of voids in the unit volume of porous material. The porosity is described using a formula, in the form of the following algebraic expression:
( 6 ) 𝜀𝜀 = 1 − 𝜌𝜌−𝜌𝜌𝑠𝑠
𝜌𝜌−𝜌𝜌𝑔𝑔
Where ρ is the apparent density of the material, ρs is the density of the solid matrix and ρg is the density of the gas in the voids (Radu et al., 2012, p. 28).
Heat Capacity
Symbol: Ϲo
Units: J/(kg·K)
Definition: Specific heat capacity of dry material – Heat added or removed when changing the temperature of a unit mass of dry material by 1 K (Radu et al., 2012, p. 19).
Heat/Thermal Conductivity Dry
Symbol: λ
Units: W/(m·K)
Definition: The Heat conductivity dry is the heat conductivity of the material in a dry
condition as defined by Radu et al. (2012):
The thermal conductivity of a material is the density of heat flow rate per one unit of the thermal gradient in the direction of the flow. That definition stems from Fourier’s law for heat conduction:
( 7 ) �⃗�𝑞 = -λ · grad T
Thermal conductivity is a scalar for isotropic materials and a tensor for anisotropic materials. Its value depends on density, temperature, moisture

195
content and sometimes age (as an indicator of changes in the material structure or composition) of the layer considered (p. 35).
Water Vapour Resistance Factor
The water vapour resistance factor (µ-value) is called by WUFI diffusion resistance
factor dry.
Symbol: µ
Units: -
Definition: Water vapour diffusion coefficient in the air (Da in m2/s) divided by the water vapour permeability (δv in m2/s) of a porous material:
( 8 ) µ = 𝐷𝐷𝑎𝑎
𝛿𝛿𝑣𝑣
It can also be defined as ( 9 ):
( 9 )
µ = 𝛿𝛿𝑝𝑝,𝑎𝑎𝛿𝛿𝑝𝑝
Where 𝛿𝛿𝑝𝑝,𝑎𝑎 is the water vapour permeability in the air in kg/(m·s·Pa) and 𝛿𝛿𝑝𝑝 is the water vapour permeability with regard to partial water vapour pressure in kg/(m·s·Pa). The water vapour resistance factor indicates how much larger the resistance of a porous material is against diffusion compared to an equally thick layer of stagnant air at the same temperature (Radu et al., 2012, p. 40).
Optional Material Properties
Some physical properties are not indispensable for WUFI Plus simulations, but are
beneficial for the accuracy of some calculations, especially by the very high moisture
contents.
Moisture-Dependent µ-Value
In some cases, the dependence of the diffusion resistance factor on RH should be
considered. This dependency of the water vapour transmission rate on RH can be
determined by a combination of test methods described in ASTM E96 / E96M-16
(2016). WUFI can, in these cases, employ a table resulting from dry cup tests with
three chamber RH levels at 50%, 70% and 90% RH. Consequently, WUFI interpolates
linearly between the table entries. However, for hygroscopic materials, the description
of moisture transport as diffusion dependent on moisture is not correct. Therefore, by
diffusion determination, additionally to using the moisture independent diffusion
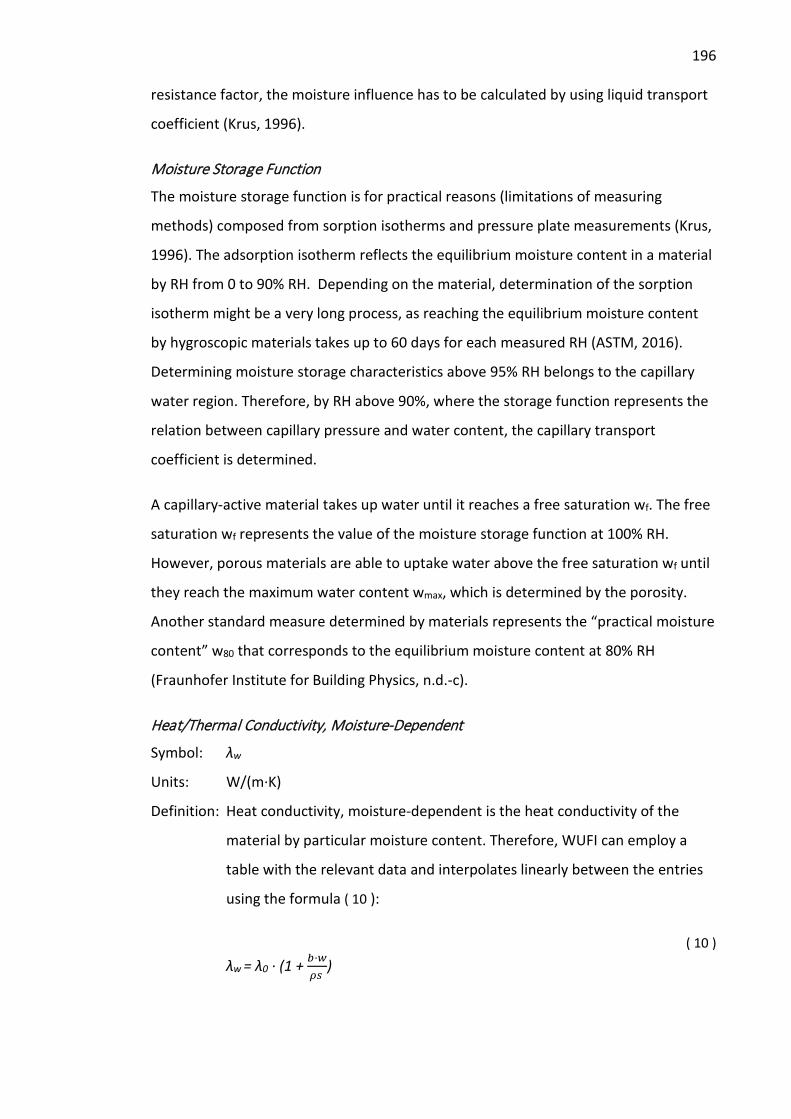
196
resistance factor, the moisture influence has to be calculated by using liquid transport
coefficient (Krus, 1996).
Moisture Storage Function
The moisture storage function is for practical reasons (limitations of measuring
methods) composed from sorption isotherms and pressure plate measurements (Krus,
1996). The adsorption isotherm reflects the equilibrium moisture content in a material
by RH from 0 to 90% RH. Depending on the material, determination of the sorption
isotherm might be a very long process, as reaching the equilibrium moisture content
by hygroscopic materials takes up to 60 days for each measured RH (ASTM, 2016).
Determining moisture storage characteristics above 95% RH belongs to the capillary
water region. Therefore, by RH above 90%, where the storage function represents the
relation between capillary pressure and water content, the capillary transport
coefficient is determined.
A capillary-active material takes up water until it reaches a free saturation wf. The free
saturation wf represents the value of the moisture storage function at 100% RH.
However, porous materials are able to uptake water above the free saturation wf until
they reach the maximum water content wmax, which is determined by the porosity.
Another standard measure determined by materials represents the “practical moisture
content” w80 that corresponds to the equilibrium moisture content at 80% RH
(Fraunhofer Institute for Building Physics, n.d.-c).
Heat/Thermal Conductivity, Moisture-Dependent
Symbol: λw
Units: W/(m·K)
Definition: Heat conductivity, moisture-dependent is the heat conductivity of the
material by particular moisture content. Therefore, WUFI can employ a
table with the relevant data and interpolates linearly between the entries
using the formula ( 10 ):
( 10 )
λw = λ0 · (1 + 𝑏𝑏·𝑤𝑤𝜌𝜌𝑠𝑠
)
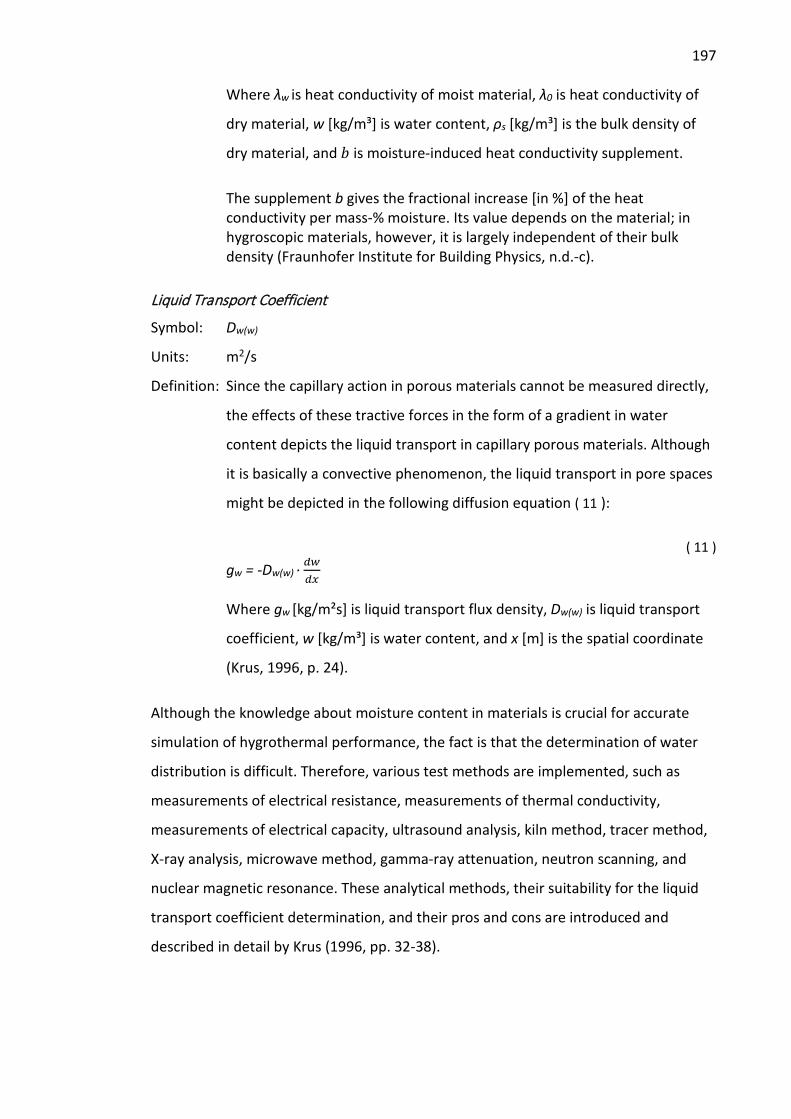
197
Where λw is heat conductivity of moist material, λ0 is heat conductivity of
dry material, w [kg/m³] is water content, ρs [kg/m³] is the bulk density of
dry material, and 𝑏𝑏 is moisture-induced heat conductivity supplement.
The supplement b gives the fractional increase [in %] of the heat conductivity per mass-% moisture. Its value depends on the material; in hygroscopic materials, however, it is largely independent of their bulk density (Fraunhofer Institute for Building Physics, n.d.-c).
Liquid Transport Coefficient
Symbol: Dw(w)
Units: m2/s
Definition: Since the capillary action in porous materials cannot be measured directly,
the effects of these tractive forces in the form of a gradient in water
content depicts the liquid transport in capillary porous materials. Although
it is basically a convective phenomenon, the liquid transport in pore spaces
might be depicted in the following diffusion equation ( 11 ):
( 11 ) gw = -Dw(w) ·
𝑑𝑑𝑤𝑤𝑑𝑑𝑑𝑑
Where gw [kg/m²s] is liquid transport flux density, Dw(w) is liquid transport
coefficient, w [kg/m³] is water content, and x [m] is the spatial coordinate
(Krus, 1996, p. 24).
Although the knowledge about moisture content in materials is crucial for accurate
simulation of hygrothermal performance, the fact is that the determination of water
distribution is difficult. Therefore, various test methods are implemented, such as
measurements of electrical resistance, measurements of thermal conductivity,
measurements of electrical capacity, ultrasound analysis, kiln method, tracer method,
X-ray analysis, microwave method, gamma-ray attenuation, neutron scanning, and
nuclear magnetic resonance. These analytical methods, their suitability for the liquid
transport coefficient determination, and their pros and cons are introduced and
described in detail by Krus (1996, pp. 32-38).

198
6.3 Limitations and Challenges of the Interoperability
The direct import of CAD data into WUFI Plus represents one of the challenges of this
research. Even though, according to the Fraunhofer Institute for Building Physics (n.d.-
e) building geometry input into WUFI Plus is supported by geometry import from
gbXML, the import of the research project data was unsuccessful. The import of
gbXML-files is dependent upon an external program ‘gbXML project import.exe’ which
is allocated in the tools-folder of the WUFI Plus main installation folder. This tool
converts gbXML project files into WUFI Plus XML project files. However, the
instructions in the WUFI Plus Manual (Antretter et al., 2017) are not very helpful:
“Always check your analytical gbXML Project model export via your CAD software. If
the analytical model is not well prepared, the tool cannot import a usable model” (p.
97). Nevertheless, the researcher is unsure of what a “well prepared” model means.
Therefore, the researcher conducted an internet search with the key-words “gbXML
files into WUFI”, and found out in the WUFI Forum that there are similar issues
described with the direct data import. However, only one answer in the online WUFI
Forum is available:
The tool should give some feedback about the information found in the gbxml file and converted to the WUFI passive project file. Mostly it tries to import the geometry and this sometimes need some model geometry adaptions. The tool only imports raw gbxml information and doesn't check, or change the model. (by mpazold, Sun Aug 09, 2015 10:52 pm)
The analytical gbXML project model export from AutoCAD or Revit follows the current
gbXML schema of green building XML. Since January 2017, the current schema is the
Version 6.01 (gbXML, 2017). Revit offers two methods for exporting to gbXML in order
to perform energy analysis using other software. The first method comprises the use of
energy settings, as described above. The second method uses volumes as defined in
the building model based on rooms/spaces in the model. However, the room/space
volumes may not be as accurate as the energy analytical model. Either way, the
resulting gbXML file contains energy information for the model depending on the
gbXML file structure. Therefore, the gbXML schema should help building designers to
gain energy related information about the building project (Treeck et al., 2018). The
new finding of this research in the form of suggested Revit extension, as described in
this chapter, might enable to perform hygrothermal analysis and optimization.
199
Another challenge to the successful interoperability represents the lack of
hygrothermal data for building materials. Except for the most common
materials/products, used in Germany and the USA, and listed in the WUFI materials
library, the moisture related data are not available. Next challenge consists of solving
the issues of building model extension in the way that it simultaneously contains all
necessary information, and does not unnecessarily slow its implementation.
6.4 Conclusions and Recommendations
Resulting from the research, one of the significant requirements for interfacing BIM
with hygrothermal modelling is the coupling of moisture related material data with
materials in assemblies. To enable an automatic assignment of properties during
exportation to a hygrothermal model, these properties have to be either already
contained in the object libraries in the architectural program, such as Revit, or be
added by user/architectural designer while creating the design model. The content,
inclusive predefined units and structure of the properties, have to be congruent to
allow for the direct use after the exportation into the hygrothermal simulation tool.
In order to improve the effectivity of the hygrothermal data administration and
actualization process, this research recommends creating open, standardized external
product library based on extended IFC model. Other option would be to use the
“Semantic Web” external library (Szeredi et al., 2014). Thus, both software, Revit and
WUFI Plus will make direct references to material properties in the external library
classification.
The other requirement for interfacing BIM with hygrothermal modelling is the
interoperability, allowing automatic transfer of geometry of the building (such as with
gbXML files or extended IFC model) and all necessary material data. Therefore, this
research is recommending software adjustments similar to the already existing energy
model creation in Revit as described above. That way, the newly created
“Hygrothermal Settings”, as an integrated part of the building model, would control
the process of the hygrothermal model creation, and the use of the material and
hygrothermal space properties for each space or zone. Therefore, the hygrothermal
settings specify parameters for the direct generation of the hygrothermal analytical
model from the architectural model. The recommended hygrothermal settings consist
200
of hygrothermal analytical model parameters and advanced hygrothermal settings.
The suggested hygrothermal analytical model parameters are mode, case,
location/climate, HVAC, building, project phase, analytical space resolution, analytical
surface resolution, visualized components, not visualized components, thermal
bridges, internal loads/occupancy, design conditions, ventilation, and other
parameters. Consequently, this research recommends establishing a new bar
“Hygrothermal Properties” in the Revit material browser. The generation of the
hygrothermal properties and the hygrothermal settings are new findings of this
research.
For future research, the study recommends analytical studies of hygrothermal analysis
influence on diverse areas in NZ. Studies especially oriented on the economic,
environmental, and sociological influences of hygrothermal analytical modelling on the
design process, energy optimization process, indoor air quality improvements, building
durability, and therefore, on the long-term costs and sustainability.
6.5 Summary
This chapter focuses on the possible improvements of interoperability between BIM
and hygrothermal modelling. The comparison of settings in Revit and WUFI Plus
reveals several feasible ways to enhance BIM with the hygrothermal analytical model
creation. Apart from the main intention to enhance the software compatibility and
achieve interoperability, the important condition constitutes the necessary creation of
coherent product libraries. One other way of interfacing BIM with hygrothermal
modelling might be the integration of WUFI Plus into Revit by using the Application
Programming Interface (API).
The process of necessary simplification of BIM data to envelopes and zones might
proceed similarly to the energy model creation in Revit. Therefore, the study
recommends the establishment of hygrothermal properties in the Revit material
browser. Additionally, the newly suggested hygrothermal settings, as an integrated
part of Revit, would control the process of the hygrothermal model creation, and the
use of the material and hygrothermal space properties. The generation of the
hygrothermal properties and the hygrothermal settings are new findings of the
research.
201
The new finding of this research, in the form of suggested Revit extension, might
enable to perform hygrothermal analysis and optimization during the design stage of
the construction process. Improving interoperability between Revit and WUFI Plus
provides for the use of hygrothermal simulation as a tool for an early materials
assessment and targeted specification of building materials. The critical interest of the
research is an improvement and higher efficiency of the informed design process. The
diverse themes related to the matter of this research are discussed in the following
Chapter 7.

202
Chapter 7 Discussion
The discussion chapter depicts the most significant results of the first part of the thesis
in a broader context of possible causes and effects. The findings of the study are
described in detail in Chapter 4 (p. 132), Chapter 5 (p. 171), and Chapter 6 (p. 179). In
this context, the researcher examines the wider meaning of the findings for different
ways of understanding and the different but related fields of work. Consequently, the
researcher assesses the findings against existing literature and evaluates the
contribution to the field.
The ontological position of this research is objectivism and the epistemological
perspective is based on integral theory. Despite the fact that this research implements
causal reasoning, which is fundamentally qualitative (Shadish et al., 2002), the used
methods for testing the hypothesis are quantitative. This research utilizes a model of
research strategy where experimental and simulation design are combined. Through
this combination of methods, new knowledge has been gained. The quasi-experiment
delivers data for the testing of the hypothesis as well as for a comparison to simulation
data. This chosen research strategy has proven to be valid because the applied
approach and methods demonstrated the importance of using simulation during the
construction design process. Therefore, the incorporation of hygrothermal modelling
into BIM would have an impact on the optimization of the hygrothermal performance
of buildings. This way, the combination of two data collections served the aim of this
research; to demonstrate that the broadening of BIM in terms of hygrothermal
assessment of materials, applied during the early stage of design, might prevent
moisture related problems and improve durability and quality of the construction.
Consequently, the proposed framework for designers (Chapter 8 below), which
includes hygrothermal modelling, might improve the quality of NZ houses.
Energy savings requirements lead to more insulation and improved airtightness.
However, this reduces the temperatures at the exterior layers of the building envelope
and increases indoor RH (Lacasse et al., 2016). Therefore, the buildings are at higher
risk of interstitial condensation. Nevertheless, the control of the hygrothermal
performance of buildings during the design stage can prevent moisture problems
(Künzel, 2014). In spite of the fact that investigations on hygrothermal performance of

203
timber constructions have been carried out by several researchers (see section 3.3),
the in-field measurements of indoor RH by diverse constructions and materials,
particularly in NZ climate, are lacking.
An experimental lightweight frame house with several wall assemblies, unoccupied but
with a laboratory controlled indoor environment was tested in France (Labat et al.,
2015; Piot et al., 2011). However, these studies have examined coupled hygrothermal
phenomena in different wall assemblies but not the influence of these assemblies on
the indoor RH. The authors have used simulation software HAM-Tools for modelling
one-dimensional (1D) coupled transfer in the walls. Nevertheless, their results
demonstrate the importance of temperature-driven moisture diffusion in wall
materials.
Another in-field study on long-term moisture performance of building envelopes was
carried out in the USA by Glass et al. (2015). Glass et al. (2015) maintained RH and
temperature in two test houses with humidifier and heater to investigate the
hygrothermal performance and water content in diverse structures with two different
orientations. The results have been compared with WUFI Pro 1D simulation. The
difference between this study and Glass et al. (2015) is that the USA study investigated
RH in building envelopes by constant indoor RH and temperature, and this study
explored indoor air RH by a controlled amount of released water vapour (WV).
A third similar, in-field long-term experimental study researched hygrothermal
performance and durability of the envelope assemblies in a passive house in Poland
(Radon et al., 2018). Although temperature and RH were measured and simulated
(using WUFI Plus) in the rooms, no testing on the influence of diverse materials on the
RH in the same room was carried out. The testing was provided in a habituated house
with active heating and mechanical ventilation without controlled humidification or
dehumidification. Therefore, the released WV to the indoor air was unknown.
Although the Polish study tested diverse envelope constructions, they stayed
unchanged during the whole experiment.
Therefore, this research makes a significant contribution to the knowledge because
none of the mentioned studies tested and simulated the influence of used materials on
204
the development of indoor RH by controlled humidification. The following discussion is
about the implications of the research for existing knowledge and research questions
generally. Thus, the following three main sections of this chapter are corresponding to
the research objectives (1. – 3.) and related questions, as stated in Chapter 1 (p. 6).
The fourth research objective will be addressed in Chapter 8 (p. 220) because of the
objective and related questions associate with the second part of this thesis dealing
with a system approach. The first section of this chapter examines the hygrothermal
performance of NZ housing construction by means of a quasi-experiment. In the
second section, the researcher identifies the challenges associated with undertaking
effective hygrothermal assessments during the early design stage of housing in NZ.
Therefore, the second section contains a discussion about hygrothermal simulation
and the differences between real measurements and simulation results, inclusive the
possible reasons for such. The third section focusses on the requirements for
integration of hygrothermal simulation into BIM in order to improve building
sustainability and performance.
7.1 Quasi-Experiment – Hygrothermal Performance Examination
This study shows that even small changes in material specification can engender a
significant influence on the hygrothermal performance of the building and therefore,
on indoor air quality. Several factors, such as materials used in the first layer from
inside of the house and airtightness membrane influence RH in houses. The findings
bring new knowledge about moisture relations in NZ housing relating to the
construction of the building envelope and used materials. Therefore, this paragraph
discusses the results of the quasi-experiment and their implications for existing
knowledge and research questions.
7.1.1 Levels of Relative Humidity in Different Settings
The study compares maximal reached RH in different settings while simulating
occupancy in two test houses, T-house with airtightness membrane and C-house
without airtightness membrane. The statistical analysis reveals that the maximal
reached RH level in each setting was noticeably higher in the T-house than in the C-
house. However, the initial RH levels in the T-house have been lower than in the C-
house (Table 9). ANOVA test indicates that the materials influence the indoor RH by
205
76% in the T-house (Table 20) and by 90% in the C-house (Table 21). Additionally, the
results show that the daily span between maximal and minimal reached RH in each
scenario is higher in the T-house than in the C-house. These are new findings of the
research.
The approach applied in this study is based on the sorption-active thickness theory
(Hens, 2017) described in Chapter 3 (p. 88). The quasi-experiment manifested RH
changes in relation to minor alterations of indoor materials (less than 20% of the total
wall area). The results are summarized in Table 10 for the T-house and in Table 11 for
the C-house. For example, by additionally covering an area of 8.28m² with MgO boards
(18.9% of the total wall area), the level of average RH dropped at 7.56 percentage
points in the T-house and 1.37 points in the C-house. The situation changed noticeably
with the application of an acrylic primer and earth plaster as an interior finish to the
same area. In spite of the fact that RH compared to 2. scenario in the T-house still
dropped (4.30 percentage points), the C-house level of the average RH increased (3.74
percentage points). This newly discovered knowledge from the research demonstrates
the influence of indoor materials and the airtightness layer on indoor RH.
The highest levels of RH are reached in the 2. scenario (no adding any materials) in the
T-house (Figure 11) and in the 4. scenario (MgO board with earth plaster) in the C-
house (Figure 12). These findings deliver an answer to the research question: What
levels of RH are reached in occupied NZ houses by different internal envelope
materials? In both houses, the most effective material for the minimalization of the RH
increase by the simulated inhabitancy seems to be the MgO board. However, the
measured values might be partly influenced by the initial levels of RH and by the
outside weather conditions. As F-statistics confirmed the later, the research
implemented an additional statistical analysis - ANCOVA to eliminate the influence of
the outside RH. Therefore, the ANCOVA calculates for what would the indoor RH
means be for each scenario, if the exterior RH would stay the same.
ANCOVA tests confirmed that used materials have a statistically significant influence
on indoor RH. This fact answered the research question: What is the impact of
different building materials used on the indoor side of walls on the hygrothermal
performance of a building? The analysis of eta squared indicates the impact of
206
introduced material on inside RH by controlling for the outside RH. Based on this
analysis, the research estimates the influence to be 67% in the T-house (Table 22) and
91% in the C-house (Table 23). However, for the holistic evaluation of the impact, the
maximal reached RH levels, and the development of temperature should be
considered simultaneously. Therefore, the research suggests that despite the
statistically higher importance of used materials in the C-house, the T-house might be
more vulnerable to introduced materials. This statement is based on visual evaluation
of graphed values for measured and calculated results and supported by a partial
increase of RH based on eta squared for each house.
Another difference between the two houses is evident in the development of
estimated marginal means of inside RH. In the C-house (Figure 16), RH is following a
stable pattern and the increase of maximal reached RH is lesser than by the T-house
(Figure 15). In the T-house, the maximal RH level exceeded in 2. scenario the
benchmark of 90% RH what in the contrary, did not happen in any scenario in the C-
house. Therefore, the analysis of measured data delivers new knowledge about the
development of inside RH in NZ houses. The research found out that the scope of
indoor materials influence is different depending on the exterior walls’ construction.
The indoor RH in the house with an airtightness membrane (T-house) is influenced by
used indoor materials by 76% (without correction for outside RH) and by 67% (with the
correction for outside RH). However, the indoor RH in the house without an
airtightness membrane (C-house) is influenced by used indoor materials by 90%
(without correction for outside RH) and by 91% (with the correction for outside RH).
Additionally, in general, the indoor RH in the T-house reached higher levels than in the
C-house in identical conditions (scenarios). Although the influence of used indoor
materials on the development of indoor RH is in the T-house statistically smaller, the
significance of these materials seems to be high. This statement is supported by the
noticeably higher RH differences between the scenarios in the T-house than in the C-
house. The described findings delivered answer to the research question: How do RH
levels differ in NZ houses based on the presence/absence of airtightness membranes?
However, the question remains why those differences occur? The researcher assumes
that these differences are due to the airtightness membrane and infiltration rate.

207
Based on the existing building physics knowledge, the researcher suggests that the
natural air exchange due to air leakages influences humidity removal from indoor
space. However, this still would not clarify where the water vapour goes. It is known
that the airflow carries the moisture into walls (Yarbrough et al., 2019). As this
experiment has not assessed the situation inside of the walls, the research makes no
conclusions regarding airtightness or drying process inside of the walls.
Nevertheless, the experience from built houses has proven that persisting high
humidity affects the wall structure and causes serious damages in the construction,
such as rust of metal parts or rotting of the structural timber (Harriman, 2012;
Strangfeld & Kruschwitz, 2018). Therefore, the missing airtightness layer has an impact
on the insulation quality, thermal transmittance, transient thermal response, and
moisture tolerance of the construction (Hens, 2016). The fact that the average RH and
the maximum reached RH in the C-house by each test have been lower than in the T-
house indicates a movement of moisture into the C-house’s walls. Consequently, the
lower levels of maximum reached RH might be wrongly interpreted as an advantage of
houses without a membrane. Therefore, the following text discusses the influence of
an airtightness layer.
7.1.2 The Influence of an Airtightness Layer
The airtightness membrane installed in the T-house is a humidity-variable vapour
control layer with a variable vapour resistance according to the direction of heat flow
and RH between both sides of the membrane (British Board of Agrément, 2015).
Therefore, the lower vapour resistance in summer allows moisture to pass through the
membrane from the wall back into the room. This fact, together with a much lower
infiltration rate due to the airtightness, might explain the higher RH levels and the
significantly higher slope of the interpolation functions in the T-house (Table 24).
Additionally, to account for the indoor RH differences, the research uses for the
explanation of the RH development the Theoretical Moisture Penetration Depth
(TMPD) model. The daily TMPD of gypsum board is 0.064 m (Wan, Xu, & Li, 2017, p. 6).
As the gypsum board installed in the test houses is only 0.01 m thick, the WV
penetrates the board on the first day, and the amount of the absorbed WV during the
following days drops (Wan et al., 2019). The airtightness membrane restricts the VW
208
movement through the wall. Consequently, more WV remains in the T-house indoor
air in contrast to the C-house in which the VW moves freely to the next layer in the
wall.
Although the vapour resistance of the airtightness membrane is in the time of the
experiment (summer) relatively low, the in-wall materials are still less available for
adsorption than in the C-house. The in-wall materials in the T-house are therefore
partly blocked, and the natural infiltration rate is low due to the airtightness
membrane. This explains the lower eta-square results for the influence of materials on
the indoor RH in the T-house. Despite this statistical fact, the differences between
maximal reached RH demonstrate that by an airtight construction, the inside layers
(before the membrane) have a much higher influence on the inside humidity levels
than in the house without any membrane.
In spite of the fact that the influence of outside RH is statistically significant, the major
factor affecting the development of inside RH remains in both houses the used
materials. However, these factors are not the only two sources of RH differences
between the houses. Therefore, the research suggests that apart from investigated
factors, existence or non-existence of airtightness membrane and the physical
characteristics of the membrane might have a significant impact on the hygrothermal
performance of the building. Consequently, the exterior wall structure and/or the
infiltration rate influence the level of indoor RH. Airtightness membrane prevents
direct water vapour transport into the exterior wall. This means that for the moisture
buffering, the most available layer/s are the sorption active surfaces in direct contact
with the indoor air. These facts would explain the generally lower levels of maximum
reached RH in the C-house by each scenario. The researcher is aware that the higher
levels of reached RH in T-house might mistakenly be interpreted as a disadvantage of
the airtightness membrane. However, without testing the drying process in exterior
walls and an assessment of complete thermal and hygrothermal house performance,
this statement would be not correct. As this study has not done any testing of the
drying/wetting process inside of the walls, the evaluation of the influence of the
airtightness membrane contains not a part of this research.
209
Despite the sorption theory, structures without airtightness membrane are prone to
be impacted by moist air due to the accessibility of materials inside of the wall’s
structure (Boudreaux et al., 2018). This would explain why, by the addition of acrylic
primer and clay plaster, the inside RH develops differently. The level of RH changes in
the 4. scenario not identically in both houses although the plastered MgO boards have
higher Sd value, and therefore, their moisture buffering capabilities are limited. In the
T-house, where the air movement through the building envelope is reduced, the
priming and plastering of the MgO boards seems not to have such a remarkable
influence. The RH in the T-house still dropped (4.30 percentage points) when
compared with the situation without any additional materials. However, the C-house
level of average RH in the same scenario increased (3.74 percentage points).
An explanation to this phenomenon might be that in the T-house, any diffusion open
material added to the indoor side of the wall offers additional moisture adsorption
and/or absorption. Therefore, RH is reduced by the addition of plastered MgO boards
regardless of the higher vapour resistance of the plaster because the acryl primer is
still diffusion open. In the C-house, the increase of RH in the same scenario indicates
that in buildings without an airtightness layer, the vapour resistance of indoor
materials influences significantly the accessibility of the in-wall materials for water
vapour. The deeper layers are therefore not freely available for sorption and the
overall RH increases. This finding adds to the general knowledge of hygrothermal
performance. The results might be used as an indication of the possible disadvantages
of acrylic paints widely used in NZ housing.
The discussion about the influence of diverse materials on indoor RH leads to the
question about the requirements for undertaking an effective hygrothermal
assessment of houses during the early design stage. Apart from the technical
requirements, which are discussed further, the criteria of the comfort zone are vital to
the assessment. Therefore, the following part takes into account different ideas about
human exposure to humidity.
7.1.3 Comfort Zone Criteria
As already mentioned earlier in the text, for an understanding of this research, it is
important to emphasize that indoor RH represents the characteristic of the interest.
210
Since the Sterling et al. (1985) study of “Criteria for Human Exposure to Humidity in
Occupied Buildings” new significant studies related to indoor RH have been undertaken
(Costanzo et al., 2018; Mijakowski & Sowa, 2017; Tsutsumi et al., 2007). Sterling et al.
(1985) have recommended comfortable levels of RH between 40% and 60% by normal
room temperature. However, these levels have been intuitively set and there is still a
lack of scientific research, especially in the analysis of the effects of low RH on health
and comfort (Derby & Pasch, 2017).
Nevertheless, NZ has outdoor ambient RH, usually between 60-80%, depending on the
geographical area (Level, 2017). The annual average RH reaches in some places
between 80-90%, such as in Auckland, Wellington, Hamilton, and Christchurch
(National Institute of Water and Atmospheric Research, n.d.). Therefore, the
researcher finds the recommended upper limit of 60% RH not feasible, especially for
coastal areas in summer. The limits should be set in conjunction with the type of
ventilation, indoor temperature, outdoor temperature, and RH. Consequently, by
sufficient air exchange rate and heated indoor, the moisture is not trapped in the
building and any short-term excessive water might quickly dry out.
Human beings’ comfort zone, according to ASHRAE, might be located in a specific
range of RH and temperature depending on metabolic rate, clothing insulation, air
temperature, radiant temperature, air speed, and humidity (ASHRAE, 2017b). These
factors are variable as they depend on occupants, the environment, and duration of
exposure. Therefore, the researcher agrees that the rigorous determination of a
comfortable indoor environment is not possible (Derby et al., 2017). However, from
the peer reviewed articles and other documents, it is possible to derive a statement
that people do not feel very well in the environment with extremely high or low RH.
Despite the facts that ASHRAE Standard 55:2017 (ASHRAE, 2017b) does not specify a
minimum humidity levels, BS EN 16798-1:2019 recommends for category II (normal
level of occupancy expectation) 25-60% RH. However, these design criteria are only
valid for the humidity in occupied spaces if humidification or dehumidification systems
are installed (British Standards, 2019a).
The researcher notes that this standard has limits set for spaces equipped with
dehumidification systems. Similarly, ASHRAE Standard 62.1-2016 requires that
211
designed RH levels be limited up to 65% RH for mechanical systems with
dehumidification capability (ASHRAE, 2019b). The current NZS 4303:1990 Ventilation
for acceptable indoor air quality is based on the outdated ASHRAE Standard 62-1989.
In spite of the fact that the ASHRAE has no humidity limitations for other mechanical
system types or where spaces are not served by mechanical systems, NZS 4303:1990
does. NZS 4303:1990 recommends RH no greater than 60% inside of habitable spaces
without any conditions on the type of ventilation system. The researcher points to the
fact that firstly, the standard is nearly thirty years old and secondly, it gives an
unrealistic recommendation to maintain RH in NZ houses between 30-60%. Given the
fact that the latter is not possible to achieve in NZ with natural ventilation, the
standard solves this controversy with a note: “In certain areas on New Zealand the
30% to 60% relative humidity recommendation is not within the operating capabilities
of the ventilation system” (Standards New Zealand, 1990, p. 6).
Therefore, additional means for regulation of indoor RH are necessary in NZ homes in
order to minimize the levels of allergenic or pathogenic organisms, such as fungi and
dust mites, and to improve IAQ and comfort. Given the results of the quasi-
experiment, a statement might be drawn that the data analysis confirmed the
hypothesis: “If materials used in the building envelope have a significant influence on
the hygrothermal performance of the building, then the design of sustainable buildings
cannot be done without hygrothermal modelling.” Therefore, the research
recommends hygrothermal simulation as a vital part of the design process, which is
discussed in the following paragraph.
7.2 Hygrothermal Simulation – Challenges in Hygrothermal Assessment
Hygrothermal simulation of the quasi-experiment, as described above, delivers data
for comparison with measurements. Despite the fact that the simulation confirmed the
results of the experiment, the calculated RH in the tested compartment shows some
discrepancies with the measured results. Although the ranking of scenarios in the
numerical model results is identical to measured results, the mean, minimum,
maximum, and the range of calculated and measured data are not the same (see Table
29). The differences in the standard deviation and mean values found between quasi-
experiment and simulation are higher in the C-house. Nevertheless, all differences in
212
the standard deviation and mean values are within the range of 5% error from the
measured values. The research experiences the highest differences in scenario number
four, where the error from the measured mean is 3.9% in the T-house and 4.5% in the
C-house. Therefore, the following paragraph discusses the possible causes of the
differences between calculated and measured results.
7.2.1 Discussion About Differences Between Simulated and Measured Results
WUFI Plus has been developed to simulate the HAM transport in the whole building or
separate zones in the building, as described in section 5.1.1. In spite of the fact that
WUFI Plus is user friendly software, it requires input parameters containing
temperature- and moisture-dependent hygrothermal properties. Therefore, the partly
unknown material properties, interzone ventilation rate, weather data, and their
estimated values might influence the results.
The detailed description of the limitations and challenges of the simulation might be
found in Chapter 5, section 5.3. The research uses hygrothermal properties data of the
MgO boards supplied by the manufacturer (Appendix B). Although the laboratory test
was done in 2011 when the ASTM E96 / E96M-10 have been active, the MgO boards
have been tested to ASTM E96 / E96M-05 (ASTM, 2005). Since then, this standard was
superseded multiple times and the current standard is ASTM E96 / E96M-16 (ASTM,
2016). During the test, two procedures, such as A-desiccant method and B-water
method, were conducted at 73.4±3.6 °F and 50±2% RH. This means that the laboratory
tested the sorption capacity of the material by these stable conditions only and have
not reflected the moisture dependent permeability values nor accounted for hysteresis
effects. However, the hysteresis phenomenon, as described by J. Berger et al. (2018),
has a significant effect on the sorption capacity of the material over a longer time,
particularly by multiple steps of RH. In the case when RH and temperature are
fluctuating, such as the case of the quasi-experiment, cycles of desorption-adsorption
processes take place.
Valuable knowledge about the relationship between temperature and mixing ratio
might be found in the field of food packaging. The water vapour transmission rate
(WVTR) is one of the key factors defining the shelf life of the packaging product
(Gaona-Forero et al., 2018; Kuusipalo & Lahtinen, 2005; Sängerlaub et al., 2018).
213
Consequently, the WVTR by many materials depends on RH and temperature (Chen et
al., 2014; Chennouf et al., 2018; Feng & Janssen, 2016; Galbraith et al., 2000). WUFI
can in these cases, employ a table resulting from dry cup tests with three chamber-RH
levels at 50%, 70% and 90% RH (Fraunhofer Institute for Building Physics, n.d.-c).
Despite the fact that the dependency of the diffusion resistance factor on RH can be
determined by a combination of test methods described in ASTM E96 / E96M-16
(ASTM, 2016), this testing of MgO boards was not provided. However, as the
determination of the moisture dependent hygrothermal qualities is a time-consuming
procedure, the data are not available for most building products.
Generally, depending on the material, the determination of sorption isotherm might
be a very long process as reaching equilibrium moisture content by hygroscopic
materials takes up to 60 days for each measured RH (ASTM, 2016). Therefore, the
analysis of the laboratory results for the MgO boards (Appendix B) shows that the
testing was done for insufficient time. The laboratory conducted the test procedure for
each method between 10 and 14 days, while equilibrium has not been reached yet.
Additionally, the laboratory has not used a dummy that is recommended for highly
hygroscopic materials. Therefore, the test results are unreliable. This fact revealed
itself by the conversion of permeance into water vapour resistance factor µ-value. In
spite of the fact that µ-value is a bulk material property independent of its thickness,
the converted values from permeance of different material thicknesses are not
identical. Therefore, the researcher has to estimate the µ-value for the 10 mm MgO
boards.
Despite the fact that in this study, the exact hygrothermal properties of the materials
are unknown, model prediction of RH development by using a classic diffusive model
may be devoid of accuracy. The common discrepancies between measurements and
calculations are due to the underestimation of the adsorption process and/or
overestimation of the desorption process in the numerical equations by diverse
moisture levels (J. Berger et al., 2018). This means that the simulation predicts slower
moisture transport than measured during the in-field experiment. Therefore, some
phenomena, such as nonequilibrium behaviour between water vapour and bound
water, or transport by air convection are in the simulation neglected (Busser et al.,
2019). The research results demonstrate this limitation, primarily due to the use of

214
hygroscopic fibrous materials, such as the MgO board and wood-based products.
Several studies have addressed the problem that hygrothermal models do not
precisely reproduce the measured RH levels under dynamic load, especially by the
presence of hygroscopic materials (Colinart et al., 2016; Kreiger & Srubar, 2019; Labat
et al., 2015). This might, to the opinion of the researcher, have its origin in the
unknown structure of porous materials and the complexity of physical processes in
moisture transport. In spite of the fact that many researchers investigated the water
vapour transmission in porous materials (Feng & Janssen, 2019; Hens, 2016), the
relationship between the structure of the porous material and the processes of
moisture transport remains open (Orlik-Kożdoń & Steidl, 2018). Nevertheless, the
simulation results demonstrate the influence of hygroscopic qualities of building
materials on the hygrothermal performance of the construction.
Due to this fact, the effective hygrothermal simulation used as a tool for assessment
and optimization of a proposed building can improve building sustainability. A
comprehensive literature review showed that good performing buildings have lower
operational costs, last longer, and provide healthy indoor air. Therefore, such buildings
have lower life cycle costs and less negative impact on the environment. The building
performance is improved by lower energy demand, more stable RH, the lower
probability for interstitial condensation, mould, and fungi development. Therefore,
BIM-integrated hygrothermal simulation can enable continuous assessment and
improvement of the building design. Consequently, alternative and sustainable
materials or solutions are easier to implement. Thus, the following section discusses
the requirements for the integration of hygrothermal simulation into BIM.
7.3 Requirements for the Integration of Hygrothermal Simulation Into BIM
This chapter evaluates various possibilities for the interfacing of BIM and hygrothermal
modelling on an example of two common software – Revit and WUFI Plus. WUFI Plus
enables, according to the WUFI Plus Manual, a direct import of geometry data only
(Antretter et al., 2017) but not material properties nor assembly settings. Therefore,
the current situation requires manual entry of these data. Generally, the direct import

215
of CAD-data is not flawless and often requires human interventions (Dimitrov &
Valchova, 2011).
Interoperability improvements and the integration of hygrothermal simulation into
BIM are explored in Chapter 6, section 6.1. The suggested solutions are ranging from
an integration of the hygrothermal model into BIM to the improvements to the
interoperability of separate programs. However, due to the fact that Revit and WUFI
Plus are proprietary programs, the proposed implementations/changes need
cooperation between the software providers.
The implementation of WUFI Plus in Revit would allow for hygrothermal optimization
of the designed building. The proposed hygrothermal settings, as described in Chapter
6, are similar to the existing energy settings in Revit. Due to the fact that Revit offers
an extension of material properties, hygrothermal properties might be added besides
the existing thermal properties. The proposed hygrothermal optimization provides an
opportunity for improvements in the hygrothermal performance of new and existing
buildings from concept to detail. The automatic creation of a hygrothermal analytical
model based on an architectural model would allow for a fast export of project data
into WUFI Plus. Before using this method of direct data transfer, the definition of
hygrothermal settings, and the creation of a hygrothermal analytical model in gbXML
will be necessary. The hygrothermal analytical model would be created by Revit and
composed of parameters required by WUFI Plus. The analytical spaces and analytical
surfaces for this model will be created from parameters defined in the proposed
Hygrothermal Settings dialog. This way, all data in the form of a hygrothermal
analytical model might be automatically exported to WUFI Plus for hygrothermal
simulation. Consequently, WUFI Plus improvements might enable direct import of the
Revit hygrothermal analytical model without the need for any personal intervention.
Therefore, WUFI Plus would be able to read the model data inclusive assemblies,
physical material properties, and orientation of the building and calculate the
hygrothermal performance of the building or its zones.
Another opportunity for interfacing BIM with hygrothermal modelling represents the
API platform, which offers an integration of other applications (including analysis
applications) into Autodesk Revit products. WUFI Plus as an optional Add-In would be

216
an option. This means that WUFI Plus will be able to directly communicate with Revit.
The user/designer will have multiple opportunities for changing materials in
assemblies related to the whole building or to a particular zone(s). The variants will be
treated as separate cases. The simulation results will allow for an optimized design.
Due to the fact that Revit calculates materials quantity, evaluation of cost difference
for diverse cases would be possible.
Despite the fact that it is 45 years since the BIM concept has been introduced by
Eastman (1975), the architecture, engineering and construction (AEC) industry is still
not able to fully adopt the fourth industrial revolution (Industry 4.0) (Daniotti et al.,
2020b). According to Daniotti et al. (2020b), data management and the interlink
between machines—objects—people and processes represent essential attributes of
the Industry 4.0. This research findings are showing that especially data management
and digital cooperation depict the most important requirements for integration of
hygrothermal performance assessment into BIM.
Firstly, for further analysis of an architectural project, the availability of relevant,
coherent, complete, and open data libraries is vital. In this sense, the researcher does
not agree with Xun (2009), who writes that metadata (non-graphic data) are more
important in the later stages of the life cycle of the product. On the contrary, for the
design of sustainable and zero-energy buildings, the physical characteristics of
materials are vital for the thermal and hygrothermal performance analyses. Therefore,
the transfer of data between various software should embrace the prospect of
selective object/material characteristics. For example, in order to provide
hygrothermal simulation, the designer needs to select the physical material properties
(listed in section 6.2.3) required by WUFI for calculation. This process has to be
supported by coherent and interoperable product data libraries in an OpenBIM, such
as libraries based on standardized IFC compatible product data management (Palos et
al., 2014). However, contemporary libraries are often proprietary and do not contain
hygrothermal data. In spite of the fact that WUFI offers a material library, many of the
building materials are missing and the library is not available for architectural
software, such as Revit. Therefore, the product data in the interoperable BIM libraries
have to be coherent, containing information for the entire process, systematically
organized, and based on standardized terminology. Additionally, this research
217
recommends that data about every material/object should consist of relevant, high
quality, and complete information about physical data necessary for thermal and
hygrothermal modelling. These recommendations are in alignment with the general
requirements for the libraries of BIM objects, as described by Daniotti et al. (2020c).
Although IFC is accepted as standard data exchange format in the construction and
facility management industries (Sacks et al., 2018), and standardized in ISO 16739-
1:2018 (ISO, 2018b), it is a very complex and highly redundant product model schema
(Belsky et al., 2016). Recent research has shown that interoperability issues consist
mainly of the inability of diverse software to interpret objects and inconsistency of
model data due to distinct representations of the same geometry, properties and
relations (Lai & Deng, 2018). Therefore, Model View Definitions (MVD), introduced by
buildingSMART, aim to provide semantic clarity to IFC exchange files (buildingSMART
International, n.d.-b). MVD are supplements to the overall IFC schema, which enable a
description of the IFC data model for the concrete data exchange (Borrmann, Beetz, et
al., 2018).
Consequently, a precise semantic definition of data exchange between Revit and WUFI
Plus depicts the most important requirement for the successful integration of
hygrothermal modelling into BIM. However, to the knowledge of the researcher, any
definitions nor MVD for the data transfer for hygrothermal modelling exist. All
necessary information, such as geometry, orientation, the structure of building
envelope, materials, etc. should be defined clearly because the representation for
semantic concepts might differ by separate software providers (Sacks et al., 2017).
Despite the importance of IFC export and import specifications tailored for each MVD,
it is true that the development of such subroutines is demanding on vendors’ human
and financial resources (Borrmann, Beetz, et al., 2018). Therefore, several researchers
are developing semantic enrichment engines for BIM which intend to add application-
specific information to a digital building model (Belsky et al., 2016; Sacks et al., 2017).
Another solution to the integration of hygrothermal modelling into BIM might be the
development of semantic web technology and semantically defined building
information as suggested by Niknam and Karshenas (2015) for sustainable building
design.
218
Next, due to the fact that digital cooperation represents a crucial attribute of the
Industry 4.0, diverse software should be interoperable. “Proprietary languages, rules
and guidelines, as well as proprietary libraries, are the death of BIM if not united by a
common “dictionary”…” (Daniotti et al., 2020a, p. viii). However, the reality is that the
most of the available programs and libraries are not fully interoperable. Therefore,
stakeholders should consider interoperability along the whole supply chain before BIM
tools implementation (Oti & Abanda, 2020). Ideally, digital cooperation beyond the
common structural and technological approaches would be the norm of BIM-based
collaboration (Papadonikolaki et al., 2019). In this context, the researcher agrees with
Oti and Abanda (2020) that the creation of built environment involves a combination
of disciplines, such as engineering, architecture, urban planning, real estates,
environmental studies, geography, industrial design, interior design, visual arts,
history, law, and sociology.
Additionally, the design and construction of sustainable buildings require the
implementation of building physics/building science and the dynamic needs of people.
These aspects are entirely missed in the cited article. Despite the fact that the energy
assessment of buildings is in many countries obligatory (European Commission, 2018;
Loncour & Heijmans, 2018; Zakula et al., 2019), Oti and Abanda (2020) have not
included any energy modelling nor analytical tools into the overview of the BIM
systems.
However, building performance analytical tools are vital for the future built
environment. This research argues that a BIM-integrated hygrothermal simulation tool
can reduce errors affecting the hygrothermal performance of buildings and increase
hygrothermal efficiency. The hygrothermal modelling allows for calculations of
multiple design options, and therefore, supports the decision process in the design
phase. Simulation results reveal hygrothermal consequences of design choices, such as
chosen building envelope, orientation, structure, used materials, ventilation,
fenestration and shading. Due to the fact that the simulation is specific to the climate
and future use of the building, these results might be utilized by building performance
optimization (Torres-Rivas et al., 2018). Therefore, the integration of hygrothermal
simulation into BIM leads to improvements in building sustainability.
219
Acknowledging the complexity of buildings’ hygrothermal performance, it is crucial to
note that this research covers only a segment of the whole. The study evaluates the
assessment of the first layer from the inside as an essential part of the design decision
process. Other parts leading to an integrated solution of HAM flow include, but are not
limited to, suitable ventilation, airtightness, the orientation of the house, use of
passive solar energy, shading, passive cooling, or thermal insulation. Therefore, the
research emphasizes the need for a thorough hygrothermal assessment of the
construction, especially of the first layer from inside. Due to the infiltration, air open
structures need more energy for heating and cooling the indoor and are prone to
interstitial condensation and mould (Shrestha et al., 2019). This is not viable because
of the energy saving needs (Bhandari et al., 2018; Loncour & Heijmans, 2018). The
solution would be a holistic and integral approach to the combined HAM flow in the
design process, as described in the following Chapter 8.
7.4 Conclusions
The results of this research indicate that sustainable design requires an integral
approach with dynamic models assessing multidisciplinary factors. Therefore, the
proposed framework, as described in the following chapter, is beyond static models of
the literature discussions. Hygrothermal modelling forms a part of the framework. The
fourth industrial revolution (Industry 4.0) fundamentally changes the way how
buildings will be constructed (Lojanica et al., 2018), and the whole architectural design
process (Abdelhameed, 2019). These research findings are showing that especially
data management and digital cooperation constitute the most essential requirements
for integration of hygrothermal performance assessment into BIM.
7.5 Summary
This chapter presented the discussion of the overall findings of the study delineated in
Chapter 4, 5, and 6. The discussion consisted of the implications of the research for
existing knowledge and addressing research questions related to the research
objectives (1. – 3.), as stated in section 1.4. This research makes a significant
contribution to the knowledge because none of the existing studies tested and
simulated the influence of used materials on the development of indoor RH by
controlled humidification.

220
Chapter 8 System Approach
Motto: “We, along with the rest of the natural world, are all interconnected within the
larger web of life” (The United Nations, n.d.).
During the last two decades, it has become evident that the human race has entered a
global age where diverse worldviews, cultures, religions, and science branches are in
the midst of a deep transformation (Gangadean, 2010; Newey, 2019). Increasing
incidences of loss/loss business outcomes due to dysfunctional multi-stakeholder
relations pinpoint the ramifications of the problematic business thinking and practice
in many business activities (Fish & Wood, 2017). Simultaneously, a new evolutionary
stage of consciousness, called “integral” is emerging (Wilber, 2007). Annals in Social
Responsibility described integral business as follows (“How stages of consciousness,”
2019):
A future vision is of integral business where a currency of well-being is the main focus. Work would be undertaken in a mindful culture directed at encouraging an achievement of harmony across all eight well-being components. The value thrown off by such companies would be in the form of well-being creation for society. (p.21)
Therefore, a new system approach to radically improve the architecture, engineering,
and construction (AEC) industry is emerging (Fewings & Henjewele, 2019; Owen et al.,
2010). Despite the development of integral architecture (Zeiler, 2011, 2015), a gap in
the literature exists because a description of the complex integral system in the AEC
industry is missing.
This chapter forms the second part of the thesis and offers a futuristic examination of
existing issues in the NZ housing design process. Part one (of this thesis) explained why
BIM, as a tool for collection and management of information about a building, should
include energy, hygrothermal, and airflow models to support the optimization process
of sustainable buildings. Therefore, the subject of the first part obtained incorporation
of hygrothermal modelling into BIM to address moisture related problems and the
building materials’ influence on indoor relative humidity (RH). The requirements for
interoperability between the hygrothermal model WUFI Plus and the architectural
design tool Revit are examples of the growing field of integration. However, the
221
problem of energy-inefficient, unhealthy, cold, mouldy, and damp houses in New
Zealand (NZ) is complex, and therefore, couldn’t be solved with the same attitude as it
was created. Improvements in tools have to be a part of an innovative approach. A
radical change in thinking is necessary, as Albert Einstein already said: “Problems
cannot be solved by the same level of thinking that created them” (as cited in German
in Stahlbaum, 2020 ).
Therefore, the second part of the thesis focuses on the paradigm shift in the
architectural design process. Taking a system approach means thinking about the
relationship between design process management and the social, environmental, and
economic systems or structures that encompass the built environment. The first two
paragraphs of this chapter consist of defining the integrative and holistic system
approach — named Complex Integral Design New Zealand (CIDNZ) and discussing the
transformation phase of the paradigm shift. The proposed framework introduces
alternative perspectives on how to design warmer, drier, and healthier houses for the
NZ context. Consequently, the researcher suggests tools for the evaluation of CIDNZ
and discusses the integration of diverse perspectives in the system approach. In the
concluding paragraph, the vital contributions of this chapter are summarized.
8.1 Complex Integral Design New Zealand (CIDNZ)
Since the energy crisis in the 1970s and forthcoming human-induced climate change,
energy-related issues are influencing the whole world. The building industry has
contributed significantly to this situation (Ürge-Vorsatz et al., 2011). Consequently,
changes towards sustainability and resilient building design and construction are
necessary to minimize the negative impact of buildings on the environment (Cohen &
Snell, 2018). However, the most improvements so far have been targeted to a specific
problem-solving without any consideration of the whole. For example, in NZ, the
incentive of warming up the existing houses led to insulation retrofits (BRANZ, 2018).
The insulation has been typically installed to some elements of the house only, like
walls, floors, or ceilings, but rarely to the whole building envelope (Ghose, McLaren, et
al., 2017). As a result of these enhancements, the energy balance and the carbon
footprint have been improved. However, the retrofits-related shifts in the position of
the dew point have ramifications. Interstitial condensation, mould growth, and rotting
222
of construction materials represent possible consequences of partial improvements in
the thermal resistance of building envelopes (Shrestha et al., 2019; Vereecken, Van
Gelder, et al., 2015).
From the system’s definition point of view (ISO/IEC/IEEE International Standard, 2017),
every building might be seen as a complex system that interacts with the environment
and humans. From the system theory perspective (Rhodes, 2012), a building includes
all of the used materials, equipment, location, shape, functions, and relations to the
environment and occupants. What makes each building a system are the links and
dependencies of one part on another and the environment. Any change of some
element, function, behaviour of occupants, or climate has an influence on the whole
system — building. This approach represents a piece of new knowledge. In theory, BIM
is a dynamic process accompanying the whole life cycle of a building. However, as
shown in part one of this thesis, the praxis is still far away from this potential. A
necessary transition process, therefore, might enable changes in the AEC industry,
leading to the integration of the fourth industrial revolution (Industry 4.0) (Daniotti et
al., 2020a).
Additionally, there is undeniable evidence that humans reached a radically new level of
consciousness and stepped into an era of globalization (Stein, 2019). Therefore, the
minimalization of the negative impact of buildings on the environment and climate is
not sufficient. The expanded consciousness recognizes the need for a harmonization of
the man-made world with the life on the planet Earth. This corresponds to the United
Nations Interactive Dialogue of the General Assembly on Harmony with Nature which
invites to promote “… the balanced integration of the economic, social and
environmental dimensions of sustainable development through harmony with nature”
(The United Nations, 2018, p. 5). Consequently, a definition of a new set of operations
is necessary. We need to set a benchmark, in other words, identify the need for certain
considerations. From this point of view, the proposed approach of CIDNZ aims to
radically improve the performance of NZ houses.
8.1.1 The Definition and Background of CIDNZ
Complex Integral Design New Zealand (CIDNZ) represents a comprehensive and
balanced system-based design and delivery process that facilitates and accelerates
223
cross-disciplinary and trans-disciplinary expertise and knowledge to create buildings in
balance with nature, environment, and human needs.
With the word “complex” the researcher advocates for complexity science as both a
theoretical and practical framework for addressing housing problems in NZ. CIDNZ
aims to radically improve the housing by integrating contextual conditions in the
search for generalizable findings and recognizing the value in the inter-disciplinary
knowledge. “Complex” therefore expresses two meanings. Firstly, as Saurin and Rooke
(2020) wrote:
… construction projects might be framed as complex socio-technical systems (CSS), which are a sub-set of the broader family of complex adaptive systems. Since many complex adaptive systems are not socio-technical (e.g. ecosystems, which may interact with construction projects), this distinction is necessary. (p. 325)
Therefore, from a complexity science point of view, complex systems include many
interacting components and diverse forms, such as networks and graphs, cellular
automata, fractals, agent-based models, swarms, self-organizing, chaotic, and
cybernetic systems (Downey, 2018). Secondly, the word “complex” points to a
changing way of thinking. The traditional forms are extended or transformed by
emerging holism, mutual causality, and perspectival observation (Dent, 1999).
CIDNZ is based on comprehensive engineering and other disciplines, including but not
limited to architecture, engineering, building physics, indoor air quality, environmental
science, information technology, computer sciences, building services, building
biology, meteorology, human physiology and psychology. The system approach used in
CIDNZ represents the ability to look at influencing factors and elements, tasks, goals,
and functions from a “distance”, which allows for different points of view. CIDNZ
implements a new modality of thinking, called integral thinking, which rests upon the
holistic consciousness, and goes wider than “integrated” because it contains concepts
of inclusivity, pluralism, and reverence (Gidley, 2010).
Every building, inhabitant, stakeholder, or a group of people (for example, a family) are
seen in CIDNZ as holons and examined in their whole/part relationships during the life
cycle of the building. The theory of holons has been introduced in Chapter 2, section
224
2.1.5. Holons are organized in hierarchies and heterarchies, called by Wilber holarchy
(Gallifa, 2019). Therefore, the analysis of the holarchy and relationships between
holons and holarchy allows for the integral examination of multifaceted, cross-
disciplinary, human- and nature-centred problems in the CIDNZ process. In this sense,
the CIDNZ forms a holon as well.
CIDNZ uses the integral examination, which executes in four dimensions:
transcendence, communion, agency, and immanence (Gallifa, 2019). The
transcendence demonstrates the ability of the holon to change and evolve. Therefore,
it allows for the evolution of the whole system (Gallifa, 2019). For example, the
integration of the hygrothermal modelling into the design process enables
improvements and the optimization of the hygrothermal performance of the building.
The communion allows for relationships with other holons. This sometimes happens
through indirect ways, such as government regulations, human priorities and values
(Gallifa, 2019). Therefore, CIDNZ will encourage dynamic relations with building
authorities and research to improve the design process and in general, the quality of
NZ housing. The agency represents the ability of the holon to project the internal
structure and transform or influence the environment (Gallifa, 2019). The agency will
carry out an essential role in CIDNZ because the AEC industry might benefit from the
cooperation and integration of diverse fields of knowledge. The immanence is the
holon’s tendency to preserve the status quo, repeat the past, and therefore, add to the
stability of the system (Gallifa, 2019). In CIDNZ, the immanence means the ability of
the system to use reliable, proven, and tested methods, technology, and materials
while encouraging for the transcendence and evolution.
The design and delivery process, and the end-result/building, when seen as systems,
offer a paradigm shift in the way how buildings are constructed and used. The system
approach in CIDNZ, for example, interpolates questions and examples from natural
systems. What does it need to create a zero-energy sustainable building? How can it
be done? What are the conditions to eliminate harmful effects on nature and people?
How could it be done that the design and construction process go more smoothly, with
minimal losses and delays, but not for the costs of the whole? The aim of the CIDNZ
approach is the harmonization and optimization of processes, resources (humans and
materials), and building performance (thermal, hygrothermal, environmental). For the

225
operations and progression, CIDNZ adopted the integral operating system (IOS) — an
integral model that includes four quadrants of growth, development, and evolution
(Wilber, 2000b, 2007, 2014a). The description of the four quadrants in CIDNZ forms
the content of the following section.
8.1.2 The Four Quadrants in CIDNZ
The CIDNZ system accommodated Wilber’s four quadrants (Wilber, 2000a) to form
four different views on the entire design process. Therefore, CIDNZ divides the design
of sustainable and low-energy houses into four quadrants along two axes, as shown in
Figure 36. The horizontal axis, connecting the interior on the left side and the exterior
on the right side, depicts a view point related to the subject of evaluation. On the right
side of the axis, the subject is objectively examined from “outside”, and therefore, it
becomes an object. The vertical axis connects the collective perspective on the bottom
with the individual perspective on the top.
Figure 36
The Four Quadrants in CIDNZ
Note. Wilber’s Quadrants adapted to design and construction from Wilber (2014b).
The subjective quadrant (upper left) describes the influence of the house on the
perceptions and sensations of a person. The individual might be the designer or the
INTE
RIO
R EXTERIOR
INDIVIDUAL
COLLECTIVE
226
future inhabitant. Questions in this phase relate to their perceptions and feelings. For
example, will the building provide a comfortable and safe environment? Will the
design and indoor environment evoke positive feelings and thoughts?
The objective quadrant (upper right) depicts all objective, measurable facts about the
building performance, functionality, indoor air quality, etc. and its influence on the
human body and health. In this phase, designers ask questions related to the impact of
the building on the physical body. For example, what impact will the building have on
the health of inhabitants? Will the building provide a healthy living environment? How
high is the probability of mould development in the building? How high will be the
concentration, if any, of hazardous substances in the indoor environment? Is the
building structure durable and safe? In this quadrant, the design team analyses both
the individual matter of biological and chemical origins and the synergistic effect of all
substances as well.
The intersubjective quadrant (lower left) relates to culture and nation; how the
building influences or reflects the existing worldview and cultural values, inclusive
corporate culture. Does the building and its design enhance the existing culture? How
the building/s will support the global culture? Does the design reflect the
characteristics of the nation?
The interobjective quadrant (lower right) reflects the relations to the environment,
ecology, economics, and social systems and structures (groups in which people live or
work). Due to the world’s major problems, such as climate change, pollution of earth,
water and air, and depletion of resources, the thinking in this quadrant and acting
sustainably gained on importance. Sustainability is a principle of action by which the
resources utilized to the needs satisfaction are exploited in such a way that enables
natural regeneration of involved ecological systems (Oxford University Press, n.d.).
“Our problems are by-products of our successes” (Maxwell, 2018, p. 349). However,
although the solution of environmental issues is crucial for the survival of humanity,
the balance between all quadrants is decisive for future well-being (Marshall, 2016).
The quadrants in CIDNZ offer four different views on the design process and help in a
practical way to formulate questions leading to integrally balanced solution concepts.

227
Some examples of these questions are as follows. What objectives and criteria we have
to set for retrofitting of existing buildings? What are the factors in building
performance to support and positively influence the human’s well-being and health?
How might these factors be satisfied in harmony with the environment? How will the
future inhabitants feel in this concrete, nearly zero energy house? What could be done
to enhance the cultural, esthetical, and social value of the designed building?
From this point of view, CIDNZ includes and simultaneously expands already existing
integral theory’s applications in the field of architecture, design, engineering, and
construction. The Integral Sustainable Design (ISD) (DeKay & Bennett, 2011) and the
integral ecology (Esbjörn-Hargens, 2005) are two examples of these applications. ISD,
although representing a more integral view on sustainable design, is mainly oriented
towards ecology and the impact of buildings on the environment, energy, and use of
materials. ISD examines the sustainability of the design from behavioural, systems,
experiences, and cultural perspectives (DeKay & Guzowski, 2006). The quadrants in ISD
are seen as follows. On the subjective/individual level, the ISD’s perspective contains
environmental phenomenology, experiences of natural cycles, and green design
aesthetics. On the objective/individual level, ISD is concerned with the efficiency of
energy, water, and materials; on the subjective/collective level, relationships to
nature, green buildings’ ethics and cultures; on the objective/collective level, eco-
effective functionalism and buildings as an ecosystem (DeKay & Bennett, 2011, p. 18).
Therefore, the subjective levels are only observer-oriented, specifically how the
architectural designer experiences and understands the place (the arts), and what
others perceive, what is measurable about the place (efficiency) (DeKay & Bennett,
2011). However, ISD does not include any influence of the building on the health and
well-being of people/inhabitants.
In this sense, CIDNZ brings new knowledge because it contains all holons related to the
building, such as environmental, individual (creator and user), collective, sociological,
and ecological. Consequently, the application of the proposed innovative system
approach requires a necessary transformation process.

228
8.2 A Process of Transformation
The development and implementation of CIDNZ involve a process of transformation.
The core of the transformation is located in the values which every stakeholder holds.
Therefore, a question emerges regarding how to shift the values towards higher stages
of individual and collective development; from personal to trans-personal, from
rational to pluralistic and integral.
The housing and the associated design and construction remain not a set of static
things, rather an open system in which evolution depends on the human values and
market conditions (Aksamija, 2017). Therefore, the state of knowledge and value
system determine the places where people live and work. For example, the
materialistic self-centred values of the modern age, “… the values of accomplishing
and getting, having and possessing” (Graves, 1970, p. 150) brought besides wealth,
innovations, and comfort exploitation of natural resources and massive pollution of
the environment (Beddoe et al., 2009).
For a framework, which the following section 8.3 shall present, the design process in
its complexity and the rapidly changing human’s values convey radically different ways
of thinking. A new set of values based on humanistic, systems, holistic, and integral
views develops (Schwartz & Esbjörn-Hargens, 2019). The CIDNZ transformation
process, therefore, values the undistorted acceptance of human nature as it is, and
problem-solving process, which leads to a balance between individuals, groups,
society, and the existing ecosystems. This is a novel way of understanding
sustainability in the housing and construction industry in general.
Consequently, the shift in value system is visible in recognition of concepts of
consciousness and attention in cognitive psychology and other scientific fields (Galotti,
2017), and the birth of global culture and consciousness (Stein, 2019). According to
Beddoe et al. (2009), “A culture can be viewed as an interdependent set of world
views, institutions, and technologies” (p. 2484). In this context, the researcher notes
that the global culture forms while each nation is developing its own unique culture.
“As seen in an organic body, for the whole to become one, each part must develop
itself. For each part to develop itself, the whole must become one” (Nishida, 2019, p.
308).

229
The stages of the individual and collective development might be followed in the spiral
dynamic, which represents a human development theory, based on Graves (1970) and
first introduced by Beck and Cowan (2014). The spiral dynamic proposed eight levels of
development to which Wilber later added the rainbow colours (Butters, 2015).
Consequently, the human development system depicts a map of evolving personality
and world views. A worldview might be defined “… as a combination of a person’s
value orientation and his or her view on how to understand the world and the
capabilities it offers, the lens through which the world is seen” (van Egmond & de
Vries, 2011, p. 855). The historical process of frequently repeated destabilization of
worldviews together with the present domination of the extreme postmodernist
worldview led to the sustainability problem and ecological crisis (van Egmond & de
Vries, 2011). Nevertheless, the emerging climate change and the need for
sustainability transformations are bringing radical shifts in worldviews, innovative
strategies, and the role of sustainability assessments (Rigolot, 2018).
Consequently, the CIDNZ transformation process involves a movement of values
toward the integral worldview domain. The integral worldview constitutes of
transformed relationships to the environment, eco-social evolution, and unity and
flourishing of all beings (Ferreira, 2018). Simultaneously, it accepts and understands all
major typologies of worldviews, such as premodern, modern, and post-modern. The
integral worldview, therefore, offers an ethical framework that operates within a circle
consisting of the four quadrants, eliminating one-sided identifications and defining
“human dignity” (van Egmond & de Vries, 2011). Integral thinking is particularly useful
in complex fields that require comprehensive approaches, such as housing design and
construction. Integral thinking includes traits of advanced ways of thinking, such as
ecological, systems, holistic, post-formal1, and metaphysical (Gallifa, 2019).
Therefore, CIDNZ implements integral thinking which is an inclusive thinking in
systems. Inclusive thinking is based on a notion of cross-sector and multi-disciplinary
collaboration and shared values (Lu, 2013). The transformation process to integral
thinking happens not as DeKay and Bennett (2011) write as “… a shift from behaviors
to system” (p. 256), but as a complex system that includes all quadrants and all levels
1 Features and characteristics of Post-formal thinking are described in Appendix C.

230
(Landrum & Gardner, 2005). Particularly, the CIDNZ ecological thinking aims to achieve
a balance between the upper right and the lower right quadrant; in other words, a
balance between behaviours/functions and environmental, societal, and ecological
systems. Therefore, the transformation process represents an ever-expanding
perception that reflects “… the need to change the legal anthropocentric paradigm and
replace it with biocentric thinking which recognizes Nature’s intrinsic value and
advances the interconnectedness between human beings and Nature” (The United
Nations, 2019, p. 4).
The transformation process depicts an entirely new quality of perceptions that are
based on the second tier of human consciousness development. This is because this
level of consciousness is profoundly different from all previous levels. It is the first time
in the known human history when the shift happens, not by fighting and denying the
previous levels (Wilber, 2019). In this level, the world view is based on recognition and
acceptance of all the progress done in the past, learning from mistakes, and
integration of the knowledge for the well-being of all (Schwartz & Esbjörn-Hargens,
2019). Through this process, holistic views of construction are developing. The holistic
views include “… integrated, collaborative processes, enhanced technical and social
skills, and interoperable technologies to support integrated information and
automation systems and knowledge management” (Prins & Owen, 2010, p. 227).
CIDNZ comprises all stages in the life cycle of buildings. Therefore, the transformation
addresses relations to the environment, stakeholders, technologies, and processes
involved in the design, delivery, usage, and decommissioning of buildings.
Simultaneously, the process of transformation needs support from research and
education. CIDNZ recognizes four significant aspects in the AEC industry: people,
processes, technology, and environment. Figure 37 schematically visualizes the four
fundamental aspects of CIDNZ and the conceptual framework for transformation.

231
Figure 37
Fundamental Aspects of CIDNZ and the Conceptual Framework for Transformation
The conceptual framework for transformation contains collaborative processes across
all project phases, enhanced skills, integrated information and automation systems,
and knowledge management. These are the four elements of the Integrated Design
and Delivery Solutions (IDDS)2 (Owen, 2009). IDDS is the CIB3 vision for a more holistic
future transformation of the construction sector. Additionally, CIDNZ recognizes two
crucial elements, such as human needs and environmental systems. Any
change/improvement in one of the industry elements has a direct or indirect influence
on the industry foundations (Owen et al., 2013). Differences between IDDS and the
complex integral design might be recognized in the fact that the former aims to
enhance the efficiency and value of projects. The later goes a step further. CIDNZ as a
2 “Integrated design and delivery solutions use collaborative work processes and enhanced skills, with integrated data, information, and knowledge management to minimize structural and process inefficiencies and to enhance the value delivered during design, build, and operation, and across projects.” (p.3) Owen, R. (Ed.). (2009). CIB white paper on IDDS integrated design & delivery solutions (Vol. 328). CIB. http://www.irbnet.de/daten/iconda/CIB18413.pdf. 3 International Council for Research and Innovation in Building and Construction.
PEOPLE
CIDNZ
PROCESSES
Consciousness development: worldviews,
values, needs
Education, training, research
Interoperability, communication
Data management, open libraries
Integrated information &
automation systems
BIM
Simulation & modelling
Design, production, construction, procurement,
decommission
Knowledge management
Construction management
Legal and regulatory aspects
Facility management
Integrated project delivery
Lean construction
Resources, nature, climate, ecology
Indoor & outdoor environment
Building performance
Design & delivery stakeholders
Clients & users
Culture & society
232
process includes all previous stages of integrated, collaborative processes in personal
and objective levels by a new integral cross-paradigmatic approach. Therefore, CIDNZ
transformation process influences all fundamental aspects as described in the
following sections.
8.2.1 People
The people involved in CIDNZ consist of two major groups: the users/inhabitants, and
the design and delivery stakeholders. Both of these groups will undergo a process of
changes and transformation. As Dent (1999) wrote more than 20 years ago: “Our
reality changes as our ability to detect phenomena changes” (p. 16). The human needs
and values, and individual’s worldviews, therefore, form a crucial element of the
transformation process. Consequently, CIDNZ includes the identification of
contemporary and future physical, psychological, and sociological needs and values, as
well as aesthetics, health, safety, and functionality. The recognition of the human
needs and values in CIDNZ proceeds across four directions: individual, collective,
interior, and exterior.
On the side of design and delivery, the enhancement of skills and knowledge
management throughout the industry foundations are decisive for the successful
transformation. CIDNZ team members work in cooperation through the whole supply
chain, and continuously improve the level of knowledge. The involved processes
require new/advanced skills in technology applications, multitasking, and the ability to
think integrally in a cross-disciplinary way (Daniotti et al., 2020a). Therefore, people
with joint degrees, such as the architect/engineering, will be in demand (Owen et al.,
2013). Some professions, such as construction or architectural managers and
mediators, might gain importance (Ali, 2019). The collaboration and shared knowledge
about past projects will improve the skills of tradespeople who will participate in
integrated work processes (Owen et al., 2010). Consequently, the educational system
will require changes towards integral thinking and inter-disciplinary approach (Gallifa,
2019), especially in combination with environmental and human sciences. It will not be
enough to build technically advanced low or zero energy buildings but to harmonize
the built environment with nature, health, and wellbeing of people.
233
8.2.2 Processes Across All Project Phases
The AEC industry is already undergoing a transformation process due to the new
technologies and collaboration with BIM (Papadonikolaki et al., 2019), Integrated
Project Delivery (Piroozfar et al., 2019), and Lean Construction and Procurement
(Tzortzopoulos et al., 2020). However, the reality of the processes across all project
phases is that very few firms are able to collaborate effectively (Daniotti et al., 2020b;
Owen et al., 2010). Interoperability issues between diverse BIM tools and design
systems still exist, as described in detail in Chapter 3 (p. 102) and Chapter 6 (p. 179). A
prerequisite to the successful development of collaborative processes across all
project phases is, however, the interoperability of diverse software. Therefore,
stakeholders in a supply chain would benefit from interoperability considerations by
the acquisition of new technology (Oti & Abanda, 2020).
The process of transformation to achieve CIDNZ will require a thorough analysis of
supply chain and team members for each project to ensure the optimal transition. The
analysis will serve in setting up a new organizational structure based on co-operation,
collaboration, acceptance, and respect. The professions of the team members should
correspond to the overall aim of the project, enabling for cross-disciplinary approach in
all of the four quadrants. The team members might belong to scientific fields of
architecture, building physics/science, engineering, design, psychology, environmental
sciences, project management, sociology, information technology, etc. Besides the
importance of technical equipment and organizational structure, communication,
conflict management, negotiation, and teamwork represent the essential factors of
successful collaboration (Papadonikolaki et al., 2019). Consequently, CIDNZ as a system
should improve the value of housing, not only in economic terms of delivering better
value in a shorter time and lower costs but relating to human needs and environment.
The latter two attributes also include architectural and aesthetical values, supporting
the well-being of occupants and the integration of buildings into the environment in a
sustainable manner. CIDNZ, therefore, requires a paradigm shift in values of all
involved stakeholders, inclusive users, developers, designers, and members of the
supply chain.
234
The CIDNZ processes include principles of Integrated Project Delivery (IPD) and Lean
design and construction. IPD is based on a contractual agreement between main
project parties (client, designer, and contractor) about collaboration, use of BIM, and
improvement of value for money by minimizing waste, inefficiency, and conflictual
relationships (Piroozfar et al., 2019). However, despite a growing interest in IPD, the
reality is that “… only few institutions are able to adapt their programs to meet this
need” (Ali, 2019, p. 2041). In the 1990s, Koskela applied a new production philosophy,
which started in Japan in the 1950s, to construction (Koskela, 1992). Since then, a
continual evolution of reconceptualization of construction as a production process and
the Lean design and construction movement are changing the AEC sector
(Tzortzopoulos et al., 2020). Lean represents improvements in the management and
production and is associated with just-in-time and implementation of information
technology to minimize excess labour or stock of goods (Koskela, 2020). Consequently,
the transformation in the AEC industry requires full integration of information and
automation systems. The necessary free flow of information is discussed in the
following section.
8.2.3 Interoperable Technologies
To successfully transform complex systems, such as the AEC sector in the 21st century,
implemented technologies in all stages have to be interoperable. Therefore, one of the
imperatives of the process of transformation to CIDNZ consists of the interoperability
analysis of the construction technology to achieve optimized solutions and higher
value levels in the AEC sector. The status quo and the problematic of interoperability
are assessed in Chapter 3, section 3.4.4.
Shirowzhan et al. (2020) describe construction technology as “… tools, systems,
mechanisms, computers, electronic boards and components, equipment and any
combination of resources used for carrying out physical construction activities in the
process of construction from design to demolition” (p. 2). Consequently, the
compatibility measures influence the building performance and the impact of the
construction process on the environment and economics. Improvements of
compatibility measures require changes in the information systems (BIM), business
processes, and management of business relationships to move “… from traditional red

235
ocean strategies, i.e., efficiency and differentiation, and aim at blue ocean strategies,
i.e. value innovation” (Grilo & Jardim-Goncalves, 2010, p. 530).
However, the current information management is still limited (with some exceptions)
to a complete model exchange, which leads to poor semantic integrity and loss of
information (Owen, 2009). Although many studies acknowledge the compatibility and
interoperability issues in software architecture (Haoues et al., 2017), they “… have not
been directly discussed in recent BIM standard investigations” (Shirowzhan et al.,
2020, p. 13). According to some researchers, the future of interoperable technologies
lies in semantic BIM and Semantic Web Services (Niknam & Karshenas, 2015). Other
examples of semantic systems are intelligent management of energy and security in
buildings (Santos et al., 2020), or real-world semantics for acquisition, processing, and
analysis of large volumes of data (Davies et al., 2020). From the practical point of view,
CIDNZ recommends including in the team an information manager, an interoperability
specialist responsible for determination of the optimal software and information flow
which suit the project the best. Additionally, free information exchange between all
stakeholders in all directions is crucial for CIDNZ for several reasons. Communication of
values, balance between built environment and nature, optimization of a design in all
quadrants, energy efficiency, and performance are some examples.
To achieve this, further development of semantic interoperability and information
science but the transformation of professionals’ education in the construction industry
are necessary. As already discussed in detail in section 7.3, data management and the
interlink between machines—objects—people and processes represent essential
attributes of the fourth industry revolution (Daniotti et al., 2020b). Therefore, to
enable the optimization and further analysis of an architectural project relevant,
coherent, complete, interoperable, and open data libraries should be available
(Daniotti et al., 2020c; Palos et al., 2014). Additionally, a precise semantic definition of
data exchange between implemented software will enable conflict-free data transfer
and minimize errors (Belsky et al., 2016). A significant transformation will happen in
information management by using sophisticated models, view- and rule-based
approaches (Santos et al., 2020). Simultaneously, companies will need to solve
problems related to software innovations and accommodation of new technology
together with the existing (Oti & Abanda, 2020). Therefore, CIDNZ suggests an
236
independent examination of compatibility and interoperability in the construction
technology context as a part of the transformation process.
8.2.4 Environmental Systems
The CIDNZ approach is of transformation with a transition towards the balance of
environmental systems. The explanation of interactions and processes in
environmental systems is, therefore, vital to the understanding of this transition. From
the integral view, the holarchy of environmental systems includes interconnected
natural and man-made holarchies with complex relations, processes, and impacts.
Natural systems are open and dependent on other systems, which are often of
anthropogenic origin (Eichhorn, 2016).
Therefore, CIDNZ comprehends the term “environmental systems” as an integration of
indoor and outdoor environments, ecology, resources, transport, climate, weather,
humans, and natural systems. Ferguson (2003) described an environmental system
(ecosystem) in the NZ Ministry of environment document Sustainable Wastewater
Management: A handbook for Smaller Communities as follows:
An ecosystem is a community of interacting organisms and the physical environment in which they live. Humans and their buildings and settlements are part of this community, which can include birds, plants and insects, as well as inorganic matter (such as rock and metals) and natural forces (such as the flow of water, fire, or the chemistry of photosynthesis4). All of these link together and interact as a complex web of life. (p. 11)
This holistic approach to the environment has deep roots in many indigenous
traditions. For example, Māori worldview, mātauranga Māori, is based on a belief in
the deep spiritual connection between people and the environment (all living and non-
living things) (Kahui & Cullinane, 2019). This means that the relationships between
humans and environmental systems determine decisions, rather than their effects. In
this sense, CIDNZ might learn about the interconnectedness of all things from the
Māori theory of the origin of the universe. Māori people believe that “… any actions
that change or degrade the mauri5 of one thing will have a corresponding impact on
4 „Photosynthesis occurs in all green plants. It is the process by which sunlight is used to turn carbon dioxide and water into sugar and oxygen” (Ferguson, 2003, p.11). 5 Mauri represents „… life principle, life force, vital essence, special nature, a material symbol of a life principle, source of emotions - the essential quality and vitality of a being or entity. Also used for a

237
the form or integrity of another” (Ferguson, 2003, p. 15). Therefore, for many Māori,
the respect for the physical environment coincides with the obligatory protection and
safeguarding of mauri as an essence located inside of each entity. Māori people see
humans “… as an integral part of the ecosystem” (Kahui & Cullinane, 2019, p. 2). On
the contrary, the prevailing worldview sees nature (ecosystem) and humans (human
activities) as separated. However, the indigenous collective leadership principles might
be beneficial to all complex adaptive systems that are resilient, non-linear, and
interdependent, such as shared leadership in teams engaged in a creative task (Cullen-
Lester & Yammarino, 2016). The core of the Māori collective leadership as a multi-
dimensional paradigm forms the knowledge code, which is “… a way of tapping into
and releasing collective intelligence that is transmitted from one generation to the
next” (Spiller et al., 2020, p. 531). Therefore, a leader, a rangatira6 represents the
ability to being a paradigm warrior, working on its potential, supporting and leading
people toward a state of belonging and flourishment (Māori Dictionary, n.d.).
However, these principles are not about any individual leader but a complex of roles
and responsibilities (Spiller et al., 2020).
Therefore, understanding what the environmental systems represent and how they
are formed, interconnected, and interdependent is vital to the CIDNZ transformation
process. The buildings and built environment configure a subset of environmental
systems, which include natural systems and people. Consequently, the researcher
believes that the built environment has to fit into the environmental systems if
humanity is to survive in the long term. The system approach requires a more
sophisticated way of thinking about environmental systems. Simultaneously, a
question arises about the flexibility and balance of these systems. Therefore, the
strong transition involves the integration of science in diverse fields, identification of
problems, adaptation and redesign of critical systems in the AEC industry, and
management of the transformation process.
physical object, individual, ecosystem or social group in which this essence is located” (Māori Dictionary, n.d.). 6 Rangatira means „… chief (male or female), chieftain, chieftainess, master, mistress, boss, supervisor, employer, landlord, owner, proprietor - qualities of a leader is a concern for the integrity and prosperity of the people, the land, the language and other cultural treasures (e.g. oratory and song poetry), and an aggressive and sustained response to outside forces that may threaten these” (Māori Dictionary, n.d.).

238
8.3 Framework for Designers
This study is concerned with improvements in housing quality, especially with the
hygrothermal performance of buildings. However, as delineated in the previous
chapters, the problematic of built environment sustainability is of such complexity and
interconnectedness that the real and long-lasting improvements require a system
approach.
The complexity of the built environment might be demonstrated in hygrothermal
relations in buildings. Although buildings without a vapour barrier can have satisfying
moisture performance by fluctuations of RH (Salonvaara et al., 2004), the probability of
uncontrolled in-wall condensation, mould growth, or rotting is very high (Domhagen &
Wahlgren, 2017). Therefore, several researchers suggest an airtight but vapour
permeable building envelope (Simonson et al., 2005; Yarbrough et al., 2019).
Nevertheless, as already mentioned, the design and construction of sustainable and
energy efficient buildings require consideration of multiple factors, including
hygrothermal relations. During the process, designers of sustainable buildings need to
answer many questions. For example, how high are the moisture loads into the wall? Is
the drying process possible? How long would the drying out take? Is the wall
construction diffusion open? If yes, how does such construction perform in the long
term? Is there any risk of additional wetting of the building envelope from driving rain,
melting of frozen water, or excessive indoor RH? How could the building adjust to
future usage needs?
The design process that follows an integral approach might eliminate most of the
problems described in this research. Therefore, this research proposes a new
framework for designers to improve the sustainability of housing. The elements of the
framework are not new, but the concept of the design process is. The basic idea
behind this concept is to create habitable spaces for people in harmony with nature
and natural forces, not against it. The holistic architecture is copying nature in its
function, as several researchers emphasize (Esbjörn-Hargens, 2005; Yarbrough et al.,
2019). The integral sustainable design takes natural systems as a model for design and
develops an ecological literacy that understands and applies the principles of
ecosystem structure, process, and organization (DeKay & Bennett, 2011). For example,

239
the concept of integrated environmental approach stresses the necessity of
simultaneous consideration of the building structure, energy efficiency, indoor
environmental quality, and moisture management during the whole design process
(Bomberg, Gibson, et al., 2015; Bomberg et al., 2016). This does not mean that the
design has to be simple or boring. This means that the design process implements a
system approach to buildings as a vital part of the environmental systems, goes from
the environment to humans, and offers unlimited possibilities.
“Nature is no longer just a thing” (p.3), as Justice Antonio Herman Benjamin of the
High Court of Brazil stated:
Granting rights to Nature reflects a profound change from the traditional legal wisdom which once considered Nature just a collection of elements and now sees Nature as the meaning and foundation of all life. This shift in paradigm, once the topic of philosophical and ethical circles, now reveals itself as a legal paradigm. (The United Nations, 2019, p. 3)
Therefore, future housing and the related design and construction process need
radical changes. The concerns are not limited to energy efficiency, CO₂ reduction, or
moisture, but include issues related to environmental systems, humans, and Nature.
To radically improve the quality of housing in NZ the AEC industry has to consider
customer requirements and needs at early construction planning stages.
Simultaneously, the designer team needs to manage the increased complexity of
buildings and their construction. This research introduces a complex integral
framework that integrates construction planning and design, optimization, and control
tools at strategic, tactical, and operational levels. The framework offers stakeholders
the possibility to actively engage in the design process, influence the impact of the
building on the environment, and be informed about concurrent design variants.
Figure 38 depicts the structural relationship model of the framework with the
influencing factors and design defects. With the paradigm shift in mind, the following
sections briefly describe four steps in the CIDNZ framework for designers.
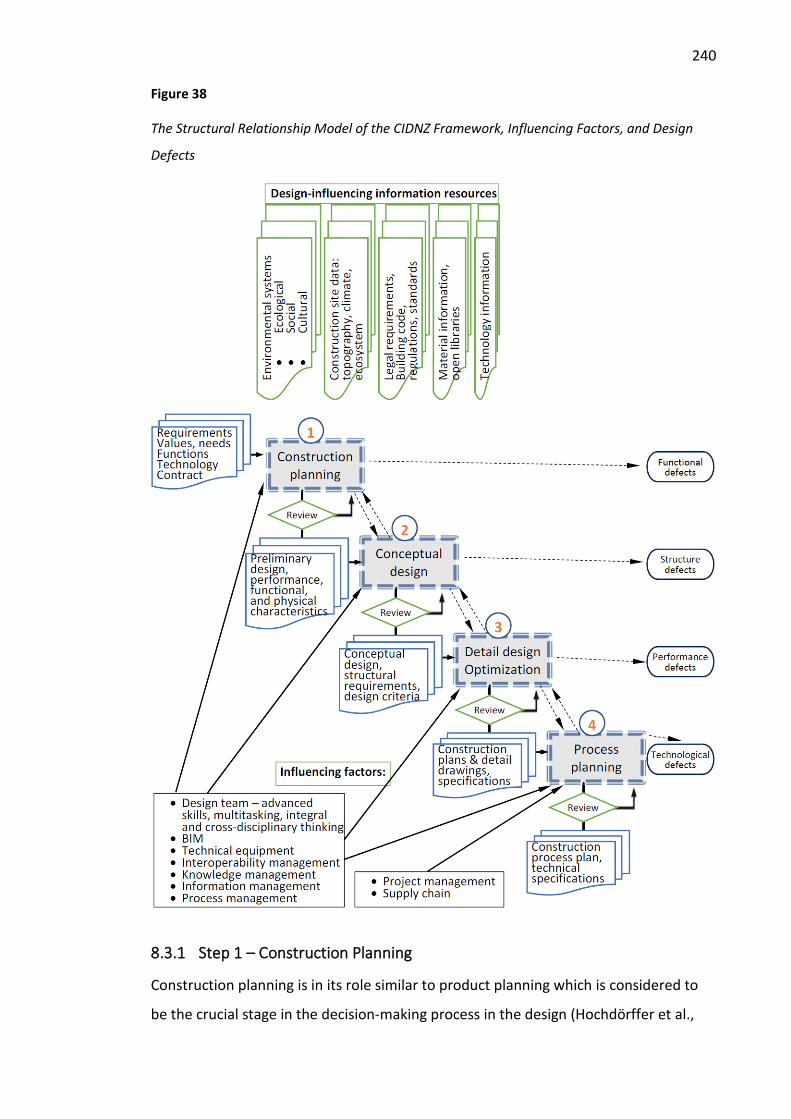
240
Figure 38
The Structural Relationship Model of the CIDNZ Framework, Influencing Factors, and Design
Defects
8.3.1 Step 1 – Construction Planning
Construction planning is in its role similar to product planning which is considered to
be the crucial stage in the decision-making process in the design (Hochdörffer et al.,

241
2018). This step in CIDNZ involves the identification of values and functions,
customer/user needs, resources, and analysis of construction site, climate, ecological,
social and cultural environment. The outcome of construction planning encompasses
preliminary design decisions, building performance objectives, time schedule, design
resources, knowledge, and technology. At this stage, designers aim to eliminate
functional defects in the design (Zheng et al., 2018). The preliminary design contains
fundamental decisions about solar gains, thermal mass, and ventilation. The designing
process in the first step follows the recommendations for the high quality environment
buildings (Bomberg et al., 2016). It is based on the principles of climate specific design
(Mitterer et al., 2012) and climate-responsive design (Looman, 2017). The origin of the
latter two design philosophies might be tracked from the early 1950s when Olgyay first
introduced the term bioclimatic design. The original publication of Olgyay’s Design
with Climate book (1963) laid the foundation for an architecture based on outdoor
climate (Olgyay et al., 2015).
Different outdoor conditions and the intended use of the building require divergent
construction concepts to achieve energy efficiency, healthy indoor environment, and
durability of the building. Designers/architects decide in the early design stage about
the size, position and orientation of the building, insulation, fenestration, air-tightness,
zoning, need for heating and cooling, mechanical or natural ventilation, shading, and
thermal mass. Therefore, preliminary design, as a result of this stage, is based on the
multidisciplinary holistic approach to the creation of new spatial objects in the existing
environment. The successful applications of bioclimatic factors into BIM sustainable
architectural design require an extensive knowledge in biology, climatology, and
building physics (Bondars, 2013). Therefore, a crucial part of the suggested framework
for designers consists of the further education of the team members. The
interdisciplinary knowledge might enhance the ability to understand and adequately
interpret the relations between the indoor and outdoor climate conditions, and the
involved environmental systems.
8.3.2 Step 2 – Conceptual Design
At the conceptual design stage, demands, functions, and values need to be prioritized
and identified from the perspective of all four quadrants. Therefore, CIDNZ ads to the
242
technical system and human use perspectives (Ai et al., 2020), which represent the
behavioural view (the upper right quadrant), intentional, social, and cultural
perspectives.
At this stage, decisions are made which have an influence on the final carbon
emissions (Ai et al., 2020), thermal and hygrothermal performance, indoor air quality,
and the impact on the environment and human well-being. Designers aim to eliminate
structure defects in the design (Zheng et al., 2018). The second step in the proposed
design framework comprises, therefore, of the determination of building structure,
materials, assemblies, and technical systems. The objective of this stage is to optimize
the thermal and hygrothermal performance of the building, and minimize negative
impacts on the environment and humans. The designer considers diverse factors, such
as the energy demand of the building (in-build and operational), durability and quality
of materials, risk of surface and interstitial condensation, and permanent wetting of
the construction (wind-driven rain). Therefore, the composition of the roof and
exterior walls should respect the outdoor and indoor situation to achieve a high energy
efficiency and good hygrothermal performance of the building envelope.
Additionally, internal walls and ceilings provide a valuable area for moisture and
thermal buffering. This research suggests distinguishing between the hygrothermal
functions of internal elements and building envelope. This is new knowledge of this
research, which allows for enhanced moisture management in buildings without
affecting the primary functions of the building envelope. Practical moisture buffering
(sorption and desorption of water) on a regular basis is according to the effective
moisture penetration depth (EMPD) model only possible in a thin surface layer of
indoor material (Cunningham, 1992; Wan et al., 2019; Woods & Winkler, 2018).
Accordingly, for every hygroscopic material might be set an optimal moisture buffering
thickness (Maskell et al., 2018). Therefore, the proposed hypothesis takes into account
the first 10-20 mm of the top inside layer of indoor surfaces. By some materials, such
as the earth is only a thin layer (4 mm) sufficient to effectively manage the indoor RH
amplitude (Labat et al., 2016). Therefore, the selection of building materials and their
purposeful placement represent an active approach to passive regulation of indoor RH
(Brauner et al., 2016).
243
8.3.3 Step 3 – Detail Design and Optimization
The third step in the proposed framework by using BIM contains the incorporation of
whole building energy simulation tools, such as DOE-2 or EnergyPlus (Gao et al., 2019;
Maile et al., 2007; Pezeshki et al., 2019), and whole building hygrothermal simulation
tools, such as WUFI Plus into the design process (Pazold et al., 2014; Winkler et al.,
2014; Yu et al., 2019). The choice of building simulation programs depends on the
personal experience of the designer, available hardware, and the frequency of usage
(Harish & Kumar, 2016). Due to the fact that the sophisticated hygrothermal analysis
by numerical simulation assesses building hygrothermal performance under real
climatic conditions, diverse design options might be tested. The computer modelling
WUFI Plus, which is fully compatible with BS EN 15026 (British Standards, 2007a),
simulates the interactions between the building envelope, building services, outdoor
conditions, and the proposed use of the building. The hygrothermal modelling is
described more in detail in Chapter 5 (p. 156).
At this stage, designers aim to eliminate performance defects in the design (Zheng et
al., 2018). Therefore, during the third stage of the design process, designers should
consider the physical properties of the construction, humidity generated by
occupancy, and external climate. The considerations include thoughts about the shape
and orientation of the building in relation to the site topography, prevailing winds,
sunlight, shade from the surroundings, and possible water intrusions (driving rain). The
tasks in this design stage are in accordance with the recommendations of BS
5250:2011+A1:2016 Code of Practice for Control of Condensation in Buildings (British
Standards, 2016). The assessment of the risk of surface and interstitial condensation
and mould growth should follow the methods described in BS EN ISO 13788 (British
Standards, 2012b). Consequently, the incorporating of moisture transport mechanisms
into the decision process might prevent the underestimation of heating and cooling
energy (Yu et al., 2019). Research shows that energy consumption by consideration of
moisture effects might be significantly higher than by thermal simulation only (Kreiger
& Srubar, 2019; Moon et al., 2014). Consequently, the employment of both thermal
and hygrothermal simulation enables the evaluation of proposed construction and
building materials. It supports decisions during the early stages of the design process
when the costs for changes are the lowest (Gao et al., 2019).
244
Since the design defects are the prevalent causes of future costs during the
construction process and building usage (Al-Hammad, 1997; Ali, 2013), it is vital to
incorporate simulation as a means of design check and optimization. The causes of the
design defects are multiple, such as a lack of knowledge, time and costs pressure, or
lack of motivation (Josephson & Hammarlund, 1999; Othman et al., 2015). However,
design defects are rarely mentioned in NZ, where most studies are concentrating on
the defects caused by substandard workmanship or low quality of building materials
(Page, 2015; Rotimi et al., 2015). Nevertheless, CIDNZ recognizes the value of defect-
free housing design, and therefore, introduces the concept of concurrent engineering
into the construction industry in NZ. Concurrent engineering is based on the
integration and concurrency as two fundamental design principles (Zidane et al., 2015).
Integrated concurrent design considers information from all lifecycle issues and uses a
multidisciplinary approach to the optimization of the end-product/building. Therefore,
designers concentrate on functionality and performance design in the process of
construction modelling (Zheng et al., 2018). Stakeholders, particularly supply chain
members and users, are integrated into the design process in the early phases, which
potentially benefit the project.
The steps described in the proposed framework might need to be repeated during the
design process to achieve optimal thermal and hygrothermal performance of the
building. For example, simulation results reveal that the decisions about fenestration
in the preliminary design (first step) might cause overheating in summer. Therefore,
the design needs changes to reduce solar radiation into the building. However, every
decision requires thoughts about the impact of such changes on the whole system,
particularly future users. In this example, thoughts need to be given concerning
daylight, shading, energy balance during winter and summer, etc. Therefore, designers
should include building performance analysis into the design process. Building
performance analysis enables ensuring that buildings meet the minimum performance
thresholds as required by law, besides that the quality of indoor environment,
sustainability and energy savings might be optimized. This requires the incorporation
of other building performance domains, such as lighting, sound, ventilation, indoor air
quality, and others (de Wilde, 2019).

245
8.3.4 Step 4 – Process Planning
The fourth step in the proposed framework is the final stage of the design process,
which simultaneously constitutes the first part of the construction process. Process
planning connects (in any manufacturing system) product design to manufacturing
(Barzanji et al., 2020). The construction process is a manufacturing process with
several specific characteristics (Dallasega et al., 2020). Therefore, the integration of
process planning into CIDNZ might enhance the efficiency of the construction process,
save time and costs. During this stage, the designer team finalizes the building design
and specifications as the result of the optimization process of the previous three
stages. Designers aim at this stage to eliminate technological defects in the design
(Zheng et al., 2018). The outcome of process planning includes construction process
plan and the technical documentation, such as drawings for construction, design
specifications, and other necessary documentation.
Construction process planning and control in CIDNZ might implement diverse activity,
location, or objects-based methodologies, such as critical path method (CPM), earned
value analysis (EVA), last planner system (LPS), line of balance (LOB), Flowline, location
based management system (LBMS), and building information modelling (BIM)
(Dallasega et al., 2020). The choice of the project-specific and suitable methodology or
their combination depends on the project planning, scheduling, and monitoring
perspective of the project execution team.
8.4 Integration of the System Approach
CIDNZ seeks to complement the construction process with a complex integral system
through integration spanning from design intent to successful commissioning,
operation and maintenance in balance with nature and well-being of humans.
Civilization resilience, expressed as the relationship between environmental systems
(inclusive social, political, economic, and ecological structure) and well-being, relies on
knowledge, institutions, and infrastructure (Cousins, 2016).
ISO/IEC/IEEE International Standard (2017) defines system integration as “…
progressive assembling of system components into the whole system” (p. 454). The
integration process of the system approach, therefore, depicts three significant
features: knowing, doing, and inhabiting. CIDNZ is an interdisciplinary, multi-level, and

246
evolving knowledge system that integrates building physics, systems and integral
thinking, modelling, energy calculations, design and architecture, comfort analysis,
building services design, management, and other academic fields. However, some
knowledge is only possible by learning-by-doing (Ikeda, 2020). Therefore, CIDNZ
encourages creativity, curiosity, innovative thinking and testing results. Especially,
finding new ways to look at things and new collaborations which might bring diversity
and improve solutions to existing problems. As DeKay and Bennett (2011) wrote: “…
An Integral Design Theory has to be not only explanatory but also analytic, generative
and evaluative” (p. 433). Equally crucial to innovative thinking is to share knowledge.
Therefore, life-long education and communication of what we know supports the
integration process.
CIDNZ is contemporaneously an action system. By “doing”, CIDNZ integration provides
a platform for change. The goal is to raise standards by framing the cross-disciplinary
problem in zero-energy sustainable housing. As already mentioned earlier (in section
3.1.3), all homes in NZ have to be built to the minimum legal standards. However, the
NZ Building Code is behind the international standards for comparable climate
(International Energy Agency, 2017; OECD, 2017). Consequently, the costs over the
whole life cycle of the houses built to the minimum legal standards are much higher
than by houses built to a higher standard (Ade & Rehm, 2019). Therefore, CIDNZ
advocates for code changes to promote better results.
The inhabiting of the evolving knowledge and action brings clear communication
about the integral meaning of sustainability and leadership in times of change.
Therefore, CIDNZ might improve on our understanding of housing design, mobilize and
activate creativity, and bring innovations. The complex integral approach to design is a
new way of how to adapt the built environment to the changing world. The integration
of the system approach might follow a spiral development of thinking which Hokoi
(2019) employed by his hygrothermal research and described as:
Understand an issue through simplification, complicate the issue by looking at it in a complicated manner or extending the issue, and simplify the complicated issue again by looking at it with a more advanced and clearer understanding. (p. 5)

247
Consequently, with the look of an advanced and more precise understanding, the
following section evaluates the process of transformation and integration of the
system approach.
8.4.1 Evaluation of CIDNZ
Radical changes are necessary to achieve cost-effectiveness, waste and energy
reduction, health enhancement of people, and harmonization of the built environment
with the natural system on Earth. CIDNZ expresses a proposal on how to achieve these
changes. This section addresses thoughts and questions about the evaluation of the
integration process. How to evaluate a complex process which embodies not
quantifiable measures? Another question accrues when we consider the value of the
well-being of people. How might we measure the success of a project in these
dimensions? The researcher suggests the evaluation of CIDNZ as a system that can be
measured, refined, and optimized.
CIDNZ evaluation is not based on a points system because values of a multilevel and
complex system may not be interchangeable or attainable due to their diverse
qualitative and quantitative measures (Moore et al., 2019). Additionally, composite
finite sums are markedly different from simple finite sums. The defining properties of
simple finite sums and their fundamental recurrence identity are no longer valid
(Alabdulmohsin, 2018). The assessment of complex system changes needs to account
for time, as effects of feedback loops emerge over time (Moore et al., 2019).
Therefore, the CIDNZ system inhabits a feedback loop, which leads inescapably to
improvements. The feedback is supported by a sense of internal conviction that the
design team is willing to find the optimal design solution. The system is based on the
integral and critical thinking which seeks adversity and willingness to change not only
the opinion but the rules as well. This system is supporting the belief that it exists in
multiple ways to reach the goal. Therefore, the evaluation of this system forms holistic
and perspectival answers to the question of how good the system serves the goal
towards the well-being of people and balance with nature.
System Definition and Structure
Systems and Software Engineering Vocabulary defines a system as:
248
1. combination of interacting elements organized to achieve one or more stated purposes
2. product of an acquisition process that is delivered to the user 3. something of interest as a whole or as comprised of parts 4. interacting combination of elements to accomplish a defined objective 5. set of interrelated or interacting elements. (ISO/IEC/IEEE International
Standard, 2017, p. 453).
The integration of the system approach will, therefore, require more research and
detailed system description and analysis to determine the organization, information,
hardware and software requirements, and processes of the CIDNZ system.
Simultaneously, to identify relations inside of the system and to other systems.
Therefore, the following section delineates the evaluation characteristics of the CIDNZ
elements, which will need further development.
System Elements
This research proposes an evaluation of the system based on the four elements
described in section 8.2: people, processes across all project phases, interoperable
technologies, and environmental systems. The system elements are evaluated by using
the integral approach with an application of perspectival mindsets. This means that the
evaluation aims a multi-perspectival and holistic characteristic. This section suggests
the broad characteristics of the evaluation process, which will need further
development and specification in detail.
The evaluation of the people-element involves the identification and evaluation of
values related to individuals, such as team members and stakeholders (inclusive
users/inhabitants and supply chain members), and collectives, such as cultures and
societies. Table 31 depicts some of the suggested values.
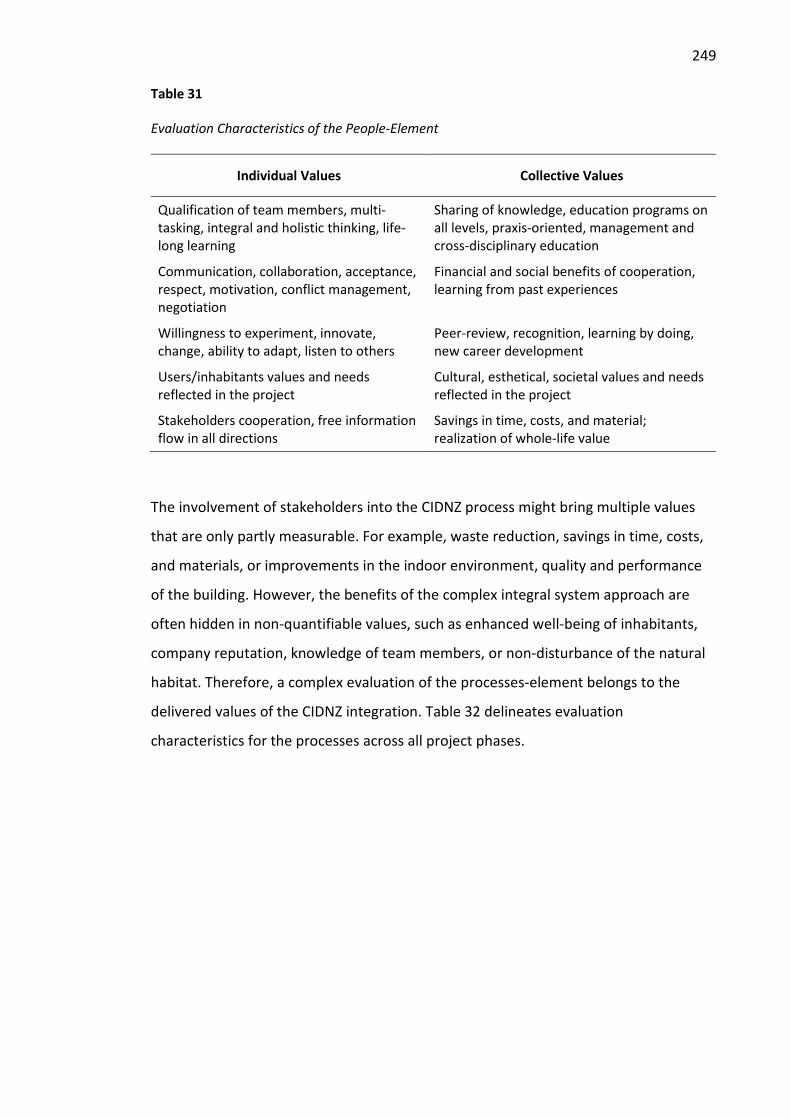
249
Table 31
Evaluation Characteristics of the People-Element
Individual Values Collective Values
Qualification of team members, multi-tasking, integral and holistic thinking, life-long learning
Sharing of knowledge, education programs on all levels, praxis-oriented, management and cross-disciplinary education
Communication, collaboration, acceptance, respect, motivation, conflict management, negotiation
Financial and social benefits of cooperation, learning from past experiences
Willingness to experiment, innovate, change, ability to adapt, listen to others
Peer-review, recognition, learning by doing, new career development
Users/inhabitants values and needs reflected in the project
Cultural, esthetical, societal values and needs reflected in the project
Stakeholders cooperation, free information flow in all directions
Savings in time, costs, and material; realization of whole-life value
The involvement of stakeholders into the CIDNZ process might bring multiple values
that are only partly measurable. For example, waste reduction, savings in time, costs,
and materials, or improvements in the indoor environment, quality and performance
of the building. However, the benefits of the complex integral system approach are
often hidden in non-quantifiable values, such as enhanced well-being of inhabitants,
company reputation, knowledge of team members, or non-disturbance of the natural
habitat. Therefore, a complex evaluation of the processes-element belongs to the
delivered values of the CIDNZ integration. Table 32 delineates evaluation
characteristics for the processes across all project phases.
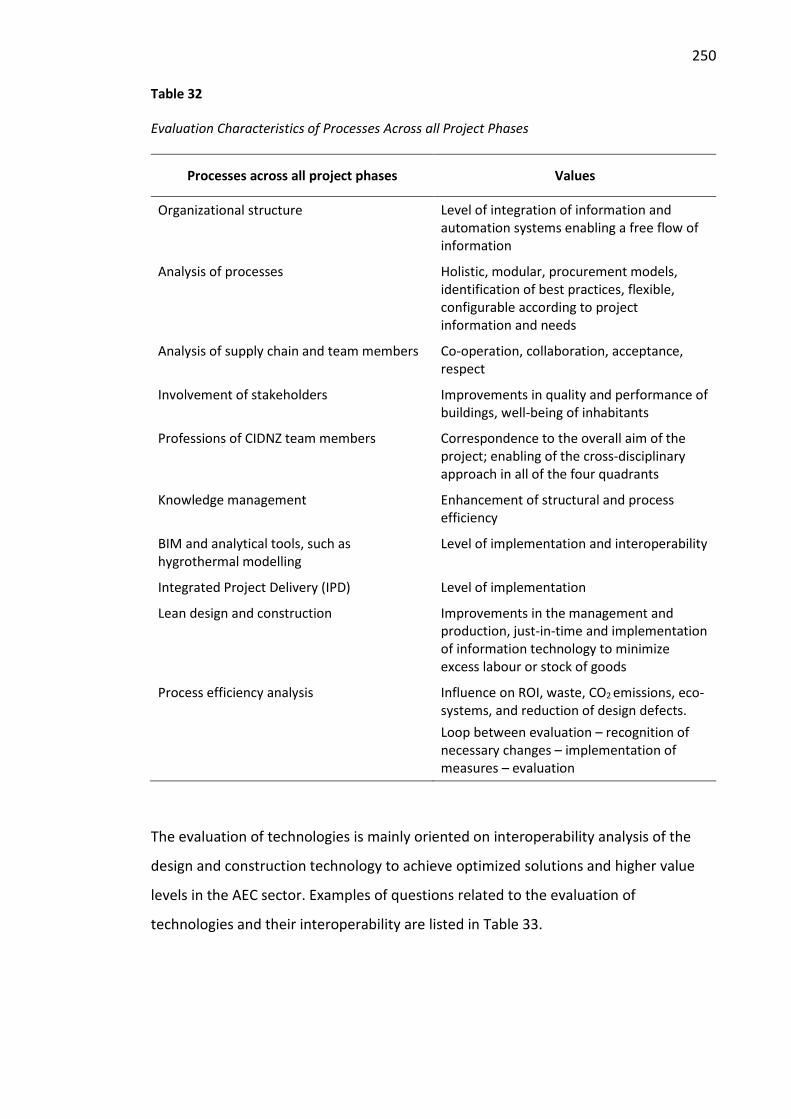
250
Table 32
Evaluation Characteristics of Processes Across all Project Phases
Processes across all project phases Values
Organizational structure Level of integration of information and automation systems enabling a free flow of information
Analysis of processes Holistic, modular, procurement models, identification of best practices, flexible, configurable according to project information and needs
Analysis of supply chain and team members Co-operation, collaboration, acceptance, respect
Involvement of stakeholders Improvements in quality and performance of buildings, well-being of inhabitants
Professions of CIDNZ team members Correspondence to the overall aim of the project; enabling of the cross-disciplinary approach in all of the four quadrants
Knowledge management Enhancement of structural and process efficiency
BIM and analytical tools, such as hygrothermal modelling
Level of implementation and interoperability
Integrated Project Delivery (IPD) Level of implementation
Lean design and construction Improvements in the management and production, just-in-time and implementation of information technology to minimize excess labour or stock of goods
Process efficiency analysis Influence on ROI, waste, CO2 emissions, eco-systems, and reduction of design defects. Loop between evaluation – recognition of necessary changes – implementation of measures – evaluation
The evaluation of technologies is mainly oriented on interoperability analysis of the
design and construction technology to achieve optimized solutions and higher value
levels in the AEC sector. Examples of questions related to the evaluation of
technologies and their interoperability are listed in Table 33.
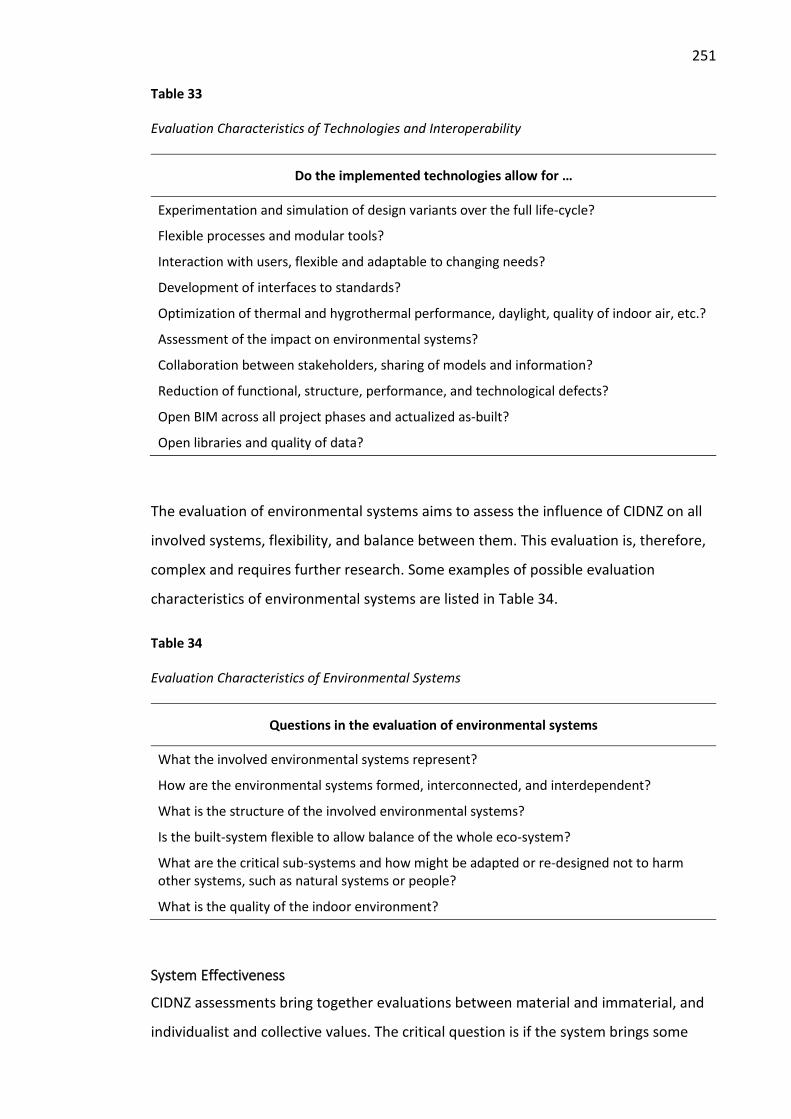
251
Table 33
Evaluation Characteristics of Technologies and Interoperability
Do the implemented technologies allow for …
Experimentation and simulation of design variants over the full life-cycle?
Flexible processes and modular tools?
Interaction with users, flexible and adaptable to changing needs?
Development of interfaces to standards?
Optimization of thermal and hygrothermal performance, daylight, quality of indoor air, etc.?
Assessment of the impact on environmental systems?
Collaboration between stakeholders, sharing of models and information?
Reduction of functional, structure, performance, and technological defects?
Open BIM across all project phases and actualized as-built?
Open libraries and quality of data?
The evaluation of environmental systems aims to assess the influence of CIDNZ on all
involved systems, flexibility, and balance between them. This evaluation is, therefore,
complex and requires further research. Some examples of possible evaluation
characteristics of environmental systems are listed in Table 34.
Table 34
Evaluation Characteristics of Environmental Systems
Questions in the evaluation of environmental systems
What the involved environmental systems represent?
How are the environmental systems formed, interconnected, and interdependent?
What is the structure of the involved environmental systems?
Is the built-system flexible to allow balance of the whole eco-system?
What are the critical sub-systems and how might be adapted or re-designed not to harm other systems, such as natural systems or people?
What is the quality of the indoor environment?
System Effectiveness
CIDNZ assessments bring together evaluations between material and immaterial, and
individualist and collective values. The critical question is if the system brings some
252
balance between these values and if the balance can be maintained during the whole
life cycle. The system evaluation starts, therefore, with the system description “…
defining the organization, essential characteristics and the hardware and software
requirements of the system” (ISO/IEC/IEEE International Standard, 2017, p. 453).
The next step in the evaluation process represents the description of the system
breakdown structure (SBS). ISO/IEC/IEEE 24748-4:2016, Systems and Software
Engineering - Life Cycle Management - Part 4: Systems Engineering Planning, 4.12
defines SBS, as cited in ISO/IEC/IEEE International Standard (2017), as:
1. system hierarchy, with identified enabling systems, and personnel that is typically used to assign development teams, support technical reviews, and to partition the assigned work and associated resource allocations to each of the tasks necessary to accomplish the technical objectives of the project. (p. 453)
SBS forms the basis for cost tracking and control, and supports system effectiveness
analysis to determine the level of the system’s performance in the intended
environment (ISO/IEC/IEEE International Standard, 2017). In this point, a clear
distinction between possible complementary effectiveness analyses should assist the
interpretation of the analysis results. The CIDNZ evaluation and transformation include
sustainability assessment, which “… always involves social systems that have their own
perspectives, with meaning, values, and logics” (Alrøe & Noe, 2016, p. 5).
Therefore, two kinds of complementary assessment tools should be developed. Each
of these tools has different perspectives and values. An entire CIDNZ assessment tool,
describing in detail and evaluating the implementation of the complex integral system
approach to building industry, and a swift CIDNZ assessment tool, allowing for the fast
overview, learning, and motivation. The swift CIDNZ assessment tool will constitute a
set of criteria (Table 35). The analysis of these criteria will lead to an evaluation of
multiple integration aspects but no quantification nor ranking. The purpose of this tool
is to support the integration process and help to identify areas that need attention or
more development. Therefore, coaching for appropriate tool use should accompany
the integration process of the system approach and its evaluation.
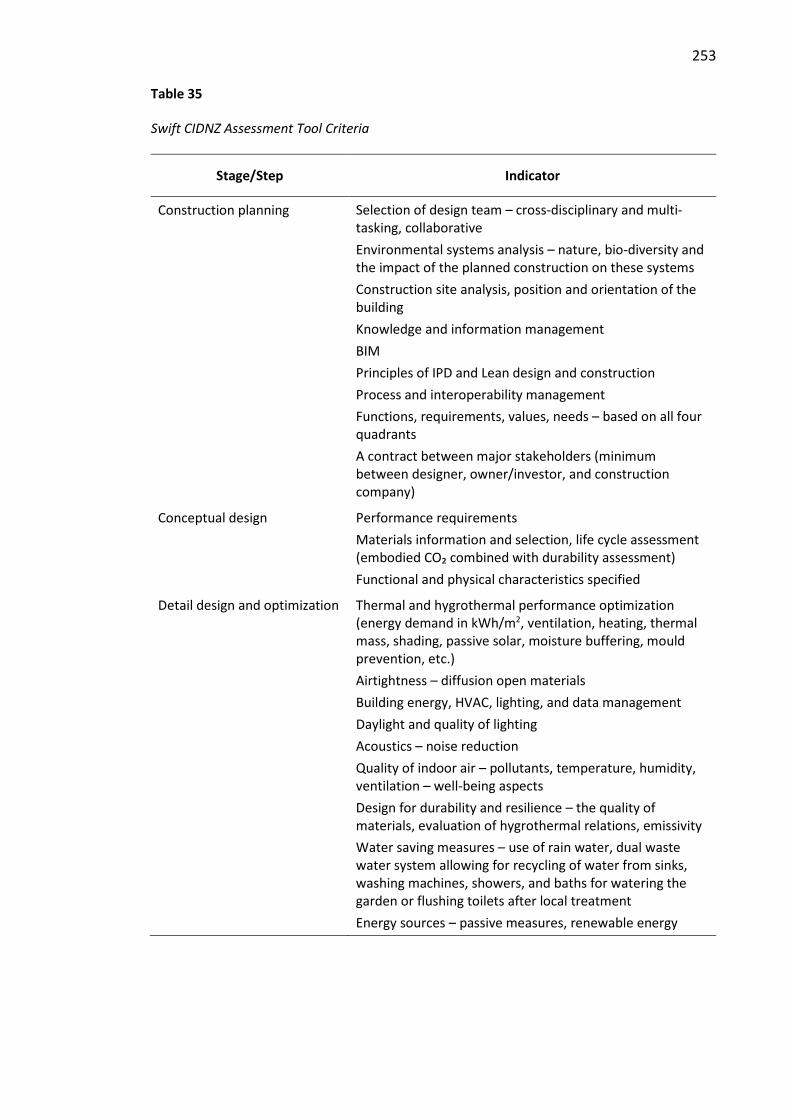
253
Table 35
Swift CIDNZ Assessment Tool Criteria
Stage/Step Indicator
Construction planning Selection of design team – cross-disciplinary and multi-tasking, collaborative Environmental systems analysis – nature, bio-diversity and the impact of the planned construction on these systems Construction site analysis, position and orientation of the building Knowledge and information management BIM Principles of IPD and Lean design and construction Process and interoperability management Functions, requirements, values, needs – based on all four quadrants A contract between major stakeholders (minimum between designer, owner/investor, and construction company)
Conceptual design Performance requirements Materials information and selection, life cycle assessment (embodied CO₂ combined with durability assessment) Functional and physical characteristics specified
Detail design and optimization Thermal and hygrothermal performance optimization (energy demand in kWh/m2, ventilation, heating, thermal mass, shading, passive solar, moisture buffering, mould prevention, etc.) Airtightness – diffusion open materials Building energy, HVAC, lighting, and data management Daylight and quality of lighting Acoustics – noise reduction Quality of indoor air – pollutants, temperature, humidity, ventilation – well-being aspects Design for durability and resilience – the quality of materials, evaluation of hygrothermal relations, emissivity Water saving measures – use of rain water, dual waste water system allowing for recycling of water from sinks, washing machines, showers, and baths for watering the garden or flushing toilets after local treatment Energy sources – passive measures, renewable energy
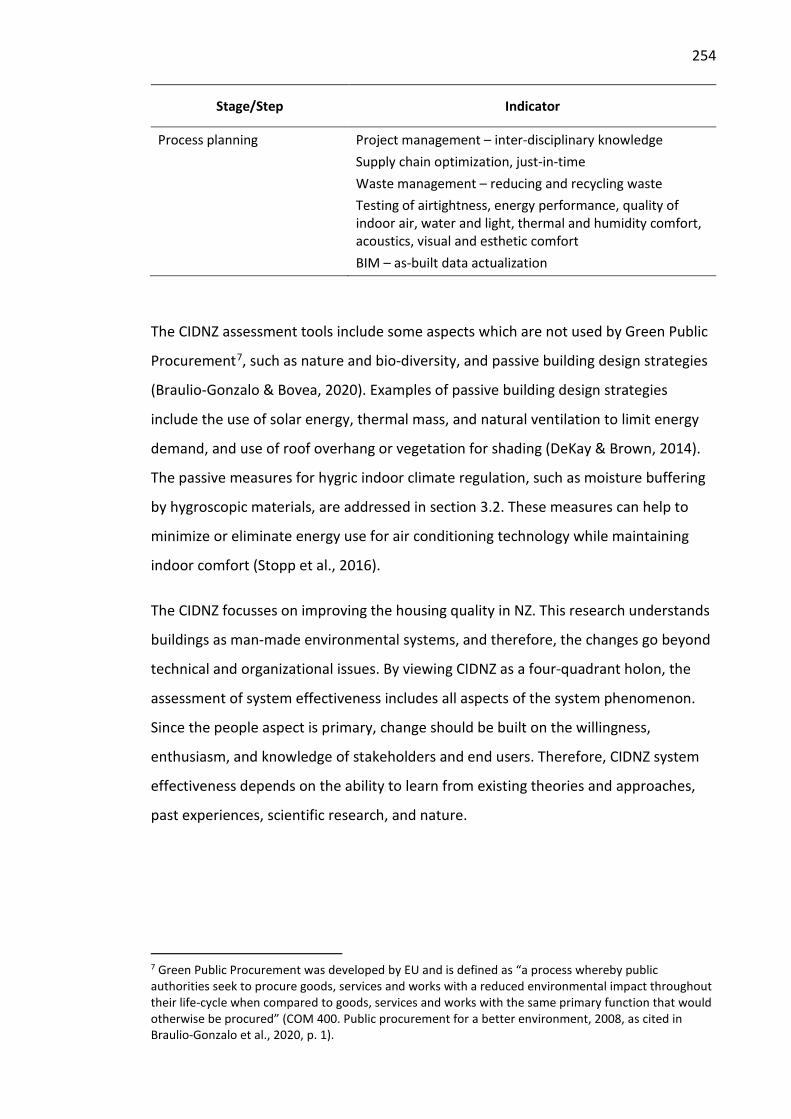
254
Stage/Step Indicator
Process planning Project management – inter-disciplinary knowledge Supply chain optimization, just-in-time Waste management – reducing and recycling waste Testing of airtightness, energy performance, quality of indoor air, water and light, thermal and humidity comfort, acoustics, visual and esthetic comfort BIM – as-built data actualization
The CIDNZ assessment tools include some aspects which are not used by Green Public
Procurement7, such as nature and bio-diversity, and passive building design strategies
(Braulio-Gonzalo & Bovea, 2020). Examples of passive building design strategies
include the use of solar energy, thermal mass, and natural ventilation to limit energy
demand, and use of roof overhang or vegetation for shading (DeKay & Brown, 2014).
The passive measures for hygric indoor climate regulation, such as moisture buffering
by hygroscopic materials, are addressed in section 3.2. These measures can help to
minimize or eliminate energy use for air conditioning technology while maintaining
indoor comfort (Stopp et al., 2016).
The CIDNZ focusses on improving the housing quality in NZ. This research understands
buildings as man-made environmental systems, and therefore, the changes go beyond
technical and organizational issues. By viewing CIDNZ as a four-quadrant holon, the
assessment of system effectiveness includes all aspects of the system phenomenon.
Since the people aspect is primary, change should be built on the willingness,
enthusiasm, and knowledge of stakeholders and end users. Therefore, CIDNZ system
effectiveness depends on the ability to learn from existing theories and approaches,
past experiences, scientific research, and nature.
7 Green Public Procurement was developed by EU and is defined as “a process whereby public authorities seek to procure goods, services and works with a reduced environmental impact throughout their life-cycle when compared to goods, services and works with the same primary function that would otherwise be procured” (COM 400. Public procurement for a better environment, 2008, as cited in Braulio-Gonzalo et al., 2020, p. 1).
255
8.5 Conclusions
The CIDNZ approach is of transformation, in which the first phase is of strong
transition. The strong transition involves the integration of science in diverse fields,
identification of problems, adaptation and redesign of critical systems in the AEC
industry, and management of the transformation process.
The suggested integration of scientific achievements, available tools, and partial
knowledge into the design process of houses in a holistic and integral way - named
Complex Integral Design New Zealand (CIDNZ) - is designed to change the quality of
houses. The proposed framework is introducing a new perspective on how to design
warmer, drier, and healthier houses for the NZ context. CIDNZ encourages
architectural and engineering design to adopt a new way of thinking, which is based on
integrative and interdisciplinary principles. The perspective of the design process
transforms from originally cost-oriented view (cheap and fast built) to a complex
system to create healthy, energy-efficient, zero-energy buildings without a negative
influence on the environment and in harmony with life and nature.
The end-users might apply the presented CIDNZ system in stages or, alternatively, start
with an encouragement of complex integral thinking. This way, the principles might be
easily adapted to the existing business structure and develop with time on the basis of
“learning by doing”. However, the application of the CIDNZ principles requires a guided
and encouraged transformation process. The core of the transformation lies in the
values and worldview which each stakeholder holds. Consequently, CIDNZ introduces a
novel understanding of sustainability in housing. Sustainable system succours to
establish and maintain a balance between individuals, groups, society, and existing
ecosystems. Therefore, the future housing (created by the CIDNZ principles) will be
durable, less disturbing to the natural habitat, less polluting the environment,
constructed from high quality, recyclable or reusable materials, have a healthy indoor
environment, and enhancing the quality of life. The proposed CIDNZ framework is
flexible, allowing the addition of new perspectives. It focuses on people by respecting a
broad spectrum of human needs, inclusive physical, psychological, social, and spiritual.
Therefore, the housing will enhance humans’ individual and social lives, harmonize
with larger environmental systems, and be adaptive to changing needs.

256
Chapter 9 Conclusions
Motto: “Building art is a synthesis of life in materialized form. We should try to bring in
under the same hat not a splintered way of thinking, but all in harmony together”
(Alvar Aalto, as cited in Demakis, 2012, p. 11).
The aim of this thesis has been to understand the relationship between BIM and
sustainability and to approach the design process from systems engineering
methodologies. This thesis evaluated the risks of underestimating hygrothermal
relations in buildings and suggested possible solutions to design energy efficient,
healthy, and durable buildings. This research focused on possible ways how to improve
the quality of houses in NZ, particularly hygrothermal performance. Suggested BIM
innovations and the proposed implementation strategy are aiming to find answers to
the questions in the time when they are needed, and prevent the building
performance design defects. Research questions have been answered in two
distinctive parts. In Chapters 3 – 7, the researcher analysed moisture related issues in
NZ housing and requirements for hygrothermal simulation. The identified challenges
associated with undertaking effective hygrothermal assessment led to the suggestion
of the incorporation of a hygrothermal model into BIM. In Chapter 8, the researcher
applied a system approach to the design process and proposed a framework to design
warmer, drier, and healthier houses for the NZ context. The introduced Complex
Integral Design New Zealand (CIDNZ) delineated a new way of the design process
based on integral, complex, and systems thinking.
9.1 Rationale and Significance of the Study
This thesis theme was born from the life-long researcher’s passion for healthy living.
The aim to provide warmer, drier, and healthier houses for New Zealanders without a
negative impact on nature pertained as the motivation to search for new ways.
Therefore, this thesis examined the moisture related issues in NZ, conditions, and
requirements for BIM enabling assessment of construction projects regarding
hygrothermal relations, calculations and optimization. This theoretical knowledge has
been transferred into the second part of the thesis, which suggested a new system-
based design process promoting interdisciplinary, holistic, and integral approach.
257
Although these parts form the whole, they differ in the chosen epistemology and
ontology. The in Chapter 8 implemented integral theory is all-inclusive. This research
has been rooted in objectivism and used quantitative methods and fundamentally
qualitative causal reasoning. For the data analysis and the evaluation of relations
between variables, this study used a combination of statistical methods and deductive
reasoning.
The first part of the thesis demonstrated with the in-field and virtual experiments that
materials used in the building envelope have a significant influence on the
hygrothermal performance of the building. Consequently, the design of sustainable
buildings cannot be achieved without hygrothermal modelling. Therefore, the BIM
expansion in terms of the hygrothermal assessment of materials and whole buildings
might prevent moisture related problems. The second part of the thesis presented an
alternative perspective from which we look at the task of how to build better,
healthier, warmer, and safer houses. From this perspective, the design and
construction process and its end-product, buildings, form open systems because they
interact with their environment and other systems. Therefore, the holistic approach to
the sustainability of the construction process pertained the whole project.
The inspection of theoretical and practical understanding of the objective revealed
several gaps in the literature. Apart from energy modelling, sustainability assessment
has a minimal presence in the used BIM tools (Gao et al., 2019; Romanska-Zapala et
al., 2019). A gap in knowledge exists of how to enable BIM to participate in a design
process that pursues a holistic approach, particularly in an optimal design with
hygroscopic materials (Wan et al., 2019). Additionally, the research on the practical
incorporation of hygrothermal modelling and mould growth risk into BIM is limited
(Fedorik et al., 2017). In the praxis, a gap exists between the calculated and the real as-
built energy performance (Kubilay et al., 2019; Zou et al., 2019). Another knowledge
gap persists on the parameters and specifications that are needed for standardized
data libraries, practical solutions for BIM, and simulation models (Daniotti et al.,
2020a). Therefore, the use of these viable tools for effective decision-making process
regarding sustainability and energy performance of the building is limited. Besides of
integral architecture (DeKay & Bennett, 2011; Zeiler, 2015), the literature about a
complex integral system in the design and construction process is missing.
258
This thesis addressed the mentioned gaps in knowledge by going from the analysis of
theory to facts (results of experiments) and finally, practical implications. The practical
implications, such as proposed BIM extension and framework for designers, enhanced
the existing knowledge. The integration of hygrothermal modelling into BIM and the
implementation of the CIDNZ system might bring improvements to the design in the
phase of the project when, as Gao et al. (2019) sad, the costs for changes are the
lowest. The introduction of integral thinking to the design process has the potential to
revolutionize the way how the housing needs will be satisfied. The researcher
inevitably sees nature and humans as one ever-changing and adjusting system. If
people construct their houses with respect to nature and themselves, the built
environment would be in harmony with the life on the Earth.
The findings of this study are of value for practitioners and policy makers.
Practitioners, especially architectural designers and engineers, construction consulting
companies and developers, are likely to get vital information concerning how to
improve the quality and durability of buildings radically. The information is of the
possible implementation of hygrothermal modelling into the design process (BIM) and
the paradigm shift in the AEC industry. The companies involved in architectural design
and construction might benefit from the application of the CIDNZ principles in all
stages of the construction process. The consequent practical application of these
principles and integral thinking might eliminate or reduce the design defects and lead
consequently to the reduction of costs involved in their rectification. There are several
feasible advantages in the practical application of the proposed CIDNZ methodology
and holistic principles. Therefore, policy makers might gain different insights on how to
change the regulations in the assessing field of building performance. The mutual
comprehension of moisture, air, energy, health, and environmental issues in the
complex integral way would open a new possibility in the necessary improvement of
housing in NZ.
9.2 Research Scope
The writing process of this thesis merely enhanced the researcher’s knowledge and
gradually awoke a novel way of thinking. Before the researcher read the literature or
collected and analysed the empirical data, she believed that dynamic simulations
259
would solve the moisture problems in NZ. This fundamental conviction was based
merely on her theoretical and practical knowledge about sustainable buildings and
building physics. However, the critical study of the academic literature revealed that
the problematic of low-quality housing is complex and affected by several factors from
which the physical laws typically represent a significant part. Therefore, the research
scope encompassed integral thinking about sustainability in the AEC industry.
This thesis explored the determined research area from an individual and collective
level which formed the whole. The test houses provided a suitable environment for the
in-field testing on a praxis-oriented individual level. The testing in real houses revealed
the levels of RH reached in occupied NZ houses by different internal envelope
materials. Simultaneously, the data demonstrated the impact of different building
materials used on the indoor side of walls and the presence/absence of airtightness
membrane on the hygrothermal performance of buildings. The simulation experiment,
based on the identical parameters, moved the empirical investigation to the virtual
modelling. This enabled the analytical study to compare the results of two different
experiments and draw conclusions. The requirements for undertaking an effective
hygrothermal assessment of houses during the early design stages have been
characterized. Consequently, the study named the physical qualities of building
materials which influence hygrothermal performance most significantly.
The collective level of the research contained a rational and integral stage. The study in
the rational phase investigated interoperability requirements and the possible ways
how to incorporate hygrothermal modelling into BIM adequately. Beside the
specification of requirements for integration of hygrothermal modelling into BIM, the
study showed possible ways how to improve building sustainability based on effective
hygrothermal simulation. The rational stage led to the description of how the BIM-
integrated hygrothermal simulation tool might improve the building performance and
reduce errors affecting the hygrothermal performance. For the integral stage, this
research applied the system approach based on the holistic and integral view.
Buildings, as whole systems, can best be understood as holons interacting with people
and the local environment. The integral phase of the research, therefore, was not
exclusive. This thesis built on all the previous stages in the development of knowledge
and considered multiple system elements and their complex interrelationships in the

260
context of the whole. From this essential point, the system changes in the design
process of housing were proposed.
9.3 Summary of Findings and Limitations
This research experienced limitations on the individual and collective level of the
research scope. The individual level limitations related to the accuracy of any data. The
collective level limitations related to the research problem and purpose – to specify
the requirements for integration of hygrothermal simulation into BIM and propose a
framework for designers. This research experienced challenges due to the available
technical equipment and the nature of the quasi-experiment. The experiment has
been influenced by the uncontrollable independent variables, such as weather, initial
RH and temperature. The significant challenge of the experiment has been
malfunctions of the technical equipment that occurred during the validation process of
the testing. Therefore, the researcher merely changed the original quasi-experiment
design from simultaneous to switching mode. Consequently, different outside
conditions have been inevitably attending each setting. However, the actual indoor
and weather data have been available. Therefore, this research carried out the analysis
of covariance (ANCOVA) to eliminate the influence of different outdoor conditions
during the experiment. The quasi-experiment was deliberately chosen to merely
demonstrate the influence of used building materials on indoor RH in a real-life
situation.
The experienced constraints in the simulation process have been of the quality of input
data and diffusive model calculations. High quality and reliable hygrothermal data have
not been available for most NZ building materials. The WUFI materials library contains
only the typical materials and products used in Germany and the USA. The limited
availability of hygrothermal data simultaneously represented a challenge to the
successful interoperability between BIM and hygrothermal models. Additionally, the
researcher was aware that the issues of BIM extension contain a hidden dilemma
between the amount and quality of necessary information and time for its
implementation process (CPU time). Another impediment this research was
experienced by the comparison of measured and simulated data. This issue is well
known. Busser et al. (2019), for example, argued that these limitations might be
261
unwittingly caused by the fact that the classic diffusive models neglect transport by air
convection and nonequilibrium behaviour between water vapour and bound water.
Despite all these limitations, the results demonstrated the influence of building
materials and construction on indoor RH levels. The employment of hygrothermal
modelling in the design process, therefore, might assist the decisions about materials
that influence the hygrothermal performance of the building. Therefore, this thesis
revealed the reasons for necessary interoperability between hygrothermal modelling
and BIM and evaluated the requirements for the simulation. As a result of the
interoperability and simulation analysis, the research suggested multiple ways for the
incorporation of the hygrothermal model into BIM. The researcher selected for the
analysis two examples of software - Revit representing BIM and WUFI Plus a whole
building hygrothermal simulation model.
The presented results of quasi and virtual experiments proved the influence of used
construction materials on the hygrothermal performance of buildings. Therefore, the
incorporation of hygrothermal modelling into BIM is crucial to the design of
sustainable buildings. The sustainability understanding in this thesis has been based on
humanistic, systems, holistic, and integral values that lead to harmony between
individuals, groups, society, and the existing ecosystems. Such novel ways of the
sustainability perception in the AEC industry accompanied the developing process of
CIDNZ. The healthy housing supports physical, mental and social well-being. Therefore,
CIDNZ recommends besides the energy, costs, and environmental aspects, the
evaluation of the quality of buildings.
The thesis introduced the systems approach to the comprehension of dwellings in their
functions and interrelations with occupants and the environment. Simultaneously, the
system approach was applied to the design, construction, usage, and decommissioning
of buildings. Therefore, this thesis introduced an alternative perspective from which
we look at the task of how to construct healthier, warmer, and safer houses. It
illustrated the viable applications of hygroscopic materials respectively and the
advantages of moisture buffering in the NZ context. Finally, by introducing CIDNZ
systems approach, the thesis proposed a strategic direction to overcome the
remaining issues.
262
9.4 Recommendations for Further Research
For further research, the thesis recommends replicating the in-field experiment with
more sophisticated humidifiers in both houses simultaneously for each scenario.
Although this testing would eliminate the difference in external conditions, there
would be still a diverse weather situation for each testing scenario. However, this
would satisfactorily address the role of the airtightness membrane in the hygrothermal
performance that was uncovered by this academic study. The AEC industry would
equally benefit from knowledge about the long-term hygrothermal performance of the
houses inclusive in-wall measurements.
Based on the simulation experience, further modelling of diverse scenarios with
various hygroscopic materials would be beneficial. The experimental results presented
in the form of a table might provide a valuable tool for building professionals.
Consequently, further research of the complex building-scale benefits of hygroscopic
materials, especially the energy-saving and cooling potential of moisture buffering
might enrich the results of this doctoral thesis. An additional laboratory testing of
hygrothermal characteristics of building materials available in NZ will support the more
expanded use of hygrothermal modelling in the design praxis and theory.
Simultaneously, the compiling of a data bank with accurate moisture related physical
data for every material used in construction would enhance the quality of simulation
results. Further research on the programming of suggested incorporation of
hygrothermal modelling into BIM might undoubtedly support the automation of this
process. Simultaneously, it would enable extensive employment of simulation in the
design praxis. However, the successful application of hygrothermal modelling is
coupled with an adequate education for building professionals. The simulation tool
might positively enhance the quality of housing if its use is accompanied by a more in-
depth knowledge of building physics and materials. Therefore, the researcher
recommends the consistent implementation of building physics into the architectural
designers’ curriculum of NZ universities.
The implementation of the system approach into the AEC industry will require more
research, comprehensive description and analysis to determine the actual processes of
CIDNZ. The practical application of this system might benefit from further research on
263
the organization, information management, and hardware and software requirements
in the proposed CIDNZ system. The delineated evaluation characteristics of the CIDNZ
elements will necessitate further development, particularly to identify relations inside
of the system and to other systems in the holarchy. Therefore, additional research on
the complex evaluation of environmental systems and the influence of CIDNZ on all
involved systems might build on the thesis inferences.
9.5 Contribution of the Research
This thesis contributed to the present knowledge in multiple ways. The findings of the
research confirmed the hypothesis: “If materials used in the building envelope have a
significant influence on the hygrothermal performance of the building, then the design
of sustainable buildings cannot be done without hygrothermal modelling.” In an
interdisciplinary and systematic approach grounded in integral thinking, this thesis
focused on BIM innovation and its implementation strategy. The key contribution of
this research is the introduction of a new perspective on how to design energy
efficient, healthy, and durable buildings for the NZ context. Suggested solutions
require a restructuration of the whole design and construction process. Hygrothermal
modelling incorporated in BIM might allow for automated assessment of the
hygrothermal performance and facilitate the optimization of the design. The idea is to
apply BIM integrated hygrothermal modelling in several design stages. This would
allow for competent decisions regarding environmental impact and sustainability of
new buildings and retrofits to prevent unintended moisture related problems during
construction and usage of the building.
The research findings confirmed the existing theory in moisture buffering and
simultaneously challenged the prevalent orientation of official policies on energy
performance. The challenging came from the application of systems approach to the
construction process and buildings as integral parts of environmental systems. In this
sense, hygrothermal modelling merely represents an element of the sustainable
design. Holistic view resting upon construction engineering, architecture, building
physics, biology, building biology, chemistry, psychology, and environmental studies
might reveal the complex interrelations in buildings. This research instigated the
264
holistic and integral thinking into the housing design, therefore, contributed to the
existing theory.
This thesis demonstrated the significance and feasibility of purposeful choice and
placement of building materials to design and build healthier and sustainable
dwellings. With the analysis of the hygrothermal performance of NZ houses, the thesis
contributed to the local practical knowledge. The findings of RH development in real
houses merely demonstrated the influence of different materials in diverse
construction types (existence or non-existence of airtightness membrane). Therefore,
hygrothermal modelling and the decisive use of hygroscopic materials might assist the
sustainable design in NZ.
CIDNZ arose as a consequence of the unique context of this thesis. It integrates
scientific achievements, available tools, and partial knowledge into the design process
of houses in a holistic way. CIDNZ proposes a gradual development of the integrative
and interdisciplinary approach in architectural and engineering design through a
transformation process. The flexibility of the proposed framework might encourage
the addition of alternative perspectives. Consequently, the design process might shift
the forefront from prevailing cost-oriented aim for cheap and fast built to long-term
energy and cost-efficient, durable, and healthy buildings. The discerning characteristic
of these buildings will be their relation to the environment based on balance and
harmony with nature. The proposed CIDNZ focuses on people by respecting a broad
spectrum of human needs, inclusive physical, psychological, social, and spiritual.
Therefore, the housing will enhance humans’ individual and social lives and be
adaptive to changing needs.
The proposed CIDNZ process accommodates the capacity to integrate diverse
perspectives into a unified framework. The suggested framework might lead towards a
conscious balance between the freedom to decide what people like (equal outcome)
and the economic and environmental factors (equal opportunity). Therefore, the
CIDNZ framework might allow for sustainable housing in harmony with the
environment and shifts in values and perspectives.
265
References
Abd Rashid, A. F., & Yusoff, S. (2015). A review of life cycle assessment method for
building industry. Renewable and Sustainable Energy Reviews, 45, 244-248.
https://doi.org/10.1016/j.rser.2015.01.043
Abdelhameed, W. (2019). Industrial revolution effect on the architectural design [Paper
presentation]. 2019 International Conference on Fourth Industrial Revolution
(ICFIR), Manama, Bahrain. https://doi.org/10.1109/ICFIR.2019.8894774
Abdou, A., & Budaiwi, I. (2013). The variation of thermal conductivity of fibrous
insulation materials under different levels of moisture content. Construction
and Building Materials, 43, 533-544.
https://doi.org/10.1016/j.conbuildmat.2013.02.058
Ackermann, E. (2001). Piaget’s constructivism, Papert's constructionism: What’s the
difference. Future of learning group publication, 5(3), 438.
https://bit.ly/2WDlbes
Adams, K., Osmani, M., Thorpe, T., & Thornback, J. (2017). Circular economy in
construction: Current awareness, challenges and enablers. Proceedings of the
Institution of Civil Engineers: Waste and Resource Management, 170(1), 15-24.
https://doi.org/10.1680/jwarm.16.00011
Adamus, L. W. (2013). BIM: Interoperability for sustainability analysis in construction.
In P. Hájek, J. Tywoniak, A. Lupíšek, J. Růžička, & K. Sojková (Eds.), CESB13 -
Central Europe towards Sustainable Building 2013, June 26-28, 2013, Prague,
Czech Republic (1 ed., pp. 499-502). http://cesb.cz/
Adan, O., Brocken, H., Carmeliet, J., Hens, H., Roels, S., & Hagentoft, C.-E. (2004).
Determination of liquid water transfer properties of porous building materials
and development of numerical assessment methods: Introduction to the ec

266
hamstad project. Journal of Thermal Envelope and Building Science, 27(4), 253-
260. https://doi.org/10.1177/1097196304042323
Ade, R., & Rehm, M. (2019). Buying limes but getting lemons: Cost-benefit analysis of
residential green buildings -A New Zealand case study. Energy and Buildings,
186, 284-296. https://doi.org/10.1016/j.enbuild.2019.01.040
Ahmad, T., Aibinu, A. A., Stephan, A., & Chan, A. P. C. (2019). Investigating associations
among performance criteria in green building projects. Journal of Cleaner
Production, 232, 1348-1370. https://doi.org/10.1016/j.jclepro.2019.06.013
Ahopelto, J., Ardila, G., Baldi, L., Balestra, F., Belot, D., Fagas, G., De Gendt, S.,
Demarchi, D., Fernandez-Bolaños, M., Holden, D., Ionescu, A. M., Meneghesso,
G., Mocuta, A., Pfeffer, M., Popp, R. M., Sangiorgi, E., & Sotomayor Torres, C.
M. (2019). Nanoelectronics roadmap for europe: From nanodevices and
innovative materials to system integration. Solid-State Electronics, 155, 7-19.
https://doi.org/10.1016/j.sse.2019.03.014
Ai, X., Jiang, Z., Zhang, H., & Wang, Y. (2020). Low-carbon product conceptual design
from the perspectives of technical system and human use. Journal of Cleaner
Production, 244, 118819. https://doi.org/10.1016/j.jclepro.2019.118819
Aït Oumeziane, Y., Bart, M., Moissette, S., & Lanos, C. (2014). Hysteretic behaviour and
moisture buffering of hemp concrete. Transport in Porous Media, 103(3), 515-
533. https://doi.org/10.1007/s11242-014-0314-7
Ajayi, S. O., Oyedele, L. O., & Ilori, O. M. (2019). Changing significance of embodied
energy: A comparative study of material specifications and building energy
sources. Journal of Building Engineering, 23, 324-333.
https://doi.org/10.1016/j.jobe.2019.02.008
Akanbi, L., Oyedele, L., Davila Delgado, J. M., Bilal, M., Akinade, O., Ajayi, A., &
Mohammed-Yakub, N. (2019). Reusability analytics tool for end-of-life

267
assessment of building materials in a circular economy. World Journal of
Science, Technology and Sustainable Development(1), 40.
https://doi.org/10.1108/WJSTSD-05-2018-0041
Aksamija, A. (2017). Integrating innovation in architecture : Design, methods and
technology for progressive practice and research. John Wiley & Sons,
Incorporated.
Al-Ahmad, M., Jusufovic, E., Arifhodzic, N., Rodriguez, T., & Nurkic, J. (2019).
Association of molds and metrological parameters to frequency of severe
asthma exacerbation. Allergy, Asthma & Clinical Immunology, 15(1), 29.
https://doi.org/10.1186/s13223-019-0323-8
Al-Hammad, A. (1997). The effect of faulty design on building maintenance. Journal of
Quality in Maintenance Engineering, 3(1), 29-39.
https://doi.org/10.1108/13552519710161526
Alabdulmohsin, I. M. (2018). Summability calculus : A comprehensive theory of
fractional finite sums. Springer.
Ali, A. K. (2019). A case study in developing an interdisciplinary learning experiment
between architecture, building construction, and construction engineering and
management education. Engineering, Construction and Architectural
Management, 26(9), 2040-2059. https://doi.org/10.1108/ECAM-07-2018-0306
Ali, A. S. (2013). The effect of design on maintenance for school buildings in penang,
Malaysia. Structural Survey, 31(3), 194-201. https://doi.org/10.1108/SS-10-
2012-0030
Alioua, T., Agoudjil, B., & Boudenne, A. (2019a). Numerical modelling and experimental
study of heat and moisture properties of a wall based on date palm fibers
concrete. E3S Web of Conferences, 85, 02009.
https://doi.org/10.1051/e3sconf/20198502009
268
Alioua, T., Agoudjil, B., & Boudenne, A. (2019b). Numerical study of heat and moisture
transfers for validation on Bio-based building materials and walls. In M. Abdel
Wahab (Ed.), Proceedings of the 1st International Conference on Numerical
Modelling in Engineering 2019: Volume 1 Numerical Modelling in Civil
Engineering, NME 2018, 28-29 August 2018, Ghent University, Belgium (pp. 81-
89). Springer. https://doi.org/10.1007/978-981-13-2405-5_7
Alioua, T., Agoudjil, B., Chennouf, N., Boudenne, A., & Benzarti, K. (2019). Investigation
on heat and moisture transfer in bio-based building wall with consideration of
the hysteresis effect. Building and Environment, 163, 106333.
https://doi.org/10.1016/j.buildenv.2019.106333
Allard, F., Dorer, V. B., E., F. H., Rodriguez Garcia, E., Grosso, M., Herrlin, M. K.,
Mingsheng, L., Phaff, H. C., Utsumi, Y., & Yoshino, H. (1990). Fundamentals of
the multizone air flow model - COMIS, AIVC, technical note 29 (H. E. Feustel & A.
Rayner-Hooson, Eds.). Lawrence Berkeley Laboratory.
Alrøe, H. F., & Noe, E. (2016). Sustainability assessment and complementarity. Ecology
and Society, 21(1), Article 30. https://doi.org/10.5751/ES-08220-210130
Alwan, Z., Jones, P., & Holgate, P. (2017). Strategic sustainable development in the UK
construction industry, through the framework for strategic sustainable
development, using building information modelling. Journal of Cleaner
Production, 140, 349-358. https://doi.org/10.1016/j.jclepro.2015.12.085
Alzetto, F., Farmer, D., Fitton, R., Hughes, T., & Swan, W. (2018). Comparison of whole
house heat loss test methods under controlled conditions in six distinct retrofit
scenarios. Energy and Buildings, 168, 35-41.
https://doi.org/10.1016/j.enbuild.2018.03.024
Ameri, S., & Rüther, N. (2019). Hygrothermal risk analysis of recently constructed
timber buildings exposed to outdoor climate changes by the end of the century
269
in Germany. IOP Conference Series: Earth and Environmental Science, 290,
012005. https://doi.org/10.1088/1755-1315/290/1/012005
Ammar, G., Dayawansa, W., & Martin, C. (1991). Exponential interpolation: Theory and
numerical algorithms. Applied Mathematics and Computation, 41(3), 189-232.
https://doi.org/10.1016/0096-3003(91)90025-I
Angelon-Gaetz, K. A., Richardson, D. B., Lipton, D. M., Marshall, S. W., Lamb, B., &
LoFrese, T. (2015). The effects of building-related factors on classroom relative
humidity among North Carolina schools participating in the ‘free to breathe,
free to teach’ study. Indoor Air, 25(6), 620-630.
https://doi.org/10.1111/ina.12176
Ankarali, H., Cangur, S., & Ankarali, S. (2018). A new seyhan's approach in case of
heterogeneity of regression slopes in ANCOVA. INTERDISCIPLINARY SCIENCES-
COMPUTATIONAL LIFE SCIENCES, 10(2), 282-290.
https://doi.org/10.1007/s12539-016-0189-0
Annals in Social Responsibility. (2019). How stages of consciousness link with the
components of well-being: The journey of society and business toward greater
harmony. 5(1), 20-22. https://doi.org/10.1108/ASR-04-2019-039
Antretter, F., Desjarlais, A. O., & Hun, D. E. (2019). Hygrothermal analyses of the
moisture control and energy efficiency potential of an adaptive water-resistive
barrier for building envelopes. https://doi.org/10.2172/1503998
Antretter, F., Klingenberg, K., & Pazold, M. (2013). All-in-one design tool solution for
passive houses and buildings—monthly energy balance and hygrothermal
simulation [Paper presentation]. Thermal Performance of the Exterior
Envelopes of Whole Buildings XII International Conference, Atlanta, GA.
https://bit.ly/2xTU0ns
270
Antretter, F., & Pallin, S. B. (2019). Modelling moisture sources due to air leakage with
the HAMT extension for EnergyPlus [Paper presentation]. 2019 ASHRAE Annual
Conference, Kansas City, Missouri, United States. https://bit.ly/3dok8pA
Antretter, F., Pazold, M., Radon, J., & Künzel, H. (2013). Kopplung von dynamischer
Wärmebrückenberechnung mit hygrothermischer Gebäudesimulation.
Bauphysik, 35(3), 181-192. https://doi.org/10.1002/bapi.201310068
Antretter, F., Sauer, F., Schöpfer, T., & Holm, A. (2011). Validation of a hygrothermal
whole building simulation software. In Proceedings of Building Simulation 2011:
12th Conference of International Building Performance Simulation Association,
Sydney, Australia, 14-16 November 2011 (pp. 1694-1701). International
Building Performance Simulation Association (IBPSA).
http://ibpsa.org/proceedings/BS2011/P_1554.pdf
Antretter, F., Winkler, M., Fink, M., Pazold, M., Radon, J., & Stadler, S. (2017). WUFI
Plus 3.1 manual. Fraunhofer IBP. https://wufi.de/en/
Arlian, L. G., Neal, J. S., Morgan, M. S., Vyszenski-Moher, D. L., Rapp, C. M., &
Alexander, A. K. (2001). Reducing relative humidity is a practical way to control
dust mites and their allergens in homes in temperate climates. Journal of
Allergy and Clinical Immunology, 107(1), 99-104.
https://doi.org/10.1067/mai.2001.112119
ASHRAE. (1977). ASHRAE handbook, 1977 fundamentals. American Society of Heating,
Refrigerating and Air-Conditioning Engineers.
ASHRAE. (2016a). Criteria for moisture-control design analysis in buildings (ASHRAE
160). American Society of Heating, Refrigerating, and Air-Conditioning
Engineers.

271
ASHRAE. (2016b). Energy standard for buildings except low-rise residential buildings
(ASHRAE 90.1). American Society of Heating, Refrigerating, and Air-
Conditioning Engineers.
ASHRAE. (2017a). Standard method of test for the evaluation of building energy
analysis computer programs (ASHRAE 140). American Society of Heating,
Refrigerating, and Air-Conditioning Engineers.
ASHRAE. (2017b). Thermal environmental conditions for human occupancy (ASHRAE
55). American Society of Heating, Refrigerating, and Air-Conditioning Engineers.
ASHRAE. (2018). Energy-efficient design of low-rise residential buildings (ASHRAE 90.2).
American Society of Heating, Refrigerating, and Air-Conditioning Engineers.
ASHRAE. (2019a). Ventilation and acceptable indoor air quality in residential buildings
(ASHRAE 62.2). American Society of Heating, Refrigerating, and Air-
Conditioning Engineers.
ASHRAE. (2019b). Ventilation for acceptable indoor air quality (ASHRAE 62.1).
American Society of Heating, Refrigerating, and Air-Conditioning Engineers.
Asif, A., Zeeshan, M., & Jahanzaib, M. (2018). Indoor temperature, relative humidity
and CO2 levels assessment in academic buildings with different heating,
ventilation and air-conditioning systems. Building and Environment, 133, 83-90.
https://doi.org/10.1016/j.buildenv.2018.01.042
Assefa, G., & Ambler, C. (2017). To demolish or not to demolish: Life cycle
consideration of repurposing buildings. Sustainable Cities and Society, 28, 146-
153. https://doi.org/10.1016/j.scs.2016.09.011
ASTM. (2005). Standard test methods for water vapor transmission of materials (ASTM
E96 / E96M-05). ASTM International. https://doi.org/10.1520/E0096_E0096M-
05
272
ASTM. (2016). Standard test methods for water vapor transmission of materials (ASTM
E96 / E96M-16). ASTM International. https://doi.org/10.1520/E0096_E0096M-
16
Attia, S., Weytjens, L., De Herde, A., & Verbeeck, G. (2012). A comparative study of the
‘architect-friendliness’ of six building performance simulation tools.
International Journal of Sustainable Building Technology and Urban
Development, 2(3), 237-244. https://doi.org/10.5390/SUSB.2011.2.3.237
Augenbroe, G. (2019). The role of simulation in performance-based building. In J. L. M.
Hensen & R. Lamberts (Eds.), Building performance simulation for design and
operation (pp. 343-373). Routledge.
Autodesk. (2006). A model decision HOK pledges support for building information
modelling and Autodesk Revit building. https://bit.ly/3cyCpQU
Autodesk. (n.d.-a). Add-in integration. Retrieved January 24, 2019 from
https://knowledge.autodesk.com
Autodesk. (n.d.-b). Autodesk Revit 2019. Retrieved April 05, 2019 from
http://help.autodesk.com/view/RVT/2019/ENU
Autodesk. (n.d.-c). What can you do with the Revit platform API? Retrieved January 24,
2019 from https://knowledge.autodesk.com
Ayres de Mello, L., Moura, L. M., & Mendes, N. (2019). A model for assessment of heat
and moisture transfer through hollow porous buildings elements. Case Studies
in Thermal Engineering, 14, 100446.
https://doi.org/10.1016/j.csite.2019.100446
AZ Quotes. (n.d.). Albert Einstein quotes. https://www.azquotes.com/quote/87290

273
Azhar, S. (2011). Building information modeling (BIM): Trends, benefits, risks, and
challenges for the AEC industry. Leadership & Management in Engineering, 11,
241-252. https://doi.org/10.1061/(ASCE)LM.1943-5630.0000127
Azhar, S., Khalfan, M., & Maqsood, T. (2015). Building information modelling (BIM):
Now and beyond. Construction Economics and Building, 12(4), 15-28.
https://doi.org/10.5130/AJCEB.v12i4.3032
Babrauskas, V., Lucas, D., Eisenberg, D., Singla, V., Dedeo, M., & Blum, A. (2012). Flame
retardants in building insulation: A case for re-evaluating building codes.
Building Research & Information, 40(6), 738-755.
https://doi.org/10.1080/09613218.2012.744533
Bacharach, S. B. (1989). Organizational theories: Some criteria for evaluation. The
Academy of Management Review, 14(4), 496-515.
https://doi.org/10.2307/258555
Bagge, H., Johansson, D., & Lindstrii, L. (2014). Measured indoor hygrothermal
conditions and occupancy levels in an arctic swedish multi-family building.
HVAC&R Research, 20(4), 376-383.
https://doi.org/10.1080/10789669.2014.888367
Baker, A. J., Williams, P. T., & Kelso, R. M. (1994). Development of a robust finite
element CFD procedure for predicting indoor room air motion. Building and
Environment, 29(3), 261-273. https://doi.org/10.1016/0360-1323(94)90022-1
Baker, P. H., Galbraith, G. H., & McLean, R. C. (2009). Temperature gradient effects on
moisture transport in porous building materials. Building Services Engineering
Research & Technology, 30(1), 37-48.
https://doi.org/10.1177/0143624408099234
Baldauf, J. P., Miron, L. I. G., & Formoso, C. T. (2013). Using BIM for modeling client
requirements for low-income housing. In C. T. Formoso & P. Tzortzopoulos
274
(Eds.), 21th Annual Conference of the International Group for Lean Construction
(IGLC 21), Fortaleza, Brazil, 29 July - 2 August 2013 (pp. 801-810). The
International Group for Lean Construction (IGLC).
http://iglc.net/Papers/Details/871
Bano, F., & Tahseen, M. (2017). Bioclimatic building design guidelines for lucknow city:
Use of various climate analysis methods. International Journal for Research in
Applied Science & Engineering Technology (IJRASET), 5(XI), 330-341.
https://doi.org/10.22214/ijraset.2017.11049
Barbadilla-Martín, E., Salmerón Lissén, J. M., Guadix Martín, J., Aparicio-Ruiz, P., &
Brotas, L. (2017). Field study on adaptive thermal comfort in mixed mode office
buildings in southwestern area of Spain. Building and Environment, 123, 163-
175. https://doi.org/10.1016/j.buildenv.2017.06.042
Barbosa, R. M., & Mendes, N. (2008). Combined simulation of central HVAC systems
with a whole-building hygrothermal model. Energy and Buildings, 40(3), 276-
288. https://doi.org/10.1016/j.enbuild.2007.02.022
Barclay, M., Holcroft, N., Patten, M., & Shea, A. (2014). Modelling and testing methods
to determine whole building hygrothermal performance with natural fibre
building materials. In Proceedings of BSO 14, the Second IBPSA-England
conference on “Building Simulation and Optimization”, held at UCL from 23rd to
25th June in association with CIBSE. https://bit.ly/3fJQFbB
Barclay, M., Holcroft, N., & Shea, A. (2014). Methods to determine whole building
hygrothermal performance of hemp–lime buildings. Building and Environment,
80, 204-212. https://doi.org/10.1016/j.buildenv.2014.06.003
Bareinboim, E., & Pearl, J. (2016). Causal inference and the data-fusion problem.
Proceedings of the National Academy of Sciences (PNAS), 113(27), 7345-7352.
https://doi.org/10.1073/pnas.1510507113

275
Barley, D., Deru, M., Pless, S., Torcellini, P., & Hayter, S. (2005). Procedure for
measuring and reporting commercial building energy performance. National
Renewable Energy Laboratory, Operated for the U.S. Department of Energy,
Office of Energy Efficiency and Renewable Energy by Midwest Research
Institute, Battelle.
Barnard, L. T., & Zhang, J. (2018). The impact of respiratory disease in New Zealand:
2018 update [Report prepared by University of Otago]. Asthma and
Respiratory Foundation NZ.
Barreira, E., & de Freitas, V. P. (2013). The effect of nearby obstacles in surface
condensations on external thermal insulation composite systems: Experimental
and numerical study. Journal of Building Physics, 37(3).
https://doi.org/10.1177/1744259113480132
Barton, C. (2019). Prefabrication: Better, cheaper, faster Architecture New Zealand (2).
https://bit.ly/3cufypL
Barzanji, R., Naderi, B., & Begen, M. A. (2020). Decomposition algorithms for the
integrated process planning and scheduling problem. Omega, 93, 102025.
https://doi.org/10.1016/j.omega.2019.01.003
Bastien, D., & Winther-Gaasvig, M. (2018). Influence of driving rain and vapour
diffusion on the hygrothermal performance of a hygroscopic and permeable
building envelope. Energy, 164, 288-297.
https://doi.org/10.1016/j.energy.2018.07.195
Bauklimatik, D. S. G. (n.d.). Delphin simulation program for the calculation of coupled
moisture, air, pollutant, and salt transport. Retrieved February 01, 2019 from
http://www.bauklimatik-dresden.de/delphin/index.php?aLa=en
Bauwens, G., & Roels, S. (2014). Co-heating test: A state-of-the-art. Energy and
Buildings, 82, 163-172. https://doi.org/10.1016/j.enbuild.2014.04.039
276
Beck, D. E., & Cowan, C. C. (2014). Spiral dynamics: Mastering values, leadership and
change. John Wiley & Sons. (1995)
Beddoe, R., Costanza, R., Farley, J., Garza, E., Kent, J., Kubiszewski, I., Martinez, L.,
McCowen, T., Murphy, K., Myers, N., Ogden, Z., Stapleton, K., & Woodward, J.
(2009). Overcoming systemic roadblocks to sustainability: The evolutionary
redesign of worldviews, institutions, and technologies. Proceedings of the
National Academy of Sciences, 106(8), 2483-2489.
https://doi.org/10.1073/pnas.0812570106
Belleudy, C., Kayello, A., Woloszyn, M., & Ge, H. (2015). Experimental and numerical
investigations of the effects of air leakage on temperature and moisture fields
in porous insulation. Building and Environment, 94, 457-466.
https://doi.org/10.1016/j.buildenv.2015.10.009
Beloussov, L. V., & Gordon, R. (2018). Two ways for interpreting driesch’s law:
“Positional information” and morphogenetic fields. BioSystems, 173, 7-9.
https://doi.org/10.1016/j.biosystems.2018.09.005
Belsky, M., Sacks, R., & Brilakis, I. (2016). Semantic enrichment for building information
modeling. Computer-Aided Civil and Infrastructure Engineering, 31(4), 261-274.
https://doi.org/10.1111/mice.12128
Belussi, L., Barozzi, B., Bellazzi, A., Danza, L., Devitofrancesco, A., Fanciulli, C., Ghellere,
M., Guazzi, G., Meroni, I., Salamone, F., Scamoni, F., & Scrosati, C. (2019). A
review of performance of zero energy buildings and energy efficiency solutions.
Journal of Building Engineering, 25, 100772.
https://doi.org/10.1016/j.jobe.2019.100772
Bennai, F., Issaadi, N., Abahri, K., Belarbi, R., & Tahakourt, A. (2018). Experimental
characterization of thermal and hygric properties of hemp concrete with
277
consideration of the material age evolution. Heat and Mass Transfer, 54(4),
1189-1197. https://doi.org/10.1007/s00231-017-2221-2
Bennett, J., Howden-Chapman, P., Chisholm, E., Keall, M., & Baker, M. G. (2016).
Towards an agreed quality standard for rental housing: Field testing of a New
Zealand housing wof tool. Australian & New Zealand Journal of Public Health,
40(5), 405-411. https://doi.org/10.1111/1753-6405.12519
Bercht, A. L., & Wijermans, N. (2018). Mind the mind: How to effectively communicate
about cognition in social–ecological systems research. Ambio.
https://doi.org/10.1007/s13280-018-1099-7
Berger, J., Busser, T., Dutykh, D., & Mendes, N. (2018). An efficient method to estimate
sorption isotherm curve coefficients. Inverse Problems in Science and
Engineering, 1-38. https://doi.org/10.1080/17415977.2018.1495720
Berger, J., Gasparin, S., Dutykh, D., & Mendes, N. (2017). Accurate numerical
simulation of moisture front in porous material. Building and Environment, 118,
211-224. https://doi.org/10.1016/j.buildenv.2017.03.016
Berger, J., Gasparin, S., Dutykh, D., & Mendes, N. (2019). On the comparison of three
numerical methods applied to building simulation: Finite-differences, RC circuit
approximation and a spectral method. Building Simulation.
https://doi.org/10.1007/s12273-019-0555-z
Berger, J., Mazuroski, W., Mendes, N., Guernouti, S., & Woloszyn, M. (2016). 2D whole-
building hygrothermal simulation analysis based on a PGD reduced order
model. Energy and Buildings, 112, 49-61.
https://doi.org/10.1016/j.enbuild.2015.11.023
Berger, J., Mazuroski, W., Oliveira, R. C. L. F., & Mendes, N. (2018). Intelligent co-
simulation: Neural network vs. Proper orthogonal decomposition applied to a

278
2D diffusive problem. Journal of Building Performance Simulation, 11(5), 568-
587. https://doi.org/10.1080/19401493.2017.1414879
Berger, J., Mendes, N., Guernouti, S., Woloszyn, M., & Chinesta, F. (2017). Review of
reduced order models for heat and moisture transfer in building physics with
emphasis in PGD approaches. Archives of Computational Methods in
Engineering, 24(3), 655-667. https://doi.org/10.1007/s11831-016-9184-1
Bernstein, H. M. (Ed.). (2014). The business value of BIM in Australia and New Zealand:
How building information modeling is transforming the design and construction
industry [Report]. McGraw Hill Construction. https://bit.ly/2SRjn0r.
Berry, T.-A., Chiswell, J. H., Wallis, S., & Birchmore, R. (2017). The effect of airtightness
on indoor air quality in timber houses in New Zealand. Unitec ePress Occasional
and Discussion Paper Series, 2017(9). http://www.unitec.ac.nz/epress
Berthelsen, A., Atalah, J., Clark, D., Goodwin, E., Sinner, J., & Patterson, M. (2020). New
Zealand estuary benthic health indicators summarised nationally and by
estuary type. New Zealand Journal of Marine and Freshwater Research, 54(1),
24-44. https://doi.org/10.1080/00288330.2019.1652658
Bhandari, M., Hun, D., Shrestha, S., Pallin, S., & Lapsa, M. (2018). A simplified
methodology to estimate energy savings in commercial buildings from
improvements in airtightness. Energies, 11(12), 3322, Article 3322.
https://doi.org/10.3390/en11123322
Bhaskar, R. (2008). A realist theory of science. Routledge.
BIM Acceleration Committee. (2019). The New Zealand BIM handbook (3 ed.). the
BRANZ Building Research Levy; the Ministry of Business, Innovation and
Employment.
279
Birchmore, R., Pivac, A., & Tait, R. (2015). Impacts of an innovative residential
construction method on internal conditions. Buildings, 5(1), 179-195.
https://doi.org/10.3390/buildings5010179
Blay, K. B., Tuuli, M. M., & France-Mensah, J. (2019). Managing change in BIM-level 2
projects: Benefits, challenges, and opportunities. Built Environment Project and
Asset Management, 9(5), 581-596. https://doi.org/10.1108/BEPAM-09-2018-
0114
Blocken, B., Roels, S., & Carmeliet, J. (2003). A numerical study of wind nuisance for a
high-rise building group [Paper presentation]. 2nd International Building
Physics Conference, Leuven, https://bit.ly/2zmiIxi
Bluyssen, P. M. (2009). Towards an integrative approach of improving indoor air
quality. Building and Environment, 44(9), 1980-1989.
https://doi.org/10.1016/j.buildenv.2009.01.012
Bluyssen, P. M., Janssen, S., van den Brink, L. H., & de Kluizenaar, Y. (2011). Assessment
of wellbeing in an indoor office environment. Building and Environment, 46(12),
2632-2640. https://doi.org/10.1016/j.buildenv.2011.06.026
Bluyssen, P. M., Roda, C., Mandin, C., Fossati, S., Carrer, P., de Kluizenaar, Y., Mihucz,
V. G., de Oliveira Fernandes, E., & Bartzis, J. (2016). Self-reported health and
comfort in ‘modern’ office buildings: First results from the European officair
study. Indoor Air, 26(2), 298-317. https://doi.org/10.1111/ina.12196
Bomberg, M. (1974). Moisture flow through porous building materials. Division of
building technology, Lund Institute of Technology.
Bomberg, M. (2012). Building science or building physics. Frontiers of Architectural
Research, 1(4), 421-423. https://doi.org/10.1016/j.foar.2012.10.003
280
Bomberg, M., Furtak, M., & Yarbrough, D. (2017). Buildings with environmental quality
management: Part 1: Designing multifunctional construction materials. Journal
of Building Physics, 41(3), 193-208.
https://doi.org/10.1177/1744259117711196
Bomberg, M., Gibson, M., & Zhang, J. (2015). A concept of integrated environmental
approach for building upgrades and new construction: Part 1—setting the
stage. Journal of Building Physics, 38(4), 360-385.
https://doi.org/10.1177/1744259114553728
Bomberg, M., Kisilewicz, T., & Mattock, C. (2015). Methods of building physics in design
of zero energy ready buildings. Cracow University Press.
Bomberg, M., & Onysko, D. (2002). Heat, air and moisture control in walls of Canadian
houses: A review of the historic basis for current practices. Journal of Thermal
Envelope and Building Science, 26(1), 3-31.
https://doi.org/10.1177/0075424202026001857
Bomberg, M., & Pazera, M. (2010). Methods to check reliability of material
characteristics for use of models in real time hygrothermal analysis [Paper
presentation]. 1st Central European Symposium on Building Physics,
https://bit.ly/3dyHNnv
Bomberg, M., Wojcik, R., & Piotrowski, J. (2016). A concept of integrated
environmental approach, part 2: Integrated approach to rehabilitation. Journal
of Building Physics, 39(6), 482-502.
https://doi.org/10.1177/1744259115624940
Bondars, E. (2013). Implementing bioclimatic design in sustainable architectural
practice. Architecture & Urban Planning, 7, 84-86.
https://doi.org/10.7250/aup.2013.011

281
Bornehag, C.-G., Blomquist, G., Gyntelberg, F., Jarvholm, B., Malmberg, P., Nordvall, L.,
Nielsen, A., Pershagen, G., & Sundell, J. (2001). Dampness in buildings and
health - nordic interdisciplinary review of the scientific evidence on associations
between exposure to "dampness" in buildings and health effects (NORDDAMP)
[Review article]. Indoor Air, 11(2), 72-86.
Borrmann, A., Beetz, J., Koch, C., Liebich, T., & Muhic, S. (2018). Industry foundation
classes: A standardized data model for the vendor-neutral exchange of digital
building models. In A. Borrmann, M. König, C. Koch, & J. Beetz (Eds.), Building
information modeling: Technology foundations and industry practice (pp. 81-
126). Springer International Publishing. https://doi.org/10.1007/978-3-319-
92862-3_5
Borrmann, A., König, M., Koch, C., & Beetz, J. (2018). Building information modeling:
Why? What? How? In A. Borrmann, M. König, C. Koch, & J. Beetz (Eds.),
Building information modeling: Technology foundations and industry practice
(pp. 1-24). Springer International Publishing. https://doi.org/10.1007/978-3-
319-92862-3_1
Boudreaux, P., Pallin, S., Accawi, G., Desjarlais, A., Jackson, R., & Senecal, D. (2018). A
rule-based expert system applied to moisture durability of building envelopes.
Journal of Building Physics, 42(3), 416-437.
https://doi.org/10.1177/1744259117750370
Boudreaux, P. R., New, J. R., Shrestha, S. S., Adams, M. B., & Pallin, S. B. (2017). State-
of-the-art for hygrothermal simulation tools. Oak Ridge National Laboratory.
https://doi.org/10.2172/1407999
BRANZ. (2018). House condition survey brag sheet. BRANZ Pty, New Zealand. Retrieved
July 25, 2019 from
https://www.branz.co.nz/cms_show_download.php?id=e24668a4a38a58adc7b
5cad7c73ff833e69a0ab3

282
Braulio-Gonzalo, M., & Bovea, M. D. (2020). Relationship between green public
procurement criteria and sustainability assessment tools applied to office
buildings. Environmental Impact Assessment Review, 81, 106310.
https://doi.org/10.1016/j.eiar.2019.106310
Brauner, M., Ghaffarianhoseini, A., Naismith, N., & Tookey, J. (2019). Decisive use of
building materials based on hygrothermal analysis. IOP Conference Series: Earth
and Environmental Science, 290, 012008. https://doi.org/10.1088/1755-
1315/290/1/012008
Brauner, M., Tookey, J. E., & GhaffarianHoseini, A. (2016). Improving building
hygrothermal performance through advanced application of building materials:
A holistic approach towards mould growth prevention. In P. Hájek, J. Tywoniak,
A. Lupíšek, & K. Sojková (Eds.), CESB16 - Central Europe towards Sustainable
Building 2016, 22-24 June 2016, Prague, Czech Republic, Electronic proceedings
(1 ed., pp. 685-692). Grada Publishing, a.s. for Czech Technical University in
Prague. http://cesb.cz
Břenek, A., Václavík, V., Dvorský, T., Daxner, J., Dirner, V., Bendová, M., Harničárová,
M., & Valíček, J. (2015). Capillary active insulations based on waste calcium
silicates. In A. Öchsner & H. Altenbach (Eds.), Mechanical and materials
engineering of modern structure and component design (pp. 177-188). Springer
International Publishing. https://doi.org/10.1007/978-3-319-19443-1_14
British Board of Agrément. (2015). Pro Clima intelligent vapour control and airtight
systems, Intello and Intello Plus [Agrément Certificate Product Sheet 14/5155].
https://bit.ly/2WHwIJS
British Standards. (2000). Building materials and products. Hygrothermal properties.
Tabulated design values (BS EN 12524:2000). The British Standards Institution.
https://bsol.bsigroup.com

283
British Standards. (2002). Code of practice for control of condensation in buildings (BS
5250:2002) (Vol. 5368). The British Standards Institution.
https://bsol.bsigroup.com
British Standards. (2007a). Hygrothermal performance of building components and
building elements. Assessment of moisture transfer by numerical simulation (BS
EN 15026:2007). The British Standards Institution. https://bsol.bsigroup.com
British Standards. (2007b). Hygrothermal performance of buildings and building
materials. Physical quantities for mass transfer. Vocabulary (BS EN ISO
9346:2007). The British Standards Institution. https://bsol.bsigroup.com
British Standards. (2012a). Energy performance of buildings. Common terms,
definitions and symbols for the overall energy performance rating and
certification (PD ISO/TR 16344:2012). The British Standards Institution.
https://bsol.bsigroup.com
British Standards. (2012b). Hygrothermal performance of building components and
building elements — internal surface temperature to avoid critical surface
humidity and interstitial condensation — calculation methods (BS EN ISO
13788:2012). The British Standards Institution.
British Standards. (2015). Specification for security-minded building information
modelling, digital built environments and smart asset management (PAS 1192-
5:2015). The British Standards Institution. https://bsol.bsigroup.com
British Standards. (2016). Code of practice for control of condensation in buildings (BS
5250:2011+A1:2016). The British Standards Institution.
https://bsol.bsigroup.com
British Standards. (2019a). Energy performance of buildings. Ventilation for buildings.
Indoor environmental input parameters for design and assessment of energy
performance of buildings addressing indoor air quality, thermal environment,
284
lighting and acoustics. Module M1-6 (BS EN 16798-1:2019). The British
Standards Institution. https://doi.org/10.3403/BSEN16798
British Standards. (2019b). Organization and digitization of information about buildings
and civil engineering works, including building information modelling (BIM) -
information management using building information modelling. Part 1:
Concepts and principles (BS EN ISO 19650-1:2018). The British Standards
Institution. https://bsol.bsigroup.com
British Standards. (2019c). Organization and digitization of information about buildings
and civil engineering works, including building information modelling (BIM) -
information management using building information modelling. Part 2: Delivery
phase of the assets (BS EN ISO 19650-2:2018). The British Standards Institution.
https://bsol.bsigroup.com
Brown, W., Bomberg, M., Ullett, J., & Rasmussen, J. (1993). Measured thermal
resistance of frame walls with defects in the installation of mineral fibre
insulation. Journal of Thermal Insulation and Building Envelopes, 16(4), 318-
339. https://doi.org/10.1177/109719639301600404
Bruffaerts, C., Verardi, V., & Vermandele, C. (2014). A generalized boxplot for skewed
and heavy-tailed distributions. Statistics and Probability Letters, 95, 110-117.
https://doi.org/10.1016/j.spl.2014.08.016
Bruno, A. W., Gallipoli, D., Perlot, C., & Mendes, J. (2017). Effect of stabilisation on
mechanical properties, moisture buffering and water durability of
hypercompacted earth. Construction and Building Materials, 149, 733-740.
https://doi.org/10.1016/j.conbuildmat.2017.05.182
Bryde, D., Broquetas, M., & Volm, J. M. (2013). The project benefits of building
information modelling (BIM). International Journal of Project Management,
31(7), 971-980. https://doi.org/10.1016/j.ijproman.2012.12.001
285
Bryman, A. (2016). Social research methods (5 ed.). Oxford : Oxford University Press.
buildingSMART International. (n.d.-a). Industry foundation classes (IFC). Retrieved June
11, 2019 from https://www.buildingsmart.org/standards/bsi-
standards/industry-foundation-classes/
buildingSMART International. (n.d.-b). Model view definitions (MVD). Retrieved May
13, 2020 from https://www.buildingsmart.org/standards/bsi-standards/model-
view-definitions-mvd/
Busser, T., Berger, J., Piot, A., Pailha, M., & Woloszyn, M. (2019). Comparative study of
three models for moisture transfer in hygroscopic materials. Transport in
Porous Media, 126(2), 379-410. https://doi.org/10.1007/s11242-018-1161-8
Butters, A. (2015). A brief history of spiral dynamics. Approaching Religion, 5.
https://doi.org/10.30664/ar.67574
Calquin, D. A. L. (2017). Automated building data exchange between BIM and BPS
supporting building environmental assessment methods (BEAM). In C. S.
Barnaby & M. Wetter (Eds.), Proceedings of the 15th IBPSA Conference San
Francisco, CA, USA, Aug. 7-9, 2017 (pp. 1329-1333). IBPSA - International
Building Performance Simulation Association.
http://www.ibpsa.org/proceedings/BS2017/BS2017_339.pdf
Campana, J. P., & Morini, G. L. (2019). Bestest and EN ISO 52016 benchmarking of
almabuild, a new open-source simulink tool for dynamic energy modelling of
buildings. Energies, 12(15), 2938. https://doi.org/10.3390/en12152938
Campaniço, H., Soares, P. M. M., Cardoso, R. M., & Hollmuller, P. (2019). Impact of
climate change on building cooling potential of direct ventilation and
evaporative cooling: A high resolution view for the iberian peninsula. Energy
and Buildings, 192, 31-44. https://doi.org/10.1016/j.enbuild.2019.03.017
286
Camuffo, D. (2014). Theoretical grounds for humidity. In Microclimate for cultural
heritage : Conservation, restoration, and maintenance of indoor and outdoor
monuments (2. ed., pp. 50-76). Elsevier.
Carbonez, K., Van Den Bossche, N., Ge, H., & Janssens, A. (2015). Comparison between
uniform rain loads and point sources to simulate rainwater leakage with
commercial HAM-models. In V. P. d. Freitas, E. d. Angelis, H. Corvacho, J.
Delgado, & A. S. Guimarães (Eds.), International Symposium on Building
Pathology (ISBP 2015). FEUP Edições. http://hdl.handle.net/1854/LU-6843090
Carlton, E. J., Barton, K., Shrestha, P. M., Humphrey, J., Newman, L. S., Adgate, J. L.,
Root, E., & Miller, S. (2019). Relationships between home ventilation rates and
respiratory health in the colorado home energy efficiency and respiratory
health (cheer) study. Environmental Research, 169, 297-307.
https://doi.org/10.1016/j.envres.2018.11.019
Carvalho, J. P., Bragança, L., & Mateus, R. (2019). Optimising building sustainability
assessment using BIM. Automation in Construction, 102, 170-182.
https://doi.org/10.1016/j.autcon.2019.02.021
Cascione, V., Maskell, D., Shea, A., & Walker, P. (2019). A review of moisture buffering
capacity: From laboratory testing to full-scale measurement. Construction and
Building Materials, 200, 333-343.
https://doi.org/10.1016/j.conbuildmat.2018.12.094
Champiré, F., Fabbri, A., Morel, J.-C., Wong, H., & McGregor, F. (2016). Impact of
relative humidity on the mechanical behavior of compacted earth as a building
material. Construction and Building Materials, 110, 70-78.
https://doi.org/10.1016/j.conbuildmat.2016.01.027
Chapman, R., Howden-Chapman, P., & Capon, A. (2016). Understanding the systemic
nature of cities to improve health and climate change mitigation. Environment
International, 94, 380-387. https://doi.org/10.1016/j.envint.2016.04.014
287
Charef, R., Emmitt, S., Alaka, H., & Fouchal, F. (2019). Building information modelling
adoption in the European Union: An overview. Journal of Building Engineering,
25, 100777. https://doi.org/10.1016/j.jobe.2019.100777
Charron, R., Athienitis, A., & Beausoleil-Morrison, I. (2005). Tools for the design of zero
energy solar homes [Paper presentation]. 30th Annual Conference of Solar
Energy Society of Canada, Vancouver, Canada. https://bit.ly/2Wg6MG5
Chaudhury, S., & Sinha, S. K. (2019). Carbon nanotube and nanowires for future
semiconductor devices applications. In B. K. Kaushik (Ed.), Nanoelectronics (pp.
375-398). Elsevier. https://doi.org/10.1016/B978-0-12-813353-8.00014-2
Chen, K., Lu, W., Peng, Y., Rowlinson, S., & Huang, G. Q. (2015). Bridging BIM and
building: From a literature review to an integrated conceptual framework.
International Journal of Project Management, 33(6), 1405-1416.
https://doi.org/10.1016/j.ijproman.2015.03.006
Chen, M., Wang, Y., Wang, L., & Yin, S. (2014). Effects of temperature and humidity on
the barrier properties of biaxially-oriented polypropylene and polyvinyl alcohol
films. Journal of Applied Packaging Research, 6(1), 5.
Chennouf, N., Agoudjil, B., Boudenne, A., Benzarti, K., & Bouras, F. (2018).
Hygrothermal characterization of a new bio-based construction material:
Concrete reinforced with date palm fibers. Construction and Building Materials,
192, 348-356. https://doi.org/10.1016/j.conbuildmat.2018.10.089
Chien, K.-F., Wu, Z.-H., & Huang, S.-C. (2014). Identifying and assessing critical risk
factors for BIM projects: Empirical study. Automation in Construction, 45, 1-15.
https://doi.org/10.1016/j.autcon.2014.04.012
Child Poverty Action Group. (2015). Housing breefing paper. CPAG, Auckland, New
Zealand. https://bit.ly/2WSx2pc
288
Chiniforush, A. A., Akbarnezhad, A., Valipour, H., & Malekmohammadi, S. (2019).
Moisture and temperature induced swelling/shrinkage of softwood and
hardwood glulam and lvl: An experimental study. Construction and Building
Materials, 207, 70-83. https://doi.org/10.1016/j.conbuildmat.2019.02.114
Chiniforush, A. A., Valipour, H., & Akbarnezhad, A. (2019). Water vapor diffusivity of
engineered wood: Effect of temperature and moisture content. Construction
and Building Materials, 224, 1040-1055.
https://doi.org/10.1016/j.conbuildmat.2019.08.013
Chisholm, E., Keall, M., Bennett, J., Marshall, A., Telfar-Barnard, L., Thornley, L., &
Howden-Chapman, P. (2019). Why don't owners improve their homes? Results
from a survey following a housing warrant-of-fitness assessment for health and
safety. Australian & New Zealand Journal of Public Health, 43(3), 221-227.
https://doi.org/10.1111/1753-6405.12895
Chism, N. V. N., Douglas, E., & Hilson Jr, W. J. (2008). Qualitative research basics: A
guide for engineering educators. Rigorous Research in Engineering Education
NSF DUE-0341127. https://bit.ly/2yyLBGy
Chituc, C.-M. (2017). XML interoperability standards for seamless communication: An
analysis of industry-neutral and domain-specific initiatives. Computers in
Industry, 92-93, 118-136. https://doi.org/10.1016/j.compind.2017.06.010
Cho, W., Iwamoto, S., & Kato, S. (2016). Condensation risk due to variations in
airtightness and thermal insulation of an office building in warm and wet
climate. Energies, 9(11), 875, Article 875. https://doi.org/10.3390/en9110875
Chong, H.-Y., Lee, C.-Y., & Wang, X. (2017). A mixed review of the adoption of building
information modelling (BIM) for sustainability. Journal of Cleaner Production,
142, 4114-4126. https://doi.org/10.1016/j.jclepro.2016.09.222
289
Clarke, J. A., & Hensen, J. (2015). Integrated building performance simulation:
Progress, prospects and requirements. Building and Environment, 91, 294-306.
https://doi.org/10.1016/j.buildenv.2015.04.002
Cohen, A., & Snell, C. (2018). Climate change and the bottom line: Delivering
sustainable buildings at market rate. Architectural Design, 88(1), 110-115.
https://doi.org/10.1002/ad.2265
Colinart, T., & Glouannec, P. (2014). Setting and drying of Bio-based building materials.
In J. M. P. Q. Delgado (Ed.), Building pathology and rehabilitation: Drying and
wetting of building materials and components (Vol. 4, pp. 91-112). Springer
International Publishing. https://doi.org/10.1007/978-3-319-04531-3_5
Colinart, T., Lelievre, D., & Glouannec, P. (2016). Experimental and numerical analysis
of the transient hygrothermal behavior of multilayered hemp concrete wall.
Energy and Buildings, 112, 1-11. https://doi.org/10.1016/j.enbuild.2015.11.027
Collet, F. (2017). Hygric and thermal properties of Bio-aggregate based building
materials. In S. Amziane & F. Collet (Eds.), Bio-aggregates based building
materials: State-of-the-art report of the RILEM technical committee 236-BBM
(pp. 125-148). Springer Netherlands. https://doi.org/10.1007/978-94-024-
1031-0_2
Corbo, S. (2018). Air design, meteorological architecture, and atmospheric
preservation: Towards a theory of feeling. Architectural Research Quarterly,
22(3), 188-193. https://doi.org/10.1017/S1359135518000490
CoreLogic. (2019). Quarterly property market & economic update, New Zealand,
quarter 3, 2019 [Report]. CoreLogic.
Corrado, V., & Fabrizio, E. (2019). Chapter 5 - Steady-state and dynamic codes, critical
review, advantages and disadvantages, accuracy, and reliability. In F. Asdrubali
& U. Desideri (Eds.), Handbook of energy efficiency in buildings (pp. 263-294).

290
Butterworth-Heinemann. https://doi.org/10.1016/B978-0-12-812817-6.00011-
5
Costanzo, V., Fabbri, K., & Piraccini, S. (2018). Stressing the passive behavior of a
passivhaus: An evidence-based scenario analysis for a mediterranean case
study. Building and Environment, 142, 265-277.
https://doi.org/10.1016/j.buildenv.2018.06.035
Cousins, F. (2016). How building services engineers can save civilization - CIBSE annual
lecture 2016 [Video]. The Chartered Institution of Building Services Engineers
(CIBSE). https://www.youtube.com/watch?v=z2qEeBV14a8
Cox-Smith, I. (2015). New homes dripping. Build, 151, 55-56. https://bit.ly/2AnXsrs
Crank, J., & Nicolson, P. (1947). A practical method for numerical evaluation of
solutions of partial differential equations of the heat-conduction type.
Mathematical Proceedings of the Cambridge Philosophical Society, 43(1), 50-67.
https://doi.org/10.1017/S0305004100023197
Crawford, R. H., Stephan, A., & Schmidt, M. (2018). Embodied carbon in buildings: An
Australian perspective. In F. Pomponi, C. De Wolf, & A. Moncaster (Eds.),
Embodied carbon in buildings : Measurement, management, and mitigation
(pp. 393-416). Springer. https://doi.org/10.1007/978-3-319-72796-7_18
Crawley, J., Wingfield, J., & Elwell, C. (2019). The relationship between airtightness and
ventilation in new UK dwellings. Building Services Engineering Research &
Technology, 40(3), 274-289. https://doi.org/10.1177/0143624418822199
Creswell, J. W., & Creswell, J. D. (2017). Research design: Qualitative, quantitative, and
mixed methods approaches (5. ed.). Sage Publishing.
Creswell, J. W., Gutmann, M. L., & Hanson, W. E. (2003). Advanced mixed methods
research designs. In A. Tashakkori & C. Teddlie (Eds.), Handbook of mixed

291
methods in social and behavioral research (1. ed., pp. 209-240). SAGE
Publications.
Crook, B., & Burton, N. C. (2010). Indoor moulds, sick building syndrome and building
related illness. Fungal Biology Reviews, 24(3–4), 106-113.
https://doi.org/10.1016/j.fbr.2010.05.001
Cullen-Lester, K. L., & Yammarino, F. J. (2016). Collective and network approaches to
leadership: Special issue introduction. The Leadership Quarterly, 27(2), 173-
180. https://doi.org/10.1016/j.leaqua.2016.02.001
Cunningham, M. J. (1988). The moisture performance of framed structures—a
mathematical model. Building and Environment, 23(2), 123-135.
https://doi.org/10.1016/0360-1323(88)90026-1
Cunningham, M. J. (1992). Effective penetration depth and effective resistance in
moisture transfer. Building and Environment, 27(3), 379-386.
https://doi.org/10.1016/0360-1323(92)90037-P
da Silva Serapião Leal, G., Guédria, W., & Panetto, H. (2019). Interoperability
assessment: A systematic literature review. Computers in Industry, 106, 111-
132. https://doi.org/10.1016/j.compind.2019.01.002
Dallasega, P., Marengo, E., & Revolti, A. (2020). Strengths and shortcomings of
methodologies for production planning and control of construction projects: A
systematic literature review and future perspectives. Production Planning &
Control, 1-26. https://doi.org/10.1080/09537287.2020.1725170
Daniotti, B., Pavan, A., Lupica Spagnolo, S., Caffi, V., Pasini, D., & Mirarchi, C. (2020a).
BIM-based collaborative building process management. Springer International
Publishing. https://doi.org/10.1007/978-3-030-32889-4
292
Daniotti, B., Pavan, A., Lupica Spagnolo, S., Caffi, V., Pasini, D., & Mirarchi, C. (2020b).
Collaborative working in a BIM environment (BIM platform). In BIM-based
collaborative building process management (pp. 71-102). Springer International
Publishing. https://doi.org/10.1007/978-3-030-32889-4_4
Daniotti, B., Pavan, A., Lupica Spagnolo, S., Caffi, V., Pasini, D., & Mirarchi, C. (2020c).
Standardized guidelines for the creation of BIM objects. In BIM-based
collaborative building process management (pp. 39-70). Springer International
Publishing. https://doi.org/10.1007/978-3-030-32889-4_3
Dastbaz, M., Gorse, C., & Moncaster, A. (Eds.). (2017). Building information modelling,
building performance, design and smart construction. Springer.
https://doi.org/10.1007/978-3-319-50346-2.
Dave, B., Boddy, S., & Koskela, L. (2013). Challenges and opportunities in implementing
Lean and BIM on an infrastructure project. In C. T. Formoso & P. Tzortzopoulos
(Eds.), 21th Annual Conference of the International Group for Lean Construction
(IGLC 21), Fortaleza, Brazil, 29 July - 2 August 2013 (pp. 741-750). The
International Group for Lean Construction (IGLC).
http://iglc.net/Papers/Conference/23
Davies, C., & Fisher, M. (2018). Understanding research paradigms. Journal of the
Australasian Rehabilitation Nurses' Association (JARNA), 21(3), 21-25.
Davies, D., & Trabucco, D. (2018). Embodied carbon of tall buildings: Specific
challenges. In F. Pomponi, C. De Wolf, & A. Moncaster (Eds.), Embodied carbon
in buildings : Measurement, management, and mitigation (pp. 341-364).
Springer. https://doi.org/10.1007/978-3-319-72796-7_16
Davies, J., Welch, J., Milward, D., & Harris, S. (2020). A formal, scalable approach to
semantic interoperability. Science of Computer Programming, 192, 102426.
https://doi.org/10.1016/j.scico.2020.102426
293
Davies, M., & Oreszczyn, T. (2012). The unintended consequences of decarbonising the
built environment: A UK case study. Energy and Buildings, 46, 80-85.
https://doi.org/10.1016/j.enbuild.2011.10.043
Dawood, S., Crosbie, T., Dawood, N., & Lord, R. (2013). Designing low carbon buildings:
A framework to reduce energy consumption and embed the use of renewables.
Sustainable Cities and Society, 8, 63-71.
https://doi.org/10.1016/j.scs.2013.01.005
De Groot, H., & Leardini, P. (2010). Indoor air quality and health in New Zealand's
traditional homes. [Paper presentation]. 44th Annual Conference of the
Architectural Science Association, Unitec Institute of Technology, Auckland,
New Zealand. https://bit.ly/35Yfqwj
De Luca Picione, R., & Freda, M. F. (2016). The processes of meaning making, starting
from the morphogenetic theories of rené thom. Culture and Psychology, 22(1),
139-157. https://doi.org/10.1177/1354067X15576171
De Rossi, A., Carvalheiras, J., Novais, R. M., Ribeiro, M. J., Labrincha, J. A., Hotza, D., &
Moreira, R. F. P. M. (2018). Waste-based geopolymeric mortars with very high
moisture buffering capacity. Construction and Building Materials, 191, 39-46.
https://doi.org/10.1016/j.conbuildmat.2018.09.201
De Simone, M., Carpino, C., Mora, D., Gauthier, S., Aragon, V., & Harputlugil, G. U.
(2018). Reference procedures for obtaining occupancy profiles in residential
buildings. IEA EBC Annex 66 Definition and Simulation of Occupant Behavior in
Buildings. https://bit.ly/3cunWW8
de Wilde, P. (2019). Ten questions concerning building performance analysis. Building
and Environment, 153, 110-117.
https://doi.org/10.1016/j.buildenv.2019.02.019
294
DeKay, M., & Bennett, S. (2011). Integral sustainable design, transformative
perspectives. https://doi.org/10.4324/9781849775366
DeKay, M., & Brown, G. Z. (2014). Sun, wind & light–architectural design strategies.
John Wiley & Sons.
DeKay, M., & Guzowski, M. (2006). A model for integral sustainable design explored
through daylighting [Paper presentation]. 31st ASES National Passive Solar
Conference, Denver, Colorado, United States. https://bit.ly/2WE4Gil
Delgado, J., Ramos, N., & De Freitas, V. (2006). Can moisture buffer performance be
estimated from sorption kinetics? Journal of Building Physics, 29(4), 281-299.
https://doi.org/10.1177/1744259106062568
Delgado, J. M. (Ed.). (2014). Drying and wetting of building materials and components
(Vol. 4). Springer.
Delgado, J. M., Barreira, E., Ramos, N. M., & de Freitas, V. P. (2013). Hygrothermal
numerical simulation tools applied to building physics. Springer.
https://doi.org/10.1007/978-3-642-35003-0
Demakis, J. M. (2012). The ultimate book of quotations. Lulu Enterprises, Inc.
Dengler, R. (1997). Dampf und Tropfen. Betrachtungen rund um die Luftfeuchtigkeit
[Article in German]. Plus Lucis, 3, 14-18. https://bit.ly/2SOVoPz
Densley Tingley, D., Giesekam, J., & Cooper-Searle, S. (2018). Applying circular
economic principles to reduce embodied carbon. In F. Pomponi, C. De Wolf, &
A. Moncaster (Eds.), Embodied carbon in buildings : Measurement,
management, and mitigation (pp. 265-285). Springer.
https://doi.org/10.1007/978-3-319-72796-7_12
Dent, E. B. (1999). Complexity science: A worldview shift. Emergence, 1(4), 5-19.
295
Denzin, N. K., & Lincoln, Y. S. E. (1994). Handbook of qualitative research. Sage
Publications, Inc.
Derby, M. M., Eckels, S., Jones, B., Hamehkasi, M., Hwang, G. M., Maghirang, R., &
Shulan, D. (2017). Update of the scientific evidence for specifying lower limit
relative humidity levels for comfort, health, and indoor environmental quality
in occupied spaces (rp-1630). Science and Technology for the Built Environment,
23(1), 30-45. https://doi.org/10.1080/23744731.2016.1206430
Derby, M. M., & Pasch, R. M. (2017). Effects of low humidity on health, comfort & IEQ.
ASHRAE Journal, 59(9), 44-51.
Desta, T. Z., Langmans, J., & Roels, S. (2011). Experimental data set for validation of
heat, air and moisture transport models of building envelopes. Building and
Environment, 46(5), 1038-1046.
https://doi.org/10.1016/j.buildenv.2010.11.002
Dimitrov, L., & Valchova, F. (2011). Problems with 3D data exchange between CAD
systems using neutral formats. PROCEEDINGS IN MANUFACTURING SYSTEMS,
6(3), 127-130. https://bit.ly/2YWH8YM
Dimyadi, J., Solihin, W., Eastman, C., & Amor, R. (2016). Integrating the BIM rule
language into compliant design audit processes [Paper presentation]. 33th CIB
W78 International Conference: IT in Construction, Brisbane, Australia.
https://bit.ly/3dxXYl1
DIN Standards. (2013). Thermal protection and energy economy in buildings - part 2:
Minimum requirements to thermal insulation (DIN 4108-2:2013-02). Beuth
Verlag GmbH. https://doi.org/10.31030/1929159

296
Ding, G. K. C. (2019). Emissions. In V. Y. Tam & K. N. Le (Eds.), Sustainable construction
technologies : Life-cycle assessment (pp. 263-297). Elsevier Science &
Technology. https://doi.org/10.1016/B978-0-12-811749-1.00008-0
Dixit, M. K., Venkatraj, V., Ostadalimakhmalbaf, M., Pariafsai, F., & Lavy, S. (2019).
Integration of facility management and building information modeling (BIM) : A
review of key issues and challenges. Facilities, 37(7/8), 455-483.
https://doi.org/10.1108/F-03-2018-0043
Doan, D. T., Ghaffarianhoseini, A., Naismith, N., Ghaffarianhoseini, A., Zhang, T., &
Tookey, J. (2019). Examining Green Star certification uptake and its relationship
with building information modelling (BIM) adoption in New Zealand. Journal of
Environmental Management, 250, Article 109508.
https://doi.org/10.1016/j.jenvman.2019.109508
Doan, D. T., Ghaffarianhoseini, A., Naismith, N., Zhang, T., Tookey, J., &
Ghaffarianhoseini, A. (2018). Examining the relationship between building
information modelling (BIM) and Green Star. International Journal of
Technology, 9(7), 1299-1307. https://doi.org/10.14716/ijtech.v9i7.2520
Domhagen, F., & Wahlgren, P. (2017). Consequences of varying airtightness in wooden
buildings. Energy Procedia, 132, 873-878.
https://doi.org/10.1016/j.egypro.2017.09.688
Domínguez-Amarillo, S., Fernández-Agüera, J., Campano, M. Á., & Acosta, I. (2019).
Effect of airtightness on thermal loads in legacy low-income housing. Energies,
12(9), 1677. https://doi.org/10.3390/en12091677
Dong, Z., & Lin, Y. (2020). Ultra-thin wafer technology and applications: A review.
Materials Science in Semiconductor Processing, 105, 104681.
https://doi.org/10.1016/j.mssp.2019.104681

297
dos Santos, G. H., & Mendes, N. (2014). Hygrothermal bridge effects on the
performance of buildings. International Communications in Heat and Mass
Transfer, 53, 133-138.
https://doi.org/10.1016/j.icheatmasstransfer.2014.02.018
Doumbouya, L., Guan, C. S., Gao, G., & Pan, Y. (2017). Application of BIM technology in
design and construction: A case study of pharmaceutical industrial base of
amino acid building project [Paper presentation]. 16th International Scientific
Conference on Engineering for Rural Development, Jelgava, Latvia.
https://doi.org/10.22616/ERDev2017.16.N338
Downey, A. (2018). Think complexity: Complexity science and computational modeling.
Green Tea Press.
Dowson, M. (2017). Shared creativity and spirituality in art, science, and religion. In M.
Miner & M. Dowson (Eds.), Creativity and spirituality: A multidisciplinary
perspective (pp. 59-82). Information Age Publishing, Inc.
Dubois, A., & Gadde, L.-E. (2002). Systematic combining: An abductive approach to
case research. Journal of Business Research, 55(7), 553-560.
https://doi.org/10.1016/S0148-2963(00)00195-8
Duncan, A., & Ward, L. (2017). A building pathology system in New Zealand – what is
possible? Study report SR366. Judgeford, New Zealand: BRANZ Ltd.
Duncan, J. (2005). Performance-based building: Lessons from implementation in New
Zealand. Building Research & Information, 33(2), 120-127.
https://doi.org/10.1080/09613210412331313007
Dyer, P. (2019). Rottenomics : The story of New Zealand's leaky buildings disaster.
David Bateman.

298
Eaqub, S., & de Raad, J.-P. (2018). Codebreakers: Constructing KiwiBuild homes to a
standard above the New Zealand building code [Report for the New Zealand
Green Building Council]. Sense Partners.
Eastman, C. M. (1975). The use of computers instead of drawings in building design.
AIA Journal, 63, 46-50.
Easton, G. (2010). Critical realism in case study research. Industrial marketing
management, 39(1), 118-128.
https://doi.org/10.1016/j.indmarman.2008.06.004
Edvardsson, B., Tronvoll, B., & Gruber, T. (2011). Expanding understanding of service
exchange and value co-creation: A social construction approach. Journal of the
Academy of Marketing Science, 39(2), 327-339.
https://doi.org/10.1007/s11747-010-0200-y
Eichhorn, M. P. (2016). What is a natural system? In Natural systems: The organisation
of life (pp. 341-344). John Wiley & Sons, Ltd.
https://doi.org/10.1002/9781118905982.ch21
Eisenberg, D. A. (2016). Transforming building regulatory systems to address climate
change. Building Research & Information, 44(5/6), 468-473.
https://doi.org/10.1080/09613218.2016.1126943
EnergyPlus. (n.d.). EnergyPlus™. Retrieved May 23, 2020 from https://energyplus.net/
Eriksson, D., Gasch, T., & Ansell, A. (2019). A hygro-thermo-mechanical multiphase
model for long-term water absorption into air-entrained concrete. Transport in
Porous Media, 127(1), 113-141. https://doi.org/10.1007/s11242-018-1182-3
Ermakov, A. S. (2018). Professor Lev Beloussov and the birth of morphomechanics.
BioSystems, 173, 26-35. https://doi.org/10.1016/j.biosystems.2018.10.010
299
Esbjörn-Hargens, S. (2005). Integral ecology: The what, who, and how of
environmental phenomena. World Futures, 61(1-2), 5-49.
https://doi.org/10.1080/02604020590902344
European Commission. (2018). Directive (EU) 2018/844 of the European parliament
and of the council of 30 May 2018 amending directive 2010/31/EU on the
energy performance of buildings and directive 2012/27/EU on energy
efficiency. Official Journal of the European Union, L 156, 75-91.
https://ec.europa.eu/energy/en/topics/energy-efficiency
European Standard. (2019). Energy performance of buildings - ventilation for buildings
- part 1: Indoor environmental input parameters for design and assessment of
energy performance of buildings addressing indoor air quality, thermal
environment, lighting and acoustics - module M1-6 (EN 16798-1:2019 E).
European Committee for Standardization, CEN-CENELEC Management Centre.
Ezema, I. C. (2019). Materials. In V. Y. Tam & K. N. Le (Eds.), Sustainable construction
technologies : Life-cycle assessment. Elsevier Science & Technology.
https://doi.org/10.1016/B978-0-12-811749-1.00007-9
Fadejev, J., Simson, R., Kurnitski, J., & Bomberg, M. (2017). Thermal mass and energy
recovery utilization for peak load reduction. Energy Procedia, 132, 39-44.
https://doi.org/10.1016/j.egypro.2017.09.628
Fang, L., Clausen, G., & Fanger, P. O. (1998). Impact of temperature and humidity on
the perception of indoor air quality. Indoor Air, 8(2), 80-90.
https://doi.org/10.1111/j.1600-0668.1998.t01-2-00003.x
Farmer, D., Johnston, D., & Miles-Shenton, D. (2016). Obtaining the heat loss
coefficient of a dwelling using its heating system (integrated coheating). Energy
and Buildings, 117, 1-10. https://doi.org/10.1016/j.enbuild.2016.02.013

300
Fauchoux, M. T., Simonson, C. J., Torvi, D. A., Eldeeb, R. M., & Ojanen, T. (2014). Cost
effective and energy efficient control of indoor humidity in buildings with
hygroscopic building materials and desiccants in the HVAC system. In J. M.
Delgado (Ed.), Building pathology and rehabilitation: Drying and wetting of
building materials and components (Vol. 4, pp. 175-196). Springer International
Publishing. https://doi.org/10.1007/978-3-319-04531-3
Fedorik, F., Heikkilä, R., Makkonen, T., & Haapala, A. (2017). Integration of structural
health control in BIM for current and future residential buildings [Paper
presentation]. 34th International Symposium on Automation and Robotics in
Construction (ISARC 2017), Taipei, Taiwan.
https://doi.org/10.22260/ISARC2017/0018
Fellows, R. F., & Liu, A. M. (2015). Research methods for construction (4 ed.). John
Wiley & Sons.
Feng, C., & Janssen, H. (2016). Hygric properties of porous building materials (II):
Analysis of temperature influence. Building and Environment, 99, 107-118.
https://doi.org/10.1016/j.buildenv.2016.01.016
Feng, C., & Janssen, H. (2018). Hygric properties of porous building materials (III):
Impact factors and data processing methods of the capillary absorption test.
Building and Environment, 134, 21-34.
https://doi.org/10.1016/j.buildenv.2018.02.038
Feng, C., & Janssen, H. (2019). Hygric properties of porous building materials (IV):
Semi-permeable membrane and psychrometer methods for measuring
moisture storage curves. Building and Environment, 152, 39-49.
https://doi.org/10.1016/j.buildenv.2019.01.054
Feng, C., Janssen, H., Feng, Y., & Meng, Q. (2015). Hygric properties of porous building
materials: Analysis of measurement repeatability and reproducibility. Building
and Environment, 85, 160-172. https://doi.org/10.1016/j.buildenv.2014.11.036
301
Feng, C., Roels, S., & Janssen, H. (2019). Towards a more representative assessment of
frost damage to porous building materials. Building and Environment, 164,
106343. https://doi.org/10.1016/j.buildenv.2019.106343
Ferguson, G. (2003). Understanding wastewater within natural and human systems. In
Sustainable wastewater management: A handbook for smaller communities
(Vol. ME 477, pp. 10 - 28). Ministry for the Environment, New Zealand.
Ferreira, A. (2018). Towards an integrative perspective: Bringing ken wilber’s
philosophy to planning theory and practice. Planning Theory & Practice, 19(4),
558-577. https://doi.org/10.1080/14649357.2018.1496270
Ferroukhi, M. Y., Belarbi, R., Limam, K., Si Larbi, A., & Nouviaire, A. (2019). Assessment
of the effects of temperature and moisture content on the hygrothermal
transport and storage properties of porous building materials. Heat and Mass
Transfer, 55(6), 1607-1617. https://doi.org/10.1007/s00231-018-02550-5
Ferroukhi, M. Y., Djedjig, R., Limam, K., & Belarbi, R. (2016). Hygrothermal behavior
modeling of the hygroscopic envelopes of buildings: A dynamic co-simulation
approach. Building Simulation, 9(5), 501-512. https://doi.org/10.1007/s12273-
016-0292-5
Fewings, P., & Henjewele, C. (2019). Construction project management : An integrated
approach (3. ed.). Routledge. https://doi.org/10.1201/9781351122030
Fish, A. J., & Wood, J. (2017). Promoting a strategic business focus to balance
competitive advantage and corporate social responsibility – missing elements.
Social Responsibility Journal, 13(1), 78-94. https://doi.org/10.1108/SRJ-04-
2016-0054
302
Fisk, W., & Seppanen, O. (2007). Providing better indoor environmental quality brings
economic benefits [Paper presentation]. Clima 2007 WellBeing Indoors,
Helsinki, Finland. https://bit.ly/2SWQIXI
Fisk, W. J. (2015). Review of some effects of climate change on indoor environmental
quality and health and associated no-regrets mitigation measures. Building and
Environment, 86, 70-80. https://doi.org/10.1016/j.buildenv.2014.12.024
Fisk, W. J., Black, D., & Brunner, G. (2011). Benefits and costs of improved IEQ in US
offices. Indoor Air, 21(5), 357-367. https://doi.org/10.1111/j.1600-
0668.2011.00719.x.
Fisk, W. J., Eliseeva, E. A., & Mendell, M. J. (2010). Association of residential dampness
and mold with respiratory tract infections and bronchitis: A meta-analysis.
Environmental Health, 9(72). https://doi.org/10.1186/1476-069X-9-72
Fisk, W. J., Lei-Gomez, Q., & Mendell, M. J. (2007). Meta-analyses of the associations of
respiratory health effects with dampness and mold in homes. Indoor Air, 17(4),
284-296. https://doi.org/10.1111/j.1600-0668.2007.00475.x
Flood, C., Scott, L., & Gleeson, W. (2017). Comparison of transient hygrothermal
modelling against in situ measurement for thermal transmittance. In M.
Dastbaz, C. Gorse, & A. Moncaster (Eds.), Building information modelling,
building performance, design and smart construction. (pp. 241-258). Springer.
https://doi.org/10.1007/978-3-319-50346-2_17
Fokaides, P. A., Maxoulis, C. N., Panayiotou, G. P., Neophytou, M. K. A., & Kalogirou, S.
A. (2011). Comparison between measured and calculated energy performance
for dwellings in a summer dominant environment. Energy and Buildings,
43(11), 3099-3105. https://doi.org/10.1016/j.enbuild.2011.08.005
303
Fortino, S., Hradil, P., & Metelli, G. (2019). Moisture-induced stresses in large glulam
beams. Case study: Vihantasalmi bridge. Wood Material Science & Engineering,
14(5), 366-380. https://doi.org/10.1080/17480272.2019.1638828
Fraunhofer Institute for Building Physics. (2017a). WUFI® Bio. Retrieved August 26,
2019 from https://wufi.de/en/2017/03/31/wufi-bio/
Fraunhofer Institute for Building Physics. (2017b). WUFI® mould index VTT. Retrieved
August 26, 2019 from https://wufi.de/en/2017/03/31/wufi-mould-index-vtt/
Fraunhofer Institute for Building Physics. (n.d.-a). Creating weather files. Retrieved
May 13, 2020 from https://wufi.de/en/service/downloads/creating-weather-
files/
Fraunhofer Institute for Building Physics. (n.d.-b). WUFI. Retrieved May 13, 2020 from
https://wufi.de/en/
Fraunhofer Institute for Building Physics. (n.d.-c). WUFI-Wiki. Retrieved May 13, 2020
from https://www.wufi-wiki.com/mediawiki/index.php/Details:Material
Fraunhofer Institute for Building Physics. (n.d.-d). WUFI forum. Retrieved May 13, 2020
from https://www.wufi-forum.com/viewtopic.php?t=1149
Fraunhofer Institute for Building Physics. (n.d.-e). WUFI® Plus. Retrieved May 13, 2020
from https://wufi.de/en/software/wufi-plus/
Frimpong, S., & Dansoh, A. (2018). Marginalization and invasion of architects’ role on
house projects: Institutional intervention inadequacy and super wicked
problems. Frontiers of Architectural Research, 7(3), 292-303.
https://doi.org/10.1016/j.foar.2018.04.001
304
Galbraith, G. H., Guo, J. S., & McLean, R. C. (2000). The effect of temperature on the
moisture permeability of building materials. Building Research & Information,
28(4), 245-259. https://doi.org/10.1080/09613210050073706
Gallaher, M. P., O’Connor, A. C., Dettbarn, J. L. J., & Gilday, L. T. (2004). Cost analysis of
inadequate interoperability in the US capital facilities industry. National
Institute of Standards and Technology (NIST).
https://doi.org/10.6028/NIST.GCR.04-867
Gallardo, A., Villacreses, G., Almaguer, M., Lobato-Cordero, A., & Cordovez, M. (2017).
Estimating the indoor thermal comfort deficit in the social housing built in
Ecuador by integrating building information modelling and geographical
information systems. In C. S. Barnaby & M. Wetter (Eds.), Proceedings of the
15th IBPSA Conference San Francisco, CA, USA, Aug. 7-9, 2017.
http://www.ibpsa.org/proceedings/BS2017/BS2017_354.pdf
Gallifa, J. (2019). Integral thinking and its application to integral education. Journal of
International Education and Practice, 2(1).
https://doi.org/10.30564/jiep.v2i1.603
Galotti, K. M. (2017). Cognitive psychology in and out of the laboratory (4 ed.). Sage
Publications.
Galvin, R. (2010). Solving mould and condensation problems: A dehumidifier trial in a
suburban house in britain. Energy and Buildings, 42(11), 2118-2123.
https://doi.org/10.1016/j.enbuild.2010.07.001
Gan, V. J. L., Deng, M., Tan, Y., Chen, W., & Cheng, J. C. P. (2019). BIM-based
framework to analyze the effect of natural ventilation on thermal comfort and
energy performance in buildings. Energy Procedia, 158, 3319-3324.
https://doi.org/10.1016/j.egypro.2019.01.971
305
Gangadean, A. (2010). Integral consciousness through the global lens: The great shift in
the presiding technology of consciousness. Futures, 42(10), 1049-1055.
https://doi.org/10.1016/j.futures.2010.08.003
Gao, H., Koch, C., & Wu, Y. (2019). Building information modelling based building
energy modelling: A review. Applied Energy, 238, 320-343.
https://doi.org/10.1016/j.apenergy.2019.01.032
Gaona-Forero, A., Agudelo-Rodríguez, G., Herrera, A. O., & Castellanos, D. A. (2018).
Modeling and simulation of an active packaging system with moisture
adsorption for fresh produce. Application in ‘hass’ avocado. Food Packaging
and Shelf Life, 17, 187-195. https://doi.org/10.1016/j.fpsl.2018.07.005
Garrecht, H. (1992). Porenstrukturmodelle für den Feuchtehaushalt von Baustoffen mit
und ohne Salzbefrachtung und rechnerische Anwendung auf Mauerwerk (Vol.
15). Universität Karlsruhe.
Gasiorowski-Denis, E. (2015). Boosting energy efficiency of buildings through ISO's
holistic approach. https://bit.ly/35Q4JvM
Gasiorowski-Denis, E. (2017). ISO 52000 leads the way on clean energy building
solutions. https://bit.ly/3fCHUjF
Gasparin, S., Berger, J., Dutykh, D., & Mendes, N. (2018a). Advanced reduced-order
models for moisture diffusion in porous media. Transport in Porous Media,
124(3), 965-994. https://doi.org/10.1007/s11242-018-1106-2
Gasparin, S., Berger, J., Dutykh, D., & Mendes, N. (2018b). An improved explicit scheme
for whole-building hygrothermal simulation. Building Simulation, 11(3), 465-
481. https://doi.org/10.1007/s12273-017-0419-3
Gasparin, S., Berger, J., Dutykh, D., & Mendes, N. (2018c). Stable explicit schemes for
simulation of nonlinear moisture transfer in porous materials. Journal of
306
Building Performance Simulation, 11(2), 129-144.
https://doi.org/10.1080/19401493.2017.1298669
Gaur, A., Lacasse, M., & Armstrong, M. (2019). Climate data to undertake
hygrothermal and whole building simulations under projected climate change
influences for 11 Canadian cities. Data, 4(2), 72.
https://doi.org/10.3390/data4020072
gbXML. (2017). Current schema, version 6.01 - January 2017. Green Building XML
(gbXML) Schema, Inc. Retrieved May 13, 2020 from
http://www.gbxml.org/Schema_Current_GreenBuildingXML_gbXML
gbXML. (2019). Software list - software tools that integrate with gbXML. Retrieved May
13, 2020 from
http://www.gbxml.org/Software_Tools_that_Support_GreenBuildingXML_gbX
ML
gbXML. (n.d.). The technology behind gbXML. Retrieved May 13, 2020 from
http://www.gbxml.org/About_GreenBuildingXML_gbXML
George, A. L., & Bennett, A. (2005). Case studies and theory development in the social
sciences. The MIT Press.
Georgiadou, M. C. (2019). An overview of benefits and challenges of building
information modelling (BIM) adoption in UK residential projects. Construction
Innovation, 19(3), 298-320. https://doi.org/10.1108/CI-04-2017-0030
Gerring, J. (2004). What is a case study and what is it good for? American political
science review, 98(2), 341-354.
Gervásio, H., Santos, P., Martins, R., & Simões da Silva, L. (2014). A macro-component
approach for the assessment of building sustainability in early stages of design.

307
Building and Environment, 73, 256-270.
https://doi.org/10.1016/j.buildenv.2013.12.015
GhaffarianHoseini, A., Doan, D. T., Naismith, N., Tookey, J., & GhaffarianHoseini, A.
(2017). Amplifying the practicality of contemporary building information
modelling (BIM) implementations for New Zealand green building certification
(Green Star). Engineering, Construction and Architectural Management, 24(4),
696-714. https://doi.org/10.1108/ECAM-02-2016-0043
Ghaffarianhoseini, A., Tookey, J., Ghaffarianhoseini, A., Naismith, N., Azhar, S.,
Efimova, O., & Raahemifar, K. (2017). Building information modelling (BIM)
uptake: Clear benefits, understanding its implementation, risks and challenges.
Renewable and Sustainable Energy Reviews, 75, 1046-1053.
https://doi.org/10.1016/j.rser.2016.11.083
Ghose, A., McLaren, S. J., Dowdell, D., & Phipps, R. (2017). Environmental assessment
of deep energy refurbishment for energy efficiency-case study of an office
building in New Zealand. Building and Environment, 117, 274-287.
https://doi.org/10.1016/j.buildenv.2017.03.012
Ghose, A., Pizzol, M., & McLaren, S. J. (2017). Consequential LCA modelling of building
refurbishment in New Zealand- an evaluation of resource and waste
management scenarios. Journal of Cleaner Production, 165, 119-133.
https://doi.org/10.1016/j.jclepro.2017.07.099
Ghose, A., Pizzol, M., McLaren, S. J., Vignes, M., & Dowdell, D. (2019). Refurbishment
of office buildings in New Zealand: Identifying priorities for reducing
environmental impacts. The International Journal of Life Cycle Assessment.
https://doi.org/10.1007/s11367-018-1570-5
Gibberd, J. (2015). Measuring capability for sustainability: The built environment
sustainability tool (BEST). Building Research & Information, 43(1), 49-61.
https://doi.org/10.1080/09613218.2014.930257

308
Gidley, J. M. (2010). Globally scanning for “megatrends of the mind”: Potential futures
of futures thinking. Futures, 42(10), 1040-1048.
https://doi.org/10.1016/j.futures.2010.08.002
Gillespie-Bennett, J. (2013). Improving health, safety and energy efficiency in New
Zealand through measuring and applying basic housing standards. New Zealand
Medical Journal, 126(1379), 74-85.
Giosuè, C., Belli, A., Mobili, A., Citterio, B., Biavasco, F., Ruello, M. L., & Tittarelli, F.
(2017). Improving the impact of commercial paint on indoor air quality by using
highly porous fillers. Buildings, 7(4), 110.
https://doi.org/10.3390/buildings7040110
Glaser, B. G., & Strauss, A. L. (2017). Discovery of grounded theory: Strategies for
qualitative research (1 ed.). Routledge.
https://doi.org/10.4324/9780203793206 (1999)
Glaser, B. G., Strauss, A. L., & Strutzel, E. (1968). The discovery of grounded theory;
strategies for qualitative research. Nursing Research, 17(4), 364.
Glaser, H. (1959). Graphisches verfahren zur untersuchung von diffusionsvorgängen.
Kältetechnik, 11(10), 345-349.
Glass, S. V., Gatland, S. D., Ueno, K., & Schumacher, C. J. (2017). Analysis of improved
criteria for mold growth in ASHRAE standard 160 by comparison with field
observations. In P. Mukhopadhyaya & D. Fisler (Eds.), Advances in
hygrothermal performance of building envelopes: Materials, systems and
simulations (pp. 1-27). ASTM International.
https://doi.org/10.1520/STP159920160106
Glass, S. V., Kochkin, V., Drumheller, S. C., & Barta, L. (2015). Moisture performance of
energy-efficient and conventional wood-frame wall assemblies in a mixed-
309
humid climate. Buildings, 5(3), 759-782.
https://doi.org/10.3390/buildings5030759
Golafshani, N. (2003). Understanding reliability and validity in qualitative research. The
Qualitative Report, 8(4), 597-606. https://bit.ly/3cn7O8R
Gonzalez-Martinez, J. F., Znamenskaya Falk, Y., Björklund, S., Erkselius, S., Rehnberg,
N., & Sotres, J. (2018). Humidity-induced phase transitions of surfactants
embedded in latex coatings can drastically alter their water barrier and
mechanical properties. Polymers, 10(3).
https://doi.org/10.3390/polym10030284
Gorski, P. S. (2013). What is critical realism? And why should you care? Contemporary
Sociology, 42(5), 658-670. https://doi.org/10.1177/0094306113499533
Gosse, L. (2018). ℒ-splines and viscosity limits for well-balanced schemes acting on
linear parabolic equations. Acta Applicandae Mathematicae, 153(1), 101-124.
https://doi.org/10.1007/s10440-017-0122-5
Graves, C. W. (1970). Levels of existence: An open system theory of values. Journal of
Humanistic Psychology, 10(2), 131-155.
https://doi.org/10.1177/002216787001000205
Grilo, A., & Jardim-Goncalves, R. (2010). Value proposition on interoperability of BIM
and collaborative working environments. Automation in Construction, 19(5),
522-530. https://doi.org/10.1016/j.autcon.2009.11.003
Grof, S. (2016). Realms of the human unconscious: Observations from LSD research.
Souvenir Press.
Grunewald, J. (1997). Diffusiver und konvektiver Stoff- und Energie-transport in
kapillarporösen Baustoffen [Doktor Ingenieur dissertation, Technische
Universität Dresden]. https://bit.ly/35P9w0k

310
Guimarães, A. S., Delgado, J. M. P. Q., Azevedo, A. C., & de Freitas, V. P. (2018).
Interface influence on moisture transport in buildings. Construction and
Building Materials, 162, 480-488.
https://doi.org/10.1016/j.conbuildmat.2017.12.040
Gullbrekken, L., Grynning, S., & Gaarder, J. E. (2019). Thermal performance of insulated
constructions—experimental studies. Buildings, 9(2), 49.
https://doi.org/10.3390/buildings9020049
Guo, H., Yu, R., & Fang, Y. (2019). Analysis of negative impacts of BIM-enabled
information transparency on contractors' interests. Automation in
Construction, 103, 67-79. https://doi.org/10.1016/j.autcon.2019.03.007
Gupta, R., & Barnfield, L. (2014). Unravelling the unintended consequences of home
energy improvements. International Journal of Energy Sector Management,
8(4), 506-526. https://doi.org/10.1108/IJESM-11-2013-0006
Guyot, G., Geoffroy, H., Ondarts, M., Migne, L., Bobee, M., Gonze, E., & Woloszyn, M.
(2019). Modelling the impact of multizone airleakage on ventilation
performance and indoor air quality in low-energy homes. Building Simulation,
12(6), 1141-1159. https://doi.org/10.1007/s12273-019-0557-x
Guzmán Garcia, E., & Zhu, Z. (2015). Interoperability from building design to building
energy modeling. Journal of Building Engineering, 1, 33-41.
https://doi.org/10.1016/j.jobe.2015.03.001
Haas, D., Mayrhofer, H., Habib, J., Galler, H., Reinthaler, F. F., Fuxjäger, M. L., & Buzina,
W. (2019). Distribution of building-associated wood-destroying fungi in the
federal state of Styria, Austria. European Journal of Wood and Wood Products,
77(4), 527-537. https://doi.org/10.1007/s00107-019-01407-w
311
Hagentoft, C. E., & Kalagasidis, A. S. (2013). Hygrothermal conditions and mould
growth potential in cold attics: Impact of weather, building system and
construction design characteristics. In V. P. de Freitas & J. M. P. Q. Delgado
(Eds.), Hygrothermal behavior, building pathology and durability (pp. 61-91).
Springer. https://doi.org/10.1007/978-3-642-31158-1_4
Haghighat, F., Jiang, Z., & Wang, J. (1989). Natural convection and air flow pattern in a
partitioned room with turbulent flow. ASHRAE Transactions, 95(2), 600-610.
Hahm, M. I., Chae, Y., Kwon, H. J., Kim, J., Ahn, K., Kim, W. K., Lee, S. Y., Park, Y. M.,
Han, M. Y., Lee, K. J., Lee, H. Y., & Min, I. (2014). Do newly built homes affect
rhinitis in children? The ISAAC phase III study in Korea. Allergy, 69(4), 479-487.
https://doi.org/10.1111/all.12355
Hall, M. R., Casey, S. P., Loveday, D. L., & Gillott, M. (2013). Analysis of UK domestic
building retrofit scenarios based on the E.On retrofit research house using
energetic hygrothermics simulation – energy efficiency, indoor air quality,
occupant comfort, and mould growth potential. Building and Environment, 70,
48-59. https://doi.org/10.1016/j.buildenv.2013.08.015
Halmetoja, E. (2019). The conditions data model supporting building information
models in facility management. Facilities, 37(7/8), 484-501.
https://doi.org/10.1108/F-11-2017-0112
Hammad, A. W. A., Akbarnezhad, A., & Oldfield, P. (2018). Optimising embodied
carbon and U-value in load bearing walls: A mathematical bi-objective mixed
integer programming approach. Energy and Buildings, 174, 657-671.
https://doi.org/10.1016/j.enbuild.2018.05.061
HAMSTAD. (2000-2002). Hamstad project - heat, air and moisture standards
development Retrieved February 01, 2019 from
http://byggnadsteknologi.se/home-2/downloads/hamstad%20project.html
312
Hannart, A., Pearl, J., Otto, F. E. L., Naveau, P., & Ghil, M. (2016). Causal counterfactual
theory for the attribution of weather and climate-related events. Bulletin of the
American Meteorological Society, 97(1), 99-110. https://doi.org/10.1175/bams-
d-14-00034.1
Hansen, K. K., Bunch-Nielsen, T., Grelk, B., & Rode, C. (2016). Magnesium-oxide boards
cause moisture damage inside facades in new Danish buildings [Paper
presentation]. International RILEM Conference Materials Systems and
Structures in Civil Engineering 2016 (MSSCE 2016) on Moisture in Materials and
Structures, Lyngby, Denmark. https://bit.ly/2yFcLvt
Hansen, M. H., Houvenaghel, G., Janz, M., Krus, M., & Strømdahl, K. (1999).
Interlaboratory comparison of the measurement of retention curves. Journal of
Thermal Envelope and Building Science, 22(4), 334-348.
Haoues, M., Sellami, A., Ben-Abdallah, H., & Cheikhi, L. (2017). A guideline for software
architecture selection based on ISO 25010 quality related characteristics.
International Journal of System Assurance Engineering and Management, 8(2),
886-909. https://doi.org/10.1007/s13198-016-0546-8
Harish, V. S. K. V., & Kumar, A. (2016). A review on modeling and simulation of building
energy systems. Renewable and Sustainable Energy Reviews, 56, 1272-1292.
https://doi.org/10.1016/j.rser.2015.12.040
Harré, R. (2001). How to change reality: Story vs. Structure-a debate between rom
harré and roy bhaskar. In J. Lopez & G. Potter (Eds.), After postmodernism: An
introduction to critical realism (Vol. 1, pp. 22-39). Continuum International
Publishing Group Ltd.
Harriman, L. (2012). 2012 ASHRAE position document, mold and dampness. ASHRAE
Journal, 54(12), 132-133.
313
Hart, C. (2018). Doing a literature review: Releasing the research imagination. Sage
Publications.
Hart, J., Adams, K., Giesekam, J., Tingley, D. D., & Pomponi, F. (2019). Barriers and
drivers in a circular economy: The case of the built environment. Procedia CIRP,
80, 619-624. https://doi.org/10.1016/j.procir.2018.12.015
Hartwig, M. (2015). Dictionary of critical realism (1 ed.). Routledge.
https://doi.org/10.4324/9781315688299 (2007)
Häupl, P., Stopp, H., Strangfeld, P., & Grunewald, J. (1993). Kapillare und gravitative
feuchteleitung in kapillarporösen Baustoffen. HAUSTECHNIK BAUPHYSIK
UMWELTTECHNIK (GI), 114(1), 19-30.
Haynes, W. M. (Ed.). (2015). CRC handbook of chemistry and physics (96 ed.). CRC
press.
Health Based Building. (2017). Magnum board technical information. Retrieved
January 10, 2019 from www.healthbasedbuilding.com
Heeren, N., & Hellweg, S. (2019). Tracking construction material over space and time:
Prospective and geo-referenced modeling of building stocks and construction
material flows. Journal of Industrial Ecology, 23(1), 253-267.
https://doi.org/10.1111/jiec.12739
Hens, H. (2002). IEA Annex 24: Heat, air and moisture transfer in highly insulated
building envelopes (HAMTIE) [Report]. FaberMaunsell Limited.
https://bit.ly/2WAKi1E
Hens, H. L. S. C. (2012). Actual limits of HAM-modelling looking at problems
encountered in practice, part 1: A short history of heat, air and moisture
modelling. IBPSA News, 22(2), 23-40. https://bit.ly/2WjlzQt
314
Hens, H. L. S. C. (2015). Combined heat, air, moisture modelling: A look back, how, of
help? Building and Environment, 91, 138-151.
https://doi.org/10.1016/j.buildenv.2015.03.009
Hens, H. L. S. C. (2016). Applied building physics : Boundary conditions, building
performance and material properties. Wilhelm Ernst & Sohn Verlag fur
Architektur und Technische.
Hens, H. L. S. C. (2017). Building physics-heat, air and moisture: Fundamentals and
engineering methods with examples and exercises (3 ed.). Wilhelm Ernst &
Sohn Verlag fur Architektur und Technische.
Hensen, J. L. M., & Lamberts, R. (Eds.). (2019). Building performance simulation for
design and operation. Routledge.
Heseltine, E., & Rosen, J. (Eds.). (2009). WHO guidelines for indoor air quality:
Dampness and mould. World Health Organization (WHO) Europe.
Hess-Kosa, K. (2017). Building materials : Product emission and combustion health
hazards. CRC Press.
Higgins, J. P., & Green, S. (Eds.). (2011). Cochrane handbook for systematic reviews of
interventions (Version 5.1.0 ed.). The Cochrane Collaboration. http://handbook-
5-1.cochrane.org/.
Hildebrandt, S., Kubota, T., Sani, H. A., & Surahman, U. (2019). Indoor air quality and
health in newly constructed apartments in developing countries: A case study
of Surabaya, Indonesia. Atmosphere, 10(4), 182.
https://doi.org/10.3390/atmos10040182
Hjørland, B. (2005). Empiricism, rationalism and positivism in library and information
science. Journal of Documentation, 61(1), 130-155.
https://doi.org/10.1108/00220410510578050

315
Hoang, C. P., Kinney, K. A., Corsi, R. L., & Szaniszlo, P. J. (2010). Resistance of green
building materials to fungal growth. International Biodeterioration &
Biodegradation, 64(2), 104-113. https://doi.org/10.1016/j.ibiod.2009.11.001
Hochdörffer, J., Buergin, J., Vlachou, E., Zogopoulos, V., Lanza, G., & Mourtzis, D.
(2018). Holistic approach for integrating customers in the design, planning, and
control of global production networks. CIRP Journal of Manufacturing Science
and Technology, 23, 98-107. https://doi.org/10.1016/j.cirpj.2018.07.004
Hoisington, A. J., Stearns-Yoder, K. A., Schuldt, S. J., Beemer, C. J., Maestre, J. P.,
Kinney, K. A., Postolache, T. T., Lowry, C. A., & Brenner, L. A. (2019). Ten
questions concerning the built environment and mental health. Building and
Environment, 155, 58-69. https://doi.org/10.1016/j.buildenv.2019.03.036
Hokoi, S. (2019). Complication–simplification spiral in hygrothermal research. Japan
Architectural Review, 2(1), 5-15. https://doi.org/10.1002/2475-8876.12075
Hopfe, C. J., & McLeod, R. S. (Eds.). (2015). The passivhaus designer's manual : A
technical guide to low and zero energy buildings. Routledge.
Horn, W., Jann, O., & Wilke, O. (2003). Suitability of small environmental chambers to
test the emission of biocides from treated materials into the air. Atmospheric
Environment, 37(39–40), 5477-5483.
https://doi.org/10.1016/j.atmosenv.2003.09.024
Hörner, M., & Lichtmeß, M. (2019). Energy performance of buildings:
A statistical approach to marry calculated demand and measured consumption.
Energy Efficiency, 12(1), 139-155. https://doi.org/10.1007/s12053-018-9664-2
Horst, J. A., Hartman, N. W., & Wong, G. (2011). Metrics for the cost of proprietary
information exchange languages in intelligent systems. In Proceedings of the
316
2010 Performance Metrics for Intelligent Systems (PerMIS) Workshop,
September 28-30, 2010, Baltimore, MD (pp. 82-86). https://bit.ly/3fItC0Q
Howden-Chapman, P. (2004). Housing standards: A glossary of housing and health.
Journal of Epidemiology and Community Health, 58(3), 162-168.
https://doi.org/10.1136/jech.2003.011569
Howden-Chapman, P. (2015). How real are the health effects of residential energy
efficiency programmes? Social Science & Medicine, 133(18), 9e190.
https://doi.org/10.1016/j.socscimed.2015.03.017
Howden-Chapman, P., & Chapman, R. (2012). Health co-benefits from housing-related
policies. Current Opinion in Environmental Sustainability, 4(4), 414-419.
https://doi.org/10.1016/j.cosust.2012.08.010
Howden-Chapman, P., Pierse, N., Nicholls, S., Gillespie-Bennett, J., Viggers, H.,
Cunningham, M., Phipps, R., Boulic, M., Fjällström, P., & Free, S. (2008). Effects
of improved home heating on asthma in community dwelling children:
Randomised controlled trial. BMJ: British Medical Journal, 337(7674), 852-855.
Howden, J. (2015). What is BIM, exactly? Retrieved September 18, 2016, from
http://www.warrenandmahoney.com/en/perspectives/what-is-bim-exactly/
Huang, H., Kato, S., Hu, R., & Ishida, Y. (2011). Development of new indices to assess
the contribution of moisture sources to indoor humidity and application to
optimization design: Proposal of CRI(H) and a transient simulation for the
prediction of indoor humidity. Building and Environment, 46(9), 1817-1826.
https://doi.org/10.1016/j.buildenv.2011.03.002
Huang, Z., Sun, Y., & Musso, F. (2017). Assessment of bamboo application in building
envelope by comparison with reference timber. Construction and Building
Materials, 156, 844-860. https://doi.org/10.1016/j.conbuildmat.2017.09.026
317
Hubert, M., & Vandervieren, E. (2008). An adjusted boxplot for skewed distributions.
Computational Statistics and Data Analysis, 52, 5186-5201.
https://doi.org/10.1016/j.csda.2007.11.008
Hui, R. (2020). Application of high-speed dsp in optical communications. In R. Hui (Ed.),
Introduction to fiber-optic communications (pp. 497-553). Academic Press.
https://doi.org/10.1016/B978-0-12-805345-4.00011-1
Huitema, B. E. (2011). Analysis of covariance and alternatives : Statistical methods for
experiments, quasi-experiments, and single-case studies (2. ed.). Wiley.
Humphreys, P. (2004). Extending ourselves: Computational science, empiricism, and
scientific method. Oxford University Press, Inc.
Hunt, R. J., & Gonzalez, V. A. (2018). Innovation in the New Zealand construction
industry – diffusion of the last planner system [Paper presentation]. 26th
Annual Conference of the International Group for Lean Construction (IGLC 26),
Chennai, India, 2018,
Hunt, S. D. (2016). Controversy in marketing theory: For reason, realism, truth and
objectivity. Routledge. (2003)
Hurel, N., Pailha, M., Garnier, G., & Woloszyn, M. (2016). Impact of different
construction details on air permeability of timber frame wall assemblies: Some
experimental evidences from a three-scale laboratory study. Journal of Building
Physics, 41(2), 162-189. https://doi.org/10.1177/1744259116673983
Husserl, E. (2012). Ideas: General introduction to pure phenomenology. Routledge.
(1913)
IBP, F. (2019, 19.12.2018). WUFI. Retrieved 20.02. from https://wufi.de/en/

318
IEA EBC. (n.d.). Annex 72: Assessing life cycle related environmental impacts caused by
buildings (2016 - 2021). International Energy Agency (IEA). Retrieved
September 10, 2019 from https://www.iea-
ebc.org/projects/project?AnnexID=72
Ikeda, A. (2020). Learning-by-doing and business cycles in emerging economies. Review
of World Economics. https://doi.org/10.1007/s10290-020-00373-3
Ingham, T., Keall, M., Jones, B., Aldridge, D. R. T., Dowell, A. C., Davies, C., Crane, J.,
Draper, J. B., Bailey, L. O., Viggers, H., Stanley, T. V., Leadbitter, P., Latimer, M.,
& Howden-Chapman, P. (2019). Damp mouldy housing and early childhood
hospital admissions for acute respiratory infection: A case control study.
Thorax, 74(9), 849. https://doi.org/10.1136/thoraxjnl-2018-212979
Integrated Environmental Solutions. (n.d.). IES Virtual Environment, integrated suite for
accurate whole building performance simulation. Retrieved October 14, 2019
from https://www.iesve.com/software
International Building Performance Simulation Association. (n.d.). Building energy
software tools, BEST directory. IBPSA, United States. Retrieved September 13,
2019 from https://www.buildingenergysoftwaretools.com/
International Building Physics Toolbox. (2012, July 31). HAM-tools. Retrieved February
01, 2019 from http://www.ibpt.org/courses.html
International Energy Agency. (2017). Energy policies of IEA countries: New Zealand
2017 review. https://doi.org/10.1787/9789264272354-en
ISO. (2004). Industrial automation systems and integration — product data
representation and exchange — part 11: Description methods: The EXPRESS
language reference manual (ISO 10303-11:2004). International Organization for
Standardization.
319
ISO. (2007). Industrial automation systems and integration — product data
representation and exchange — part 28: Implementation methods: XML
representations of EXPRESS schemas and data, using XML schemas (ISO 10303-
28:2007). International Organization for Standardization.
ISO. (2008). Hygrothermal performance of building materials and products.
Determination of moisture adsorption/desorption properties in response to
humidity variation (ISO 24353:2008(en)). International Organization for
Standardization.
ISO. (2013). Hygrothermal performance of building materials and products.
Determination of hygroscopic sorption properties (ISO 12571:2013(E)).
International Organization for Standardization.
ISO. (2016). Industrial automation systems and integration — product data
representation and exchange — part 21: Implementation methods: Clear text
encoding of the exchange structure (ISO 10303-21:2016). International
Organization for Standardization.
ISO. (2017). Energy performance of buildings - overarching EPB assessment - part 1:
General framework and procedures (ISO 52000-1:2017). International
Organization for Standardization.
ISO. (2018a). Hygrothermal performance of building materials and products -
determination of moisture adsorption/desorption properties in response to
humidity variation (ISO 24353:2008) (Vol. 2019). International Organization for
Standardization. https://www.iso.org/standard/42167.html
ISO. (2018b). Industry foundation classes (IFC) for data sharing in the construction and
facility management industries - part 1: Data schema (ISO 16739-1:2018).
International Organization for Standardization.
320
ISO/IEC/IEEE International Standard. (2017). Systems and software engineering-
vocabulary (ISO/IEC/IEEE 24765:2017(E)). IEEE.
https://doi.org/10.1109/IEEESTD.2017.8016712
Ivory, V. C., O'Donnell, K., & Schindler, M. (2019). Potentials, problems and possibilities
for developing New Zealand's built environment through high-value geospatial
information. Kōtuitui: New Zealand Journal of Social Sciences Online, 14(1), 95-
111. https://doi.org/10.1080/1177083X.2018.1538053
Jaakkola, M. S., Quansah, R., Hugg, T. T., Heikkinen, S. A., & Jaakkola, J. J. (2013).
Association of indoor dampness and molds with rhinitis risk: A systematic
review and meta-analysis. Journal of Allergy and Clinical Immunology, 132(5),
1099-1110. e1018. https://doi.org/10.1016/j.jaci.2013.07.028
Jackson, P. T. (2015). Fear of relativism1. International Studies Perspectives, 16(1), 13-
22. https://doi.org/10.1111/insp.12091
James, C., Simonson, C. J., Talukdar, P., & Roels, S. (2010). Numerical and experimental
data set for benchmarking hygroscopic buffering models. International Journal
of Heat and Mass Transfer, 53(19–20), 3638-3654.
https://doi.org/10.1016/j.ijheatmasstransfer.2010.03.039
Janbon, G., Quintin, J., Lanternier, F., & d’Enfert, C. (2019). Studying fungal pathogens
of humans and fungal infections: Fungal diversity and diversity of approaches.
Microbes and Infection. https://doi.org/10.1016/j.micinf.2019.06.011
Janssen, H. (2011). Thermal diffusion of water vapour in porous materials: Fact or
fiction? International Journal of Heat and Mass Transfer, 54(7), 1548-1562.
https://doi.org/10.1016/j.ijheatmasstransfer.2010.11.034
Janssen, H. (2018). A discussion of “characterization of hygrothermal properties of
wood-based products – impact of moisture content and temperature”.
321
Construction and Building Materials, 185, 39-43.
https://doi.org/10.1016/j.conbuildmat.2018.07.018
Janssen, H., Blocken, B., & Carmeliet, J. (2007). Conservative modelling of the moisture
and heat transfer in building components under atmospheric excitation.
International Journal of Heat and Mass Transfer, 50(5), 1128-1140.
https://doi.org/10.1016/j.ijheatmasstransfer.2006.06.048
Janssen, H., & Roels, S. (2009). Qualitative and quantitative assessment of interior
moisture buffering by enclosures. Energy and Buildings, 41(4), 382-394.
https://doi.org/10.1016/j.enbuild.2008.11.007
Janssens, A. (1998). Reliable control of interstitial condensation in lightweight roof
systems : Calculation and assessment methods [PhD thesis, Katholieke
Universiteit Leuven]. https://bwk.kuleuven.be/bwf/PhDs/PhDJanssens
Jaques, R., Berg, B., & McNeil, S. (2016). The selection and hygro-thermal modelling of
New Zealand dwellings (pilot). Study report SR361. Judgeford, New Zealand:
BRANZ Ltd.
Jensen, K. R., Fojan, P., Jensen, R. L., & Gurevich, L. (2014). Water condensation: A
multiscale phenomenon. Journal of Nanoscience and Nanotechnology, 14(2),
1859-1871. https://doi.org/10.1166/jnn.2014.9108
Jensen, P., Larsson, J., Simonsson, P., & Olofsson, T. (2013). Improving buildabuility
with platforms and configurators. In C. T. Formoso & P. Tzortzopoulos (Eds.),
21th Annual Conference of the International Group for Lean Construction (IGLC
21), Fortaleza, Brazil, 29 July - 2 August 2013 (pp. 771-780). International Group
for Lean Construction (IGLC). http://iglc.net/Papers/Details/914
Jeon, J., Park, J. H., Wi, S., Yang, S., Ok, Y. S., & Kim, S. (2019). Latent heat storage
biocomposites of phase change material-biochar as feasible eco-friendly
322
building materials. Environmental Research, 172, 637-648.
https://doi.org/10.1016/j.envres.2019.01.058
Jeong, W., Kim, J. B., Clayton, M. J., Haberl, J. S., & Yan, W. (2016). A framework to
integrate object-oriented physical modelling with building information
modelling for building thermal simulation. Journal of Building Performance
Simulation, 9(1), 50-69. https://doi.org/10.1080/19401493.2014.993709
Jerman, M., Palomar, I., Kočí, V., & Černý, R. (2019). Thermal and hygric properties of
biomaterials suitable for interior thermal insulation systems in historical and
traditional buildings. Building and Environment, 154, 81-88.
https://doi.org/10.1016/j.buildenv.2019.03.020
Jester, T. C. (Ed.). (2014). Twentieth-century building materials: History and
conservation. Getty Publications.
Jiang, Y. H., Bourebrab, M. A., Sid, N., Taylor, A., Collet, F., Pretot, S., Hussain, A.,
Ansell, M., & Lawrence, M. (2018). Improvement of water resistance of hemp
woody substrates through deposition of functionalized silica hydrophobic
coating, while retaining excellent moisture buffering properties. Acs
Sustainable Chemistry & Engineering, 6(8), 10151-10161.
https://doi.org/10.1021/acssuschemeng.8b01475
Jin, R., Zhong, B., Ma, L., Hashemi, A., & Ding, L. (2019). Integrating BIM with building
performance analysis in project life-cycle. Automation in Construction, 106,
102861. https://doi.org/10.1016/j.autcon.2019.102861
JIS. (2014). Determination of water vapour adsorption/desorption properties for
building materials - part 1: Response to humidity variation (JIS a 1470-1).
Japanese Standards Association (JSA)
Johansson, P., Ekstrand-Tobin, A., & Bok, G. (2014). An innovative test method for
evaluating the critical moisture level for mould growth on building materials.
323
Building and Environment, 81, 404-409.
https://doi.org/10.1016/j.buildenv.2014.07.002
Johansson, P., Ekstrand-Tobin, A., Svensson, T., & Bok, G. (2012). Laboratory study to
determine the critical moisture level for mould growth on building materials.
International Biodeterioration & Biodegradation, 73, 23-32.
https://doi.org/10.1016/j.ibiod.2012.05.014
Johansson, P., Svensson, T., & Ekstrand-Tobin, A. (2013). Validation of critical moisture
conditions for mould growth on building materials. Building and Environment,
62, 201-209. https://doi.org/10.1016/j.buildenv.2013.01.012
Johnston, D., Miles-Shenton, D., Wingfield, J., Farmer, D., & Bell, M. (2013). Whole
house heat loss test method (coheating). Leeds Metropolitan University.
https://bit.ly/2WKQPa4
Johnston, J. D., Tuttle, S. C., Nelson, M. C., Bradshaw, R. K., Hoybjerg, T. G., Johnson, J.
B., Kruman, B. A., Orton, T. S., Cook, R. B., Eggett, D. L., & Weber, K. S. (2016).
Evaporative cooler use influences temporal indoor relative humidity but not
dust mite allergen levels in homes in a semi-arid climate. PLOS ONE, 11(1).
https://doi.org/10.1371/journal.pone.0147105
Jonassen, D. H. (1991). Objectivism versus constructivism: Do we need a new
philosophical paradigm? Educational technology research and development,
39(3), 5-14.
Jones, D. (2018). Energy arbitrations in the construction sector. Construction Law
International, 13(1), 15-24.
Jorgensen, D. L. (2015). Participant observation : A methodology for human studies.
Wiley Online Library. https://doi.org/10.1002/9781118900772.etrds0247
(1989)

324
Josephson, P. E., & Hammarlund, Y. (1999). The causes and costs of defects in
construction: A study of seven building projects. Automation in Construction,
8(6), 681-687. https://doi.org/10.1016/S0926-5805(98)00114-9
Jowett, G. (2015). A place for BIM Architecturenow. https://bit.ly/2xQk5Un
Kaczorek, D. (2019). Moisture buffering of multilayer internal wall assemblies at the
micro scale: Experimental study and numerical modelling. Applied Sciences,
9(16), 3438. https://doi.org/10.3390/app9163438
Kadadi, A., Agrawal, R., Nyamful, C., & Atiq, R. (2014). Challenges of data integration
and interoperability in big data. In 2014 IEEE International Conference on Big
Data (Big Data), October 27-30, 2014, Washington, DC, USA (pp. 38-40).
https://doi.org/10.1109/BigData.2014.7004486
Kahui, V., & Cullinane, A. (2019). The ecosystem commons. New Zealand Journal of
Ecology, 43(3), 1. https://doi.org/10.20417/nzjecol.43.28
Kalagasidis, A. S. (2004). HAM-tools-an integrated simulation tool for heat, air and
moisture transfer analyses in building physics [PhD, Chalmers University of
Technology]. Gothenburg, Sweden.
https://research.chalmers.se/publication/485
Kalagasidis, A. S., Rode, C., & Woloszyn, M. (2008). HAM-tools – a whole building
simulation tool in Annex 41. In C. Rode, H. Hens, & H. Janssen (Eds.),
Proceedings of the IEA ECBCS Annex 41 Closing Seminar (pp. 21-35). Technical
University of Denmark, Department of Civil Engineering. https://bit.ly/3dBe39u
Kalagasidis, A. S., Weitzmann, P., Nielsen, T. R., Peuhkuri, R., Hagentoft, C.-E., & Rode,
C. (2007). The international building physics toolbox in simulink. Energy and
Buildings, 39(6), 665-674. https://doi.org/10.1016/j.enbuild.2006.10.007
325
Kaplan, A. (2017). The conduct of inquiry: Methodology for behavioural science.
Routledge. (1964)
Karagiannis, N., Karoglou, M., Bakolas, A., Krokida, M., & Moropoulou, A. (2018). The
influence of dynamic environmental conditions on capillary water uptake of
building materials. Journal of Building Physics, 42(4), 506-526.
https://doi.org/10.1177/1744259118773284
Kassem, M., & Succar, B. (2017). Macro BIM adoption: Comparative market analysis.
Automation in Construction, 81, 286-299.
https://doi.org/10.1016/j.autcon.2017.04.005
Kazemian, N., Pakpour, S., Milani, A. S., & Klironomos, J. (2019). Environmental factors
influencing fungal growth on gypsum boards and their structural
biodeterioration: A university campus case study. PLOS ONE, 14(8), e0220556.
https://doi.org/10.1371/journal.pone.0220556
Kent, D. C., & Becerik-Gerber, B. (2010). Understanding construction industry
experience and attitudes toward integrated project delivery. Journal of
Construction Engineering & Management, 136(8), 815-825.
https://doi.org/10.1061/(ASCE)CO.1943-7862.0000188
Kerestecioglu, A., Swami, M., & Kamel, A. (1990). Theoretical and computational
investigation of simultaneous heat and moisture transfer in buildings: Effective
penetration depth theory. ASHRAE Transactions, 96(1), 447-454.
Khan, A. H., & Karuppayil, S. M. (2012). Fungal pollution of indoor environments and its
management. Saudi journal of biological sciences, 19(4), 405-426.
https://doi.org/10.1016/j.sjbs.2012.06.002
Khosrowshahi, F. (2017). Building information modelling (BIM) a paradigm shift in
construction. In M. Dastbaz, C. Gorse, & A. Moncaster (Eds.), Building
information modelling, building performance, design and smart construction
326
(pp. 47-64). Springer International Publishing. https://doi.org/10.1007/978-3-
319-50346-2_4
Khoukhi, M. (2018). The combined effect of heat and moisture transfer dependent
thermal conductivity of polystyrene insulation material: Impact on building
energy performance. Energy and Buildings, 169, 228-235.
https://doi.org/10.1016/j.enbuild.2018.03.055
Kieper, G., Caemmerer, W., & Wagner, A. (1974). Ein neues Diagramm zur
feuchtigkeitsschutztechnischen Beurteilung von Baukonstruktionen.
Gesundheits-Ingenieur, 95(8), 214-219.
Kießl, K. (1983). Kapillarer und dampfförmiger Feuchtetransport in mehrschichtigen
Bauteilen: Rechnerische Erfassung und bauphysikalische Anwendung
[Dissertation, Universität-Gesamthochschule Essen].
Kim, C., Park, C., Choi, C., & Jang, H. (2019). Automated conversion of building
information modeling (BIM) geometry data for Window thermal performance
simulation. Advances in Civil Engineering, 2019, 13, Article 7402089.
https://doi.org/10.1155/2019/7402089
Kim, H., Hong, T., & Kim, J. (2019). Automatic ventilation control algorithm considering
the indoor environmental quality factors and occupant ventilation behavior
using a logistic regression model. Building and Environment, 153, 46-59.
https://doi.org/10.1016/j.buildenv.2019.02.032
Kim, K. P. (2019). BIM-enabled sustainable housing refurbishment— LCA case study. In
V. Y. Tam & K. N. Le (Eds.), Sustainable construction technologies : Life-cycle
assessment (pp. 349-394). Elsevier Science & Technology.
https://doi.org/10.1016/B978-0-12-811749-1.00019-5
Kincheloe, J. L., & Steinberg, S. R. (1999). A tentative description of post-formal
thinking: The critical confrontation with cognitive theory. In S. R. Steinberg, J. L.

327
Kincheloe, & P. H. Hinchey (Eds.), The post-formal reader: Cognition and
education (pp. 55-90). Falmer Press.
Kiser, B. (2016). Circular economy: Getting the circulation going. Nature, 531, 443.
https://doi.org/10.1038/531443a
Kleemann, F., Lederer, J., Rechberger, H., & Fellner, J. (2017). GIS-based analysis of
vienna's material stock in buildings. Journal of Industrial Ecology, 21(2), 368-
380. https://doi.org/10.1111/jiec.12446
Knarud, J. I., & Geving, S. (2017). Comparative study of hygrothermal simulations of a
masonry wall. Energy Procedia, 132, 771-776.
https://doi.org/10.1016/j.egypro.2017.10.027
Knox, A., & Star, L. (2015). Data on residential weathertightness failures; draft, 16
February 2015 [Document prepared for the Ministry of Business, Innovation
and Employment, New Zealand]. https://bit.ly/3fwsZHN
Knudsen, S. M., Møller, E. B., & Gunnarsen, L. (2017). Assessment of exposure risk
from hidden fungal growth by measurements of air change rates in
construction cavities and living areas. Journal of Building Physics, 41(3), 209-
224. https://doi.org/10.1177/1744259117704386
Koch, C., & König, M. (2018). Data modeling. In A. Borrmann, M. König, C. Koch, & J.
Beetz (Eds.), Building information modeling: Technology foundations and
industry practice (pp. 43-62). Springer International Publishing.
https://doi.org/10.1007/978-3-319-92862-3_3
Kölsch, P., Zirkelbach, D., Nusser, B., Wagner, R., Zegowitz, A., & Künzel, H. (2016).
Airflow through lightweight wall assemblies - influence of size and location of
leakages. In Thermal Performance of the Exterior Envelopes of Whole Buildings
XIII International Conference. Proceedings of a conference held Clearwater
Beach, Florida, USA, December 4-8, 2016 (pp. 459-484). American Society of
328
Heating, Refrigerating, and Air Conditioning Engineers (ASHRAE).
http://publica.fraunhofer.de/documents/N-442445.html
Korecký, T., Keppert, M., Maděra, J., & Černý, R. (2015). Water transport parameters of
autoclaved aerated concrete: Experimental assessment of different modeling
approaches. Journal of Building Physics, 39(2), 170-188.
https://doi.org/10.1177/1744259114535727
Korjenic, A., Zach, J., & Hroudová, J. (2016). The use of insulating materials based on
natural fibers in combination with plant facades in building constructions.
Energy and Buildings, 116, 45-58.
https://doi.org/10.1016/j.enbuild.2015.12.037
Koro-Ljungberg, M., & Douglas, E. P. (2008). State of qualitative research in
engineering education: Meta-analysis of JEE articles, 2005–2006. Journal of
Engineering Education, 97(2), 163-175. https://doi.org/10.1002/j.2168-
9830.2008.tb00965.x
Kosiński, P., Brzyski, P., & Duliasz, B. (2018). Moisture and wetting properties of
thermal insulation materials based on hemp fiber, cellulose and mineral wool in
a loose state. Journal of Natural Fibers, 1-15.
https://doi.org/10.1080/15440478.2018.1477086
Koskela, L. (1992). Application of the new production philosophy to construction. CIFE
technical report (Vol. 72). Stanford University.
Koskela, L. (2020). Theory of Lean construction. In P. Tzortzopoulos, M. Kagioglou, & L.
Koskela (Eds.), Lean construction : Core concepts and new frontiers (pp. 3 - 13).
Routledge.
Kovacic, I., & Zoller, V. (2015). Building life cycle optimization tools for early design
phases. Energy, 92(3), 409-419. https://doi.org/10.1016/j.energy.2015.03.027
329
Kovács, R., & Ván, P. (2015). Generalized heat conduction in heat pulse experiments.
International Journal of Heat and Mass Transfer, 83, 613-620.
https://doi.org/10.1016/j.ijheatmasstransfer.2014.12.045
Kreiger, B. K., & Srubar, W. V. (2019). Moisture buffering in buildings: A review of
experimental and numerical methods. Energy and Buildings, 109394.
https://doi.org/10.1016/j.enbuild.2019.109394
Krejcirikova, B., Rode, C., & Peuhkuri, R. (2018). Determination of hygrothermal
properties of cementitious mortar: The effect of partial replacement of cement
by incinerated sewage sludge ash. Journal of Building Physics, 42(6), 771-787.
https://doi.org/10.1177/1744259118791202
Krischer, O., & Kröll, K. (1963). Trocknungstechnik. I. Band: Krischer, o.: Die
wissenschaftlichen Grundlagen der Trocknungstechnik. (2 ed.). Springer.
https://doi.org/10.1007/978-3-662-26011-1
Kristensen, E. K. (2011). Systemic barriers to a future transformation of the building
industry from a buyer controlled to a seller driven industry: An analysis of key
systemic variables in the building industry, such as 'procurement model', 'buyer
perception', 'production mode' and 'leadership and management', principally in
a Danish development context and seen from the perspective of the architect
[PhD thesis, Robert Gordon University].
Krone, U., Ascione, F., Bianco, N., Tschirner, T., & Böttcher, O. (2015). Prescriptive- and
performance-based approaches of the present and previous german DIN 4108-
2. Hourly energy simulation for comparing the effectiveness of the methods.
Energy Procedia, 75, 1315-1324. https://doi.org/10.1016/j.egypro.2015.07.197
Kronvall, J. (1980). Air flows in building components. Division of Building Technology,
Lund Institute of Technology.
330
Krueger, N., Hofbauer, W., Krus, M., Fitz, C., Mayer, F., Melzer, A., & Breuer, K. (2013).
Effectiveness and durability of biocides in building coatings: Biological aspects.
In V. P. de Freitas & J. M. P. Q. Delgado (Eds.), Hygrothermal behavior, building
pathology and durability (Vol. 1, pp. 45-60). Springer.
https://doi.org/10.1007/978-3-642-31158-1_4
Krus, M. (1996). Moisture transport and storage coefficients of porous mineral building
materials: Theoretical principles and new test methods. Fraunhofer IRB Verlag.
https://bit.ly/35RPYZd
Krus, M., Fitz, C., & Sedlbauer, K. (2013). Reducing the risk of microbial growth on
insulated walls by improving the properties of the surface materials. In V. P. de
Freitas & J. M. P. Q. Delgado (Eds.), Hygrothermal behavior, building pathology
and durability (Vol. 1, pp. 1-22). Springer. https://doi.org/10.1007/978-3-642-
31158-1
Krus, M., Rösler, D., & Holm, A. (2011). Calculation of the primary energy consumption
of a supply and exhaust ventilation system with heat recovery in comparison to
a demand-based (moisture-controlled) exhaust ventilation. In X. Zhang (Ed.),
ISHVAC 2011, 7th International Symposium on Heating, Ventilating and Air
Conditioning. Proceedings (pp. 818-823).
http://publica.fraunhofer.de/dokumente/N-237836.html
Krus, M., & Sedlbauer, K. (2011). Innendämmung und Schimmelpilzproblematik
[Interior insulation and mould problem]. In J. Grunewald (Ed.), 1.
Internationaler Innendämmkongress 2011: Tagungsunterlagen (pp. 53-64).
http://publica.fraunhofer.de/documents/N-195934.html
Krus, M., Sedlbauer, K., Fitz, C., & Rösler, D. (2009). Schimmel, Pilze, Algen und co. Tl. 1,
2, 3, mikrobieller Bewuchs durch Energiesparmaßnahmen? Sanitär- und
Heizungstechnik, 74 (9, 10, 11), 60-63, 71-73, 44-47. https://bit.ly/2AdzWgI

331
Kubilay, A., Zhou, X., Derome, D., & Carmeliet, J. (2019). Moisture modeling and
durability assessment of building envelopes. In J. L. M. Hensen & R. Lamberts
(Eds.), Building performance simulation for design and operation (pp. 270-314).
Routledge.
Kukk, V., Horta, R., Püssa, M., Luciani, G., Kallakas, H., Kalamees, T., & Kers, J. (2017).
Impact of cracks to the hygrothermal properties of CLT water vapour resistance
and air permeability. Energy Procedia, 132, 741-746.
https://doi.org/10.1016/j.egypro.2017.10.019
Kukletova, I., & Chromkova, I. (2019). Proposal of methodology for testing resistance of
building materials against mold infestation. IOP Conference Series: Materials
Science and Engineering, 583, 012029. https://doi.org/10.1088/1757-
899x/583/1/012029
Kumar, P., Martani, C., Morawska, L., Norford, L., Choudhary, R., Bell, M., & Leach, M.
(2016). Indoor air quality and energy management through real-time sensing in
commercial buildings. Energy and Buildings, 111, 145-153.
https://doi.org/10.1016/j.enbuild.2015.11.037
Kumar, S., Mathur, J., Mathur, S., Singh, M. K., & Loftness, V. (2016). An adaptive
approach to define thermal comfort zones on psychrometric chart for naturally
ventilated buildings in composite climate of india. Building and Environment,
109, 135-153. https://doi.org/10.1016/j.buildenv.2016.09.023
Künzel, H. (1995). Simultaneous heat and moisture transport in building components:
One- and two-dimensional calculation using simple parameters. Fraunhofer IRB
Verlag.
Künzel, H. M. (1994). Verfahren zur ein-und zweidimensionalen berechnung des
gekoppelten Wärme-und Feuchtetransports in Bauteilen mit einfachen
kennwerten [Dr.-Ing. dissertation, Universität Stuttgart, Germany].
https://bit.ly/35Y3Rp2
332
Künzel, H. M. (1999). Flexible vapor control solves moisture problems of building
assemblies-smart retarder to replace the conventional PE-film. Journal of
Thermal Envelope and Building Science, 23, 95-102.
Künzel, H. M. (2006). Indoor relative humidity in residential buildings–a necessary
boundary condition to assess the moisture performance of building envelope
systems. Zeitschrift für Wärmeschutz, Kälteschutz, Schallschutz, Brandschutz,
51(56), 31-41. https://bit.ly/2y1PjrW
Künzel, H. M. (2014). Accounting for unintended moisture sources in hygrothermal
building analysis. In J. Arfvidsson, L.-E. Harderup, A. Kumlin, & B. Rosencrantz
(Eds.), NSB 2014 10th Nordic Symposium on Building Physics, 15-19 June 2014,
Lund, Sweden, Full Papers (pp. 947-953). Lund University.
http://www.nsb2014.se/?page_id=1577
Künzel, H. M., & Sedlbauer, K. P. (2015). Neufassung von DIN 4108-3 zur rechnerischen
Feuchteschutzbeurteilung. Bauphysik, 37(2), 132-136.
https://doi.org/10.1002/bapi.201520015
Künzel, H. M., & Zirkelbach, D. (2013). Advances in hygrothermal building component
simulation: Modelling moisture sources likely to occur due to rainwater
leakage. Journal of Building Performance Simulation, 6(5), 346-353.
https://doi.org/10.1080/19401493.2012.694911
Künzel, H. M., Zirkelbach, D., & Schafaczek, B. (2012). Modelling the effect of air
leakage in hygrothermal envelope simulation [Paper presentation]. The third
Building Enclosure Science & Technology Conference, BEST3: High Performance
Buildings - Combining Field Experience with Innovation Atlanta, GA.
https://bit.ly/3cjEvnF

333
Kurth, M. H., Keenan, J. M., Sasani, M., & Linkov, I. (2019). Defining resilience for the
US building industry. Building Research & Information, 47(4), 480-492.
https://doi.org/10.1080/09613218.2018.1452489
Kuusipalo, J., & Lahtinen, K. (2005). Influence of temperature and mixing ratio on
water vapor barrier properties of extrusion-coated paper. International Journal
of Polymer Analysis and Characterization, 10(1-2), 71-83.
https://doi.org/10.1080/10236660500346057
Kwan, K. M., & Tsang, E. W. (2001). Realism and constructivism in strategy research: A
critical realist response to mir and watson. Strategic Management Journal,
22(12), 1163-1168. https://doi.org/10.1002/smj.199
Labat, M., Magniont, C., Oudhof, N., & Aubert, J.-E. (2016). From the experimental
characterization of the hygrothermal properties of straw-clay mixtures to the
numerical assessment of their buffering potential. Building and Environment,
97, 69-81. https://doi.org/10.1016/j.buildenv.2015.12.004
Labat, M., Woloszyn, M., Garnier, G., & Roux, J. J. (2015). Dynamic coupling between
vapour and heat transfer in wall assemblies: Analysis of measurements
achieved under real climate. Building and Environment, 87, 129-141.
https://doi.org/10.1016/j.buildenv.2015.01.022
Lacasse, M. A., Saber, H. H., Maref, W., Ganapathy, G., Plescia, S., & Parekh, A. (2016).
Field evaluation of thermal and moisture response of highly insulated wood-
frame walls [Paper presentation]. Buildings XIII: Thermal Performance of
Exterior Envelopes of Whole Buildings, Clearwater, Florida, USA.
https://bit.ly/2Ad3GKF
Lai, H., & Deng, X. (2018). Interoperability analysis of IFC-based data exchange
between heterogeneous BIM software. Journal of Civil Engineering and
Management, 24(7), 537-555. https://doi.org/10.3846/jcem.2018.6132

334
Lakatos, A. (2014). Analysis of the type of the sorption isotherm curves of different
materials. In International Conference on Machine Learning, Electrical and
Mechanical Engineering (ICMLEME'2014) Jan. 8-9, 2014 Dubai (UAE) (pp. 111-
114). https://doi.org/10.15242/IIE.E1014
Lakoff, G. (1987). Women, fire, and dangerous things: What categorization reveals
about the mind. The University of Chicago Press.
Lan, L., Wood, K. L., & Yuen, C. (2019). A holistic design approach for residential net-
zero energy buildings: A case study in singapore. Sustainable Cities and Society,
50, 101672. https://doi.org/10.1016/j.scs.2019.101672
Landrum, N. E., & Gardner, C. L. (2005). Using integral theory to effect strategic
change. Journal of Organizational Change Management, 18(3), 247-258.
https://doi.org/10.1108/09534810510599407
Lane, E. (2019). Are you sick from mould? Positive Health(256).
Latif, E., Ciupala, M. A., Tucker, S., Wijeyesekera, D. C., & Newport, D. J. (2015).
Hygrothermal performance of wood-hemp insulation in timber frame wall
panels with and without a vapour barrier. Building and Environment, 92, 122-
134. https://doi.org/10.1016/j.buildenv.2015.04.025
Latif, E., Lawrence, M., Shea, A., & Walker, P. (2016). In situ assessment of the fabric
and energy performance of five conventional and non-conventional wall
systems using comparative coheating tests. Building and Environment, 109, 68-
81. https://doi.org/10.1016/j.buildenv.2016.09.017
Latif, E., Tucker, S., Ciupala, M. A., Wijeyesekera, D. C., & Newport, D. (2014). Hygric
properties of hemp bio-insulations with differing compositions. Construction
and Building Materials, 66, 702-711.
https://doi.org/10.1016/j.conbuildmat.2014.06.021
335
Latif, E., Tucker, S., Ciupala, M. A., Wijeyesekera, D. C., Newport, D. J., & Pruteanu, M.
(2016). Quasi steady state and dynamic hygrothermal performance of fibrous
hemp and stone wool insulations: Two innovative laboratory based
investigations. Building and Environment, 95, 391-404.
https://doi.org/10.1016/j.buildenv.2015.10.006
Lawrence, T., Darwich, A. K., & Means, J. K. (2018). ASHRAE greenguide : Design,
construction, and operation of sustainable buildings (5. ed.). ASHRAE.
Leardini, P., Rosemeier, K., & Ong, A. (2012). Ventilation’s pivotal role for indoor air
quality of houses in New Zealand. In 10th International Conference on Healthy
Buildings 2012, Proceedings, 8-12 July 2012 (pp. 1120-1125). International
Society of Indoor Air Quality and Climate ( ISIAQ ). https://bit.ly/2WNEWjJ
Lee, S.-I., Bae, J.-S., & Cho, Y. S. (2012). Efficiency analysis of set-based design with
structural building information modeling (s-BIM) on high-rise building
structures. Automation in Construction, 23, 20-32.
https://doi.org/10.1016/j.autcon.2011.12.008
Leivo, V., Kiviste, M., Aaltonen, A., Prasauskas, T., Martuzevicius, D., & Haverinen-
Shaughnessy, U. (2018). Analysis of hygrothermal parameters in Finnish and
Lithuanian multi-family buildings before and after energy retrofits. Journal of
Building Physics, 42(4), 441-457. https://doi.org/10.1177/1744259118767236
Lepczyk, C. A., Aronson, M. F. J., Evans, K. L., Goddard, M. A., Lerman, S. B., & MacIvor,
J. S. (2017). Biodiversity in the city: Fundamental questions for understanding
the ecology of urban green spaces for biodiversity conservation. Bioscience,
67(9), 799-807. https://doi.org/10.1093/biosci/bix079
Leroux, G., Mendes, N., Stephan, L., Le Pierrès, N., & Wurtz, E. (2019). Innovative low-
energy evaporative cooling system for buildings: Study of the porous
evaporator wall. Journal of Building Performance Simulation, 12(2), 208-223.
https://doi.org/10.1080/19401493.2018.1501094

336
Level. (2017). Passive design, controlling indoor air quality, humidity and condensation.
BRANZ, New Zealand. Retrieved November 25, 2019 from
http://www.level.org.nz/passive-design/controlling-indoor-air-
quality/humidity-and-condensation/
Levesque, A., Pietzcker, R. C., Baumstark, L., De Stercke, S., Grübler, A., & Luderer, G.
(2018). How much energy will buildings consume in 2100? A global perspective
within a scenario framework. Energy, 148, 514-527.
https://doi.org/10.1016/j.energy.2018.01.139
Lexico powered by Oxford. (n.d.-a). Epistemology. In Lexico.com dictionary. Retrieved
April 11, 2020, from https://www.lexico.com/en/definition/epistemology
Lexico powered by Oxford. (n.d.-b). Experiment. In Lexico.com dictionary. Retrieved
June 11, 2019, from https://www.lexico.com/en/definition/experiment
Lexico powered by Oxford. (n.d.-c). Hypothesis. In Lexico.com dictionary. Retrieved
April 12, 2020, from https://www.lexico.com/en/definition/hypothesis
Lexico powered by Oxford. (n.d.-d). Integral. In Lexico.com dictionary. Retrieved May
09, 2020, from https://www.lexico.com/en/definition/integral
Lexico powered by Oxford. (n.d.-e). Ontology. In Lexico.com dictionary. Retrieved April
11, 2020, from https://www.lexico.com/en/definition/ontology
Lexico powered by Oxford. (n.d.-f). Relay. In Lexico.com dictionary. Retrieved June 12,
2019, from https://www.lexico.com/definition/relay
Lexico powered by Oxford. (n.d.-g). Research. In Lexico.com dictionary. Retrieved June
12, 2019, from https://www.lexico.com/en/definition/research
337
Li, G., Henry, L., Bihang, F., Xihong, C., & Jin, C. (2013). Impact of root water content on
root biomass estimation using ground penetrating radar: Evidence from
forward simulations and field controlled experiments. Plant and Soil, 371(1/2),
503-520. https://doi.org/10.1007/s11104-013-1710-4
Li, X., Liu, Y., Wilkinson, S., & Liu, T. (2019). Driving forces influencing the uptake of
sustainable housing in New Zealand. Engineering, Construction and
Architectural Management, 26(1), 46-65. https://doi.org/10.1108/ECAM-07-
2017-0111
Li, Y. L., Han, M. Y., Liu, S. Y., & Chen, G. Q. (2019). Energy consumption and
greenhouse gas emissions by buildings: A multi-scale perspective. Building and
Environment, 151, 240-250. https://doi.org/10.1016/j.buildenv.2018.11.003
Liang, W., Lv, M., & Yang, X. (2019). Inhibitory effect of mould growth on formaldehyde
emissions from medium-density fibreboards: Evidence from field observations
in three experimental houses. Indoor & Built Environment, 28(7), 999-1010.
https://doi.org/10.1177/1420326X18812929
Lichtfouse, E., Schwarzbauer, J., & Robert, D. (Eds.). (2015). Pollutants in buildings,
water and living organisms (Vol. 7). Springer.
Lie, S. K., Vestøl, G. I., Høibø, O., & Gobakken, L. R. (2019). Surface mould growth on
wooden claddings – effects of transient wetting, relative humidity, temperature
and material properties. Wood Material Science & Engineering, 14(3), 129-141.
https://doi.org/10.1080/17480272.2018.1424239
Lin, Y.-H., Liu, Y.-S., Gao, G., Han, X.-G., Lai, C.-Y., & Gu, M. (2013). The IFC-based path
planning for 3D indoor spaces. Advanced Engineering Informatics, 27(2), 189-
205. https://doi.org/10.1016/j.aei.2012.10.001

338
Liu, F., Jia, B., Chen, B., & Geng, W. (2017). Moisture transfer in building envelope and
influence on heat transfer. Procedia Engineering, 205, 3654-3661.
https://doi.org/10.1016/j.proeng.2017.10.229
Liu, J., Yang, X., Jiang, Q., Qiu, J., & Liu, Y. (2019). Occupants’ thermal comfort and
perceived air quality in natural ventilated classrooms during cold days. Building
and Environment, 158, 73-82. https://doi.org/10.1016/j.buildenv.2019.05.011
Liu, W., Wong, P. K. J., & Xu, Y. (2019). Hybrid spintronic materials: Growth, structure
and properties. Progress in Materials Science, 99, 27-105.
https://doi.org/10.1016/j.pmatsci.2018.08.001
Logue, J. M., Turner, W. J. N., Walker, I. S., & Singer, B. C. (2016). A simplified model for
estimating population-scale energy impacts of building envelope air tightening
and mechanical ventilation retrofits. Journal of Building Performance
Simulation, 9(1), 1-16. https://doi.org/10.1080/19401493.2014.993710
Lojanica, V., Colic-Damjanovic, V., & Jankovic, N. (2018). Housing of the future: Housing
design of the fourth industrial revolution [Paper presentation]. 5th International
Symposium on Environment-Friendly Energies and Applications (EFEA), Rome,
Italy. https://doi.org/10.1109/EFEA.2018.8617094
Loncour, X., & Heijmans, N. (2018). (CT3) certification, control system and quality -
2018. In Implementing the Energy Performance of Buildings Directive. The
Concerted Action Energy Performance of Buildings Directive (CA EPBD).
https://epbd-ca.eu/archives/2764
Longo, S., Beccali, M., Cellura, M., & Guarino, F. (2020). Energy and environmental life-
cycle impacts of solar-assisted systems: The application of the tool “elisa”.
Renewable Energy, 145, 29-40. https://doi.org/10.1016/j.renene.2019.06.021
Looman, R. (2017). Climate-responsive design: A framework for an energy concept
design-decision support tool for architects using principles of climate-responsive

339
design [PhD thesis, Delft University of Technology, Faculty of Architecture and
the Built Environment, Department of Architectural Engineering + Technology].
López, O., Torres, I., Guimarães, A. S., Delgado, J. M. P. Q., & de Freitas, V. P. (2017).
Inter-laboratory variability results of porous building materials hygrothermal
properties. Construction and Building Materials, 156, 412-423.
https://doi.org/10.1016/j.conbuildmat.2017.08.184
Lopez, R., & Love, P. E. (2012). Design error costs in construction projects. Journal of
Construction Engineering & Management, 138(5), 585-593.
https://doi.org/10.1061/(ASCE)CO.1943-7862.0000454
Lu, A.-D. (2013). Harnessing social innovation through inclusive thinking. Japan Social
Innovation Journal, 3(1), 56-61. https://doi.org/10.12668/jsij.3.56
Lu, W., Fung, A., Peng, Y., Liang, C., & Rowlinson, S. (2014). Cost-benefit analysis of
building information modeling implementation in building projects through
demystification of time-effort distribution curves. Building and Environment,
82, 317-327. https://doi.org/10.1016/j.buildenv.2014.08.030
Lu, Y., Wu, Z., Chang, R., & Li, Y. (2017). Building information modeling (BIM) for green
buildings: A critical review and future directions. Automation in Construction,
83, 134-148. https://doi.org/10.1016/j.autcon.2017.08.024
Luikov, A. V. (1964). Heat and mass transfer in capillary-porous bodies. In T. F. Irvine &
J. P. Hartnett (Eds.), Advances in heat transfer (Vol. 1, pp. 123-184). Elsevier.
https://doi.org/10.1016/S0065-2717(08)70098-4
Ma, G., & Wu, Z. (2020). BIM-based building fire emergency management: Combining
building users' behavior decisions. Automation in Construction, 109, 102975.
https://doi.org/10.1016/j.autcon.2019.102975
340
Maas, A., Kempkes, C., & Schlitzberger, S. (2013). Summer heat protection - revised
version of DIN 4108-2. Bauphysik, 35(3), 155-161.
https://doi.org/10.1002/bapi.201310065
Maas, J. (Ed.). (1992). Annex 20: Air flow patterns within buildings, subtask 2: Air flows
between zones; air flow through large openings in buildings [Technical report].
International Energy Agency. https://bit.ly/3bmexyR.
Mahmoud, S., & Zayed, T. (2017). An integrated sustainability assessment tool
framework, paper no. ICESDP 157. In Proceedings of the 2nd World Congress on
Civil, Structural, and Environmental Engineering (CSEE’17), Barcelona, Spain,
April 2–4, 2017. https://doi.org/10.11159/icesdp17.157
Mahmoud, S., Zayed, T., & Fahmy, M. (2019). Development of sustainability
assessment tool for existing buildings. Sustainable Cities and Society, 44, 99-
119. https://doi.org/10.1016/j.scs.2018.09.024
Mahoney, M. J. (2004). What is constructivism and why is it growing? [review of the
book studies in meaning: Exploring constructivist psychology. Edited by j. D.
Raskin & s. K. Bridges]. . PsycCRITIQUES, 49(3), 360-363.
https://doi.org/10.1037/004362
Maile, T., Fischer, M., & Bazjanac, V. (2007). Building energy performance simulation
tools - a life-cycle and interoperable perspective (Vol. 107) [Working Paper].
Stanford University Center for Integrated Facility Engineering (CIFE).
Mao, S., Duan, Z., Hu, J., Zhang, Z., & Shi, L. (2011). Extension of the IAPWS-95
formulation and an improved calculation approach for saturated properties.
Physics of the Earth and Planetary Interiors, 185(1), 53-60.
https://doi.org/10.1016/j.pepi.2011.01.003
Māori Dictionary. (n.d.). Rangatira. In Te Aka Online Māori Dictionary. Retrieved April
13, 2020, from
341
https://maoridictionary.co.nz/search?idiom=&phrase=&proverb=&loan=&histL
oanWords=&keywords=rangatira
Marincioni, V., Altamirano, H., & Ridley, I. (2014). Performance of internal wall
insulation systems-experimental test for the validation of a hygrothermal
simulation tool. In J. Arfvidsson (Ed.), 10th Nordic Symposium on Building
Physics: Full papers - NSB 2014 (pp. 119-126). Lund University.
https://www.nsb2014.se/?page_id=1577
Markopoulos, A., Strachan, P., Kelly, N., & Baker, P. (2013). Towards whole building
moisture modelling of the impacts of short duration moisture release. In E.
Wurtz (Ed.), Proceedings of BS2013: 13th Conference of International Building
Performance Simulation Association, Chambéry, France, August 26-28 (Vol. 13,
pp. 2907-2914). IBPSA. http://www.ibpsa.org/international-conferences/
Marshall, P. (2016). A complex integral realist perspective: Towards a new axial vision.
Routledge.
Maskell, D., da Silva, C. F., Mower, K., Cheta, R., Dengel, A., Ball, R., Ansell, M., Walker,
P., & Shea, A. (2015). Properties of bio-based insulation materials and their
potential impact on indoor air quality [Paper presentation]. First International
Conference on Bio-based Building Materials, Clermont-Ferrand, France.
https://bit.ly/2zrumqo
Maskell, D., Thomson, A., Walker, P., & Lemke, M. (2018). Determination of optimal
plaster thickness for moisture buffering of indoor air. Building and
Environment, 130, 143-150. https://doi.org/10.1016/j.buildenv.2017.11.045
Mathy, F., & Chekaf, M. (2018). Experiments and modeling in cognitive science:
MATLAB, SPSS, Excel and E-prime. ISTE Press.
Maxwell, N. (2018). We need progress in ideas about how to achieve progress.
Metascience, 27(2), 347-350. https://doi.org/10.1007/s11016-018-0312-4
342
Mayo, E. (2014). The social problems of an industrial civilisation. Routledge. (1949)
Mayouf, M., Gerges, M., & Cox, S. (2019). 5D BIM: An investigation into the integration
of quantity surveyors within the BIM process. Journal of Engineering, Design &
Technology, 17(3), 537. https://doi.org/10.1108/jedt-05-2018-0080
Mazhoud, B., Collet, F., Pretot, S., & Chamoin, J. (2016). Hygric and thermal properties
of hemp-lime plasters. Building and Environment, 96, 206-216.
https://doi.org/10.1016/j.buildenv.2015.11.013
McClung, R., Ge, H., Straube, J., & Wang, J. (2014). Hygrothermal performance of cross-
laminated timber wall assemblies with built-in moisture: Field measurements
and simulations. Building and Environment, 71, 95-110.
https://doi.org/10.1016/j.buildenv.2013.09.008
McGregor, F., Heath, A., Shea, A., & Lawrence, M. (2014). The moisture buffering
capacity of unfired clay masonry. Building and Environment, 82, 599-607.
https://doi.org/10.1016/j.buildenv.2014.09.027
McLeod, R. S., & Hopfe, C. J. (2013). Hygrothermal implications of low and zero energy
standards for building envelope performance in the UK. Journal of Building
Performance Simulation, 6(5), 367-384.
https://doi.org/10.1080/19401493.2012.762809
McNeil, S. (2018). Airtightness trends (part 2). Build, 167, 74-75. https://bit.ly/2LtD7TD
McNeil, S., Plagmann, M., McDowall, P., & Bassett, M. R. (2015). The role of ventilation
in managing moisture inside of New Zealand homes. Study report SR341.
Judgeford, New Zealand: BRANZ Ltd.
343
Meacham, B. J. (2016). Sustainability and resiliency objectives in performance building
regulations [Article]. Building Research & Information, 44(5/6), 474-489.
https://doi.org/10.1080/09613218.2016.1142330
Medjelekh, D., Ulmet, L., Abdou, S., & Dubois, F. (2016). A field study of thermal and
hygric inertia and its effects on indoor thermal comfort: Characterization of
travertine stone envelope. Building and Environment, 106, 57-77.
https://doi.org/10.1016/j.buildenv.2016.06.010
Melton, P., & Yost, P. (2014). Go with the flows: The promise and peril of hygrothermal
modeling. Environmental Building News, 23(4). www.BuildingGreen.com
Mendell, M., Lei-Gomez, Q., Mirer, A., Seppänen, O., & Brunner, G. (2008). Risk factors
in heating, ventilating, and air-conditioning systems for occupant symptoms in
US office buildings: The US EPA BASE study. Indoor Air, 18(4), 301-316.
https://doi.org/10.1111/j.1600-0668.2008.00531.x
Mendell, M. J., & Heath, G. A. (2005). Do indoor pollutants and thermal conditions in
schools influence student performance? A critical review of the literature.
Indoor Air, 15(1), 27-52. https://doi.org/10.1111/j.1600-0668.2004.00320.x
Mendell, M. J., Macher, J. M., & Kumagai, K. (2018). Measured moisture in buildings
and adverse health effects: A review. Indoor Air, 28(4), 488-499.
https://doi.org/10.1111/ina.12464
Mendes, E., & Mendes, N. (2019). An instructional design for building energy
simulation e-learning: An interdisciplinary approach. Journal of Building
Performance Simulation, 12(3), 326-342.
https://doi.org/10.1080/19401493.2018.1560500
Mendes, N., Chhay, M., Berger, J., & Dutykh, D. (2016). Numerical methods for
diffusion phenomena in building physics: A practical introduction. PUCPRESS.
344
Mendes, N., Chhay, M., Berger, J., & Dutykh, D. (2019). Numerical methods for
diffusion phenomena in building physics (2 ed.). Springer International
Publishing. https://doi.org/10.1007/978-3-030-31574-0
Mendes, N., & Philippi, P. C. (2005). A method for predicting heat and moisture
transfer through multilayered walls based on temperature and moisture
content gradients. International Journal of Heat and Mass Transfer, 48(1), 37-
51. https://doi.org/10.1016/j.ijheatmasstransfer.2004.08.011
Mensah-Attipoe, J., Reponen, T., Salmela, A., Veijalainen, A. M., & Pasanen, P. (2015).
Susceptibility of green and conventional building materials to microbial growth.
Indoor Air, 25(3), 273-284. https://doi.org/10.1111/ina.12140
Merriam, S. B. (2002). Qualitative research in practice: Examples for discussion and
analysis (1 ed.). Jossey-Bass.
Miettinen, R., & Paavola, S. (2014). Beyond the BIM utopia: Approaches to the
development and implementation of building information modeling.
Automation in Construction, 43, 84-91.
https://doi.org/10.1016/j.autcon.2014.03.009
Migilinskas, D., Popov, V., Juocevicius, V., & Ustinovichius, L. (2013). The benefits,
obstacles and problems of practical bim implementation. Procedia Engineering,
57, 767-774. https://doi.org/10.1016/j.proeng.2013.04.097
Mijakowski, M., & Sowa, J. (2017). An attempt to improve indoor environment by
installing humidity-sensitive air inlets in a naturally ventilated kindergarten
building. Building and Environment, 111, 180-191.
https://doi.org/10.1016/j.buildenv.2016.11.013
Milion, R. N., Alves, T., & Paliari, J. C. (2017). Impacts of residential construction
defects on customer satisfaction. International Journal of Building Pathology
and Adaptation, 35(3), 218-232. https://doi.org/10.1108/IJBPA-12-2016-0033

345
Ministry for the Environment. (2002). The ambient air quality guidelines, 2002 update
(Vol. ME 438) [Air Quality Report No 32]. Ministry for the Environment, New
Zealand.
Ministry for the Environment & Stats NZ. (2018). Our air 2018, data to 2017 (Vol. ME
1384) [New Zealand’s Environmental Reporting Series].
Mir, R., & Watson, A. (2000). Strategic management and the philosophy of science: The
case for a constructivist methodology. Strategic Management Journal, 21(9),
941-953. https://doi.org/10.1002/1097-0266(200009)21:9<941::AID-
SMJ141>3.0.CO;2-D
Mitchell, J. C. (1983). Case and situation analysis 1. The sociological review, 31(2), 187-
211. https://doi.org/10.1111/j.1467-954X.1983.tb00387.x
Mitterer, C., Künzel, H. M., Herkel, S., & Holm, A. (2012). Optimizing energy efficiency
and occupant comfort with climate specific design of the building. Frontiers of
Architectural Research, 1(3), 229-235.
https://doi.org/10.1016/j.foar.2012.06.002
Mizsei, J., & Lappalainen, J. (2019). Microelectronics, nanoelectronics: Step behind the
red brick wall using the thermal domain. Materials Today: Proceedings, 7, 888-
893. https://doi.org/10.1016/j.matpr.2018.12.089
Molina, C., Pickering, C. A. C., & Valbjorn, O. (1989). Sick building syndrom, a practical
guide [Report]. Commission of the European Communities.
https://bit.ly/3cyv4RK
Moon, H. J., Ryu, S. H., & Kim, J. T. (2014). The effect of moisture transportation on
energy efficiency and iaq in residential buildings. Energy and Buildings, 75, 439-
446. https://doi.org/10.1016/j.enbuild.2014.02.039
346
Moore, G. F., Evans, R. E., Hawkins, J., Littlecott, H., Melendez-Torres, G. J., Bonell, C.,
& Murphy, S. (2019). From complex social interventions to interventions in
complex social systems: Future directions and unresolved questions for
intervention development and evaluation. Evaluation, 25(1), 23-45.
https://doi.org/10.1177/1356389018803219
Moraga, G., Huysveld, S., Mathieux, F., Blengini, G. A., Alaerts, L., Van Acker, K., de
Meester, S., & Dewulf, J. (2019). Circular economy indicators: What do they
measure? Resources, Conservation and Recycling, 146, 452-461.
https://doi.org/10.1016/j.resconrec.2019.03.045
Moran, D. (2000). Introduction to phenomenology (1 ed.). Routledge.
Morgan, A. (2006). Developing geographical wisdom: Postformal thinking about, and
relating to, the world. International Research in Geographical and
Environmental Education, 15(4), 336-352. https://doi.org/10.2167/irg199.0
Morgan, M. S. (2002). Model experiments and models in experiments. In L. Magnani &
N. J. Nersessian (Eds.), Model-based reasoning: Science, technology, values (pp.
41-58). Kluewer Academic/Plenum Publishers.
Morgan, M. S., & Morrison, M. (1999). Models as mediators: Perspectives on natural
and social science (Vol. 52). Cambridge University Press.
Morris, A. S., & Langari, R. (2016). Measurement and instrumentation : Theory and
application (2 ed.). Elsevier Science & Technology.
Morse, J. M. (1991). Approaches to qualitative-quantitative methodological
triangulation. Nursing Research, 40(2), 120-123.
Motawa, I., & Carter, K. (2013). Sustainable BIM-based evaluation of buildings.
Procedia - Social and Behavioral Sciences, 74, 419-428.
https://doi.org/10.1016/j.sbspro.2013.03.015

347
Mudarri, D., & Fisk, W. J. (2007). Public health and economic impact of dampness and
mold. Indoor Air, 17(3), 226-235. https://doi.org/10.1111/j.1600-
0668.2007.00474.x
Mudarri, D. H. (2010). Building codes and indoor air quality, report prepared for U.S.
Environmental protection agency. Cadmus Group. https://bit.ly/2Lj2W8R
Mugnier, D. (2019). Task 53 – new generation solar cooling & heating systems (PV or
solar thermal driven systems). Task 53 - Highlights 2018. https://bit.ly/2xRIXeB
Mumford, P. J. (2011). Enhancing performance-based regulation: Lessons from New
Zealand's building control system [PhD Thesis]. Victoria University of
Wellington, New Zealand.
Mundt-Petersen, S. O., & Harderup, L.-E. (2015). Predicting hygrothermal performance
in cold roofs using a 1d transient heat and moisture calculation tool. Building
and Environment, 90, 215-231. https://doi.org/10.1016/j.buildenv.2015.04.004
Murphy, M. (2011). An end to ordinary history: Comments on a philosophical novel.
Open Road Media.
Nag, P. K. (2019). Bioclimatic approach: Thermal environment. In Office buildings:
Health, safety and environment (pp. 243-278). Springer.
https://doi.org/10.1007/978-981-13-2577-9_9
Natephra, W., Yabuki, N., & Fukuda, T. (2018). Optimizing the evaluation of building
envelope design for thermal performance using a BIM-based overall thermal
transfer value calculation. Building and Environment, 136, 128-145.
https://doi.org/10.1016/j.buildenv.2018.03.032
348
National Institute of Building Sciences. (2015). National BIM standard – United States®,
version 3 (NBIMS-US™ V3). National Institute of Building Sciences
buildingSMART alliance®. https://www.nationalbimstandard.org/nbims-us
National Institute of Water and Atmospheric Research. (n.d.). Climate data and
activities. NIWA, New Zealand. Retrieved November 25, 2019 from
https://niwa.co.nz
NATSPEC and Masterspec. (2018). The open BIM object standard. Construction
Information Systems Limited, Sydney, Australia (ABN 20 117 574 606);
Construction Information Ltd, Auckland, New Zealand. https://bim.natspec.org/
Nawari, N. O. (2012). BIM standard in off-site construction. Journal of Architectural
Engineering, 18(2), 107-113. https://doi.org/10.1061/(ASCE)AE.1943-
5568.0000056
Nazaroff, W. W. (2013). Four principles for achieving good indoor air quality. Indoor
Air, 23(5), 353-356. https://doi.org/10.1111/ina.12062
NBS. (2019). National BIM report 2019 (Vol. 9) [Report]. Royal Institute of British
Architects. https://bit.ly/3baLyxO
Negendahl, K. (2015). Building performance simulation in the early design stage: An
introduction to integrated dynamic models. Automation in Construction, 54, 39-
53. https://doi.org/10.1016/j.autcon.2015.03.002
Neiß, J. (1982). Numerische simulation des Wärme-und Feuchtetransports und der
Eisbildung in Böden. VDI-Verlag.
Neiß, J., & Winter, E. R. F. (1982). Berechnung der Wärmeleitfähigkeit von Böden
oberhalb und unterhalb des Gefrierpunktes. Chemie Ingenieur Technik, 54(2),
176-177. https://doi.org/10.1002/cite.330540219
349
Ness, D., Swift, J., Ranasinghe, D. C., Xing, K., & Soebarto, V. (2015). Smart steel: New
paradigms for the reuse of steel enabled by digital tracking and modelling.
Journal of Cleaner Production, 98, 292-303.
https://doi.org/10.1016/j.jclepro.2014.08.055
Nevalainen, A., Täubel, M., & Hyvärinen, A. (2015). Indoor fungi: Companions and
contaminants. Indoor Air, 25(2), 125-156. https://doi.org/10.1111/ina.12182
New Zealand Business Council for Sustainable Development. (2003). Better performing
homes for New Zealanders: Making it happen https://www.sbc.org.nz/
New Zealand Government. (2007). Regulatory impact statement: Towards a
sustainable New Zealand – measures to minimise solid waste.
http://www.mfe.govt.nz/more/cabinet-papers-and-related-material-
search/regulatory-impact-statements/ris-towards-sustainab-0
New Zealand Government. (2017). Resource management (national environmental
standards for air quality) regulations 2004 (SR 2004/309) amendment
regulations 2011 (SR 2011/103). Ministry of the Environment.
http://www.legislation.govt.nz/regulation/public/2004/0309/latest/DLM28683
5.html?search=ta_regulation_R_rc%40rinf%40rnif_an%40bn%40rn_25_a&p=3
New Zealand Government. (2018a). E2/AS 1: Acceptable solution for building code
clause E2 external moisture. https://www.building.govt.nz/building-code-
compliance/e-moisture/e2-external-moisture/
New Zealand Government. (2018b). Weathertightness FAP valuation as at 30 June
2018. https://www.mbie.govt.nz
New Zealand Government. (2019a). Improving waste management: Supporting new
zealand’s transition to a circular economy.
https://www.mfe.govt.nz/more/briefings-cabinet-papers-and-related-material-
search/cabinet-papers/improving-waste-management
350
New Zealand Government. (2019b). Residential tenancies act 1986, reprint as at 29
October 2019. http://www.legislation.govt.nz
New Zealand Government. (2019c). Weathertight homes resolution services act 2006.
http://www.legislation.govt.nz
New Zealand Government. (2019d). Weekly updates for February 2019 to Hon Eugenie
Sage. https://www.mfe.govt.nz/legislation-
search?f[0]=field_section_topic%3A167
New Zealand Government. (2020). Weathertight homes resolution service claims
statistics. Ministry of Business, Innovation & Employment. Retrieved January
26, 2020 from https://www.mbie.govt.nz/building-and-
energy/building/weathertight-homes-resolution-service-claims-statistics/
New Zealand Government. (n.d.). Cabinet papers related to the Ministry for the
environment's areas of responsibility. Ministry of the Environment. Retrieved
July 29, 2019 from https://www.mfe.govt.nz/legislation-
search?f%5B0%5D=field_section_topic%3A172&f%5B1%5D=field_section_topi
c%3A167&f%5B2%5D=field_section_topic%3A189
New Zealand Legislation. (2017). Building regulations 1992 (SR 1992/150): Revoked
(with regulation 3 and schedule 1 continued in force), on 31 march 2005, by
regulation 8(1) of the building (forms) regulations 2004 (SR 2004/385). New
Zealand Government.
http://www.legislation.govt.nz/regulation/public/1992/0150/latest/whole.html
#DLM162576
Newey, L. R. (2019). Well-being as a staged social responsibility process for business
and society. Social Responsibility Journal, 15(1), 75-89.
https://doi.org/10.1108/SRJ-10-2017-0213
351
Nghana, B., & Tariku, F. (2018). Field investigation of moisture buffering potential of
american clay and magnesium oxide board in a mild climate. Journal of
Architectural Engineering, 24(4), Article 04018023.
https://doi.org/10.1061/(ASCE)AE.1943-5568.0000325
Niang, I., Maalouf, C., Moussa, T., Bliard, C., Samin, E., Thomachot-Schneider, C., Lachi,
M., Pron, H., Mai, T. H., & Gaye, S. (2018). Hygrothermal performance of
various typha–clay composite. Journal of Building Physics, 42(3), 316-335.
https://doi.org/10.1177/1744259118759677
Niknam, M., & Karshenas, S. (2015). Sustainable design of buildings using semantic BIM
and semantic web services. Procedia Engineering, 118, 909-917.
https://doi.org/10.1016/j.proeng.2015.08.530
Nilon, C. H., Aronson, M. F. J., Cilliers, S. S., Dobbs, C., Frazee, L. J., Goddard, M. A.,
O’Neill, K. M., Roberts, D., Stander, E. K., Werner, P., Winter, M., & Yocom, K. P.
(2017). Planning for the future of urban biodiversity: A global review of city-
scale initiatives. Bioscience, 67(4), 332-342.
https://doi.org/10.1093/biosci/bix012
Nishida, K. (2019). The principle of the new world order. Geopolítica (s), 10(2), 305-
311. https://doi.org/10.5209/geop.66402 (1944)
Nore, K., Nyrud, A. Q., Kraniotis, D., Skulberg, K. R., Englund, F., & Aurlien, T. (2017).
Moisture buffering, energy potential, and volatile organic compound emissions
of wood exposed to indoor environments. Science and Technology for the Built
Environment, 23(3), 512-521. https://doi.org/10.1080/23744731.2017.1288503
Nuñez-Cacho, P., Corpas-Iglesias, F. A., Górecki, J., & Molina-Moreno, V. (2018). What
gets measured, gets done: Development of a circular economy measurement
scale for building industry. Sustainability, 10(7).
https://doi.org/10.3390/su10072340
352
Oduyemi, O., Okoroh, M. I., & Fajana, O. S. (2017). The application and barriers of BIM
in sustainable building design. Journal of Facilities Management, 15(1), 15-34.
https://doi.org/10.1108/JFM-03-2016-0008
OECD. (2017). OECD environmental performance reviews: New Zealand 2017. OECD
Publishing. https://doi.org/10.1787/9789264268203-en
Oesterreich, T. D., & Teuteberg, F. (2019). Behind the scenes: Understanding the socio-
technical barriers to BIM adoption through the theoretical lens of information
systems research. Technological Forecasting and Social Change, 146, 413-431.
https://doi.org/10.1016/j.techfore.2019.01.003
Oh, G.-H., Joo, S.-J., Jeong, J.-W., & Kim, H.-S. (2019). Effect of plasma treatment on
adhesion strength and moisture absorption characteristics between epoxy
molding compound/silicon chip (emc/chip) interface. Microelectronics
Reliability, 92, 63-72. https://doi.org/10.1016/j.microrel.2018.11.004
Ojanen, T., Kohonen, R., & Kumaran, M. K. (1994). Modeling heat, air, and moisture
transport through building materials and components. In H. R. Trechsel (Ed.),
Moisture control in buildings (pp. 18-34). American Socienty for Testing and
Materials (ASTM).
Ojanen, T., & Viitanen, H. (2016). VTT mold model: From visual findings to mold index
[Paper presentation]. Thermal Performance of the Exterior Envelopes of Whole
Buildings: XIII International Conference, Clearwater Beach, USA.
https://bit.ly/3fuj7yl
Oladokun, M. O., Ali, M., Osman, S. B., & Lin, Z. (2017). Indoor mould growth
prediction using coupled computational fluid dynamics and mould growth
model. Building Simulation, 10(4), 551-562. https://doi.org/10.1007/s12273-
016-0343-y
353
Olawumi, T. O., & Chan, D. W. M. (2019). An empirical survey of the perceived benefits
of executing BIM and sustainability practices in the built environment.
Construction Innovation(3), 321. https://doi.org/10.1108/CI-08-2018-0065
Olgyay, V., Yeang, K., Reynolds, J., Lyndon, D., & Yeang, K. (2015). Design with climate :
Bioclimatic approach to architectural regionalism, new and expanded edition.
Princeton University Press.
Opoku, A. (2019). Biodiversity and the built environment: Implications for the
sustainable development goals (sdgs). Resources, Conservation and Recycling,
141, 1-7. https://doi.org/10.1016/j.resconrec.2018.10.011
Optis, M., Shaw, K., Stephenson, P., & Wild, P. (2012). Mold growth in on-reserve
homes in Canada: The need for research, education, policy, and funding.
Journal of Environmental Health, 74(6), 14-21.
Orlik-Kożdoń, B., & Steidl, T. (2018). Experimental and analytical determination of
water vapour transmission properties of recyclable insulation material.
Construction and Building Materials, 192, 798-807.
https://doi.org/10.1016/j.conbuildmat.2018.10.093
Orton, J. D. (1997). From inductive to iterative grounded theory: Zipping the gap
between process theory and process data. Scandinavian Journal of
Management, 13(4), 419-438. https://doi.org/10.1016/S0956-5221(97)00027-4
Osanyintola, O. F., & Simonson, C. J. (2006). Moisture buffering capacity of hygroscopic
building materials: Experimental facilities and energy impact. Energy and
Buildings, 38(10), 1270-1282. https://doi.org/10.1016/j.enbuild.2006.03.026
Ostermeyer, Y., Nägeli, C., Wallbaum, H., & Heeren, N. (2018). Building inventory and
refurbishment scenario database development for Switzerland. Journal of
Industrial Ecology, 22(4), 629-642. https://doi.org/10.1111/jiec.12616
354
Othman, N. L., Jaafar, M., Harun, W. M. W., & Ibrahim, F. (2015). A case study on
moisture problems and building defects. Procedia - Social and Behavioral
Sciences, 170, 27-36. https://doi.org/10.1016/j.sbspro.2015.01.011
Oti, A. H., & Abanda, H. F. (2020). A review of systems for information modelling in the
built environment. In K. H. Adjallah, B. Birregah, & H. F. Abanda (Eds.), Data-
driven modeling for sustainable engineering. Proceedings of the first
international conference on engineering, applied sciences and system modeling
(ICEASSM), Accra, 2017 (pp. 161-174). Springer International Publishing.
https://doi.org/10.1007/978-3-030-13697-0_12
Ouf, M. M., O'Brien, W., & Gunay, B. (2019). On quantifying building performance
adaptability to variable occupancy. Building and Environment, 155, 257-267.
https://doi.org/10.1016/j.buildenv.2019.03.048
Owen, R. (Ed.). (2009). CIB white paper on IDDS integrated design & delivery solutions
(Vol. 328). CIB. http://www.irbnet.de/daten/iconda/CIB18413.pdf.
Owen, R., Amor, R., Dickinson, J., Prins, M., & Kiviniemi, A. (2013). CIB integrated
design & delivery solutions (IDDS); research roadmap (Vol. 373). CIB.
https://bit.ly/3dnOE2S
Owen, R., Amor, R., Palmer, M., Dickinson, J., Tatum, C. B., Kazi, A. S., Prins, M.,
Kiviniemi, A., & East, B. (2010). Challenges for integrated design and delivery
solutions. Architectural Engineering and Design Management, 6(4), 232-240.
https://doi.org/10.3763/aedm.2010.IDDS1
Oxford University Press. (n.d.). Oxford English Dictionary. The definitive record of the
English language. https://www.oed.com
Padfield, T. (1999). Humidity buffering of interior spaces by porous, absorbent
insulation: Part of hygrothermal properties of alternative insulation materials.
Series R (61). https://bit.ly/2xQVHlG

355
Padfield, T., Ryhl-Svendsen, M., Larsen, P. K., & Aasbjerg Jensen, L. (2018). A review of
the physics and the building science which underpins methods of low energy
storage of museum and archive collections. Studies in Conservation, 63, 209-
215. https://doi.org/10.1080/00393630.2018.1504456
Page, I. C. (2015). New-home defects. Build, 148, 84-85. https://bit.ly/2zuLSKI
Palos, S., Kiviniemi, A., & Kuusisto, J. (2014). Future perspectives on product data
management in building information modeling. Construction Innovation, 14(1),
52-68. https://doi.org/10.1108/CI-12-2011-0080
Palumbo, M., Lacasta, A. M., Giraldo, M. P., Haurie, L., & Correal, E. (2018). Bio-based
insulation materials and their hygrothermal performance in a building envelope
system (ETICS). Energy and Buildings, 174, 147-155.
https://doi.org/10.1016/j.enbuild.2018.06.042
Panetto, H., Zdravkovic, M., Jardim-Goncalves, R., Romero, D., Cecil, J., & Mezgár, I.
(2016). New perspectives for the future interoperable enterprise systems.
Computers in Industry, 79, 47-63.
https://doi.org/10.1016/j.compind.2015.08.001
Papadonikolaki, E., van Oel, C., & Kagioglou, M. (2019). Organising and managing
boundaries: A structurational view of collaboration with building information
modelling (BIM). International Journal of Project Management, 37(3), 378-394.
https://doi.org/10.1016/j.ijproman.2019.01.010
Papadopoulos, S., Kontokosta, C. E., Vlachokostas, A., & Azar, E. (2019). Rethinking
HVAC temperature setpoints in commercial buildings: The potential for zero-
cost energy savings and comfort improvement in different climates. Building
and Environment, 155, 350-359.
https://doi.org/10.1016/j.buildenv.2019.03.062
356
Parish, O. O., & Putnam, T. W. (1977). Equations for the determination of humidity
from dewpoint and psychrometric data [Technical Note]. NASA.
https://go.nasa.gov/3crFdzj
Park, J. H., Kang, Y., Lee, J., Wi, S., Chang, J. D., & Kim, S. (2019). Analysis of walls of
functional gypsum board added with porous material and phase change
material to improve hygrothermal performance. Energy and Buildings, 183,
803-816. https://doi.org/10.1016/j.enbuild.2018.11.023
Parke, E. C. (2014). Experiments, simulations, and epistemic privilege. Philosophy of
Science, 81(4), 516-536. https://doi.org/10.1086/677956
Pazold, M., Antretter, F., & Hermes, M. (2014). Coupling hygrothermal whole building
simulation and air-flow modelling to determine strategies for optimized natural
ventilation [Paper presentation]. 35th AIVC Conference, 4th TightVent
Conference, 2nd venticool Conference, Poznan, Poland. https://bit.ly/2WDGL2F
Pearl, J. (2009). Causality: Models, reasoning, and inference (2 ed.). Cambridge
University Press.
Pedersen, C. R. (1990). Combined heat and moisture transfer in building constructions
(Vol. 214). Thermal Insulation Laboratory, Technical University of Denmark.
Peikoff, L., & Ward, J. (1991). Objectivism: The philosophy of Ayn Rand. Dutton.
Peirce, C. S. (1997). Pragmatism as a principle and method of right thinking: The 1903
Harvard lectures on pragmatism. SUNY Press. (1903)
Pelsmakers, S., Vereecken, E., Airaksinen, M., & Elwell, C. C. A. (2019). Void conditions
and potential for mould growth in insulated and uninsulated suspended timber
ground floors. International Journal of Building Pathology and Adaptation(4),
395. https://doi.org/10.1108/IJBPA-05-2018-0041

357
Persily, A. (2015). Challenges in developing ventilation and indoor air quality standards:
The story of ASHRAE standard 62. Building and Environment, 91, 61-69.
https://doi.org/10.1016/j.buildenv.2015.02.026
Peter, J. P. (1981). Construct validity: A review of basic issues and marketing practices.
Journal of Marketing Research, 18(2), 133-145.
Peters, L. D., Pressey, A. D., Vanharanta, M., & Johnston, W. J. (2013). Constructivism
and critical realism as alternative approaches to the study of business
networks: Convergences and divergences in theory and in research practice.
Industrial marketing management, 42(3), 336-346.
https://doi.org/10.1016/j.indmarman.2013.02.003
Pezeshki, Z., Soleimani, A., & Darabi, A. (2019). Application of BEM and using BIM
database for BEM: A review. Journal of Building Engineering, 23, 1-17.
https://doi.org/10.1016/j.jobe.2019.01.021
Philip, J., & De Vries, D. (1957). Moisture movement in porous materials under
temperature gradients. Eos, Transactions American Geophysical Union, 38(2),
222-232. https://doi.org/10.1029/TR038i002p00222
Piaget, J., & Inhelder, B. (1967). The child's conception of space. WW Norton &Co.
Piggott, J. J., Townsend, C. R., & Matthaei, C. D. (2015). Reconceptualizing synergism
and antagonism among multiple stressors. Ecology and evolution, 5(7), 1538-
1547. https://doi.org/10.1002/ece3.1465
Piot, A., Woloszyn, M., Brau, J., & Abele, C. (2011). Experimental wooden frame house
for the validation of whole building heat and moisture transfer numerical
models. Energy and Buildings, 43(6), 1322-1328.
https://doi.org/10.1016/j.enbuild.2011.01.008
358
Piroozfar, P., Farr, E. R. P., Zadeh, A. H. M., Timoteo Inacio, S., Kilgallon, S., & Jin, R.
(2019). Facilitating building information modelling (BIM) using integrated
project delivery (IPD): A UK perspective. Journal of Building Engineering, 26,
100907. https://doi.org/10.1016/j.jobe.2019.100907
Pizzorno, J. (2016). Is mold toxicity really a problem for our patients? Part I--respiratory
conditions. Integrative Medicine: A Clinician's Journal, 15(2), 6-10.
Pizzorno, J., & Shippy, A. (2016). Is mold toxicity really a problem for our patients? Part
2--nonrespiratory conditions. Integrative Medicine: A Clinician's Journal, 15(3),
8-14.
Plagmann, M. (2018). Mould, occupants and house condition. Build, 169, 58-59.
https://bit.ly/2SUuNRd
Poletti, E., Vasconcelos, G., Branco, J. M., & Isopescu, B. (2019). Effects of extreme
environmental exposure conditions on the mechanical behaviour of traditional
carpentry joints. Construction and Building Materials, 213, 61-78.
https://doi.org/10.1016/j.conbuildmat.2019.04.030
Poli, R. (2017). The Brentano puzzle. Taylor & Francis.
Political Risk Services. (2017). New Zealand: Country report. PRS Group, Inc.
Pollard, A. (2018). Could damp homes be too cold/underheated? BRANZ study report
SR389. Judgeford, New Zealand: BRANZ Ltd.
Poppendieck, D. G., Ng, L. C., Persily, A. K., & Hodgson, A. T. (2015). Long term air
quality monitoring in a net-zero energy residence designed with low emitting
interior products. Building and Environment, 94, Part 1, 33-42.
https://doi.org/10.1016/j.buildenv.2015.07.001

359
Popper, K. (2005). The logic of scientific discovery [Logik der Forschung] (2. ed.).
Routledge. (1935)
Porwal, A., & Hewage, K. N. (2013). Building information modeling (BIM) partnering
framework for public construction projects. Automation in Construction, 31,
204-214. https://doi.org/10.1016/j.autcon.2012.12.004
Poshdar, M., Gonzalez, V. A., & B, K. (2018). Buffer management in construction - a
New Zealand study [Paper presentation]. 26th Annual Conference of the
International Group for Lean Construction (IGLC 26), Chennai, India, 2018,
Prada, A., Pernigotto, G., Baggio, P., & Gasparella, A. (2018). Uncertainty propagation
of material properties in energy simulation of existing residential buildings: The
role of buildings features. Building Simulation, 11(3), 449-464.
https://doi.org/10.1007/s12273-017-0418-4
Praveen, V., Delhi Narendran, T., Pavithran, R., & Thirumalai, C. (2017). Data analysis
using box plot and control chart for air quality [Paper presentation].
International Conference on Trends in Electronics and Informatics ICEI 2017,
Tirunelveli, India, 11-12,May 2017,
https://doi.org/10.1109/ICOEI.2017.8300877
Prins, M., & Owen, R. (2010). Integrated design and delivery solutions. Architectural
Engineering and Design Management, 6(4), 227-231.
https://doi.org/10.3763/aedm.2010.IDDS0
Puolitaival, T., Amor, R., GhaffarianHoseini, A., & Park, K. (2016). Supporting BIM
adoption and implementation-case New Zealand [Paper presentation]. 1st
International UK BIM Academic Forum Conference, Glasgow, UK.
https://hdl.handle.net/10652/3820
Quaglia, L., & McNeil, S. (2012). Changing the air indoors. Build, 127, 48-49.
https://bit.ly/2YZte8y
360
Radon, J., Was, K., Flaga-Maryanczyk, A., & Schnotale, J. (2018). Experimental and
theoretical study on hygrothermal long-term performance of outer assemblies
in lightweight passive house. Journal of Building Physics, 41(4), 299-320.
https://doi.org/10.1177/1744259116686959
Radu, A., Barreira, E., Saber, H., Hens, H., Vinha, J., Vasilache, M., Bomberg, M.,
Koronthalyova, O., Matiasovsky, P., & Becker, R. (2012). Heat, air and moisture
transfer terminology: Parameters and concepts (Vol. 369). CIB – International
Council for Research and Innovation In Building and Construction.
Rahmani Asl, M., Zarrinmehr, S., Bergin, M., & Yan, W. (2015). BPOpt: A framework for
BIM-based performance optimization. Energy and Buildings, 108, 401-412.
https://doi.org/10.1016/j.enbuild.2015.09.011
Rahmillah, F. I., Hotma, A., Tumanggor, U., & Sari, A. D. (2017). The analysis of thermal
comfort in kitchen. IOP Conference Series: Materials Science and Engineering,
215(1). https://doi.org/10.1088/1757-899X/215/1/012033
Ramos, N. M. M., & de Freitas, V. P. (2009). Experimental determination of the
hygroscopic inertia of building materials. Building Research & Information,
37(3), 293-299. https://doi.org/10.1080/09613210902748990
Ramos, N. M. M., & de Freitas, V. P. (2012). The evaluation of hygroscopic inertia and
its importance to the hygrothermal performance of buildings. In J. M. P. Q.
Delgado (Ed.), Heat and mass transfer in porous media. Advanced structured
materials (Vol. 13, pp. 25-45). Springer. https://doi.org/10.1007/978-3-642-
21966-5_2
Ramos, N. M. M., Delgado, J. M. P. Q., & de Freitas, V. P. (2010). Influence of finishing
coatings on hygroscopic moisture buffering in building elements. Construction
and Building Materials, 24(12), 2590-2597.
https://doi.org/10.1016/j.conbuildmat.2010.05.017

361
Rehman, S. U., Kiani, U. A., Yaqub, M., & Ali, T. (2020). Controlling natural resources
depletion through montmorillonite replacement for cement-low cost
construction. Construction and Building Materials, 232, 117188.
https://doi.org/10.1016/j.conbuildmat.2019.117188
Rempel, A. R., & Rempel, A. W. (2016). Intrinsic evaporative cooling by hygroscopic
earth materials. Geosciences, 6(3), 1-38, Article 38.
https://doi.org/10.3390/geosciences6030038
Rempel, A. R., Rempel, A. W., Gates, K. R., & Shaw, B. (2016). Climate-responsive
thermal mass design for pacific northwest sunspaces. Renewable Energy, 85,
981-993. https://doi.org/10.1016/j.renene.2015.07.027
Reynders, G., Andriamamonjy, A., Klein, R., & Saelens, D. (2017). Towards an IFC-
Modelica tool facilitating model complexity selection for building energy
simulation. In C. S. Barnaby & M. Wetter (Eds.), Proceedings of the 15th IBPSA
Conference San Francisco, CA, USA, Aug. 7-9, 2017.
https://doi.org/10.26868/25222708.2017.621
Rezaei, F., Bulle, C., & Lesage, P. (2019). Integrating building information modeling and
life cycle assessment in the early and detailed building design stages. Building
and Environment, 153, 158-167.
https://doi.org/10.1016/j.buildenv.2019.01.034
Rhodes, J. (2019). Rapid worldwide emergence of pathogenic fungi. Cell Host &
Microbe, 26(1), 12-14. https://doi.org/10.1016/j.chom.2019.06.009
Rhodes, M. L. (2012). Systems theory. In S. J. Smith (Ed.), International encyclopedia of
housing and home (pp. 134-137). Elsevier. https://doi.org/10.1016/B978-0-08-
047163-1.00689-5
362
Rieth, Á., Kovács, R., & Fülöp, T. (2018). Implicit numerical schemes for generalized
heat conduction equations. International Journal of Heat and Mass Transfer,
126, 1177-1182. https://doi.org/10.1016/j.ijheatmasstransfer.2018.06.067
Riggio, M., Sandak, J., & Franke, S. (2015). Application of imaging techniques for
detection of defects, damage and decay in timber structures on-site.
Construction and Building Materials.
https://doi.org/10.1016/j.conbuildmat.2015.06.065
Rigolot, C. (2018). Sustainability transformations as shifts in worldviews; a dynamic
view of complementarity issues. Ecology and Society, 23(2).
https://doi.org/10.2307/26799123
Ringman, R., Beck, G., & Pilgård, A. (2019). The importance of moisture for brown rot
degradation of modified wood: A critical discussion. Forests, 10(6), 522.
https://doi.org/10.3390/f10060522
Rittner, D., & Bailey, R. (2016). Clausius-Clapeyron equation. In D. Rittner & R. Bailey
(Eds.), Facts on file science encyclopedia: Encyclopedia of chemistry (2 ed.).
Facts On File.
Robati, M., Daly, D., & Kokogiannakis, G. (2019). A method of uncertainty analysis for
whole-life embodied carbon emissions (CO2-e) of building materials of a net-
zero energy building in Australia. Journal of Cleaner Production, 225, 541-553.
https://doi.org/10.1016/j.jclepro.2019.03.339
Rocha, I. B. C. M., van der Meer, F. P., Nijssen, R. P. L., & Sluys, L. J. (2017). A multiscale
and multiphysics numerical framework for modelling of hygrothermal ageing in
laminated composites. International Journal for Numerical Methods in
Engineering, 112(4), 360-379. https://doi.org/10.1002/nme.5542

363
Rode, C., & Grau, K. (2008). Moisture buffering and its consequence in whole building
hygrothermal modeling. Journal of Building Physics, 31(4), 333-360.
https://doi.org/10.1177/1744259108088960
Rode, C., & Grau, K. (2010). Whole building hygrothermal simulation model [Paper
presentation]. American Society of Heating, Refrigeration and Air-Conditioning
Engineers, Recent Advances in Energy Simulation: Building Loads, Symposium
CH-03-09, Chicago, United States. https://bit.ly/35LaZoy
Rode, C., Hens, H., & Janssen, H. (Eds.). (2008). IEA Annex 41 whole building heat, air,
moisture response. Technical University of Denmark.
http://orbit.dtu.dk/files/3156657/byg-r191.pdf.
Rode, C., Peuhkuri, R. H., Mortensen, L. H., Hansen, K. K., Time, B., Gustavsen, A.,
Ojanen, T., Ahonen, J., Svennberg, K., & Arfvidsson, J. (Eds.). (2005). Moisture
buffering of building materials. Technical University of Denmark, Department of
Civil Engineering.
Roels, S. (Ed.). (2017). Reliable building energy performance characterisation based on
full scale dynamic measurements. IEA EBC Annex 58 [Project Summary Report].
AECOM Ltd. https://bit.ly/3coaa7J.
Roels, S., & Janssen, H. (2005). Is the moisture buffer value a reliable material property
to characterise the hygric buffering capacities of building materials [Working
paper]. IEA Annex 41 project: Whole Building Heat, Air and Moisture Response.
https://bit.ly/2zkqzeF
Roels, S., & Janssen, H. (2006). A comparison of the nordtest and japanese test
methods for the moisture buffering performance of building materials. Journal
of Building Physics, 30(2), 137-161.
https://doi.org/10.1177/1744259106068101
364
Romanska-Zapala, A., Bomberg, M., Fedorczak-Cisak, M., Furtak, M., Yarbrough, D., &
Dechnik, M. (2018). Buildings with environmental quality management, part 2:
Integration of hydronic heating/cooling with thermal mass. Journal of Building
Physics, 41(5), 397-417. https://doi.org/10.1177/1744259117735465
Romanska-Zapala, A., Bomberg, M., & Yarbrough, D. W. (2019). Buildings with
environmental quality management: Part 4: A path to the future NZEB. Journal
of Building Physics, 43(1), 3-21. https://doi.org/10.1177/1744259118790756
Rosemeier, K. (2010). The role of building physics in the New Zealand architecture
curriculum [Paper presentation]. 44th Annual Conference of the Architectural
Science Association, ANZAScA 2010, Unitec Institute of Technology, Auckland,
New Zealand. http://anzasca.net/wp-
content/uploads/2014/08/ANZAScA_2010_Rosemeier_K.pdf
Rotimi, F. E., Tookey, J., & Rotimi, J. O. (2015). Evaluating defect reporting in new
residential buildings in New Zealand. Buildings, 5(1), 39-55.
https://doi.org/10.3390/buildings5010039
Rotimi, J., Arasanmi, C., Rotimi, F., Ramanayaka, C., & Komolafe, A. (2019).
Antecedents of BIM training effectiveness amongst AEC firms in New Zealand.
In P. Wu & X. Wang (Eds.), Innovative production and construction:
Transforming construction through emerging technologies (pp. 353-366). World
Scientific. https://doi.org/10.1142/9789813272491_0021
Roush, S. (2017). The epistemic superiority of experiment to simulation. Synthese.
https://doi.org/10.1007/s11229-017-1431-y
Rowley, F. B., Algren, A. B., & Lund, C. E. (1941). Condensation of moisture and its
relation to building construction and operation. Bulletin of the University of
Minnesota, 18, 1-69. https://bit.ly/3dFMvQt
365
Runeson, P., & Höst, M. (2009). Guidelines for conducting and reporting case study
research in software engineering. Empirical software engineering, 14(2), 131-
164. https://doi.org/10.1007/s10664-008-9102-8
Rupp, R. F., de Dear, R., & Ghisi, E. (2018). Field study of mixed-mode office buildings in
southern brazil using an adaptive thermal comfort framework. Energy and
Buildings, 158, 1475-1486. https://doi.org/10.1016/j.enbuild.2017.11.047
Rutherford, A. (2011). ANOVA and ANCOVA : A GLM approach (2. ed.). Wiley.
Růžička, J., & Diviš, J. (2019). The influence of building materials on relative humidity of
internal microclimate. IOP Conference Series: Earth and Environmental Science,
290, 012029. https://doi.org/10.1088/1755-1315/290/1/012029
Ryan, B., Scapens, R. W., & Theobald, M. (2002). Research method and methodology in
finance and accounting (2. ed.). Cengage Learning. (1992)
Saadatian, O., Lim, C. H., Sopian, K., & Salleh, E. (2013). A state of the art review of
solar walls: Concepts and applications. Journal of Building Physics, 37(1), 55-79.
https://doi.org/10.1177/1744259113479336
Sacks, R., Eastman, C., Lee, G., & Teicholz, P. (2018). BIM handbook : A guide to
building information modeling for owners, managers, architects, engineers,
contractors, and fabricators (3. ed.). John Wiley & Sons, Incorporated.
Sacks, R., Ma, L., Yosef, R., Borrmann, A., Daum, S., & Kattel, U. (2017). Semantic
enrichment for building information modeling: Procedure for compiling
inference rules and operators for complex geometry. Journal of Computing in
Civil Engineering, 31(6), 04017062. https://doi.org/10.1061/(ASCE)CP.1943-
5487.0000705
Sahlberg, B., Gunnbjörnsdottir, M., Soon, A., Jogi, R., Gislason, T., Wieslander, G.,
Janson, C., & Norback, D. (2013). Airborne molds and bacteria, microbial

366
volatile organic compounds (mvoc), plasticizers and formaldehyde in dwellings
in three north European cities in relation to sick building syndrome (sbs).
Science of The Total Environment, 444, 433-440.
https://doi.org/10.1016/j.scitotenv.2012.10.114
Saijo, Y., Kanazawa, A., Araki, A., Morimoto, K., Nakayama, K., Takigawa, T., Tanaka,
M., Shibata, E., Yoshimura, T., Chikara, H., & Kishi, R. (2011). Relationships
between mite allergen levels, mold concentrations, and sick building syndrome
symptoms in newly built dwellings in Japan. Indoor Air, 21(3), 253-263.
https://doi.org/10.1111/j.1600-0668.2010.00698.x
Salloum, S., Ghali, K., & Ghaddar, N. (2015). Moisture buffering capacity of novel solar-
regenerated rotating hygroscopic curtain system. International Journal of
Energy Research, 39(14), 1942-1953. https://doi.org/10.1002/er.3420
Salonvaara, M., Ojanen, T., Holm, A., Künzel, H. M., & Karagiozis, A. N. (2004). Moisture
buffering effects on indoor air quality-experimental and simulation results
(paper 119) [Paper presentation]. 2004 Buildings IX International Conference,
Clearwater, Florida. https://bit.ly/2Lo0sX3
Samuel, D. G. L., Nagendra, S. M. S., & Maiya, M. P. (2013). Passive alternatives to
mechanical air conditioning of building: A review. Building and Environment,
66, 54-64. https://doi.org/10.1016/j.buildenv.2013.04.016
Sängerlaub, S., Schmid, M., & Müller, K. (2018). Comparison of water vapour
transmission rates of monolayer films determined by water vapour sorption
and permeation experiments. Food Packaging and Shelf Life, 17, 80-84.
https://doi.org/10.1016/j.fpsl.2018.06.004
Santos, A., Ramos, N. M. M., Maia, J., & Delgado, J. (2019). Hygrothermal performance
of brazilian gypsum walls. Journal of Building Physics, 42(4), 605-626.
https://doi.org/10.1177/1744259118779021
367
Santos, G., Vale, Z., Faria, P., & Gomes, L. (2020). Bricks: Building’s reasoning for
intelligent control knowledge-based system. Sustainable Cities and Society, 52,
101832. https://doi.org/10.1016/j.scs.2019.101832
Sarigiannis, D. A., Karakitsios, S. P., Gotti, A., Liakos, I. L., & Katsoyiannis, A. (2011).
Exposure to major volatile organic compounds and carbonyls in European
indoor environments and associated health risk. Environment International,
37(4), 743-765. https://doi.org/10.1016/j.envint.2011.01.005
Sauer, F. (2011). Validierung der hygrothermischen Gebäudesimulation WUFI® plus mit
ASHRAE-140. Hochschule München.
Sauni, R., Uitti, J., Jauhiainen, M., Kreiss, K., Sigsgaard, T., & Verbeek, J. H. (2015).
Remediating buildings damaged by dampness and mould for preventing or
reducing respiratory tract symptoms, infections and asthma (review) (Vol. 2.
Art. No.: CD007897). John Wiley & Sons, Ltd.
https://doi.org/10.1002/14651858.CD007897.pub3.
Saurin, T. A., & Rooke, J. (2020). The last planner® system as an approach for coping
with the complexity of construction projects. In P. Tzortzopoulos, M. Kagioglou,
& L. Koskela (Eds.), Lean construction : Core concepts and new frontiers (pp. 325
- 340). Routledge.
Schaffer, M., Schoon, P. M., Sigma Theta Tau, I., & Porta, C. M. (2018). Population-
based public health clinical manual, third edition: The Henry Street model for
nurses (3. ed.). Sigma.
Scharfetter, D. L., & Gummel, H. K. (1969). Large-signal analysis of a silicon read diode
oscillator. IEEE Transactions on Electron Devices, 16(1), 64-77.
https://doi.org/10.1109/T-ED.1969.16566

368
Schiavon, S., Hoyt, T., & Piccioli, A. (2014). Web application for thermal comfort
visualization and calculation according to ASHRAE standard 55. Building
Simulation, 7(4), 321-334. https://doi.org/10.1007/s12273-013-0162-3
Schiavon, S., Rim, D., Pasut, W., & Nazaroff, W. W. (2016). Sensation of draft at
uncovered ankles for women exposed to displacement ventilation and
underfloor air distribution systems. Building and Environment, 96, 228-236.
https://doi.org/10.1016/j.buildenv.2015.11.009
Schlueter, A., & Thesseling, F. (2009). Building information model based energy/exergy
performance assessment in early design stages. Automation in Construction,
18(2), 153-163. https://doi.org/10.1016/j.autcon.2008.07.003
Schmidt, E., & Riggio, M. (2019). Monitoring moisture performance of cross-laminated
timber building elements during construction. Buildings, 9(6), 144.
https://doi.org/10.3390/buildings9060144
Schmidt, S., Lindauer, M., & Hoppe, M. (2012). Comparing TRNSYS and WUFI®plus
simulation models- illustrated on models validated on measurements at
Schack- gallery Munich. In Proceedings of the 5th International Building Physics
Conference (IBPC), May 28-31, 2012 (pp. 1143-1148). https://bit.ly/3bmUL63
Schöpfer, T., Antretter, F., van Treeck, C., Frisch, J., & Holm, A. (2010). Validierung
energetischer gebäudesimulationsmodelle mit der VDI 6020 [Validation of
energetic building simulation models with VDI 6020]. In A. Mahdavi & B.
Martens (Eds.), Building Performance Simulation in a Changing Environment,
Proceedings of the Third German-Austrian IBPSA Conference, September 22-24,
2010 (Vol. 3, pp. 529-534). ÖKK-Verlag.
Schwaller, J., Wegerer, P., & Bednar, T. (2016). Modification of the glaser method using
solar radiation and convective moisture penetration. Bauphysik, 38(2), 71-80.
https://doi.org/10.1002/bapi.201610008
369
Schwartz, M., & Esbjörn-Hargens, S. (Eds.). (2019). Dancing with Sophia: Integral
philosophy on the verge. SUNY Press.
Sedlacek, S., & Maier, G. (2012). Can green building councils serve as third party
governance institutions? An economic and institutional analysis. Energy Policy,
49, 479-487. https://doi.org/10.1016/j.enpol.2012.06.049
Sedlbauer, K., Hofbauer, W., Krueger, N., Mayer, F., & Breuer, K. (2011). Material
specific isopleth-systems as valuable tools for the assessment of the durability
of building materials against mould infestation–the ‘‘isopleth-traffic light’’. In V.
P. de Freitas, H. Corvacho, & M. Lacasse (Eds.), XII DBMC 12th International
Conference on Durability of Building Materials and Components, 12th - 15th
April 2011, Porto, Portugal (pp. 417-424). FEUP Edicoes (Faculdade de
Engenharia da Universidade do Porto Edicoes). https://bit.ly/3cwiX7K
Sedlbauer, K., & Krus, M. (2003). A new model for mould prediction and its application
in practice. In J. Carmeliet, H. Hens, & G. Vermeir (Eds.), Research in building
physics: Proceedings of the 2nd international conference on building physics,
Leuven, Belgium, 14-18 September 2003 (pp. 921-928). A.A. Bulkema
Publishers.
Sellars, W., Rorty, R., Rorty, R. M., & Brandom, R. (1997). Empiricism and the
philosophy of mind (Vol. 1). Harvard University Press.
Sepers, F. (2017). An integral design framework —designing a global village. The Design
Journal, 20(sup1), S1566-S1579.
https://doi.org/10.1080/14606925.2017.1352681
Shadish, W., Cook, T. D., & Campbell, D. T. (2002). Experimental and quasi-
experimental designs for generalized causal inference. Houghton Mifflin
Company.

370
Sharpe, R. A., Bearman, N., Thornton, C. R., Husk, K., & Osborne, N. J. (2015). Indoor
fungal diversity and asthma: A meta-analysis and systematic review of risk
factors. Journal of Allergy and Clinical Immunology, 135(1), 110-122.
https://doi.org/10.1016/j.jaci.2014.07.002
Sharpe, R. A., Thornton, C. R., Nikolaou, V., & Osborne, N. J. (2015a). Fuel poverty
increases risk of mould contamination, regardless of adult risk perception &
ventilation in social housing properties. Environment International, 79, 115-
129. https://doi.org/10.1016/j.envint.2015.03.009
Sharpe, R. A., Thornton, C. R., Nikolaou, V., & Osborne, N. J. (2015b). Higher energy
efficient homes are associated with increased risk of doctor diagnosed asthma
in a UK subpopulation. Environment International, 75, 234-244.
https://doi.org/10.1016/j.envint.2014.11.017
Shehadi, M. (2018). Review of humidity control technologies in buildings. Journal of
Building Engineering, 19, 539-551. https://doi.org/10.1016/j.jobe.2018.06.009
Shen, X., & Qi, C. (2012). Countermeasures towards circular economy development in
west regions. Energy Procedia, 16, 927-932.
https://doi.org/10.1016/j.egypro.2012.01.148
Shi, L., Zhang, H., Li, Z., Man, X., Wu, Y., Zheng, C., & Liu, J. (2018). Analysis of moisture
buffering effect of straw-based board in civil defence shelters by field
measurements and numerical simulations. Building and Environment, 143, 366-
377. https://doi.org/10.1016/j.buildenv.2018.07.018
Shi, S., McCarthy, I., & Mai, U. (2017). Leaky building stigma : Can it be eliminated by
remediation? Evidence from New Zealand. International Journal of Housing
Markets and Analysis, 10(3), 328-351. https://doi.org/10.1108/IJHMA-06-2016-
0043
371
Shirowzhan, S., Sepasgozar, S. M. E., Edwards, D. J., Li, H., & Wang, C. (2020). BIM
compatibility and its differentiation with interoperability challenges as an
innovation factor. Automation in Construction, 112, 103086.
https://doi.org/10.1016/j.autcon.2020.103086
Shoubi, M. V., Shoubi, M. V., Bagchi, A., & Barough, A. S. (2015). Reducing the
operational energy demand in buildings using building information modeling
tools and sustainability approaches. Ain Shams Engineering Journal, 6(1), 41-55.
https://doi.org/10.1016/j.asej.2014.09.006
Shrestha, P. M., Humphrey, J. L., Barton, K. E., Carlton, E. J., Adgate, J. L., Root, E. D., &
Miller, S. L. (2019). Impact of low-income home energy-efficiency retrofits on
building air tightness and healthy home indicators. Sustainability, 11(9), 2667.
https://doi.org/10.3390/su11092667
Sigo, K. L. (2012). Towards the development of cost metrics for inadequate
interoperability (Publication Number Paper 10) [Master thesis, Purdue
University, Department of Computer Graphics Technology].
http://docs.lib.purdue.edu/cgttheses
Silberstein, A., & Hens, H. (1996). Effects of air and moisture flows on the thermal
performance of insulations in ventilated roofs and walls. Journal of Thermal
Insulation and Building Envelopes, 19(4), 367-385.
Simões, N., Branco, F., & Tadeu, A. (2002). Definition of two-dimensional condensation
via BEM, using the glaser method approach. Engineering Analysis with
Boundary Elements, 26(6), 527-536. https://doi.org/10.1016/S0955-
7997(02)00011-5
Simonson, C. J., Ojanen, T., & Salonvaara, M. (2005). Moisture performance of an
airtight, vapor-permeable building envelope in a cold climate. Journal of
Thermal Envelope and Building Science, 28(3), 205-226.
https://doi.org/10.1177/1097196305048628
372
Simonson, C. J., Salonvaara, M., & Ojanen, T. (2002). The effect of structures on indoor
humidity – possibility to improve comfort and perceived air quality. Indoor Air,
12(4), 243-251. https://doi.org/10.1034/j.1600-0668.2002.01128.x
Smith, D. K., & Tardif, M. (2009). Building information modeling : A strategic
implementation guide for architects, engineers, constructors, and real estate
asset managers. Wiley.
Smith, L. D. (1986). Behaviorism and logical positivism: A reassessment of the alliance.
Stanford University Press.
Smith, M. (2017). Avoidance and diagnosis of problems associated with internal wall
insulation. Journal of Building Survey, Appraisal & Valuation, 6(1), 11-25.
Smith, S., Booth, K., & Zalewski, M. (1996). International theory: Positivism and beyond.
Cambridge University Press.
Sonntag, D. (1990). Important new values of the physical constants of 1986, vapour
pressure formulations based on the ITS-90, and psychrometer formulae. Z.
Meteorol, 70(5), 340-344.
Soudani, L., Fabbri, A., Morel, J.-C., Woloszyn, M., Chabriac, P.-A., Wong, H., & Grillet,
A.-C. (2016). Assessment of the validity of some common assumptions in
hygrothermal modeling of earth based materials. Energy and Buildings, 116,
498-511. https://doi.org/10.1016/j.enbuild.2016.01.025
Spengler, J. D. (2012). Climate change, indoor environments, and health. Indoor Air,
22(2), 89-95. https://doi.org/10.1111/j.1600-0668.2012.00768.x
Spiller, C., Maunganui Wolfgramm, R., Henry, E., & Pouwhare, R. (2020). Paradigm
warriors: Advancing a radical ecosystems view of collective leadership from an
373
indigenous Māori perspective. Human Relations, 73(4), 516-543.
https://doi.org/10.1177/0018726719893753
Stahlbaum, D. (2020). Probleme kann man niemals mit derselben Denkweise lösen,
durch die sie entstanden sind: Zeitkritische Beiträge. Buch IV der Reihe "mit
Buddha, mit Immanuel Kant" [Problems cannot be solved by the same level of
thinking that created them: Time-critical contributions. Book IV of the series
"With Buddha, with Immanuel Kant"] (2 ed.) [Kindle Book]. BookRix. (2014)
Standards New Zealand. (1990). Ventilation for acceptable indoor air quality (NZS
4303:1990). https://shop.standards.govt.nz
Standards New Zealand. (2012a). Plywood—structural part 0: Specifications (AS/NZS
2269.0). https://shop.standards.govt.nz
Standards New Zealand. (2012b). Specification for preservative treatment part 3:
Plywood (AS/NZS 1604.3). https://shop.standards.govt.nz
Stapp, H. P. (2011). Mindful universe: Quantum mechanics and the participating
observer. Springer Science & Business Media.
Statistics New Zealand. (2013). How will New Zealand's ageing population affect the
property market? https://www.stats.govt.nz
Stats NZ. (2017). Trending topics housing. https://www.stats.govt.nz
Stats NZ. (2019). Framework for housing quality. https://www.stats.govt.nz
Stats NZ. (n.d.-a). Dwelling and household estimates: June 2019 quarter. Stats NZ
Tatauranga Aotearoa. Retrieved July 28, 2019 from
https://www.stats.govt.nz/information-releases/dwelling-and-household-
estimates-june-2019-quarter

374
Stats NZ. (n.d.-b). Summary figures for the New Zealand resident population, year
ended December 2018. Stats NZ Tatauranga Aotearoa. Retrieved July 28, 2019
from https://www.stats.govt.nz/topics/population
Stazi, F., Tittarelli, F., Politi, G., Di Perna, C., & Munafo, P. (2014). Assessment of the
actual hygrothermal performance of glass mineral wool insulation applied 25
years ago in masonry cavity walls. Energy and Buildings, 68, 292-304.
https://doi.org/10.1016/j.enbuild.2013.09.032
Steadman, R. G. (1979). The assessment of sultriness. Part I: A temperature-humidity
index based on human physiology and clothing science. Journal of Applied
Meteorology, 18(7), 861-873. https://doi.org/10.1175/1520-
0450(1979)018<0861:TAOSPI>2.0.CO;2
Steel, J., Drogemuller, R., & Toth, B. (2012). Model interoperability in building
information modelling. Software & Systems Modeling, 11(1), 99-109.
https://doi.org/10.1007/s10270-010-0178-4
Steeman, M., Janssens, A., & De Paepe, M. (2009). Performance evaluation of indirect
evaporative cooling using whole-building hygrothermal simulations. Applied
Thermal Engineering, 29(14), 2870-2875.
https://doi.org/10.1016/j.applthermaleng.2009.02.004
Stegnar, G., & Cerovšek, T. (2019). Information needs for progressive BIM
methodology supporting the holistic energy renovation of office buildings.
Energy, 173, 317-331. https://doi.org/10.1016/j.energy.2019.02.087
Stein, Z. (2019). Integral theory, pragmatism, and the future of philosophy. In Dancing
with Sophia: Integral philosophy on the verge (pp. 3-20). SUNY Press.
Sterling, E., Arundel, A., & Sterling, T. (1985). Criteria for human exposure to humidity
in occupied buildings. ASHRAE Transactions, 91(1B), 611-622.
375
Stopp, H., Schmidt, W., & Strangfeld, P. (2016). Passive hygrische klimatisierung.
Bauphysik, 38(1), 50-61. https://doi.org/10.1002/bapi.201610006
Stopp, H., & Strangfeld, P. (2008). Hygrothermic performance of the exterior and
interior surfaces of buildings. In G. Broadbent (Ed.), Eco-architecture II, WIT
transactions on ecology and the environment (Vol. 113, pp. 243-252). WITPress.
https://doi.org/10.2495/ARC080241
Strangfeld, C., & Kruschwitz, S. (2018). Monitoring of the absolute water content in
porous materials based on embedded humidity sensors. Construction and
Building Materials, 177, 511-521.
https://doi.org/10.1016/j.conbuildmat.2018.05.044
Straube, J. F. (2002). Moisture in buildings. ASHRAE Journal, 44(1), 15-19.
Succar, B., & Kassem, M. (2015). Macro-BIM adoption: Conceptual structures.
Automation in Construction, 57, 64-79.
https://doi.org/10.1016/j.autcon.2015.04.018
Suddaby, R. (2006). From the editors: What grounded theory is not. Academy of
management journal, 49(4), 633-642.
https://doi.org/10.5465/AMJ.2006.22083020
Sun, C., Jiang, S., Skibniewski, M. J., Man, Q., & Shen, L. (2017). A literature review of
the factors limiting the application of BIM in the construction industry.
Technological and Economic Development of Economy, 23(5), 764-779.
https://doi.org/10.3846/20294913.2015.1087071
Susan, E. (2017). Rising inflation “well-contained.”. Manawatu Standard(12).
Sutcliffe, R., Orban, E., McDonald, K., & Moebus, S. (2015). The german energiewende
—a matter for health? European Journal of Public Health, 26(4), 707-712.
https://doi.org/10.1093/eurpub/ckv212
376
Suzer, O. (2015). A comparative review of environmental concern prioritization: Leed
vs other major certification systems. Journal of Environmental Management,
154, 266-283. https://doi.org/10.1016/j.jenvman.2015.02.029
Švajlenka, J., Kozlovská, M., & Pošiváková, T. (2017). Assessment and biomonitoring
indoor environment of buildings. International Journal of Environmental Health
Research, 27(5), 427-439. https://doi.org/10.1080/09603123.2017.1373276
Szeredi, P., Lukácsy, G., Benko, T., & Nagy, Z. P. (2014). The semantic web explained :
The technology and mathematics behind web 3.0. Cambridge University Press.
Tam, V. Y., & Le, K. N. (Eds.). (2019). Sustainable construction technologies : Life-cycle
assessment. Elsevier Science & Technology.
Tan, B., & Thomas, N. L. (2016). A review of the water barrier properties of
polymer/clay and polymer/graphene nanocomposites. Journal of Membrane
Science, 514, 595-612. https://doi.org/10.1016/j.memsci.2016.05.026
Taptiklis, P., & Phipps, R. (2017). Indoor air quality in New Zealand homes and schools.
A literature review of healthy homes and schools with emphasis on the issues
pertinent to New Zealand. BRANZ.
Tariku, F., Kumaran, K., & Fazio, P. (2010). Transient model for coupled heat, air and
moisture transfer through multilayered porous media. International Journal of
Heat and Mass Transfer, 53(15), 3035-3044.
https://doi.org/10.1016/j.ijheatmasstransfer.2010.03.024
Tariku, F., Kumaran, K., & Fazio, P. (2011). Determination of indoor humidity profile
using a whole-building hygrothermal model. Building Simulation, 4(1), 61-78.
https://doi.org/10.1007/s12273-011-0031-x
377
Tchouanguem Djuedja, J. F., Karray, M. H., Foguem, B. K., Magniont, C., & Abanda, F. H.
(2019). Interoperability challenges in building information modelling (BIM). In
K. Popplewell, K.-D. Thoben, T. Knothe, & R. Poler (Eds.), Enterprise
interoperability VIII. Proceedings of the I-ESA conferences (Vol. 9, pp. 275-282).
Springer International Publishing. https://doi.org/10.1007/978-3-030-13693-
2_23
TenWolde, A. (1985). Steady-state one-dimensional water vapor movement by
diffusion and convection in a multilayered wall. ASHRAE Transactions, 91(1A),
322-342.
TenWolde, A. (1989). Moisture transfer through materials and systems in buildings. In
H. R. Trechsel & M. Bomberg (Eds.), Water vapor transmission through building
materials and systems: Mechanisms and measurement, ASTM STP 1039 (pp. 11-
18). American Society for Testing and Materials (ASTM). https://bit.ly/2LdI574
TenWolde, A., & Walker, l. S. (2001). Interior moisture design loads for residences. In
Thermal Performance of the Exterior Envelopes of Whole Buildings VIII
International Conference. Proceedings of a conference held Clearwater Beach,
Florida, USA, 2-7 December 2001. American Society of Heating, Refrigerating,
and Air Conditioning Engineers (ASHRAE). https://bit.ly/3cqrnNz
Terrell, S. R. (2012). Mixed-methods research methodologies. The Qualitative Report,
17(1), 254-280. https://bit.ly/35ONoDh
The Association of German Engineers (VDI). (2001). Anforderungen an
Rechenverfahren zur gebäude- und anlagensimulation Gebäudesimulation
(requirements on methods of calculation to thermal and energy simulation of
buildings and plants - buildings) (VDI 6020 part 1). Beuth Verlag GmbH.
The British Standards Institution. (2018). BIM: A 'must' for manufacturers. Why digital
transformation in the built environment offers a new world of opportunity for
makers of construction products [A BSI Whitepaper]. Retrieved November 06,

378
2018, from https://www.bsigroup.com/en-GB/Building-Information-Modelling-
BIM/
The National Institute of Standards and Technology. (2019). CODATA internationally
recommended 2018 values of the fundamental physical constants [Online
database]. http://physics.nist.gov/cuu/Constants/index.html
The United Nations. (2018). Harmony with nature (Vol. A/RES/73/235) [Resolution
adopted by the General Assembly on 20 December 2018].
https://bit.ly/3dvk2wE
The United Nations. (2019). Harmony with nature (Vol. A/74/236) [Report of the
Secretary-General]. https://bit.ly/3fHJ2me
The United Nations. (n.d.). Harmony with nature. Retrieved March 09, 2020 from
http://www.harmonywithnatureun.org/
The World Wide Web Consortium. (n.d.). About W3C. Retrieved November 04, 2019
from https://www.w3.org/Consortium/
Thomas, G. (2015). How to do your case study. Sage.
Thomas, N. L. (1991). The barrier properties of paint coatings. Progress in Organic
Coatings, 19(2), 101-121. https://doi.org/10.1016/0033-0655(91)80001-Y
Thomson, H., Thomas, S., Sellstrom, E., & Petticrew, M. (2013). Housing improvements
for health and associated socio-economic outcomes (Vol. 2). John Wiley & Sons,
Ltd. https://doi.org/10.1002/14651858.CD008657.pub2.
Todorović, M. S., Ećim-Đurić, O., Nikolić, S., Ristić, S., & Polić-Radovanović, S. (2015).
Historic building's holistic and sustainable deep energy refurbishment via BPS,
energy efficiency and renewable energy—a case study. Energy and Buildings,
95, 130-137. https://doi.org/10.1016/j.enbuild.2014.11.011
379
Tonn, B., Rose, E., & Hawkins, B. (2018). Evaluation of the U.S. Department of energy’s
weatherization assistance program: Impact results. Energy Policy, 118, 279-290.
https://doi.org/10.1016/j.enpol.2018.03.051
Torgerson, W. S. (1958). Theory and methods of scaling. Behavioral Science, 4(4), 245-
247. https://doi.org/10.1002/bs.3830040308
Torres-Rivas, A., Palumbo, M., Haddad, A., Cabeza, L. F., Jiménez, L., & Boer, D. (2018).
Multi-objective optimisation of bio-based thermal insulation materials in
building envelopes considering condensation risk. Applied Energy, 224, 602-
614. https://doi.org/10.1016/j.apenergy.2018.04.079
Totaro, M., Costa, A. L., Casini, B., Profeti, S., Gallo, A., Frendo, L., Porretta, A.,
Valentini, P., Privitera, G., & Baggiani, A. (2019). Microbiological air quality in
heating, ventilation and air conditioning systems of surgical and intensive care
areas: The application of a disinfection procedure for dehumidification devices.
Pathogens, 8(1), 8. https://doi.org/10.3390/pathogens8010008
Tran, V., Tookey, J. E., & Roberti, J. (2012). Shaving BIM: Establishing a framework for
future BIM research in New Zealand. International Journal of Construction
Supply Chain Management, 2(2), 66-79. https://bit.ly/2SUrOrZ
Travers, J. L. (2019). Climate change, climate justice, and a call for action. Nursing
Economic$, 37(1), 9-12.
Treeck, C. v., Wimmer, R., & Maile, T. (2018). BIM for energy analysis. In A. Borrmann,
M. König, C. Koch, & J. Beetz (Eds.), Building information modeling: Technology
foundations and industry practice (pp. 337-347). Springer International
Publishing. https://doi.org/10.1007/978-3-319-92862-3_20
Tsutsumi, H., Tanabe, S. i., Harigaya, J., Iguchi, Y., & Nakamura, G. (2007). Effect of
humidity on human comfort and productivity after step changes from warm
380
and humid environment. Building and Environment, 42(12), 4034-4042.
https://doi.org/10.1016/j.buildenv.2006.06.037
Tuuminen, T., Vaali, K., & Valtonen, V. (2019). Dampness and mold hypersensitivity
syndrome as an umbrella for many chronic diseases—the clinician's point of
view. In Reference module in earth systems and environmental sciences.
Elsevier. https://doi.org/10.1016/B978-0-12-409548-9.11454-X
Tweed, C., & Zapata-Lancaster, G. (2018). Interdisciplinary perspectives on building
thermal performance. Building Research & Information, 46(5), 552-565.
https://doi.org/10.1080/09613218.2018.1379815
Tzortzopoulos, P., Kagioglou, M., & Koskela, L. (Eds.). (2020). Lean construction : Core
concepts and new frontiers. Routledge.
Ulubeyli, S., & Kazanci, O. (2018). Holistic sustainability assessment of green building
industry in turkey. Journal of Cleaner Production, 202, 197-212.
https://doi.org/10.1016/j.jclepro.2018.08.111
Ürge-Vorsatz, D., Petrichenko, K., & Butcher, A. C. (2011). How far can buildings take us
in solving climate change? A novel approach to building energy and related
emission forecasting [Paper presentation]. ECEEE 2011 Summer Study
proceedings: Energy Efficiency First: The Foundation of a Low-Carbon Society,
https://bit.ly/2xLX0Ci
Utama, A., & Gheewala, S. H. (2008). Life cycle energy of single landed houses in
Indonesia. Energy and Buildings, 40(10), 1911-1916.
https://doi.org/10.1016/j.enbuild.2008.04.017
Van Belleghem, M., Steeman, M., Janssen, H., Janssens, A., & De Paepe, M. (2014).
Validation of a coupled heat, vapour and liquid moisture transport model for
porous materials implemented in CFD. Building and Environment, 81, 340-353.
https://doi.org/10.1016/j.buildenv.2014.06.024
381
Van Belleghem, M., Steeman, M., Willockx, A., Janssens, A., & De Paepe, M. (2011).
Benchmark experiments for moisture transfer modelling in air and porous
materials. Building and Environment, 46(4), 884-898.
https://doi.org/10.1016/j.buildenv.2010.10.018
van Egmond, N. D., & de Vries, H. J. M. (2011). Sustainability: The search for the
integral worldview. Futures, 43(8), 853-867.
https://doi.org/10.1016/j.futures.2011.05.027
van Stijn, A., & Gruis, V. (2019). Towards a circular built environment: An integral
design tool for circular building components. Smart and Sustainable Built
Environment, ahead-of-print(ahead-of-print). https://doi.org/10.1108/sasbe-
05-2019-0063
Velasco, S., Román, F. L., & White, J. A. (2009). On the Clausius–Clapeyron vapor
pressure equation. Journal of Chemical Education, 86(1), 106.
https://doi.org/10.1021/ed086p106
Verbist, M., Nunes, L., Jones, D., & Branco, J. M. (2019). Service life design of timber
structures. In B. Ghiassi & P. B. Lourenço (Eds.), Long-term performance and
durability of masonry structures (pp. 311-336). Woodhead Publishing.
https://doi.org/10.1016/B978-0-08-102110-1.00011-X
Vereecken, E., Roels, S., & Janssen, H. (2011). In situ determination of the moisture
buffer potential of room enclosures. Journal of Building Physics, 34(3), 223-246.
https://doi.org/10.1177/1744259109358268
Vereecken, E., Van Gelder, L., Janssen, H., & Roels, S. (2015). Interior insulation for wall
retrofitting – a probabilistic analysis of energy savings and hygrothermal risks.
Energy and Buildings, 89, 231-244.
https://doi.org/10.1016/j.enbuild.2014.12.031
382
Vereecken, E., Vanoirbeek, K., & Roels, S. (2015a). A preliminary evaluation of mould
prediction models based on laboratory experiments. Energy Procedia, 78, 1407-
1412. https://doi.org/10.1016/j.egypro.2015.11.162
Vereecken, E., Vanoirbeek, K., & Roels, S. (2015b). Towards a more thoughtful use of
mould prediction models: A critical view on experimental mould growth
research. Journal of Building Physics, 39(2), 102-123.
https://doi.org/10.1177/1744259115588718
Victoria University of Wellington. (n.d.). Study at Victoria, programmes and courses.
New Zealand. Retrieved August 02, 2019 from
https://www.victoria.ac.nz/study/programmes-courses
Viitanen, H., Krus, M., Ojanen, T., Eitner, V., & Zirkelbach, D. (2015). Mold risk
classification based on comparative evaluation of two established growth
models. Energy Procedia, 78, 1425-1430.
https://doi.org/10.1016/j.egypro.2015.11.165
Viitanen, H., & Ojanen, T. (2007). Improved model to predict mold growth in building
materials [Paper presentation]. Proceedings of the Thermal Performance of the
Exterior Envelopes of Whole Building X, Florida, USA. https://bit.ly/2YNcile
Viitanen, H., Ojanen, T., Peuhkuri, R., Vinha, J., Lähdesmäki, K., & Salminen, K. (2011).
Mould growth modelling to evaluate durability of materials. In V. P. de Freitas,
H. Corvacho, & M. Lacasse (Eds.), XII DBMC 12th international conference on
durability of building materials and components, 12th - 15th april 2011, Porto,
Portugal (Vol. 1, pp. 409-416). FEUP Edicoes (Faculdade de Engenharia da
Universidade do Porto Edicoes).
Viitanen, H., Toratti, T., Makkonen, L., Peuhkuri, R., Ojanen, T., Ruokolainen, L., &
Räisänen, J. (2010). Towards modelling of decay risk of wooden materials.
European Journal of Wood and Wood Products, 68(3), 303-313.
https://doi.org/10.1007/s00107-010-0450-x
383
Viitanen, H., Vinha, J., Salminen, K., Ojanen, T., Peuhkuri, R., Paajanen, L., &
Lähdesmäki, K. (2010). Moisture and bio-deterioration risk of building materials
and structures. Journal of Building Physics, 33(3), 201-224.
https://doi.org/10.1177/1744259109343511
Vinha, J., Salminen, M., Salminen, K., Kalamees, T., Kurnitski, J., & Kiviste, M. (2018).
Internal moisture excess of residential buildings in finland. Journal of Building
Physics, 42(3), 239-258. https://doi.org/10.1177/1744259117750369
Vololonirina, O., Coutand, M., & Perrin, B. (2014). Characterization of hygrothermal
properties of wood-based products – impact of moisture content and
temperature. Construction and Building Materials, 63, 223-233.
https://doi.org/10.1016/j.conbuildmat.2014.04.014
Vos, B. H. (1969). Internal condensation in structures. Building Science, 3(4), 191-206.
https://doi.org/10.1016/0007-3628(69)90015-2
Wagner, W., & Pruß, A. (2002). The IAPWS formulation 1995 for the thermodynamic
properties of ordinary water substance for general and scientific use. Journal of
Physical and Chemical Reference Data, 31(2), 387-535.
https://doi.org/10.1063/1.1461829
Waldrop, M. (2016). More than more. Nature, 530, 144.
https://doi.org/10.1038/530144a
Walls, K. L., Benke, G. R., & Kingham, S. R. (2014). Potential increased radon exposure
due to greater building energy-efficiency for climate change mitigation. Air
Quality & Climate Change, 48(1), 16-22.
Wan, H., Sun, Z., Huang, G., Xu, X., & Yu, J. (2019). Calculation of the maximum
moisture buffering thickness of building wall layer of hygroscopic material.

384
Building and Environment, 160, 106173.
https://doi.org/10.1016/j.buildenv.2019.106173
Wan, H., Xu, X., Gao, J. J., & Li, A. (2017). A moisture penetration depth model of
building hygroscopic material. Procedia Engineering, 205, 3235-3242.
https://doi.org/10.1016/j.proeng.2017.10.299
Wan, H., Xu, X., & Li, A. (2017). Application analysis of theoretical moisture penetration
depths of conventional building material. Advances in Mechanical Engineering,
9(5), 1-10. https://doi.org/10.1177/1687814017699803
Wang, H., Pan, Y., & Luo, X. (2019). Integration of BIM and GIS in sustainable built
environment: A review and bibliometric analysis. Automation in Construction,
103, 41-52. https://doi.org/10.1016/j.autcon.2019.03.005
Wang, J., Zhao, Z., Zhang, Y., Li, B., Huang, C., Zhang, X., Deng, Q., Lu, C., Qian, H., Yang,
X., Sun, Y., Sundell, J., & Norbäck, D. (2019). Asthma, allergic rhinitis and
eczema among parents of preschool children in relation to climate, and
dampness and mold in dwellings in China. Environment International, 130,
104910. https://doi.org/10.1016/j.envint.2019.104910
Wang, J. C. Y., Jiang, Z., & Haghighat, F. (1991). Influence of air infiltration on airflow in
a ventilated isothermal two-zone enclosure. Energy and Buildings, 17(1), 43-54.
https://doi.org/10.1016/0378-7788(91)90070-J
Weber, R. (2004). Editor's comments: The rhetoric of positivism versus interpretivism:
A personal view. MIS quarterly, iii-xii.
Weerasuriya, A. U., Zhang, X., Gan, V. J. L., & Tan, Y. (2019). A holistic framework to
utilize natural ventilation to optimize energy performance of residential high-
rise buildings. Building and Environment, 153, 218-232.
https://doi.org/10.1016/j.buildenv.2019.02.027
385
Welle, B., Rogers, Z., & Fischer, M. (2012). BIM-centric daylight profiler for simulation
(bdp4sim): A methodology for automated product model decomposition and
recomposition for climate-based daylighting simulation. Building and
Environment, 58, 114-134. https://doi.org/10.1016/j.buildenv.2012.06.021
West Health Institute. (2013). The value of medical device interoperability: Improving
patient care with more than $30 billion in annual health care savings.
https://bit.ly/2T2lSxb
White, V., Jones, M., Cowan, V., & Chun, S. (2017). BRANZ 2015 house condition
survey: Comparison of house condition by tenure. BRANZ study report SR370.
Judgeford, New Zealand.
Wilber, K. (1993). The spectrum of consciousness (2. ed.). Quest Books Theosophical
Publishing House. (1977)
Wilber, K. (2000a). Sex, ecology, spirituality: The spirit of evolution (2. ed.). Shambhala
Publications. (1995)
Wilber, K. (2000b). A theory of everything : An integral vision for business, politics,
science and spirituality. Gateway.
Wilber, K. (2007). Integral spirituality: A startling new role for religion in the modern
and postmodern world. Shambhala Publications.
Wilber, K. (2014a). The five elements of AQAL [Video]. Integral Life.
https://www.youtube.com/watch?v=ZVX1g1rk7WM
Wilber, K. (2014b, October 28, 2014). What are the four quadrants? Retrieved May 21,
2020 from https://integrallife.com/four-quadrants/
386
Wilber, K. (2019). Realism and idealism in integral theory. In M. Schwartz & S. Esbjörn-
Hargens (Eds.), Dancing with Sophia integral philosophy on the verge (pp. 457-
472). State University of New York Press.
Williamson, M. (2009). Review reinforces government action on weathertightness.
Beehive.govt.nz, The official website of the New Zealand Government
Retrieved January 25, 2020 from https://bit.ly/2Lp4C0I
Wingfield, J., Bell, M., Miles-Shenton, D., & Seavers, J. (2011). Elm Tree Mews field trial
– evaluation and monitoring of dwellings, final technical report. Leeds
Metropolitan University. https://bit.ly/2SPGsAB
Winkler, J., Munk, J., & Woods, J. (2018). Effect of occupant behavior and air-
conditioner controls on humidity in typical and high-efficiency homes. Energy
and Buildings, 165, 364-378. https://doi.org/10.1016/j.enbuild.2018.01.032
Winkler, M., Nore, K., & Antretter, F. (2014). Impact of the moisture buffering effect of
wooden materials on energy demand and comfort conditions. In J. Arfvidsson
(Ed.), 10th Nordic Symposium on Building Physics: Full papers - NSB 2014 (pp.
483-491). Lund University. http://publica.fraunhofer.de/dokumente/N-
323922.html
Winsberg, E. (2003). Simulated experiments: Methodology for a virtual world.
Philosophy of Science, 70(1), 105-125. https://doi.org/10.1086/367872
Winsberg, E. (2010). Science in the age of computer simulation. University of Chicago
Press.
Winter, G. (2000). A comparative discussion of the notion of'validity'in qualitative and
quantitative research. The Qualitative Report, 4(3), 1-14.
http://nsuworks.nova.edu/tqr/vol4/iss3/4

387
Wolkoff, P. (2018a). Indoor air humidity, air quality, and health – an overview.
International Journal of Hygiene and Environmental Health, 221(3), 376-390.
https://doi.org/10.1016/j.ijheh.2018.01.015
Wolkoff, P. (2018b). The mystery of dry indoor air – an overview. Environment
International, 121, 1058-1065. https://doi.org/10.1016/j.envint.2018.10.053
Wolkoff, P., & Kjærgaard, S. K. (2007). The dichotomy of relative humidity on indoor air
quality. Environment International, 33(6), 850-857.
https://doi.org/10.1016/j.envint.2007.04.004
Woloszyn, M., Kalamees, T., Olivier Abadie, M., Steeman, M., & Sasic Kalagasidis, A.
(2009). The effect of combining a relative-humidity-sensitive ventilation system
with the moisture-buffering capacity of materials on indoor climate and energy
efficiency of buildings. Building and Environment, 44(3), 515-524.
https://doi.org/10.1016/j.buildenv.2008.04.017
Woloszyn, M., & Rode, C. (2008). Tools for performance simulation of heat, air and
moisture conditions of whole buildings. Building Simulation, 1(1), 5-24.
https://doi.org/10.1007/s12273-008-8106-z
Woods, J., & Winkler, J. (2018). Effective moisture penetration depth model for
residential buildings: Sensitivity analysis and guidance on model inputs. Energy
and Buildings, 165, 216-232. https://doi.org/10.1016/j.enbuild.2018.01.040
Woods, J., Winkler, J., & Christensen, D. (2013). Evaluation of the effective moisture
penetration depth model for estimating moisture buffering in buildings
[Technical report NREL/TP-5500-57441]. National Renewable Energy
Laboratory (NREL).
World Health Organization. (2018). WHO housing and health guidelines.
388
Wu, Y., Gong, G., Yu, C. W., & Huang, Z. (2015). Proposing ultimate moisture buffering
value (UMBV) for characterization of composite porous mortars. Construction
and Building Materials, 82, 81-88.
https://doi.org/10.1016/j.conbuildmat.2015.02.058
Wu, Z., Qin, M., & Zhang, M. (2018). Phase change humidity control material and its
impact on building energy consumption. Energy and Buildings, 174, 254-261.
https://doi.org/10.1016/j.enbuild.2018.06.036
Xie, H., Gong, G., Wu, Y., Liu, Y., & Wang, Y. (2018). Research on the hygroscopicity of a
composite hygroscopic material and its influence on indoor thermal and
humidity environment. Applied Sciences, 8(3), 430, Article 430.
https://doi.org/10.3390/app8030430
Xing, F., Mohotti, D., & Chauhan, K. (2018). Study on localised wind pressure
development in gable roof buildings having different roof pitches with
experiments, rans and les simulation models. Building & Environment, 143,
240-257. https://doi.org/10.1016/j.buildenv.2018.07.026
Xun, X. (2009). Integrating advanced computer-aided design, manufacturing, and
numerical control: Principles and implementations. IGI Global.
https://doi.org/10.4018/978-1-59904-714-0
Yan, W., Clayton, M., Haberl, J., WoonSeong, J., Bun Kim, J., Sandeep, K., Bermudez, J.,
& Dixit, M. (2013). Interfacing BIM with building thermal and daylighting
modeling. In E. Wurtz (Ed.), Proceedings of BS2013: 13th Conference of
International Building Performance Simulation Association, Chambéry, France,
August 26-28 (Vol. 13, pp. 3521-3528). IBPSA. https://bit.ly/2AoMySp
Yarbrough, D. W., Bomberg, M., & Romanska-Zapala, A. (2019). Buildings with
environmental quality management, part 3: From log houses to environmental
quality management zero-energy buildings. Journal of Building Physics, 42(5),
672-691. https://doi.org/10.1177/1744259118786758
389
Yavari, F., Khajehzadeh, I., & Vale, B. (2018). Design options for an ageing New Zealand
population: A life cycle energy (LCE) analysis. Energy and Buildings, 166, 1-22.
https://doi.org/10.1016/j.enbuild.2018.01.027
Yigit, S., & Ozorhon, B. (2018). A simulation-based optimization method for designing
energy efficient buildings. Energy and Buildings, 178, 216-227.
https://doi.org/10.1016/j.enbuild.2018.08.045
Yin, R. K. (2017). Case study research and applications: Design and methods (6. ed.).
SAGE Publications. (1984)
Yosun, Y., Dongwoo, C., & Changu, C. (2018). Analysis of green building certification
system for developing g-seed: Focusing on the comparison of leed and breeam.
Future Cities & Environment, 4(1), 1-9. https://doi.org/10.5334/fce.37
Yu, S., Bomberg, M., & Zhang, X. (2012). Integrated methodology for evaluation of
energy performance of the building enclosures: Part 4-material characterization
for input to hygrothermal models. Journal of Building Physics, 35(3), 194-212.
https://doi.org/10.1177/1744259111420071
Yu, S., Bomberg, M., & Zhang, X. (2012). Integrated methodology for evaluation of
energy performance of the building enclosures: Part 5—application of the
proposed hygrothermal characterization. Journal of Building Physics, 36(2),
178-197. https://doi.org/10.1177/1744259112453818
Yu, S., Cui, Y., Shao, Y., & Han, F. (2019). Simulation research on the effect of coupled
heat and moisture transfer on the energy consumption and indoor
environment of public buildings. Energies, 12(1), 141, Article en12010141.
https://doi.org/10.3390/en12010141
Zach, J., Korjenic, A., Petránek, V., Hroudová, J., & Bednar, T. (2012). Performance
evaluation and research of alternative thermal insulations based on sheep
390
wool. Energy and Buildings, 49, 246-253.
https://doi.org/10.1016/j.enbuild.2012.02.014
Zakula, T., Bagaric, M., Ferdelji, N., Milovanovic, B., Mudrinic, S., & Ritosa, K. (2019).
Comparison of dynamic simulations and the ISO 52016 standard for the
assessment of building energy performance. Applied Energy, 254, 113553.
https://doi.org/10.1016/j.apenergy.2019.113553
Zari, M. P. (2014). Ecosystem services analysis in response to biodiversity loss caused
by the built environment. Sapiens, 7(1), 1-14.
http://journals.openedition.org/sapiens/1684
Zeiler, W. (2011). Integral design instead of integrative design between engineering
and architecture. IUP Journal of Architecture, 44-63.
Zeiler, W. (2015). Integral design: The new roles for architect and engineers for
developing nearly zero energy buildings. International Journal of Innovation
and Sustainable Development, 9(2), 137-156.
https://doi.org/10.1504/IJISD.2015.068786
Zeinelabdein, R., Omer, S., & Gan, G. (2018). Critical review of latent heat storage
systems for free cooling in buildings. Renewable and Sustainable Energy
Reviews, 82, 2843-2868. https://doi.org/10.1016/j.rser.2017.10.046
Zhang, H., Yoshino, H., Hasegawa, K., Liu, J., Zhang, W., & Xuan, H. (2017). Practical
moisture buffering effect of three hygroscopic materials in real-world
conditions. Energy and Buildings, 139, 214-223.
https://doi.org/10.1016/j.enbuild.2017.01.021
Zhang, M., Qin, M., Rode, C., & Chen, Z. (2017). Moisture buffering phenomenon and
its impact on building energy consumption. Applied Thermal Engineering, 124,
337-345. https://doi.org/10.1016/j.applthermaleng.2017.05.173

391
Zhang, W., Villarini, G., & Wehner, M. (2019). Contrasting the responses of extreme
precipitation to changes in surface air and dew point temperatures. Climatic
Change, 154(1), 257-271. https://doi.org/10.1007/s10584-019-02415-8
Zhang, X., Sahlberg, B., Wieslander, G., Janson, C., Gislason, T., & Norback, D. (2012).
Dampness and moulds in workplace buildings: Associations with incidence and
remission of sick building syndrome (sbs) and biomarkers of inflammation in a
10 year follow-up study. Science of The Total Environment, 430, 75-81.
https://doi.org/10.1016/j.scitotenv.2012.04.040
Zhang, Y., Xiong, J., Mo, J., Gong, M., & Cao, J. (2015). Understanding and controlling
airborne organic compounds in the indoor environment: Mass transfer analysis
and applications. Indoor Air, 26(1), 39-60. https://doi.org/10.1111/ina.12198
Zheng, H., Liu, W., & Xiao, C. (2018). Structural relationship model for design defect
and influencing factors in the concurrent design process. International Journal
of Production Research, 56(14), 4897-4924.
https://doi.org/10.1080/00207543.2018.1447704
Zheng, X., Lu, Y., Li, Y., Le, Y., & Xiao, J. (2019). Quantifying and visualizing value
exchanges in building information modeling (BIM) projects. Automation in
Construction, 99, 91-108. https://doi.org/10.1016/j.autcon.2018.12.001
Zidane, Y. J. T., Stordal, K. B., Johansen, A., & Van Raalte, S. (2015). Barriers and
challenges in employing of concurrent engineering within the norwegian
construction projects. Procedia Economics and Finance, 21, 494-501.
https://doi.org/10.1016/S2212-5671(15)00204-X
Zimmer, A. T., & Ha, H. (2017). People, planet and profit: Unintended consequences of
legacy building materials. Journal of Environmental Management, 204, 472-
485. https://doi.org/10.1016/j.jenvman.2017.09.026

392
Zirkelbach, D. (2013). Hygrothermische simulation–anwendungsmöglichkeiten für
planer und sachverständige [Paper presentation in German]. 12. Internationale
Baufach- und Sachverständigentagung Ausbau und Fassade, Regensburg,
Germany. https://bit.ly/2SQROnZ
Zou, P. X. W., Wagle, D., & Alam, M. (2019). Strategies for minimizing building energy
performance gaps between the design intend and the reality. Energy and
Buildings, 191, 31-41. https://doi.org/10.1016/j.enbuild.2019.03.013

393
Appendix A Blower Door Test Results for Test House and Control House

394
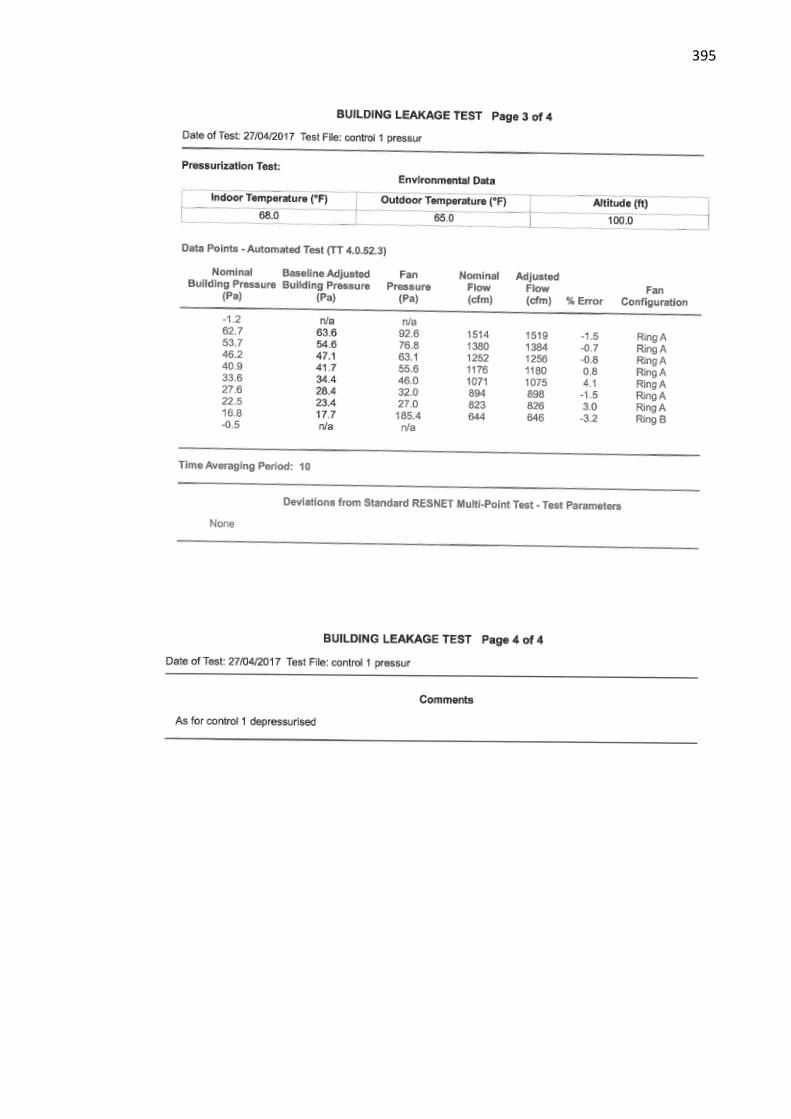
395

396
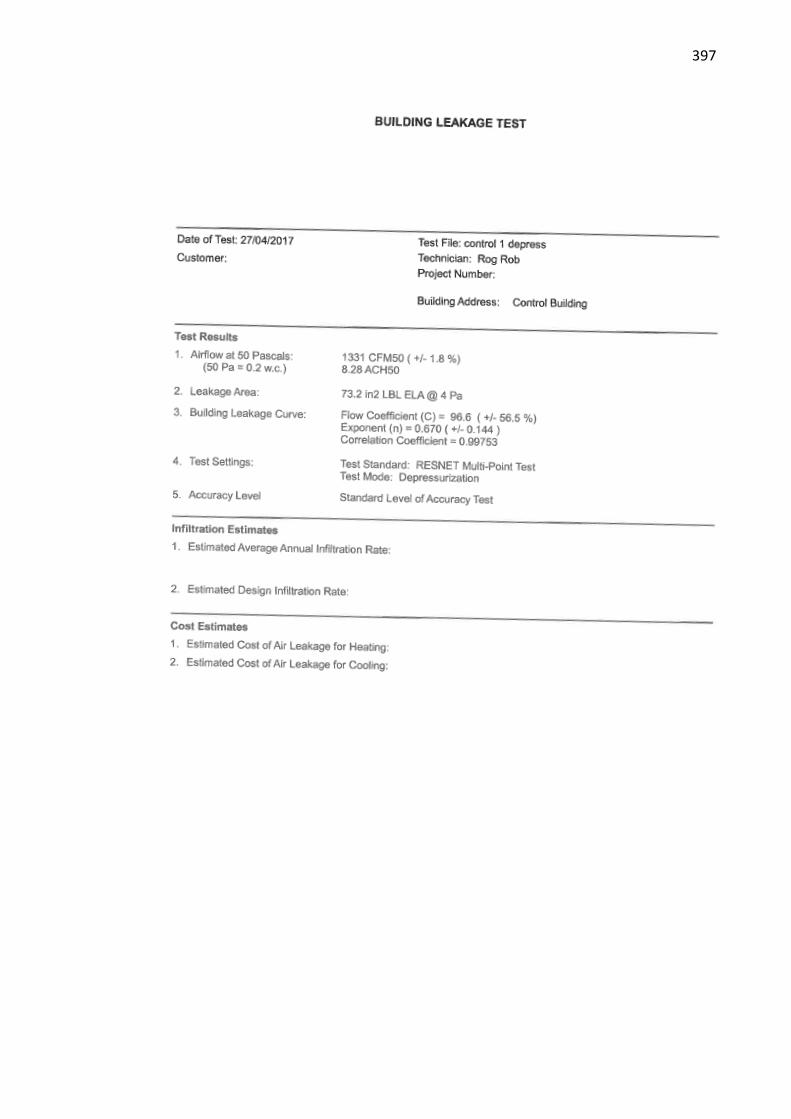
397

398
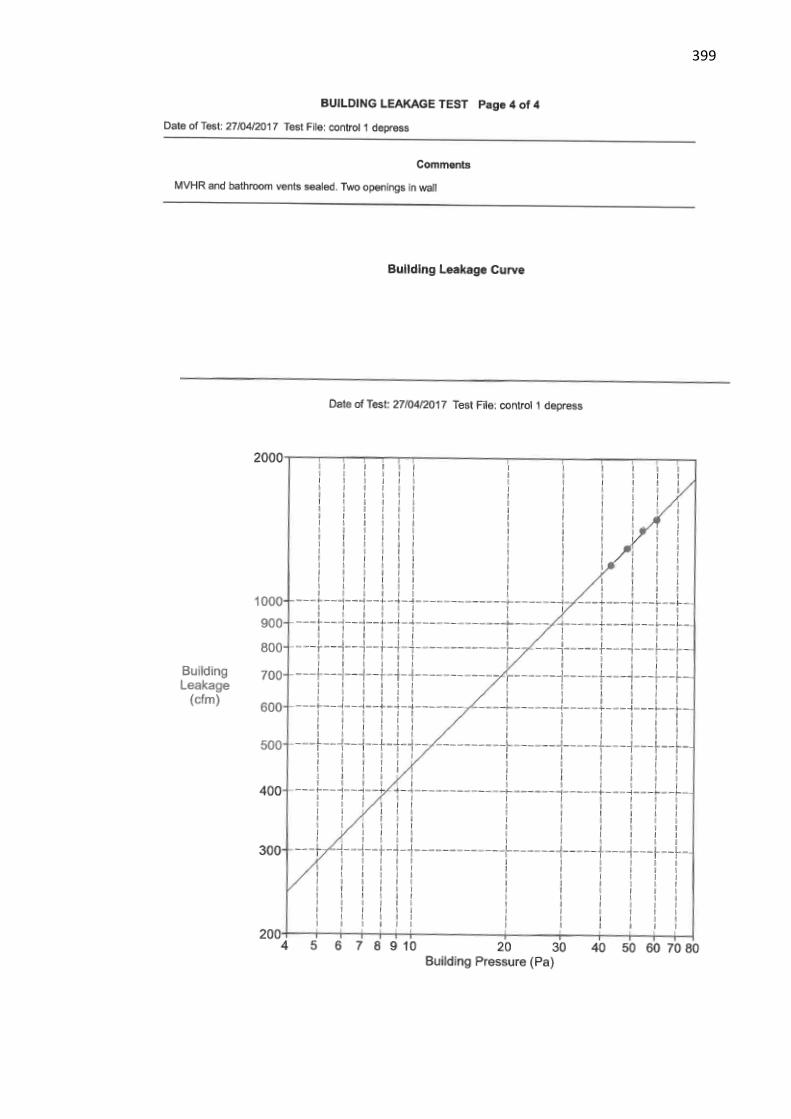
399
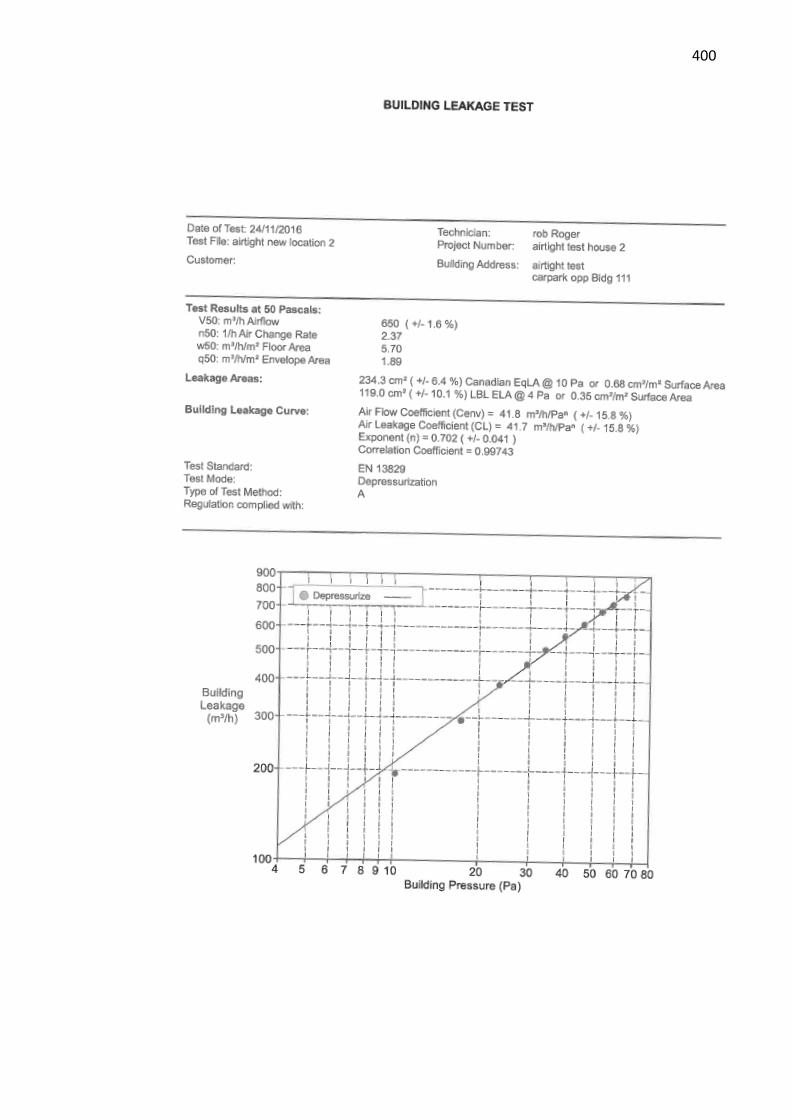
400

401

402
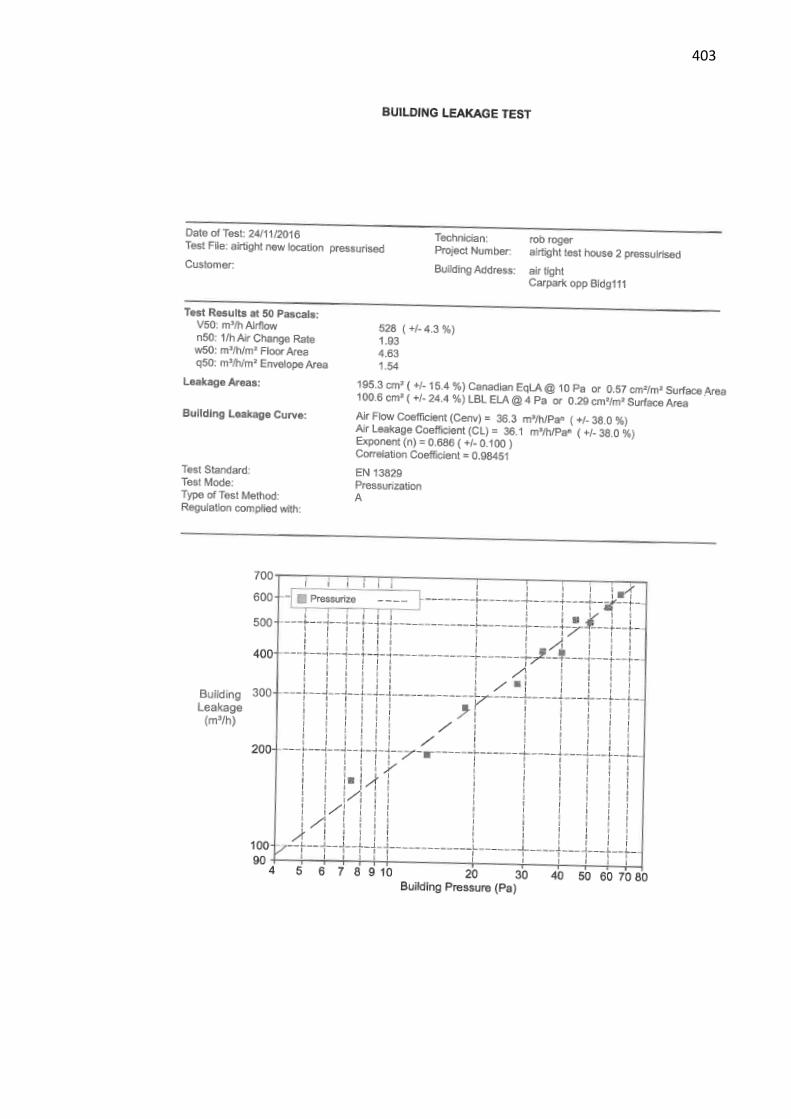
403

404

405

406
Appendix B MgO Boards Laboratory Test Report
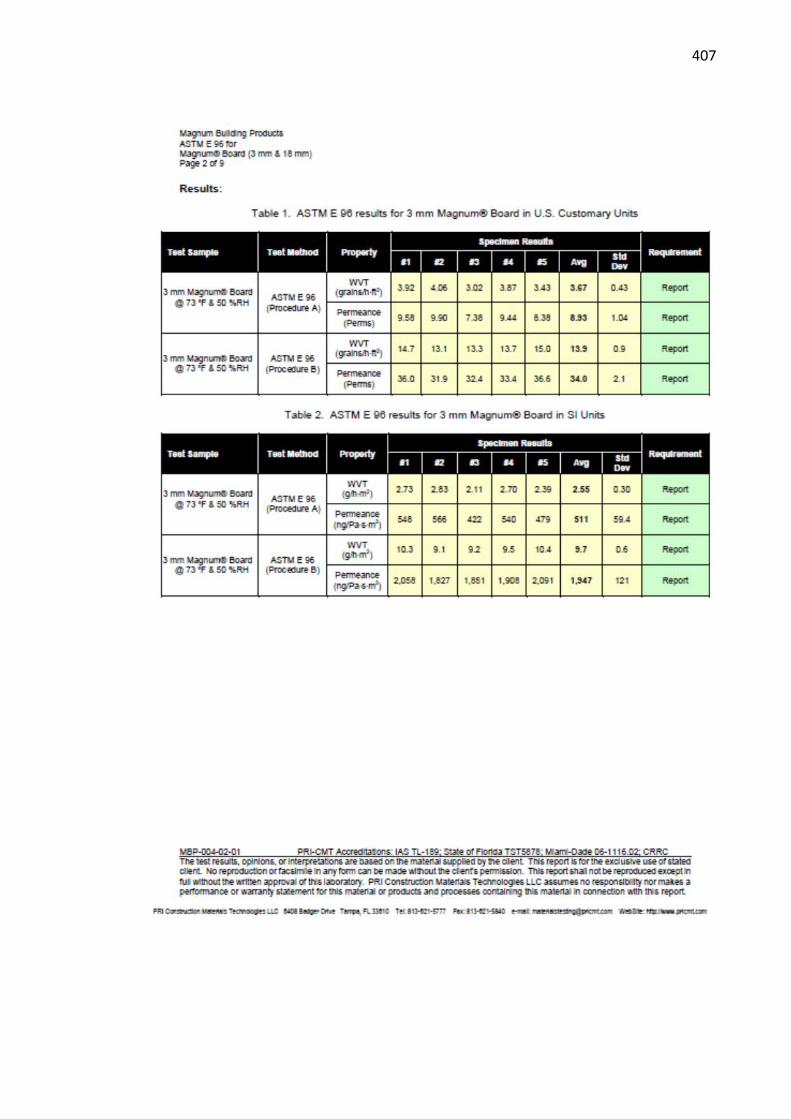
407

408
409

410

411

412
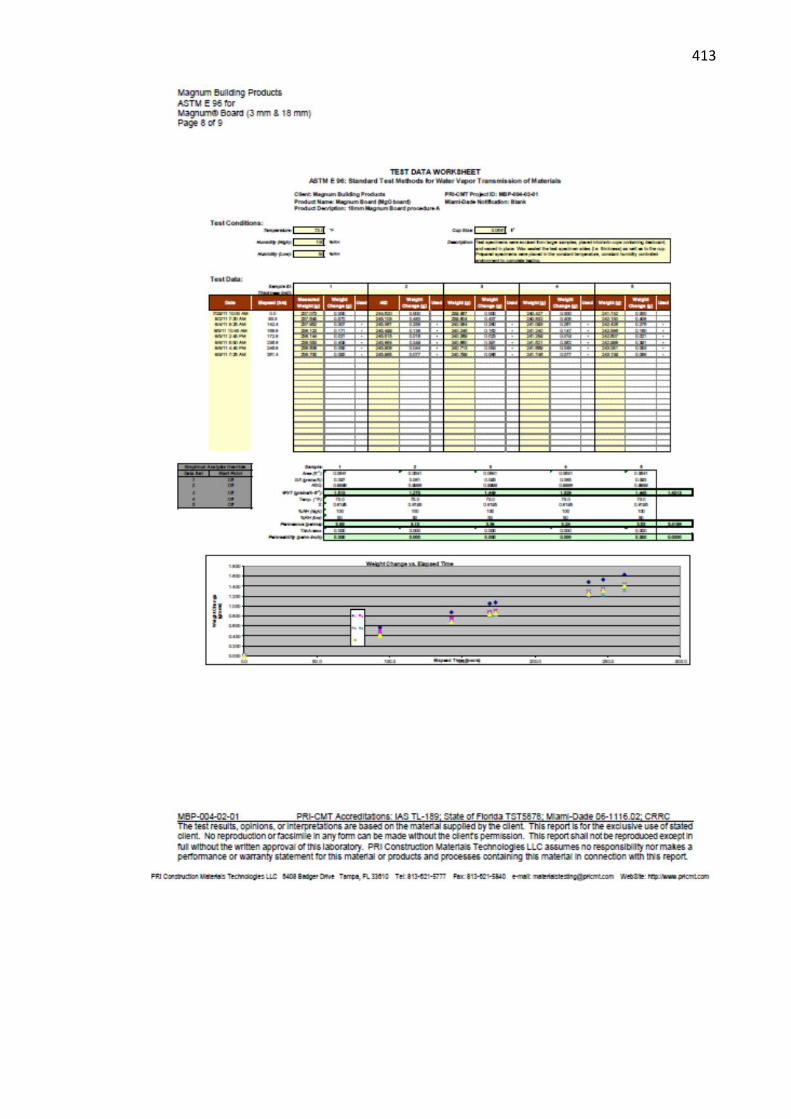
413
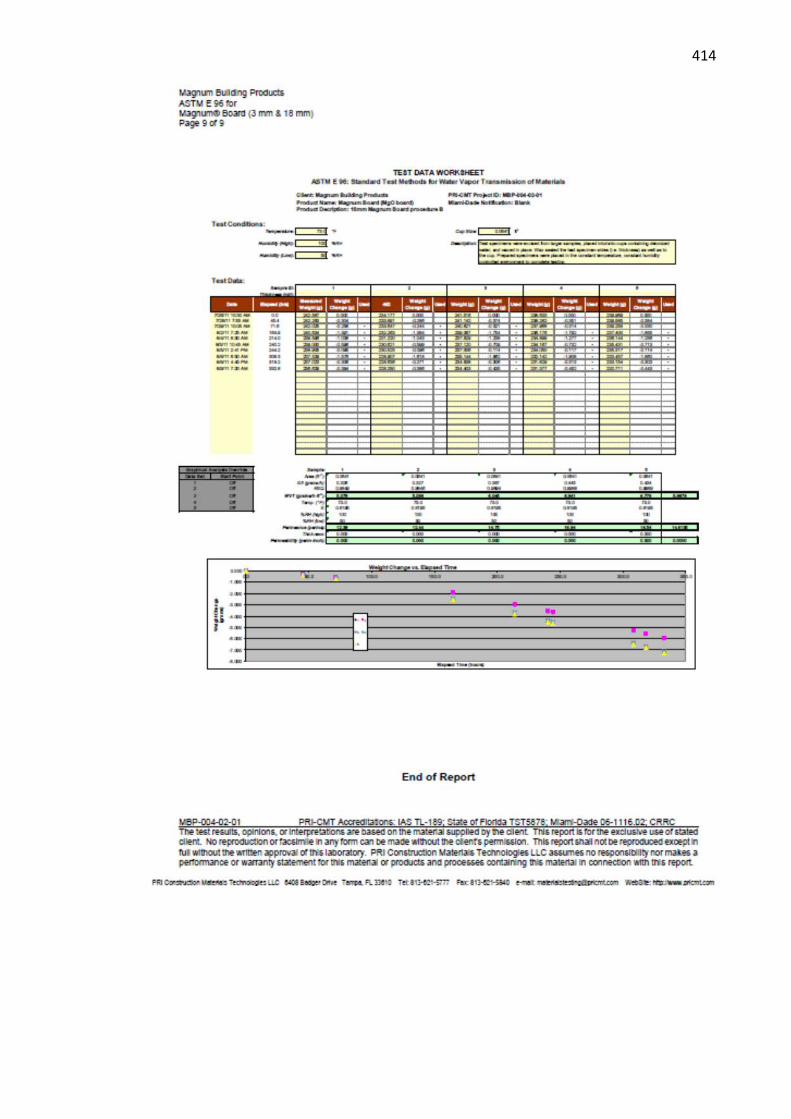
414
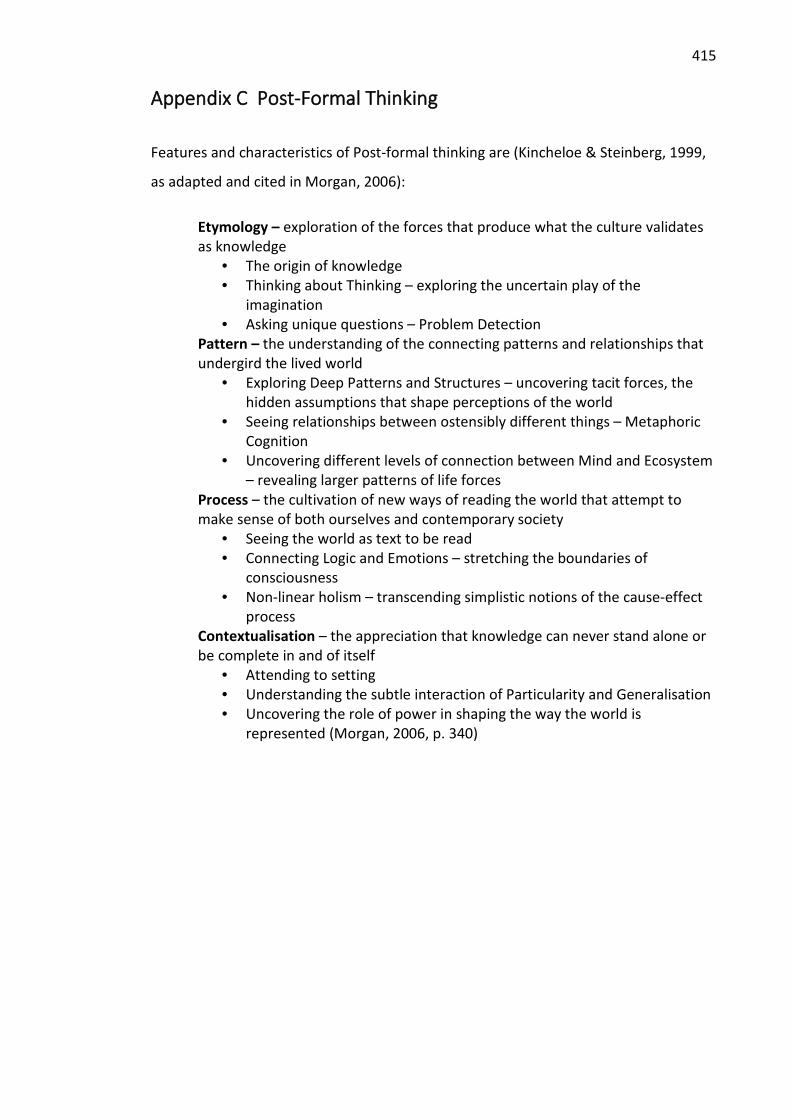
415
Appendix C Post-Formal Thinking
Features and characteristics of Post-formal thinking are (Kincheloe & Steinberg, 1999,
as adapted and cited in Morgan, 2006):
Etymology – exploration of the forces that produce what the culture validates as knowledge
• The origin of knowledge • Thinking about Thinking – exploring the uncertain play of the
imagination • Asking unique questions – Problem Detection
Pattern – the understanding of the connecting patterns and relationships that undergird the lived world
• Exploring Deep Patterns and Structures – uncovering tacit forces, the hidden assumptions that shape perceptions of the world
• Seeing relationships between ostensibly different things – Metaphoric Cognition
• Uncovering different levels of connection between Mind and Ecosystem – revealing larger patterns of life forces
Process – the cultivation of new ways of reading the world that attempt to make sense of both ourselves and contemporary society
• Seeing the world as text to be read • Connecting Logic and Emotions – stretching the boundaries of
consciousness • Non-linear holism – transcending simplistic notions of the cause-effect
process Contextualisation – the appreciation that knowledge can never stand alone or be complete in and of itself
• Attending to setting • Understanding the subtle interaction of Particularity and Generalisation • Uncovering the role of power in shaping the way the world is
represented (Morgan, 2006, p. 340)