developing a poverty map for indonesia: an initiatory work...
TRANSCRIPT

Research Coordinator:
Asep Suryahadi
Team Leader:
Agus Priyambada
Field Research Team:
Syaikhu Usman
Sri Kusumastuti Rahayu
Sri Budiyati
Nina Toyamah
Hastuti
Akhmadi
Wawan Munawar
Alexander Arifiyanto
Vita Febriany
Dedi Waluyadi
Uzair Suhaimi
Abdul Kahar
Siti Muchlisoh
May 2003
The findings, views, and interpretations published in this report are those ofthe authors and should not be attributed to the SMERU Research Instituteor any of the agencies providing financial support to SMERU.For further information, please contact SMERU, Phone: 62-21-336336;Fax: 62-21-330850; E-mail: [email protected]; Web: www.smeru.or.id
Research Report
Part III: Field Verification

Developing a Poverty Map for Indonesia:Developing a Poverty Map for Indonesia:Developing a Poverty Map for Indonesia:Developing a Poverty Map for Indonesia: An Initiatory Work in Three ProvincesAn Initiatory Work in Three ProvincesAn Initiatory Work in Three ProvincesAn Initiatory Work in Three Provinces
Research Coordinator: Asep Suryahadi
Team Leader:
Agus Priyambada
Field Research Team: Syaikhu Usman
Sri Kusumastuti Rahayu Sri Budiyati
Nina Toyamah Hastuti
Akhmadi Wawan Munawar
Alexander Arifiyanto Vita Febriany
Dedi Waluyadi Uzair Suhaimi Abdul Kahar
Siti Muchlisoh
Part III: Field Verification
The SMERU Research Institute & BPS Jakarta
May 2003
The SMERU Research Institute, May 2003 iiii
Table of ContentsTable of ContentsTable of ContentsTable of Contents Abstract ii
I. Introduction 1
II. Verification Method 3
III. Field Verification for Jakarta 4 A. Sample Areas 4 B. Verification Results 4
a. District Level 4 b. Subdistrict Level 5 c. Village Level 7
Kembangan Subdistrict 7 Tambora Subdistrict 9
IV. Field Verification for East Java 13 A. Sample Areas 13 B. Verification Results 14
a. District Level 14 b. Subdistrict Level 16
Gresik District 16 Tulungagung District 18 Magetan District 20
c. Village Level 21 Bungah Subdistrict in Gresik 21 Panceng Subdistrict in Gresik 22 Ngantru Subdistrict in Tulungagung 24 Kauman Subdistrict in Tulungagung 25 Maospati Subdistrict in Magetan 27 Panekan Subdistrict in Magetan 29
V. Field Verification for East Kalimantan 35 A. Sample Areas 35 B. Verification Results 36
a. District Level 36 b. Subdistrict Level 38
East Kutai District 38 West Kutai District 39
c. Village Level 41 Sengatta Subdistrict in East Kutai 41 Sangkulirang Subdistrict in East Kutai 43 Long Iram Subdistrict in West Kutai 45 Muara Pahu Subdistrict in West Kutai 47
VI. Conclusion 51

The SMERU Research Institute, May 2003 iiiiiiii
DevelopinDevelopinDevelopinDeveloping a Poverty Map for Indonesia:g a Poverty Map for Indonesia:g a Poverty Map for Indonesia:g a Poverty Map for Indonesia: An Initiatory Work in Three ProvincesAn Initiatory Work in Three ProvincesAn Initiatory Work in Three ProvincesAn Initiatory Work in Three Provinces
AbstractAbstractAbstractAbstract
This report presents the field verification results for poverty maps of Jakarta, East Java, and East Kalimantan. The results show that the poverty maps created in this pilot study have been successful in ranking regions according to their poverty conditions, particularly at the district and subdistrict levels. At the village level, however, the presence of relatively large standard errors of the poverty rate point estimates in a significant number of villages makes it more difficult to determine with certainty the ordering of villages by poverty incidence. This implies that every poverty mapping exercise should attempt to attain the lowest possible magnitudes of standard errors. However, there is a practical limit to the effort to reduce the standard errors. Therefore, one may want to use the poverty mapping results only up to the level where the standard errors are reasonably acceptable. For this particular study, it seems that one can use the poverty mapping results down to the subdistrict level with reasonable confidence.
The SMERU Research Institute, May 2003 1111
I. IntroductionI. IntroductionI. IntroductionI. Introduction
The detailed poverty maps over small administrative areas, which are the main output of this pilot study, provide several benefits in the efforts to reduce poverty. The most obvious benefit is that poverty maps can capture the heterogeneity of poverty within a country. Almost all countries in the world have regions that are better off and others that are left behind. Such differences often get washed out in national level statistics – a problem that is particularly critical in very large and heterogeneous countries such as Indonesia. A poverty map can reveal the variation in local poverty levels and, therefore, can show a large degree of local heterogeneity at the province, district, subdistrict, or village level in seemingly homogeneous regions.
As a result, the availability of poverty maps can be used to improve targeting of intervention. This means that in designing poverty reduction programs, resources can be used more effectively. If the most needy groups can be more accurately targeted, it will reduce the leakage of benefits from poverty reduction programs to non-poor people, and vice versa it will reduce the risk that poor people will be excluded from programs.
By basing allocation decisions on observed geographic poverty data, rather than subjective rankings of regions, poverty maps increase the transparency of government decision-making and can, therefore, assist governments – both national and local – to articulate their policy objectives. Well-defined poverty maps will lend credibility to government decision-making and thus help limit the influence of special interests in allocation decisions. This is particularly relevant in the context of currently decentralized Indonesia. By increasing transparency, poverty maps can help prevent regional autonomy policies from being hijacked by local elites.
Poverty maps are useful not only for governments and decision-makers, but also for local communities. Poverty maps can have an important role in communicating information on distribution of welfare to civil society within a country. Compiling disaggregated information on human welfare generates locally relevant information. This provides local stakeholders with the facts that are required for local decision-making and for negotiation with government agencies. Poverty maps thus become an important tool for local empowerment and decentralization.
Finally, poverty maps are useful in evaluating the impact of various programs. Poverty maps offer opportunities to undertake detailed empirical research on the causal relationships between local poverty, income inequality, and various other social outcomes, both at the individual and at the community level. Until now, scarcity of welfare indicators for small areas has prevented researchers from studying the relationship between various programs, poverty, inequality, and various outcomes, such as health, education, crime, and the environment. Poverty maps open up more opportunities for researchers to examine these relationships.
The realization of these great potential benefits of poverty maps, however, is dependent on the quality of the maps: that is how it reflects the actual poverty
The SMERU Research Institute, May 2003 2222
conditions in the field. Therefore, it is important to conduct field verifications of the poverty maps. This report summarizes the findings from field verification studies conducted in Jakarta, East Java, and East Kalimantan as part of the pilot study on poverty mapping in these provinces as reported in Suryahadi et al. (2003)1.
The rests of the report is organized as follows. Chapter two discusses the methods used for the field verifications. Chapter three presents the findings from the field verifications in Jakarta. Chapter four presents the findings from the field verifications in East Java. Chapter five presents the findings from the field verifications in East Kalimantan. Finally, chapter six provides overall conclusions of this field verification study.
1 Asep Suryahadi, Wenefrida Widyanti, Daniel Perwira, Sudarno Sumarto, Chris Elbers and Menno Pradhan (2003), Developing a Poverty Map for Indonesia: an Initiatory Work in Three Provinces, Part I: Technical Report and Part II: Tables of Poverty and Inequality Estimates, Research Report, The SMERU Research Institute, Jakarta.

The SMERU Research Institute, May 2003 3333
II. VerifII. VerifII. VerifII. Verification Methodication Methodication Methodication Method
The most important reason for measuring poverty is not to determine the single number of poverty rate for one place at one time, but rather to allow comparisons between poverty rates either over time or across areas.2 Therefore, in this study the poverty maps were verified qualitatively by checking whether the ordering of areas by poverty indicators obtained from the maps is supported by the actual conditions in those areas.
One district (Kabupaten/Kota) in Jakarta, three districts in East Java, and two districts in East Kalimantan were selected purposively as the research sites where the field visits were to be conducted. The three districts in East Java were selected each to represent districts with low, medium, and high level of poverty within the province. Similarly, the two districts in East Kalimantan were selected each to represent districts with low and high level of poverty within the province.
In each district, two subdistricts (Kecamatan) were selected purposively as sample, each to represent subdistricts with low and high level of poverty within a district. Finally, in each subdistrict, three villages (Desa/Kelurahan) were selected purposively as sample, each to represent villages with low, medium, and high level of poverty within a subdistrict. In some cases, however, it is not always possible to select regions with significantly different poverty levels. Field verification will test whether those regions have similar poverty conditions.
For each administrative level in all areas visited, interviews were conducted with personnel from various local government officials, poverty experts from local universities, non-governmental organization workers, the local press, to community leaders. The purpose of the interviews was to obtain qualitative assessments about the economic welfare and poverty conditions of the people in the sample areas. Based on these assessments, respondents were asked their opinions about the ordering of sample regions in terms of their poverty levels.
At the village level, in addition to conducting interviews with respondents, field researchers also made visual observations on the conditions of the villages and the villagers. In particular, the observations focused on housing conditions, cleanliness and tidiness of the neighborhoods, physical appearances of the people in general, occupations of the majority population, and conditions of village infrastructure. The purpose of these observations was to compare the condition of villages within a subdistrict. Based on these observations, the field researchers then ordered the sample villages in terms of their poverty levels and compared these rankings to the poverty mapping results.
2 Ravallion, Martin (1994), Poverty Comparisons, Fundamentals of Pure and Applied Economics Volume 56, Harwood Academic Press, Chur, Switzerland.

The SMERU Research Institute, May 2003 4444
III. Field Verification for JakartaIII. Field Verification for JakartaIII. Field Verification for JakartaIII. Field Verification for Jakarta A. Sample AreasA. Sample AreasA. Sample AreasA. Sample Areas The sample areas visited in Jakarta are shown in Table 1 at the end of this chapter. The district selected was West Jakarta. According to the poverty mapping results, this is the poorest district in Jakarta. The two subdistricts selected have markedly different point estimates of headcount poverty rates, Kembangan with a 2.8 percent poverty rate (standard error 1.6 percent) and Tambora with a 7.8 percent poverty rate (standard error 3.4 percent). The poverty rate in Tambora is statistically significantly higher than that in Kembangan at 10 percent significance level.
In Kembangan, the three villages selected were Meruya Utara with a 1.3 percent poverty rate (standard error 1.8 percent), Joglo with a 2.6 percent poverty rate (standard error 3.3 percent), and Kembangan Utara with a 4.1 percent poverty rate (standard error 4.5 percent). The point estimates suggest that Joglo is poorer than Meruya Utara and Kembangan Utara is poorer than Joglo. However, after taking into account the standard errors, the poverty rates in the three villages are not statistically significantly different from each other.
Meanwhile, in Tambora, the three villages selected were Pekojan with a 3.2 percent poverty rate (standard error 3.9 percent), Jembatan Lima with a 6.2 percent poverty rate (standard error 6.4 percent), and Kali Anyar with a 13.1 percent poverty rate (standard error 9.8 percent). Although it seems that the differences in the poverty rates across these villages are larger than those in the Kembangan subdistrict, the poverty rates in the three villages in the Tambora subdistrict are actually not statistically significantly different from each other either.
B. Verification ResultsB. Verification ResultsB. Verification ResultsB. Verification Results a. District Levela. District Levela. District Levela. District Level • City: West Jakarta
West Jakarta is 126.15 km2 in area and it consists of eight subdistricts, 56 villages, 564 RW and 6,319 RT. As of mid 2001, the population of West Jakarta was 1,565,420. The population density of 124 people per hectare makes it the second most densely populated city in the Jakarta province after Central Jakarta. Of the eight subdistricts in West Jakarta, Tambora is known as the most densely populated subdistrict with 493 people per hectare. Kembangan, on the contrary, is known as the least densely populated subdistrict in West Jakarta with density of 55 people per hectare. The most densely populated village in West Jakarta is Kalianyar with density of 923 people per hectare.
As of end 2000, there were 432,251 households in West Jakarta that occupied 303,978 houses. This implies that, in many cases, there was more than one household per house. 57.84% of houses in West Jakarta are permanent, 34.45% are

The SMERU Research Institute, May 2003 5555
semi permanent, and 7.7% are temporary houses, which are characterized by dirt floors, wooden wall, and plastic or thatched roof.
There are 2,300 large-scale industries, 1,170 medium-scale, 38,085 small-scale and 64,930 home industries in West Jakarta.
Based on the proportion of poor people according to BPS data, the rank of cities in Jakarta from the highest to the lowest poverty incidence is as follows:
1. City of North Jakarta 2. City of West Jakarta 3. City of East Jakarta 4. City of Central Jakarta 5. City of South Jakarta.
According to this list, West Jakarta is the second poorest area in Jakarta after North Jakarta. According to the poverty mapping results, however, West Jakarta is the poorest area while North Jakarta is in the second place. b. Subdistrict Levelb. Subdistrict Levelb. Subdistrict Levelb. Subdistrict Level • Subdistrict: Kembangan
Kembangan is 2,463.18 hectares in area. It consists of 6 villages (kelurahan), 61 RW and 586 RT. As of 2002, the population was 134,567 (69,195 males and 65,372 females), consisting of 35,859 families. Population density was 55 people per hectare.
In general, the people of Kembangan are considered as middle-income earners or higher, as indicated by the number of unit/door in real estate housing complexes. Overall, there are 19,541 units/doors real estate, whereas there are only 2,707 in Kembangan Utara, 3,168 in Joglo, and 4,568 in Meruya Utara.
There are 6 large-scale, 27 medium-scale, 60 small-scale and 87 home industries in the subdistrict. Kripik tempe (tempe chips) production, which also employs school-aged children in its production, and drinking water refill business are examples of home industry in Kembangan. However, the presence of these industries is less evident compared to agriculture and construction activities. As of 2001, household heads were employed in the following economic sectors: trade (36.1%), services (18.24%), industry (14.54%), agriculture (12.89%), construction (10.13%), transportation and communication (7.02%), public sector (0.43%) and other sectors (0.13%). Occupations of the Kembangan residents include traders in the local market, construction workers, security guards and mainly employees.
• Subdistrict: Tambora
Tambora is 543.85 hectares, consisting of 11 villages, 96 RW, and 1,083 RT. As of 2001, the population of Tambora was 270,319 (133,551 males and 136,768 females) consisting of 57,590 families, with a population density of 493 people per hectare.

The SMERU Research Institute, May 2003 6666
51.61% of the houses in Tambora are permanent, 32.81% semi-permanent, and 15.58% temporary. There are 940 flats but no housing estates.
There are 2,100 large-scale, 707 medium-scale, 34,031 small-scale, and 64,045 home industries. These home industries create a lot of job opportunities in Tambora with the main activities including sablon (screen-printing) and garment. The production processes of these activities are carried out in two or three-floor small semi-permanent houses with iron roof in small alleys throughout the subdistrict. Screen printing process requires 4 to 5 workers. Whereas, 10 to 15 workers usually produce garment products, making the workshop crowded. Each worker is responsible for a specific item such as button or embroidery. They work in shifts and receive low payments.
In general, the people of Tambora are considered middle or low-income earners. An ojek (motorcycles or bicycles used for public transport) driver is an example of an occupation of low-income earners. As of 2001, there were 612 motorcycles and 358 bicycle ojek riders in Tambora.
• Poverty comparison
! According to BKKBN (National Family Planning Coordinating Agency) and BPS (Statistics Indonesia), Tambora is one of eight subdistricts with the highest poverty rate in West Jakarta. On the contrary, Kembangan is considered to have a low poverty rate.
! In general, poor people do not have permanent jobs and easily change their jobs or sectors of economic activity. This phenomenon is more evident in Tambora than in Kembangan.
! Tambora has no space available for development. According to some respondents, it is the most densely populated area in South East Asia with the density of around 5,000 people per km2. Shacks occupied by many people, such that they have to take turn to sleep, are common in Tambora. One shack is sometimes occupied by two or three shifts. Due to the limited space, poor families have to arrange the schedule or activities of their family members to determine who stays in the shack. This phenomenon is not found in Kembangan where there is still some space available for development as shown by new houses and estates.
! The construction of new houses and housing estates that help local people raise their income are present only in Kembangan.
! Ojek driver, a typical job of low-income earners, is common in Tambora, but not in Kembangan.
It can thus be concluded that Tambora is less prosperous than Kembangan. This is consistent with the poverty mapping results, which shows that the poverty rate in Tambora is significantly higher than in Kembangan.

The SMERU Research Institute, May 2003 7777
c. Village Levelc. Village Levelc. Village Levelc. Village Level Kembangan Subdistrict
• Village: Meruya Utara
Meruya Utrara is 475.63 hectares in area with 11 RW and 125 RT. As of 2001, the population was 27,605 consisting of 6,830 families and the population density was 58 people per hectare.
There is only one home industry and no record of other kinds of businesses. The people of Meruya Utara are considered middle-income earners or higher. There are two housing estates: Taman Aries and Puri Kencana, and one shopping mall.
As of 2000, of the 6,408 families, there were only 26 families classified as KPS Plus (Pre Prosperous Family Plus), 272 families as KS-I alasan ekonomi (Prosperous Family I - economic reasons), 318 families as KS-I alasan non-ekonomi (Prosperous Family I – non economic reasons), 1,196 families as KS-II, 2,701 families as KS-III, and 1,896 families as KS-III Plus.
There are several shopping areas, housing estates and shop-house complexes along the main street. The presence of a mall, small offices and restaurants characterize Meruya Utara as urban.
• Village: Joglo
Joglo is 485.9 hectares in area, making it the second largest village in Kembangan, with 9 RW and 103 RT. As of 2001, the population was 23,274 people consisting of 5,547families. The population density was 48 people per hectare.
There are 3 large-scale, 2 medium-scale and 5 small-scale industries in Joglo. The people of Joglo are considered medium-income earners. There are two housing estates in Joglo: Kopilas and Taman Alfa Indah. As of 2000, there were 110 families classified as KPS Plus (Pre Prosperous Family - Plus).
The population density of Joglo is relatively high, however, the absence of either a riverbank or railroad, which usually characterize a slum area, makes the neighborhood look tidy. The main street heading to Joglo is crowded, mainly at the intersections. Around this street, there exist some stalls, which sell food, beverages and essentials to the local people. In addition, there is an ojek rank in the front of a mini market. Narrow, but clean alleys laid under the Mohammad Hoesni Thamrin program in the 1970s (MHT alleys) connect one RT with others. The local people plant vegetables on unused lands owned by private companies located in the village, also making the neighborhoods look tidy. However, Joglo is not as clean as Meruya Utara.
People are employed as civil servants, private sector employees, but mainly as traders in the market, who are considered poor. In general, these people fell into poverty as

The SMERU Research Institute, May 2003 8888
a result of the riots in May 1998 and the mass lay offs, which followed. These mass lay offs mainly hit the Joglo residents who worked in shoe factories in Tangerang, or as porters, security guards and employees in the Ramayana shopping center in Ciledug, or the Matahari shopping center in Cipulir, which went bankrupt due to the floods in 2002. They have now become ojek drivers, work on vacant land owned by private companies located in the village, or live with their parents.
• Village: Kembangan Utara
Kembangan Utara is 364.68 hectares, consisting of 9 RW and 110 RT. The Kembangan subdistrict office is located in Kembangan Utara. As of 2001, the population was 21,508 consisting of 6,673 families. The population density was 59 people per hectare.
In Kembangan Utrara, there is one big-scale, one medium-scale, 13 small-scale and 36 home industries. In general, the people of Kembangan Utara are considered middle-income earners, as indicated by the presence of 3 housing estates: Permata Buana, Media Land, and Taman Kota.
As of 2000, there were 29 families classified as KPS (Pre Prosperous Family), 664 families as KS-I, 2,479 families as KS-II, 2,157 families in KS-III, and 661 families as KS-III Plus.
The village always floods during the wet season due to a river in the village, which is higher than the residential area. The river is dirty. The main road is built on high ground, between the river and the railroad track. This is a slum area, with shacks built close to each other.
Narrow local roads made of cement or dirt connect one RT with another. The local people also make use of local roads to dry their laundry due to the lack of space in their own homes, making the neighborhood look untidy. Although the water is very dirty, some people plant vegetables on the bank of the river. In general, a toilet facility is present in every house, except in RT 4 and 6, where there are public toilet facilities.
• Poverty comparison
It can be concluded that Meruya Utara is the most prosperous area. This conclusion is based on the absence of slum areas and the presence of luxurious housing estates in Meruya Utara. Joglo is ranked second, while Kembangan Utara is the least prosperous area. This conclusion is based on the following:
! According to BKKBN and OPK/Raskin (rice for the poor) data, there are more poor people in Kembangan Utara than in Joglo.
! There are more slum areas in Kembangan Utara than in Joglo. In addition, there are many poor people occupying land illegally in Kembangan Utara.

The SMERU Research Institute, May 2003 9999
! Overall, the neighborhood in Kembangan Utara is poorly maintained. Clean water and toilet facilities are limited. These phenomena are not evident in Joglo or Meruya Utara.
! In general, people in Kembangan Utara do not have permanent jobs. They work as vegetable sellers, construction workers, and freelance workers. Unfortunately, most of the time they are unemployed.
This ranking is consistent with the poverty mapping results, which shows that Meruya Utara has the lowest poverty rate and Kembangan Utara has the highest poverty rate among the sampled villages.
Tambora Subdistrict
• Village: Pekojan
Pekojan borders on Jembatan Lima, with roads, rivers and railroads being the borders. Pekojan is 77.8 hectares in area, consisting of 12 RW and 144 RT. Pekojan is the second largest village in Tambora. The neighborhood is tidy and the river looks clean. The local roads are made of cement.
As of 2001, the population of Pekojan was 31,531, consisting of 8,666 families. Just like any other urban area, the population density is relatively high (405 people per hectare). Significant numbers of Chinese and Arabic people reside in the village. In general, they run their own businesses in the Glodok electronics center.
There are 300 large-scale, 302 medium-scale, 3,007 small-scale and 6,010 home industries. Social facilities in Pekojan include schools and health facilities. There are 10 elementary schools (4 private and 6 public), 5 junior high schools (1 public, 4 private) and 5 senior high schools (1 public, 4 private). Health facilities include 19 general practitioners, 1 polyclinic, 3 BKIA (Offices for the Welfare of Mothers and Children), 2 Puskesmas (public healthcare centers), and 12 Posyandu (Integrated Service Posts for Pregnant Women and Babies).
Office buildings, shops and hotels are present in Pekojan. Of the 3,849 buildings, 1,828 buildings (47.5%) are permanent, 1,734 (45.1%) are semi-permanent, and 287 (7.4%) are temporary. In general, the people of Pekojan can be considered middle-income earners. In 2000, of 5,460 families, there were 450 families classified as KPS, 677 families as KS-I, 2,058 families as KS-II, 1,608 families as KS-III, and 667 families as KS-III Plus. Most of the poor live in shacks on the side of the railway.
• Village: Jembatan Lima
The area of Jembatan Lima is 46.31 hectares, consisting of 8 RW and 107 RT. There are three markets in Jembatan Lima and a significant proportion of residents work in these markets as traders and porters. The village is bordered by a river and railroad tracks.
The SMERU Research Institute, May 2003 10101010
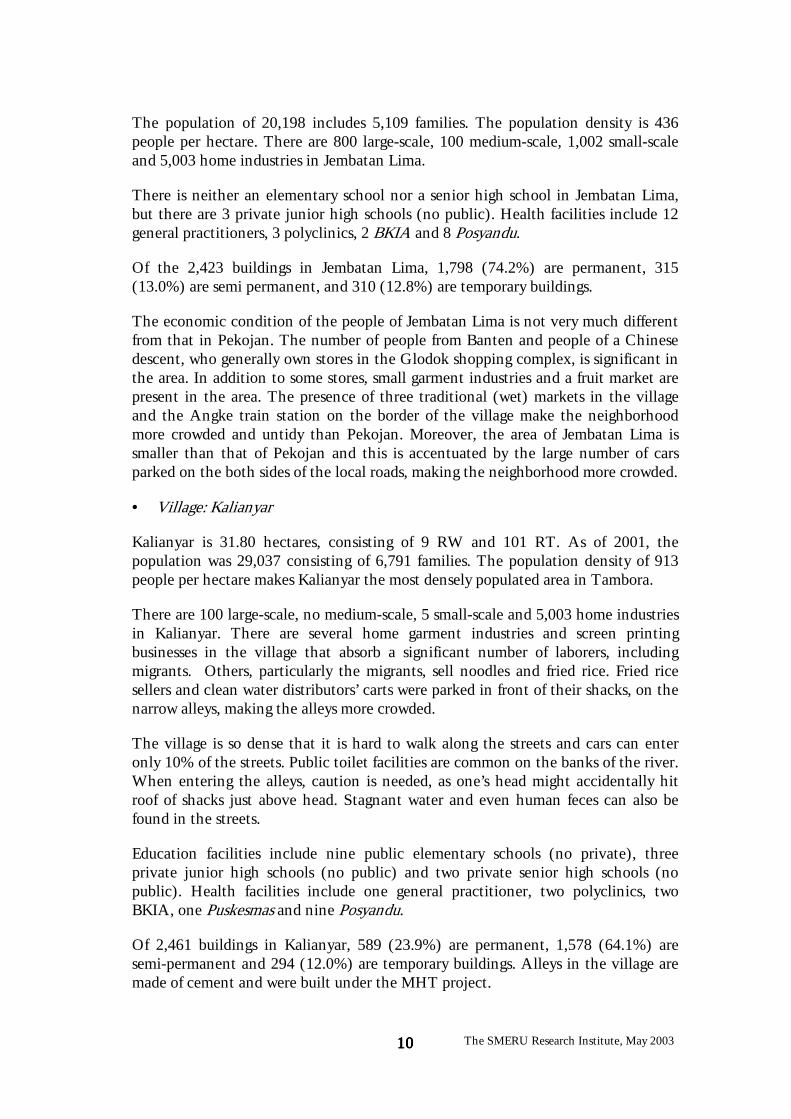
The population of 20,198 includes 5,109 families. The population density is 436 people per hectare. There are 800 large-scale, 100 medium-scale, 1,002 small-scale and 5,003 home industries in Jembatan Lima.
There is neither an elementary school nor a senior high school in Jembatan Lima, but there are 3 private junior high schools (no public). Health facilities include 12 general practitioners, 3 polyclinics, 2 BKIA and 8 Posyandu.
Of the 2,423 buildings in Jembatan Lima, 1,798 (74.2%) are permanent, 315 (13.0%) are semi permanent, and 310 (12.8%) are temporary buildings.
The economic condition of the people of Jembatan Lima is not very much different from that in Pekojan. The number of people from Banten and people of a Chinese descent, who generally own stores in the Glodok shopping complex, is significant in the area. In addition to some stores, small garment industries and a fruit market are present in the area. The presence of three traditional (wet) markets in the village and the Angke train station on the border of the village make the neighborhood more crowded and untidy than Pekojan. Moreover, the area of Jembatan Lima is smaller than that of Pekojan and this is accentuated by the large number of cars parked on the both sides of the local roads, making the neighborhood more crowded.
• Village: Kalianyar
Kalianyar is 31.80 hectares, consisting of 9 RW and 101 RT. As of 2001, the population was 29,037 consisting of 6,791 families. The population density of 913 people per hectare makes Kalianyar the most densely populated area in Tambora.
There are 100 large-scale, no medium-scale, 5 small-scale and 5,003 home industries in Kalianyar. There are several home garment industries and screen printing businesses in the village that absorb a significant number of laborers, including migrants. Others, particularly the migrants, sell noodles and fried rice. Fried rice sellers and clean water distributors’ carts were parked in front of their shacks, on the narrow alleys, making the alleys more crowded.
The village is so dense that it is hard to walk along the streets and cars can enter only 10% of the streets. Public toilet facilities are common on the banks of the river. When entering the alleys, caution is needed, as one’s head might accidentally hit roof of shacks just above head. Stagnant water and even human feces can also be found in the streets.
Education facilities include nine public elementary schools (no private), three private junior high schools (no public) and two private senior high schools (no public). Health facilities include one general practitioner, two polyclinics, two BKIA, one Puskesmas and nine Posyandu.
Of 2,461 buildings in Kalianyar, 589 (23.9%) are permanent, 1,578 (64.1%) are semi-permanent and 294 (12.0%) are temporary buildings. Alleys in the village are made of cement and were built under the MHT project.
The SMERU Research Institute, May 2003 11111111
• Poverty comparison
It can be concluded that Kalianyar is the least prosperous village compared to the other two sample villages, followed by Jembatan Lima, and Pekojan, being the most prosperous village. This is consistent with the poverty mapping results. The conclusion is based on the following:
! Kalianyar is known as the most densely populated area in South East Asia. Its 31 hectares are home to, approximately 29,600 people (at night) or almost 100,000 people per km2. Shacks no larger than 3m x 3m occupied by 5 or more people can be found in Kalianyar. Approximately 30% of the residents live in such small shacks that the occupants have to take turns to sleep. As an example, one shack is occupied by four bakso (noodle and meatball) sellers who work during the day and stay in the cabin at night, and four fried rice sellers who work at night and stay in the cabin during the day. Another example is a family of two parents and three children who has to organize when the parents can stay at home and when the children can stay at home. Approximately 40% of houses in Kalianyar are occupied by more than one family.
! Kalianyar’s high population density gives rise to a potential market for micro businesses
! Slum areas are usually characterized by a small proportion of roads or accesses that can be passed through by vehicles. In Kalianyar, under than 10% of roads can be accessed by vehicles, while in Pekojan and Jembatan Lima, the proportion is higher. The local access in Kalianyar is characterized by narrow alleys with water stagnated when raining.
! Most of Kalianyar’s residents work in the informal sector. Those who work in the formal sector, however, remain at risk as the terms of employment are informal and uncertain. In comparison, in Jembatan Lima and Pekojan, the proportion of workers who work in the formal sector with formal terms of employment is higher.
! Pekojan is larger than Jembatan Lima and has more space available for development. This offers wider opportunities for residents to establish their own business such as food stalls. This is thought to be one indication that Pekojan is more prosperous than Jembatan Lima.
! Pekojan is considered more prosperous than Jembatan Lima. This is indicated by the presence of established shops in Pekojan compared with a fruit market in Jembatan Lima, which makes the neighborhood look a bit dirty and untidy. On the contrary, in Pekojan there exist shops instead of wet markets. Consequently, the neighborhood in Pekojan looks cleaner.
The SMERU Research Institute, May 2003 12121212
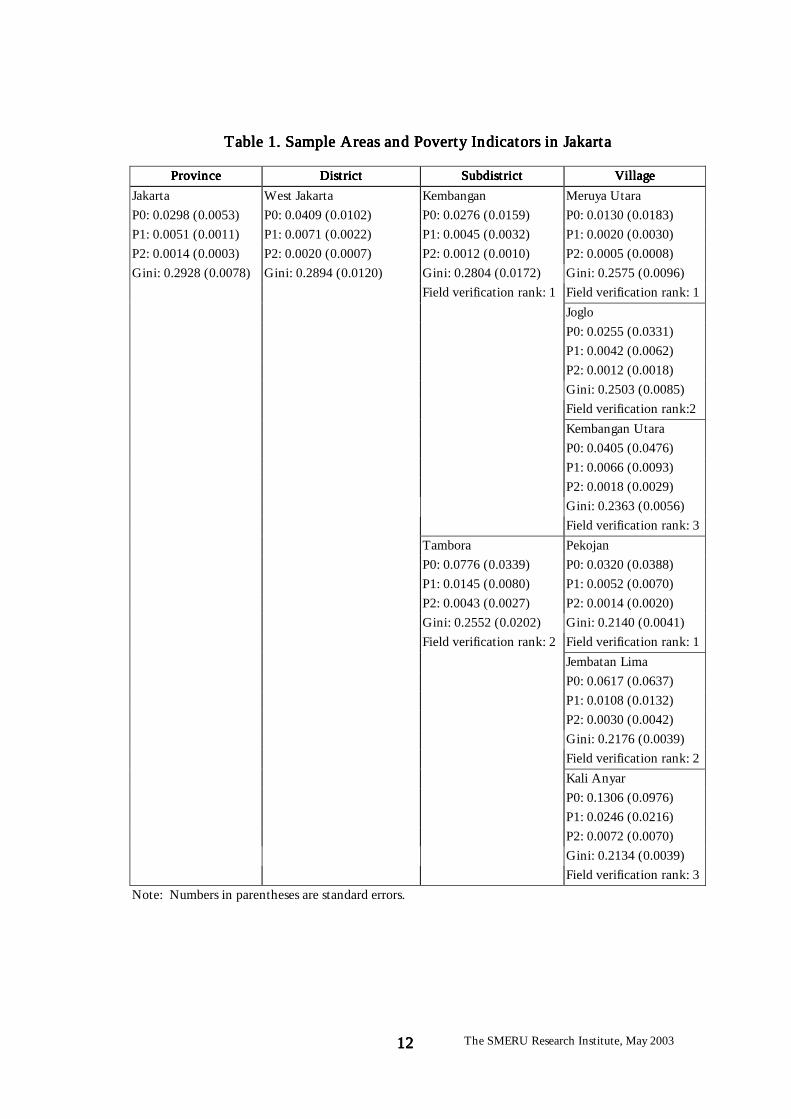
Table 1. Sample Areas and Poverty Indicators in JakartaTable 1. Sample Areas and Poverty Indicators in JakartaTable 1. Sample Areas and Poverty Indicators in JakartaTable 1. Sample Areas and Poverty Indicators in Jakarta
ProvinceProvinceProvinceProvince DistrictDistrictDistrictDistrict SubdistrictSubdistrictSubdistrictSubdistrict VillageVillageVillageVillage
Jakarta West Jakarta Kembangan Meruya Utara P0: 0.0298 (0.0053) P0: 0.0409 (0.0102) P0: 0.0276 (0.0159) P0: 0.0130 (0.0183) P1: 0.0051 (0.0011) P1: 0.0071 (0.0022) P1: 0.0045 (0.0032) P1: 0.0020 (0.0030) P2: 0.0014 (0.0003) P2: 0.0020 (0.0007) P2: 0.0012 (0.0010) P2: 0.0005 (0.0008) Gini: 0.2928 (0.0078) Gini: 0.2894 (0.0120) Gini: 0.2804 (0.0172) Gini: 0.2575 (0.0096)
Field verification rank: 1 Field verification rank: 1
Joglo P0: 0.0255 (0.0331) P1: 0.0042 (0.0062) P2: 0.0012 (0.0018) Gini: 0.2503 (0.0085) Field verification rank:2
Kembangan Utara P0: 0.0405 (0.0476) P1: 0.0066 (0.0093) P2: 0.0018 (0.0029) Gini: 0.2363 (0.0056) Field verification rank: 3
Tambora Pekojan P0: 0.0776 (0.0339) P0: 0.0320 (0.0388) P1: 0.0145 (0.0080) P1: 0.0052 (0.0070) P2: 0.0043 (0.0027) P2: 0.0014 (0.0020) Gini: 0.2552 (0.0202) Gini: 0.2140 (0.0041) Field verification rank: 2 Field verification rank: 1
Jembatan Lima P0: 0.0617 (0.0637) P1: 0.0108 (0.0132) P2: 0.0030 (0.0042) Gini: 0.2176 (0.0039) Field verification rank: 2
Kali Anyar P0: 0.1306 (0.0976) P1: 0.0246 (0.0216) P2: 0.0072 (0.0070) Gini: 0.2134 (0.0039) Field verification rank: 3
Note: Numbers in parentheses are standard errors.
The SMERU Research Institute, May 2003 13131313
IV. Field Verification for East JavaIV. Field Verification for East JavaIV. Field Verification for East JavaIV. Field Verification for East Java A. Sample AreasA. Sample AreasA. Sample AreasA. Sample Areas The sample areas visited in East Java are shown in Table 2 at the end of this chapter. Of the three sample districts in this province, Gresik has the lowest poverty rate at 13.2 percent with a standard error of 2.3 percent. The second sample district was Tulungagung with a poverty rate of 19.5 percent (standard error 3.5 percent). The sample district with the highest poverty rate was Magetan, that being 32.5 percent with a standard error of 2.9 percent. Statistical tests indicate that the differences in poverty rates between all pairs of districts are significant. The higher poverty rate in Tulungagung compared with Gresik is statistically significant at a 10 percent significance level, while the differences in poverty rates between Magetan and Tulungagung, as well as between Magetan and Gresik, are both statistically significant at a one percent level.
In Gresik, the two subdistricts sampled were Bungah, with a poverty rate of 10.3 percent (standard error 4.4 percent) and Panceng, with a poverty rate of 19 percent (standard error 7.8 percent). Statistical tests, however, indicate that the poverty rates in the two subdistricts are not significantly different from each other.
In the Bungah subdistrict, the three sample villages were Kemangi, with a poverty rate of 5.3 percent (standard error 7.5 percent), Kramat, with a poverty rate of 7.4 percent (standard error 6.8 percent), and Bungah village, which has a poverty rate of 13.9 percent (standard error 10 percent). Statistical tests indicate that the differences in the poverty rates between any pair of the three villages are not statistically significant.
In the Panceng subdistrict, the three villages sampled were Ketanen, with a poverty rate of 6.3 percent (standard error 5 percent), Surowiti, with a poverty rate of 10.9 percent (standard error 11.4 percent), and Banyutengah, with a poverty rate of 37.1 percent (standard error 21 percent). Statistical tests indicate that the poverty rate in Banyutengah is significantly higher than that in Ketanen. However, neither the difference in poverty rates between Surowiti and Ketanen nor between Surowiti and Banyutengah are statistically significant. Thus the poverty mapping results indicate that Banyutengah is poorer than Ketanen, but cannot determine whether Surowiti is poorer than Ketanen or Banyutengah is poorer than Surowiti.
In Tulungagung, the two subdistricts sampled were Ngantru, with a poverty rate of 16.4 percent (standard error 5.5 percent) and Kauman, with a poverty rate of 23.8 percent (standard error 6.4 percent). Statistical tests, however, indicate that the difference in poverty rate point estimates of the two subdistricts is not statistically significant.
In the Ngantru subdistrict, the three villages sampled were Pucung, with a poverty rate of 11.2 percent (standard error 7.5 percent), Pulerejo, with a poverty rate of 33.3 percent (standard error 18.7 percent), and Bendosari, which has a poverty rate of 36.4 percent (standard error 15.2 percent). Statistical tests indicate that the

The SMERU Research Institute, May 2003 14141414
poverty rate in Bendosari is significantly higher than that in Pucung. However, neither the differences in poverty rates between Pulerejo and Pucung nor between Pulerejo and Bendosari are statistically significant. Thus the poverty mapping results indicate that Bendosari is poorer than Pucung, but cannot determine whether Pulerejo is poorer than Pucung or Bendosari is poorer than Pulerejo.
In the Kauman subdistrict, the three villages sampled were Jatimulyo, with a poverty rate of 15.7 percent (standard error 9.8 percent), Kauman village, with a poverty rate of 16.1 percent (standard error 10.7 percent), and Pucangan, with a poverty rate of 45 percent (standard error 19.6 percent). The difference in point estimates of poverty rates in Jatimulyo and Kauman is quite small, it is therefore not surprising that statistical tests indicate the difference in poverty rates of the two villages is not statistically significant. However, the tests indicate that Pucangan is certainly poorer than Jatimulyo and Kauman, with both differences in poverty rates being statistically significant at a 10 percent level.
In Magetan, the two sample subdistricts were Maospati, with a poverty rate of 18.6 percent (standard error 5.5 percent) and Panekan, with a poverty rate of 45.3 percent (standard error 6.6 percent). The difference in point estimates of poverty rates between the two subdistricts is very large, even after taking into account the standard errors, so statistical tests indicate that the difference is highly significant at a one percent level.
In the Maospati subdistrict, the three sample villages were Ronowijayan, with poverty rate of 15.7 percent (standard error 14.4 percent), Ngujung, with a poverty rate of 23.9 percent (standard error 12.2 percent), and Gulun, with a poverty rate of 25.7 percent standard error 16.3 percent. Statistical tests indicate that the differences in the poverty rates for any pair of the three villages are not statistically significant.
In the Panekan subdistrict, the three sample villages were Milangsari, with a poverty rate of 35.2 percent (standard error 17.1 percent), Manjung, with a poverty rate of 43.1 percent (standard error 18.1 percent), and Bedagung, with a poverty rate of 45 percent (standard error 19.6 percent). Statistical tests again indicate that the differences in poverty rate point estimates for any pair of the three villages are not statistically significant.
B. Verification ResultsB. Verification ResultsB. Verification ResultsB. Verification Results a. District Levela. District Levela. District Levela. District Level • District: Gresik
Gresik is located on the northeast coast of Java, bordering on Surabaya. It consists of 18 subdistricts. Eight subdistricts are located in the south, and 10 subdistricts, including two subdistricts on Bawean Island, are located in the north and considered relatively prosperous. The district is 1,191 km2 with a population of 964,000.
The SMERU Research Institute, May 2003 15151515
The economy of Gresik is supported by fish farming (in the north), predominantly prawn and bandeng fish, and home industries, such as kopiah (black velvet rimless caps), sarongs, garments, and fish products. The returns offered by the fish farming sector are so attractive (the price of prawns can reach Rp 120,000 per kg) that many agricultural areas are converted into tambak (fish farms). In addition, although still in an early stage, the lucrative swallow nest industry is considered to have excellent prospects and is constantly growing.
Fish farming and working abroad as TKI (Indonesian laborers working abroad) are the predominant sources of income for people in the north, while industry and agriculture are the main sources of income for people in the south. Agricultural areas are considered relatively less prosperous as most fields are rain-fed, providing only one harvest per year.
As a buffer zone for Surabaya, the province capital, Gresik’s location is strategic for large-scale industries. PT Semen Gresik and PT Petrokimia Gresik are just two examples of large companies located in Gresik. The presence of large industries has encouraged local residents to set up their own businesses, mainly services that directly or indirectly support these industries. Gresik has various public facilities, and is considered a modern urban district. Consequently, Gresik is considered quite prosperous. However, poor enclaves of the poor still exist in some subdistricts in urban and industrial areas.
• District: Tulungagung
Located on the south coast of East Java, 154 km from Surabaya, Tulungagung borders on the districts of Kediri, Blitar, and Trenggalek. Tulungagung is strategically located along several trade routes. The south and the west areas of Tulungagung are hilly, while the other areas are relatively flat. The total population of Tulungagung is 972,000.
Although agriculture is still the primary source of income for the majority of people, small and medium scale businesses are growing and make a significant contribution to the district. In addition to the batik and garments industry, Tulungagung is famous for its onyx industry. Tulungagung is also known as the largest supplier of TKI in East Java, with inward remittances constituting a significant amount of money to the local economy. Bank BNI and the district post office record that over the last two years (2001 and 2002), the average value of inward remittances to Tulungagung reached Rp366 billion, or more than 25% of the total remittances of East Java.
The southern area of Tulungagung used to flood in the wet season. However, since the Niyama dam was constructed in the Besuki subdistrict near Popoh Beach, floods have been successfully prevented and agricultural productivity has increased.
The SMERU Research Institute, May 2003 16161616
• District: Magetan
Located in the western part of East Java, 193 km from Surabaya, Magetan borders on the Wonogiri and Karanganyar districts in Central Java. Located on the eastern side of Mount Lawu, most of the land is fertile. With a population of 655,000 and encompassing approximately 60% of the total area of Gresik, the population density of Magetan is 992 people per km2, higher than both Gresik (809 people per km2) and Tulungagung (929 people per km2).
Compared to other districts in East Java, Magetan is often considered poor. The natural tourism attraction Telaga Sarangan is one of the few sources of revenue for the district. The capital of Magetan is located far from the inter-city trade road. Due to its less strategic location, the presence of a local government-owned leather-processing factory and a number of leather home industries are still unable to boost the local economy.
• Poverty comparison
It is clear that among the three districts, Gresik is the most prosperous, followed by Tulungagung and Magetan, being the poorest. This is mainly because Gresik is close to Surabaya, the capital of East Java, and offers a relatively wide variety of jobs in various industries. In the second place is Tulungagung, which still mainly relies on the agricultural sector. However, small and medium-scale industries in this district are growing, offering more income opportunities for the people. Poor location is believed to be the main reason for Magetan being the least prosperous district among the three samples. These results are consistent with the findings from poverty mapping.
b. Subdistrict Levelb. Subdistrict Levelb. Subdistrict Levelb. Subdistrict Level
Gresik District
• Subdistrict: Bungah
Located 20 km from the capital of Gresik, Bungah is well known for its fish farming (mainly bandeng fish and prawns) and home industries such as food processing, kopiah, and terbang (traditional tambourines). Following the economic crisis, the price of prawns increased sharply, peaking at Rp 120,000 per kg during 1997/98 - 2000. As this sector offers a much higher return than the agricultural sector, working in the fish-farming sector has become so popular that it constitutes approximately 70% of economic activities in the district. However, since November 2002, the prawn prices have fallen to as low as Rp 70,000 per kg. The highly lucrative swallow nest industry, which is relatively new in Bungah, shows good prospects and is growing. Revenues can reach Rp 1,500,000 per house for a period of 3 to 4 months.

The SMERU Research Institute, May 2003 17171717
The presence of various education institutions, ranging from elementary to graduate schools, including general schools3, pondok pesantren4, indicates that residents of Bungah are very concerned about education. There are 28 Madrasah Ibtidyah5 and 23 general elementary schools in this subdistrict. Residents are religious and prefer Islamic schools to general schools. This is indicated by the growing number of students in Islamic schools and declining number of students in general schools despite the fees for Islamic schools (Rp 7,000-15,000 per month) being much higher than those of general schools (Rp 500-2,000 per month).
• Subdistrict: Panceng
Located around 40 km to the north of the capital of Gresik and bordering on the Lamongan district, Panceng is considered a less prosperous subdistrict. Infertile soil and low productivity rain-fed rice fields characterize the agricultural sector in the subdistrict. Limited employment opportunities have made working abroad as TKI a very popular choice for the local people for more than 20 years. The number of TKI is widely used as an indicator of a poor region. Regions with limited natural resources and employment opportunities tend to have a high proportion of TKI. Remittances from TKI are used by the local residents to renovate houses and purchase motorcycles. Limestone quarrying is another significant economic activity in Panceng. The businesses are not exclusively owned by Panceng residents; however, they offer significant employment opportunities for local people.
There are very few education institutions and only several villages have high schools. In addition, the emphasis on education is low and tends to be limited to preparing young people to work abroad. Like in Bungah, in this subdistrict Islamic schools are also preferred to general schools.
• Poverty comparison
It can be concluded that Bungah is more prosperous than Panceng. This argument is mainly based on the fact that there are more employment opportunities in Bungah than in Panceng. Bungah relies on fish farming, which offers higher returns than rain-fed rice fields, the backbone of the Panceng economy. In addition, home industries are much more developed in Bungah. This conclusion is consistent with the results of poverty mapping.
3 Non-Islamic schools. 4 Informal Islamic education institution. 5 Elementary-level formal Islamic education institution.
The SMERU Research Institute, May 2003 18181818
Tulungagung District
• Subdistrict: Kauman
This subdistrict is 30.8 km2 or 2.9% of the total area of Tulungagung, making Kauman Tulungagung’s third smallest subdistrict. Consisting of 13 villages, Kauman is only 5 km from the city of Tulungagung. The average distance from villages to the subdistrict capital is approximately 2 km, along sealed or gravel roads, accessible by cars.
By 2001, the population of Kauman was 49,528 or 5.1% of the total population of Tulungagung. With the population density of 1,606 people per km2, Kauman is the fifth most densely populated subdistrict in Tulungagung. Agriculture is the dominant sector of employment in Kauman, although only a small number of people own lands and the remainders work as farm laborers. Other employment opportunities lie in the trade, industry (garment and batik), and services (such as craftsmanship) sectors. According to the local BPS, in 2001 there were only three traders categorized as large-scale traders, while the rest were categorized as small and medium traders.
Kauman produces a large quantity of rice, and by 2001, contributed 8% of the total rice production in Tulungagung. Farmers also plant other crops such as corn, soybean and cassava. In addition, animal husbandry is growing in this subdistrict, although it has remained relatively small compared to that in other subdistricts.
Education institutions, ranging from elementary schools to senior high schools and vocational schools, as well as health facilities, ranging from puskesmas to hospital are available.
• Subdistrict: Ngantru
Ngantru borders the Tulungagung, Kediri and Blitar districts, and is located on the side of the main road to Kediri. The Brantas River flows through the northern part of the subdistrict, sometimes causing floods. Ngantru is 37 km2 or 3.5% of the total area of Tulungagung and consists of 13 villages. The capital of Ngantru is located approximately 7 km to the northwest of the capital of Tulungagung. The average distance from villages to the capital of Ngantru is approximately 4 km, along relatively good roads.
The population is 48,601, lower than that of Kauman, however the area is much larger. As a result, the population density of Ngantru, 1,312 people per km2, is lower than that of Kauman. Similar to Kauman, the predominant sector of employment is agriculture, followed by trade, industry and service. Trading enterprises in this subdistrict are small to medium in size. In addition, owing to the presence of the Brantas River, some people are involved in sand quarrying.
Most of the areas used for agriculture in Ngantru are unirrigated. Of 1,186 hectares, less than 10% is technically irrigated, while the remainder is semi-technically

The SMERU Research Institute, May 2003 19191919
irrigated or completely reliant on rain. Consequently, rice productivity is relatively low. Farmers are more interested in planting other crops such as vegetables and fruits. Ngantru is the biggest producer of peanuts in Tulungagung. Its production reached approximately 50% of total peanut production of Tulungagung in 2001. In addition, Ngantru is also one of the biggest corn and sugar producers in Tulungagung. However, declining sugar prices have encouraged sugar farmers to switch to fruits such as oranges and papaya, intercropped with dry season crops. Animal husbandry in this subdistrict is growing faster than it is in Kauman, as indicated by the increasing number of cattle.
Education institutions are widely available in Ngantru, ranging from elementary schools to senior high schools. In addition to 2 junior high schools, there are 8 Madrasah Ibtidaiyah (Islamic primary schools), 2 Madrasah Tsanawiyah (Islamic junior secondary schools), and 1 Madrasah Aliyah (Islamic senior secondary schools). The local people are quite religious, as shown by the significant number of mosques and pesantren. Health services are provided by 2 Puskesmas and 3 Puskesmas Pembantu (secondary public healthcare center).
• Poverty comparison
Based on interviews and observations it was concluded that people in the Kauman subdistrict are more prosperous than those in the Ngantru subdistrict. This conclusion is based on the following arguments:
! Kauman was the Kawedanan capital (an administrative level lower than district but higher than subdistrict during Dutch times). As a result the current population is larger and trade is more dynamic than that in Ngantru.
! Agricultural areas in Kauman are mostly irrigated, while in Ngantru, most are semi-technically irrigated.
! The proportion of workers involved in non-agricultural activities, such as trade, industry and craftmanship, is higher in Kauman than that in Ngantru.
! In the northern part of Ngantru, floods are quite frequent.
! According to the Dinas Kependudukan dan Catatan Sipil (the Population and Civil Registry Agency), a greater proportion of residents in Kauman possess a birth certificate. This suggests that the people of Kauman are more educated and wealthier than the people of Ngantru.
! According to some NGOs, the unemployment rate in Ngantru is higher than that in Kauman.
! Per capita consumption of iodine salt is higher in Kauman than that in Ngantru that shows a higher prevalence of goiters. It indicates that health quality is better in Kauman than it is in Ngantru.
The SMERU Research Institute, May 2003 20202020
! The emphasis on education and level of income in Kauman is higher than that in Ngantru.
This conclusion is contrary to the poverty rate point estimates from poverty mapping. It is important to note, however, that the difference in point estimates for the two subdistricts is not statistically significant.
Magetan District
• Subdistrict: Maospati
Maospati consists of 3 kelurahan, 12 desa and borders on the Madiun district. Located on the main road between East Java and Central Java, at the intersection of the Ngawi, Magetan, and Madiun districts. Maospati’s strategic location, the presence of a bus station and an airforce base, offer the local people various employment opportunities, ranging from traders, civil servants, private sector employees, farmers, to entrepreneurs (roof tile producers, chips). Maospati can easily be accessed from the capital of Magetan or from Madiun (13 km).
Public facilities are considered sufficient and include two banks (Bank Rakyat Indonesia) and education institutions ranging from elementary schools to senior high schools.
• Subdistrict: Panekan
Panekan consists of 1 kelurahan and 19 desa, and is located on the side of Mount Lawu. In some areas the soil is largely infertile and the supply of water is inconsistent. The upper and lower areas lack water, but the area in between receives amounts of water, making the land relatively fertile compared to the upper and the lower areas. Despite these conditions, agriculture is the dominant economic sector throughout Panekan.
The employment sector is relatively homogeneous, with the majority of residents being small-land holder farmers, and some people also raising cows for sale. Working abroad is also popular amongst the people in Panekan.
There is one bank (Bank Rakyat Indonesia) in Panekan. A senior economic high school is the highest-level education institution available in Panekan, requiring students who want to continue their education to go to the capital of Magetan, 6 km from Panekan. There is also a bus station in Milangsari, providing people easier access to other cities.
• Poverty comparison
The village Poverty Map of the Magetan district issued by the local BPS office shows that Panekan is better off than Maospati as the percentage of poor households in Panekan is lower than that in Maospati. Initially, respondents from government agencies tended to ‘stick’ with this finding. However, visual observations imply the opposite is true. Finally, almost all respondents came up with the conclusion that the

The SMERU Research Institute, May 2003 21212121
level of welfare of the people in Maospati is higher than that in Panekan. Maospati, which is more urban than Panekan, shows a higher level of development, and this is consistent with the results from poverty mapping.
c. Village Levelc. Village Levelc. Village Levelc. Village Level
Bungah Subdistrict in Gresik
• Village: Kramat
This is a relatively isolated village, approximately 13 km from the Bungah subdistrict center. Kramat, together with two neighboring villages with similar characteristics and level of welfare, are called “Mengari Island”. They are referred to as an island because they are surrounded by tambak and connected by only a one-car wide dirt road. In heavy rain, the villages cannot be accessed by car due to thick mud; therefore motorcycles become the only possible mode of transportation.
More than 70% of people in Kramat are traditional fishermen. As these fishermen are equipped with only small boats, during the west monsoon, for about four months they cannot go to the sea due to rough weather. In addition, there are only a few other economic activities, such as the small, prawn cracker (krupuk udang) home industry.
The tambak surrounding the village are not owned by the local residents. They only work in the tambak, making the benefits for the village very limited. In addition, the human resources in Kramat have so much lower quality than those in the other two villages sampled that they face more obstacles in searching for jobs outside the village. Environmental health standards in the village are so poor that diseases are rampant. Clean water is rare, especially during the dry season. Most houses are still semi-permanent and many have dirt floors.
• Village: Kemangi
Kemangi is approximately 3 km from the subdistrict center. Originally, Kemangi was an agricultural village with rice as the main crop. Since 1985, due to higher return offered by fish farming, rice fields have gradually been transformed into tambak. By 2002, there were no more rice fields left in this village and fish farming is now the main economic activity. Men and women are actively involved in other economic activities such as the production of peci/kopiah, and rebana/terbang, which are mostly intended for foreign markets. Some residents are now starting swallow nest businesses
• Village: Bungah
The Bungah village is the center of economic activity and education in the Bungah subdistrict. The village is connected to the provincial road by a good quality, asphalt road. As a center of education, there are four pesantren with thousands of students, and some general education facilities ranging from elementary schools to graduate
The SMERU Research Institute, May 2003 22222222
schools. The presence of these facilities has encouraged the local people to develop a service sector. Services such as house rentals, shops, and food stalls constitute a significant proportion in employment of the village. Some residents own huge prawn tambak outside the village.
Neat and clean neighborhoods, sealed local roads, and permanent houses characterize the village. One private clinic, six midwives and one puskesmas compliment the village health facilities. Considered as an urban village, the price of land is relatively high and can reach Rp 200,000 per m2.
• Poverty comparison
It can be concluded that Bungah is the most prosperous village, with Kramat being the least prosperous. Bungah is considered as urban village, with public facilities. In general, second-ranked Kemangi is supported by highly productive home industries, in addition to fish farming activities. Being an isolated village, Kramat is considered as the least prosperous village of the three. Limited job opportunities and a lack of skills and motivation amongst the local people are believed to be the main reasons for the village’s low ranking.
The finding that Bungah is the most prosperous village among the three sample villages contradicts findings from poverty mapping, which ranks Bungah as the lowest. However, the finding that Kemangi is more prosperous than Kramat is consistent with poverty mapping results. It is important to note, however, that the point estimates of the poverty mapping in the three villages are not statistically significantly different from each other.
Panceng Subdistrict in Gresik
• Village: Surowiti
Surowiti is relatively isolated as it is surrounded by forests and connected to the main road by only a narrow 3.5km gravel road. The presence of a cow market provides a significant contribution to village revenue; however, opportunities for the people to make a living are very limited. Its location on the side of a hill, the absence of irrigation and small land ownership result in low productivity in the agricultural sector, with only one harvest per year. The forests surrounding the village are protected, limiting the income potential for the local community.
The village is characterized by poor quality dirt and gravel roads. Most houses are made of woven bamboo panels and dirt floors. Water is one of the most immediate problems for the villagers as there are only few sources of water in the village. Limited income opportunities in the village encourage young people to work abroad.
Villagers and village officials in Surowiti consider the grave of Sunan Kalijaga as having tourism potential for the village. However, the proposal to develop this potential has not been approved by the district government.

The SMERU Research Institute, May 2003 23232323
• Village: Banyutengah
Banyutengah is located in the northern part of Gresik, bordering on the Lamongan district. The infertile soil and rain-fed rice fields cannot support the community; therefore, there has been a significant number of TKI, considered to be indicative of poverty in the village, over the last 20 years. Just like other villages with a significant number of TKI, the contribution of TKI to their families through their remittances is obvious. They can, for example, afford to renovate their houses. However, these contributions to the village finance are considered insignificant. High orientation to work abroad results in relatively low interest in education. Graduating from senior high school or even junior high school level is considered sufficient to be able to work abroad.
Limestone quarrying is significant in the village. Unfortunately, the owners are mostly from the Tuban district, while the local people are just workers, making the benefits of this activity for the people in the village quite limited. Furthermore, quarry owners are not cooperative with the village apparatus and refuse to make any significant financial contribution to the village finance.
• Village: Ketanen
Ketanen approximately 5 km from the main road, connected by a good sealed road. There are more permanent than semi-permanent houses in the village. Rain-fed rice, corn and vegetable fields supported by moderate soil fertility enable the people to harvest two or three times per year, resulting in the productivity of its agricultural activities being higher than that of the other two sample villages.
There is a significant number of TKI in the village, and these TKI contribute a significant amount to development in the village (such as for village offices, mosques and roads) and to their families. The people of Ketanen value education and some residents send their children to tertiary education institutions in Malang, Gresik, and even Surabaya. There are some limestone quarries in the village and the owners are considered cooperative and willing to contribute to village development.
• Poverty comparison
Relatively isolated and with no natural resources, Surowiti is clearly the least prosperous village. Ketanen is apparently the most prosperous village. In general, Banyutengah’s agricultural sector is not very promising, as the rice fields are mainly rain-fed; however, it is easily accessible from the main road. Furthermore, the limestone quarries in the village hold some employment opportunities for the local people. The number of TKI in Ketanen is high. The people of Ketanen are considered to have a much better sense of belonging to the village. As a result, contrary to the case in Banyutengah, the contributions of TKI from Ketanen are very significant to the development of the village and the prosperity of the people. In addition, owners of the limestone quarries are willing to contribute revenue to the village.
The SMERU Research Institute, May 2003 24242424
The finding that Ketanen has the highest welfare level compared to the other two villages is consistent with the poverty mapping results, but the finding that Surowiti is the poorest village conflicts with poverty rate point estimates resulting from the poverty mapping. However, the statistical tests of the poverty mapping results indicate that the poverty point estimates for Surowiti and Banyutengah are not significantly different from each other.
Ngantru Subdistrict in Tulungagung
• Village: Pulerejo
Pulerejo borders the villages of Bendosari and Ngantru, the capital of the Ngantru subdistrict, making various public facilities conveniently accessible. However, some areas of Pulerejo are still seriously affected by floods in the wet season.
Pulerejo is less than 2 km2 or approximately 5% of the Ngantru subdistrict making it the second smallest village in the subdistrict. As of 2001, the population was 2,701 and the population density was 1,364 people/km2. Most of the houses in the village are still made of woven bamboo walls. The closest health facility is located in the village of Ngantru, the capital of Ngantru subdistrict.
Apart from being rain-fed, the rice fields are also irrigated by a semi-technical irrigation system. Most of the farmers in the village do not own land and their incomes are relatively small. Rice and sugarcane are the dominant crops in this village.
• Village: Bendosari
Bendosari constitutes approximately 7% of the area of the subdistrict. As of 2001, the population was 3,787 and the population density was 1,515 people/km2. Bendosari is a neighboring village of Pulorejo and borders on the Ngantru village, the capital of the Ngantru subdistrict, making various public facilities easily accessible. The closest health facility is also located in the Ngantru village. Apart from being rain fed, rice fields are also irrigated by a semi-technical irrigation system.
Compared to Pulerejo, there are more employment opportunities in Bendosari. This includes working as traders, working in sohun factory (transparent noodles made from bean flour), garment factory and the construction industry. However, farming is still the main occupation of people in Bendosari, despite the proportion of people owning land being much smaller than those who do not. The younger generation is becoming less interested in working in the agricultural sector, particularly due to the prices of sugarcane and cows showing a declining trend. They prefer to move to the cities to become construction workers.
• Village: Pucung Lor
Pucung Lor is located 7 km to the south of the Ngantru subdistrict capital, along the main road to Blitar. However, public transportation is available, making the district and subdistrict capitals easily accessible. Pucung Lor is approximately 8% of the area
The SMERU Research Institute, May 2003 25252525
of the subdistrict. As of 2001, the population was 3,527, with a population density of 1,164 people/km2.
There are health facilities in the village, including a Puskesmas and a doctor in practice in the afternoon. The people are religious, as shown by the significant number of santri (students at traditional Islamic schools) and graduates from IAIN (Nusantara Islamic Institute).
The price of land is higher than that in Bendosari and Pulerejo. The land is relatively fertile compared to Pulerejo and Bendosari and there is also a technical irrigation system. In addition, farmers are relatively responsive to technological changes in agricultural practices. They plant not only rice and sugarcane, but also horticultural crops. Animal husbandry activities are also expanding. A significant number of young people from the village work abroad. These various opportunities have helped the community in obtaining more secure sources of income.
• Poverty comparison
Based on interviews with several respondents and visual observations, especially regarding location, land fertility, social activities, housing and employment, it can be concluded that Pucung Lor is the most prosperous village, followed by Bendosari and Pulerejo, being the poorest sample village.
The conclusion that Pucung Lor is the most prosperous village among the three sample villages is consistent with the poverty mapping results. However, the conclusion that the people of Bendosari are better off than those of Pulorejo is contrary to the poverty point estimates from poverty mapping. Note, however, that the difference in the poverty point estimates of the two villages is relatively small and not statistically significant.
Kauman Subdistrict in Tulungagung
• Village: Kauman
The village of Kauman is located in the capital of the Kauman subdistrict. The village is 1.6 km2 or approximately 5% of the total area of the Kauman subdistrict. The population of 4,002 is relatively heterogeneous, with only around 65% of the residents native to the area. Various public facilities, which are available in the capital of the district and the subdistrict, can be easily accessed from the village. The village is low-lying, rice fields are irrigated by technical irrigation systems and village roads are sealed. In addition to farmers, people of Kauman also work as traders, entrepreneurs (garment industry), government and private sector employees, shop owners, craftsmen or skilled labors in other cities.
The SMERU Research Institute, May 2003 26262626
• Village: Jatimulyo
Jatimulyo is located 7 km to the northwest of the capital of the Kauman subdistrict and alongside main road to the Kediri district. The village is 1.5 km2, or approximately 5% of the total area of the Kauman subdistrict and the population is 4,000. The various public facilities available in the district and the subdistrict capitals are easily accessible from the village. The village is low-lying, rice fields are irrigated by technical irrigation systems, and village roads are sealed. The people of Jatimulyo are employed in similar positions to the people of Kauman; however, the proportion of farmers and craftsmen is higher in Jatimulyo. Some people also work as skilled laborers in other cities including Jakarta, Madiun and Surabaya. In addition, Jatimulyo is famous for its carpentry.
In the agricultural sector, out of approximately 797 farming households, only 152 farmers possess land, while the remainders are seasonal farm laborers. Many young females are employed in garment industry, producing bed sheet and pillow cover.
• Village: Pucangan
The village of Pucangan is located in a hilly area to the west of the capital of the Kauman subdistrict. A road heading to PLTA (hydro power plant) Wonorejo passes through this village. The village is 5.7 km2, or approximately 18% of the total area of the Kauman subdistrict. With a population of 3,054, the population density in Pucangan is lower in comparison to the other two sample villages. Various public facilities, which are available in the district and subdistrict capitals are easily accessible from the village. Most of the village roads are made of compacted gravel. The hamlets are scattered and one particular hamlet, which borders on the forest, is inaccessible by car. Some houses are attached to cattle yards, which indicates the low health standards of some areas.
More than 70% of the people rely on agriculture, however, only one-third of them possess land, and the rest are just landless laborers. A small proportion of the people are involved in other activities such as collecting stones from the river, breeding cow, buffalo, or goat and factory work. The village borders on the forest owned by PT Perhutani (a state-owned forestry company). 40% of the village residents are involved in forestry activities including planting dry season crops such as corn and cassava, and managing the hardwood, pine, and acacia trees.
• Poverty comparison
Based on geographical location, accessibility to the subdistrict and district capitals, the physical condition of houses, sectors of employment and the percentage of pre-prosperous families, most respondents concluded that Kauman is the most prosperous village, followed by Jatimulyo, and finally Pucangan. As the areas are relatively small, the proportion of farmers in Kauman and Jatimulyo is lower than that in Pucangan, implying that professions are more heterogeneous in Kauman and Jatimulyo.

The SMERU Research Institute, May 2003 27272727
The conclusion that Pucangan is the least prosperous village among the three sample villages is consistent with the poverty mapping results. The poverty point estimates for Jatimulyo and Kauman are actually almost the same, thus the poverty map cannot significantly differentiate the poverty ordering of the two villages.
Maospati Subdistrict in Magetan
• Village: Gulun
Gulun is located 3 km from the capital of Maospati but is on the main inter-city road and close to the Maospati bus station. The main roads are mostly sealed, with only a small proportion (20%) of the local roads still made of gravel. In general, all houses have an access to electricity provided by the state electricity company and have toilet facilities. Approximately 125 of the 713 houses have a telephone line. Around 90% of the households use a water pump to obtain clean water and only 10% households still obtain water manually from wells. In general, all school-aged children are enrolled in school and many continue on to tertiary education, showing that education is accessible and affordable for village residents.
Well known as the center of the roof tile industry in the area, approximately 75% of the residents are involved in this activity. In general, unemployment is low, as even school-aged children are actively involved in the production process in their leisure time. Due to the presence of the industry, students’ savings are higher compared to that of students in the other two villages sampled. According to the local BRI office, the value of loans for this village is also higher. Other economic activities, directly or indirectly related to the roof tile industry, such as the transportation of clay and food are also expanding. The production process of producing roof-tile is usually carried out in the front yard, making the neighborhood look dirty with roof-tiles scattered on the yard. Most houses are permanent and have either a tiled or cement floor.
• Village: Ngujung
The village is approximately 2 km from the inter-city road and 4 km from the subdistrict office. The main road has been sealed with asphalt for a long time; whereas, the local roads were just sealed in 2000. The neighborhood looks clean and neat. In general, all houses are permanent, with either tiled or ceramic floor and are fenced. Electricity is provided by the state electricity company and telephone lines are available; however, the lines are still limited. Most households have access to piped water and only a small proportion of the households still have to obtain water manually. According to some respondents, the number of households using electric water pumps is higher in Ngujung than that in Gulun.
Ngujung is a farming village. Technical irrigation does exist, but the water is only available in the wet season. However, since water pumps are widely used, crops can be planted three times per year. Farmers who do not own any water pump can hire one for Rp 5,500 per hour. As a farming village, most people are either farm owners or laborers, but others occupations include entrepreneurs, workers in the local
The SMERU Research Institute, May 2003 28282828
tempeh industry, traders, civil servants and retired soldiers of the Iswahjudi Air Force Base. Almost all school-aged children are enrolled in school.
• Village: Ronowijayan
Ronowijayan is a relatively small and sparsely populated village which neighbors Ngujung and is located 4 km from the main road and 7 km from the subdistrict. The main road in the village is sealed whereas the local roads are not. The population is 1,020 (264 households) and most people are employed in the farming and construction industries. Only 50 households actually own land and a small number of villagers have began to raise cattle whereas others have become civil servants.
Most houses are permanent and there are only few made of bamboo-woven walls. Of the permanent houses, most have cement floors, but a few have ceramic tiled floors. All households have an access to electricity provided by the state electricity company; however, 60 households do not have legal connections. Around 80% have access to running water and the remainders obtain water manually.
In 1990, together with other villages, Ronowijayan was selected to receive assistance from the IDT program6. Interviews with several stakeholders concluded that Ronowijayan is still poor and underdeveloped village compared to other villages in Maospati.
Compared to the other sample villages, the people of Ronowijayan are relatively less concerned about education. Most of them consider junior high school as sufficient and less than 50% of junior high school students continue to senior high schools.
• Poverty comparison
All respondents concluded that Ronowijayan is the least prosperous village compared to the other two villages and this was confirmed by observations. Visual observation, however, could be misleading when comparing Ngujung and Gulun. In Ngujung, the neighborhood is neater and the houses are more comfortable than that in Gulun, thus it could be concluded that Ngujung is more prosperous. Looking at incomes and economic activities, however, the conclusion is contradictory. The presence of the roof tile industry makes Gulun more prosperous as everyone is actively involved in production and the income generated is high. Out of the 16 respondents, 15 respondents stated that Gulun is more prosperous than Ngujung.
The comparison of poverty in the three villages based on field verification results ranks these villages in exactly the opposite order to the poverty mapping results. The presence of large standard errors of the poverty point estimates clearly needs to be taken into account in the use of the estimates.
6 Presidential Instruction on Underdeveloped Villages Program.
The SMERU Research Institute, May 2003 29292929
Panekan Subdistrict in Magetan
• Village: Milangsari
Supported by various public facilities such as a bus station, Milangsari is considered as semi-urban. A housing estate is located in the village and the main road is sealed. Public transportation is available, making the village easily accessible.
Although considered as a semi-urban village, agriculture is still the main economic activity. However, the productivity is relatively low due to difficulties in obtaining water and farmers having to rely on rain to water their crops.
Apart from farmers, people work as traders, or are employed by the government or private enterprises. The presence of the bus station since 1990 has created some new job opportunities such as driving ojek and operating small shops around the bus station. Alternatively, a significant number of village residents migrate to Jakarta to become seasonal workers. Only a small percentage of Milangsari residents are native to the area. In terms of education, high school is generally the highest level of education attained by residents. Income distribution is relatively unequal.
Out of the 1,068 houses in the village, 163 houses have bamboo walls, and in general, the houses are spacious. Almost all houses have access to electricity provided by the state electricity company, clean water supplied by PDAM (the water company owned by the local government), and have a toilet. Due to the limited network, there are only 50 houses, which currently have a telephone connection. Some permanent houses still have dirt floors. This is not due to poverty but the belief that dirt floors are good for storing unhulled rice as they absorb water.
• Village: Manjung
Although located only 2 km from the subdistrict capital and around 600 meters from the main road, Manjung is relatively quiet. Some of the village roads are sealed, while others are made of compacted gravel.
Rice fields cover most of Manjung and as water is available year round, crops can be planted three times per year. As a result land prices are high, around Rp100 – 200 million per hectare, much higher if compared to that in Milangsari, which are Rp40 – 50 million per hectare.
Most residents in Manjung are farmers and possess large plots of land. Almost all households possess at least one cow and have fruit trees in their yard. As a result, the village is well known for its surpluses in agricultural and cattle products.
Around 60% of the houses are permanent and the rest are made of wood or bamboo. Almost all houses have cement or tiled floors and only a small proportion of the houses are still earth floored. Telephone lines are not yet available in the village. Approximately 30% of the houses have access to clean water supplied by the local government water company while the rest still rely on water from mountain springs.

The SMERU Research Institute, May 2003 30303030
According to local BRI officials, people of Manjung are reliable in paying off their PBB (Land and Building Tax). In addition, the people are seen as responsive and participative in various village development programs.
• Village: Bedagung
Located in the highlands of Mt Lawu, Bedagung is susceptible to landslides, making it difficult to establish an irrigation system for agriculture. There is a lack of transportation as most of the roads are gravel. The location of the village is around one kilometer from the main road, making the village hard to access. As the village is long, access to the furthermost point is even more difficult.
Houses are simple in appearance and only 30% are made of bricks, the remaining 70% from wood or bamboo. Around 75% of the houses still have earth floors. Some houses rely on mountain springs for obtaining clean water, while others rely on water supplied by PDAM. The village has access to electricity but there are no telephone lines. Toilet facilities are still rare and most people use the river as a toilet facility, in addition to washing and showering.
Of the 460 households in Bedagung, 133 possess land, although small, while the rest are landless-laborers. Farmer is the dominant occupation in Bedagung, followed by small trader. The level of education in Bedagung is relatively low, and most residents only reach junior high school, some finishing after graduating from elementary school.
• Poverty comparison
All the 19 respondents interviewed concluded that Bedagung is the least prosperous village compared to Milangsari and Manjung. The appearance of the village, including the neighborhood and the houses, and the way the people dress confirm this conclusion.
Nine respondents concluded that Milangsari is more prosperous that Manjung, while, seven respondents stated the contrary, that Manjung is more prosperous than Milangsari. Respondents who stated that Milangsari is more prosperous tended to focus on infrastructure, the availability of public facilities such as bus terminal, and employment prospects, which are better in Milangsari. Milangsari was also considered more urban than Manjung. Manjung was considered very rural and to be lacking infrastructure and public transportation. The village roads are small and made of gravel. Employment is relatively homogeneous with most residents working as farmers or farm laborers. The people in Manjung also lead a more simple life than those in Milangsari.
In comparison, those who concluded Manjung is the more prosperous village based their decisions on Manjung’s high agricultural productivity and price of land. It is also well known for its animal husbandry.

The SMERU Research Institute, May 2003 31313131
However, based on observations, the verification team concluded that the Milangsari village is more prosperous due to the more comfortable lifestyle, spacious environment and modern housing.
In contrast to the field verification results for the Maospati subdistrict, the field verification results for the Panekan subdistrict were exactly the same as the poverty mapping results.

The SMERU Research Institute, May 2003 32323232
Table 2. Sample Areas and Poverty Indicators in East JavaTable 2. Sample Areas and Poverty Indicators in East JavaTable 2. Sample Areas and Poverty Indicators in East JavaTable 2. Sample Areas and Poverty Indicators in East Java
ProvinceProvinceProvinceProvince DistrictDistrictDistrictDistrict SubdistrictSubdistrictSubdistrictSubdistrict VillageVillageVillageVillage
East Java Gresik Bungah Kemangi P0: 0.3210 (0.0131) P0: 0.1322 (0.0233) P0: 0.1029 (0.0435) P0: 0.0532 (0.0746) P1: 0.0718 (0.0044) P1: 0.0254 (0.0052) P1: 0.0204 (0.0124) P1: 0.0084 (0.0143) P2: 0.0234 (0.0019) P2: 0.0078 (0.0018) P2: 0.0065 (0.0052) P2: 0.0023 (0.0045) Gini: 0.2699 (0.0052) Gini: 0.2589 (0.0100) Gini: 0.2482 (0.0186) Gini: 0.2075 (0.0160)
Field verification rank: 1 Field verification rank: 1 Field verification rank: 2 Kramat P0: 0.0743 (0.0680) P1: 0.0114 (0.0117) P2: 0.0030 (0.0032) Gini: 0.1752 (0.0115) Field verification rank: 3 Bungah P0: 0.1389 (0.1000) P1: 0.0271 (0.0221) P2: 0.0085 (0.0073) Gini: 0.2535 (0.0155) Field verification rank: 1 Panceng Ketanen P0: 0.1902 (0.0784) P0: 0.0631 (0.0499) P1: 0.0386 (0.0206) P1: 0.0102 (0.0095) P2: 0.0121 (0.0076) P2: 0.0028 (0.0031) Gini: 0.2277 (0.0142) Gini: 0.2053 (0.0137) Field verification rank: 2 Field verification rank: 1 Surowiti P0: 0.1093 (0.1143) P1: 0.0158 (0.0198) P2: 0.0039 (0.0053) Gini: 0.1672 (0.0111) Field verification rank: 3 Banyutengah P0: 0.3712 (0.2097) P1: 0.0871 (0.0664) P2: 0.0299 (0.0272) Gini: 0.2321 (0.0165) Field verification rank: 2

The SMERU Research Institute, May 2003 33333333
Table 2. Continued
ProvinceProvinceProvinceProvince DistrictDistrictDistrictDistrict SubdistrictSubdistrictSubdistrictSubdistrict VillageVillageVillageVillage
Tulungagung Ngantru Pucung Lor P0: 0.1954 (0.0355) P0: 0.1640 (0.0550) P0: 0.1118 (0.0753) P1: 0.0428 (0.0111) P1: 0.0357 (0.0162) P1: 0.0257 (0.0209) P2: 0.0144 (0.0048) P2: 0.0120 (0.0065) P2: 0.0092 (0.0085) Gini: 0.2917 (0.0163) Gini: 0.2881 (0.0207) Gini: 0.3071 (0.0255)
Field verification rank: 2 Field verification rank: 2 Field verification rank: 1
Pulerejo P0: 0.3333 (0.1866) P1: 0.0669 (0.0505) P2: 0.0199 (0.0177) Gini: 0.1964 (0.0093) Field verification rank: 3
Bendosari P0: 0.3641 (0.1520) P1: 0.0882 (0.0516) P2: 0.0307 (0.0218) Gini: 0.2427 (0.0079) Field verification rank: 2
Kauman Jatimulyo P0: 0.2380 (0.0644) P0: 0.1565 (0.0981) P1: 0.0515 (0.0184) P1: 0.0337 (0.0240) P2: 0.0167 (0.0073) P2: 0.0114 (0.0088) Gini: 0.2732 (0.0170) Gini: 0.2706 (0.0199) Field verification rank: 1 Field verification rank: 2
Kauman P0: 0.1607 (0.1071) P1: 0.0308 (0.0259) P2: 0.0093 (0.0091) Gini: 0.2342 (0.0103) Field verification rank: 1
Pucangan P0: 0.4502 (0.1961) P1: 0.1072 (0.0757) P2: 0.0364 (0.0356)
Gini: 0.2052 (0.0101) Field verification rank: 3
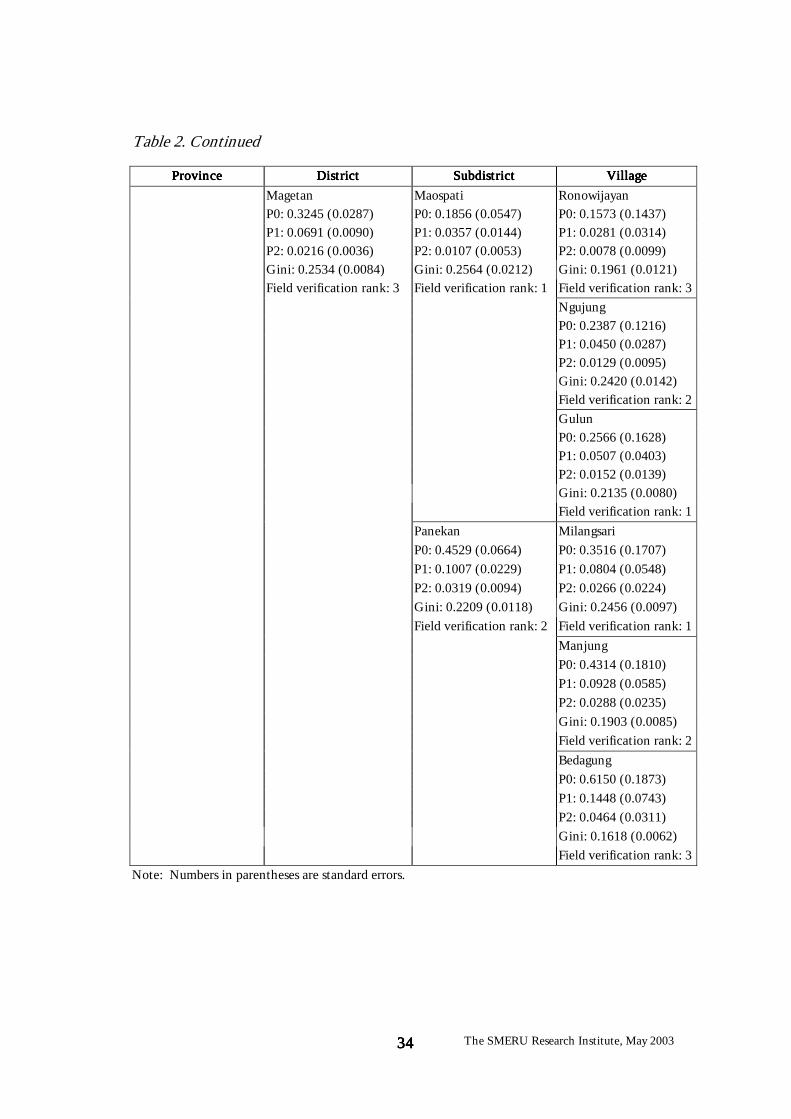
The SMERU Research Institute, May 2003 34343434
Table 2. Continued
ProvinceProvinceProvinceProvince DistrictDistrictDistrictDistrict SubdistrictSubdistrictSubdistrictSubdistrict VillageVillageVillageVillage
Magetan Maospati Ronowijayan P0: 0.3245 (0.0287) P0: 0.1856 (0.0547) P0: 0.1573 (0.1437) P1: 0.0691 (0.0090) P1: 0.0357 (0.0144) P1: 0.0281 (0.0314) P2: 0.0216 (0.0036) P2: 0.0107 (0.0053) P2: 0.0078 (0.0099) Gini: 0.2534 (0.0084) Gini: 0.2564 (0.0212) Gini: 0.1961 (0.0121) Field verification rank: 3 Field verification rank: 1 Field verification rank: 3 Ngujung P0: 0.2387 (0.1216) P1: 0.0450 (0.0287) P2: 0.0129 (0.0095) Gini: 0.2420 (0.0142) Field verification rank: 2 Gulun P0: 0.2566 (0.1628) P1: 0.0507 (0.0403) P2: 0.0152 (0.0139) Gini: 0.2135 (0.0080) Field verification rank: 1
Panekan Milangsari P0: 0.4529 (0.0664) P0: 0.3516 (0.1707) P1: 0.1007 (0.0229) P1: 0.0804 (0.0548) P2: 0.0319 (0.0094) P2: 0.0266 (0.0224) Gini: 0.2209 (0.0118) Gini: 0.2456 (0.0097) Field verification rank: 2 Field verification rank: 1
Manjung P0: 0.4314 (0.1810) P1: 0.0928 (0.0585) P2: 0.0288 (0.0235) Gini: 0.1903 (0.0085) Field verification rank: 2
Bedagung P0: 0.6150 (0.1873) P1: 0.1448 (0.0743) P2: 0.0464 (0.0311) Gini: 0.1618 (0.0062) Field verification rank: 3
Note: Numbers in parentheses are standard errors.

The SMERU Research Institute, May 2003 35353535
V. Field Verification for East KalimantanV. Field Verification for East KalimantanV. Field Verification for East KalimantanV. Field Verification for East Kalimantan A. Sample AreasA. Sample AreasA. Sample AreasA. Sample Areas The sample areas visited in East Kalimantan are shown in Table 3 at the end of this chapter. Of the two sample districts in this province, the results of poverty mapping indicate that the district with the lower poverty rate is East Kutai, which has a point estimate of 24 percent with a standard error of 4.6 percent. Meanwhile, the district with the higher poverty rate is West Kutai, which has a point estimate of 40.7 percent with a standard error of 5.5 percent. Furthermore, statistical tests indicate that the difference in poverty rates between the two districts is highly significant at a one percent level.
In East Kutai, the two subdistrict sampled were Sengatta, with a poverty rate of 12.8 percent (standard error 5.2 percent), and Sangkulirang, with a poverty rate of 27.6 percent (standard error 6.7 percent). Statistical tests indicate that the difference in the point estimates of poverty rates in the two subdistricts is significant at a five percent level. Therefore, the mapping results suggest that Sangkulirang is certainly poorer than Sengatta.
In Sengatta subdistrict, the three sample villages were Pulung Sari, with a poverty rate of 32 percent (standard error 22.1 percent), Teluk Pandan, with a poverty rate of 37.7 percent (standard error 16.9 percent), and Rantau Makmur, with a poverty rate of 38.7 percent (standard error of 22.6 percent). Statistical tests indicate that the difference in point estimates of poverty rates in the three sample villages are not statistically significant.
In Sangkulirang subdistrict, the three sample villages were Saka with a poverty rate of 28.8 percent (standard error 18 percent), Peridan, with a poverty rate of 49.6 percent (standard error 22.6 percent), and Tanjung Manis, with a poverty rate of 66.8 percent (standard error 17.9 percent). Statistical tests indicate that the poverty rate in Tanjung Manis is significantly higher than that in Saka. However, the differences in poverty rates between Peridan and Saka and between Peridan and Tanjung Manis are not statistically significant. This means that poverty-mapping results indicate Tanjung Manis is poorer than Saka, but are unable to determine whether Peridan is poorer than Saka or Tanjung Manis is poorer than Peridan.
In West Kutai, the two subdistrict sampled were Long Iram, with a poverty rate of 34.1 percent (standard error 5.9 percent) and Muara Pahu, with a poverty rate of 45.3 percent (standard error 8.3 percent). Statistical tests, however, indicate that the poverty rates in the two districts are not significantly different.
In the Long Iram subdistrict, the three sample villages were Melapeh Baru, with a poverty rate of 33.2 percent (standard error 15.7 percent), Kelubaq, with a poverty rate of 49.4 percent (standard error 20.5 percent), and Long Daliq, with a poverty rate of 64.6 percent (standard error of 20.7 percent). However, statistical tests indicate that the point estimates of poverty rates in the three sample villages are not statistically significantly different.
The SMERU Research Institute, May 2003 36363636
In the Muara Pahu subdistrict, the three sample villages were Muara Jawaq, with a poverty rate of 39 percent (standard error 17.4 percent), Muara Kelawit, with a poverty rate of 56.7 percent (standard error 23.4 percent), and Abit, with a poverty rate of 61.2 percent (standard error 21.1 percent). Similar to Long Iram, however, statistical tests again indicate that difference in point estimates of poverty rates in the three villages sample are not statistically significant.
B. Verification ResultsB. Verification ResultsB. Verification ResultsB. Verification Results a. District Levela. District Levela. District Levela. District Level • District: Kutai Timur (East Kutai)
The district was established in October 1999. It was previously part of the Kutai district, which was then split up into several new districts including East Kutai and West Kutai. The district consists of 11 subdistricts and 115 villages.
Sengatta, the capital of East Kutai, is located to the north of Samarinda, the capital of East Kalimantan. From Samarinda, Sengatta can be reached in four hours during the day through Bontang or five hours at night. The area of East Kutai that borders on Bontang is part of Kutai National Park (Taman National Kutai), a conservation area. However, the people are allowed to earn a living in some areas of the National Park, including the Teluk Pandan village, one of the sample villages.
East Kutai is located on the eastern most point of Kalimantan, on the Makassar Strait. This explains why many people from South Sulawesi, including those from the Bone, Bugis, and Makassar ethnic groups, have migrated to East Kutai. In addition, a significant number of migrants from Lombok and East Java are also present. The number of indigenous Kutai people is relatively small in comparison to these migrants. In addition to its strategic location, the migrants to East Kutai were also attracted by its rich natural resources and the fact that East Kutai was one of the resettlement areas established by the New Order regime under the transmigration program.
The people in the area work in dry land farming and on plantation producing cacao, palm, and coconut, fishermen, or employed by timber companies or Kaltim Prima Coal, a large coal company, or its business partners.
Some areas in the northern part of East Kutai, including Sangkurilang, are still inaccessible by road, making boats, which are relatively expensive, the only form of transportation available. In addition to these transportation costs, the presence of Kaltim Prima Coal is thought to be a significant cause of high price levels in East Kutai, relative to other districts in East Kalimantan.

The SMERU Research Institute, May 2003 37373737
• District: Kutai Barat (West Kutai)
West Kutai is 31,628.7 km2 or approximately 15% of the area of East Kalimantan. The capital of West Kutai is Sendawar. The district consists of 15 subdistricts and 208 villages.
As of 1999, the population was 129,456, and population growth was 2.36% per year. Population growth varies among subdistricts, with the Bongan subdistrict showing one of the highest growth rates of 7.74% per year. This is because the subdistrict is a resettlement area. Three out of five resettlement areas in West Kutai are located in the Bongan subdistrict. The Long Hubung and Long Apari subdistricts also show high population growth rates of 3.35% and 5.04% per year respectively. The population of West Kutai is concentrated in the Barong Tongkok, Melak, and Long Iram subdistricts (39.64%) while the rest of the population is divided between the remaining 12 subdistricts.
West Kutai is considered to have the most abundant supply of natural resources districts in East Kalimantan. The mining and forestry industries have high potential but are yet to be fully utilized.
Approximately 70% of the people of Kutai Barat are traditional farmers. Since 2002, the authority to manage forests has been decentralized through HPHH (Hak Pemungutan Hasil Hutan – Forest License), resulting in higher benefits for the local people. Some policy changes have also occurred in the plantation sector. For example, in the rubber plantation sub sector, investors negotiate directly with district government instead of with the central government.
• Poverty comparison
Overall, the economic condition of the people in East Kutai is better off than that in West Kutai. The main reasons include:
! East Kutai’s location on the coast is more strategic than West Kutai’s location in the hinterland.
! The Gross Domestic Regional Product (GDRP) per capita of East Kutai is higher than that of West Kutai. This is mostly due to the presence of Kaltim Prima Coal. West Kutai also benefits from the presence of a large mining company, PT Kelian Equatorial Mining, however, the benefits received by the people are much smaller and, furthermore, operations will cease in 2003.
! Infrastructure, education and health facilities are more developed in East Kutai than that in West Kutai. The government of East Kutai is considered to be more committed to the development of the health and education sectors. As a result, doctors prefer to practice in East Kutai than in West Kutai.
! East Kutai also receives development assistance from Deutsche Gessellscharf fur Technische Zusammenarbeit (GTZ), a German aid organization.

The SMERU Research Institute, May 2003 38383838
! East Kutai is more populated than West Kutai.
! The overall development of East Kutai has been faster than that of West Kutai. One indication is that the East Kutai government has already built its government offices and local parliamentary building, whereas West Kutai is still to do so.
The conclusion that the people of East Kutai are better off than those in West Kutai is consistent with the results of poverty mapping.
b. Subdistrict Level b. Subdistrict Level b. Subdistrict Level b. Subdistrict Level
East Kutai District
• Subdistrict: Sengatta
Sengatta is the capital of the East Kutai district and thus various social and economic facilities, such as banks, hotels, restaurants, schools and hospitals are available there. Sengatta can be reached by car in 4 hours from Samarinda, by good state roads.
Although Sengatta is the district capital, it is not the most populated subdistrict in East Kutai. The population density is 11.2 people/km2. Sengatta consists of 18 villages, including 8 resettlement villages (also known as SP - Satuan Pemukiman, Settlement Unit), which were established in 1993.
Some SP have already been abandoned because the transmigrants could not use dry land farming techniques. As they were predominantly from Java, they were more familiar with wet land farming. In addition, according to many transmigrants, the government had made many promises such as the provision of palm plantations, but these never eventuated. The situation in one village was so bad that 50% of the residents abandoned it.
Kaltim Prima Coal is located in Sengatta and offers various job and business opportunities for the local people. A significant number of people work either for the company or for its business partners.
• Subdistrict: Sangkurilang
Sangkurilang is located in the north of East Kutai and its capital, Benua Baru, is located on a small island. At present, Sangkurilang consists of 14 villages, but there is a plan to expand this to 15 villages.
It takes three to four hours by car to reach Sangkurilang from Sengatta through the Bengalon and Bukit Sekerat subdistrict. The roads, made of compacted gravel, are poor, steep and twisting. Before reaching the village one must cross the bay, which takes 15 minutes and costs Rp 10,000. In the Benua Baru village there are no roads for four-wheeled vehicles, therefore people use bicycles or motorcycles for transportation.
The SMERU Research Institute, May 2003 39393939
Most people in Sangkurilang are farmers, fishermen, or wood collectors. Forty percent of people rely on the forestry sector for a living, whereas 60% rely on the agricultural, fishing and plantation sectors. This implies that the people of Sangkurilang are highly dependent on the natural resources in the subdistrict.
Health and education facilities are limited. Puskesmas Keliling (a mobile public healthcare facility) was in service during 2000-2001 but the boat is no longer in operation by 2002. In 2001 some funds were allocated to build Pusban (secondary primary healthcare center), however, when the Pusban were ready, no doctors or nurses were willing to be assigned there. This has resulted in health standards, which remain poor in the area.
• Poverty comparison
It was concluded that the people of Sengatta are more prosperous than the people of Sangkurilang. The reasons for this are the following:
! As the capital of East Kutai, Sengatta is more strategically located. It is the center of economic activities, health services and education facilities. As Sangkurilang is located in the hinterland, access to the subdistrict is much more difficult and costly.
! The people of Sangkurilang are faced with limited job opportunities and they are heavily dependent on nature. On the contrary, there are greater variety of jobs in various sectors in Sengatta, including work in the agricultural, plantation and trade sectors, or work with Kaltim Prima Coal or its business partners.
! The quality of human resources is lower in Sangkurilang than that in Sengatta. One reason for this is that education facilities are very limited in Sangkurilang and it is costly to be educated outside of the subdistrict. The poor quality of human resources limits the job opportunities and has resulted in a high dependency on nature.
This finding that the people of Sengatta are more prosperous than those in Sangkurilang is consistent with the results from poverty mapping.
West Kutai District
• Subdistrict: Long Iram
Long Iram consists of 21 villages, 75% located on the banks of the Mahakam River and 25% in the hinterland. Long Iram is 3,126.46 km2, and in 2000, the population was 22,636 with a population density of 7 people per km2. In the north, it borders the Long Hubung subdistrict, in the east, it borders the Tabang, Kembang Janggut and Melak subdistricts. In the south it borders the Barong Tongkok and Damai subdistricts, meanwhile in the west, it borders the Barito district.

The SMERU Research Institute, May 2003 40404040
In the dry season, the capital of Long Iram becomes the center of trade, as the river subsides, and boats cannot go further up the river. Tering acts as a port where goods are loaded from larger boats into ketingting (small boats) to be taken further up the river.
Most people in Long Iram work as farmers or fishermen, or are employed in the private sector. Education facilities available include one public and one private senior high school, one public junior high school and three private junior high schools.
• Subdistrict: Muara Pahu
Muara Pahu is located 46 km from the capital of West Kutai and 272 km from the capital of East Kalimantan. It is strategically located between the Mahakam and Kedang Pahu Rivers. In 2000, the population was 14,031 with a population density of 0.20 people per km2. The subdistrict is 2,833.80 km2, and consists of 28 villages and 7 sub-villages. Five villages are located around the subdistrict capital, three on the banks of the Mahakam River, four on the banks of the Kedang Pahu River, six on the banks of the Jelau River, six on the banks of the Tuang River, and three on the banks of the Kelawit River.
Approximately 60% of the people in Muara Pahu are farmers, 20% are fishermen and the remainders are traders, entrepreneurs, or private sector employees. Agricultural products include rice, fruit and vegetables. Rubber plantations also exist in the hinterland. Fishermen use karamba (a basket placed in a stream to raise fish). The economic condition has improved since 2002 due to HPHH that has attracted investors to the local forestry sector. In addition, coal mining, palm plantations and the fishing sector also contribute to the local economy.
Approximately 40-50% of the village people are considered to be poor, and the rest are considered prosperous. Generally, the poor have not attained education past elementary school and do not have permanent jobs. Those who are considered prosperous mainly work for timber or coal mining companies or on palm plantations. These people reside close to the subdistrict capital or on the banks of the Mahakam River. According to some respondents, however, the people of Muara Pahu tend to be consumptive, and like to gamble and spend money on luxury goods such as motorcycles. As a result those who possess a motorcycle or a permanent house are not necessarily prosperous.
Education facilities include 33 elementary schools (28 in villages and five in dusun), 14 junior high schools (three public, seven open, and four private), and one private senior high school.
The SMERU Research Institute, May 2003 41414141
• Poverty comparison
The people of Long Iram are considered to be more prosperous than those of Muara Pahu due to the following reasons:
! Villages in Muara Pahu are mostly isolated in the hinterland and hard to access by either road or water. Consequently, health and education in Muara Pahu are considered to be deficient. On the contrary, villages in Long Iram are mostly located on the banks of the Mahakam River and thus easily accessible. PT Kelian Equatorial Mining has also built some roads in Long Iram and this has improved access.
! People residing on the banks of the Mahakam River work as fishermen whereas people residing in the hinterland are mostly traditional nomadic farmers with little exposure to technology.
! The capital of Long Iram is an old settlement and was previously the kawedanan capital during the colonial era. Therefore the facilities are better than that in Muara Pahu.
The conclusion that the people in Muara Pahu are in general less prosperous than the people in Long Iram is consistent with the results from poverty mapping.
c. Village Levelc. Village Levelc. Village Levelc. Village Level
Sengatta Subdistrict in East Kutai
• Village: Teluk Pandan
Teluk Pandan is located on the side of the main road that connects the Bontang district and Sengatta. The village is approximately one hour from Sengatta, but only 30 minutes from Bontang. Teluk Pandan is actually located in the Kutai National Park. However, the people had resided in the area long before it was declared a national park. The government, therefore, has allowed them to remain in the area and has even officially recognized their village.
In November 2001, Teluk Pandan, which was established in the 1960s, was split up into three new villages: Teluk Pandan, Sukarahmat, and Sukadamai. The Teluk Pandan village is 79 km2 and in 2002, the population reached 3,583 in 881 households.
Agriculture is the main economic sector in the village, with each farmer owning approximately two hectares of land, usually devoted to cacao and banana plantations. Others have obtained work as traders, civil servants such as teachers or pusban staff, and entrepreneurs.
The existing public facilities include a pusban, two elementary schools (one public and one private), and one private junior high school. Around 60 of the 800 households have access to electricity (provided by the state electricity company) and

The SMERU Research Institute, May 2003 42424242
the rest rely on private generators, or kerosene lamps. Houses have been raised wooden floors, wooden walls, and corrugated iron roofs, and are generally well spaced from each other. Toilet facilities are not common in the village. The people make use of rainwater in the wet season and river in the dry season, water containers are dirty and harbor mosquitoe larvae.
• Village: Rantau Makmur
Rantau Makmur was originally a resettlement village together with seven other villages. Initially, these eight villages were grouped as one village named Rantau Pulung. Rantai Makmur can only be accessed by a logging road, owned by a timber company located in the village that has been in operation since 1976, long before the village was established. It normally takes one hour to get to Sengatta from Rantau Makmur, through the Kaltim Prima Coal site. However, in heavy rain, the road, which is only one-truck wide, becomes hazardous and is often impassable.
There are approximately 280 households and most of them still occupy the standard houses built by the government for the transmigration program, with the houses are 6m x 6m and have wooden floors and walls, and corrugated iron roofs. The village is outside the state electricity network and as a result, approximately 50% of the households possess a generator, and the other 50% still rely on kerosene lamps. The public facilities in the village include one elementary school and one pusban, with a mantri (a medical aide) residing in the village. Since there is no bidan desa (a village midwife), for births the villagers rely on the dukun terlatih (a trained traditional midwife).
• Village: Pulung Sari
Similar to Rantau Makmur village, Pulung Sari is also one of the resettlement villages in Sengatta. Pulung Sari is also accessible by a logging road, although it is further away from Sengatta. Forty percent of the population originates from Lombok and Java. Initially, there were 250 households in Pulung Sari, but currently there are only 112 households as the rest have left the village or moved to Sengatta. This sharp decline was due to the lack of experience in dry-land farming. Many transmigrants abandoned the two hectares of land provided by the government and turned to wood collecting in nearby forests.
• Poverty comparison
In comparing the three sample villages, Teluk Pandan is considered to be more prosperous than the two resettlement villages. The quality of human resources, accessibility, and the variety of economic sectors (banana and cocoa plantations, agriculture, and fishery) are among the factors that make Teluk Pandan relatively prosperous.
Some respondents stated that Rantau Makmur is more prosperous than Pulung Sari due to the presence of the timber company in Rantau Makmur, whereas other respondents stated the contrary. According to this second group, Rantau Makmur is
The SMERU Research Institute, May 2003 43434343
less prosperous because the people are too reliant on the forestry sector, a sector that is declining due to forest depletion.
The field verification results differ from the poverty mapping results, however, the difference in point estimates of poverty rates of the three villages are not statistically significant.
Sangkurilang Subdistrict in East Kutai
• Village: Saka
It takes approximately 15 minutes to get to Saka from the subdistrict capital by speedboat. The residential area is built close to the river and is connected to the pier by a dirt trail. Wide roads for trucks are found in the village, but are still made of dirt.
Saka consists of two dusun, Saka and Mandu Luar, where the head of the village resident is located. Most of the houses are made of wood, have a thatched roof, and are usually around 4m x 8m in size. Other houses, however, are permanent buildings, have ceramic floors and are relatively spacious. In general, houses are equipped with toilet facilities. Houses have been built close together and are generally of a high quality as a significant number of residents are involved in the timber industry.
This village is still outside of the state electricity network. Approximately 20% of the households possess a generator, while the rest rely on kerosene lamps. There is only one elementary school, two mosques and two prayer houses.
There are 300 households in the village. Most of the people are nomadic farmers who plant mountain paddies. Others collect wood, work for the timber company or plant various fruits such as durian and rambutan, which are then sold in Sangkurilang.
There were no significant changes in the village economy during the 2000-2002 periods. Some investors came to the village searching for oil and an airport was built nearby to support exploration activities. Oil reserves did not meet expectations and the planned venture was cancelled. Illegal logging is evident and constitutes a significant economic activity in the village.
A significant number of the villagers are involved in lucrative timber businesses. However, since the people are highly dependent on the presence of the timber company, it is feared that when the forests are completely depleted, the village economy will collapse. A palm company, which holds a land license for 800 hectares, is also present; however, there are also some fears about its sustainability as the business is declining. Besides, according to some respondents, the palm company is actually intending to exploit the forest for its timber rather than developing and expanding the palm plantation business.

The SMERU Research Institute, May 2003 44444444
It is mainly the nomadic dry-land farmers who are considered poor, whereas most of the traders and company employees are not. The village has abundant natural resources, thus supporting the economy of the village. However, the quality of human resources is relatively low with primary education being the highest level of education for most people.
• Village: Peridan
Peridan can only be accessed by river or sea. From the subdistrict capital, it takes approximately 10 minutes by speedboat or 25 minutes by regular motorboat to reach Peridan.
Almost all houses have wooden floors and walls, and hatched roofs. The average size of the houses is 4m x 8m. The village is not serviced by the state electricity company and only 12 houses are equipped with a generator. Only a small proportion of the village roads are sealed and the rest are still made of dirt.
According to a teacher in the village, most of the residents can be considered poor because those who are not poor have moved out of the village. The main sources of income include the production of coconut oil, coconut palm sugar and rice, which can be harvested only once a year. Only the village-head, deputy village head and government employees such as teachers are not considered poor. The poor do not have permanent jobs and rely on nature for a living.
Six of eight elementary school students continue their education to junior high school. All the students can afford to buy uniforms, but only 50% of them can afford to buy shoes.
25% of the people reside in the Segara dusun, which is considered relatively developed. Most of the people in this dusun work for a timber company that offers a good income. However, the supply of wood is diminishing, and it is feared that the company will soon close, as was the case with the previous timber company, that survived for only seven months.
• Village: Tanjung Manis
From the subdistrict capital, it takes about 20 minutes to get to Tanjung Manis by speedboat, but up to one hour by regular motorboat, however the river is impassable during the dry season. The pier looks empty and not well maintained. The residential area is also connected to the capital by a wet, slippery, narrow, over-grown dirt trail.
The village consists of five RT. RT 3, consisting of 35 households, is relatively developed because there are rice fields and coconut plantations. The village capital is located in RT 2, one-hour walk from the pier. RT 3, 4, and 5 are difficult to access, leaving people to rely on the river. Unfortunately, the river rises only twice a month, making the route by river almost impossible.

The SMERU Research Institute, May 2003 45454545
Most houses have wooden floors and walls, thatched roofs are 4m x 6m in size and do not have toilet facilities. The village is still outside the state electricity network and only a small proportion of households (approximately 5%) possesses generators. Wells and rain water are the sources of clean water. All village roads are dirt and there are no healthcare facilities available.
Some people rely on cocoa and coconut plantations for a living, while others rely on fishery. There are 200 households and 900 people. Approximately 50% of the population is considered poor. Some of the poor do not have permanent jobs but the remainders do. The poor who have permanent jobs, however, are still highly dependent on nature. The other 50% are not considered poor, and, in general, own cocoa or coconut plantations.
• Poverty comparison
All respondents concluded that Tanjung Manis is less prosperous compared to Saka and Peridan. This is shown by the poor condition of infrastructure, such as the pier, local dirt roads, and bridges. In addition, access is also very limited, making the village relatively isolated.
Comparing Saka and Peridan proved more difficult as some respondents concluded that Saka is more prosperous, while others concluded that Peridan is more prosperous. According to the Camat (the head of the subdistrict) and the Kepala Urusan Pemerintahan Kecamatan Sangkurilang (the Head of Governmental affairs in the Sangkurilang subdistrict) Peridan is more prosperous than Saka. Meanwhile, according to PLKB (family planning field staff) and the head of the Sangkurilang puskesmas, Saka is more prosperous than Peridan. The head of the Sangkurilang puskesmas mainly focused on health awareness, which is better in Saka. These results are, in general, consistent with the results from poverty mapping, which order Saka, Peridan and Tanjung Manis from the lowest to the highest poverty rates.
Long Iram Subdistrict in West Kutai
• Village: Melapeh Baru
Melapeh Baru’s population is 1,500, consisting of 311 households in 4 RT. More than 70% of the people are farmers, but on average own only one hectare. Products include rice, cassava, corn, and vegetables. The soil is relatively fertile, resulting in high productivity. The people of Melapeh Baru also rely on a rubber plantation of 100 hectares, which has been in operation since 1994. The workers receive Rp 25,000 per day. A significant number of the people also work for PT Kelian Equatorial Mining and around 10-15 residents work for its affiliates. Approximately 5% of the villagers are involved in the timber industry and they are relatively prosperous. Approximately 10 households breed chickens.
The village has a long record of high economic performance and there are many permanent houses. Access to the village is good, as PT Kelian Equatorial Mining has built many roads in the area. The company also contributed 90% of the funds to

The SMERU Research Institute, May 2003 46464646
build two local elementary schools thus improving education facilities. A significant number of children continue their education to high school, and even to tertiary education. The village also has a hospital. No less than 50% of village residents possess a motorcycle, and 5% possess a car.
• Village: Long Daliq
Long Daliq is an old village, established during the colonial era. Most people are farmers with the average land ownership being around one hectare. Agricultural commodities include rice, cassava, and horticulture crops. Others work as fishermen or wood collectors.
In the dry season the village is accessible by land. The state electricity company does not service the village. Education facilities include an elementary school and open junior high school. A significant proportion of school age children goes to senior high school in Samarinda.
Previously there was a logging industry in the village, which made significant contributions to the village economy. As the industry is no longer in operation, incomes have declined and infrastructure has degenerated.
According to community leaders, about 30% of people are poor. Most of these people farm small dry lands. Some farmers with large landholdings are also poor. This is because productivity is low due to a low technology and the high cost of production.
• Village: Kelubaq
Kelubaq is 60 km2 and has a population of 316 people. Of the 114 households, including 20 who live in the forests, 60 households are still considered poor.
Approximately 90% of the residents participate in logging activities for a living. Others work on rubber plantations, in wood factories (5 people), become government employees, or farm rice, vegetables, coffee, and horticultural crops. Unfortunately, many farmers are still nomadic, making it difficulties for their children to go to school. Many farmers collect rattan to supplement their income.
The village is close to Tering harbor and in the dry season it can be accessed by road from Tering. Education facilities are limited. There are only three classes at the local branch of an elementary school for grades 1 to 3. Students who want to continue to grade 4 to 6 have to go to the main school outside the village.
• Poverty comparison
The people in Melapeh Baru are considered to be the most prosperous. This is supported by the significant number of people who possess a motorcycle or car and can afford to send their children to senior high school and even tertiary education. This is consistent with the results from poverty mapping.

The SMERU Research Institute, May 2003 47474747
It was concluded that Long Daliq is more prosperous than Kelubaq. This was shown by high productivity in the agricultural sector and the number of public facilities, especially education, in Long Daliq. In addition, access to the subdistrict capital is easier from Long Daliq than from Kelubaq. This conclusion contradicts the poverty mapping results, although the difference in poverty estimates of the two villages is not statistically significant.
Muara Pahu Subdistrict in West Kutai
• Village: Muara Jawaq
Muara Jawaq is relatively close to the subdistrict capital and can be reached by motorboat in 1 hour from Muara Pahu but is also accessible by land. This village is also considered as the main gate to other villages. Muara Jawaq is the center of the timber industry, with wood arriving from the hinterland to be processed by 2-3 timber mills in the village. Electricity is provided by companies operating in the village. An elementary and public junior high school, as well as a healthcare facility, is available.
The population of 1,500 people, or 400 households, is the highest in this sample villages. Residents work as farmers, private sector employees, factory workers, traders and wood traders. However, 75% of the residents are dry land, nomadic farmers who farm rice, corn, cassava, rubber, palm sugar and vegetables. On average, each household possesses one and a half hectares of land, two thirds for dry-land farming and the remainder for wetland farming. The variety of jobs implies that the village is relatively prosperous and that the economy is growing.
Most respondents believed that less than 25% of the population are poor, the majority of whom are farmers. The remainders of the population are considered to be above the poverty line, but only 25% are considered wealthy. They are mostly traders or wood traders, and have graduated from at least secondary school.
• Village: Abit
Abit has a population of 568 or 155 households. On average, there are 2 families living in one house. The village can be reached from Muara Pahu by motorboat in 90 minutes or from Muara Jawaq by motorcycle and speedboat in one hour. Recently, 20 families moved to this village, indicating that Abit’s economy is becoming more appealing.
The main occupation in the village is traditional wetland and dry-land farming. In general, each household owns two hectares of land. However, on average, only one hectare is fully utilized. To raise additional income, farmers intercrop cassava and vegetables between rice fields. Crops are only planted once a year. The village is also seriously affected by floods and pests.
Boat builders can earn between Rp 250,000 and Rp 350,000 per boat. The implementation of HPHH has spurred economic growth in the 2000-2002 period, as
The SMERU Research Institute, May 2003 48484848
indicated by some newly renovated houses. Some of the village roads were built by one of the timber companies located in the village.
Some respondents believed that approximately 70-80% of the people are poor and most of them are farmers. Those who are not considered poor possess a motorcycle or motorboat, and have obtained work as traders or government employees. A significant number of Abit school-age children are enrolled at junior high school in Muara Jawak and at the open junior high school.
• Village: Muara Kelawit
The village is rather isolated, as it is located far from the subdistrict capital and is not easily accessed. The closest market is in the subdistrict capital, which is three hours by motorboat.
In 1958-1960, Muara Kelawit was a prosperous village. Unfortunately, a significant number of people, including some community leaders, migrated to Samarinda to earn a better living, leaving the village deserted. The current population is only 182 people or 46 households. Many people believe that the village is relatively under-developed as a number of its residents have left the village and a large forest fire occurred in 1982.
Most villagers are dry-land farmers and, on average, each owns 1.5 hectares of dry land, but of a limited potential. Rice is only harvested once a year. The second most common occupation is rattan collecting. On average, each household owns five hectares of rattan plantation. Each family can earn Rp25,000 per day by selling 50 kg of rattan. Unfortunately, rattan cannot be harvested all the year. Additional seasonal income for farmers also comes from fishing.
Prices in the village are considered high, making life difficult. More than 75% of the village people are considered poor. In general, those who are not considered poor are government employees, farmers who possess land or traders, who usually possess a motorboat.
The villagers are relatively under-educated. There are now only 13 students (down from 20) and two teachers. There are no health facilities in the village. The closest puskesmas is located in neighboring village or in the subdistrict capital.
• Poverty comparison
Muara Jawak is the most prosperous village. This is consistent with the results of poverty mapping. This is mainly because Muara Jawak is the center of the timber industry and is easily accessed from the district capital. In comparing Abit and Muara Kelawit, it can be concluded that Abit is more prosperous than Kelawit. Access to the district capital, as well as health and education facilities are better in Abit than that in Muara Kelawit. Adding to this, some timber mills are also located in Abit. The results of poverty mapping indicate that the poverty rate in Muara Kelawit is lower than that in Abit, but the difference is relatively small and statistically insignificant.
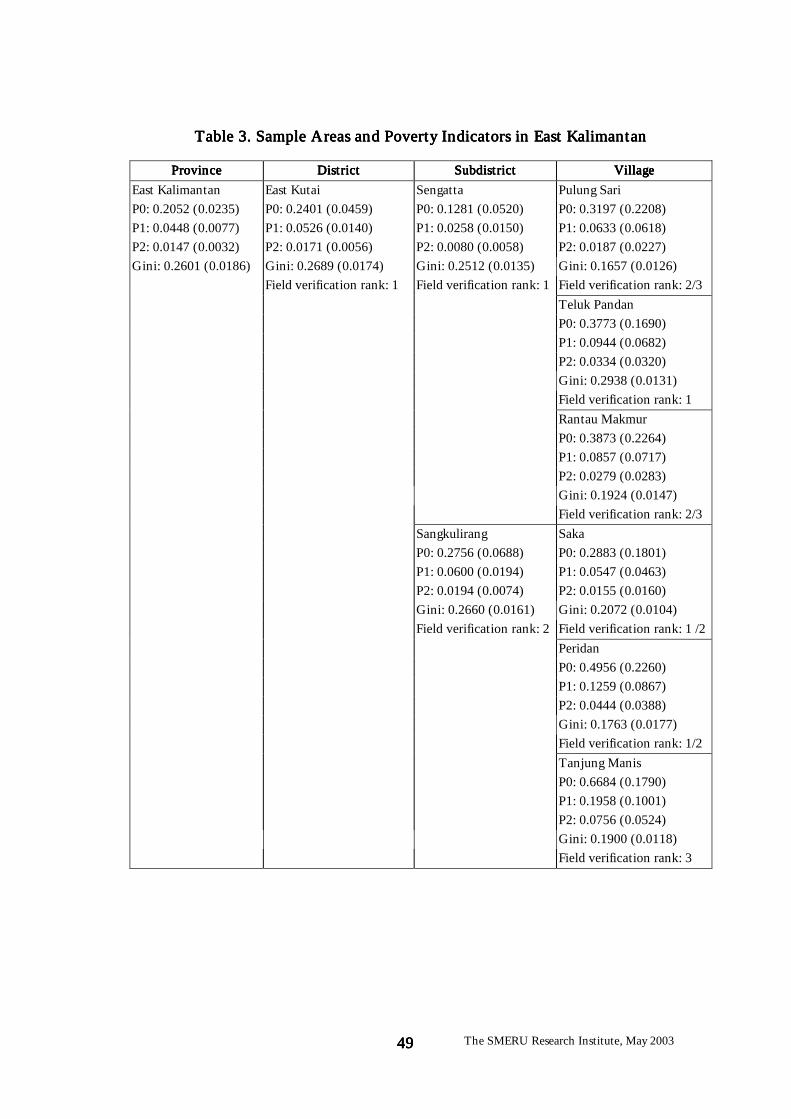
The SMERU Research Institute, May 2003 49494949
Table 3. Sample Areas and Poverty Indicators in East KalimantanTable 3. Sample Areas and Poverty Indicators in East KalimantanTable 3. Sample Areas and Poverty Indicators in East KalimantanTable 3. Sample Areas and Poverty Indicators in East Kalimantan
ProvinceProvinceProvinceProvince DistricDistricDistricDistrictttt SubdistrictSubdistrictSubdistrictSubdistrict VillageVillageVillageVillage
East Kalimantan East Kutai Sengatta Pulung Sari P0: 0.2052 (0.0235) P0: 0.2401 (0.0459) P0: 0.1281 (0.0520) P0: 0.3197 (0.2208) P1: 0.0448 (0.0077) P1: 0.0526 (0.0140) P1: 0.0258 (0.0150) P1: 0.0633 (0.0618) P2: 0.0147 (0.0032) P2: 0.0171 (0.0056) P2: 0.0080 (0.0058) P2: 0.0187 (0.0227) Gini: 0.2601 (0.0186) Gini: 0.2689 (0.0174) Gini: 0.2512 (0.0135) Gini: 0.1657 (0.0126)
Field verification rank: 1 Field verification rank: 1 Field verification rank: 2/3
Teluk Pandan P0: 0.3773 (0.1690) P1: 0.0944 (0.0682) P2: 0.0334 (0.0320) Gini: 0.2938 (0.0131) Field verification rank: 1
Rantau Makmur P0: 0.3873 (0.2264) P1: 0.0857 (0.0717) P2: 0.0279 (0.0283) Gini: 0.1924 (0.0147) Field verification rank: 2/3
Sangkulirang Saka P0: 0.2756 (0.0688) P0: 0.2883 (0.1801) P1: 0.0600 (0.0194) P1: 0.0547 (0.0463) P2: 0.0194 (0.0074) P2: 0.0155 (0.0160) Gini: 0.2660 (0.0161) Gini: 0.2072 (0.0104) Field verification rank: 2 Field verification rank: 1 /2
Peridan P0: 0.4956 (0.2260) P1: 0.1259 (0.0867) P2: 0.0444 (0.0388) Gini: 0.1763 (0.0177) Field verification rank: 1/2
Tanjung Manis P0: 0.6684 (0.1790) P1: 0.1958 (0.1001) P2: 0.0756 (0.0524) Gini: 0.1900 (0.0118) Field verification rank: 3

The SMERU Research Institute, May 2003 50505050
Table 3. Continued
ProvinceProvinceProvinceProvince DistrictDistrictDistrictDistrict SubdistrictSubdistrictSubdistrictSubdistrict VillageVillageVillageVillage
West Kutai Long Iram Melapeh Baru P0: 0.4074 (0.0552) P0: 0.3408 (0.0588) P0: 0.3320 (0.1572) P1: 0.0965 (0.0209) P1: 0.0747 (0.0184) P1: 0.0680 (0.0459) P2: 0.0328 (0.0092) P2: 0.0240 (0.0075) P2: 0.0206 (0.0173) Gini: 0.2502 (0.0134) Gini: 0.2394 (0.0154) Gini: 0.2144 (0.0119)
Field verification rank: 2 Field verification rank: 1 Field verification rank: 1
Kelubaq P0: 0.4943 (0.2049) P1: 0.1163 (0.0709) P2: 0.0388 (0.0306) Gini: 0.1478 (0.0165) Field verification rank: 3
Long Daliq P0: 0.6459 (0.2069) P1: 0.1790 (0.0961) P2: 0.0667 (0.0467) Gini: 0.1700 (0.0127)
Field verification rank: 2
Muara Pahu Muara Jawaq P0: 0.4525 (0.0826) P0: 0.3895 (0.1741) P1: 0.1087 (0.0296) P1: 0.0872 (0.0595) P2: 0.0371 (0.0128) P2: 0.0284 (0.0244) Gini: 0.2307 (0.0129) Gini: 0.2159 (0.0085)
Field verification rank: 2 Field verification rank: 1
Muara Kelawit P0: 0.5667 (0.2342) P1: 0.1402 (0.0938) P2: 0.0483 (0.0436) Gini: 0.1286 (0.0176) Field verification rank: 3
Abit P0: 0.6120 (0.2112) P1: 0.1575 (0.0864) P2: 0.0552 (0.0389) Gini: 0.1593 (0.0133) Field verification rank: 2
Note: Numbers in parentheses are standard errors.
The SMERU Research Institute, May 2003 51515151
VI. ConclusionVI. ConclusionVI. ConclusionVI. Conclusion
As mentioned in chapter two, the most important reason for measuring poverty is to allow for poverty comparisons over time or across regions. Judged from this objective, the results of field verification show that the poverty maps created in this study have been successful in ranking regions according to their poverty conditions, particularly at the district and subdistrict levels. At the village level, however, the presence of relatively large standard errors of the poverty rate point estimates makes the ordering of villages more difficult to determine with certainty.
This implies that every poverty mapping exercise should attempt to attain the lowest possible magnitudes of standard errors of point estimates of the poverty indicators measured. This effort should start at the very first stage of poverty mapping method, which ensures that the variables measured in household survey are exactly the same and statistically identical with that in population data set. This may also point to the need to find and incorporate community or village level variables beyond what are available from population census means and village census data.
However, there is certainly a practical limit to the effort of reducing the standard errors of the poverty rate point estimates. Therefore, one may not want to use the poverty mapping results for very low-level administrative areas and only use the maps of areas where the standard errors are reasonably acceptable. For this particular study, it seems that one can use the poverty mapping results down to the subdistrict level with reasonable confidence. This is already a great achievement compared to the statistics currently available, i.e. the reasonably measured official provincial-urban/rural poverty statistics and the methodologically weak district poverty statistics.
Another implication from the results of the field verification points to the need to use the results of poverty mapping not as a substitute but rather as a complement to other information available on regional poverty profiles. When other information supports the results of poverty mapping, it will increase confidence on the accuracy of the mapping. When they disagree, however, one need to be more careful and seek other sources of information, including conducting field verification if necessary.