developing a field test for measuring unconfined
TRANSCRIPT
University of Montana University of Montana
ScholarWorks at University of Montana ScholarWorks at University of Montana
Graduate Student Theses, Dissertations, & Professional Papers Graduate School
1994
Developing a field test for measuring unconfined compressive Developing a field test for measuring unconfined compressive
strength of indurated materials strength of indurated materials
Bradley J. Cook The University of Montana
Follow this and additional works at: https://scholarworks.umt.edu/etd
Let us know how access to this document benefits you.
Recommended Citation Recommended Citation Cook, Bradley J., "Developing a field test for measuring unconfined compressive strength of indurated materials" (1994). Graduate Student Theses, Dissertations, & Professional Papers. 2038. https://scholarworks.umt.edu/etd/2038
This Thesis is brought to you for free and open access by the Graduate School at ScholarWorks at University of Montana. It has been accepted for inclusion in Graduate Student Theses, Dissertations, & Professional Papers by an authorized administrator of ScholarWorks at University of Montana. For more information, please contact [email protected].
Maureen and Mike MANSFIELD LIBRARY
The University of
Montana Permission is granted by the author to reproduce this material in its entirety, provided that this material is used for scholarly purposes and is properly cited in published works and reports.
** Please check "Yes" or "No" and provide signature**
Yes, 1 grant permission No, I do not grant permission
Author's Signature
Date: ' ft . /??"/
Any copying for commercial'purposes or financial gain may be undertaken only with fhe author's exnlint mncpm-

DEVELOPING A FIELD TEST FOR MEASURING
UNCONFINED COMPRESSIVE STRENGTH
OF INDURATED MATERIALS
by
Bradley J. Cook
B.S., University of Montana, 1989
presented in partial fulfillment of the requirements
for the degree of
Master of Science
The University of Montana
1994
Approved by:
Chairperson
Dean, Graduate School
Date
UMI Number: EP33848
All rights reserved
INFORMATION TO ALL USERS The quality of this reproduction is dependent on the quality of the copy submitted.
In the unlikely event that the author did not send a complete manuscript and there are missing pages, these will be noted. Also, if material had to be removed,
a note will indicate the deletion.
UMT DiMHGtftatksn
UMI EP33848
Copyright 2012 by ProQuest LLC.
All rights reserved. This edition of the work is protected against unauthorized copying under Title 17, United States Code.
ProQuest'
ProQuest LLC. 789 East Eisenhower Parkway
P.O. Box 1346 Ann Arbor, Ml 48106-1346

ACKNOWLEDGEMENTS
I wish to thank Professors Tom Nimlos, Don Bedunah, Bill Woessner, and Hans
Zuuring for their technical assistance.
I would also like to thank Jim Calcaterra and Doug Wright for their advice and
permission to use the Tinius Olsen and proving rings, at the Materials Testing
Laboratory, Lolo National Forest, in Missoula.
In addition, I wish to express my great appreciation to everyone at the Riparian
and Wetland Research Program for their help (especially Bob Ehrhart, who has to
share an office with me, and Bill Thompson, who helped lug and shift the dead
weights) and the office space.
And finally, I thank Amy and Emma, for their support and understanding while
I finished this ... work.
This research was supported, in part, under Grant No. DHR-5600-G-00-0081-00,
Program in Science and Technology, Office of the Science Advisor, Agency for
International Development.
i
Cook, Bradley J., M.S., December 1994 Forestry
Developing a Field Test for Measuring Unconfined Compressive Strength of Indurated Materials (38 pp.)
- f jp Director: Thomas J. Nimlos
This paper presents field techniques for cutting, forming, and strength testing of indurated materials. Measuring unconfined compressive strength of blocks pf*is the standard strength test of indurated materials. However, field techniques for obtaining quantified measurements of unconfined compressive strength have never been described. These techniques for cutting and forming blocks apply equally to either laboratory or field situations. Testing indurated volcanic-ash blocks, at various moisture contents, has important ties to reclamation where this induration is exposed. A modified hydraulic jack was used to obtain quantified measurements of unconfined compressive strength of ash-flow tuff (tepetate), fine sandstone, coarse sandstone, and chalk in the field. The techniques described in this paper are inexpensive, precise, and testing shows them to have a nearly perfect linear relationship to standard laboratory techniques.
ii
CONTENTS
ACKNOWLEDGEMENTS i
ABSTRACT ii
LISTS of PHOTOS and FIGURES iv
INTRODUCTION 1
PART ONE: Techniques for cutting, forming, and moisture
adjustment of sampling materials 3
PART TWO: Strength tests and the development and calibration
of a modified hydraulic jack 9
PART THREE: Application and results of field testing the
Modified Jack 18
PART FOUR: Conclusions 24
BIBLIOGRAPHY 27
APPENDIX 1: Regressions of paired direct readings 29
APPENDIX 2: Paired direct readings 32
APPENDIX 3: Block dimensions and strength measurements . 35
iii
LIST of PHOTOS
Photo 1. Quick saw 5
Photo 2. Chop saw 6
Photo 3. The Tinius Olsen 10
Photo 4. Calibration of the Modified Jack using the Tinius Olsen ... 13
Photo 5. Calibration of the Modified Jack using proving rings .... 15
LIST of FIGURES
Figure 1. The Modified Jack 12
Figure 2. Calibration curve of the Modified Jack using the Tinius Olsen . 14
Figure 3. Calibration curve of the Modified Jack using proving rings . . 16
Figure 4. Calibration curve of the Modified Jack using dead weights . . 17
Figure 5. Graph of readings from paired tepetate blocks 19
Figure 6. Graph of readings from paired blocks made from fine sandstone,
coarse sandstone, and chalk 21
iv

INTRODUCTION
Indurated volcanic-ash materials are common wherever volcanism has
occurred; they are ash-flow tuffs, air-fall ash or reworked ash (Vera and Lopez,
1986 and Nimlos, 1991). Pedocementation by silica, carbonates and iron oxides,
especially at the surface of the materials, has augmented their induration.
The nomenclature of indurated volcanic-ash materials is vague and
confusing for two reasons. In the first place, at least one local name, usually of
indigenous dialect, has been applied to these materials in each country (Nimlos,
1987). Moreover, the nomenclature is obscure because the lower limit of
pedologic development is difficult to identify, so it is not clear whether these
materials are soil or rock.
Indurated volcanic-ash materials are widespread throughout the Pacific
Rim portion of Latin America. In many areas, the porous overlying soil has been
completely eroded leaving the indurated material exposed. Two-thirds of the
land area in some watersheds in the Valley of Mexico, the basin that contains
Mexico City, have had all soil eroded and the induration (locally called tepetate)
exposed (Nimlos and Ortiz., 1987). Near Quito, Ecuador, exposure of indurated
material (locally called cangahua) is so extensive that one can walk for two miles
without touching soil.
Reclaiming these lands is necessary if the countries of Latin America are to
meet their agricultural production needs. Historically, campesinos (farmers)
have reclaimed indurated materials by breaking chunks of the material loose
from the matrix and building some type of structure; usually terraces with them.
The most famous complex of terraces are those built by the Incas at Machu
Picchu.
1
2
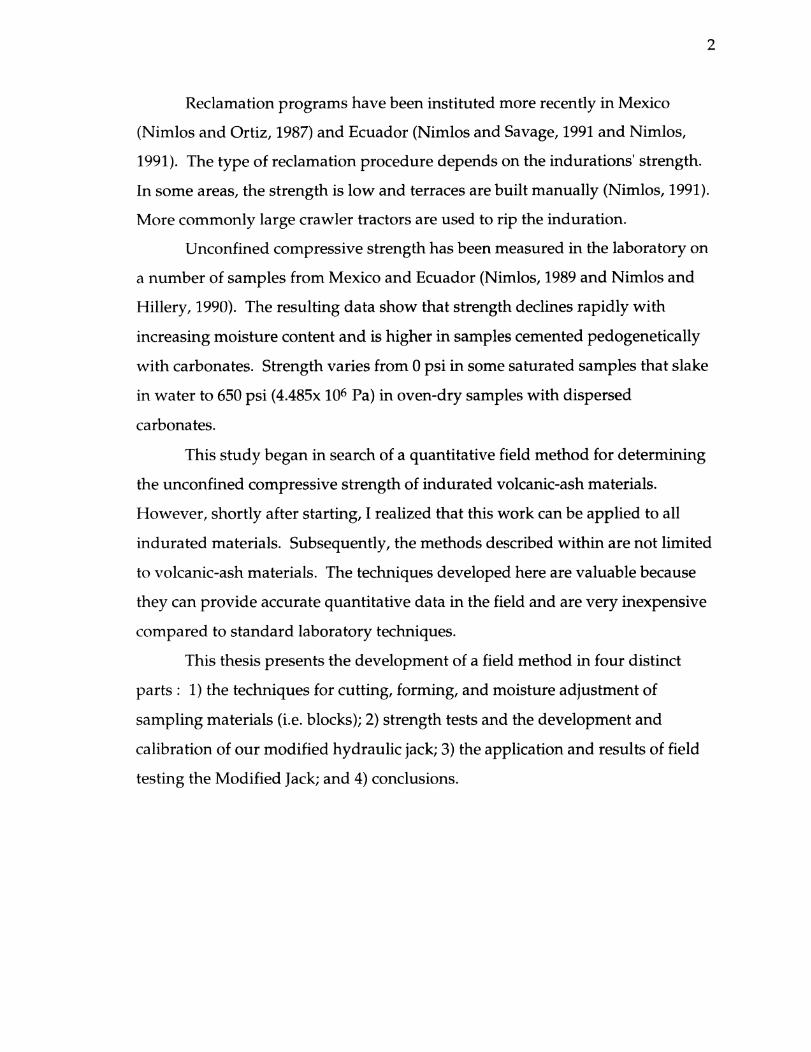
Reclamation programs have been instituted more recently in Mexico
(Nimlos and Ortiz, 1987) and Ecuador (Nimlos and Savage, 1991 and Nimlos,
1991). The type of reclamation procedure depends on the indurations' strength.
In some areas, the strength is low and terraces are built manually (Nimlos, 1991).
More commonly large crawler tractors are used to rip the induration.
Unconfined compressive strength has been measured in the laboratory on
a number of samples from Mexico and Ecuador (Nimlos, 1989 and Nimlos and
Hillery, 1990). The resulting data show that strength declines rapidly with
increasing moisture content and is higher in samples cemented pedogenetically
with carbonates. Strength varies from 0 psi in some saturated samples that slake
in water to 650 psi (4.485x 10⁶ Pa) in oven-dry samples with dispersed
carbonates.
This study began in search of a quantitative field method for determining
the unconfined compressive strength of indurated volcanic-ash materials.
However, shortly after starting, I realized that this work can be applied to all
indurated materials. Subsequently, the methods described within are not limited
to volcanic-ash materials. The techniques developed here are valuable because
they can provide accurate quantitative data in the field and are very inexpensive
compared to standard laboratory techniques.
This thesis presents the development of a field method in four distinct
parts : 1) the techniques for cutting, forming, and moisture adjustment of
sampling materials (i.e. blocks); 2) strength tests and the development and
calibration of our modified hydraulic jack; 3) the application and results of field
testing the Modified Jack; and 4) conclusions.
PART ONE:
TECHNIQUES OF CUTTING, FORMING, AND MOISTURE ADJUSTMENT
OF SAMPLING MATERIALS
Unconfined Compressive Strength and Blocks
Unconfined compressive strength is the standard strength test for soil
materials; the comparable test used by geologists for rock is tensile strength.
Since the surface of indurated volcanic-ash materials is in the gray zone between
rock and soil, the choice of strength tests is subject to question. Ripping is the
most common method of reclamation and entails both compressive and tensile
strength; the indurated material is compressed as the ripper enters, and the ease
of pulling the bar through the material is a function of the tensile strength.
Compressive strength is a more common test; there are more data for
comparisons, sample preparation is much easier, and measuring tensile strength
in the field would be extremely difficult. Further, Farrell et al. (1967) have shown
a very close correlation between the two parameters on soil samples with
moisture contents between 2% and 14%. Most tepetate have a field moisture
content within this range.
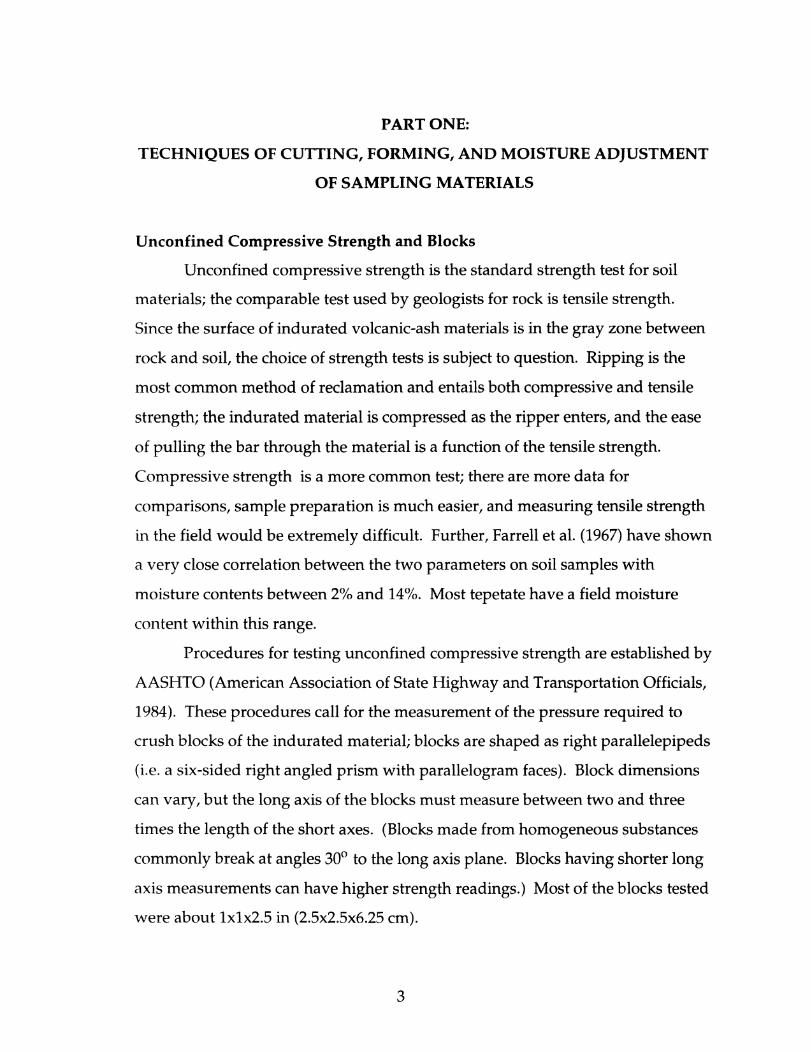
Procedures for testing unconfined compressive strength are established by
AASHTO (American Association of State Highway and Transportation Officials,
1984). These procedures call for the measurement of the pressure required to
crush blocks of the indurated material; blocks are shaped as right parallelepipeds
(i.e. a six-sided right angled prism with parallelogram faces). Block dimensions
can vary, but the long axis of the blocks must measure between two and three
times the length of the short axes. (Blocks made from homogeneous substances
commonly break at angles 30° to the long axis plane. Blocks having shorter long
axis measurements can have higher strength readings.) Most of the blocks tested
were about 1x1x2.5 in (2.5x2.5x6.25 cm).
3
4
Block Cutting
Cutting blocks out of the matrix is very rapid in some samples but time-
consuming and frustrating in others. Samples of low strength (less than 15 psi or
10.35xl04 Pa) often break while being cut, and samples of high strength (more
than 150 psi or 10.35x10⁵ Pa) are so hard they cut slowly by hand. Samples with
carbonate lamellae are especially vexing because the interface between the
lamellae and matrix is a natural plane of weakness. These samples frequently
crumble while being cut. Cutting is easiest in massive materials without
carbonate lamellae.
At least three types of saws can be used to cut rough blocks from the
matrix:
1) Quick saw. A quick saw is a gas-powered, 2-cycle saw that resembles
a chain saw with the tung and chain replaced with a 12- or 14-inch cutting disc
(See Photo 1.). The discs or blades employ cutting teeth for use on wood or an
abrasive for use on masonry or metal. I used a Stihl TS360 with a 12-inch
masonry blade; I found the metallic blade to be less effective. Cutting through
four inches of indurated material is quick and easy. The saw's power is more
than adequate and the time spent cutting is reduced exponentially when
compared with manual methods of cutting. Parallel cuts are made in the
material to form the planes of the long axis. Then cuts are made at right angles
and the blocks are gently broken from the matrix. All cuts are made slightly over
the desired dimensions so that the blocks can be formed to specific size later.
However, cutting blocks too large requires excessive time forming them later.
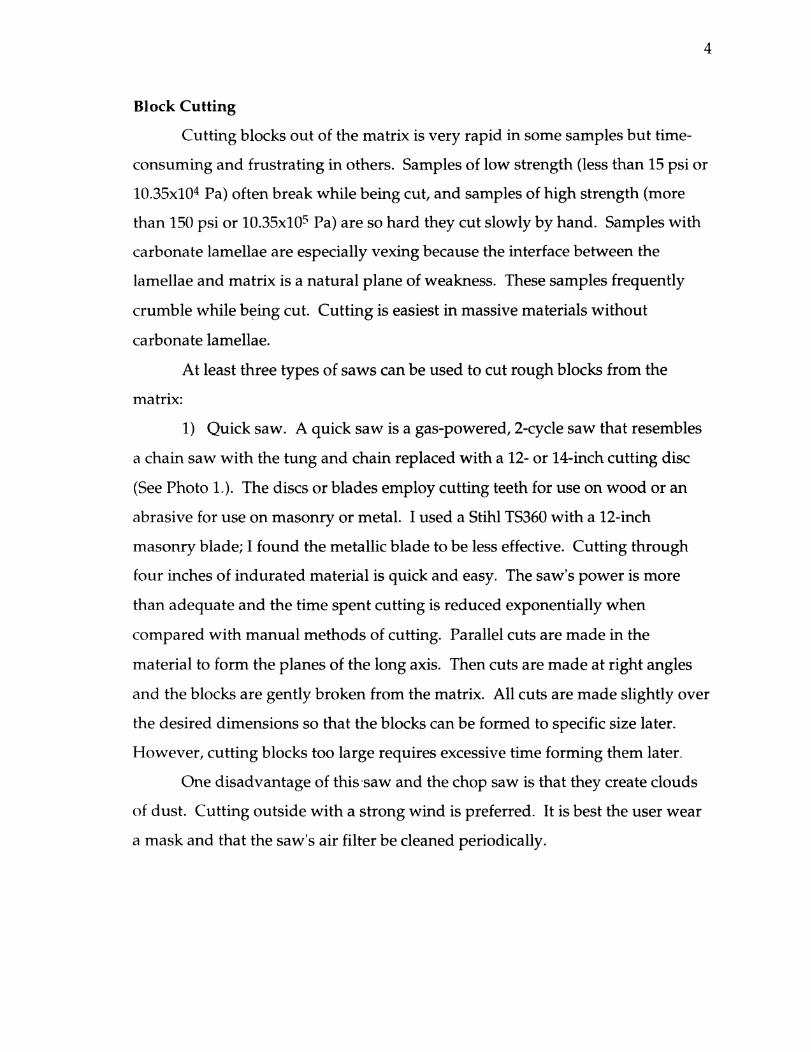
One disadvantage of this saw and the chop saw is that they create clouds
of dust. Cutting outside with a strong wind is preferred. It is best the user wear
a mask and that the saw's air filter be cleaned periodically.

Photo 1. Quick Saw. A gas-powered saw used for cutting and forming samples in the field.
Plywood frame with fence beneath the saw is used when forming blocks. Block in photo is in
position to be formed; perpendicular to the blade and against the fence.
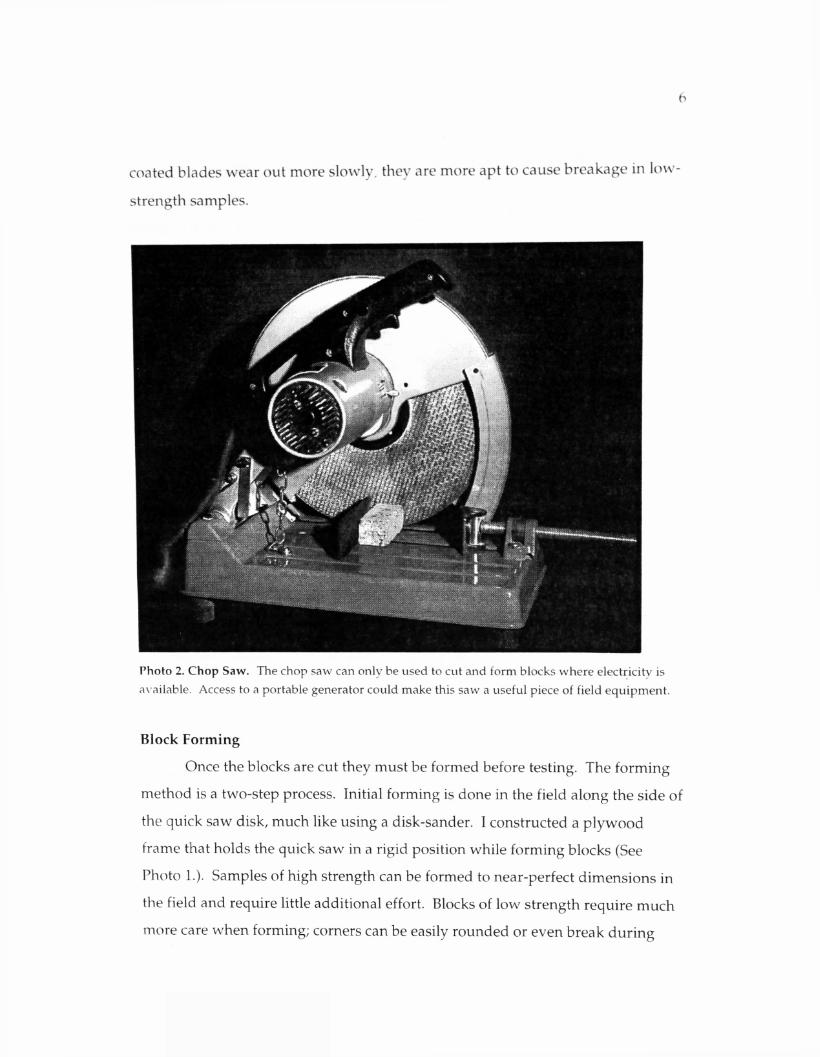
2) Chop saw. A chop saw is an AC-powered (110 volt) circular saw
mounted on its own base and can use the same blades as the quick saw (See
Photo 2.). I used a Makita (model No. 2414) with a 14-inch masonry blade which
had a cutting platform on the base and a fence along the back to ensure right
angle cuts. To use the chop saw, samples of indurated material must be removed
from the matrix and cut where electricity is available.
3) Hacksaw. Initially I used a standard hacksaw with cutting blades
having 12 teeth per inch. This proved cheap hut very slow on samples with high
strength and the blades wore out rapidly; it took four hours to cut a block from a
sample with strength of 650 psi (4.485x lO6 Pa). The advantage of this saw lies
with cutting samples of low strength; samples break less frequently because the
blades are relatively thin and make a narrow cut. To overcome the rapid dulling
of the blades I switched to carbide-coated blades. These blades abrade the
material rather than cut it, leaving a wider, less precise cut. Although carbide-
6
coated blades wear out more slowly, they are more apt to cause breakage in low-
strength samples.
Photo 2. Chop Saw. The chop saw can only be used to cut and form blocks where electricity is
available. Access to a portable generator could make this saw a useful piece of field equipment.
Block Forming
Once the blocks are cut they must be formed before testing. The forming
method is a two-step process. Initial forming is done in the field along the side of
the quick saw disk, much like using a disk-sander. I constructed a plywood
frame that holds the quick saw in a rigid position while forming blocks (See
Photo 1.). Samples of high strength can be formed to near-perfect dimensions in
the field and require little additional effort. Blocks of low strength require much
more care when forming; corners can be easily rounded or even break during
7
formation. For the more refined formation I used 50 to 80 grit sandpaper or a
mill bastard file. Good blocks can be formed if the sandpaper or file is placed
along a square inside corner, such as the inside of a tool box. The corner is used
to keep the long and short axis planes of the block perpendicular. Oven drying
low-strength samples increases their strength and makes them easier to cut and
form. The most important aspect of cutting and forming blocks is to keep the
short axis planes both flat and parallel.
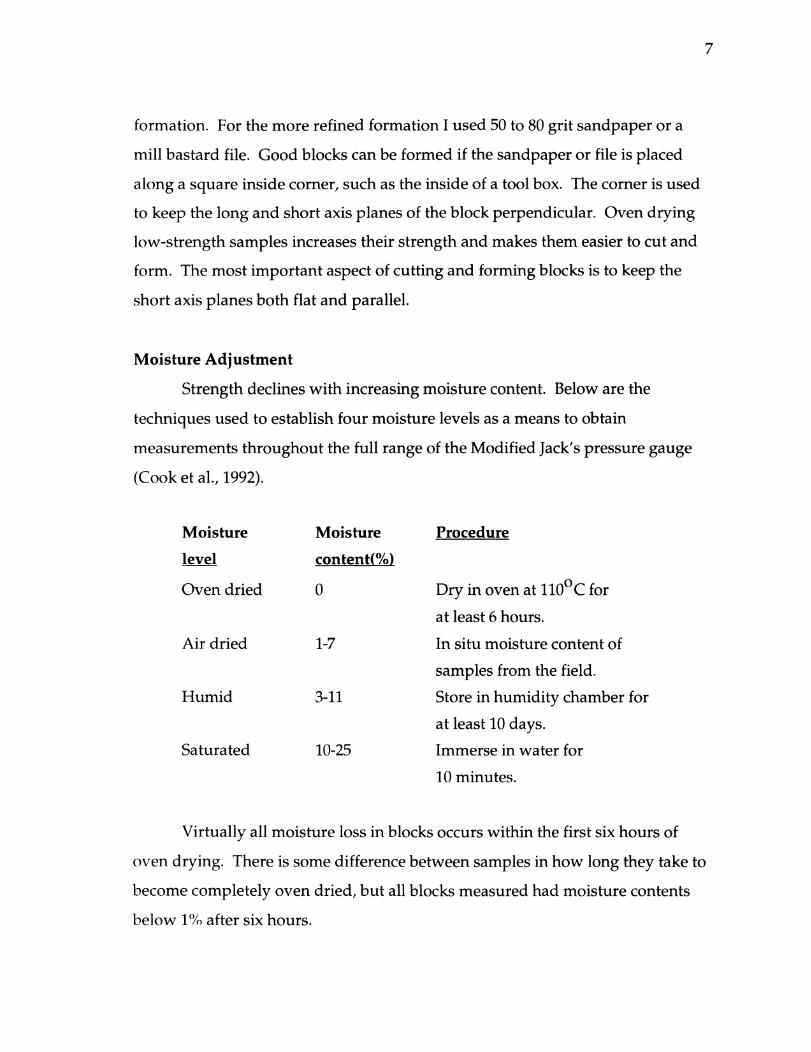
Moisture Adjustment
Strength declines with increasing moisture content. Below are the
techniques used to establish four moisture levels as a means to obtain
measurements throughout the full range of the Modified Jack's pressure gauge
(Cook et al., 1992).
Moisture
level
Oven dried
Moisture
content(%)
0
Air dried
Humid
Saturated
1-7
3-11
10-25
Procedure
Dry in oven at 110°C for
at least 6 hours.
In situ moisture content of
samples from the field.
Store in humidity chamber for
at least 10 days.
Immerse in water for
10 minutes.
Virtually all moisture loss in blocks occurs within the first six hours of
oven drying. There is some difference between samples in how long they take to
become completely oven dried, but all blocks measured had moisture contents
below 1% after six hours.
8
In order to create a moisture level intermediate between saturated and air-
dried, I made a humidity chamber using a covered plastic container with free
water in the bottom. Samples were placed on an inverted standard sieve used as
a rack inside the container above the water line. I added paper towels, loosely
rolled and rising out of the water to wick moisture, increasing the surface area of
the water surface and maintaining a saturated atmosphere. Most samples
reached a near constant weight in the chamber in less than 10 days. I assume this
moisture content corresponds to hygroscopic moisture content. It is not essential
that the hygroscopic moisture content be reached, but that the moisture content
be at some level above air-dried.
When removing samples from the humidity chamber for testing or
weighing, moisture content decreases instantly in dry labs or any atmosphere
less than 100% relative humidity.
Samples immersed in water reached saturation in less than 10 minutes. I
assume the difference in saturation moisture contents between samples is due to
differences in texture, type of cementation and chemical composition. Low-
strength samples often slake when saturated, and it is not possible to use this
method to determine the unconfined compressive strength of these samples
when saturated.
PART TWO:
STRENGTH TESTS AND THE DEVELOPMENT AND CALIBRATION OF A
MODIFIED HYDRAULIC JACK
Strength Tests
Strength can be measured in the laboratory with sophisticated, expensive
equipment, approximated in the field with simple manual techniques, or
measured in the field with the Modified Jack.
Measuring with Laboratory Equipment:
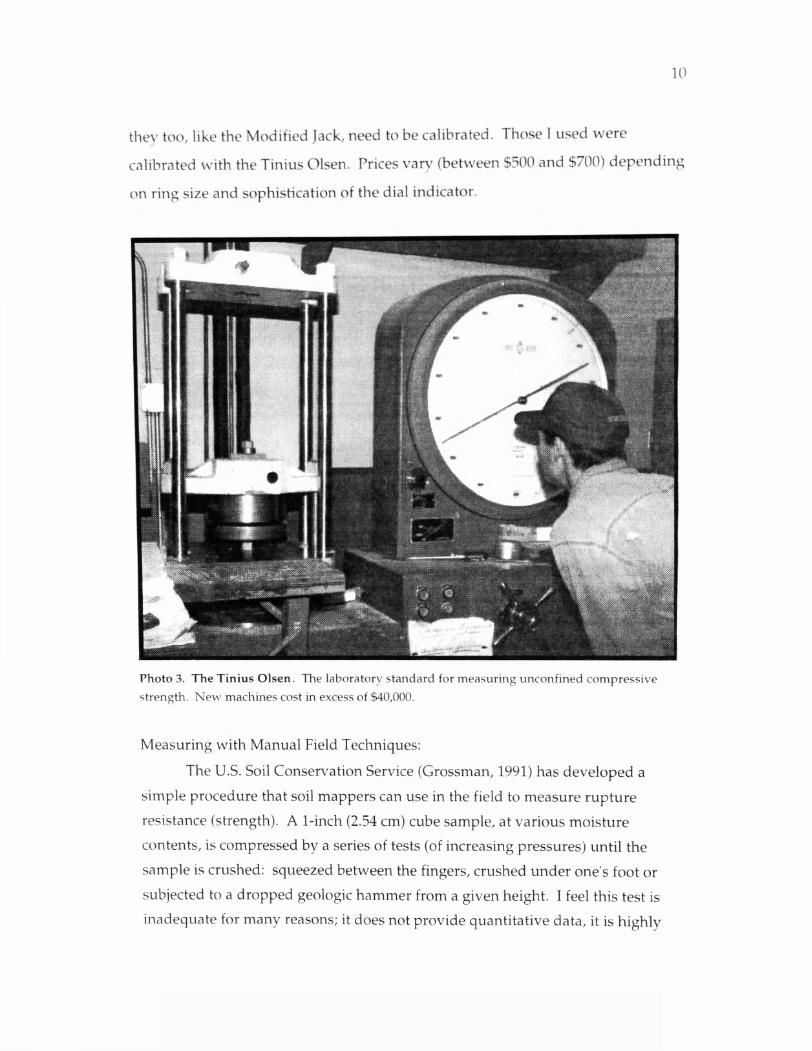
Many commercial testing machines are available. The standard, most
sophisticated testing machine is the Tinius Olsen. I used the Super L model. This
machine is not too dissimilar to a large hydraulic vise; crushing block samples
between two large steel plates (See Photo 3.). The upper steel plate is made to
pivot and allows adjustment of the plane of the plate to fit flush against the
upper planer surface of the block. One feature that makes the Tinius Olsen so
sophisticated is that it applies the desired load evenly at the desired rate (e.g. 6
lbs sec-1). These machines are expensive; usually costing over $40,000.
Proving rings are also commonly used in the laboratory. Proving rings are
simply stainless steel rings set into a frame. A dial indicator is mounted to the
rings to measure the amount of deformation in the rings as the load increases.
Loads are applied using a geared mechanical jack. A correction factor is used to
calculate pressure (measured in psi or Pa) from deformation readings (measured
in 0.001 in). I used a 1500 pound capacity, double ring type made by Soil Test,
Inc. (Evanston, 111.). The double ring type allows for a greater range of
measurements. Commonly, single rings are used for measuring specific ranges
of strength. This may require the use of several rings for measuring materials
with wide ranging strengths. One consequence of using proving rings is that
9
10
they too, like the Modified Jack, need to be calibrated. Those 1 used were
calibrated with the Tinius Olsen. Prices vary (between $500 and $700) depending
on ring size and sophistication of the dial indicator.
Photo 3. The Tinius Olsen. The laboratory standard for measuring unconfined compressive
strength. New machines cost in excess of $40,000.
Measuring with Manual Field Techniques:
The U.S. Soil Conservation Service (Grossman, 1991) has developed a
simple procedure that soil mappers can use in the field to measure rupture
resistance (strength). A 1-inch (2.54 cm) cube sample, at various moisture
contents, is compressed by a series of tests (of increasing pressures) until the
sample is crushed: squeezed between the fingers, crushed under one's foot or
subjected to a dropped geologic hammer from a given height. I feel this test is
inadequate for many reasons; it does not provide quantitative data, it is highly
11
subjective, and the units of force/energy applied to samples differs between
techniques. Samples that break between the fingers or under foot are placed in
strength classes by measured force in newtons, whereas the energy of a falling
hammer is measured in joules. However, this method does have the advantage
of a simple field technique that requires very little equipment.
Measuring with the Modified Jack Field Equipment:
We have developed a simple, inexpensive technique for measuring
strength in the field. A 1.5-ton hydraulic jack, modified with a 1000 psi pressure
gauge and fit into an angle-iron frame, is used to crush blocks (See Figure 1.).
Modification of the hydraulic jack with the pressure gauge is simple. A hole is
drilled and tapped into the jack's reservoir. A short nipple connects the pressure
gauge to the jack. Total cost for materials is less than $50. The pressure gauge
makes up 80% of the price and will vary with the range of measurement needed
and the incremental accuracy desired. Readings at the extreme low and extreme
high ranges of most pressure gauges can be less accurate, especially with lower
quality gauges (Calcaterra, 1994).
Blocks are placed on the jack piston and squeezed against the frame by
pumping the jack arm. It is of utmost importance that the interface between the
sample and the frame or jack be clean and have a flush fit. A poor fit, leaving air
space between the sample and frame or jack, will apply pressure to a smaller area
of the block and cause premature failing and erroneous measurements. I used a
2x2 inch plate of three-eighths inch steel between the sample and the jack piston
to provide this smooth interface. I also modified the steel plate by welding a 1 /4
inch ball bearing to the center of the underside. This allows the plate to pivot on
top of the jack piston and ensures a flush fit between the block and the frame.
Blocks of very high strength may top-out the pressure gauge and are cut
proportionally smaller to be tested in the jack. Strength measurements are then
corrected to a per unit standard (psi or Pa). To standardize testing with the
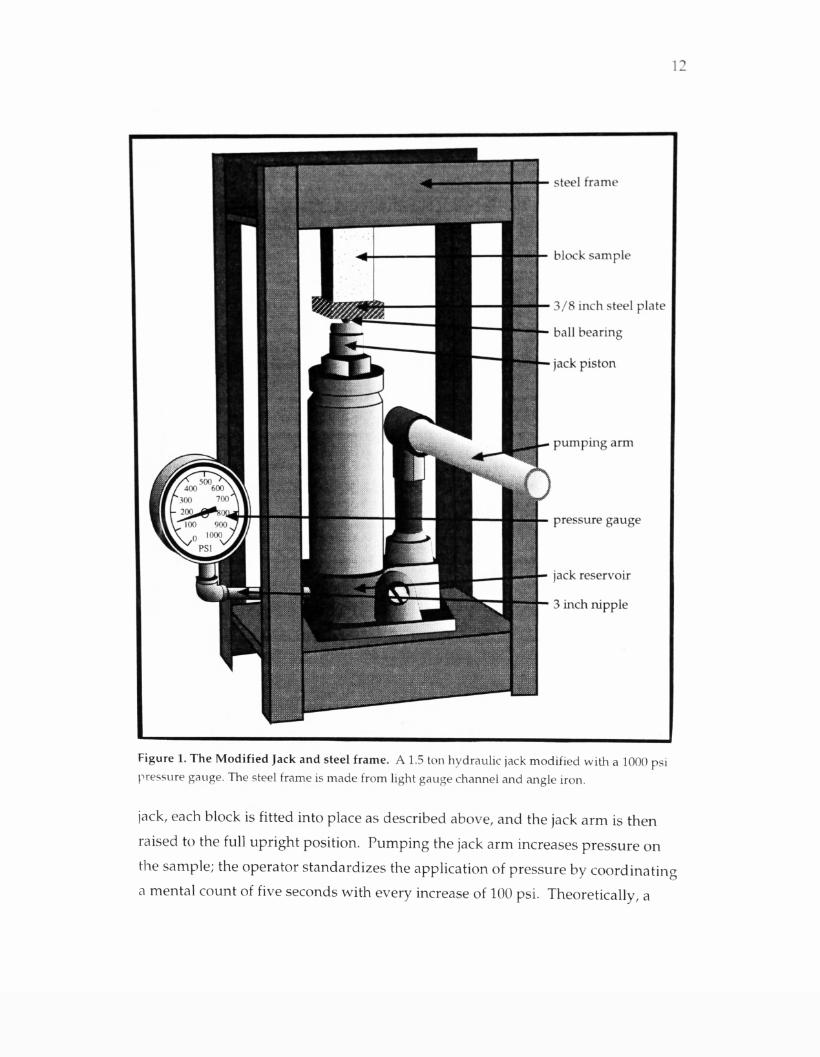
Figure 1. The Modified Jack and steel frame. A 1.5 ton hydraulic jack modified with a 1000 psi
pressure gauge. The steel frame is made from light gauge channel and angle iron.
jack, each block is fitted into place as described above, and the jack arm is then
raised to the full upright position. Pumping the jack arm increases pressure on
the sample; the operator standardizes the application of pressure by coordinating
a mental count of five seconds with every increase of 100 psi. Theoretically, a
13
sample tested to have a strength of 200 psi would have taken 10 seconds to fail.
The strength of a sample is recorded as the pressure gauge reading at the time of
failure.
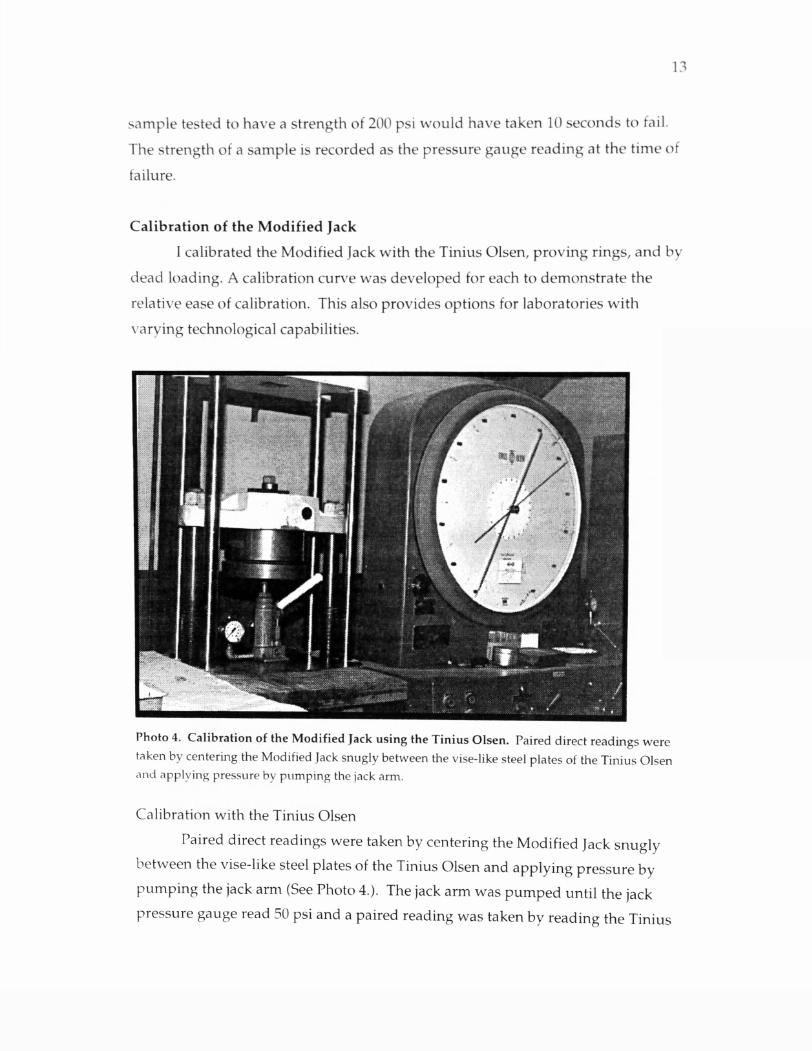
Calibration of the Modified Jack
I calibrated the Modified Jack with the Tinius Olsen, proving rings, and by
dead loading. A calibration curve was developed for each to demonstrate the
relative ease of calibration. This also provides options for laboratories with
varying technological capabilities.
Photo 4. Calibration of the Modified Jack using the Tinius Olsen. Paired direct readings were
taken by centering the Modified Jack snugly between the vise-like steel plates of the Tinius Olsen and applying pressure by pumping the jack arm.
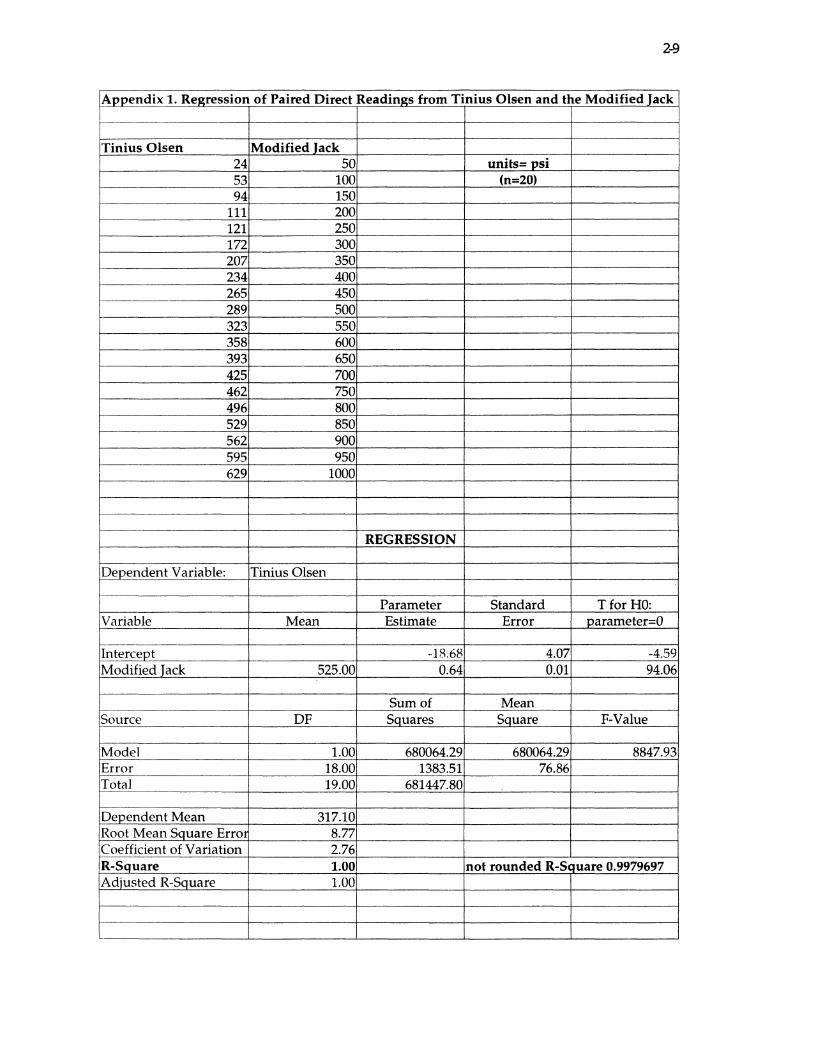
Calibration with the Tinius Olsen
Paired direct readings were taken by centering the Modified Jack snugly
between the vise-like steel plates of the Tinius Olsen and applying pressure by
pumping the jack arm (See Photo 4.). The jack arm was pumped until the jack
pressure gauge read 50 psi and a paired reading was taken by reading the Tinius
14
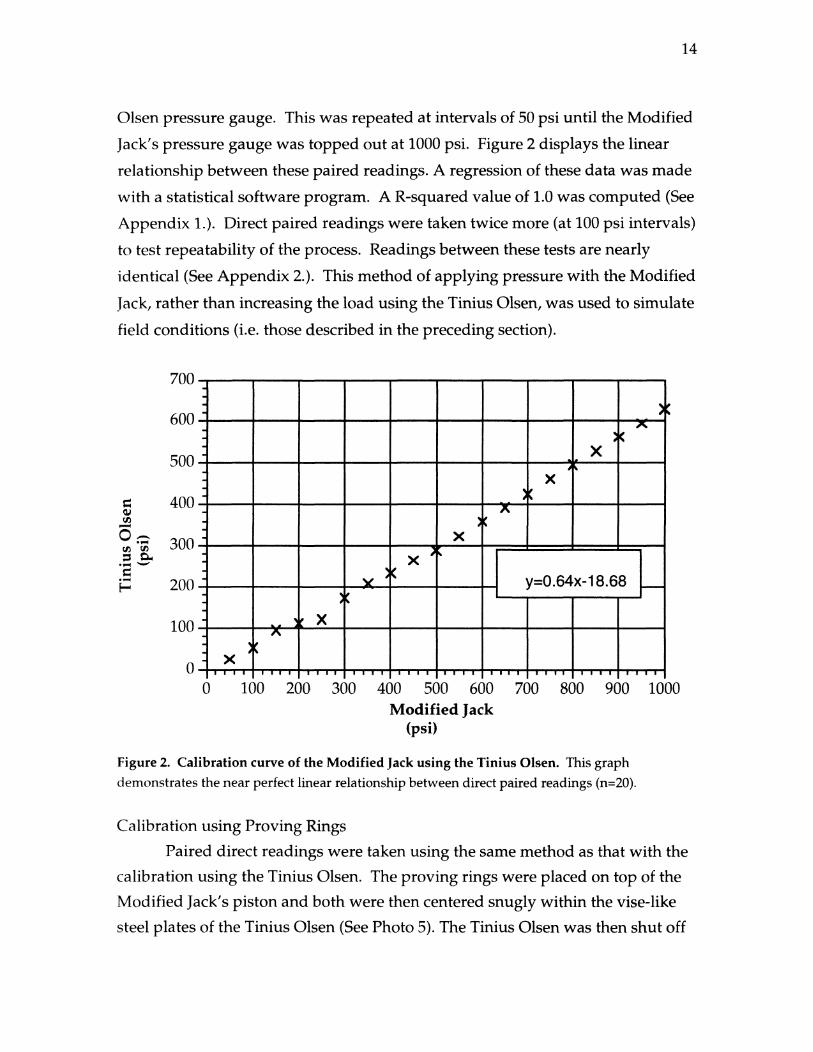
Olsen pressure gauge. This was repeated at intervals of 50 psi until the Modified
Jack's pressure gauge was topped out at 1000 psi. Figure 2 displays the linear
relationship between these paired readings. A regression of these data was made
with a statistical software program. A R-squared value of 1.0 was computed (See
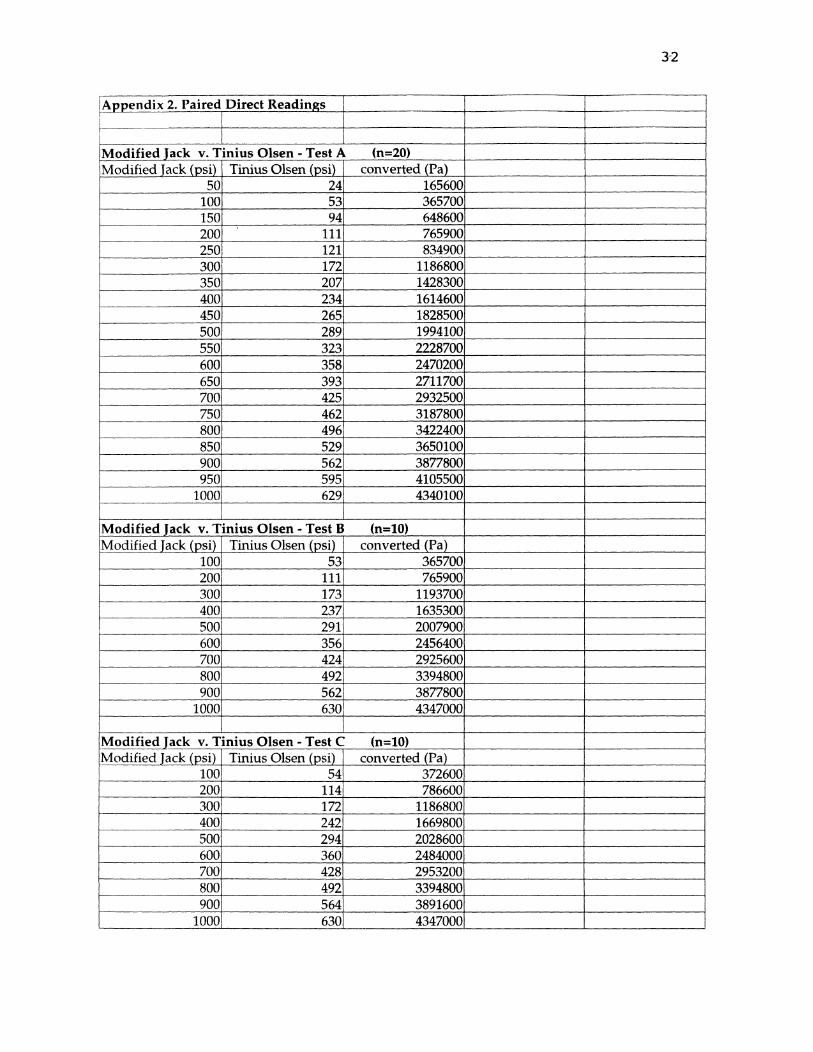
Appendix 1.). Direct paired readings were taken twice more (at 100 psi intervals)
to test repeatability of the process. Readings between these tests are nearly
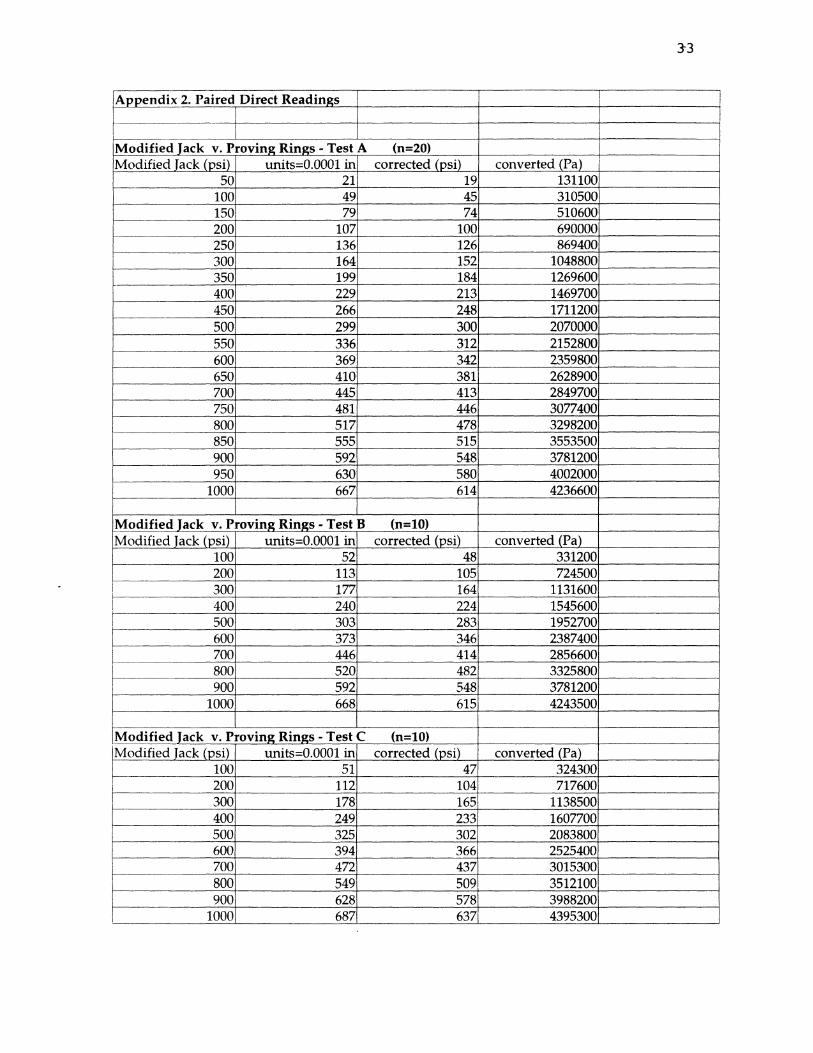
identical (See Appendix 2.). This method of applying pressure with the Modified
Jack, rather than increasing the load using the Tinius Olsen, was used to simulate
field conditions (i.e. those described in the preceding section).
700.
600.
500.
400.
300.
200.
100-
0. X
I I I
V X
I I I I
-X-
I I I I I I
y=0.64x-18.68
i 11 i i i i TT I I I
0 100 200 300 400 500 600 700 800 900 1000 Modified Jack
(psi)
Figure 2. Calibration curve of the Modified Jack using the Tinius Olsen. This graph
demonstrates the near perfect linear relationship between direct paired readings (n=20).
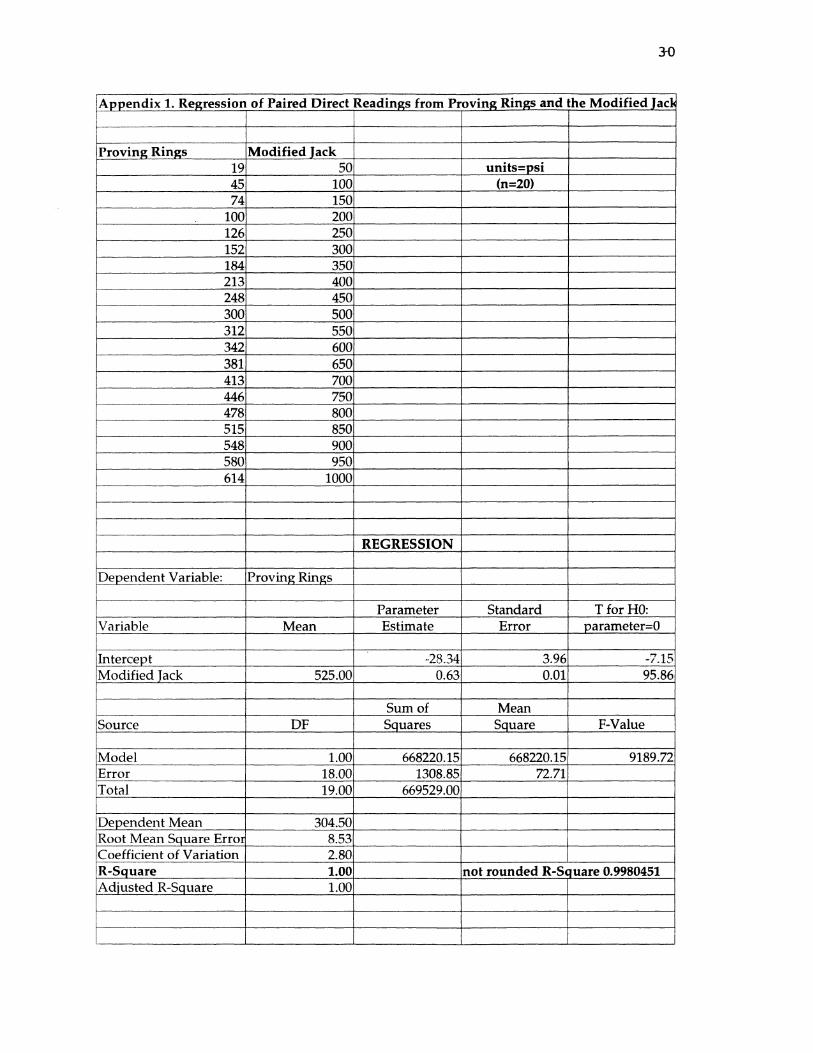
Calibration using Proving Rings
Paired direct readings were taken using the same method as that with the
calibration using the Tinius Olsen. The proving rings were placed on top of the
Modified Jack's piston and both were then centered snugly within the vise-like
steel plates of the Tinius Olsen (See Photo 5). The Tinius Olsen was then shut off
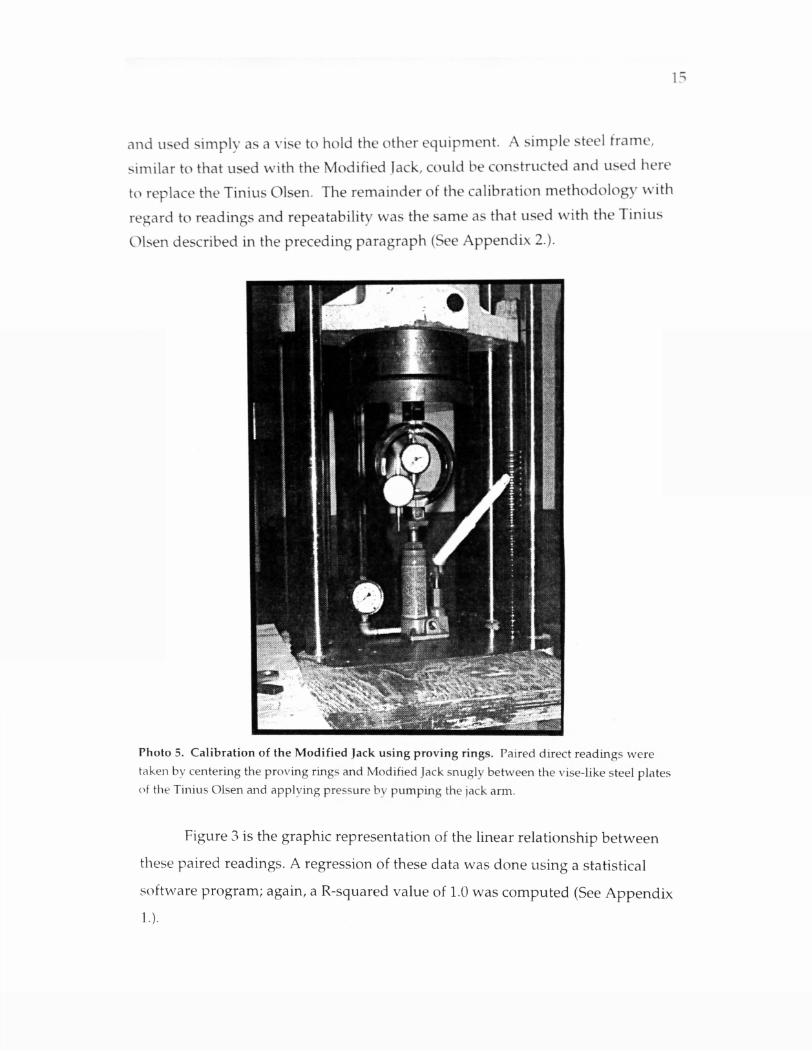
15
and used simply as a vise to hold the other equipment. A simple steel frame,
similar to that used with the Modified lack, could be constructed and used here
to replace the Tinius Olsen. The remainder of the calibration methodology with
regard to readings and repeatability was the same as that used with the Tinius
Olsen described in the preceding paragraph (See Appendix 2.).
Photo 5. Calibration of the Modified Jack using proving rings. Paired direct readings were
taken by centering the proving rings and Modified Jack snugly between the vise-like steel plates
of the Tinius Olsen and applying pressure by pumping the jack arm.
Figure 3 is the graphic representation of the linear relationship between
these paired readings. A regression of these data was done using a statistical
software program; again, a R-squared value of 1.0 was computed (See Appendix
1.).
16
</) 60 C
60 *55 c o l-l c-
700.
600
500.
400.
300.
200.
100.
0- T T
0 I I I I I I I I 1 1 1 1
y=0.63x-28.34
1 1 1 I I I I 1 1 1 100 200 300 400 500 600 700 800 900 1000
Modified Jack (psi)
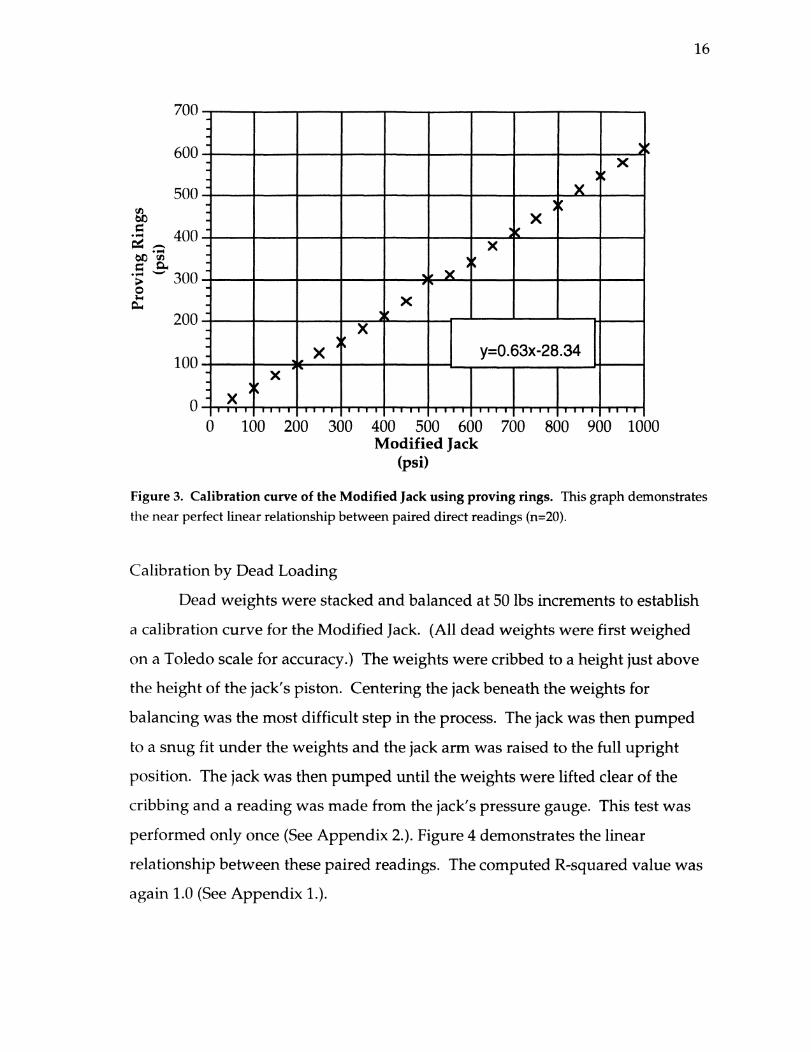
Figure 3. Calibration curve of the Modified Jack using proving rings. This graph demonstrates
the near perfect linear relationship between paired direct readings (n=20).
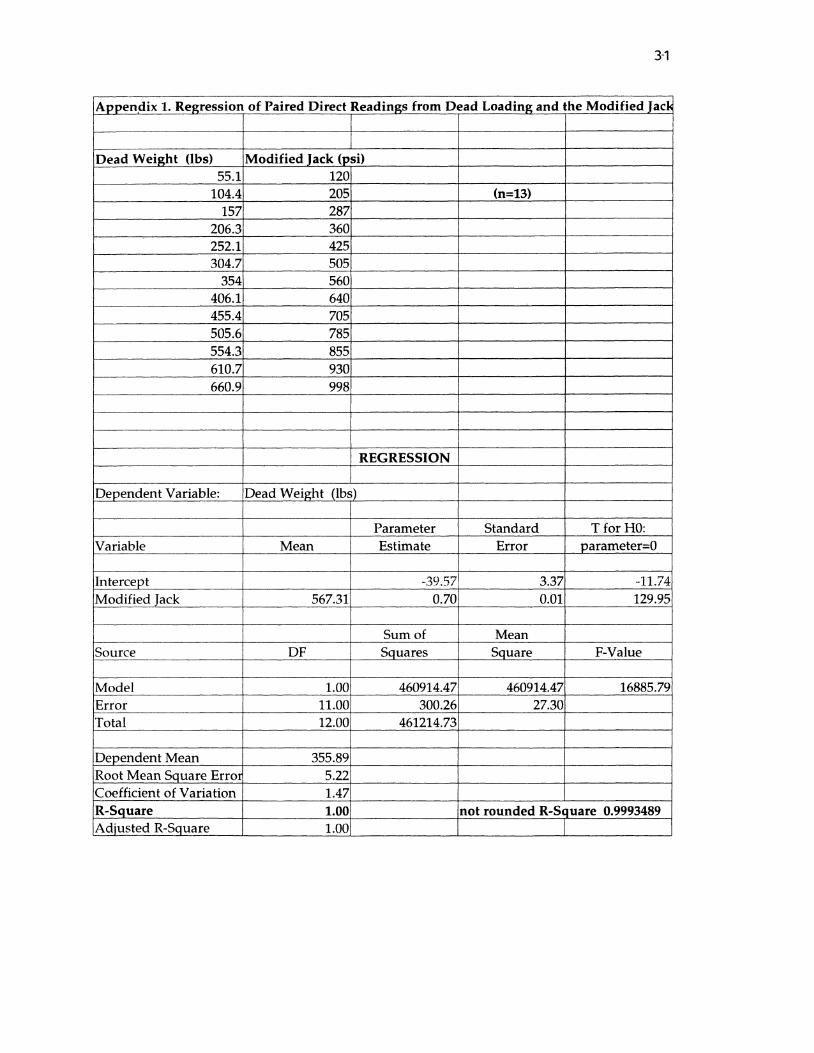
Calibration by Dead Loading
Dead weights were stacked and balanced at 50 lbs increments to establish
a calibration curve for the Modified Jack. (All dead weights were first weighed
on a Toledo scale for accuracy.) The weights were cribbed to a height just above
the height of the jack's piston. Centering the jack beneath the weights for
balancing was the most difficult step in the process. The jack was then pumped
to a snug fit under the weights and the jack arm was raised to the full upright
position. The jack was then pumped until the weights were lifted clear of the
cribbing and a reading was made from the jack's pressure gauge. This test was
performed only once (See Appendix 2.). Figure 4 demonstrates the linear
relationship between these paired readings. The computed R-squared value was
again 1.0 (See Appendix 1.).

17
.£P "S3
0> D
700
600
500
400
£ 300
200.
100
o. » I I I » I I I I I I I I I I I l l l l l
-X-
y=0.70x-39.57
I I I I I I I i i i i i i 0 100 200 300 400 500 600 700 800 900 1000
Modified Jack (psi)
Figure 4. Calibration curve of the Modified Jack using dead weights. This graph demonstrates
the near perfect linear relationship between paired direct readings (n=13).
All three calibration methods demonstrate a near perfect linear
relationship between the Modified Jack and the respective testing equipment.
Each technique is quick, relatively simple, and establishes the Modified Jack as a
precise instrument for obtaining quantified measurements in the field.
PART THREE:
APPLICATION AND RESULTS OF FIELD TESTING
THE MODIFIED JACK
Field Testing the Modified Jack
Four samples of indurated materials were collected, cut, and shaped
following the techniques described in Part One. Indurated volcanic-ash (tepetate)
was taken from the Valley of Mexico. Two sandstone samples (fine and coarse
textured) were then taken locally. The fourth was chalk (magnesium carbonate)
purchased at a local athletic equipment retailer. The testing of each will be
discussed below.
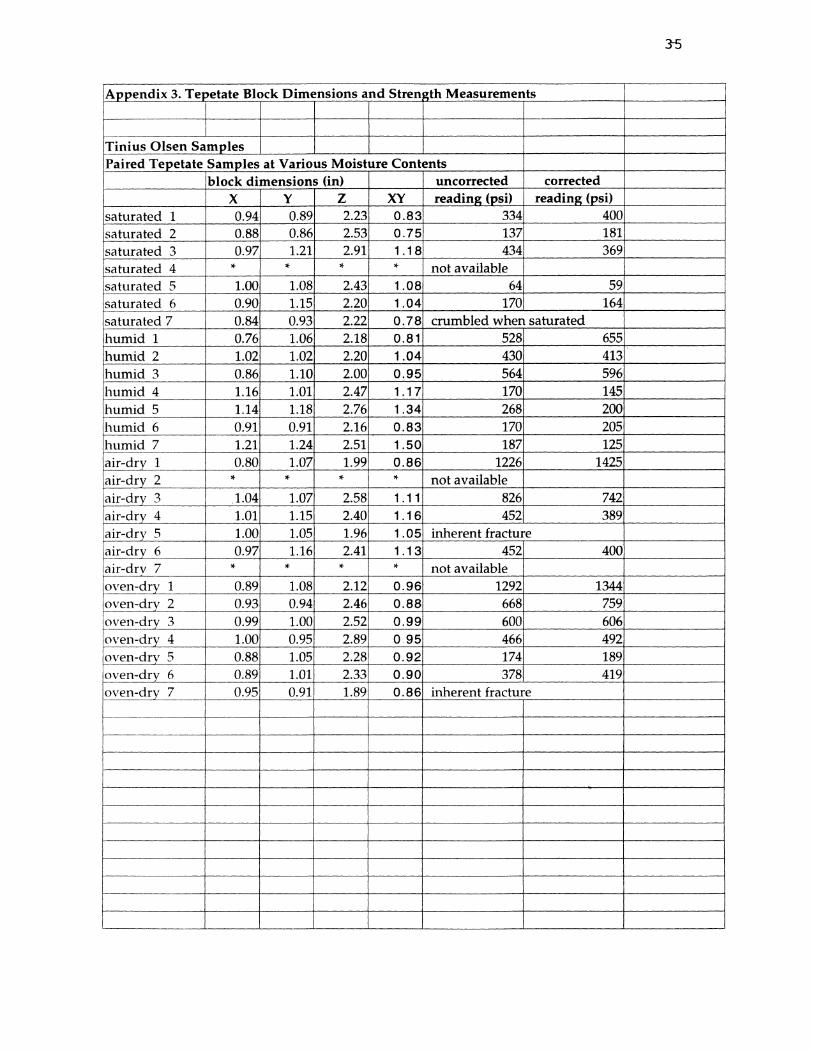
Tepetate
Eight blocks were cut and formed in the field at each of seven locations.
Although very little is known of the spatial distribution of tepetate or individual
ash flows, there were significant differences in color and bedding patterns to
suggest seven different samples. The eight blocks from each location were
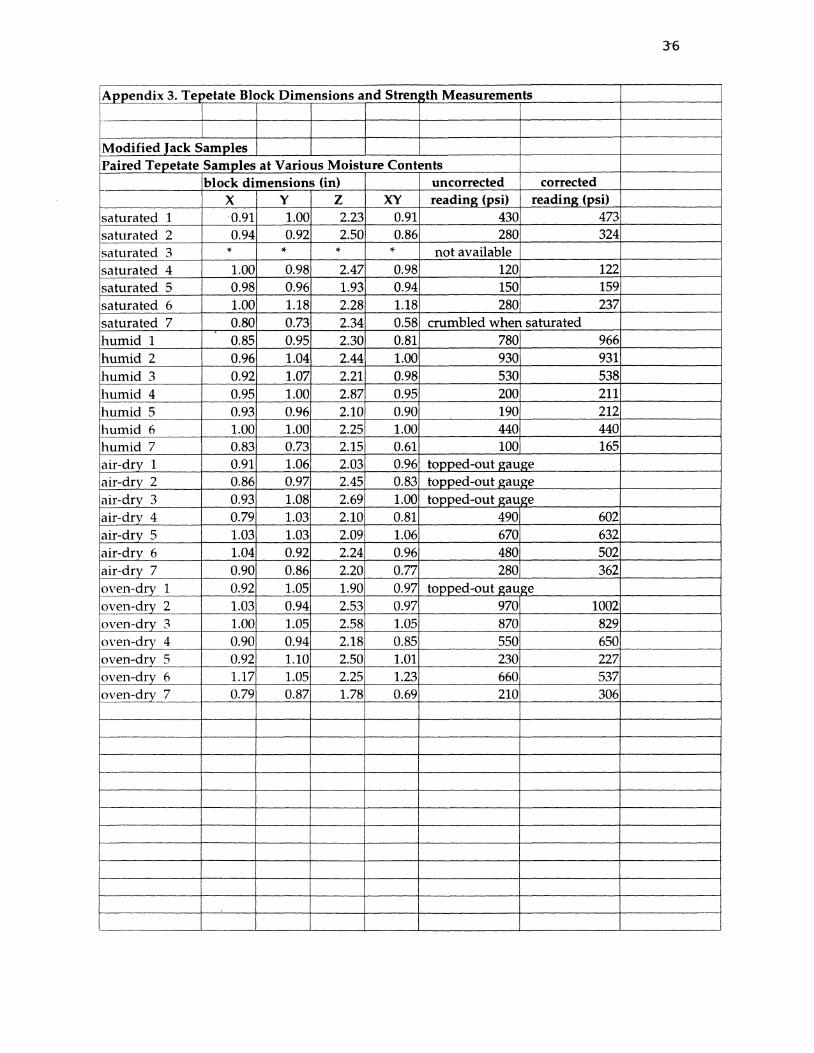
randomly paired to be tested in the Tinius Olsen and the Modified Jack. To
obtain measurements throughout the full range of the jack's pressure gauge, the
moisture content of each pair was adjusted using the techniques described in the
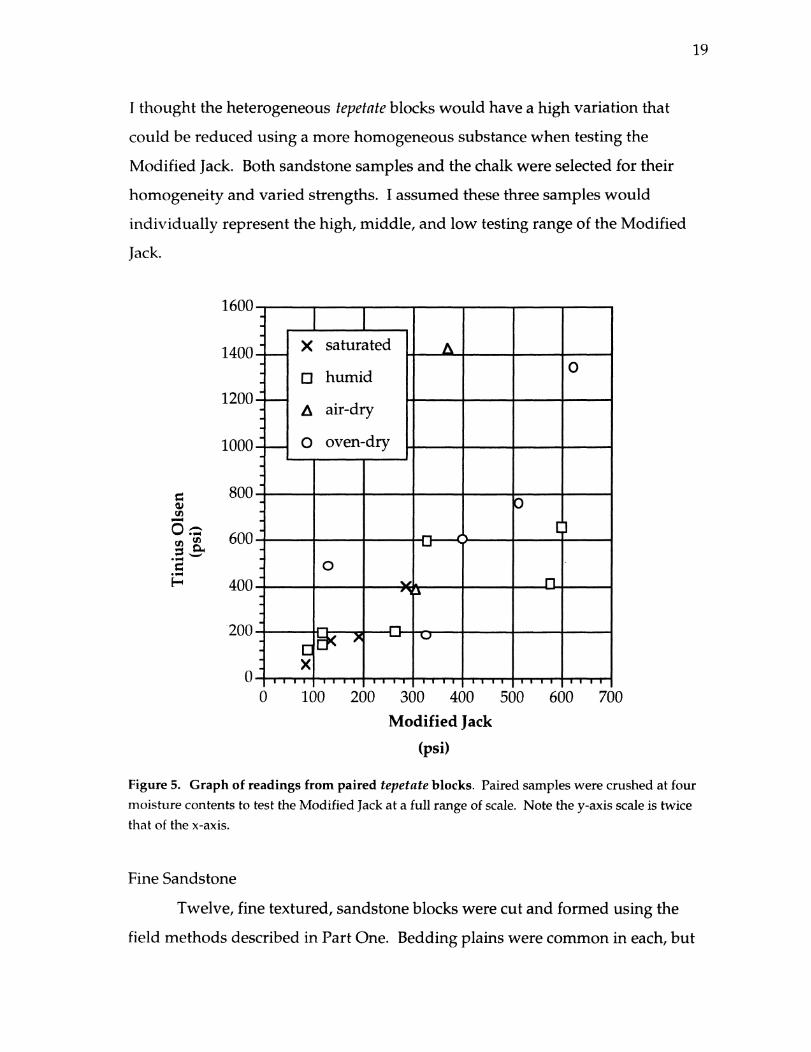
last section of Part One. Figure 5 is a graph of these data (See Appendix 3.). The
Modified Jack readings have been corrected using the calibration equation from
Figure 2.
Tepetate was the original focus for testing the jack, but I felt two reasons
justified expanding the study to other indurated materials. First, the Modified
Jack, like other strength tests, has wider applicability. Second, several of the
tepetate samples had many natural planes of weakness (i.e. laminar carbonates,
bedding planes,vesicles) or were so weak that forming good blocks was difficult.
18
19
I thought the heterogeneous tepetate blocks would have a high variation that
could be reduced using a more homogeneous substance when testing the
Modified Jack. Both sandstone samples and the chalk were selected for their
homogeneity and varied strengths. I assumed these three samples would
individually represent the high, middle, and low testing range of the Modified
Jack.
e 0) CA Os
</>
3-c H
1600-
1400-
1200-
1000-
800-
600-
400-
200-
X saturated
• humid
A air-dry
O oven-dry
• X
-*3r
-O-
•D 9
xr
-Q
i i i i | i i 1 1 I 1 1 1 1 I 1 1 1 1 I ' ' I I I 1 I I I I I I I I 0 100 200 300 400 500 600 700
Modified Jack
(psi)
Figure 5. Graph of readings from paired tepetate blocks. Paired samples were crushed at four
moisture contents to test the Modified Jack at a full range of scale. Note the y-axis scale is twice
that of the x-axis.
Fine Sandstone
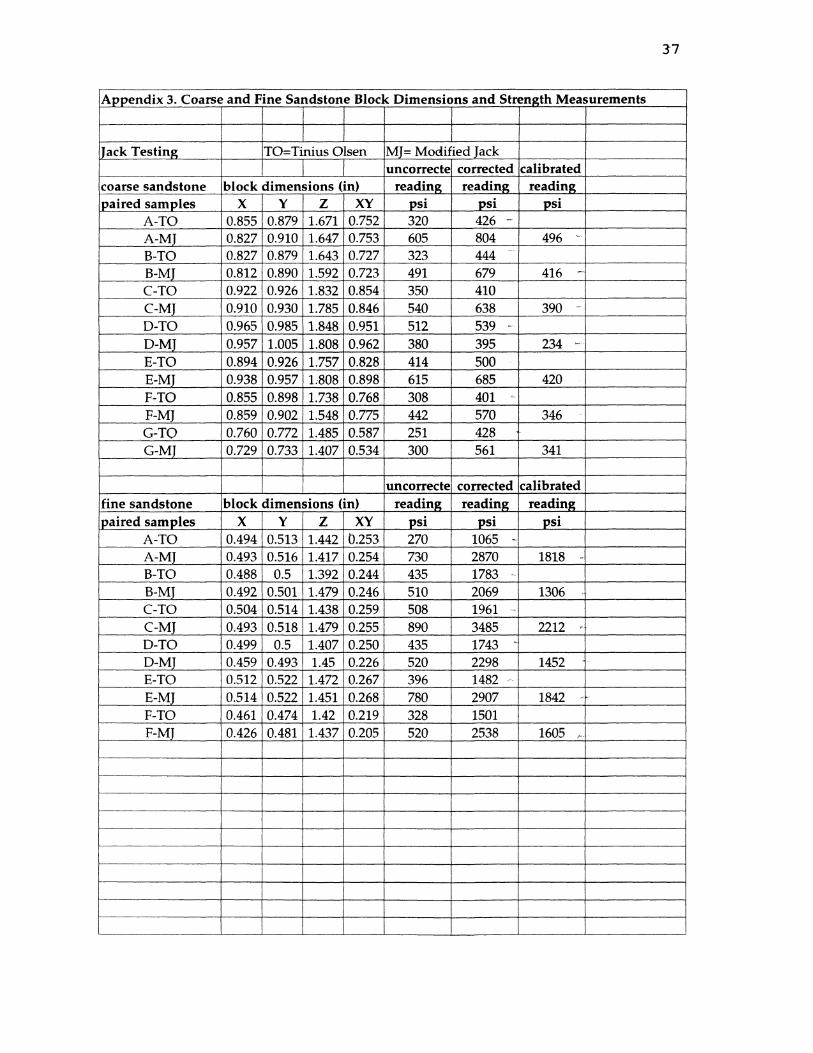
Twelve, fine textured, sandstone blocks were cut and formed using the
field methods described in Part One. Bedding plains were common in each, but
20
blocks formed easily. Bedding planes were a change in color, not texture, and
did not show any sign of being a natural plane of weakness.
The fine sandstone was selected to test the high range of the Modified
Jack. Preliminary testing of 1x1x2.5 in (2.5x2.5x6.25 cm) blocks showed the fine
sandstone to have very high strength (the pressure gauge on the jack was topped
out). Each block was resized several times, eventually to approximately
0.5x0.5x1.5 in (1.25xl.25x3.8cm). Each block was measured along its three axes
(x,y, and z; z being the long axis). Blocks having equal or most similar xy values
were then paired and tested in either the Tinius Olsen or the Modified Jack (See
Appendix 3.).
Coarse Sandstone
Fourteen, coarse textured, sandstone blocks were cut, formed, and paired
using the same methods described for the fine sandstone. No difficulties were
encountered cutting and forming blocks. Bedding planes were originally
observed in the coarse sandstone but were uncommon in blocks. The coarse
sandstone was selected to test the mid-range of the Modified Jack (See Appendix
3.).
Chalk
Chalk (magnesium carbonate of this type is used by gymnasts to increase
their grip) was selected to test the low range of the Modified Jack and for its
greater homogeneity than the sandstones. It was purchased in factory-made
blocks approximately 1.75x3.5x3.5 in (4.5x9x9 cm). Seven blocks were cut in half
to approximately 1.75x1.75x3.5 in (4.5x4.5x9 cm). Blocks easily crumbled when
cut; hence the large size. Each pair of halves was considered a matched pair and
tested in either the Tinius Olsen or the Modified Jack (See Appendix 3.).
21
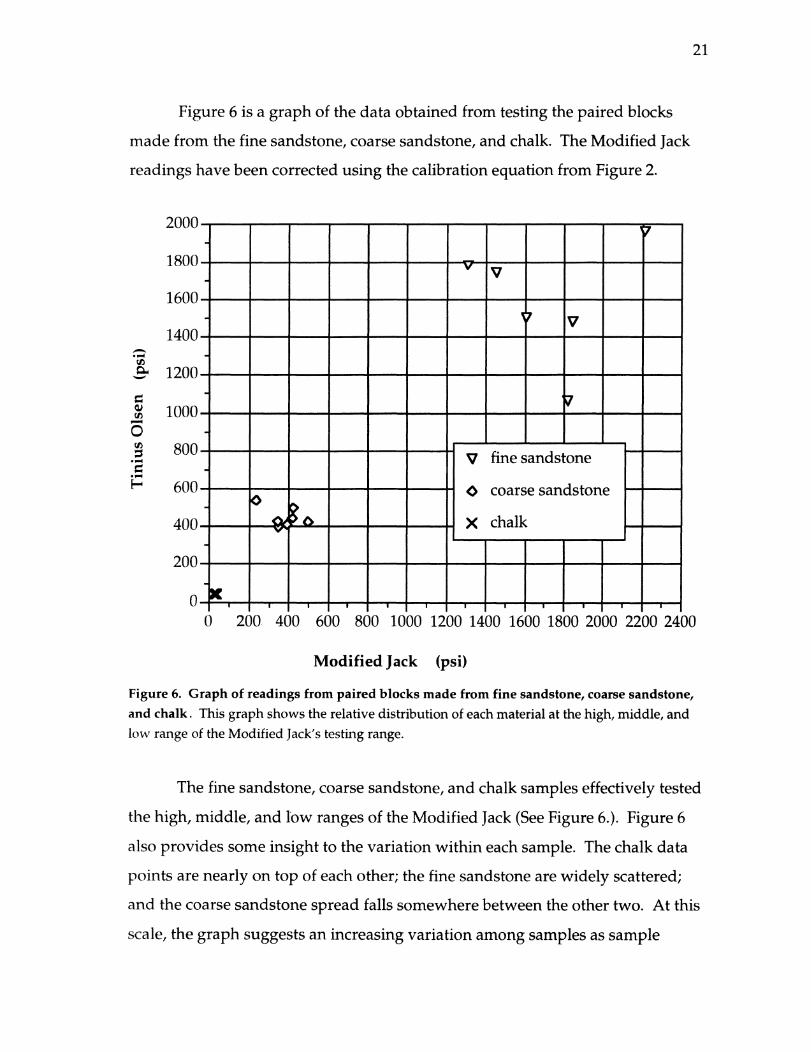
Figure 6 is a graph of the data obtained from testing the paired blocks
made from the fine sandstone, coarse sandstone, and chalk. The Modified Jack
readings have been corrected using the calibration equation from Figure 2.
1/5 c l
ts 4> to
2 '2 . -H H
2000-
1800-
1600-
1400-
1200-
1000-
800-
600-
400-
200-
0-
V fine sandstone
O coarse sandstone
X chalk
0 200 400 600 800 1000 1200 1400 1600 1800 2000 2200 2400
Modified Jack (psi)
Figure 6. Graph of readings from paired blocks made from fine sandstone, coarse sandstone, and chalk. This graph shows the relative distribution of each material at the high, middle, and
low range of the Modified Jack's testing range.
The fine sandstone, coarse sandstone, and chalk samples effectively tested
the high, middle, and low ranges of the Modified Jack (See Figure 6.). Figure 6
also provides some insight to the variation within each sample. The chalk data
points are nearly on top of each other; the fine sandstone are widely scattered;
and the coarse sandstone spread falls somewhere between the other two. At this
scale, the graph suggests an increasing variation among samples as sample
22
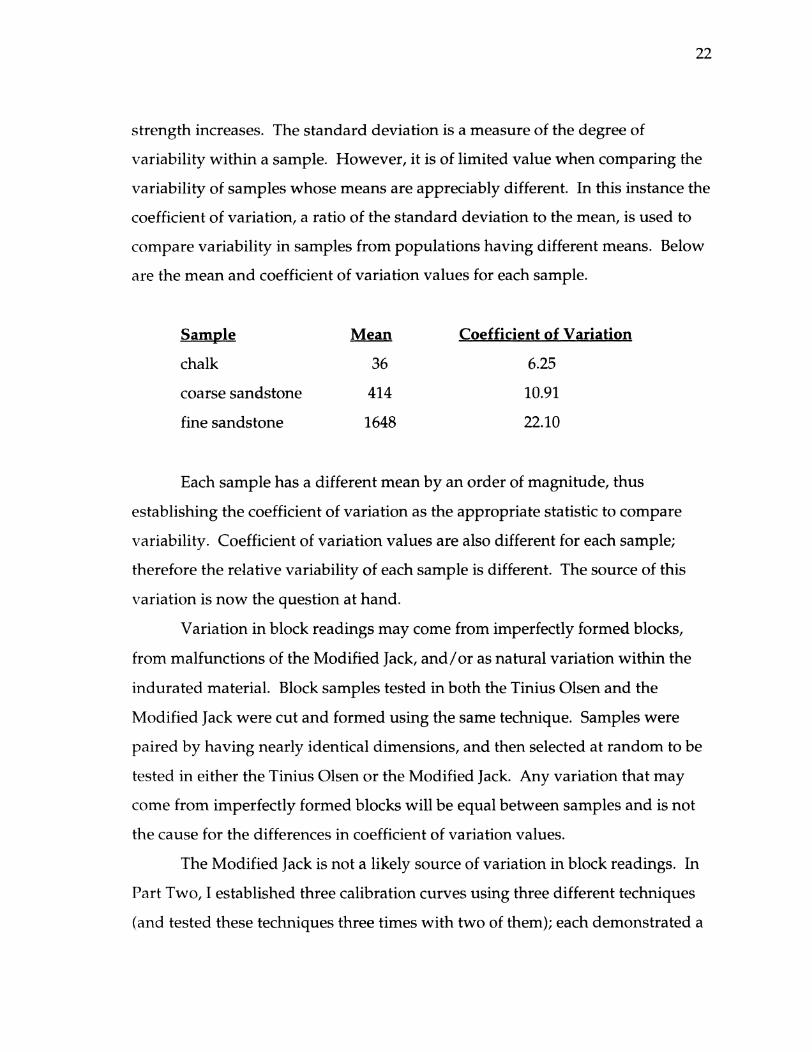
strength increases. The standard deviation is a measure of the degree of
variability within a sample. However, it is of limited value when comparing the
variability of samples whose means are appreciably different. In this instance the
coefficient of variation, a ratio of the standard deviation to the mean, is used to
compare variability in samples from populations having different means. Below
are the mean and coefficient of variation values for each sample.
Sample Mean
chalk 36
coarse sandstone 414
fine sandstone 1648
Coefficient of Variation
6.25
10.91
22.10
Each sample has a different mean by an order of magnitude, thus
establishing the coefficient of variation as the appropriate statistic to compare
variability. Coefficient of variation values are also different for each sample;
therefore the relative variability of each sample is different. The source of this
variation is now the question at hand.
Variation in block readings may come from imperfectly formed blocks,
from malfunctions of the Modified Jack, and/or as natural variation within the
indurated material. Block samples tested in both the Tinius Olsen and the
Modified Jack were cut and formed using the same technique. Samples were
paired by having nearly identical dimensions, and then selected at random to be
tested in either the Tinius Olsen or the Modified Jack. Any variation that may
come from imperfectly formed blocks will be equal between samples and is not
the cause for the differences in coefficient of variation values.
The Modified Jack is not a likely source of variation in block readings. In
Part Two, I established three calibration curves using three different techniques
(and tested these techniques three times with two of them); each demonstrated a
23
nearly perfect linear relationship throughout the full range of the Modified Jack.
If these had not been linear relationships or if there had been variation among
readings when the tests were repeated, the Modified Jack would then be suspect.
These situations were not present. Therefore the Modified Jack is not a source of
significant variation. However, the pressure gauge on the Modified Jack is
graduated at increments of 10 psi and that of the Tinius Olsen at increments of 2
psi. Readings can only be roughly estimated between the values of ten. I assume
this "reader error" to be a real but minor source of variation. Since it will be
most significant for low strength readings, "reader error" may be minimized by
cutting blocks large enough to utilize the middle range of the pressure gauge.
Using a more sophisticated pressure gauge would also reduce "reader error".
Eliminating the blocks and the Modified Jack as significant sources of
variation, leads to the conclusion that the source to the variation must lie in the
natural variation of the indurated materials. This is consistent with my
observations above regarding the homogeneity and bedding planes for each
sample.
PART FOUR:
CONCLUSIONS
The following conclusions are presented in three sections. Each section
concludes the information presented in the previous three parts of this thesis.
Techniques for Cutting, Forming, and Moisture Adjustment of Materials
The techniques for cutting and forming indurated materials, described in
Part One, enabled me to produce the blocks needed for testing all four indurated
materials (tepetate, fine sandstone, coarse sandstone, and chalk). Each material
tested, presented unique features (i.e. differences in strength, bedding planes)
that required preliminary testing and experimenting with different saws, files or,
sandpaper until the desired block was formed. I assume this will be required for
any and all materials to be tested.
In Part One I stated, "The most important aspect of cutting and forming
blocks is to keep the short axis planes both flat and parallel." Testing imperfectly
formed blocks can introduce error in measurements or increase variation within
a population sample. However, techniques for cutting and forming laboratory
samples have not been described. I feel my field techniques have equal
application for field and laboratory use. I assume the conscientious person will
form the best blocks possible and any error or variation introduced to either the
laboratory or field tests (paired samples) would be equal.
The techniques describing the moisture adjustment of materials have
already been established (Cook et al., 1992) and were effective for testing a wider
range of strength in tepetate samples. However, this sample set provides only
two replicates for each tepetate sample at each moisture content and prevents me
from making any other inferences with regard to these data. However, these
techniques may also be helpful in coordinating reclamation with moisture
content.
24
25
Strength Tests and the Development and Calibration of the Modified Jack
The Tinius Olsen and proving rings are the established laboratory
standards for determining unconfined compressive strength. The Tinius Olsen is
the most sophisticated and most expensive. Proving rings are considerably less
expensive, but require some means of calibration and various rings are needed
for measuring a wide range of strengths. The manual field techniques developed
by the Soil Conservation Service do not provide quantitative data and are highly
subjective. Moreover the units of force/energy applied to samples differ between
techniques.
The Modified Jack is inexpensive, provides quantified data, and is easily
carried into the field. The pressure gauge is the most expensive item to purchase,
and cost is a function of the range of measurement needed and the incremental
accuracy desired.
Calibration curves were developed by making direct paired readings
using three techniques of varying degrees of sophistication (i.e. by using the
Tinius Olsen, proving rings, and dead weight). Paired direct readings were
taken three times, using the Tinius Olsen and proving rings, to ensure
repeatability and to exclude the possibility of equipment malfunction. All three
techniques and each replicate produced a near perfect linear correlation between
the Modified Jack and the calibration equipment. Regressions were done on data
taken from each technique, and R-squared values of 1.0 were computed for each.
The nearly perfect linear relationship between the Modified Jack and the
calibration equipment establishes the jack as a means of obtaining quantified
data on unconfined compressive strength in the field.
Application and Results of Field Testing the Modified Jack
Four samples of indurated materials were tested (tepetate, fine sandstone,
coarse sandstone, and chalk). As stated above, in Part Four, the small number of
26
tepetate replicates prevents any further inferences from those data. In retrospect,
it would have been best to test only three or four tepetate samples in the same
way I did the sandstones and chalk. To utilize the seven samples in hand, I could
have run preliminary tests to determine the relative strengths of all seven
samples. If more than one sample had similar strengths, I could adjust all the
blocks of one sample to a different moisture content (higher or lower), using the
same techniques, and fill any gap throughout the pressure range of the Modified
Jack.
The chalk, coarse sandstone, and fine sandstone samples effectively tested
the low, middle, and high ranges of the Modified Jack. Coefficient of variation
values were different for each sample, thus, indicating the relative variability of
each sample was different. I eliminated the blocks and the Modified Jack as
significant sources of variation, and concluded that the source to the variation
must lie in the natural variation of the indurated materials. Variations in jack
readings due to equipment and reader error are most likely to occur at the
extreme low range of the pressure gauge, but can be minimized with a more
sophisticated gauge.
The determination of strength of indurated volcanic-ash materials is
prerequisite to reclamation. While several methods for determining strength are
available, most are either too expensive or do not provide the reliable
quantitative data needed in the field. My study shows that the Modified Jack is
an inexpensive, precise instrument for determining unconfined compressive
strength in the field and that the associated field techniques (cutting, forming,
and moisture adjustment) have wide applicability for use with indurated
materials.
BIBLIOGRAPHY
American Association of State Highway and Transportation Officials, 1984, Standard Specifications for Transportation Materials and Methods of Sampling and Testing. 15th ed.: American Association of State Highway and Transportation Officials, Washington, D.C.
Calcaterra, Jim, 1994, personal communication, Materials Testing Laboratory, Lolo National Forest,U.S. Forest Service, United States Department of Agriculture, Missoula, MT.
Cook, B.J.; and Nimlos, T.J.; and Olsen, D.S. 1992, Determining the unconfined compressive strength of indurated volcanic-ash materials: Bulletin of the Association of Engineering Geologists. Vol. 29, No.3, pp. 335-339.
Farrell, D.A.; Greacen, E.L.; and Larson, W.E., 1967, The effect of water content on axial strain in a loam soil under tension and compression: Soil Science Society of America Proceedings. Vol. 31, No. 4, pp. 445-450.
Grossman, Robert, 1991, personal communication, Soil Conservation Service, United States Department of Agriculture, Lincoln, NE.
Hillery, P. A., 1988, Strength/Moisture Relationships of Mexican Tepetate: Unpublished MS Thesis, Department of Environmental Studies, University of Montana, Missoula, MT, 60p.
Nimlos, T. J. and Ortiz-Solorio, C., 1987, Tepetate-the rock mat: Tournal of Soil and Water Conservation. Vol. 42, No. 2, pp. 83-86.
Nimlos, T. J., 1987, La nomenclature de horizontes endurecidos en suelos de cenizas volcanicas. In Ruiz F., J. F. (editor), Uso v Manejo de los Tepetates para el Desarrollo Rural: Universidad Autonoma Chapingo, Chapingo, Mexico, pp. 10-18.
Nimlos, T. J., 1989, The density and strength of Mexican tepetate: Soil Science. Vol. 147, No. 1, pp. 23-27.
27
28
Nimlos, T. J., 1991, Reclamation of indurated, volcanic-ash material in Latin America. In Lai, R. and Stewart, B. A., Soil Degradation: Advances in Soil Science, Springer-Verlag Publisher, New York, NY, pp.153-170.
Nimlos, T. J. and Hillery, P. A., 1990, The strength/moisture relations and hydraulic conductivity of Mexican tepetate: Soil Science. Vol. 150, No. 1, pp. 425-430.
Nimlos, T. J. and Savage, R. F., 1991, Successful soil conservation in the Ecuadorian Highlands: Tournal of Soil and Water Conservation. Vol. 46, No. 5, pp.341-343.
Vera, R. and Lopez R., 1986, El origen de la cangahua: Paisajes Geograficos. Vol. 16, No. 4, pp. 618-626.
2-9
Appendix 1. Regression of Paired Direct Readings from Tinius Olsen and the Modified Jack
Tinius Olsen Modified Jack 24 50 units= psi 53 100 (n=20) 94 150
111 200 121 250 172 300 207 350 234 400 265 450 289 500 323 550 358 600 393 650 425 700 462 750 496 800 529 850 562 900 595 950 629 1000
REGRESSION
Dependent Variable: Tinius Olsen
Parameter Standard T for HO: Variable Mean Estimate Error parameter=0
Intercept -18.68 4.07 -4.59 Modified Jack 525.00 0.64 0.01 94.06
Sum of Mean Source DF Squares Square F-Value
Model 1.00 680064.29 680064.29 8847.93 Error 18.00 1383.51 76.86 Total 19.00 681447.80
Dependent Mean 317.10 Root Mean Square Error 8.77 Coefficient of Variation 2.76 R-Square 1.00 not rounded R-Square 0.9979697 Adjusted R-Square 1.00
3-0
Appendix 1. Regression of Paired Direct Readings from Proving Rings and the Modified Jack
Proving Rings Modified Jack 19 50 units=psi 45 100 (n=20) 74 150
100 200 126 250 152 300 184 350 213 400 248 450 300 500 312 550 342 600 381 650 413 700 446 750 478 800 515 850 548 900 580 950 614 1000
REGRESSION
Dependent Variable: Proving Rings
Parameter Standard T for HO: Variable Mean Estimate Error parameter=0
Intercept -28.34 3.96 -7.15 Modified Jack 525.00 0.63 0.01 95.86
Sum of Mean Source DF Squares Square F-Value
Model 1.00 668220.15 668220.15 9189.72 Error 18.00 1308.85 72.71 Total 19.00 669529.00
Dependent Mean 304.50 Root Mean Square Error 8.53 Coefficient of Variation 2.80 R-Square 1.00 not rounded R-Square 0.9980451 Adjusted R-Square 1.00
3-1
Appendix 1. Regression of Paired Direct Readings from Dead Loading and the Modified Jack
Dead Weight (lbs) Modified Jack (psi) 55.1 120
104.4 205 (n=13) 157 287
206.3 360 252.1 425 304.7 505
354 560 406.1 640 455.4 705 505.6 785 554.3 855 610.7 930 660.9 998
REGRESSION
Dependent Variable: Deadweight (lbs)
Parameter Standard T for HO: Variable Mean Estimate Error parameter=0
Intercept -39.57 3.37 -11.74 Modified Jack 567.31 0.70 0.01 129.95
Sum of Mean Source DF Squares Square F-Value
Model 1.00 460914.47 460914.47 16885.79 Error 11.00 300.26 27.30 Total 12.00 461214.73
Dependent Mean 355.89 Root Mean Square Error 5.22 Coefficient of Variation 1.47 R-Square 1.00 not rounded R-Square 0.9993489 Adjusted R-Square 1.00
3-2
Appendix 2. Paired Direct Readings
Modified Tack v. Tinius Olsen - Test A (n=20) Modified lack (psi) Tinius Olsen (psi) converted (Pa)
50 24 165600 100 53 365700 150 94 648600 200 111 765900 250 121 834900 300 172 1186800 350 207 1428300 400 234 1614600 450 265 1828500 500 289 1994100 550 323 2228700 600 358 2470200 650 393 2711700 700 425 2932500 750 462 3187800 800 496 3422400 850 529 3650100 900 562 3877800 950 595 4105500
1000 629 4340100
Modified Jack v. Tinius Olsen - Test B (n=10) Modified Jack (psi) Tinius Olsen (psi) converted (Pa)
100 53 365700 200 111 765900 300 173 1193700 400 237 1635300 500 291 2007900 600 356 2456400 700 424 2925600 800 492 3394800 900 562 3877800
1000 630 4347000
Modified jack v. Tinius Olsen - Test C (n=10) Modified Jack (psi) Tinius Olsen (psi) converted (Pa)
100 54 372600 200 114 786600 300 172 1186800 400 242 1669800 500 294 2028600 600 360 2484000 700 428 2953200 800 492 3394800 900 564 3891600
1000 630 4347000
33
Appendix 2. Paired Direct Readings
Modified Jack v. Proving Rings - Test A (n=20) Modified Jack (psi) units=0.0001 in corrected (psi) converted (Pa)
50 21 19 131100 100 49 45 310500 150 79 74 510600 200 107 100 690000 250 136 126 869400 300 164 152 1048800 350 199 184 1269600 400 229 213 1469700 450 266 248 1711200 500 299 300 2070000 550 336 312 2152800 600 369 342 2359800 650 410 381 2628900 700 445 413 2849700 750 481 446 3077400 800 517 478 3298200 850 555 515 3553500 900 592 548 3781200 950 630 580 4002000
1000 667 614 4236600
Modified Jack v. Proving Rings - Test B (n=10) Modified lack (psi) units=0.0001 in corrected (psi) converted (Pa)
100 52 48 331200 200 113 105 724500 300 177 164 1131600 400 240 224 1545600 500 303 283 1952700 600 373 346 2387400 700 446 414 2856600 800 520 482 3325800 900 592 548 3781200
1000 668 615 4243500
Modified Jack v. Proving Rings - Test C (n=10) Modified Jack (psi) units=0.0001 in corrected (psi) converted (Pa)
100 51 47 324300 200 112 104 717600 300 178 165 1138500 400 249 233 1607700 500 325 302 2083800 600 394 366 2525400 700 472 437 3015300 800 549 509 3512100 900 628 578 3988200
1000 687 637 4395300

Appendix 2. Paired Direct Readings
Modified Tack v. Dead Loading - Test A (n=13) Modified Jack (psi) Dead Weight (lbs) Calibrated Jack(psi)
120 55.1 44.4 205 104.4 103.9 287 157 161.3 360 206.3 212.4 425 252.1 257.9 505 304.7 313.9 560 354 352.4 640 406.1 408.4 705 455.4 453.9 785 505.6 509.9 855 554.3 558.9 930 610.7 611.4 998 660.9 659.0
-
35
Appendix 3. Tepetate Block Dimensions and Stren gth Measurements
1 Tinius Olsen Samples Paired Tepetate Samples at Various Moisture Contents
block dimensions (in) uncorrected corrected X Y Z XY reading (psi) reading (psi)
saturated 1 0.94 0.89 2.23 0.83 334 400 saturated 2 0.88 0.86 2.53 0.75 137 181 saturated 3 0.97 1.21 2.91 1.18 434 369 saturated 4 * * * * not available saturated 5 1.00 1.08 2.43 1.08 64 59 saturated 6 0.90 1.15 2.20 1.04 170 164 saturated 7 0.84 0.93 2.22 0.78 crumbled when saturated humid 1 0.76 1.06 2.18 0.81 528 655 humid 2 1.02 1.02 2.20 1.04 430 413 humid 3 0.86 1.10 2.00 0.95 564 596 humid 4 1.16 1.01 2.47 1.17 170 145 humid 5 1.14 1.18 2.76 1.34 268 200 humid 6 0.91 0.91 2.16 0.83 170 205 humid 7 1.21 1.24 2.51 1.50 187 125 air-dry 1 0.80 1.07 1.99 0.86 1226 1425 air-dry 2 * * * * not available air-dry 3 1.04 1.07 2.58 i . i i 826 742 air-dry 4 1.01 1.15 2.40 1.16 452 389 air-dry 5 1.00 1.05 1.96 1.05 inherent fracture air-dry 6 0.97 1.16 2.41 1.13 452 400 air-drv 7 * * * * not available oven-dry 1 0.89 1.08 2.12 0.96 1292 1344 oven-dry 2 0.93 0.94 2.46 0.88 668 759 oven-dry 3 0.99 1.00 2.52 0.99 600 606 oven-dry 4 1.00 0.95 2.89 0 95 466 492 oven-drv 5 0.88 1.05 2.28 0.92 174 189 oven-dry 6 0.89 1.01 2.33 0.90 378 419 oven-dry 7 0.95 0.91 1.89 0.86 inherent fracture
56
Appendix 3. Tepetate Block Dimensions and Stren gth Measurements
Modified Jack Samples Paired Tepetate Samples at Various Moisture Contents
block dimensions (in) uncorrected corrected X Y Z XY reading (psi) reading (psi)
saturated 1 0.91 1.00 2.23 0.91 430 473 saturated 2 0.94 0.92 2.50 0.86 280 324 saturated 3 * * * * not available saturated 4 1.00 0.98 2.47 0.98 120 122 saturated 5 0.98 0.96 1.93 0.94 150 159 saturated 6 1.00 1.18 2.28 1.18 280 237 saturated 7 0.80 0.73 2.34 0.58 crumbled when saturated humid 1 0.85 0.95 2.30 0.81 780 966 humid 2 0.96 1.04 2.44 1.00 930 931 humid 3 0.92 1.07 2.21 0.98 530 538 humid 4 0.95 1.00 2.87 0.95 200 211 humid 5 0.93 0.96 2.10 0.90 190 212 humid 6 1.00 1.00 2.25 1.00 440 440 humid 7 0.83 0.73 2.15 0.61 100 165 air-dry 1 0.91 1.06 2.03 0.96 topped-out gauge air-dry 2 0.86 0.97 2.45 0.83 topped-out gauge air-dry 3 0.93 1.08 2.69 1.00 topped-out gauge air-dry 4 0.79 1.03 2.10 0.81 490 602 air-dry 5 1.03 1.03 2.09 1.06 670 632 air-dry 6 1.04 0.92 2.24 0.96 480 502 air-dry 7 0.90 0.86 2.20 0.77 280 362 oven-dry 1 0.92 1.05 1.90 0.97 topped-out gauge oven-dry 2 1.03 0.94 2.53 0.97 970 1002 oven-dry 3 1.00 1.05 2.58 1.05 870 829 oven-dry 4 0.90 0.94 2.18 0.85 550 650 oven-drv 5 0.92 1.10 2.50 1.01 230 227 oven-dry 6 1.17 1.05 2.25 1.23 660 537 oven-dry 7 0.79 0.87 1.78 0.69 210 306
31
Appendix 3. Coarse and Fine Sandstone Bloc < Dimensions and Strength Measurements
Jack Testing TO=Tinius O sen MJ= Modified Jack uncorrecte corrected calibrated
coarse sandstone block dimensions (in) reading reading reading paired samples X Y Z XY psi psi psi
A-TO 0.855 0.879 1.671 0.752 320 426 -A-MJ 0.827 0.910 1.647 0.753 605 804 496 -B-TO 0.827 0.879 1.643 0.727 323 444 B-MJ 0.812 0.890 1.592 0.723 491 679 416 ~ C-TO 0.922 0.926 1.832 0.854 350 410 C-MJ 0.910 0.930 1.785 0.846 540 638 390 ~ D-TO 0.965 0.985 1.848 0.951 512 539 -D-MJ 0.957 1.005 1,808 0.962 380 395 234 -E-TO 0.894 0.926 1.757 0.828 414 500 E-MJ 0.938 0.957 1.808 0.898 615 685 420 F-TO 0.855 0.898 1.738 0.768 308 401 F-MJ 0.859 0.902 1.548 0.775 442 570 346 G-TO 0.760 0.772 1.485 0.587 251 428 • G-MJ 0.729 0.733 1.407 0.534 300 561 341
uncorrecte corrected calibrated fine sandstone block dimensions (in) reading reading reading paired samples X Y Z XY psi psi psi
A-TO 0.494 0.513 1.442 0.253 270 1065 -A-MJ 0.493 0.516 1.417 0.254 730 2870 1818 -B-TO 0.488 0.5 1.392 0.244 435 1783 B-MJ 0.492 0.501 1.479 0.246 510 2069 1306 C-TO 0.504 0.514 1.438 0.259 508 1961 C-MJ 0.493 0.518 1.479 0.255 890 3485 2212 -D-TO 0.499 0.5 1.407 0.250 435 1743 * D-MJ 0.459 0.493 1.45 0.226 520 2298 1452 • E-TO 0.512 0.522 1.472 0.267 396 1482 E-MJ 0.514 0.522 1.451 0.268 780 2907 1842 h F-TO 0.461 0.474 1.42 0.219 328 1501 F-MJ 0.426 0.481 1.437 0.205 520 2538 1605 „

Appendix 3. Chalk Block Dimensions and Strength Measurements
Jack Testing TO=Tinius Olsen MJ=Modified Jack uncorrectec corrected calibrated
chalk block dimensions (in) reading reading reading paired samples X Y Z XY psi psi psi
A-TO 1.74 1.74 3.46 3.03 131 43 A-MJ 1.73 1.74 3.46 3.01 175 58 19 -B-TO 1.71 1.75 3.46 2.99 116 39 -B-MJ 1.72 1.72 3.46 2.96 242 82 34 -C-TO 1.48 1.72 3.45 2.55 114 45 C-MJ 1.46 1.73 3.45 2.53 200 79 32 D-TO 1.66 1.8 3.46 2.99 128 43 -D-MJ 1.56 1.66 3.46 2.59 220 85 36 -E-TO 1.64 1.72 3.47 2.82 113 40 -E-MJ 1.72 1.75 3.47 3.01 255 85 36 -F-TO 1.72 1.72 3.47 2.96 119 40 -F-MJ 1.71 1.75 3.47 2.99 232 78 31 ~ G-TO 1.65 1.69 3.47 2.79 109 39 G-MJ 1.71 1.72 3.46 2.94 220 75 29 -