developing a cell based screen for inhibitors of two
TRANSCRIPT

Developing a Cell Based Screen for Inhibitors of Two Component Signal
Transduction in Mycobacteria
A thesis
submitted in partial fulfilment
of the requirements
for the degree of
Master of Science in Molecular Microbiology
At
Victoria University of Wellington
By
Sandi Grainne Dempsey
School of Biological Sciences
Victoria University of Wellington
New Zealand
2009

ii
ABSTRACT
The growing number of drug resistant strains of Mycobacterium tuberculosis
appearing worldwide has had an enormous impact on the ability to control and treat
Tuberculosis (TB). Discovering new anti-TB drugs is of paramount importance to the
global effort for TB eradication. The success of the pathogen is largely due to its
inherent ability to remain in a non-replicating or latent state for extended periods of
time. In order to achieve this shift it requires tightly controlled signal transduction
mechanisms to respond to its host environment. Two component systems (TCS) are
one example of signalling mechanisms employed by prokaryotes and are ideal
candidates for antibacterial drug targets. It is understood that many TCS are
conserved in a large number of organisms, they are often essential to the virulence
and persistence of pathogens and they are virtually exclusive to prokaryotes. In this
study three Mycobacterium smegmatis TCS were selected; DevS/DevR, MtrB/MtrA
and SenX3/RegX3. Promoters under the control of these systems were cloned into
an optimised mycobacterial high copy number GFP reporter plasmid and subject to a
number of in vitro stress conditions to ascertain induction conditions for these
systems. As expected the DevS/DevR controlled hspX promoter was responsive to
oxygen starvation and the SenX3/RegX3 controlled phoA was induced by phosphate
starvation. Interestingly, phoA and mtrA were also induced by magnesium chelator
EDTA in minimal media.
The phoA and mtrA promoter constructs were then used for in vitro high throughput
bioassays with a number of compound libraries in order to screen for any inhibitory
activity on each of the target systems. A phosphorylation inhibitor included in one of
the screens, oleic acid, indicated that this assay could potentially be used to screen

iii
for TCS inhibitors, but no novel compounds were found in this study. As a proof of
principle, known TCS inhibitors palmitoleic and oleic acid were employed to show a
dose dependent inhibition mtrA expression. This method could potentially be
expanded to other TCS of Mycobacterium smegmatis and Mycobacterium bovis
BCG, or other signal transduction systems such as one component regulators and
serine threonine kinases.

Acknowledgements
iv
ACKNOWLEDGEMENTS
I would like to express my gratitude to a number of people who were central to the
completion of this project; first and foremost my supervisor Dr. Ronan O’Toole, for
his vision and guidance. The assistance, feedback and encouragement I have
received over the last two years have been crucial to this work.
A number of other SBS staff have also given generous of their time, equipment and
expertise. In particular Dr. David Bellows, who provided a number of chemical
libraries and showed us how to use all the equipment necessary to apply them to our
experiments. Cameron Jack, for all the technical support in so many areas from
robots to plate readers to memory sticks.
A number of plasmids were acquired from other laboratories for use in this study.
Helen Stutz provided the pHIGH100 and pHS201 to our facility, both of which were
extremely useful for my work.
Dr. David Ackerly and all the student members of KK817 and 816 have been a
fantastic group to work with. Thank you all for all the helpful advice, borrowed
reagents and bad jokes. Three people in particular have been central to my work;
future Doctors Jeremy Owen, Shahista Nisa and Christopher Miller. Jeremy thank
your all the advice and encouragement (and for teaching me your cloning tricks!).
Chris, thank you for all the technical help, from setting up library screens to fixing
computer woes, as well as all the intelligent to semi intelligent conversations that
we’ve shared over copious amounts of coffee. Sha, you’ve been a wonderful friend
and mentor and I value all the time you took from your own work to help me with
mine from the very start.

v
I also wish to thank all of my flatmates, workmates, officemates and regular old
matey type mates for being so supportive and understanding. In particular Katherine
Troup, thank you for the constant supply of baked goods and coffee. Special thanks
to Professor Barrington and David Searle for all the welcome distractions and being
the greatest friends ever.
Lastly and most importantly, I wish to thank my family Dr. Susan Burgess, Dr.
Graeme Dempsey, Dr. Rachel Dempsey, Rufus and Paddy who have supported me
in so many ways. Mum thanks all the hours of proofreading and Rachel thanks for
the mini and not so mini breaks and generally spoiling me whenever you got the
chance.
vi
CONTENTS
ABSTRACT................................................................................................................ii
ACKNOWLEDGEMENTS..........................................................................................v
CONTENTS...............................................................................................................vi
LIST OF FIGURES.....................................................................................................x
LIST OF TABLES......................................................................................................xi
LIST OF ABBREVIATIONS......................................................................................xii
1. CHAPTER ONE: General Introduction.....................................1
1.1 Background......................................................................................2
1.1.1 The Development of TB treatment.................................................3
1.1.2 Drugs and Resistance....................................................................5
1.1.3 Epidemiology..................................................................................8
1.2 Immunology and Persistence.......................................................11
1.2.1 Disease Progression......................................................................11
1.2.2 The Tubercular Granuloma ...........................................................13
1.2.3 Endogenous Re-activation and Engogenous Re-
infection..........................................................................................16
1.2.4 Models of Persistence....................................................................17
1.2.5 The Dormancy Response...............................................................20
1.3 Signalling...........................................................................................23
1.3.1 Classes of Signalling Molecules found in mycobacteria.................23
1.3.2 Prokaryote Two Component Signal Transduction..........................26
1.3.3 Mechanisms of Two Component Signal Transduction...................27
1.3.4 Cross talk and Networks in Two Component Systems...................29
1.3.5 The Importance of Two Component Systems in Prokaryotes........32
1.4 Two Component Systems in mycobacteria..............................33
1.4.1 MtrB/MtrA.......................................................................................33
1.4.2 SenX3/RegX3................................................................................35
1.4.3 DevS/DevR....................................................................................36
1.4.4 Two Component Systems as Drug Targets...................................38
1.5 Inhibitors of Two Component Systems .....................................40
1.5.1 Inhibition of the Histidine Kinases..................................................41
1.5.2 Inhibition of the Response Regulators ..........................................42
1.5.3 Screening for TCS inhibitors..........................................................44
vii
1.5.4 Methods used in this Study............................................................46
1.6 Aims ..................................................................................................48
2. CHAPTER TWO: Materials and Methods .................................49
2.1 Strains and Culture Conditions ...................................................50
2.2 Plasmids and Primers ..................................................................50
2.3 Identification of TCS dependent genes in M. tuberculosis
and M. smegmatis ...............................................................................51
2.4 Plasmid Manipulation.....................................................................52
2.4.1 Amplification of Promoters from Genomic DNA ............................52
2.4.2 Ligation of promoters into Cloning Vectors and Heat Shock
Transformation into E. coli.............................................................53
2.4.3 Plasmid Isolation and Digestion.....................................................54
2.4.4 Sequence Alignment......................................................................55
2.4.5 Low Copy Number Reporter Constructs........................................55
2.4.6 High Copy Number Reporter Constructs ......................................57
2.5 Electroporation of constructs into Mycobacterium
smegmatis ............................................................................................60
2.5.1 Visualisation of cells......................................................................61
2.6 Stress Condition Assays .............................................................62
2.6.1 Oxygen Starvation Assays............................................................62
2.6.1.1 Oxygen Starvation Assay with low copy number
constructs ................................................................................62
2.6.1.2 Optimised Oxygen Starvation Assay ............................63
2.6.2 High throughput stress conditions ................................................63
2.6.2.1 Nutrient starvation ........................................................65
2.6.2.2 Antibiotic Stress ...........................................................65
2.6.2.3 Chelators ......................................................................66
2.6.2.4 Additional Stressors .....................................................66
2.6.3 Validation of expression conditions ..............................................66
2.7 Screening for TCS inhibitors........................................................67
2.7.1 Compound Library Screens ..........................................................67
2.7.2 Palmitoleic and Oleic Acid Serial Dilution .....................................68
viii
3. CHAPTER THREE: Optimisation of a GFP Reporter
Plasmid.......................................................................................69
3.1 Introduction .....................................................................................70
3.2 Results .............................................................................................72
3.2.1 Amplification of GFPmut2 and oriM high by PCR .........................74 3.2.2 Switching xylE and pAL5000 with GFPmut2 and oriM high in
pTKmx .....................................................................................75 3.2.3 Comparing the fluorescence of high and low copy number
plasmids in M. smegmatis .............................................................76
3.3 Inserting TCS controlled promoters into pSHigh ....................79 3.3.1 Promoter Amplification by PCR from genomic DNA ......................82 3.3.2 Ligation of promoters into pSHigh .................................................83
3.4 Discussion .......................................................................................84 3.4.1 Optimisation of the reporter plasmid ..............................................84 3.4.2 Selection of TCS promoters ...........................................................86
4. CHAPTER FOUR: Conditions of TCS Regulated Gene
Expression ..................................................................................87
4.1 Introduction ......................................................................................88
4.2 Results ..............................................................................................90
4.2.1 Expression of the DevS/DevR dependent hspX promoter .............90
4.2.2 Expression of the SenX3/RegX3 dependent phoA promoter.........93
4.2.3 Expression of the MtrB/MtrA dependent mtrA promoter ................96
4.3 Discussion .......................................................................................98
4.3.1 Expression of the DevS/DevR dependent hspX promoter .............98
4.3.2 Expression of the SenX3/RegX3 dependent phoA promoter.......100
4.3.3 Expression of the MtrB/MtrA dependent mtrA promoter ..............101
5. CHAPTER FIVE: Screening Compound Libraries for TCS
Inhibitors ...................................................................................104
5.1 Introduction ....................................................................................105
5.2 Results ............................................................................................107
5.2.1 Drug Screens with mtra ...............................................................107
5.2.1.1 Spectrum Library Screen against mtrA expression ....107
5.2.1.2 LOPAC Library Screen against mtrA expression ........110
5.2.1.3 NIH Library Screen against mtrA expression ..............113
ix
5.2.1.4 NIWA Collection Screen against mtrA expression ......116
5.2.2 Drug Screens with phoA ..............................................................118
5.2.2.1 LOPAC Library Screen with phoA................................118
5.2.2.2 Comparison of mtrA and phoA LOPAC screens .........120
5.2.3 Validation of hits from Library Screens in triplicate .....................121
5.2.4 Validation of Whole Cell based screen with Oleic and Palmitoleic
Acid dilution series .......................................................................122
5.3 Discussion .....................................................................................125
5.3.1 Compound Library Screens .........................................................125
5.3.1.1 Spectrum Collection ....................................................125
5.3.1.2 NIH Collection ..............................................................125
5.3.1.3 NIWA Samples ............................................................126
5.3.1.4 LOPAC Library ............................................................126
5.3.2 Discussion on Screen ..................................................................127
5.3.3 Validation of the screen with cis fatty acids .................................129
6. CHAPTER SIX: General Discussion and Future Directions..131
6.1 Summary of Findings ..................................................................132
6.2 Critique of the Screen .................................................................134
6.3 Future Directions ..........................................................................137
REFERENCES......................................................................140
APPENDICES .......................................................................149
Appendix 1: PCR Reactions ...................................................................................149
Appendix 2: Ligation Reactions ..............................................................................150
Appendix 3: Restriction Enzyme Reactions ............................................................151
Appendix 4: Preparation of Calcium Competent DH5α cells ..................................153
Appendix 5: Preparation of Electrocompetent
Mycobacterium smegmatis mc2 155 cells ...............................................................155
Appendix 6: Media used in this study for DH5α cells ..............................................156
Appendix 7: Media used in this study for mc2 155 cells ..........................................157
x
LIST OF FIGURES
Figure 1.1: Disease Progression in TB 12
Figure 1.2: Two Component Signal Transduction 26
Figure 1.3: TCS inhibitors 40
Figure 2.1: 96 well plate set up for stress condition assays 64
Figure 2.2: 96 well plate set up for compound library screening 67
Figure 3.1: Construction of pSHigh, an optimised GFP reporter plasmid 73
Figure 3.2: Visualisation of gfpmut2 and oriM high amplified PCR products 74
Figure 3.3: Removal of xylE and pAL5000 from pTKmx by restriction
enzyme digest 75
Figure 3.4: Visualisation of reporter constructs in M. smegmatis 77
Figure 3.5: Relative Fluorescence of Reporter plasmids in M. smegmatis 78
Figure 3.6: Gene organisation and function of selected TCS controlled
Genes 81
Figure 3.7: Promoters amplified from M. smegmatis and M. tuberculosis
gDNA 82
Figure 3.8: KpnI cut and uncut pSHigh plasmid 83
Figure 4.1: HspX expression during oxygen starvation using low copy
number plasmids 91
Figure 4.2: HspX expression using an optimised oxygen starvation
method and high copy number plasmids 93
Figure 4.3: The effect of phosphate starvation on phoA expression 94
Figure 4.4: The effect of magnesium starvation on phoA expression 95
Figure 4.5: The expression of mtrA in rich media 96
Figure 4.6: The effect of magnesium starvation on mtrA expression 97
Figure 5.1: Spectrum Screen against mtrA expression 108
Figure 5.2: LOPAC Screen against mtrA expression 111
Figure 5.3: NIH Screen against mtrA expression 114
Figure 5.4: NIWA Screen against mtrA expression 117
Figure 5.5: LOPAC Screen against phoA expression 120
Figure 5.6: Identification of mtrA hits on LOPAC Screen against phoA 123
Figure 5.7: Oleic Acid dilution series against mtrA expression 124
Figure 5.8: Palmitoleic Acid dilution series against mtrA expression 124
xi
LIST OF TABLES
Table 1.1: Virulence and survival associated TCS in prokaryotes 31
Table 1.2: HKs and RRs of M. tuberculosis 33
Table 2.1: Plasmids used in this study 50
Table 2.2: Primers used in this study 51
Table 2.3: Stress Conditions 64
Table 3.1: Normalised Fluorescence of High and Low Copy number
Plasmids 79
Table 3.2: Two Component System Controlled Genes 80
Table 5.1: Spectrum Library Candidates 109
Table 5.2: LOPAC Library Candidates 112
Table 5.3: NIH Library Candidates 115
Table A.1 (a-c): PCR Reactions 149
Table A.2 (a-c): Ligation reactions 151
Table A.3 (a-c): Restriction Enzyme Digestion 153
Table A.4 (a-c): Alterations to HdeB media for nutrient starvation 160

xii
LIST OF ABBREVIATIONS
96 wp 96 well plate
ADP Adenosine diphosphate
AFB Acid Fast Bacilli
AIP Auto Inducing Peptide
Amp Ampicillin
AMP-PNP Adenosine Monophosphate p-Nitrophenol
AraLam Arabino Lipoarabinomannan
ATP Adenosine triphosphate
ATPase Adenosine triphosphatase
AWC Alan Wilson Centre
BCG Bacille Calmette-Guérin
cAMP cyclic Adenosine Monophosphate
c-di-GMP cyclic diGuanosine Monophosphate
CIP Calf Intestinal Phosphatase
CR Complement Receptor
DOTS Directly Observed Therapy
DST Drug Susceptibility Testing
DTP Developmental Therapeutics Programme
EDDA Ethylene Diamine-N,N'-Diacetic Acid
EDTA Ethylene Diamine Tetraacetic Acid
EEA-1 Early Endosome Autoantigen 1
eGFP enhanced GFP
EGTA Ethylene Glycol Tetraacetic Acid
ESR Institute of Environmental Science and Research
F Fluorescence
FACS Fluorescence Activated Cell Sorting
FITC Fluoescein Isothiocyante
xiii
gDNA genomic DNA
GFP Green Fluorescent Protein
HdeB Hartman deBonts
HK Histidine Kinase
HPt Histidine containing Phosphotransfer domain
HTH Helix Turn Helix
HTS High Throughput Screen
IFNɣ Interferon gamma
INH Isoniazid
iNOS inducible Nitric Oxide Synthase
IPTG Isopropyl-β-d-thiogalactopyranoside
kan kanamycin
kanr kanamycin resistance
LA Luria Agar
LB Luria Broth
LOPAC Library of Pharmacologically Active Compounds
LTBI Latent Tuberculosis Infection
ManLam Mannosylated lipoarabinomannan
MAP Mitogen Activated Protein
MDR Multi Drug Resistant
MIC Minimum Inhibitory Concentration
NEB New England Biolabs
NIH National Institute of Health
NIWA National Institute of Water and Atmospheric Research
OD Optical Density
oriE Origin of replication (E. coli)
oriM mycobacterial Origin of replication
oriM high mycobacterial Origin of replication (high copy number)
PCR Polymerase Chain Reaction
xiv
PIT Phosphate Intake Transporter
PST Phosphate Specific Transporter
PZA Pyrazinamide
RBS Ribosomal Binding Site
RD-1Region of Difference
rF relative Fluorescence
RIF Rifampin
RR Response Regulator
SDW Standard Distilled Water
SM Streptomycin
STPK Serine Threonine Protein Kinase
TB Tuberculosis
TCS Two Component System
TCSi Two Component System Inhibitor
TEP TriEthylPhosphate
TLR Toll Like Receptor
TNFα Tumour Necrosis Factor alpha
WHO World Health Organisation
XDR Extensively Drug Resistant
X-gal X- galactosidase

1
CHAPTER ONE:
General Introduction
Chapter One: General Introduction
2
1.1 Background
Mycobacterium tuberculosis has been a significant human pathogen for thousands of
years 1, 2. Without a natural reservoir of its own, some consider it to have co-evolved
with humans 2-4. Studies have shown evidence of M. tuberculosis infection in
Egyptian and Incan mummified remains up to 9,000 years ago 2-4 and the
domestication of cattle around 10,000 years ago 5, 6 was thought to be implicated in
the origins of this disease 7. Modern molecular methods have since indicated that the
causative agent of bovine tuberculosis, Mycobacterium bovis, is a more recent
species, having evolved from human specific M. tuberculosis ancestry 3, 8. Ancient M.
tuberculosis DNA, containing none of the four splogiotypic groups used to distinguish
the species from M. bovis, has been found in humans and animals dating back long
before cattle domestication 9. A recent paper suggests that modern M. tuberculosis
may have evolved from a similar prehistoric pathogen found in Homo erectus up to
500,000 years ago 10. While M. tuberculosis is clearly an ancient species, direct
evidence of outbreaks of phthisis, consumption and the white plague cannot be
traced back as far as the organism itself 3.
Whether pathogenically inert or otherwise, M. tuberculosis has infected mankind for
a substantial proportion of our existence. Robert Koch, who first isolated the acid fast
bacillus (AFB) in 1881, estimated at the time that one in seven humans died of
Tuberculosis (TB) 11. Later in 1898, Smith identified different types of mycobacteria
that infect livestock, who shared the hardy mycolic acid cell wall 12. Since then, our
knowledge of the Mycobacterium genus has expanded to 71 species, 32 of which
are pathogenic, these have been classified in a Runyan scheme by various features
including pigmentation and rate of growth 12. More recently, the evolutionary
Chapter One: General Introduction
3
distance between species has been further defined by the analysis of mycolic acid
structures, genetic markers such as the 16S rRNA gene and, in the last decade, the
comparison of entire genomes 8-10. Members of the Mycobacterium tuberculosis
complex are generally responsible for disease in humans and cattle; however a
number of opportunistic Mycobacteria can give rise to infection in an immuno-
compromised host. Slow growers such as Mycobacterium celatum and
Mycobacterium abscessus can infect patients with Acquired Immune Deficiency
Syndrome (AIDS) or chronic immune suppression, while post-traumatic infection is
generally caused by fast growers such as Mycobacterium goodie 12. Comparing
pathogenic and non-pathogenic species has been a useful tool in understanding the
evolution of the Mycobacterium tuberculosis complex and its host-specific virulence
13.
Mycobacterium smegmatis, a non pathogenic soil bacterium, has been extensively
used as a model organism owing to its rapid doubling time of three hours compared
with M. tuberculosis’ 12hours 12, 14. Another model organism is the vaccine strain M.
bovis BCG (Bacille Calmette-Guérin) whose sequence is 99.95% identical to that of
M. tuberculosis 15. These and other models will be discussed in section 1.2.3.
1.1.1 The Development of TB Treatment
TB has been a human disease for thousands of years and a range of treatments and
therapies have been explored. Many significant events have lead to the current
understanding and treatment of TB and other infectious diseases today. The Royal
College of Physicians was set up in 1518 by Henry VIII to fight the bubonic plague
and meant that physicians of the time could monitor infectious outbreaks in order to
Chapter One: General Introduction
4
circumvent the devastating effects disease was having on a rapidly growing
population 16. The burden of TB was probably intensified by overcrowding and
urbanisation, becoming a major cause of death by the Industrial Revolution 17. TB
was no exception to the emerging idea that living conditions play as significant a role
as the disease itself, something which is still a very important factor in TB control 16.
Records show deaths attributed to TB in England and Wales fell from 62,633 to
27,871 between 1878 and 1940, testament to the effect of an improved standard of
living on the disease 16.
Another common feature of infectious endemic is war 18. Devastating outbreaks of
infectious diseases in post war Europe fast tracked the antibiotic era with the
discovery of penicillin in 1928 by Fleming and then streptomycin (SM) in 1944 by
Waksman, Schatz and Bugie 16-18. Prior to this point, the most common form of
treatment for TB had been fresh air and bed rest 19 so Waksman’s discovery in 1943
of a broad spectrum antibiotic that eliminated M. tuberculosis infection in most
patients revolutionised its treatment and lead to a sharp decrease in mortality.
Preventative therapy by immunisation with a live attenuated strain of M. bovis BCG
was pioneered in 1921 and first given to “at risk” groups such as nurses and medical
students in 1949 16. In one of the first large-scale medical research trials in the
United Kingdom, 52, 239 children were immunised between 1950 and 1952 with the
attenuated strain of M. bovis BCG 16. The incidence of TB decreased 79% between
1954 and 1965 which was probably a combination of drug and vaccine efficacy as
well as an improved standard of living, which reduced the infection rate 16.

Chapter One: General Introduction
5
Thousands were saved by vaccination and antibiotic development, but it did not take
long for SM resistant strains of M. tuberculosis to emerge 20. The discovery of
pyrazinamide (PZA), isoniazid (INH) and rifampin (RIF) meant that TB could be
relatively well controlled and combined therapy could be administered to avoid the
emergence of resistant strains 21, 22. Eventually a growing number of patients
presented strains resistant to each of the available anti-tubercular agents prompting
scientists in the field to search for new classes of antibiotics.
Presently, drug resistant strains are classified as either multi drug resistant (MDR) or
extensively drug resistant (XDR) based on the number and class of antibiotics to
which susceptibility has been lost. MDR strains of M. tuberculosis are defined by the
World Health Organisation (WHO) as having “resistance to at least INH and
rifamycin” and XDR is described as “resistance to at least INH and RIF among first-
line anti-TB drugs, resistance to any fluoroquinolone, and resistance to at least one
second-line injectable aminoglycoside (amikacin, capreomycin, or kanamycin)” 23.
M. tuberculosis’ ability to acquire genotypic and phenotypic resistance to these drugs
is of great importance to physicians administering these drugs and to drug discovery
efforts 23.
1.1.2 Drugs and resistance
The treatment of TB has evolved from concoctions of distilled milk infused with earth
worms and snails to modern synthetic pro drugs like INH 20, 24. It is impossible to say
how effectively some of the early remedies such as cod liver oil, arsenic and iodine
worked to reduce the TB burden at the time, but some interesting discoveries began
to emerge at the turn of the 20th century. In 1912 studies employed the use of
Chapter One: General Introduction
6
cultured Bacillus subtilis and Bacillus mesentericus to inhibit the growth of M.
tuberculosis in vitro and in a guinea pig model 20. Later, the use of sulfonamides
showed great anti-mycobacterial potential in vitro, but were far too toxic for use in the
treatment of pulmonary TB 20.
Streptomycin (SM) was isolated from Streptomyces griseus in 1943 and before the
end of 1944 it was being used in clinical trials against TB, showing efficacy in vivo
and in vitro 20, 25. SM was quickly moved to industrial scale production as it showed
an effect on a broad spectrum of organisms including Gram negative, Gram positive
and acid fast bacteria 25. SM is an aminoglycoside antibiotic which acts on bacterial
ribosomes inhibiting translation initiation and causing misreading 26. Various strains
have been sequenced to identify polymorphisms responsible for drug resistance in
mycobacteria recorded by the drug resistance mutation database
(http://www.tbdreamdb.com) 27. Genes encoding the ribosomal subunits rrs and rpsL
have been implicated in resistance to SM and other aminoglycoside 22, 26.
Current first line drugs include INH, rifampin, ethambutol (ETB) and pyrazinamide.
INH acts on mycolic acid synthesis, inhibiting cell wall synthesis 28. It is a
nicotinamide-derived drug first discovered in the 1950s, and proved more effective
than any anti TB drug of its time 24. Resistant isolates were discovered the same
year as the drug. However, it was nearly half a century before genetic analysis of
these isolates lead to the elucidation its mode of action 24. INH is a pro drug
activated by the M. tuberculosis KatG protein and certain polymorphisms in this gene
give rise to INH resistance 24. PZA is an interesting drug, owing to its inactivity in
vitro 29. The mode of action of PZA is currently unknown, but its effect in an
anaerobic environment is far more pronounced than in aerobic conditions 29. Its
Chapter One: General Introduction
7
activity on so called “semi dormant” bacilli has reduced the treatment time of TB from
12 to 6 months 29. A number of mutations to pncA gene and promoter region result in
reduced susceptibility to this drug 27.
The evolution of drug resistant strains of mycobacteria is influenced by many factors.
On a clinical level, the existence of many sub populations within a host, sometimes
in more than one location therein, as well as an inherent ability to survive in either an
active or dormant state engenders resistance 22. Host specific factors also contribute
to the likelihood of drug resistance developing such as the strength of innate
immunity, HIV status and whether or not a patient has been treated for TB previously
13. Studies have shown that the likelihood of MDR or XDR-TB arising is much higher
if the patient has been previously treated for TB or is HIV positive 23, 30. The latest
WHO figures show that countries where the incidence of MDR and XDR-TB is
highest include countries such as South Africa, Ukraine and Latvia where the
number of people with HIV and AIDS is also high 23, 31. Previous treatment is another
important factor, as low quality drugs, incorrect prescription and poor adherence will
affect the probability of resistance arising 27, 32.
On a molecular level, mutations causing polymorphisms within a population can lead
to a subpopulation of resistant bacteria 33. Mutation can arise spontaneously or as a
result of exogenous agents causing DNA replication errors. Point mutations,
insertions, duplications or loss of genetic material can result in a change of
phenotype allowing an organism to become resistant to a drug which usually knocks
out an essential process 34. In some ways the more critical the target to cellular
replication, the more likely resistance will arise. The rate of mutation in pathogenic
Chapter One: General Introduction
8
mycobacteria is relatively low compared with faster growing pathogens, however
there are many genes which display variable mutation rates 35.
There are many reasons M. tuberculosis is able to develop resistance to drugs
including its extended incubation and latency period as well as the fact that most
drugs act on targets essential for growth and division 13, 22. As well as these
documented genotypic changes, the idea of reversible phenotypic drug resistance is
a concept that may well be central to M. tuberculosis drug susceptibility. The idea
that sub populations of bacteria can survive exposure to drugs by a phenotypic
switch to a reductive metabolism, rather than a permanent genotypic change is a
relevant argument for the case of mycobacteria 36.
1.1.3 Epidemiology
The WHO annual surveillance report on TB for 2009 gives a summary of the current
state of TB as well as strategies to combat the disease worldwide 23. Encouragingly
the report indicates that the number of new TB cases per capita has decreased since
2003, however with 9.27 million new cases and 1.3 million deaths in 2007, these
alarming statistics show there is still a long way to go before TB is completely
eradicated 23. The highest incidence per capita is in Africa with an average rate of
363 per 100,000 and 14.4 deaths in 2007 23. The USA and Monaco have the world’s
lowest prevalence rates of 3.1 and 1.9 per 100 000 respectively, while Swaziland
has the highest rate with 1,226 per 100 000 23.
The WHO gives the latest prevalence of TB in New Zealand as 7.3 per 100,000 for
2007 and ESR (Institute of Environmental Science and Research) recorded this rate
as 7.2 per 100,000 in 2008 23, 30. Five new cases of TB were recorded in its latest
Chapter One: General Introduction
9
public health survey report for July and September 2008 all of which were in
Wellington 30. TB has a very strong association with poverty and age in NZ 37. Unlike
countries with a high prevalence of HIV, the majority of TB cases are found in older
people, children and people in a low income bracket 37. Although globally the rate of
TB has dramatically decreased in the last hundred years, thanks to the availability of
antibiotics and a higher standard of living in most countries, the emergence of MDR
and XDR strains of TB is of huge concern 23. First line TB drugs can be used in most
cases to treat TB. Second line drugs are used in cases of drug resistance; however
they are more expensive, must be administered for longer and display severe side
effects 23, 37.
Drug resistant TB is not geographically isolated, according to the WHO 2008 report
MDR TB was detected all over the world and at least one case of XDR TB was
reported in all 45 countries surveyed 23. Globally, it is estimated that 3.9 to 6.6 % of
all cases of TB are MDR 23. The highest rates of MDR-TB in the world are recorded
in Eastern Europe especially in Latvia and Ukraine (up to 36 % of all cases), much
higher than in Africa 23. Data from these countries has shown that the percentage of
MDR-TB is significantly different in new cases at 2.9 % compared with previously
treated cases at 15.3 % 23. Some associate this with a sharp increase in the number
of HIV cases reported in this area 23, it may also be that Eastern Europeans
countries have a very effective surveillance strategy for MDR and XDR-TB and are
picking up more cases than other countries.
The STOP TB strategy set up in 2006 includes an expansion of the directly observed
therapy (DOTS) regime to 184 countries and addresses the challenge of TB HIV co
infection 32.
Chapter One: General Introduction
10
In addition to an increased susceptibility to TB, a positive HIV status is significant
because it will affect drug resistance and the host immune response to TB,
precipitating the onset of disease 23. Testing for HIV status among TB cases in high
risk areas has increased from 8% to 35% since 2002 23. A very important part of TB
research is recording information from around the world showing trends of drug
resistance. Drug susceptibility testing (DST) is one way that MDR and XDR can be
monitored and managed 32. Although mutations causing resistance to current TB
drugs are unavoidable, ensuring that the right combinations of drugs are given to
patients is one way that the rate of MDR and XDR-TB can be reduced.
Currently, the discovery of new anti-TB drugs is of paramount importance in the
effort to stop TB. In order to combat emerging drug resistant strains new targets
need to be elucidated. Our focus is on latent TB and the following section will
describe the progression, persistence and virulence of TB and why targeting latent,
in addition to active, TB could help to alleviate this global epidemic.
Chapter One: General Introduction
11
1.2 Immunology and persistence
One of the most challenging features of TB treatment is the organism’s ability to
maintain a dormant state within its host for long periods of time 34, 38. This section will
outline the progression of TB with an emphasis on factors which affect the disease
outcome for patients and morphological and genetic changes within M. tuberculosis
which allow it to persist for so long.
1.2.1 Disease progression
M. tuberculosis is an obligate pathogen, unlike some other mycobacterial species it
has no environmental niche but can live in humans asymptomatically for long periods
of time 39. Given that one in three humans harbours latent TB, there is in fact a huge
reservoir of M. tuberculosis worldwide
(http://www.who.int/mediacentre/factsheets/fs104/en/). Infection begins with
inhalation of aerosols containing M. tuberculosis AFB to pulmonary alveoli 36, 37. The
presence of foreign pathogenic bacteria is very quickly recognised by the host
immune cells via bacterial toll like receptors (TLR) and mannose receptors 36, 38.
Macrophages and dendrites are recruited to the site of infection where they
phagocytose bacterial cells. In non-pathogenic mycobacteria this results in efficient
control of the infection since macrophages induce the elimination of bacilli by
phagolysosome fusion, complement activation and lymphocyte mediated killing 40.
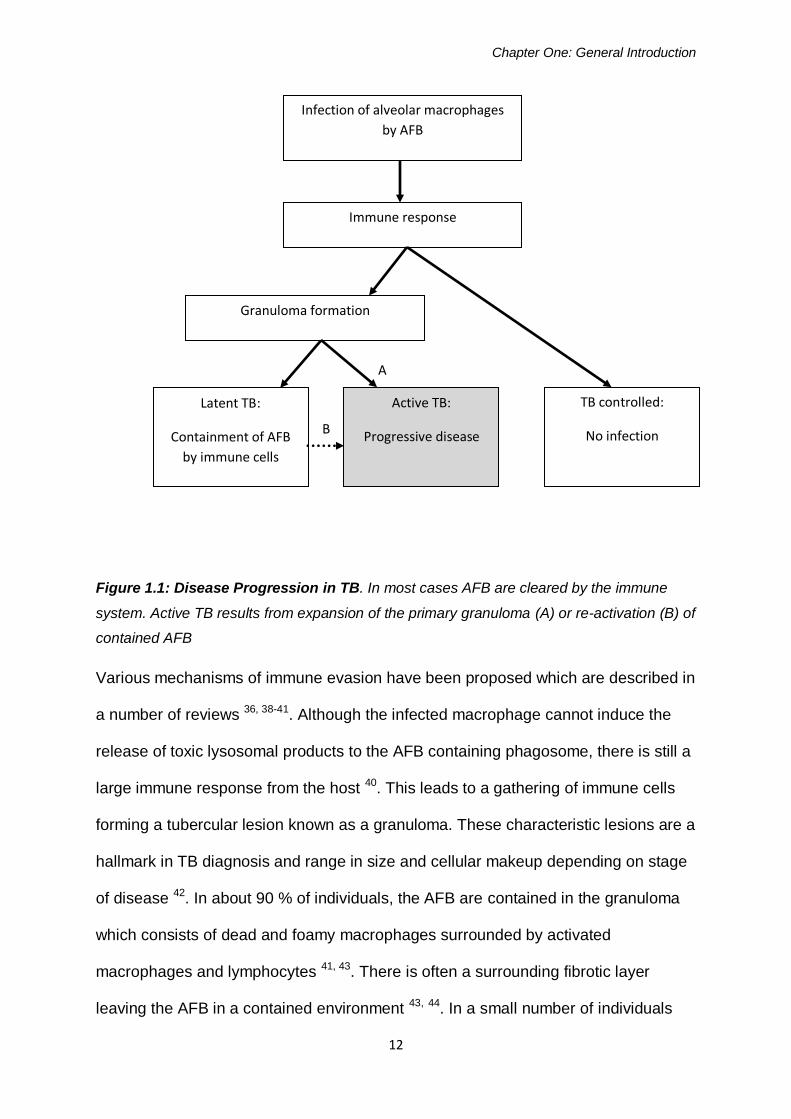
During M. tuberculosis infection, most of the AFB are cleared in this manner but in
approximately one third of cases, the pathogen persists by interfering with
macrophage maturation 38, 41 as shown in figure 1.1.
Chapter One: General Introduction
12
Figure 1.1: Disease Progression in TB. In most cases AFB are cleared by the immune
system. Active TB results from expansion of the primary granuloma (A) or re-activation (B) of
contained AFB
Various mechanisms of immune evasion have been proposed which are described in
a number of reviews 36, 38-41. Although the infected macrophage cannot induce the
release of toxic lysosomal products to the AFB containing phagosome, there is still a
large immune response from the host 40. This leads to a gathering of immune cells
forming a tubercular lesion known as a granuloma. These characteristic lesions are a
hallmark in TB diagnosis and range in size and cellular makeup depending on stage
of disease 42. In about 90 % of individuals, the AFB are contained in the granuloma
which consists of dead and foamy macrophages surrounded by activated
macrophages and lymphocytes 41, 43. There is often a surrounding fibrotic layer
leaving the AFB in a contained environment 43, 44. In a small number of individuals
Infection of alveolar macrophages
by AFB
Granuloma formation
Immune response
TB controlled:
No infection
Active TB:
Progressive disease
Latent TB:
Containment of AFB
by immune cells
A
B
Chapter One: General Introduction
13
the initial infection will lead to primary tuberculosis after an incubation period ranging
from 4 to 12 weeks 43. Dissemination of the primary granuloma results in active TB
by allowing AFB to spread to other regions of lung and eventually other organs of the
host 36, 37.
1.2.2 The Tubercular Granuloma
The host adaptive immune response results in the formation of a granuloma;
providing protection from but not sterilization of an M. tuberculosis infection 40. This is
also seen in other pathogens such as those of the Schistosoma and Brucella genera
44.The large number of immune cells recruited to the site of infection is exaggerated
during a TB infection, effectively encapsulating the AFB to the initial infection foci.
After AFB enter a macrophage they are transported across the epithelial lining where
they recruit more immune cells to the site. This recruitment requires the Region of
Difference (RD1) virulence gene locus 45. Ulrichs and others showed that the type of
cell arriving at the granuloma changes with time, after 4 weeks 45 % of the cells are
macrophages whereas at 6 weeks 80 % are lymphatic cells 42.
A number of reviews describe the structure of the granuloma and the general
consensus is that there is a necrotic core surrounded by concentric rings of immune
cells 36, 41, 42. AFB reside in macrophages surrounded by a mass of cellular material
consisting of dead macrophages and Langhans giant cells, the latter having formed
by the fusion of epitheloid macrophages 42. This layer is surrounded by a number of
activated macrophages, surrounded by naive macrophages and T lymphocytes. A
number of others components are involved in this organised structure including B
lymphocytes, dendritic cells, neutrophils, fibroblasts and extracellular matrix 44.
Chapter One: General Introduction
14
Surrounding tissue keeps the entire structure in check by secreting chemokines and
cytokines 42. The aggregation of T cells around the fibrotic layer acts as mini lymph
nodes surrounding the healing granuloma 42, 43. The conditions within the tubercular
granuloma have been studied extensively using a number of models; certain areas
of the granuloma have been shown to be hypoxic, nutrient and iron deprived, and
contain toxic nitric oxide products 42, 44.
The cellular composition of the granuloma is altered depending on whether the
lesion is healing or disseminated and the centre of the granuloma can either be
casious or calcified 42. Other differences in these states are the presence of blood
supply in an active granuloma and fibrotic coating surrounding the healing
granuloma keeping AFB contained to the site of infection 42. One of the most
important factors affecting the rate of healing is the bacillary load present in the lungs
45. Other host factors will also determine how quickly the granuloma heals, in
particular the health of the individual’s immune system.
There is debate as to whether the granuloma is in a constant or dynamic state 42, 45.
The historical view of granuloma formation implies that after infection granulomas
heal over time unless certain host factors trigger re-activation 42. This static view
implies that the dormant bacilli are contained in the granuloma, employing a
reductive metabolism in order to survive in the hypoxic nutrient deprived lesion for
extended periods of time until resuscitated. Numerous studies in different models
have shown that TB is able to switch to a dormant state during LTBI 45-48. There is,
however, mounting evidence that this may not be the case for every single AFB. For
example, the finding of M. tuberculosis DNA outside the granulomatous lesions of
patients with LTBI indicates that AFB could be escaping from granulomas even
Chapter One: General Introduction
15
during an LTBI 49. The problem here is that the presence of DNA does not
necessarily prove that live M. tuberculosis survives in the lung. To date the presence
of RNA, indicative of live M. tuberculosis, has only been found within macrophages
in non-necrotic zones of the granuloma 44.
The dynamic hypothesis describes a state seen in the M. marinum model where the
AFB are contained by fibrotic tissue surrounding the granuloma but can escape to
other areas of the lung with the help of macrophages 45. In this view, infection
remains controlled even though the lesions are moving around the lung; more
forming as older ones heal completely 45. Unfortunately, which view you take is
largely dependent on what model organism and host you are studying. As there is
really no perfect model for LTBI in humans, all of the evidence obtained using
different model organisms and hosts needs to be carefully considered. In any case,
there is something unique about the ability of M. tuberculosis to maintain a slow
growing persistent state in response to the harsh environmental conditions it faces.
The granuloma effectively houses the infectious agent for extended periods of time.
This can lead to endogenous re-activation of the disease in a compromised host.
There is much debate as to whether the majority of current TB cases are the result of
exogenous re-infection of AFB or endogenous re-activation from a previous infection
41. Given that so many humans harbour latent TB, yet only a small proportion of
those exposed to the pathogen develop a latent or active infection, one could argue
that both processes are very important in post primary TB.
Chapter One: General Introduction
16
1.2.3 Endogenous Re-activation and Exogenous Re-infection
A number of studies attest to M. tuberculosis’ ability to survive for long periods of
time in a dormant state in vivo and in vitro 16, 45-48. There is evidence that TB can
survive in a human host for up to 33 years 48. Re-activation occurs when a
granuloma disseminates and infected macrophages spread to other parts of the lung
42, 50. The ratio of cases which arise from re-activation and re-infection is unknown
but it is likely that a number of host factors are involved in the outcome. A Latent TB
infection (LTBI) is maintained by a delicate balance between the host immune
system and the population of AFB in the granuloma 42. Immune suppressant drugs
such as infliximab have been shown to greatly increase the rate of re-activation 51.
Malnutrition, old age and co-infection with HIV have all been shown to increase re-
activation rates 13, 34. Even genetic differences within individuals of a population can
influence the odds of re-activation, for example polymorphisms on chromosome
regions 2q21-2q24 and 5p13-5q22 have been linked to susceptibility to re-activation
52.
On the other hand many of these factors could also increase the likelihood that an
individual is susceptible to re-infection. Consider that a malnourished, elderly or HIV
positive patient is probably much more likely to be unable to control a new infection if
they live in an area with a high risk of contagion. As we learn more about the
granuloma status in latent and active TB it seems likely that both re-activation and
re-infection contribute to the current epidemiology of the disease. There may be an
entire spectrum of disease states in these lesions. The AFB may be replicating very
slowly and causing new lesions which heal without ever causing active disease until
there is a break down in the immune system control causing re-activation or an
Chapter One: General Introduction
17
increase in AFB number as a result of re-infection 45. In either case, the fact that TB
can survive in this latent phase, providing such a large reservoir of AFB developing
drug tolerance and resistance, make it an extremely dangerous pathogen.
1.2.4 Models of Persistence
Before discussing the ability of M. tuberculosis to enter dormancy, it is necessary to
explain some of the models used to explore the dynamics of mycobacterial gene
expression and host responses to the AFB during LTBI. H37Rv, a common lab strain
of M. tuberculosis, is restricted to physical containment level 3 facilities in New
Zealand. This precaution and its long doubling time of 12 hours make it a difficult
organism to work with, thus other species of the mycobacterium genus have been
used in its place. M. smegmatis and M. bovis BCG are commonly used to explore
changes involved in dormancy 48, 53. Other related mycobacterial model organisms
include zoonotic pathogens M. avium and M. marinum 12.
The Wayne model is an in vitro model used to explore changes in gene expression
during stationary phase 54. It involves a slow starvation of oxygen to a point where
the optical density (OD) of the cell culture is constant but the cells remain viable 55.
This model was originally established in the 1970s and the authors discovered that
genes involved in the glycoxylate shunt were up-regulated during this growth phase
56. Three markers of dormancy were described namely, tolerance to anaerobiosis,
unique antigen production and a significant increase in the production of glycine
dehydrogenase and isocitrate lyase enzymes 56. These changes mean that M.
tuberculosis can use up less energy and persist in a slow or non-replicating state.
Many of these findings have been replicated by two dimensional gel and microarray
TH1
TH1
Chapter One: General Introduction
18
analysis showing upregulation of icl and aceA genes during stationary phase and
during in vivo infection 57. Other variations on this model achieve stationary phase
persistence by altering temperature, pH, nutrient sources and nitric oxide levels 44.
While in vitro models cannot replicate the hostile environment of the granuloma,
many mycobacterial species exhibit similar changes as a result of oxygen starvation
to those seen in vivo such as antibiotic tolerance, down regulation of a number of
genes involved in active metabolism and induction of a set of genes known as the
dormancy regulon 47. In vivo induced genes have also been categorised by infection
with human macrophage cells 44. Some of these can be further broken down to
groups of macrophage and granuloma activated genes 44. The different subsets
show that there are some intrinsic host factors required to fully appreciate dormancy
in human LTBI 44.
The Cornell model has been used extensively to discover more about in vivo
adaptation by M. tuberculosis. This model involves drug induced immunosupression
in mice 36, 65, 66. After infection, a mouse will generally clear most of the AFB without
causing disease until treatment with steroids causes M. tuberculosis re-activation.
While much of what we know about in vivo gene expression and host response is
derived from this model, it does have its limitations. The bacterial load required for a
TB infection in mice is much higher than what is usually seen in humans 44.
Consequently, the mice end up with a chronic infection causing severe damage of
the lung, rather than the anaerobic calcified granuloma seen in humans 36, 43.
Another problem is that the administration of drugs is not standardised across the
field which may cause discrepancies in results 44.

Chapter One: General Introduction
19
These problems have lead to the exploration of other host organisms. Guinea pigs
are much more susceptible to M. tuberculosis infection and produce granulomas of
similar pathology to those in humans 36, 67. Rabbits also show a similar pathology
with caseous and calcified healing lesions however, they are resistant to M.
tuberculosis infection and will only be infected by M.bovis 44.
Using other species of mycobacteria in their specific host is another way of
determining how persistence can be achieved. Although they will not fully represent
the human disease, many of the mechanisms used to survive intracellular conditions
are similar. Members of the M. avium subspecies are obligate pathogens which
infect chickens and cause Crohn’s disease in immune compromised humans 12. M.
bovis is 99.95 % similar to M. tuberculosis on a nucleotide level and infects a number
of animals including goats, pigs and sheep 15. Interestingly M. bovis, which is more
recently evolved than M. tuberculosis from the original progenitor of the complex, the
loss of certain genetic elements exhibits a broader host range 15.
Avirulent M. bovis BCG has been used as a vaccine strain for many years and a
particular region that was lost in BCG is the previously mentioned RD1 region 36, 68.
This genetic region was recently studied in M. marinum, which can cause disease in
frogs and fish 45. It is a particularly useful model as it infects macrophages and gives
a similar granuloma structure to the closely related M. tuberculosis. The
aforementioned work used this species in zebrafish embryos to determine formation
and stability of granulomas in this species.

Chapter One: General Introduction
20
1.2.5 The Dormancy response
Using the models described, significant advances have been made in elucidating the
dormancy response during persistence in a granuloma. Transposon mutagenesis
studies have implicated a number of genes for survival of M. tuberculosis at various
stages of infection 46. The pathogen must respond rapidly to environmental cues in
order to alter its proteome and adapt to these harsh conditions using tightly regulated
signal transduction mechanisms. Some of the important cellular changes will be
described.
The RD1 Region
The development of the M. bovis BCG vaccine strain involved serial passage of the
strain until it reached an avirulent state 58. Genotyping the vaccine strain revealed
the loss of two significant genetic regions, esat6 and cfp10 collectively known as the
RD1 region. A BCG:RD1 knock in strain displayed an increase in virulence that was
not entirely restored with respect to the wild type strain 58. RD1 mutants have a
different morphology to wild type and do not form a granuloma structure. A recent
study confirmed that this genetic region was vital in maintaining persistence in a
granuloma using the M. marinum zebrafish model 45.
The distinct layers of a granuloma suggest that these lesions are not a random mass
of cellular material but an organised structure which forms as macrophages are
activated by AFB, leading to aggregation of mononuclear phagocytes 59. Davis et al.
found that the M. marinum RD1 mutant was attenuated in its ability to form a
granuloma. The main distinctions they found in macrophage aggregation from the
RD1 mutant compared with wild type included differences in the speed and

Chapter One: General Introduction
21
morphology of macrophages recruited to the infection foci. The granuloma expansion
was also different; in wild type cells a continual expansion of the granuloma was
observed through cycles of apoptosis and phagocytosis, while the mutant showed no
chemotaxic recruitment of macrophages.
Other changes involved in the dormancy response include the induction of the so
called dormancy regulon. Over 40 genes are induced by the DevS/ DevR two
component system (TCS) in response to conditions of low oxygen and nitric oxide 60-
62. These include enzymes required for glycoxylate metabolism, shown in the
previously mentioned Wayne model 56, a number of other stress response genes are
induced by this TCS, including the hspX gene 62-64.
Changes to the cell wall structure of the pathogen involving the PhoP/ PhoR system
are also noted during latency 57, 70-73. A review on the potential of cell wall
components as drug targets describes multiple changes in the cell wall composition
as a result of stationary phase in mycobacteria 65. The author describes possible
changes to the amount and conformation of mycolic acid, a change in the ratio of
cross-linked peptidoglycan and a decrease in the level of arabinogalactan present
during dormancy 65.
All of the mechanisms which M. tuberculosis uses to evade immune responses and
survive latently in an intracellular environment rely on adapting to life in the
macrophage. The AFB is able to do this via a number of signal transduction
mechanisms which tightly control gene expression in response to extra and intra
cellular changes it encounters. The current understanding of changes to the mycolic
acid structure of the AFB cell wall during infection raises questions about the efficacy

Chapter One: General Introduction
22
of cell wall related drug targets, such as INH, for treating latent TB 65. The AFB’s
switch to a more reductive metabolism will also render drugs which target active
replication poor candidates against latent infection. In order to eliminate the sizable
reservoir of latent TB worldwide, new candidates that act on targets utilised during
this dormancy phase are required.
Chapter One: General Introduction
23
1.3 Cellular Signalling
Every living organism must have tightly controlled sensing mechanisms in order to
survive in and respond to its particular niche. Both prokaryotic and eukaryotic cells
employ a number of responsive systems and processes, without which they would
be rendered defenceless in the face of any changes in their respective
environments. Organisms adapt to life in specific conditions with relation to
temperature, pH, and the availability of nutrients and oxygen, to name a few. How
well an organism adapts to a changing environment determines its survival and
evolutionary fitness.
In M. tuberculosis, signalling molecules and systems allow the organism to live in the
hostile environment of the human immune system induced granuloma for extended
periods of time, making these structures attractive drug targets. Their relative
distance, in terms of homology, from eukaryotic signalling systems means that
inhibitors of prokaryote signal transduction are less likely to evoke a negative
response in the human host. This section will highlight important prokaryote
signalling mechanisms seen in mycobacteria, with an emphasis on the two
component systems (TCS) which are the focus of this study.
1.3.1 Classes of Prokaryote Signalling Molecules found in mycobacteria
In response to external signals, prokaryotes employ single and multi protein
phosphorelay systems to interpret and respond to external ligands. This results in
control of gene expression by either transcriptional control or post translational
modification of proteins. Histidine kinases (HKs) are generally part of two component
system signal transduction. Other sorts of protein kinases include serine threonine
Chapter One: General Introduction
24
and tyrosine kinases. The earliest evidence for reversible phosphorylation in
prokaryotes was unearthed in the 1970s 66. This sort of mechanism had only been
revealed in eukaryotes and the bacteriophage T7, so the discovery of serine
threonine kinases in Salmonella typhimurium 66 preceded a surge of interest in this
area.
One Component Regulators
One component signalling, as the name implies, requires just one protein with
sensor and effector domains 67. Intracellular changes are recognised by the sensing
domain which results in DNA binding of the effector, which acts as a transcriptional
activator or repressor 67. Some well known examples include the TetR and AraC
proteins in E.coli, which respond to L-arabinonse and tetracycline respectively 67.
The simplest AraC type regulators do not require phosphorylation or communication
between proteins 67. Thousands of bacterial proteins share motifs with the AraC
regulator but none have been found in eukaryotes 67. An example of this sort of
protein in mycbacteria is the iron dependent regulator IdeR. The protein contains an
N terminal helix turn helix motif for DNA binding and two metal binding sites
surrounded by the dimerization domain 68. When bound to iron, the protein represses
the fxbA gene product 79-81, which is an important enzyme in the synthesis of the M.
smegmatis siderophore exochelin 69, and activates iron storage gene bfrA 70. The
ability to acquire and store iron is very important during intracellular infection and is
noted as a virulence factor for M. tuberculosis 82, 83. The ideR gene has been
deemed essential 71, probably because loss of this gene product results in an
overload of iron accumulation which is toxic to the organism 72.
Chapter One: General Introduction
25
Serine Threonine Kinases
The first mycobacterial serine threonine protein kinase (STPK) was discovered in
1997 73, since then 11 Mycobacterial STPKs have been identified named Pkn A to L,
which are implicated in development, pathogenicity and stress responses 74. STPKs
are often implicated in development from one state to another such as in sporulation
of M. xanthus 75. They are also thought to interfere with Mitogen Activated Protein
(MAP) kinases of epithelial cells in Listeria monocytogenes 76. Mycobacteria,
especially M. marinum, have a large number of STPKs; it is possible that they are
complementing a relatively smaller number of TCS compared with other bacteria 77.
PknG and PknK are the only M. tuberculosis STPKs that do not posses
transmembrane regions, all the other STPKs are grouped based on homology
clusters or function.
Adenylyl cyclases and diguanylyl cyclases
Other transcriptional regulators are influenced by global regulators such as cyclic
nucleotides cyclic adenosine monophosphate (cAMP) and cyclic diguanosine
monophosphate (c-di-GMP). Bai et al have shown that cAMP has an important role
in macrophage interaction as its concentration increases 50 fold during M.
tuberculosis and M. bovis BCG infection 78. At least 15 class III adenylyl cyclases
exist in M. tuberculosis and 31 in M. leprae, a relatively high number compared with
other bacterial genomes 79, 80.
Chapter One: General Introduction
26
1.3.2 Prokaryote Two Component Signal Transduction
The concept of two component signal transduction, whereby one component
recognises some external change and another component modulates an appropriate
response, is now a hallmark of prokaryote signal transduction. Phosphorylation of
histidine kinases was recognized in E.coli by Kundig and Roseman in 1971 who
were studying mechanisms of sugar transport 81. Later it was found that
phosphorylation of such proteins can modulate changes in gene expression 82 when
coupled with a response regulator in a process outlined by figure 1.3. The term two
component system is something of a misnomer, as it includes multistep kinases with
intermediate proteins to regulate and insulate signals 83. In E. coli there are 32
response regulators (RR), 23 histidine kinases (HKs) and 5 hybrid sensory kinases
83. These were identified by Mizuno et al using OmpR, NarL, NtrC and CheY
systems as probes to search for similar open reading frames 83. They described a
number of common “signature sequences” of HKs and RRs.
Chapter One: General Introduction
27
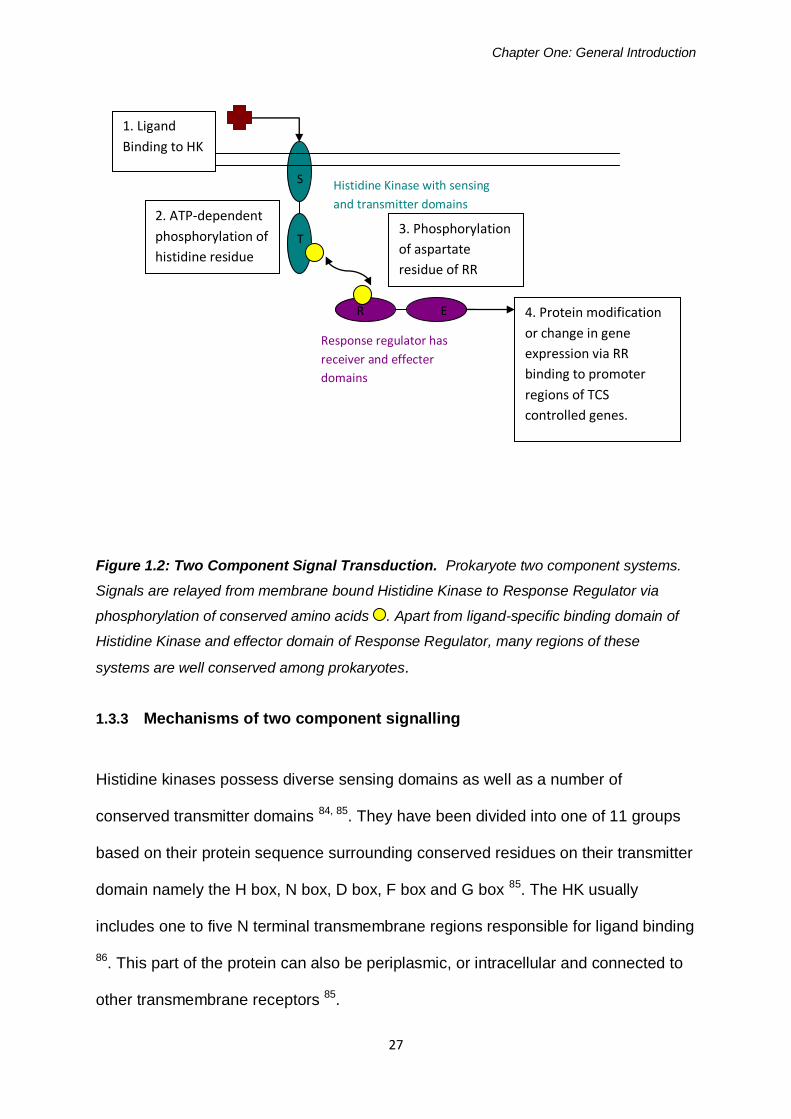
Figure 1.2: Two Component Signal Transduction. Prokaryote two component systems.
Signals are relayed from membrane bound Histidine Kinase to Response Regulator via
phosphorylation of conserved amino acids . Apart from ligand-specific binding domain of
Histidine Kinase and effector domain of Response Regulator, many regions of these
systems are well conserved among prokaryotes.
1.3.3 Mechanisms of two component signalling
Histidine kinases possess diverse sensing domains as well as a number of
conserved transmitter domains 84, 85. They have been divided into one of 11 groups
based on their protein sequence surrounding conserved residues on their transmitter
domain namely the H box, N box, D box, F box and G box 85. The HK usually
includes one to five N terminal transmembrane regions responsible for ligand binding
86. This part of the protein can also be periplasmic, or intracellular and connected to
other transmembrane receptors 85.
Extra cellular
signal
Histidine Kinase with sensing
and transmitter domains
Response regulator has
receiver and effecter
domains
S
T
R E
1. Ligand
Binding to HK
2. ATP-dependent
phosphorylation of
histidine residue
3. Phosphorylation
of aspartate
residue of RR
4. Protein modification
or change in gene
expression via RR
binding to promoter
regions of TCS
controlled genes.
Chapter One: General Introduction
28
As mentioned, this part of the protein is extremely variable amongst TCS. Some
studies have shown the sensory domain to have a specific ligand binding preference,
such as divalent cations 87, others imply that certain conditions lead to a change in
conformation of the protein 88. In either case, this results in an ATP-dependent
autophosphorylation of the H box of the protein. The HKs occur as dimers with
catalytic domains connected by a HAMP linker motif 84. The catalytic domain forms a
complex with a cognate RR containing a conserved aspartate residue 89. The
phosphoryl group is transferred from the histidine to the aspartate residues resulting
in a switch to the RR’s active state 89.
The RR usually contains around 120 amino acids, including the crucial aspartate and
two other conserved residues 83. The RR carboxy terminal effector domain is
responsible for initiating the cellular responses to the ligand 83. OmpR, NarL and
NtrC type RRs have DNA binding domains and act as transcription factors in that
they directly induce or repress gene expression 83. Others have an enzymatic role in
the cell or directly interact with other proteins 85.
There are essentially four steps common to all TCS which are illustrated in figure
1.3. An environmental stimulus is recognised, usually in the form of ligand binding.
This results in a conformational change to the HK, causing autophosphorylation of
the histidine residue of the HK transmitter domain by the conversion of an ATP to
ADP (adenosine diphosphate). Then there is a transfer of the phosphoryl group from
a histidine residue on the HK to an aspartate residue on a response regulator, and
finally dephosphorylation of the phosphoryl group to inorganic phosphate 89.
Chapter One: General Introduction
29
This is a simplified model of this mechanism because there are a number of
variations on this theme. Some systems involve intermediate steps for greater
control and networking between signals. Multi-step phosphotransfer signalling works
on the same principles as two component signalling, with an added level of
complexity. HPts are histidine containing phosphotransfer domains found in some
signalling systems 84. This higher level of complexity is often found in eukaryote
signalling systems, either to ensure that there are multiple regulatory checkpoints, to
amplify a signal or so that the HPt can be an alternate target 84.
1.3.4 Cross talk and Networks in TCS Signal Transduction
As well as having intermediate proteins, these systems can form networks to
integrate signal transduction 90. Pathways can be branched, in other words one HK
can phosphorylate many RRs, such as is the case in the CheA/CheY/CheB system
or multiple HKs can phosphorylate one RR 91. It is somewhat surprising, given the
conserved mechanism of phosphotransfer across signalling networks, that crosstalk
is not a problem 91. Since there are often dozens of these systems in a cell,
responding to a vast array of different signals, it is important that these
phosphorelays are insulated from each other. There is evidence that, in the absence
of their cognate HK, a RR can be phosphorylated by other HKS 91. For example, in a
PhoR deletion mutant, its native RR PhoB can be phosphorylated by another HK
named VanS 91. Another way to induce cross talk of signals is to over-express the
HK, presumably making the protein more likely to phosphorylate another RR. This
has not been shown in wild type cells, indicating that there is a high level of control
over signal insulation. It is likely that RRs, which are generally more abundant in the
cell than their cognate HKs, have a preference for their own HK 90, 91. Also, the
Chapter One: General Introduction
30
observation that HKs often negatively control RRs by de phosphorylation means that
there is a smaller chance of signals going astray 91.
In eukaryotic Arabidopsis thaliana, a TCS network has been analysed giving a map
of hundreds of interactions between proteins involved in these systems 92. A similar
study in E. coli concluded that the most significant interaction between TCS was in
the overlap of gene expression resulting from different systems 93, 94.
1.3.5 The Importance of TCSs in Prokaryotes
The signal relays described usually culminate in an alteration of gene expression.
Large numbers of genes are either switched on or off as a result of the RR
activation. Control of cell osmolarity in E. coli by EnvZ/ OmpR is a well understood
example of how the cell is capable of maintaining turgor pressure 84. Controlling the
expression of membrane proteins OmpC (during high osmolarity) and OmpF (during
low osmolarity) is crucial in a changing environment 84.
As well as general survival of the cell in harsh conditions, pathogenic bacteria also
use these signal systems to express virulence factors, some of which are shown 89 in
table 1.1.
Chapter One: General Introduction
31
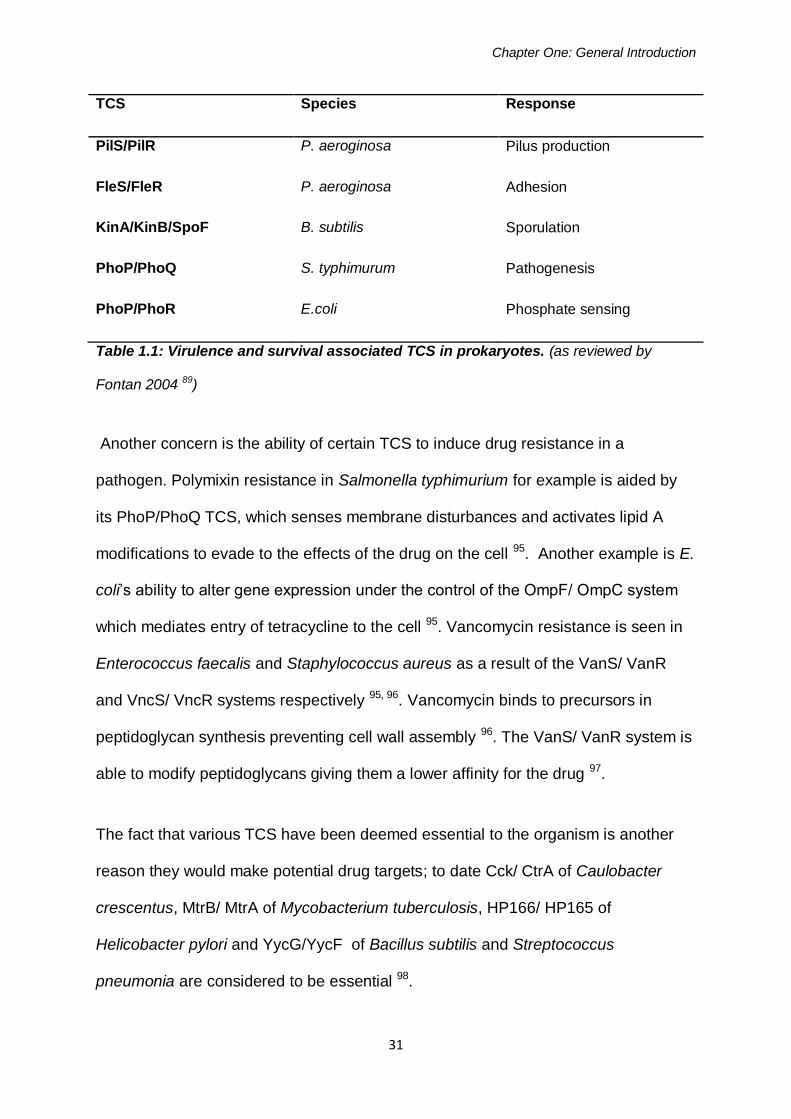
TCS Species Response
PilS/PilR P. aeroginosa Pilus production
FleS/FleR P. aeroginosa Adhesion
KinA/KinB/SpoF B. subtilis Sporulation
PhoP/PhoQ S. typhimurum Pathogenesis
PhoP/PhoR E.coli Phosphate sensing
Table 1.1: Virulence and survival associated TCS in prokaryotes. (as reviewed by
Fontan 2004 89)
Another concern is the ability of certain TCS to induce drug resistance in a
pathogen. Polymixin resistance in Salmonella typhimurium for example is aided by
its PhoP/PhoQ TCS, which senses membrane disturbances and activates lipid A
modifications to evade to the effects of the drug on the cell 95. Another example is E.
coli’s ability to alter gene expression under the control of the OmpF/ OmpC system
which mediates entry of tetracycline to the cell 95. Vancomycin resistance is seen in
Enterococcus faecalis and Staphylococcus aureus as a result of the VanS/ VanR
and VncS/ VncR systems respectively 95, 96. Vancomycin binds to precursors in
peptidoglycan synthesis preventing cell wall assembly 96. The VanS/ VanR system is
able to modify peptidoglycans giving them a lower affinity for the drug 97.
The fact that various TCS have been deemed essential to the organism is another
reason they would make potential drug targets; to date Cck/ CtrA of Caulobacter
crescentus, MtrB/ MtrA of Mycobacterium tuberculosis, HP166/ HP165 of
Helicobacter pylori and YycG/YycF of Bacillus subtilis and Streptococcus
pneumonia are considered to be essential 98.
Chapter One: General Introduction
32
1.4 Two Component Systems in mycobacteria
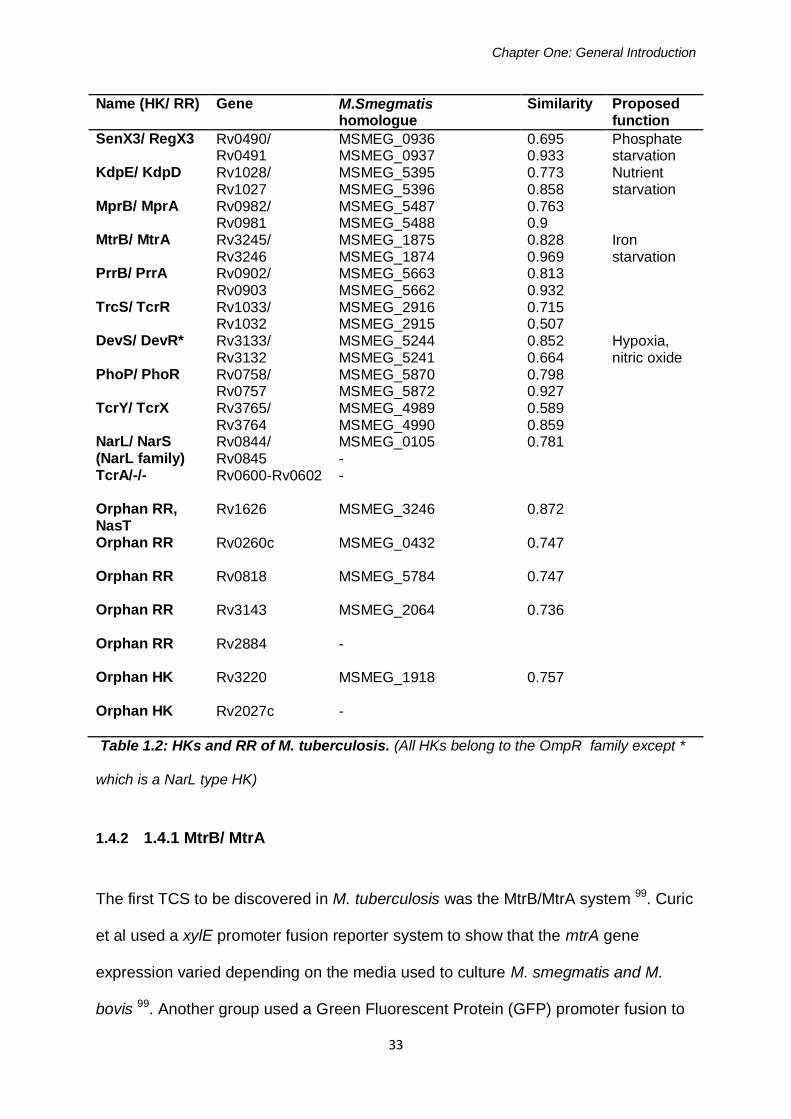
The M. tuberculosis genome encodes 11 TCS and seven orphan HKs and RRs 86.
All of these belong to either the OmpR or NarL family of TCS defined by the residues
surrounding their H box. M. bovis shares all of these TCS while the M. smegmatis
genome contains five out of the seven orphan HK and RR and nine out of the eleven
complete TCS 86. Table 1.2 names all of these systems and their M. smegmatis
homologues with any known conditions regarding their expression, based on articles
by Tyagi, Fontan and Haydel 113, 116, 125. These TCS are found in a majority of
mycobacterial species, with the exception of M. leprae which has only 4 out of 12;
SenX3/ RegX3, PrrB/ PrrA, MprA/ MprB and MtrB/ MtrA.
Some of the TCS of M. tuberculosis have been well studied and their activating
factor or factors proposed. Others have been shown to be upregulated during intra-
macrophage infection, indicating an important function during infection and latency,
but the specific condition they are responsive to remains elusive. The systems used
in this study were MtrB/ MtrA, DevS/ DevR and SenX3/ RegX3 which will be
described..
Chapter One: General Introduction
33
Name (HK/ RR) Gene M.Smegmatis homologue
Similarity Proposed function
SenX3/ RegX3 Rv0490/ Rv0491
MSMEG_0936 MSMEG_0937
0.695 0.933
Phosphate starvation
KdpE/ KdpD Rv1028/ Rv1027
MSMEG_5395 MSMEG_5396
0.773 0.858
Nutrient starvation
MprB/ MprA Rv0982/ Rv0981
MSMEG_5487 MSMEG_5488
0.763 0.9
MtrB/ MtrA Rv3245/ Rv3246
MSMEG_1875 MSMEG_1874
0.828 0.969
Iron starvation
PrrB/ PrrA Rv0902/ Rv0903
MSMEG_5663 MSMEG_5662
0.813 0.932
TrcS/ TcrR Rv1033/ Rv1032
MSMEG_2916 MSMEG_2915
0.715 0.507
DevS/ DevR* Rv3133/ Rv3132
MSMEG_5244 MSMEG_5241
0.852 0.664
Hypoxia, nitric oxide
PhoP/ PhoR Rv0758/ Rv0757
MSMEG_5870 MSMEG_5872
0.798 0.927
TcrY/ TcrX Rv3765/ Rv3764
MSMEG_4989 MSMEG_4990
0.589 0.859
NarL/ NarS (NarL family)
Rv0844/ Rv0845
MSMEG_0105 -
0.781
TcrA/-/-
Rv0600-Rv0602 -
Orphan RR, NasT
Rv1626 MSMEG_3246 0.872
Orphan RR
Rv0260c MSMEG_0432 0.747
Orphan RR
Rv0818 MSMEG_5784 0.747
Orphan RR
Rv3143 MSMEG_2064 0.736
Orphan RR
Rv2884 -
Orphan HK
Rv3220 MSMEG_1918 0.757
Orphan HK
Rv2027c -
Table 1.2: HKs and RR of M. tuberculosis. (All HKs belong to the OmpR family except *
which is a NarL type HK)
1.4.2 1.4.1 MtrB/ MtrA
The first TCS to be discovered in M. tuberculosis was the MtrB/MtrA system 99. Curic
et al used a xylE promoter fusion reporter system to show that the mtrA gene
expression varied depending on the media used to culture M. smegmatis and M.
bovis 99. Another group used a Green Fluorescent Protein (GFP) promoter fusion to
Chapter One: General Introduction
34
show this gene was expressed during macrophage infection with M. bovis BCG 127
which was later complemented by work from Via and co-workers 100. One interesting
quality of this TCS is the fact that it has not been knocked out, indicating that it may
be essential to M. tuberculosis 101. This has however made it more difficult to
investigate its function during infection. In 2006 a group over expressed the MtrA RR
showing that overproduction of this protein prevented multiplication during
macrophage infection, but not in broth 102. They concluded that the ratio of
phosphorylated to unphosphorylated MtrA was vital for intra macrophage replication,
since simultaneously upregulating its HK MtrB had no effect 102.They supported this
theory by showing that MtrA binds to the promoter of a replication gene dnaA 102.
They also suggested that it may be involved in the AFB’s ability to block
phagolysome fusion. Friedland et al solved the crystal structure of MtrA and
demonstrated that it was similar to the PrrA RR and may have multiple
conformations 103.
Studies of this RR in other species may also give clues as to its function in M.
tuberculosis. A study of M. leprae cell wall associated proteins unearthed an mtrA
homologue in this species, highlighting its importance for intracellular growth 104. In
M. avium the mtrB locus has been knocked out using transposon mutagenesis,
resulting in a strain with attenuated virulence which cannot make the red white
switch on Congo red agar 105. In this species the TCS is required for the control of
cell surface proteins and regulates permeability and composition of cell wall
components 105. In a more distantly related species Cornebacterium glutamicum an
MtrA knockout showed an effect on antibiotic susceptibility and osmo-regulation of
the cell 106. In this species the mtrA gene is probably involved in peptidoglycan
metabolism and osmotic protection 106. Interestingly, a similar TCS the AmrA/ AmkA
Chapter One: General Introduction
35
system of Amycolatopsis mediterranei has been knocked out showing a 20%
decrease in RIF production by the organism 107.
MtrB/ MtrA is well conserved in other mycobacterial species including M. smegmatis,
which makes this system easy to manipulate for this study. Since MtrB/ MtrA
appears to be induced during macrophage entry and has not yet been knocked out,
this system shows great potential as a drug target in M. tuberculosis.
1.4.2 SenX3/ RegX3
The SenX3/ RegX3 TCS has been well characterised in M. tuberculosis 135-137. It is
involved in the phosphate transport system and induces the M.smegmatis phoA
gene, whose protein product is an alkaline phosphatase required for transport of
inorganic phosphate into the cell 108. It is proposed that this system controls the
regulation of around 50 genes as well as the regX3 gene product 109. This positive
autoregulation of the RR is important in TCS for signal amplification 110. The phoA
gene is present in M. smegmatis and E. coli but not M. tuberculosis 111. This gene is
involved in inorganic phosphate transport in E. coli, a mechanism which has been
well characterised in this species 135, 139, 140. PhoA is induced by SenX3/ RegX3 in M.
smegmatis and by PhoP/ PhoR in E.coli in a phosphate dependent manner 135, 139. It
functions as a cell surface associated lipoprotein which liberates inorganic
phosphate from macromolecules 111.
The phosphate specific transporter PST and phosphate intake transporter PIT are
responsible for maintaining cellular levels of inorganic phosphate 111. The PST
proteins act as a sensor of phosphate concentration, keeping RegX3 in an
unphosphorylated state 108. When phosphate is limited the PST complex causes
Chapter One: General Introduction
36
dimerization of the SenX3 HK, which activates the RegX3 RR to induce phoA and
other genes required for phosphate production 108.
To summarise, this TCS is implicated in the phosphate transport system, its
expression is increased during early macrophage infection 112 and its knockout
displays attenuation of growth in a mouse and macrophage model. This suggests
that this TCS may be an important virulence factor 109. Specific sequence differences
between virulent and avirulent strains of the M. tuberculosis complex species have
been shown in the sequences of this TCS, indicating that virulence phenotypes may
be affected by SenX3/ RegX3 113.
1.4.3 DevS/ DevR
The DevS/ DevR system is responsible for inducing the dormancy response of M.
tuberculosis during hypoxia and nitric oxide stress 71, 72, 142-144 making it a valuable
target in preventing latency 114. Unlike most other TCS of M. tuberculosis, the DevS/
DevR system is part of the NarS/ NarL family 89. The DevS HK contains two GAF
domains in its sensing core named GAF A and GAF B 115. It has been proposed that
GAF A binds to heme which changes from an oxygenated to a deoxygenated state
during oxygen starvation, this results in DevR activation and transcription of a
number of dormancy related genes 115. This assumption was based on the
observation that cyanide, which binds with heme, hinders the dormancy response in
M. tuberculosis usually induced by nitric oxide stress and oxygen starvation. The
importance of this TCS during hypoxic stress has been illustrated by its knockout
mutant, which cannot survive oxygen starvation and is more sensitive to heat shock
62. As previously mentioned, the granumloma formed in the human lung during M.
Chapter One: General Introduction
37
tuberculosis infection leaves the AFB in a hypoxic environment 116. It is proposed
that this oxygen based sensor could be a switch from aerobic to anaerobic
metabolism.
A mouse model has shown knockouts of this system to be hyper virulent 112 while
rabbit and guinea pig models show it is required for persistence 117. Converse et al
117 showed marked differences in results depending on the model host used.
Considering the different pathology shown in different host organisms, it is possible
the DevS/ DevR system is required to shut down active metabolism and therefore
the knockout appears hyper virulent in mice because this host does not naturally
show latency.
During the M. tuberculosis dormancy period a number of genes required for active
metabolism are repressed, while stress response genes, including hspX, are induced
47, 144, 148. The hspX gene product is an alpha crystallin antigen which may play a role
in stabilizing proteins during persistence 63. As well as hspX, DevS/ DevR induces 3
universal stress proteins (UspL,M and N) and a nitroreductase (Rv3131) 118.
The signal transduction mechanisms of M. tuberculosis undoubtedly have an overall
effect on its virulence and pathogenesis, in particular the switch from active to latent
infection. It is in this light that these systems are viewed as excellent potential drug
targets in mycobacteria and other pathogenic prokaryotes. Consequently, a number
of groups have attempted to develop inhibitors to these signalling systems.
Chapter One: General Introduction
38
1.4.4 Two Component Systems as Drug Targets
The search for new anti-TB drugs is a particularly important component of the STOP
TB strategy, given the rising threat of MDR and XDR-TB. Using growth inhibition
assays to discover anti-tubercular agents from a vast array of compounds by
measuring the effect on the whole cell, may lead to the discovery of effective agents
against the pathogen. On the other hand, a more targeted approach to specific
components of the cells dormancy program is more likely to yield an agent with a
detrimental effect on M. tuberculosis during a latent TB infection.
Since the discovery of TCS and their inferences to virulence and persistence, they
have been labelled as critical targets in pathogenic bacteria 98. Generally speaking
signal transduction mechanisms allow bacteria to persist and cause disease in a
human host; TCSs in particular are of great interest for four main reasons 98:
Their ubiquity among prokaryote organisms and selective presence in higher
eukaryotes, indicates a TCS inhibitor would be less likely to exert a negative effect
on a human host
Principle active sites in TCS display a high level of homology, so a TCSi could
potentially act on a number of TCS across a broad spectrum of bacteria
At least four TCS are essential to their host organisms
TCS are often used by prokaryotes to regulate the expression of virulence
factors
More specifically, in terms of M. tuberculosis, current drug targets act on processes
such as cell wall and protein assembly, which are only effective in the case of an
active TB infection. In targeting the mechanisms M. tuberculosis employs to sustain

Chapter One: General Introduction
39
an ongoing latent infection, problems encountered with many of the current anti-TB
agents such as toxicity, lengthy treatment duration and the emergence of resistant
strains could be prevented 114.
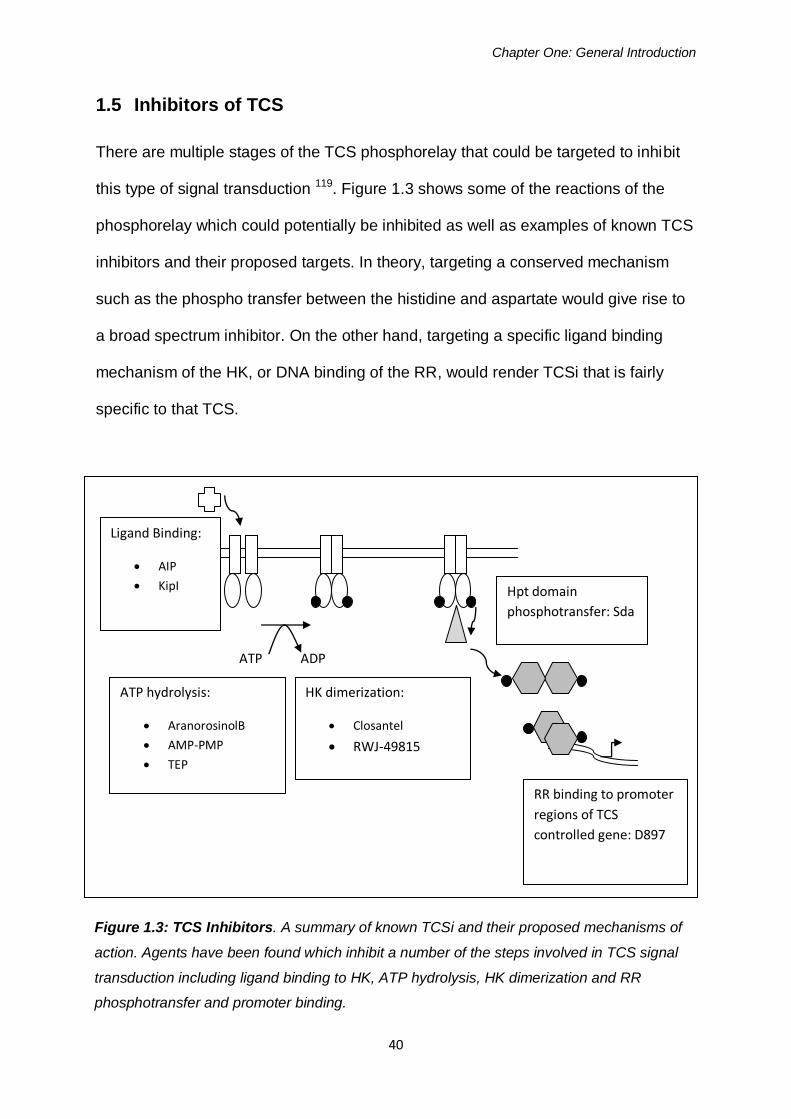
Chapter One: General Introduction
40
1.5 Inhibitors of TCS
There are multiple stages of the TCS phosphorelay that could be targeted to inhibit
this type of signal transduction 119. Figure 1.3 shows some of the reactions of the
phosphorelay which could potentially be inhibited as well as examples of known TCS
inhibitors and their proposed targets. In theory, targeting a conserved mechanism
such as the phospho transfer between the histidine and aspartate would give rise to
a broad spectrum inhibitor. On the other hand, targeting a specific ligand binding
mechanism of the HK, or DNA binding of the RR, would render TCSi that is fairly
specific to that TCS.
The specificity of a TCS inhibitor would depend on which part of the relay is targeted.
Interfering with conserved domains involved in general phosphotransfer would give
Figure 1.3: TCS Inhibitors. A summary of known TCSi and their proposed mechanisms of
action. Agents have been found which inhibit a number of the steps involved in TCS signal
transduction including ligand binding to HK, ATP hydrolysis, HK dimerization and RR
phosphotransfer and promoter binding.
ATP hydrolysis:
AranorosinolB
AMP-PMP
TEP
Hpt domain
phosphotransfer: Sda
RR binding to promoter
regions of TCS
controlled gene: D897
ATP ADP
HK dimerization:
Closantel
RWJ-49815
Ligand Binding:
AIP
KipI
Chapter One: General Introduction
41
To date there have been a number of compounds introduced to the field which act
on specific components of the signal transduction machinery, but none that do so in
a way that affects signalling independently of other prokaryote and eukaryote cellular
processes 98.
1.5.1 Inhibition of the Histidine Kinase
Compounds which affect ligand binding to HK sensor domains have been developed
for specific targets 98. These are usually derivatives of naturally occurring ligands
which are modified at specific residues in order to compete with naturally occurring
ligands of the TCS.
Streptomyces produce autoinducing peptide (AIP) to induce virulence factor Agr
required for quorum sensing 119. When the population reaches a threshold density,
secretion of AIP binds the HK of the ArgC/ ArgA TCS effectively inducing virulence
genes and repressing surface proteins 119. Replacing the sulphur of the thiolactone
ring structure of AIP with O or N provides a competitive inhibitor of their quorum
sensing mechanism 119.
KipI is a protein inhibitor of B. subtilis sporulation TCS KinA/SpoOA 120. This protein
inhibits the autophosphorylation of KinA, but not the phospho transfer step. Another
gene in its operon, kipA, counters its activity 120.
A number of chemicals have been found to inhibit the ATP to ADP hydrolysis shown
in figure 1.4. These can act in either a competitive or non competitive fashion. AMP-
PNP (adenosine monophosphate p-Nitrophenol), TEP (triethyl phosphate) and
aranorosinol B for instance competitively inhibit this hydrolysis reaction while cis
Chapter One: General Introduction
42
unsaturated fatty acids such as oleic and palmitoleic act in a non competitive fashion
98. While they effectively inhibit this signal transduction process, they would clearly
affect a number of other processes in both the host and pathogen.
Most TCS inhibitors to date interfere with the dimerization domain of a HK, exposing
hydrophobic amino acids resulting in an aggregation of HKs at the cell membrane
121. Closantel and RWJ-49815 act in this way, denaturing the dimer of KinA by
interfering with its 4 helix bundle between the sensor and effecter domains 122.
Without suitable dimerization, signal transduction cannot be relayed to the RR.
These compounds have the same effect in a sensor kinase in E. coli reflecting a
broad spectrum of activity 96. Unfortunately, many of these HK dimerization inhibitors
also have an effect on membrane intergrity in both bacterial and mammalian cells
and thus have not been developed as antibiotics.
The Sda protein inhibits the sporulation system KinA/KinB through binding of the
histidine phosphotranfer domain (HPt) of KinB 121. This compound binds with the
alpha helices, not the conserved H box or catalytic domain, and acts as a molecular
barricade, hindering communication between KinB and KinA 121.
1.5.2 Inhibition of Response Regulator
A less common mechanism of action is the inhibition of the RR activity. A modified
protein can alter a HK/ RR interaction via competition for their binding site.
Modifications to the DrrA peptide of the HpkA/DrrA system in Thermotoga maritima
caused competitive binding for HpkA resulting in a loss of dimer formation 123. A
compound named D897 is able to inhibit DNA binding of RR to the promoter regions
of induced genes by preventing the dimerization of RR required for DNA binding 98.
Chapter One: General Introduction
43
Although natural and synthetic compounds have been shown to inhibit stages of this
process, research in the field has yet to provide a compound which affects these
processes exclusively. A major shortcoming of many TCS inhibitors described is an
adverse effect on membrane integrity of both bacterial and human cell membranes
98. A study of 24 TCS inhibitors showed that 23/24 had adverse effects on membrane
integrity. This suggests that their activity may be the result of another mechanism
altogether, such as membrane interference or macromolecule synthesis 124.
Unfortunately the only compound free of this defect had a relatively high minimum
inhibitory concentration (MIC) 124. Other TCS inhibitors exhibit severe toxic side
effects, closantel for example adversely affects energy metabolism in the
mitochondria 125.
That being said, the organism Staphylococcus epidermis causes major problems
with its ability to form biofilms on medical instruments 126. It has been suggested that
an inhibitor of the YycG HK of this organism, required for biofilm formation, could
easily be used as a sterilization agent on medical equipment if it were cost effective
126. Another suggestion is the use of non toxic HK inhibitors in combination with other
drugs to improve a therapeutic outcome. Isothiazolone and imidazolin salts were the
first TCS inhibitors to be discovered 127. These aromatic structures showed activity
against the AlgR2/ AlgR1 system, an important virulence factor of P. aeroginosa
which causes major problems in cystic fibrosis patients 127. These could be used to
improve the therapeutic outcome of patients with cystic fibrosis 98 even though they
do no inhibit the organism outright. Despite work by several groups to discover and
develop TCS inhibitors, none been made commercially available as antibiotics or
bacteriostatic agents in a medical context. The aim of this study was to develop a
way in which one can screen for novel TCSi, which inhibit mycobacterial signal
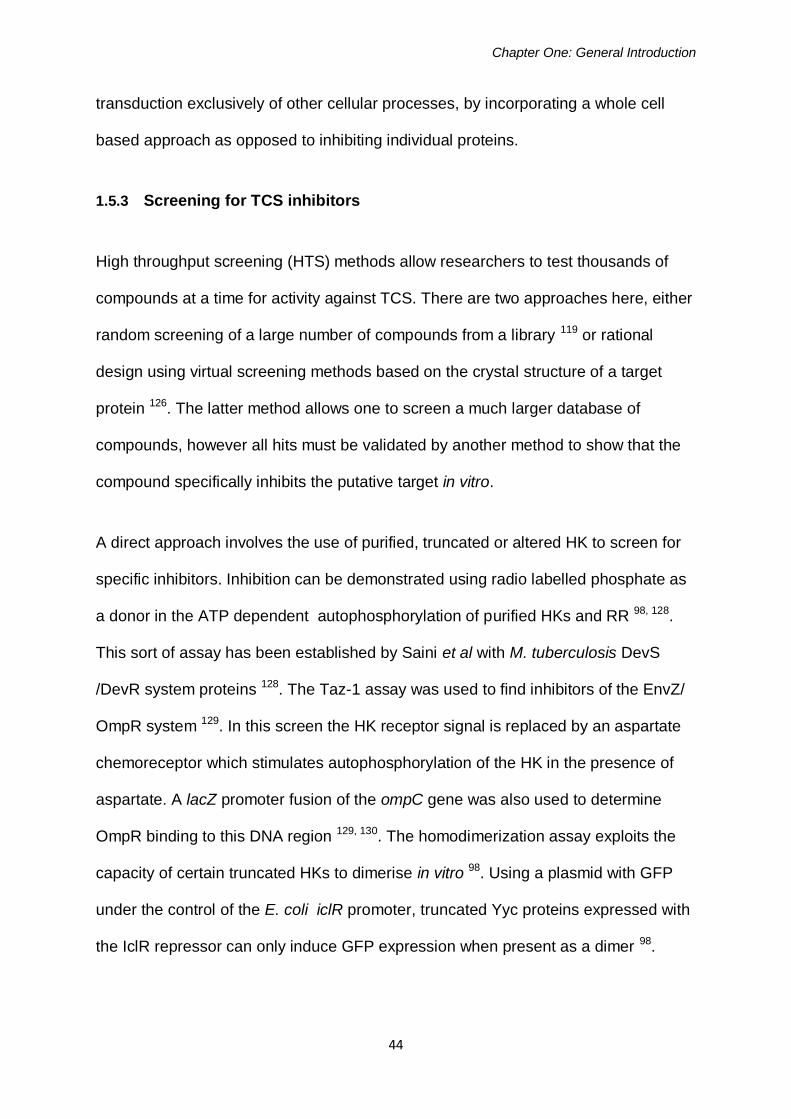
Chapter One: General Introduction
44
transduction exclusively of other cellular processes, by incorporating a whole cell
based approach as opposed to inhibiting individual proteins.
1.5.3 Screening for TCS inhibitors
High throughput screening (HTS) methods allow researchers to test thousands of
compounds at a time for activity against TCS. There are two approaches here, either
random screening of a large number of compounds from a library 119 or rational
design using virtual screening methods based on the crystal structure of a target
protein 126. The latter method allows one to screen a much larger database of
compounds, however all hits must be validated by another method to show that the
compound specifically inhibits the putative target in vitro.
A direct approach involves the use of purified, truncated or altered HK to screen for
specific inhibitors. Inhibition can be demonstrated using radio labelled phosphate as
a donor in the ATP dependent autophosphorylation of purified HKs and RR 98, 128.
This sort of assay has been established by Saini et al with M. tuberculosis DevS
/DevR system proteins 128. The Taz-1 assay was used to find inhibitors of the EnvZ/
OmpR system 129. In this screen the HK receptor signal is replaced by an aspartate
chemoreceptor which stimulates autophosphorylation of the HK in the presence of
aspartate. A lacZ promoter fusion of the ompC gene was also used to determine
OmpR binding to this DNA region 129, 130. The homodimerization assay exploits the
capacity of certain truncated HKs to dimerise in vitro 98. Using a plasmid with GFP
under the control of the E. coli iclR promoter, truncated Yyc proteins expressed with
the IclR repressor can only induce GFP expression when present as a dimer 98.
Chapter One: General Introduction
45
These sophisticated screening methods are limited in that they deal with altered
forms of proteins which do not naturally occur in the cell. Using the native forms of
these proteins in a whole cell based assay may deliver TCS inhibitors which
represent a higher level of efficiency in a whole cell model.
Whole cell based methods have a number of advantages over isolated protein
methods . For one thing, TCS inhibitors found using protein based methods may be
potent inhibitors of signal transduction, but their ability to permeate the cell
membrane is not taken into account. What is more, other metabolic activities of the
cell are accounted for, such as proteins and enzymes which could decrease the
activity of these compounds. As previously mentioned, all of the current known TCSi
have failed in that they cause adverse affects on bacterial and mammalian cell walls.
Many bacterial species also have efflux pumps which could potentially remove these
inhibitors from the cell before it reaches its target.
Another consideration is the specificity of the target. Using isolated protein methods
confines the researcher to finding inhibitors of a specific molecule or reaction in the
chain of events involved in signal transduction. Using a whole cell based method,
which measures the end result of the signalling mechanism, i.e. the up-regulation of
a particular gene under the control of that system, increases the likelihood of an
inhibitor of any part of this phosphorelay being picked up in the screen.
In 1993 Roychoudhury et al discovered the first TCSi by screening around 25,000
synthetic compounds using a whole cell xylE reporter system assay 127. Inhibition of
the RR binding activity to the algD promoter was demonstrated in 15 compounds
using this colourmetric assay 127. Differential growth assays are another method that

Chapter One: General Introduction
46
can be applied to whole cell screening. Temperature sensitive mutants of the YycG
HK showed hypersensitivity to 11 compounds in a screen of 4000 acetone extracts
131. These hits were further characterised, leading to the detection of aranorosinol
B’s ability to inhibit the autophosphorylation of YycG in S. aureus and B. subtilis 131.
Measuring expression of a TCS target gene is a valuable method because it
accounts for everything that is going on in the cell at once. These methods show that
a compound is capable of reaching its target and that gene expression is being
inhibited in spite of whatever else is going on in the cell. However, it is an indirect
method of detecting TCS inhibition. Usually validation either at a protein level or by
measuring the expression of an unrelated gene is required in order to show that a
compound does not simply have a global effect on gene expression. It is also
important to consider any implications that reporter systems may have on both the
cell and compounds in the screen and vice versa.
In this study a GFP reporter was used to measure the expression of promoters under
the control of mycobacterial TCS to evaluate conditions which induce these systems
and screen for TCS inhibitors using available drug libraries.
1.5.4 Methods used in this Study
The aim of this study was to apply a promoter reporter method to demonstrate
appropriate conditions under which selected TCS genes are induced, so they can be
used in a screen for two component system inhibitors. GFP, isolated from Aequorea
victoria, has been used to monitor gene expression since 1994 132, 133. It is an ideal
reporter as it does not require substrate activation 133 and numerous enhanced
variants of the original wildtype GFP exist for specific purposes 134-136. GFP mut2 will

Chapter One: General Introduction
47
be used to scrutinise the expression of TCS-regulated genes, and examine changes
that occur to these expression profiles as a result of exposure to compound libraries.
The constitutively expressed hsp60 promoter will be included to verify that a shift in
GFP fluorescence is the result of some mechanism other than a reduction in global
gene expression on the cell. The model organism M. smegmatis will be used so that
these assays can be carried out to test as many compounds as possible in a high
throughput manner as it grows more rapidly and can be safely manipulated in a PC2
laboratory. The resultant experimental procedure could lead to further studies of the
more pathologically relevant M. bovis BCG once the assay is optimised for M.
smegmatis.
Chapter One: General Introduction
48
1.6 Aims
The overall objective of this research was to design a screen which identifies
inhibitors of mycobacterial TCS related to dormancy and intra macrophage survival.
This required four main objectives to be carried out:
1. Create a list of suitable M. tuberculosis and M. smegmatis TCS dependent
genes and identify their promoter sequences.
2. Clone these promoter sequences and an optimised GFP reporter gene into a
plasmid which can be electroporated into M. smegmatis.
3. Demonstrate conditions under which the greatest expression of these
promoters is found.
4. Develop a bioassay to screen compounds for mycobacterial TCS inhibitors
based on the expression of these TCS regulated genes.

Chapter Two: Materials and Methods
49
CHAPTER TWO:
Materials and Methods
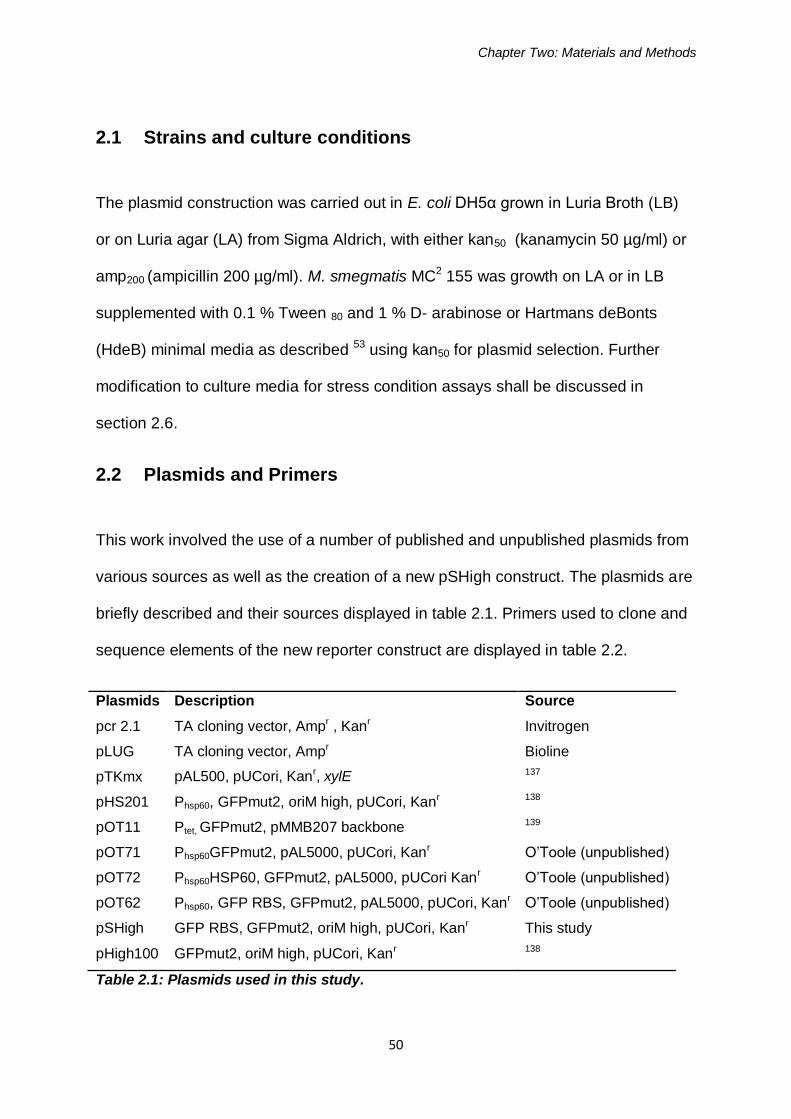
Chapter Two: Materials and Methods
50
2.1 Strains and culture conditions
The plasmid construction was carried out in E. coli DH5α grown in Luria Broth (LB)
or on Luria agar (LA) from Sigma Aldrich, with either kan50 (kanamycin 50 µg/ml) or
amp200 (ampicillin 200 µg/ml). M. smegmatis MC2 155 was growth on LA or in LB
supplemented with 0.1 % Tween 80 and 1 % D- arabinose or Hartmans deBonts
(HdeB) minimal media as described 53 using kan50 for plasmid selection. Further
modification to culture media for stress condition assays shall be discussed in
section 2.6.
2.2 Plasmids and Primers
This work involved the use of a number of published and unpublished plasmids from
various sources as well as the creation of a new pSHigh construct. The plasmids are
briefly described and their sources displayed in table 2.1. Primers used to clone and
sequence elements of the new reporter construct are displayed in table 2.2.
Plasmids
pcr 2.1
pLUG
pTKmx
pHS201
pOT11
pOT71
pOT72
pOT62
pSHigh
pHigh100
Description
TA cloning vector, Ampr , Kanr
TA cloning vector, Ampr
pAL500, pUCori, Kanr, xylE
Phsp60, GFPmut2, oriM high, pUCori, Kanr
Ptet, GFPmut2, pMMB207 backbone
Phsp60GFPmut2, pAL5000, pUCori, Kanr
Phsp60HSP60, GFPmut2, pAL5000, pUCori Kanr
Phsp60, GFP RBS, GFPmut2, pAL5000, pUCori, Kanr
GFP RBS, GFPmut2, oriM high, pUCori, Kanr
GFPmut2, oriM high, pUCori, Kanr
Source
Invitrogen
Bioline
137
138
139
O’Toole (unpublished)
O’Toole (unpublished)
O’Toole (unpublished)
This study
138
Table 2.1: Plasmids used in this study.
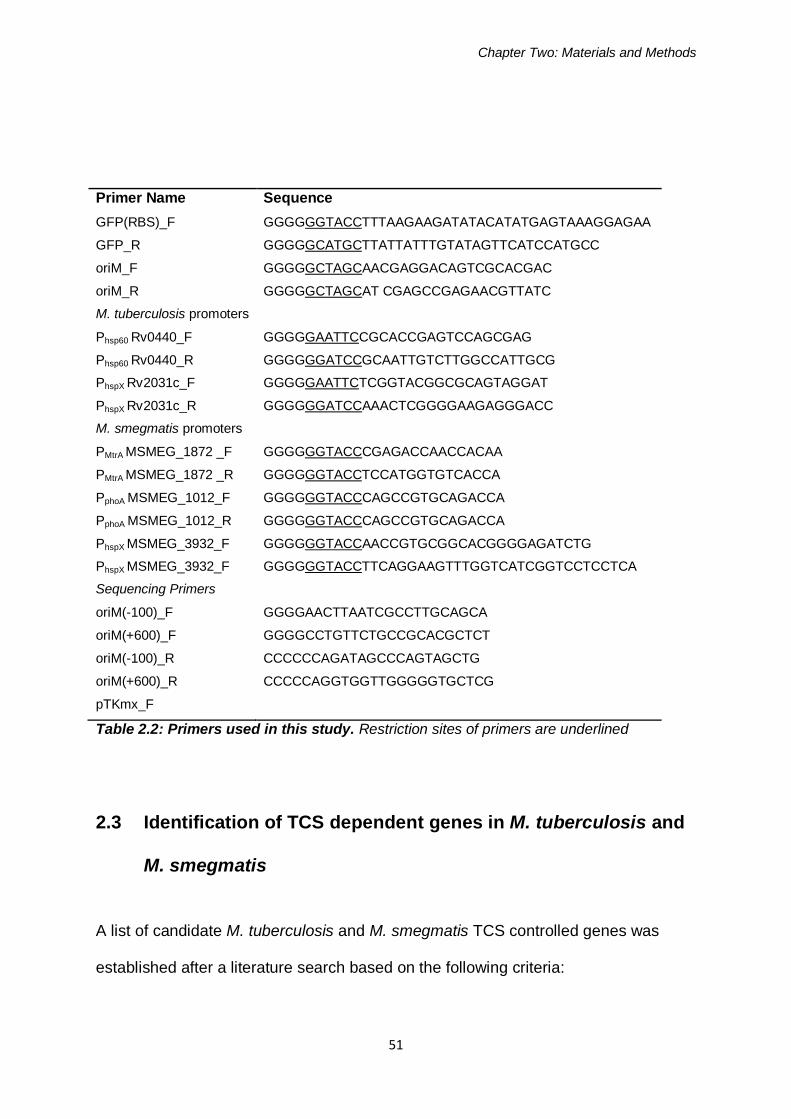
Chapter Two: Materials and Methods
51
Primer Name
GFP(RBS)_F
GFP_R
oriM_F
oriM_R
M. tuberculosis promoters
Phsp60 Rv0440_F
Phsp60 Rv0440_R
PhspX Rv2031c_F
PhspX Rv2031c_R
M. smegmatis promoters
PMtrA MSMEG_1872 _F
PMtrA MSMEG_1872 _R
PphoA MSMEG_1012_F
PphoA MSMEG_1012_R
PhspX MSMEG_3932_F
PhspX MSMEG_3932_F
Sequencing Primers
oriM(-100)_F
oriM(+600)_F
oriM(-100)_R
oriM(+600)_R
pTKmx_F
Sequence
GGGGGGTACCTTTAAGAAGATATACATATGAGTAAAGGAGAA
GGGGGCATGCTTATTATTTGTATAGTTCATCCATGCC
GGGGGCTAGCAACGAGGACAGTCGCACGAC
GGGGGCTAGCAT CGAGCCGAGAACGTTATC
GGGGGAATTCCGCACCGAGTCCAGCGAG
GGGGGGATCCGCAATTGTCTTGGCCATTGCG
GGGGGAATTCTCGGTACGGCGCAGTAGGAT
GGGGGGATCCAAACTCGGGGAAGAGGGACC
GGGGGGTACCCGAGACCAACCACAA
GGGGGGTACCTCCATGGTGTCACCA
GGGGGGTACCCAGCCGTGCAGACCA
GGGGGGTACCCAGCCGTGCAGACCA
GGGGGGTACCAACCGTGCGGCACGGGGAGATCTG
GGGGGGTACCTTCAGGAAGTTTGGTCATCGGTCCTCCTCA
GGGGAACTTAATCGCCTTGCAGCA
GGGGCCTGTTCTGCCGCACGCTCT
CCCCCCAGATAGCCCAGTAGCTG
CCCCCAGGTGGTTGGGGGTGCTCG
Table 2.2: Primers used in this study. Restriction sites of primers are underlined
2.3 Identification of TCS dependent genes in M. tuberculosis and
M. smegmatis
A list of candidate M. tuberculosis and M. smegmatis TCS controlled genes was
established after a literature search based on the following criteria:
Chapter Two: Materials and Methods
52
1. The candidate must contain a non-coding region upstream of the gene or
have its promoter region identified, preferably with a gel mobility shift assay
consistent with the ability to bind directly with a RR.
2. Factors or conditions inducing expression of the gene should be postulated or
proven.
3. A high fold induction of gene expression upon stimulation, or a significant
decrease in expression of that gene displayed in the TCS mutant.
Sequences of candidate genes and their organisation within an operon were
obtained from www.genome.jp. A promoter region of approximately 600 base pairs
was selected directly upstream of each candidate gene for primer design.
2.4 Plasmid Manipulation
Cloning procedures were carried out with T4 ligase from Bioline and restriction
enzymes and their respective buffer solutions from New England Biolabs (NEB).
Polymerase chain reactions (PCR) were carried out with Taq polymerases from
either Bioline or Invitrogen limited.
2.4.1 Amplification of Promoters from Genomic DNA
Genomic DNA (gDNA) from heat treated M. tuberculosis H37Rv was provided by
AgResearch (Upper Hutt). M. smegmatis gDNA was prepared by standard genomic
preparation as described by Sambrook 140. Primers were designed to amplify around
600 base pairs of a promoter region upstream of each gene of interest, including at
least the start codon of each gene. Primers contained EcoRI and BamHI restriction
sites for cloning into low copy number pOT constructs, or KpnI for cloning into
Chapter Two: Materials and Methods
53
pSHigh constructs. In addition, the highly conserved promoter of the hsp60 gene
(Rv0440) was cloned as a constitutively expressed positive control. Promoters were
amplified from gDNA using the high fidelity polymerase Platinum Taq (Invitrogen
Ltd.) according to manufacturer’s instructions with an Eppendorf thermocycler.
Appendix 1 displays a summary of all PCR conditions used in this study. PCR
products were visualised on a 1% agarose gel to check they were the correct size,
before the PCR products were isolated using a clean and concentrate kit from Zymo
Ltd.
2.4.2 Ligation of promoters into Cloning Vectors and heat shock
Transformation into E.coli
Purified PCR products were ligated into either pCR2.1 of pLUG TA cloning vectors
using T4 ligase by incubating promoter, vector, ligase enzyme and 1 x ligase buffer
for at least 4 hours at 16 oC. A summary of ligation reactions in this study is shown in
appendix 2.
Ligation reactions were then transformed into calcium competent E. coli DH5α by
heat shock transformation. For notes on preparation of calcium competent DH5α see
appendix 4. The optimal ratio of cells to ligation product is 10:1 so for a 10 µL ligation
reaction, aliquots of 100 µL of DH5α cells were used. Cells were first thawed on ice
for 5 minutes before adding the ligation product. Following a 20 minute incubation
period on ice, cells were heat shocked at 42 oC in a heat block for 2 minutes and
then returned to ice for 5 minutes. The cells were then recovered at 37 oC without
agitation, for at least 45 minutes in 600 µL of LB, without antibiotics, to allow
expression of the antibiotic cassettes contained on the plasmid. Following recovery,
Chapter Two: Materials and Methods
54
cells were centrifuged for 30 seconds at 12000 rpm and the supernatant removed to
leave 100 µL of cells which were re-suspending by gentle pipetting.
For blue white colony selection, cells were spread on Luria agar with Isopropyl-Beta-
d-Thiogalactopyranoside (IPTG) at 100 µg/ml, X-galactosidase (Xgal) at 40 µg/ml
and ampicillin at 200 µg/ml and incubated at 37oC overnight. At least 5 white
colonies for each ligation reaction were selected and inoculated in 3 mL overnight
cultures of LB with ampicillin (200 µg/ml). 600 µL from each culture was reserved for
a -80 oC freezer stock, made with an equal volume of 80 % glycerol to give a final
concentration of 40 % gylcerol.
2.4.3 Plasmid Isolation and Digestion
The remainder of the liquid culture was used for plasmid preparation. In this study
plasmid DNA was isolated using either alkaline lysis with phenol chloroform
extraction as described 140 or using a Zymo plasmid preparation kit according to
manufacturer’s instructions. The pellet free Zymo kit method was preferred when
plasmids were to be sequenced or electroporated, since this method gives a cleaner
plasmid product. The alkaline lysis method was used when a concentrated DNA
preparation was required, for example before removal of a fragment by restriction
digest.
The presence of the inserted promoter fragment was verified with a small amount of
the plasmid preparation by a restriction enzyme digest with EcoRI. A summary of
restriction enzyme digestions can be found in appendix 3. EcoRI sites surrounding
the cloning region of the TA vector result in a drop-out of the fragment after digestion
giving two distinct bands on a 1% agarose gel. Plasmid preparations which displayed
this fragment drop out were sequenced by the Alan Wilson Centre (AWC) in
Chapter Two: Materials and Methods
55
Palmerston North using primers M13 forward and reverse, which are present on the
TA cloning vector surrounding the insertion site.
2.4.4 Sequence Alignment
Chromatogram data were analysed for fidelity using Vector NTI software (Invitrogen).
The sequence displayed between the M13 forward and reverse primers was then
aligned with the published sequence of the candidate promoters using AlignX
software (Invitrogen). It was important that these sequences were accurate since the
exact location of response regulator binding site on the promoter was not always
known. In some cases this process was repeated until the sequence of each
promoter was identical to the published genome. Clones with correct promoter
sequences were identified and used to construct GFP reporter plasmids.
2.4.5 Low Copy Number Reporter Constructs
TCS regulated promoters were cloned into low copy number mycobacterial plasmid
pOT71 with EcoRI and BamHI restriction enzymes sites. The reporter plasmids were
developed based on pTKmx plasmids from Kenney et al 137. These contain a
kanamycin resistance cassette, mycobacterial origin of replication pAL5000, E. coli
origin of replication pUCori (also known as oriE) and gfpmut2 cloned from the pKEN
plasmid created by Cormack et al 136 with a multiple cloning site in front of the GFP.
Plasmid DNA of the pOT71 plasmid was digested with EcoRI and BamHI with 1 x
BamHI buffer overnight at 37 oC. Around 3 µL of this reaction was visualised on 1 %
agarose gel to ensure a single band was obtained. Restriction enzymes were
removed by column purification using a Zymo clean and concentrator kit.
Chapter Two: Materials and Methods
56
Sequenced promoters were concurrently digested out of their cloning vectors using
the same restriction enzymes. Restriction enzyme reactions were run through a 1%
agarose gel to separate plasmid and promoter fragments. These were then excised
and the DNA purified using a Zymo gel extraction kit according to the manufacturer’s
instructions. To ensure DNA was not lost in this process, the DNA was visualised by
running a small amount of the sample on a 1% agarose gel.
Promoters were then inserted into pOT71 by incubation with T4 ligase and T4 ligase
buffer at 16 oC for at least 6 hours. A small amount of KpnI, which cuts between the
two cloning sites (EcoRI and BamHI), was added to the reaction to prevent
unwanted uncut pOT72 from remaining in the reaction. The ligation reaction was
then transformed into DH5α by heat shock as previously described and plated on LB
supplemented with kan50.
The primer pTKmx F1 corresponding to a region on the plasmid about 100 bp
upstream of the cloning site, was used in combination with each promoter’s reverse
primer to screen for clones with the promoter correctly inserted into the pOT71
plasmid. This was carried out by colony PCR screen, according to the
manufacturer’s guidelines for using Mastermix from Bioline, except that cells from a
single colony were used as template DNA, and added using a toothpick or pipette
tip. The same tip was then added to a 3 mL falcon tube containing LB and
kanamycin for an overnight incubation at 37 oC.
The 3 mL overnight cultures for all positive clones were used to create freezer stocks
and plasmid preparations of the pOT71 + promoter constructs. These were then
Chapter Two: Materials and Methods
57
sequenced using the pTKmx F primer to ensure promoters were correctly inserted in
frame with GFP in the plasmid.
2.4.6 High Copy Number Reporter Constructs
While this work with the pOT71 plasmids was being carried out, Bourn et al
published a paper on a high copy number plasmid for mycobacteria involving the use
of a modified pAL5000 origin of replication which will henceforth be known as oriM
high 138. They showed a seven fold increase in plasmid copy number compared with
the original pAL5000 origin of replication. A modification of 3 base pairs, causing an
alanine deletion, lead to a significant increase in gfp expression on their pHS201
plasmid 138. The authors kindly gifted us this plasmid to use in our work.
Unfortunately their plasmid contained an EcoRI site in front of the GFP, which was
also found in their modified oriM so it was impossible to clone promoters directly into
this plasmid. A new plasmid was constructed using their modified high copy number
origin of replication named pSHigh.
Initial experiments involving the pOT plasmids indicated that pOT62, containing a
ribosomal binding site (RBS) upstream of the gfp gene, displayed a higher
fluorescent intensity than the pOT71 plasmids. In order to include this RBS
sequence in front of the GFP in the new plasmid pSHigh, a forward primer was
designed to include this sequence in front of the GFP start codon. We reasoned that
having a terminator upstream of the GFP would also improve the vector by avoiding
leakage and unwanted GFP expression. The pTKmx plasmid contains a terminator
site upstream of the multiple cloning site, so this plasmid was used to create the new
high copy number vector. In summary, three improvements were made to optimise
the potential of this plasmid as a reporter of gene expression:
Chapter Two: Materials and Methods
58
High copy number origin of replication (oriM high from pHS201).
Ribosomal binding site for GFP (added to the primer sequence).
Terminator site upstream of cloning site (trp from pTkmx).
GFP RBS insertion
The gfpmut2 gene, as well as its RBS, was cloned from pOT11 with GFP_RBS_F
and GFP_R primers by PCR using a high fidelity polymerase, Platinum Taq
(Invitrogen). As described for the TCS controlled promoters in section 2.3, this gene
was cloned into a TA vector, sequenced and then excised with KpnI and SphI. The
pTKmx plasmid was also digested with these enzymes to replace the xylE
component of this plasmid with the gfpmut2 by ligation and heat shock
transformation onto LB agar with kan50. Screening colonies of DH5α during this step
was facilitated by briefly placing the plate on a UV light box and selecting brighter
colonies for the PCR screen, which increased the number of positive clones
containing the pTKMx_F and Gfp_R primed amplicon. Correct orientation was
verified by sequencing with pTKmx F primer.
pAL5000/ oriM high switch
The original origin of replication was removed from pTKmx by digestion with NheI
and separated from the rest of the plasmid by gel extraction. The high copy oriM high
was amplified from Bourn’s pHS201 plasmid using primers oriM_F and oriM_R with
a modified PCR protocol for amplification of long fragments (see Appendix 1).
The PCR product was visualised on a 1 % agarose gel and then purified using a
clean and concentrator column to remove PCR enzymes before ligation into pTKmx
–pAL5000. Ligation products were transformed by heat shock into DH5α and
Chapter Two: Materials and Methods
59
screened using oriM-100_F and oriM-100_R primers, which are located 100 bp
upstream and downstream of the insertion site. PCR products were visualised on 1%
agarose and positive clones were sequenced by AWC with the oriM -100 primer set
to make the plasmid pTkmx_oriM.
Ligation of Promoters
Promoters were amplified from gDNA with re designed oligonucleotides containing
KpnI sites on both forward and reverse primers. These were ligated and cloned into
either pLUG or pCR2.1 TA cloning vectors, sequenced and cut out using KpnI.
Ligations with one restriction site
A number of steps were taken to improve the efficiency of these ligations
A much higher concentration of promoter DNA was obtained by preparation
with alkaline lysis instead of using the pellet free plasmid prep kit.
During gel extraction as much of the unstained agarose (containing no DNA)
was removed before the sample was melted in the ADB buffer provided in the
kit, to improve the DNA yield.
The pSHigh plasmid was incubated with KpnI for at least 15 hours and then
run on 0.8% agarose to visualise the different band size in cut and uncut DNA
and separate the two.
KpnI cut pSHigh was extracted from the agarose gel and then incubated with
calf intestinal phosphatase (CIP) at 37 oC for 30 minutes; CIP was removed
from the sample by column purification before ligation.
Chapter Two: Materials and Methods
60
A pre-ligation heat step involving incubation of plasmid and insert at 65 oC for
ten minutes to break weak bonds between DNA fragments which may have
formed dimers.
A negative control containing SDW instead of the promoter DNA was
included. The number of colonies on the negative control plate, containing cut
plasmid and SDW rather than insertion fragment, gives an indication of the
efficiency of the ligation.
2.5 Electroporation of constructs into M. smegmatis
Reporter constructs were transformed into M. smegmatis mc2155 by electroporation
with a Biorad gene pulser. Plasmid preparations were desalted by column
purification and quantified by gel electrophoresis because unclean plasmid
preparations result in the electroporator arcing. The method for preparation of
electro-competent M. smegmatis is summarised in appendix 5. Competent cells
were thawed on ice for 5 minutes before 200 µL of cold 10% glycerol was added to
each 100 µL aliquot. Between 7 and 10 µL of DNA was added to the cells and
glycerol, this solution was mixed by gentle pipetting and moved to a cold
electroporation cuvette. Cells and DNA were then stored on ice for at least 2 hours
before electroporation. Cuvettes containing cells, DNA and glycerol were pulsed at
the following settings according to Mycobacteria Protocols 141:
Voltage 1250 V
Capacitance 25 µF
Resistance 1000 Ω
Cuvette 2 mm
Chapter Two: Materials and Methods
61
After electroporation, cells were allowed to recover overnight in 600 mL LB without
antibiotics or shaking in eppendorf tubes and then plated on LB kan50 to select for
plasmid containing clones. M. smegmatis generally takes around 3 days to appear
on plates, at which point freezer stocks and overnight cultures were made.
2.5.1 Visualisation of cells
Cells were visualised under oil immersion for fluorescence using a microscope with a
FITC (Fluorescein Isothiocyanate) filter. Around 500 µL of cells were removed from
overnight cultures and washed with equal amounts of 1 x PBS. Cells were then spun
down for 30 seconds at 12,000 rpm and 400 µL of supernatant removed before re-
suspension. Around 10µL of this concentrated cell solution was used to make slides
without staining.
Chapter Two: Materials and Methods
62
2.6 Stress Condition Assays
2.6.1 Oxygen Starvation
2.6.1.1 Oxygen Starvation Assay with low Copy number constructs
A method for growing M. smegmatis in oxygen starved conditions has been
previously described 62.
For oxygen starvation, HdeB minimal media was made from a stock of metal salts,
100x nitrates (N), Glycerol and 100x phosphates. 15 mL overnight cultures were
incubated with agitation of M. smegmatis containing three different plasmid
constructs:
pOT71 (negative control plasmid containing no promoter)
pOT71_Rv0440 (positive control promoter containing constitutively expressed
hsp60 promoter)
pOT71_Rv2031 (oxygen sensitive hspX promoter)
Overnight cultures were diluted to an OD600 of 1.0 in 50 mL HdeB minimal media
with Kan50 and grown in 250 ml flasks with airtight rubber seals 53. Triplicate cultures
were grown at 37 oC with shaking and 1 mL samples of the culture were removed
periodically with a syringe to avoid oxygen being let into the flasks. These samples
were measured for OD600 using a spectrophotometer and fluorescence using a
Wallac envision plate reader with excitation and emission set at 488 nm and 509 nm
respectively.
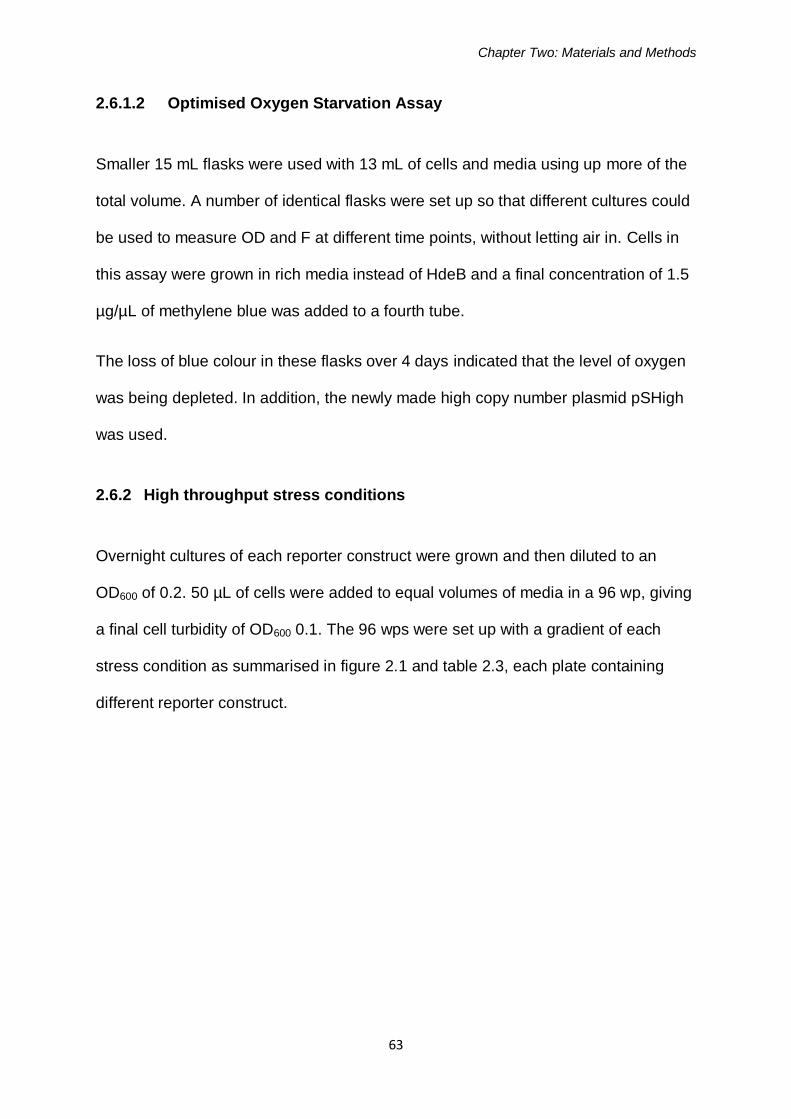
Chapter Two: Materials and Methods
63
2.6.1.2 Optimised Oxygen Starvation Assay
Smaller 15 mL flasks were used with 13 mL of cells and media using up more of the
total volume. A number of identical flasks were set up so that different cultures could
be used to measure OD and F at different time points, without letting air in. Cells in
this assay were grown in rich media instead of HdeB and a final concentration of 1.5
µg/µL of methylene blue was added to a fourth tube.
The loss of blue colour in these flasks over 4 days indicated that the level of oxygen
was being depleted. In addition, the newly made high copy number plasmid pSHigh
was used.
2.6.2 High throughput stress conditions
Overnight cultures of each reporter construct were grown and then diluted to an
OD600 of 0.2. 50 µL of cells were added to equal volumes of media in a 96 wp, giving
a final cell turbidity of OD600 0.1. The 96 wps were set up with a gradient of each
stress condition as summarised in figure 2.1 and table 2.3, each plate containing
different reporter construct.
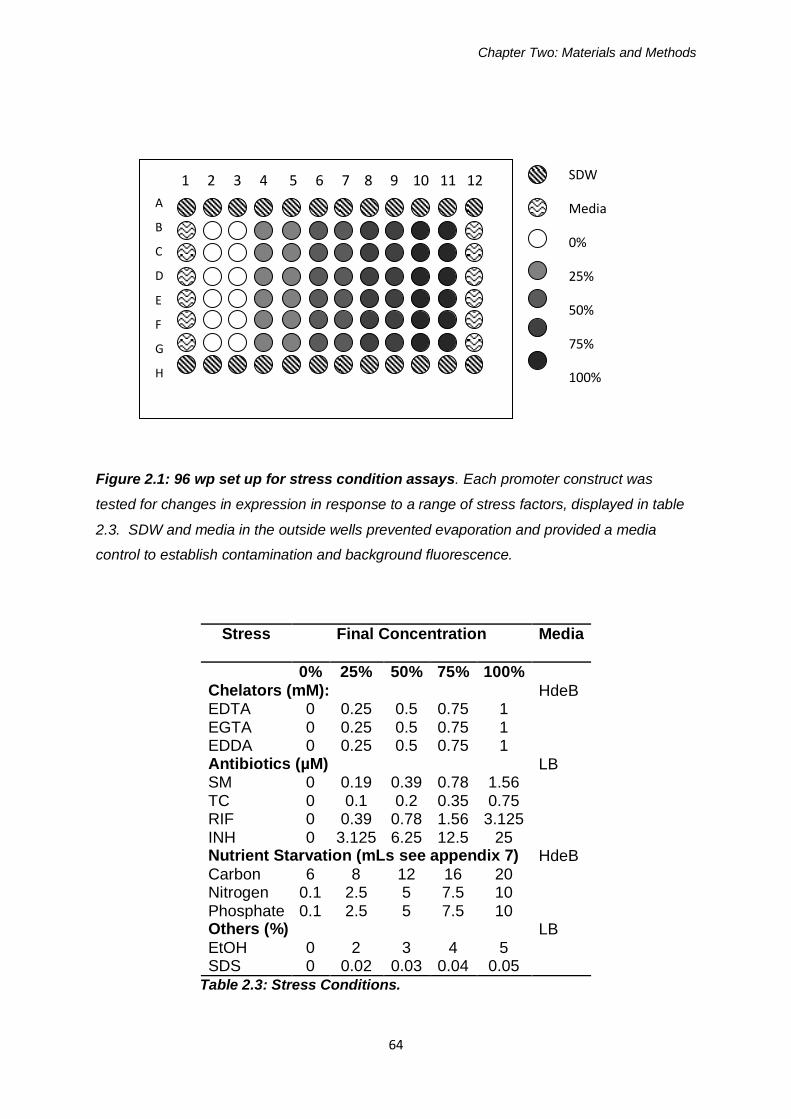
Chapter Two: Materials and Methods
64
Figure 2.1: 96 wp set up for stress condition assays. Each promoter construct was
tested for changes in expression in response to a range of stress factors, displayed in table
2.3. SDW and media in the outside wells prevented evaporation and provided a media
control to establish contamination and background fluorescence.
Stress Final Concentration
Media
0% 25% 50% 75% 100% Chelators (mM): HdeB EDTA 0 0.25 0.5 0.75 1 EGTA 0 0.25 0.5 0.75 1 EDDA 0 0.25 0.5 0.75 1 Antibiotics (µM) LB SM 0 0.19 0.39 0.78 1.56 TC 0 0.1 0.2 0.35 0.75 RIF 0 0.39 0.78 1.56 3.125 INH 0 3.125 6.25 12.5 25 Nutrient Starvation (mLs see appendix 7) HdeB Carbon 6 8 12 16 20 Nitrogen 0.1 2.5 5 7.5 10 Phosphate 0.1 2.5 5 7.5 10 Others (%) LB EtOH 0 2 3 4 5 SDS 0 0.02 0.03 0.04 0.05
Table 2.3: Stress Conditions.
A
B
C
D
E
F
G
H
1 2 3 4 5 6 7 8 9 10 11 12 SDW
Media
0%
25%
50%
75%
100%
Chapter Two: Materials and Methods
65
2.6.2.1 Nutrient starvation
15mL overnight cultures of M. smegmatis containing the three TCS controlled
promoters (phoA, hspX and MtrA) as well as the negative control pSHigh construct
were grown at 37oC with agitation in HdeB minimal media. These were then diluted
to an OD600 of 0.1 in a range of 5 different media starvation conditions (0%, 25%,
50%, 75% and 100% of each nutrient) and transferred to a 96 wp, sealed and
incubated at 37 oC with agitation for 48 hours. Plates were then removed and read
for OD and F. A typical 96 wp set up is displayed in figure 2.2. Column 1 of the 96
wp was filled with SDW to prevent evaporation in other wells and column 12 was
used for media controls.
LB was used to grow 15 mL overnight starter cultures, with the exception of the
phosphate starvation and chelator experiments for which HdeB minimal media was
used. These were then diluted to an OD600 of 0.2, transferred to 96 wps, sealed and
incubated with agitation at 37 oC for 48 hours.
2.6.2.2 Antibiotic stress
Sub-inhibitory concentrations of 4 antibiotics were tested in this manner namely, RIF,
INH, SM and tetracycline. The concentration of each antibiotic ranged from half the
minimum inhibitory concentration (MIC) of each drug in M. smegmatis so that the
antibiotics would not inhibit growth of the cells in the assay. Table 2.5 indicates final
concentrations in LB used in this experiment for each antibiotic.
Chapter Two: Materials and Methods
66
2.6.2.3 Chelators
A number of commercially available chelators from Sigma Aldrich were used in this
experiment to starve the media of cations; EDTA (Ethylene Diamine Tetraacetic
Acid), EGTA (Ethylene Glycol Tetraacetic Acid) and EDDA (Ethylene Diamine-N,N'-
Diacetic Acid ) all of which quench media of metal ions. Up to 1 mM of each chelator
was added to the media in a 96 wp before cells were added. For final concentrations
used see table 2.3.
2.6.2.4 Additional Stressors
Cells were grown to mid exponential phase in LB and then transferred to three 96
wps where they incubated for half an hour at 4 oC, 37 oC and 45 oC without shaking.
Plates were then returned to 37oC for half an hour before being read for OD and F.
Other stress conditions include low levels of SDS (0 – 0.05 %) and ethanol (0-5 %) in
the LB.
2.6.3 Validation of Expression Conditions
Initial findings from the 96 wp assays were repeated with an increased culture
volume of 50 mL in 250 mL flasks. Triplicate overnight cultures were inoculated and
diluted in the same way, then incubated with agitation at 37oC for 48 hours before
OD and F were measured.
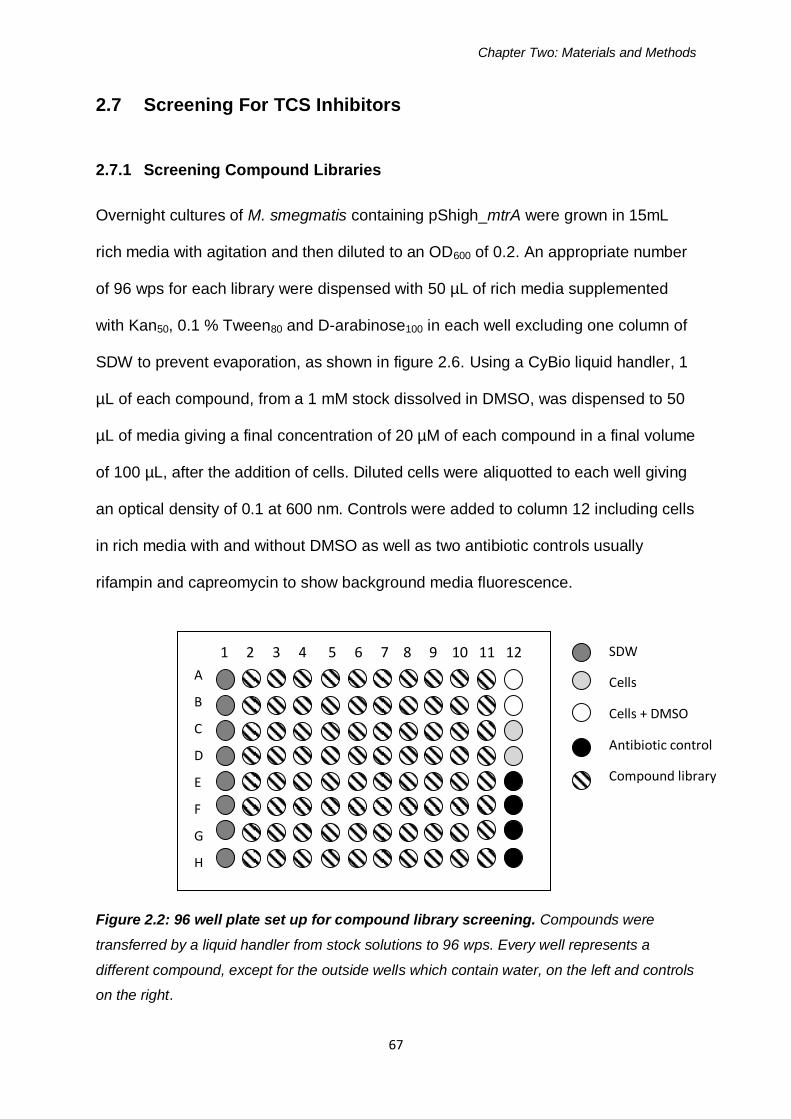
Chapter Two: Materials and Methods
67
2.7 Screening For TCS Inhibitors
2.7.1 Screening Compound Libraries
Overnight cultures of M. smegmatis containing pShigh_mtrA were grown in 15mL
rich media with agitation and then diluted to an OD600 of 0.2. An appropriate number
of 96 wps for each library were dispensed with 50 µL of rich media supplemented
with Kan50, 0.1 % Tween80 and D-arabinose100 in each well excluding one column of
SDW to prevent evaporation, as shown in figure 2.6. Using a CyBio liquid handler, 1
µL of each compound, from a 1 mM stock dissolved in DMSO, was dispensed to 50
µL of media giving a final concentration of 20 µM of each compound in a final volume
of 100 µL, after the addition of cells. Diluted cells were aliquotted to each well giving
an optical density of 0.1 at 600 nm. Controls were added to column 12 including cells
in rich media with and without DMSO as well as two antibiotic controls usually
rifampin and capreomycin to show background media fluorescence.
Figure 2.2: 96 well plate set up for compound library screening. Compounds were
transferred by a liquid handler from stock solutions to 96 wps. Every well represents a
different compound, except for the outside wells which contain water, on the left and controls
on the right.
A
B
C
D
E
F
G
H
1 2 3 4 5 6 7 8 9 10 11 12 SDW
Cells
Cells + DMSO
Antibiotic control
Compound library
Chapter Two: Materials and Methods
68
Plates were then sealed with plate seals and parafilm and wrapped in gladwrap
before incubation at 37oC with shaking for 96 hours. Plates were read by a Wallac
Envision plate reader for OD580 and F (excitation 488 nm and emission 509 nm).
The phoA promoter driven expression was also tested in a similar way except that
minimal media was used, supplemented with Kan50 and 0.5 mM EDTA. For these
plates an additional control of promoterless pShigh was added, instead of having 4
antibiotic controls.
2.7.2 Palmitoleic and Oleic Acid Serial Dilutions
Three 2 x dilutions of each of the fatty acids and a solvent control of ethanol were set
up in rich media starting from a final concentration of 50 µM. An ethanol solvent
control was included and these values are shown in the results as 0 µM of each type
of fatty acid. Cells with an initial OD600 of 0.1 were added to this media, including
strains containing the plasmids pSHigh, pSHigh_mtrA and pSHigh_hsp60. These
were incubated and measured for F and OD as described in HTP screen.

Chapter Three: Optimisation of a GFP reporter plasmid
69
CHAPTER THREE:
Construction of a GFP
reporter plasmid
Chapter Three: Optimisation of a GFP reporter plasmid
70
3.1 Introduction
In order to screen for potential TCS inhibitors, this study required a method of
determining the level of TCS controlled gene expression under different stress
conditions, which could be modified to a 96 wp format for high throughput screening.
The green fluorescent protein has been used for over a decade, as a reporter of
gene expression 133 in a number of organisms including mycobacteria 134. By
inserting the promoter sequence of a gene of interest in front of gfp on a plasmid, the
amount of protein expressed under the control of this promoter will be indicative of
promoter activation, which can be measured by the fluorescence intensity.
Since its isolation from A. victoria, GFP has been engineered to suit a number of
applications across many fields in biology. A number of enhanced variants, known as
eGFPs, were developed by Cormack et al in order to increase the signal strength
and stability of the protein 136. Taking a rational engineering approach, they used site
directed mutagenesis to vary the 20 amino acids surrounding the central
chromophore and screened for improved signal strength with fluorescence activated
cell sorting (FACS). The result was GFPmut2, with a 100 fold increase in
fluorescence compared with wild type GFP and a red shift in its natural excitation
and emission spectra from 395 nm to 488 nm, making it more compatible with
techniques such as FACS and FITC filtration 136.
In this study GFPmut2 was chosen as a reporter over other methods, such as xylE
expression, for a number of reasons. Firstly, as GFP is activated by light of a specific
wavelength there is no substrate required, which can interfere with other cellular
processes. Secondly, the intensity of a fluorescent signal can be easily measured
using a FITC filter under a microscope, and quantified in a 96 wp fluorescence
Chapter Three: Optimisation of a GFP reporter plasmid
71
reader. Finally, this reporter is well established as a measure of gene expression in
mycobacteria 134.
A number of mycobacterial promoters are constitutively expressed and induce
protein formation all the time; these are sometimes known as “housekeeping” genes.
GFP expression under the control of the constitutively expressed promoter from the
hsp60 gene, for example, gives off relatively high levels of fluorescence. Many
others, such as the TCS-controlled genes which were selected in this study, induce
GFP expression under certain conditions, but never at the same level as the hsp60
promoter. In order to monitor relatively small changes in gene expression as a result
of stress conditions, a very sensitive reporter system was required. The GFPmut2
variant has been well adapted to measure bacterial gene expression; however
another means of improving signal strength is to increase the number of plasmids
per cell.
Bourn et al showed that a modification to the pAL5000 mycobacterial origin of
replication on a plasmid resulted in a seven fold increase in plasmid copy number
per cell 138. In this chapter, the development of the new plasmid pSHigh containing
gfpmut2 and the modified pAL5000, will be described. Its relative fluorescence will
be established and compared with that of low copy number plasmids containing the
same GFPmut2 under the control of the hsp60 promoter. Having demonstrated an
increase in signal strength, the phoA, hspX and mtrA promoters from M. smegmatis
were amplified and used to replace the hsp60 promoter for further analysis of the
TCS they control.

Chapter Three: Optimisation of a GFP reporter plasmid
72
3.2 Results
Construction of the reporter plasmid pSHigh involved a number of steps 142. An
overview of the process in shown in figure 3.1
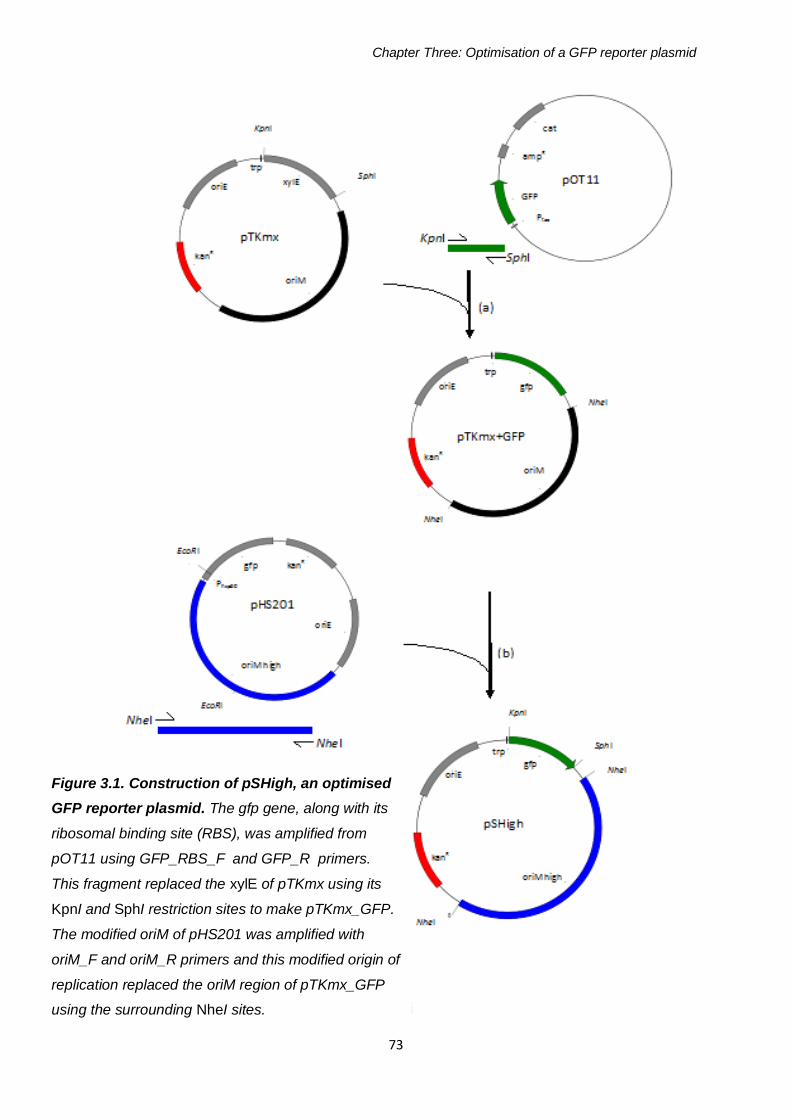
Chapter Three: Optimisation of a GFP reporter plasmid
73
3.2.1 Amplification of gfpmut2 and oriM hi
Figure 3.1. Construction of pSHigh, an optimised
GFP reporter plasmid. The gfp gene, along with its
ribosomal binding site (RBS), was amplified from
pOT11 using GFP_RBS_F and GFP_R primers.
This fragment replaced the xylE of pTKmx using its
KpnI and SphI restriction sites to make pTKmx_GFP.
The modified oriM of pHS201 was amplified with
oriM_F and oriM_R primers and this modified origin of
replication replaced the oriM region of pTKmx_GFP
using the surrounding NheI sites.

Chapter Three: Optimisation of a GFP reporter plasmid
74
3.2.1 Amplification of GFPmut2 and OriM by PCR
The optimised reporter plasmid pSHigh was developed by cloning a new origin of
replication oriM high and gfpmut2 into a mycobacterial plasmid pTKmx created by
Kenney and Churchwood 137. Figure 3.2 shows the PCR products of the amplification
of gfpmut2 from pOT11 and oriM high from pHS201 on 1 % agarose. A gradient
PCR showed that the optimal annealing temperature for cloning the oriM high
fragment was 63 oC, as shown in figure 3.2 (a).
Figure 3.2: Visualisation of gfpmut2 and oriM high amplified PCR products. A) gfpmut2
along with its RBS was amplified by PCR using pOT11 as a template, giving an 800bp
product on the agarose gel. B) OriM was amplified effectively from pHS201 using an
annealing temperature of 63oC, giving a 2500 bp product shown in the sixth lane.
800bp
GFP
RB
S
65oC
1 2 3
63oC
4 5 6
59oC
7 8 9
2500bp
A. B.
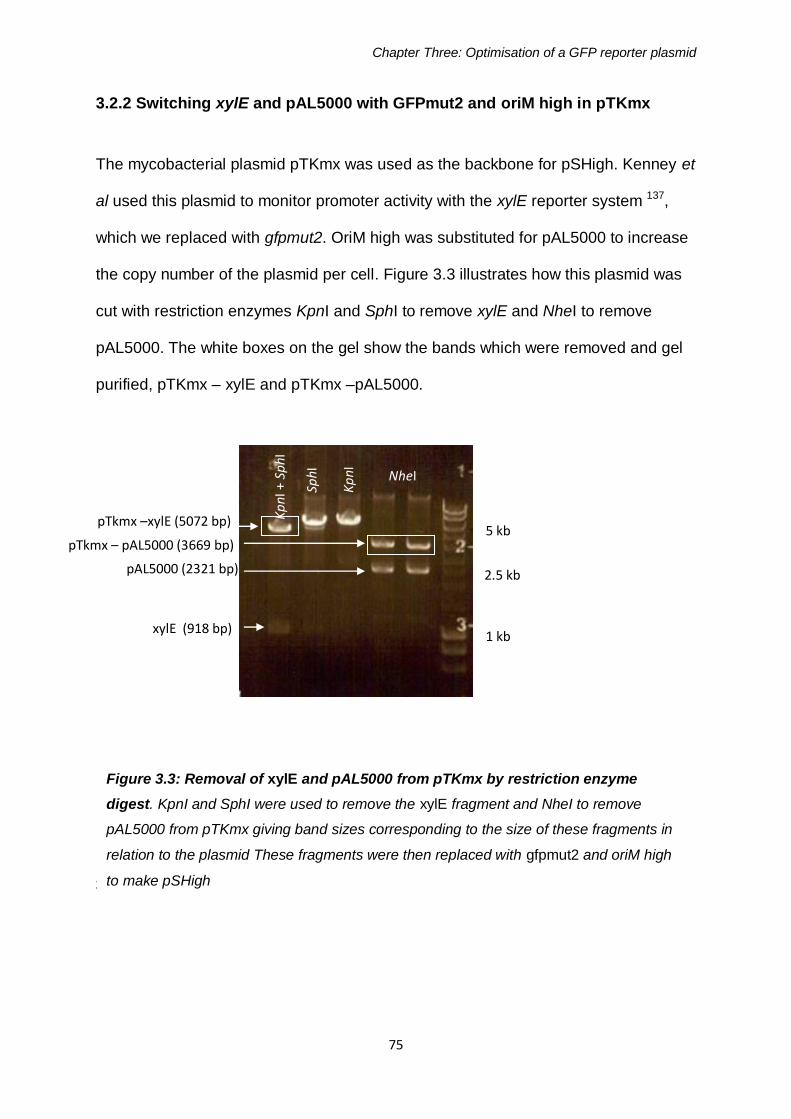
Chapter Three: Optimisation of a GFP reporter plasmid
75
3.2.2 Switching xylE and pAL5000 with GFPmut2 and oriM high in pTKmx
The mycobacterial plasmid pTKmx was used as the backbone for pSHigh. Kenney et
al used this plasmid to monitor promoter activity with the xylE reporter system 137,
which we replaced with gfpmut2. OriM high was substituted for pAL5000 to increase
the copy number of the plasmid per cell. Figure 3.3 illustrates how this plasmid was
cut with restriction enzymes KpnI and SphI to remove xylE and NheI to remove
pAL5000. The white boxes on the gel show the bands which were removed and gel
purified, pTKmx – xylE and pTKmx –pAL5000.
3.2.3 Comparing the fluorescence of high and low copy number plasmids in M.
pTkmx – pAL5000 (3669 bp)
pAL5000 (2321 bp)
xylE (918 bp)
Kp
nI +
Sp
hI
Sph
I
Kp
nI
NheI
pTkmx –xylE (5072 bp)
Figure 3.3: Removal of xylE and pAL5000 from pTKmx by restriction enzyme
digest. KpnI and SphI were used to remove the xylE fragment and NheI to remove
pAL5000 from pTKmx giving band sizes corresponding to the size of these fragments in
relation to the plasmid These fragments were then replaced with gfpmut2 and oriM high
to make pSHigh
1 kb
2.5 kb
5 kb
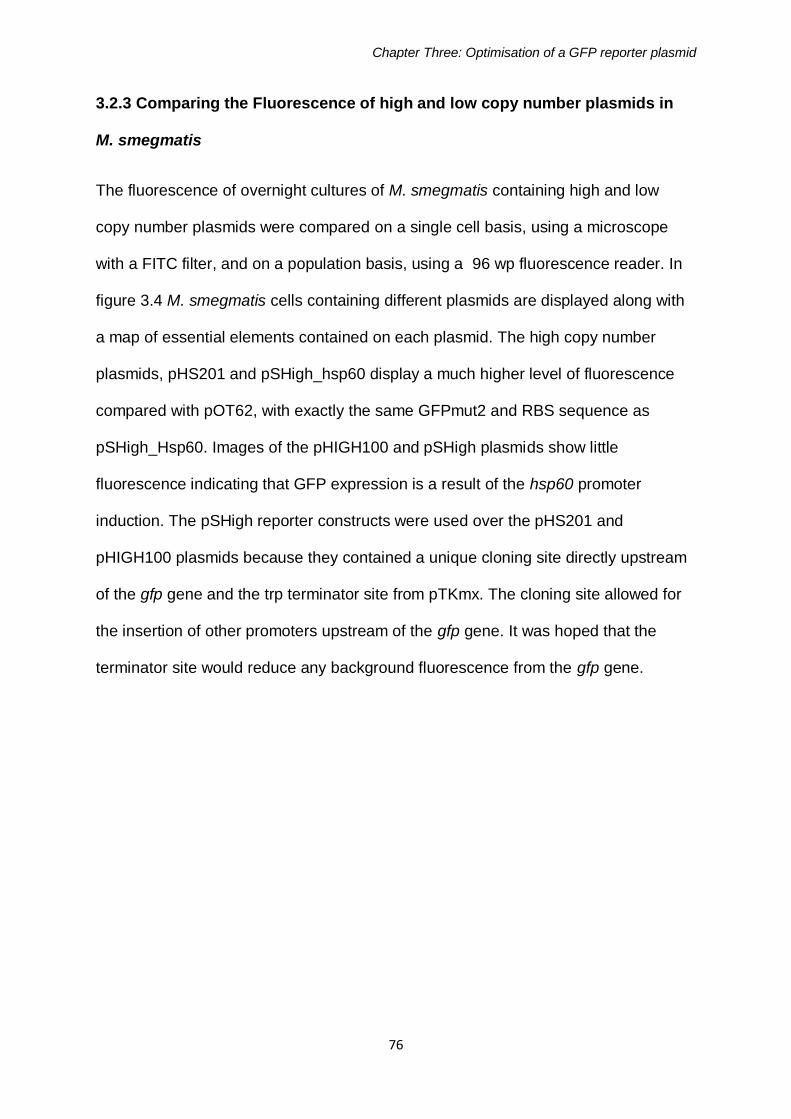
Chapter Three: Optimisation of a GFP reporter plasmid
76
3.2.3 Comparing the Fluorescence of high and low copy number plasmids in
M. smegmatis
The fluorescence of overnight cultures of M. smegmatis containing high and low
copy number plasmids were compared on a single cell basis, using a microscope
with a FITC filter, and on a population basis, using a 96 wp fluorescence reader. In
figure 3.4 M. smegmatis cells containing different plasmids are displayed along with
a map of essential elements contained on each plasmid. The high copy number
plasmids, pHS201 and pSHigh_hsp60 display a much higher level of fluorescence
compared with pOT62, with exactly the same GFPmut2 and RBS sequence as
pSHigh_Hsp60. Images of the pHIGH100 and pSHigh plasmids show little
fluorescence indicating that GFP expression is a result of the hsp60 promoter
induction. The pSHigh reporter constructs were used over the pHS201 and
pHIGH100 plasmids because they contained a unique cloning site directly upstream
of the gfp gene and the trp terminator site from pTKmx. The cloning site allowed for
the insertion of other promoters upstream of the gfp gene. It was hoped that the
terminator site would reduce any background fluorescence from the gfp gene.
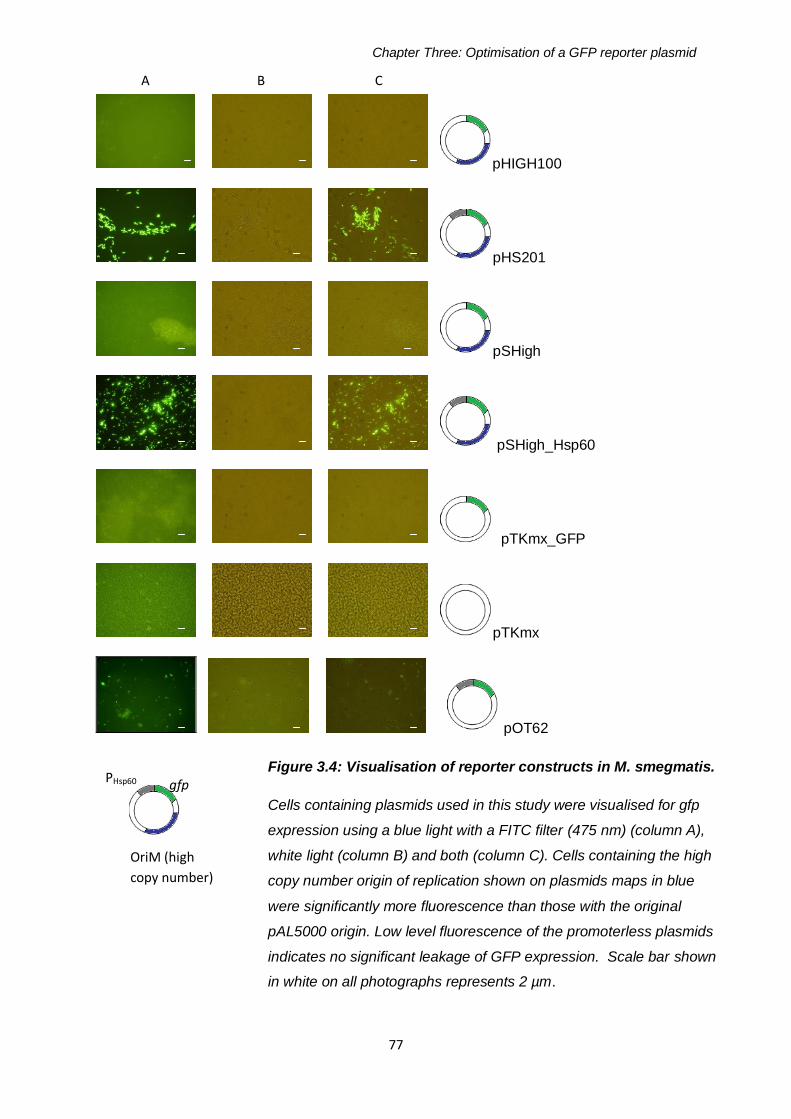
Chapter Three: Optimisation of a GFP reporter plasmid
77
pHIGH100
pHS201
pSHigh
pSHigh_Hsp60
pTKmx_GFP
pTKmx
pOT62
PHsp60 gfp
OriM (high
copy number)
Figure 3.4: Visualisation of reporter constructs in M. smegmatis.
Cells containing plasmids used in this study were visualised for gfp
expression using a blue light with a FITC filter (475 nm) (column A),
white light (column B) and both (column C). Cells containing the high
copy number origin of replication shown on plasmids maps in blue
were significantly more fluorescence than those with the original
pAL5000 origin. Low level fluorescence of the promoterless plasmids
indicates no significant leakage of GFP expression. Scale bar shown
in white on all photographs represents 2 µm.
A B C
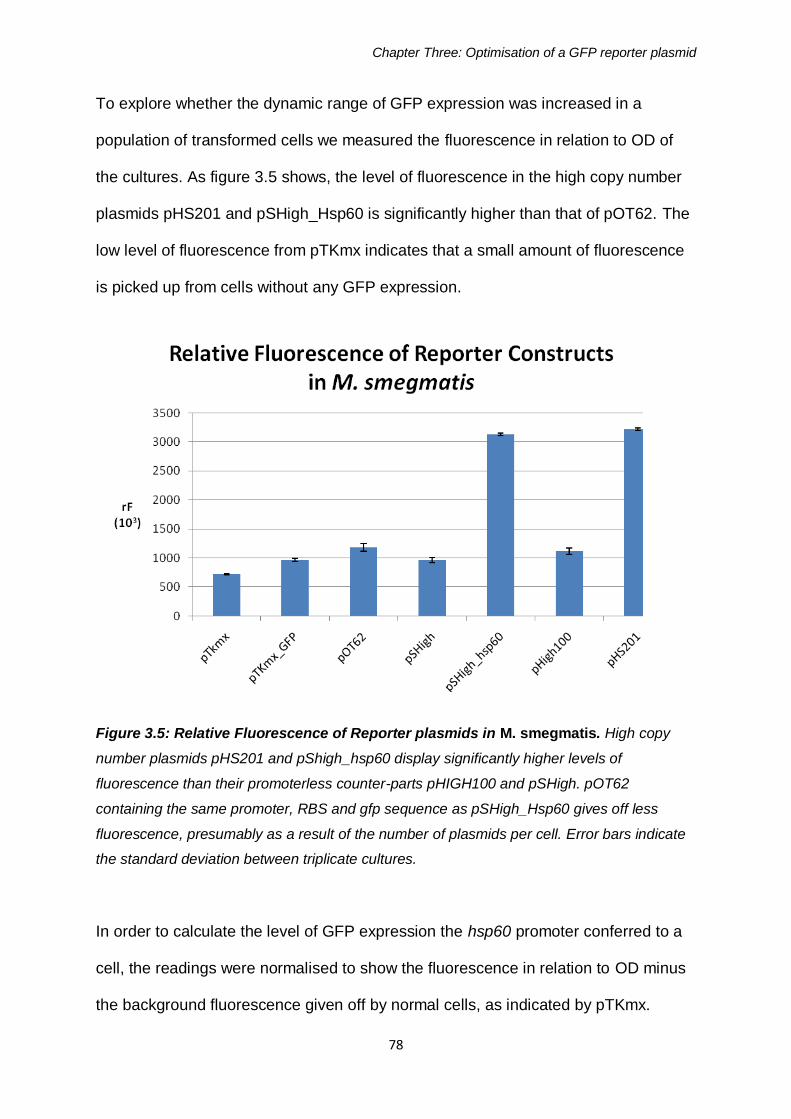
Chapter Three: Optimisation of a GFP reporter plasmid
78
To explore whether the dynamic range of GFP expression was increased in a
population of transformed cells we measured the fluorescence in relation to OD of
the cultures. As figure 3.5 shows, the level of fluorescence in the high copy number
plasmids pHS201 and pSHigh_Hsp60 is significantly higher than that of pOT62. The
low level of fluorescence from pTKmx indicates that a small amount of fluorescence
is picked up from cells without any GFP expression.
Figure 3.5: Relative Fluorescence of Reporter plasmids in M. smegmatis. High copy
number plasmids pHS201 and pShigh_hsp60 display significantly higher levels of
fluorescence than their promoterless counter-parts pHIGH100 and pSHigh. pOT62
containing the same promoter, RBS and gfp sequence as pSHigh_Hsp60 gives off less
fluorescence, presumably as a result of the number of plasmids per cell. Error bars indicate
the standard deviation between triplicate cultures.
In order to calculate the level of GFP expression the hsp60 promoter conferred to a
cell, the readings were normalised to show the fluorescence in relation to OD minus
the background fluorescence given off by normal cells, as indicated by pTKmx.
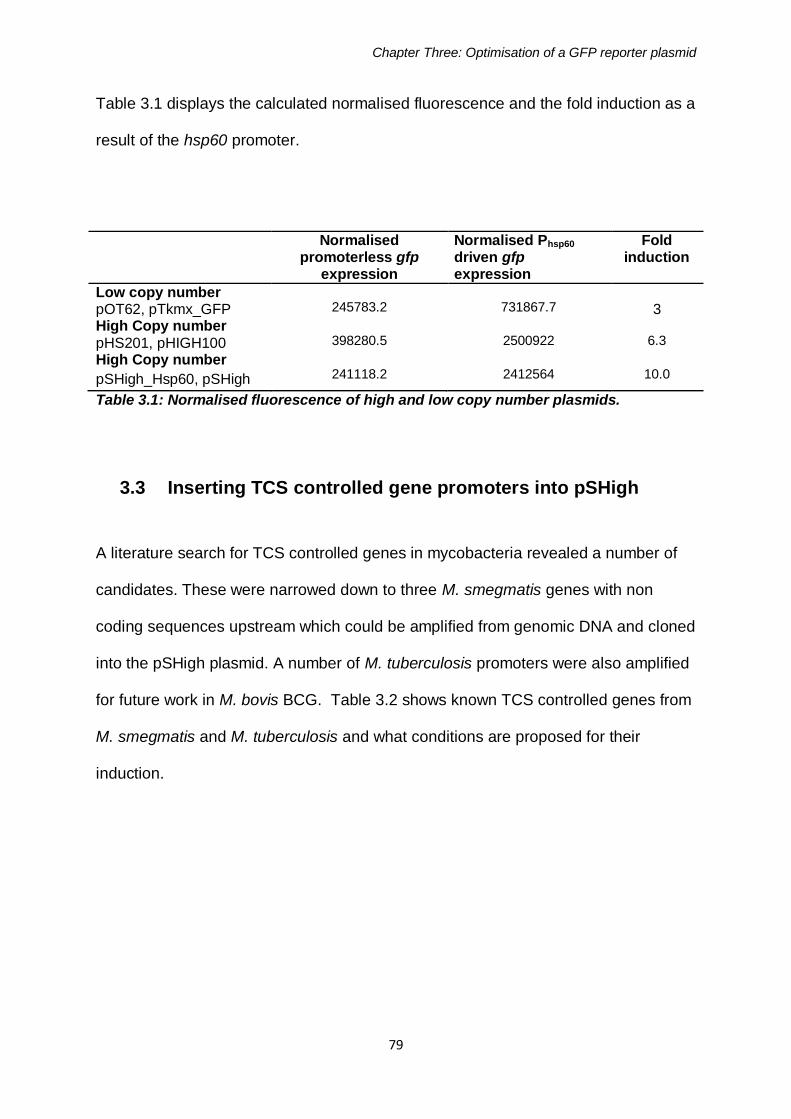
Chapter Three: Optimisation of a GFP reporter plasmid
79
Table 3.1 displays the calculated normalised fluorescence and the fold induction as a
result of the hsp60 promoter.
Normalised promoterless gfp
expression
Normalised Phsp60 driven gfp expression
Fold induction
Low copy number pOT62, pTkmx_GFP
245783.2
731867.7
3
High Copy number
pHS201, pHIGH100
398280.5
2500922
6.3
High Copy number
pSHigh_Hsp60, pSHigh
241118.2
2412564
10.0
Table 3.1: Normalised fluorescence of high and low copy number plasmids.
3.3 Inserting TCS controlled gene promoters into pSHigh
A literature search for TCS controlled genes in mycobacteria revealed a number of
candidates. These were narrowed down to three M. smegmatis genes with non
coding sequences upstream which could be amplified from genomic DNA and cloned
into the pSHigh plasmid. A number of M. tuberculosis promoters were also amplified
for future work in M. bovis BCG. Table 3.2 shows known TCS controlled genes from
M. smegmatis and M. tuberculosis and what conditions are proposed for their
induction.
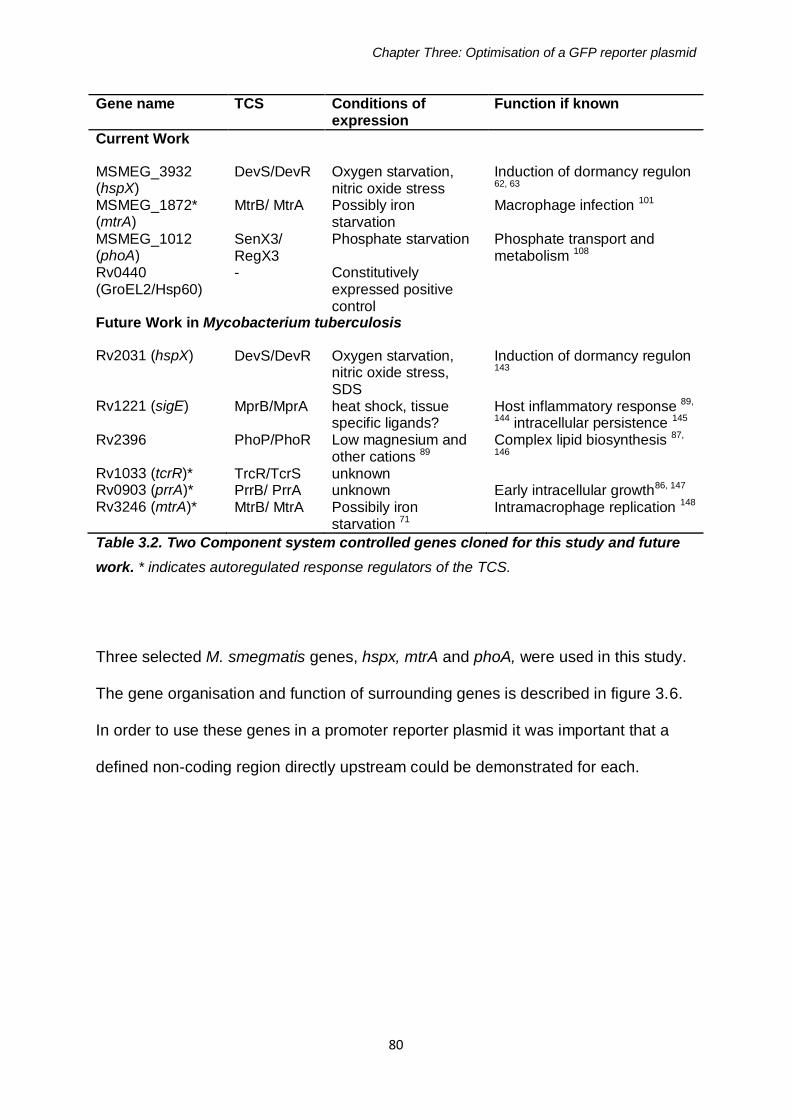
Chapter Three: Optimisation of a GFP reporter plasmid
80
Gene name TCS Conditions of expression
Function if known
Current Work
MSMEG_3932 (hspX)
DevS/DevR Oxygen starvation, nitric oxide stress
Induction of dormancy regulon 62, 63
MSMEG_1872* (mtrA)
MtrB/ MtrA Possibly iron starvation
Macrophage infection 101
MSMEG_1012 (phoA)
SenX3/ RegX3
Phosphate starvation Phosphate transport and metabolism 108
Rv0440 (GroEL2/Hsp60)
- Constitutively expressed positive control
Future Work in Mycobacterium tuberculosis
Rv2031 (hspX) DevS/DevR Oxygen starvation, nitric oxide stress, SDS
Induction of dormancy regulon 143
Rv1221 (sigE) MprB/MprA heat shock, tissue specific ligands?
Host inflammatory response 89,
144 intracellular persistence 145 Rv2396 PhoP/PhoR Low magnesium and
other cations 89 Complex lipid biosynthesis 87,
146 Rv1033 (tcrR)* TrcR/TcrS unknown Rv0903 (prrA)* PrrB/ PrrA unknown Early intracellular growth86, 147 Rv3246 (mtrA)* MtrB/ MtrA Possibily iron
starvation 71 Intramacrophage replication 148
Table 3.2. Two Component system controlled genes cloned for this study and future
work. * indicates autoregulated response regulators of the TCS.
Three selected M. smegmatis genes, hspx, mtrA and phoA, were used in this study.
The gene organisation and function of surrounding genes is described in figure 3.6.
In order to use these genes in a promoter reporter plasmid it was important that a
defined non-coding region directly upstream could be demonstrated for each.
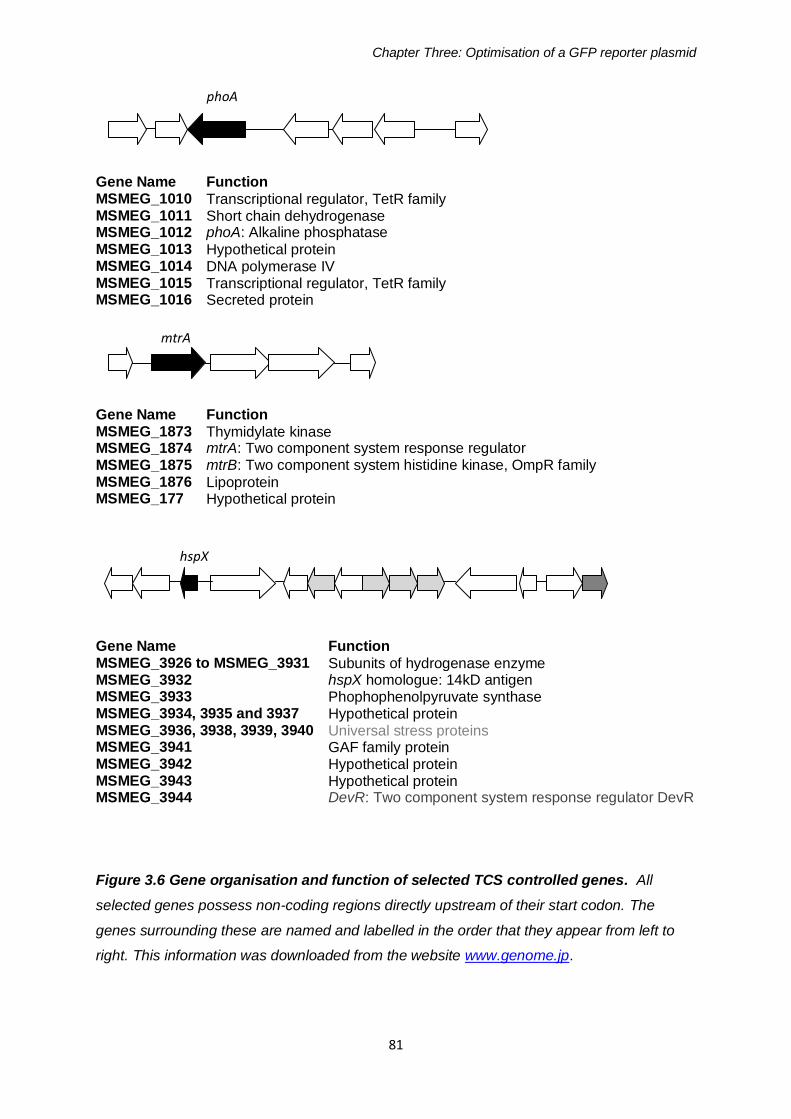
Chapter Three: Optimisation of a GFP reporter plasmid
81
Gene Name Function MSMEG_1010 Transcriptional regulator, TetR family MSMEG_1011 Short chain dehydrogenase MSMEG_1012 phoA: Alkaline phosphatase MSMEG_1013 Hypothetical protein MSMEG_1014 DNA polymerase IV MSMEG_1015 Transcriptional regulator, TetR family MSMEG_1016 Secreted protein
Gene Name Function MSMEG_1873 Thymidylate kinase MSMEG_1874 mtrA: Two component system response regulator MSMEG_1875 mtrB: Two component system histidine kinase, OmpR family MSMEG_1876 Lipoprotein MSMEG_177 Hypothetical protein
Gene Name Function MSMEG_3926 to MSMEG_3931 Subunits of hydrogenase enzyme MSMEG_3932 hspX homologue: 14kD antigen MSMEG_3933 Phophophenolpyruvate synthase MSMEG_3934, 3935 and 3937 Hypothetical protein MSMEG_3936, 3938, 3939, 3940 Universal stress proteins MSMEG_3941 GAF family protein MSMEG_3942 Hypothetical protein MSMEG_3943 Hypothetical protein MSMEG_3944 DevR: Two component system response regulator DevR
Figure 3.6 Gene organisation and function of selected TCS controlled genes. All
selected genes possess non-coding regions directly upstream of their start codon. The
genes surrounding these are named and labelled in the order that they appear from left to
right. This information was downloaded from the website www.genome.jp.
hspX
mtrA
phoA
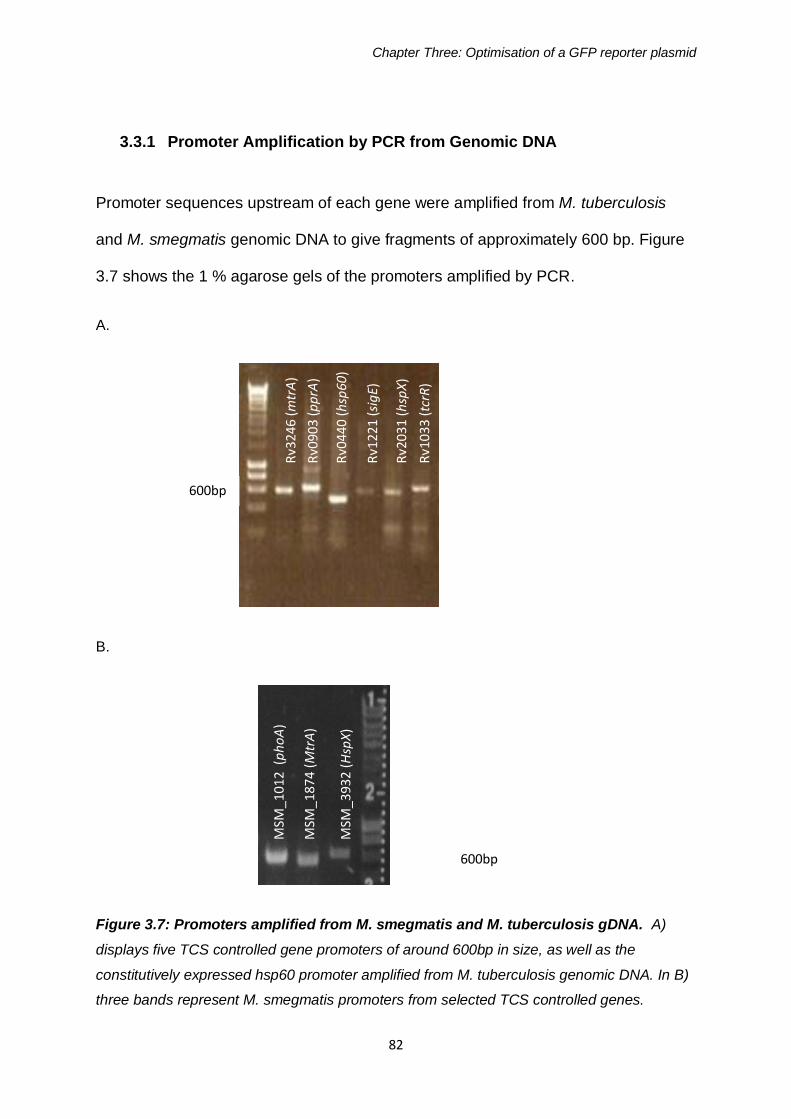
Chapter Three: Optimisation of a GFP reporter plasmid
82
3.3.1 Promoter Amplification by PCR from Genomic DNA
Promoter sequences upstream of each gene were amplified from M. tuberculosis
and M. smegmatis genomic DNA to give fragments of approximately 600 bp. Figure
3.7 shows the 1 % agarose gels of the promoters amplified by PCR.
A.
B.
Figure 3.7: Promoters amplified from M. smegmatis and M. tuberculosis gDNA. A)
displays five TCS controlled gene promoters of around 600bp in size, as well as the
constitutively expressed hsp60 promoter amplified from M. tuberculosis genomic DNA. In B)
three bands represent M. smegmatis promoters from selected TCS controlled genes.
600bp
Rv3
246
(m
trA
)
Rv0
903
(p
prA
)
Rv0
440
(h
sp6
0)
Rv1
221
(si
gE)
Rv2
031
(h
spX
)
Rv1
033
(tc
rR)
600bp
MSM
_393
2 (
Hsp
X)
MSM
_101
2 (
ph
oA
)
MSM
_187
4 (
Mtr
A)
Rv0
440
_Hsp
60
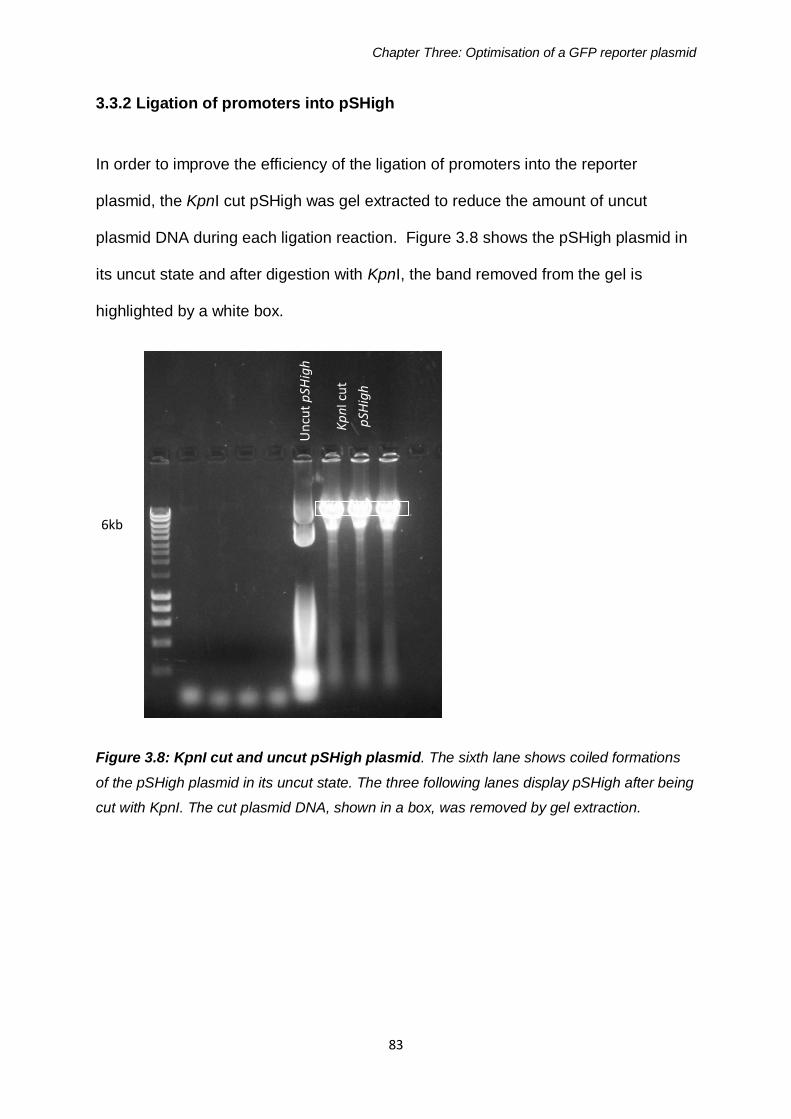
Chapter Three: Optimisation of a GFP reporter plasmid
83
3.3.2 Ligation of promoters into pSHigh
In order to improve the efficiency of the ligation of promoters into the reporter
plasmid, the KpnI cut pSHigh was gel extracted to reduce the amount of uncut
plasmid DNA during each ligation reaction. Figure 3.8 shows the pSHigh plasmid in
its uncut state and after digestion with KpnI, the band removed from the gel is
highlighted by a white box.
Figure 3.8: KpnI cut and uncut pSHigh plasmid. The sixth lane shows coiled formations
of the pSHigh plasmid in its uncut state. The three following lanes display pSHigh after being
cut with KpnI. The cut plasmid DNA, shown in a box, was removed by gel extraction.
6kb
Un
cut
pSH
igh
Kp
nI c
ut
pSH
igh
Chapter Three: Optimisation of a GFP reporter plasmid
84
3.4 Discussion
3.4.1 Optimisation of the reporter plasmid
The principal aim of this work was to generate a cell based screen for TCS inhibitors.
This required a highly sensitive reporter system which could be manipulated to
identify small changes in gene expression as a result of TCS-specific conditions. The
results of section 3.2.3 clearly show that pSHigh_Hsp60 is a highly fluorescent
reporter construct and this is a result of the change in the origin of replication of the
plasmid from pAL5000 to oriM high. Only a limited amount of background
fluorescence is produced from the promoterless pSHigh plasmid, when compared
with the pTKmx strain, indicating the plasmid does not express the protein
independently of an adjacent promoter sequence upstream of gfpmut2. The plasmid
also contains a kanamycin resistance cassette for antibiotic selection and an E. coli
origin of replication oriE. This pSHigh_hsp60 plasmid was used as a constitutively
expressed control in this study, and has also been used for screening compound
libraries against mycobacteria. The plasmid displays high levels of measurable
fluorescence which can also indicate cell viability when OD readings cannot be used
due to interference by coloured compounds.
The authors who created the pHS201 vector describe a significant increase in
plasmid copy number from around five per cell to between 32 and 64 copies of the
same plasmid 138. The advantage of the pSHigh plasmid over the pHS201 vector is
its unique KpnI restriction site, directly upstream from the gfpmut2 gene, allowing
other promoters to be cloned in frame with the ribosomal binding site to monitor gene
expression. In addition the trpA terminator sequence from pTKmx, located
Chapter Three: Optimisation of a GFP reporter plasmid
85
downstream of this cloning site lead to a lower level of background fluorescence
from the promoterless plasmid control.
When using a reporter to monitor gene expression, a number of assumptions are
made. Firstly, any changes in fluorescence demonstrated are a result of activation or
repression of a particular promoter. Therefore any post translational modification to
proteins in a cell which are not directly affected by activation or repression of that
promoter will not be demonstrated by the reporter system. Fortunately, the three
promoters selected for this work have been previously studied and RR promoter
binding sites have been demonstrated. This type of method may not be suitable for
other target genes if their protein concentration or activity within the cell is controlled
by some mechanism other than promoter activation.
One also assumes that the number of plasmids per cell remains relatively consistent
between cultures. Measuring the fluorescence of a cell indicates the amount of
protein expressed therein and is dependent on the number of plasmids present. We
calculate the relative fluorescence (rF) as a measure of fluorescence divided by the
OD of a culture of cells, to generate a number which is relative to the number of cells
present, but we cannot account for the number of plasmids in each cell and assume
that this remains relatively constant.
Another concern with this methodology is the effect a reporter may have on cellular
function. The use of GFPmut2 has been established in a number of species and no
significant adverse reactions to the cell have been noted. It is shown in figure 3.3
that cells expressing GFP appear normal and seem as healthy as those not
expressing the protein. The benefits of this reporter over substrate based systems
such as xylE are clear in this regard, although some work has indicated that

Chapter Three: Optimisation of a GFP reporter plasmid
86
exposure to certain wavelengths of light can cause photo bleaching of the protein,
reducing its fluorescence 149.
3.4.2 Selection of TCS promoters
As not all TCS controlled genes have had their promoters sequences published, it
was important that a substantial intergenic region could be identified directly
upstream of selected genes for RR binding. It is known that certain genes are
controlled as part of an operon rather than direct binding at each one’s promoter site,
which meant some of the TCSs could not be included. Figure 3.5 indicates that
genes selected for this study all qualify in this regard. We included genes such as
HspX and PhoA, whose promoter binding sites are known 108, 150. MtrA is an auto-
regulated gene, in that induction of this TCS confers expression of its own response
regulator 89.
The importance of these TCS in terms of dormancy (hspX), phosphate starvation
(phoA) and survival in the macrophage (mtrA) has been discussed in some detail in
the opening chapter. The conditions for hspX and phoA induction have been
demonstrated in previous work, but the control of the mtrA gene is something of a
mystery despite its proposed essentiality in M. tuberculosis. The idea of using the
hspX and mtrA promoters as drug targets came from the fact that their M.
tuberculosis homologues are involved in signal transduction mechanisms which are
vital to mycobacterial survival and latency. PhoA, on the other hand is absent in M.
tuberculosis. Its established induction during phosphate starvation in M. smegmatis
and E. coli, however, make it an attractive target in terms of screening for a broad
class of TCS inhibitors which affect a conserved part of the phosphorylation transfer
and may inhibit a number of TCS mycobacteria and other species of bacteria.

87
CHAPTER FOUR:
Conditions of TCS
Regulated Gene Expression
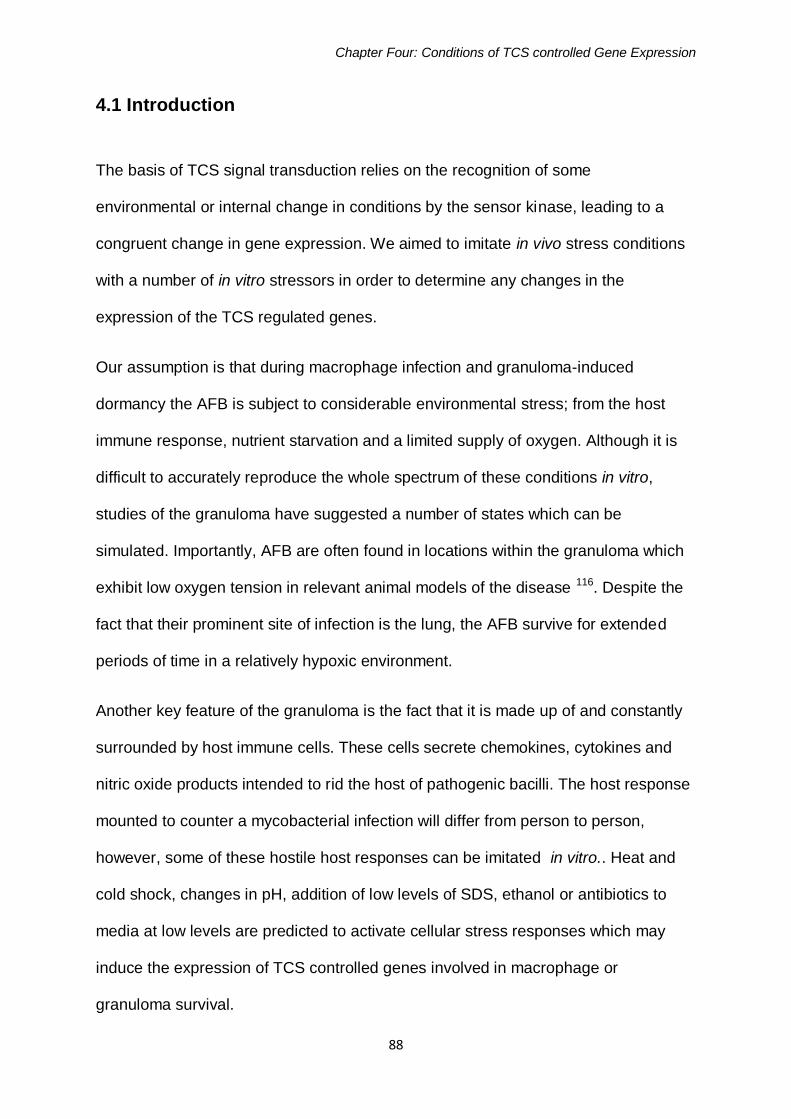
Chapter Four: Conditions of TCS controlled Gene Expression
88
4.1 Introduction
The basis of TCS signal transduction relies on the recognition of some
environmental or internal change in conditions by the sensor kinase, leading to a
congruent change in gene expression. We aimed to imitate in vivo stress conditions
with a number of in vitro stressors in order to determine any changes in the
expression of the TCS regulated genes.
Our assumption is that during macrophage infection and granuloma-induced
dormancy the AFB is subject to considerable environmental stress; from the host
immune response, nutrient starvation and a limited supply of oxygen. Although it is
difficult to accurately reproduce the whole spectrum of these conditions in vitro,
studies of the granuloma have suggested a number of states which can be
simulated. Importantly, AFB are often found in locations within the granuloma which
exhibit low oxygen tension in relevant animal models of the disease 116. Despite the
fact that their prominent site of infection is the lung, the AFB survive for extended
periods of time in a relatively hypoxic environment.
Another key feature of the granuloma is the fact that it is made up of and constantly
surrounded by host immune cells. These cells secrete chemokines, cytokines and
nitric oxide products intended to rid the host of pathogenic bacilli. The host response
mounted to counter a mycobacterial infection will differ from person to person,
however, some of these hostile host responses can be imitated in vitro.. Heat and
cold shock, changes in pH, addition of low levels of SDS, ethanol or antibiotics to
media at low levels are predicted to activate cellular stress responses which may
induce the expression of TCS controlled genes involved in macrophage or
granuloma survival.

Chapter Four: Conditions of TCS controlled Gene Expression
89
Finally, the use of HdeB minimal media can effectively control the level of particular
nutrients available to cells. This media can be modified to alter the concentration of
available carbon, nitrogen and phosphate. In addition to the direct removal of
elements from the media, chelators can be used to remove cations such as calcium,
magnesium and iron.
By measuring the effect of these stress conditions on TCS controlled gene
expression we can elucidate the possible activators of these systems. As a proof of
principal, hspX expression was measured during oxygen starvation, a known
activator of the DevS/ DevR TCS dormancy response. This was followed by a
number of other stress conditions described in the materials and methods section,
which were applied to all three TCS controlled promoters phoA, mtrA and hspX.
The remainder of this chapter will describe the significant findings on the influence of
stress condition on TCS regulated gene expression.

Chapter Four: Conditions of TCS controlled Gene Expression
90
4.2 Results
Cells containing GFP reporter constructs were exposed to a number of stress
conditions throughout this study. For simplicity, only those with a reproducible
outcome will be described here.
4.2.1 Expression of the DevS/DevR dependent hspX promoter
The DevS/DevR TCS is known to promote the expression of hspX under conditions
of oxygen starvation and nitric oxide stress 143, 151. Other authors have shown an
increase in hspX mRNA during growth in media with 5% ethanol and to a lesser
extent hydrogen peroxide 152.
In order to demonstrate that the hspX reporter plasmid was oxygen dependent two
oxygen starvation assays were carried out. The first was using a low copy number
pOT71 plasmid and a method described in a previous publication 62, shown in figure
4.1. After 35 hours, the hspX-driven expression increased to a level that was higher
than that of the promoterless pSHigh plasmid. The positive control, hsp60 driven
gene expression, is generally much higher and is variable over different time points.
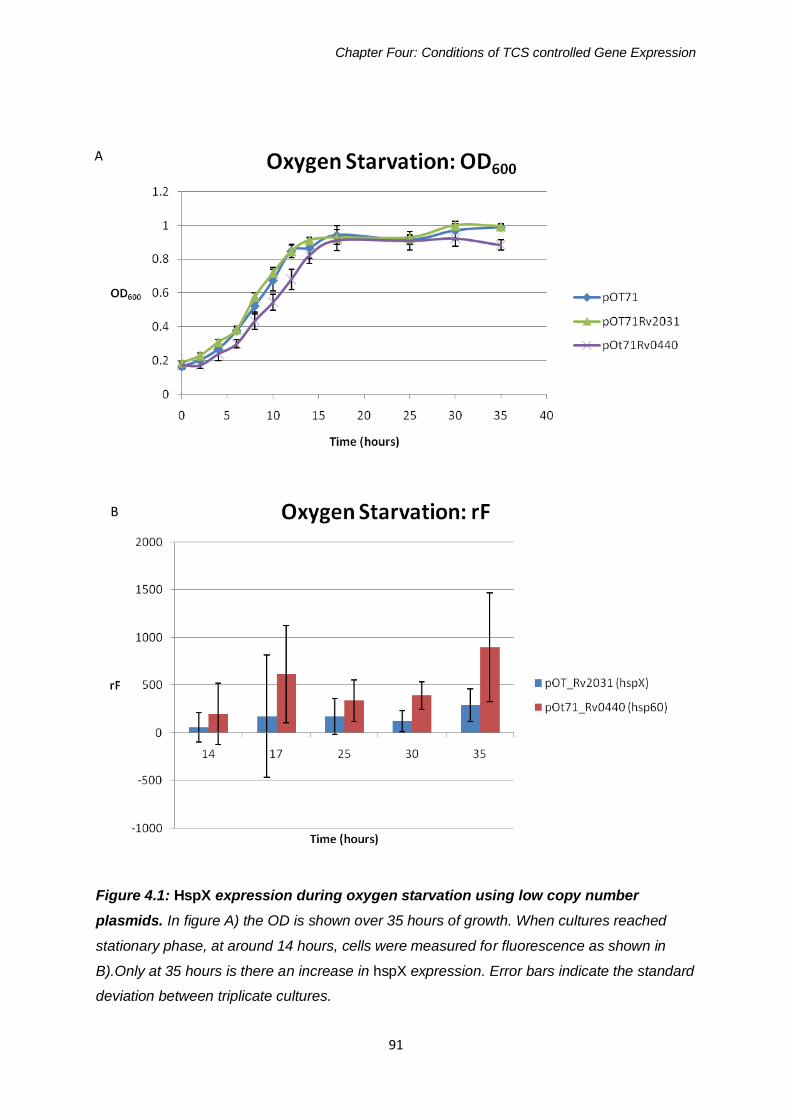
Chapter Four: Conditions of TCS controlled Gene Expression
91
Figure 4.1: HspX expression during oxygen starvation using low copy number
plasmids. In figure A) the OD is shown over 35 hours of growth. When cultures reached
stationary phase, at around 14 hours, cells were measured for fluorescence as shown in
B).Only at 35 hours is there an increase in hspX expression. Error bars indicate the standard
deviation between triplicate cultures.
A
B

Chapter Four: Conditions of TCS controlled Gene Expression
92
Another means of oxygen starvation was achieved based on a number of other
methods used in current literature 56, 153. We reasoned that there were a number of
problems with the original assay and made appropriate alterations to our method.
Smaller flasks with a larger volume of media were used to reduce the amount of air
in each culture to start with. Another alteration to the original method was the use of
rich rather than minimal media. We argued that cells are less likely to reach
stationary phase as a result of some limiting factor other than oxygen, if they are
living in rich media.
Using an optimised oxygen starvation method and the improved high copy number
pSHigh plasmid (amongst other changes to this method described in section 2.7), a
higher level of fluorescence was produced (figure 4.2). A number of changes were
made to this assay to increase the stringency of oxygen starvation and observe a
higher level of GFP expression under the control of the hspX promoter after 4 days.
Contrasting these results with figure 4.1 indicates that a combination of the method
of oxygen starvation and choice of plasmid constructs results in higher hspX
promoter induction after 4 days.
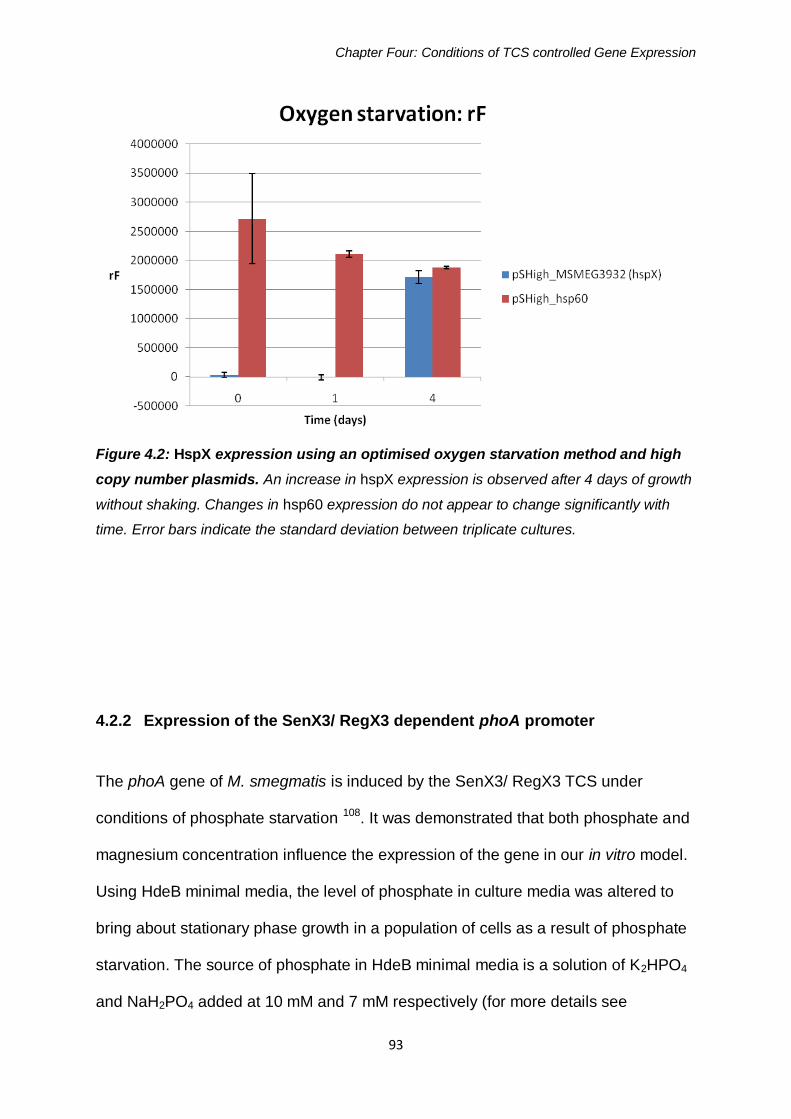
Chapter Four: Conditions of TCS controlled Gene Expression
93
Figure 4.2: HspX expression using an optimised oxygen starvation method and high
copy number plasmids. An increase in hspX expression is observed after 4 days of growth
without shaking. Changes in hsp60 expression do not appear to change significantly with
time. Error bars indicate the standard deviation between triplicate cultures.
4.2.2 Expression of the SenX3/ RegX3 dependent phoA promoter
The phoA gene of M. smegmatis is induced by the SenX3/ RegX3 TCS under
conditions of phosphate starvation 108. It was demonstrated that both phosphate and
magnesium concentration influence the expression of the gene in our in vitro model.
Using HdeB minimal media, the level of phosphate in culture media was altered to
bring about stationary phase growth in a population of cells as a result of phosphate
starvation. The source of phosphate in HdeB minimal media is a solution of K2HPO4
and NaH2PO4 added at 10 mM and 7 mM respectively (for more details see

Chapter Four: Conditions of TCS controlled Gene Expression
94
appendix 7). As figure 4.3 indicates, lower levels of phosphate in the media bring
about an increase in phoA promoter activation compared with the promoterless
pSHigh plasmid grown in the same condition.
Figure 4.3: The effect of phosphate starvation on phoA expression. The amount of 100
x phosphate solution added to HdeB minimal media was altered to adjust the percentage of
phosphates available to cells whereby 100 % is equivalent to that of minimal media. Using
media with only 20 % of the required phosphate leads to a change in phoA expression. Error
bars indicate the standard deviation between triplicate cultures.
Figure 4.4 demonstrates that a range of EDTA concentrations also had an effect on
phoA expression. A final concentration of 0.5 mM EDTA added to minimal media
seems to induce the expression of this gene. It was observed that a final
concentration of more than 1.0 mM EDTA resulted in a slow growth rate of cells,
increasing the variation of the data collected, which is perhaps why fluorescence
does not increase with concentration.
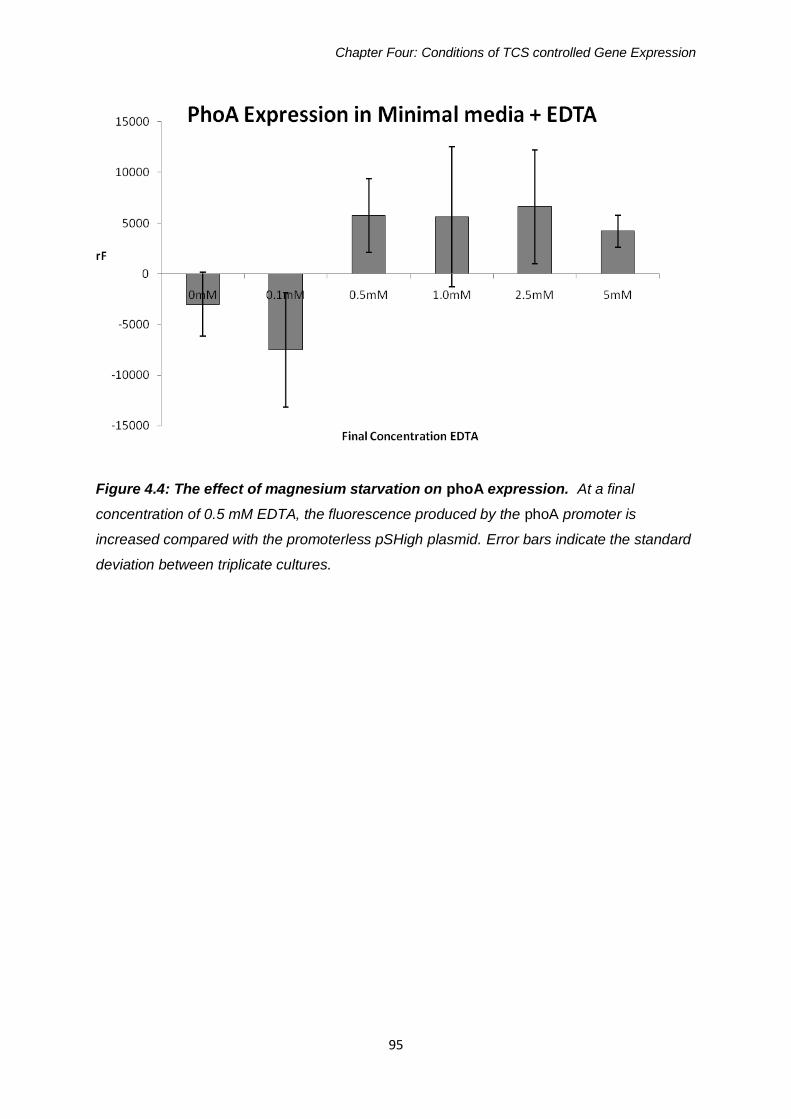
Chapter Four: Conditions of TCS controlled Gene Expression
95
Figure 4.4: The effect of magnesium starvation on phoA expression. At a final
concentration of 0.5 mM EDTA, the fluorescence produced by the phoA promoter is
increased compared with the promoterless pSHigh plasmid. Error bars indicate the standard
deviation between triplicate cultures.
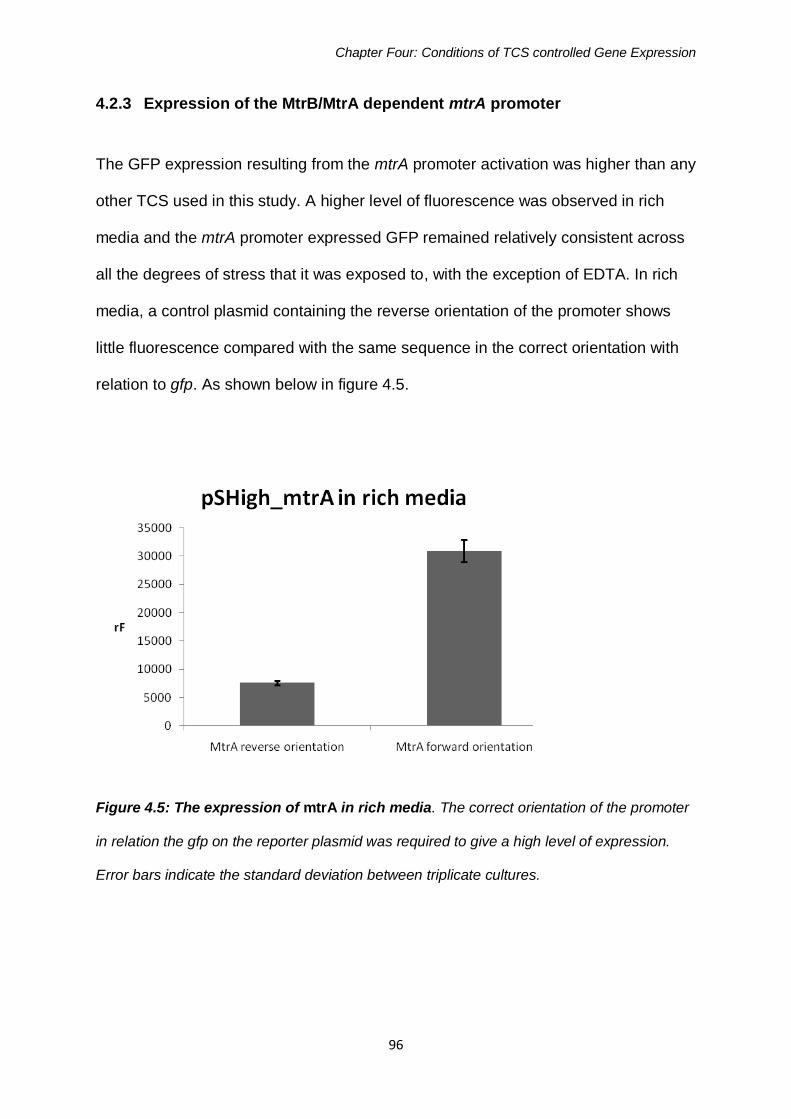
Chapter Four: Conditions of TCS controlled Gene Expression
96
4.2.3 Expression of the MtrB/MtrA dependent mtrA promoter
The GFP expression resulting from the mtrA promoter activation was higher than any
other TCS used in this study. A higher level of fluorescence was observed in rich
media and the mtrA promoter expressed GFP remained relatively consistent across
all the degrees of stress that it was exposed to, with the exception of EDTA. In rich
media, a control plasmid containing the reverse orientation of the promoter shows
little fluorescence compared with the same sequence in the correct orientation with
relation to gfp. As shown below in figure 4.5.
Figure 4.5: The expression of mtrA in rich media. The correct orientation of the promoter
in relation the gfp on the reporter plasmid was required to give a high level of expression.
Error bars indicate the standard deviation between triplicate cultures.
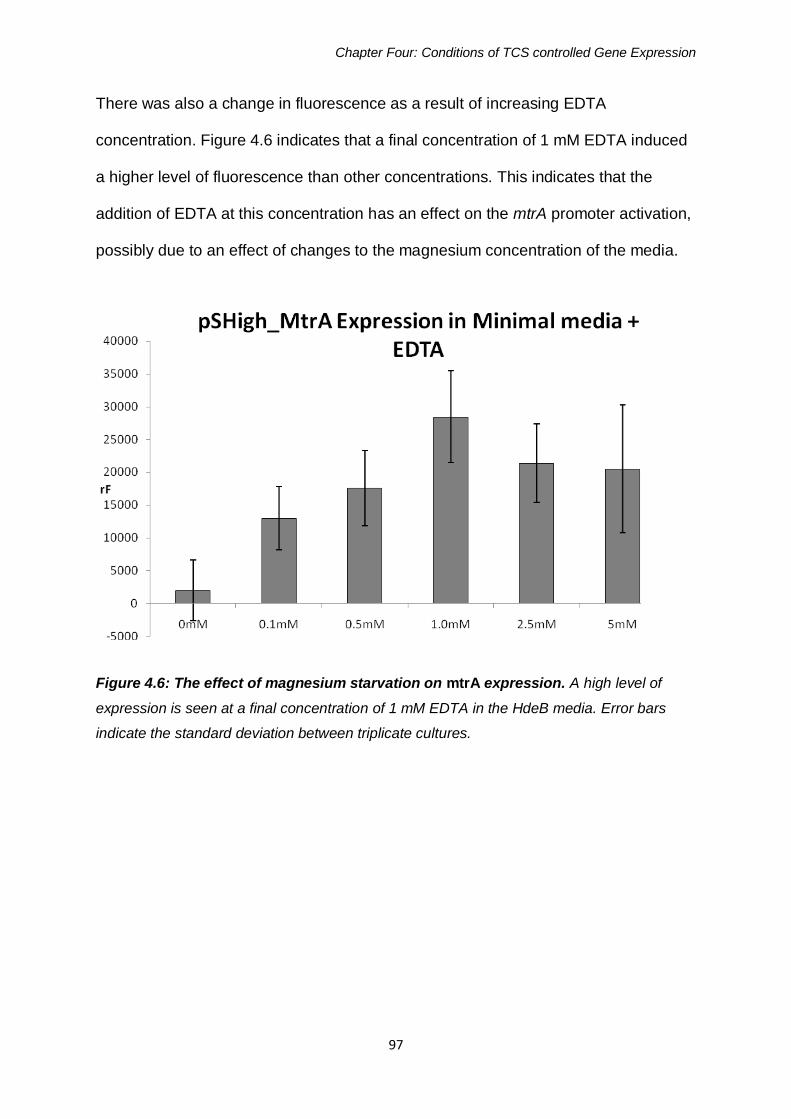
Chapter Four: Conditions of TCS controlled Gene Expression
97
There was also a change in fluorescence as a result of increasing EDTA
concentration. Figure 4.6 indicates that a final concentration of 1 mM EDTA induced
a higher level of fluorescence than other concentrations. This indicates that the
addition of EDTA at this concentration has an effect on the mtrA promoter activation,
possibly due to an effect of changes to the magnesium concentration of the media.
Figure 4.6: The effect of magnesium starvation on mtrA expression. A high level of
expression is seen at a final concentration of 1 mM EDTA in the HdeB media. Error bars
indicate the standard deviation between triplicate cultures.
Chapter Four: Conditions of TCS controlled Gene Expression
98
4.3 Discussion
4.3 1 Expression of the DevS/DevR dependent hspX promoter
The oxygen starvation growth curves gave the highest hspX-induced rF for any
condition using this promoter construct, especially with the optimised method. As a
number of variables were changed, including the time allowed for oxygen starvation,
the copy number of the plasmid, the media used and volume of air in the flask to
begin with, we cannot specify exactly what caused the improved results. None the
less, figure 4.2 shows that hspX was induced by oxygen starvation. This provided a
proof of principle that using a promoter reporter system to monitor gene expression
of a TCS-controlled gene accurately.
Surprisingly, other reported activators of expression such as, SDS and ethanol
stress did not give a reproducible result for this assay. There are a number of
possible reasons for this, mainly relating to differences in the method used. The up
regulation of hspX found by Kendall et al 152 was shown by rtPCR. This method may
be more effective at recognising small changes in gene expression which are a
consequence of downstream effects of the stressors. Studies suggests that the
sensor kinase DevS contains heme binding GAF domains, and these are likely to
respond to oxygen tension 60. Other authors suggest that carbon monoxide is the
critical ligand of this sensor kinase 154, 155. The response seen to nitric oxide may
result from its ability to inhibit respiration rather than direct binding ligand binding 156.
Similarly, ethanol and SDS may be detrimental to cells in a way that reduces aerobic
respiration and induces a dormancy response.
Chapter Four: Conditions of TCS controlled Gene Expression
99
Another possibility is that these alternate inducers of the hspX gene occur as an
effect of another stress response, rather than the hypoxia induced dormancy regulon
151. As mentioned in the introduction, the highest level of cross talk between TCS
signal transduction mechanisms is the overlap in genes under their control 90. HspX
may be induced by a number of other signal transduction mechanisms controlled by
other stressors, at a lower level than that seen during oxygen starvation.
One problem involved in this type of assay is the effect stressful conditions have on
the OD of a cell culture. Adding stressors like ethanol and SDS, even at a low
concentration will limit the cell growth in a solution. A small difference in
concentration of a stress inducing agent between wells of a 96 wp will equate to a
large difference in cell density and a high degree of variability. The only quantifiable
way of showing a change is to compare the difference in fluorescence between
pShigh_hspX and pSHigh, with and without that stress condition. Herein lies another
problem in that any differences in growth rate between the strains used in the
experiment will mask a significant result. There are several reasons that this may
occur, such as how long the strain has been stored at -80 oC, the copy number of the
plasmid (in other words how much of the antibiotic resistance gene is expressed)
and the burden of expressed protein on a cell.
A more relative and labour intensive method would have been to use FACS to
determine fluorescence of each cell rather than an entire large culture, when using
conditions which impaired growth. However relating this to a HTS assay would be
near impossible.
Chapter Four: Conditions of TCS controlled Gene Expression
100
4.3.2 Expression of the SenX3/ RegX3 dependent phoA promoter
The activation of the SenX3/RegX3 controlled phoA promoter was demonstrated in
two conditions; phosphate starvation and magnesium depletion. The former
condition was anticipated based on f what is known about phoA’s role in phosphate
metabolism; however the result from adding magnesium chelator EDTA was not.
There are a number of theories as to why this may be the case, none of which we
can validate from this experiment alone.
Firstly, EDTA is a major chelator of magnesium, but it also chelates a number of
other cations in media including calcium. To conclude that this effect is a direct result
of magnesium starvation is an over-simplification. One could conclusively show this
by setting up a minimal media depleted of magnesium and compare and contrast the
result.
Another theory is that EDTA may have some effect on the cell wall integrity of the
mycobacteria, or the phosphate importer/exporter pump system which is affecting
the expression of this gene in some way. It was suggested by Ryndak et al that phoP
mutants were unable to survive in EDTA supplemented media as a result of
detrimental changes in the cell wall caused by this chelator, which could also
explain what is happening in this case 157.
The level of EDTA in media can have an effect on cell density, indicating it presents
a certain amount of stress on a cell. It could be that this gene is upregulated as a
more globally controlled stress response by the cell in addition to the SenX3/RegX3
phosphate specific induction. Another signalling system may well control the
expression of this gene. Once again, the possibility of overlap in genes expressed by
isolated signal transduction systems may be worth considering here 90. The PhoP/
Chapter Four: Conditions of TCS controlled Gene Expression
101
PhoR system is thought to be controlled by magnesium concentration and is
involved in cell wall maintenance, phoA or SenX3/RegX3 could easily be influenced
by this TCS as well as the PST PIT phosphate transport systems.
It is also plausible that this TCS is controlled by more than just phosphate starvation
via multiple ligand binding sites. The RegX3 sensor kinase is not itself membrane
bound, interacting with a phosphate specific transporter (PST) which senses the
external phosphate concentration 108 . Presumably, it is the result of a change in this
transporter which causes dimerization of the sensor kinase and not a direct response
to a reduction in phosphate acting on the kinase itself. So any other ligand affecting
this phosphate transporter, the SenX3 sensor kinase or the interaction between the
two may have downstream effects on the expression of phoA. A protein
phosphatase assay using only the isolated HK and RR of SenX3/ RegX3 would be
one way to show if the histidine kinase responded to magnesium independently of
the PST.
4.3.3 Expression of the MtrB/ MtrA dependent mtrA
The activation of the mtrA promoter was not higher in any of the stress conditions
than in rich media. Since this gene is thought to be essential to M. tuberculosis 101 , it
may also be essential to M. smegmatis. By definition an essential gene is one
required for cell growth; therefore some constitutive expression would be expected in
rich media.
Studies have shown that this gene is induced during intra-macrophage growth. Only
one of the in vitro models of the macrophage or granuloma environment presented
here induced an effect on mtrA expression; EDTA. Activation of mtrA was generally
Chapter Four: Conditions of TCS controlled Gene Expression
102
much lower in minimal media than that observed in rich media. As figure 4.6 shows,
there is very little fluorescence without the addition of EDTA in minimal media. While
this data indicates that EDTA-dependent ion depletion may have an effect on mtrA
activation, this does not conclusively demonstrate that the sensor kinase directly
responds to magnesium.
The inducer of this TCS is still unclear 112, 158 but one suggestion is iron starvation 71.
Rodrigues et al, who profiled iron-responsive gene expression using microarrays,
saw an increase in the expression of mtrA during iron starvation 71. In the current
study, however, the use of an iron chelator EDDA did not seem to render any
increase in mtrA expression. This would be worth exploring, by omitting iron from the
minimal media rather than using a chelator in case the EDDA concentration used in
this study was not optimal and did not chelate all the iron in solution. In order to show
that magnesium or iron is a ligand of the MtrB histidine kinase, further work on the
crystal structure and binding properties of this protein is required. EDTA was used in
this assay to deplete free magnesium from the media, but the possibility exists that it
causes a multitude of effects on cellular morphology independent of specific ion
starvation.
The reporter protein GFPmut2 is relatively stable; consequently endpoint readings in
such an assay will not disclose exactly when the gene is induced. If mtrA is
expressed at a particular point of the growth phase our assay picks up the GFP
expression at the end of the growth assay. Using an unstable variant of GFP, such
as that developed by Blokpoel et al. 2003, may give a better idea of phase
dependent expression of this gene 134.
Chapter Four: Conditions of TCS controlled Gene Expression
103
Our aim of finding a high level of GFP expression for each TCS controlled promoter
was fulfilled with rich media for this TCS. Even though EDTA induced a high level of
expression, its use in high throughput assays was not advantageous as minimal
media gives a much higher level of variance in a 96 wp format.
Another concern was the addition of EDTA to media as this may have a profound
effect on the action of compounds used in library screens. In the end it was decided
that rich media could be used for high throughput (HTP) screening because a more
stable rate of growth could be achieved. Another benefit was that this data could be
compared with other screens using the hsp60 promoter which were also carried out
in rich media.

Chapter Five: Screening Compound Libraries for TCS inhibitors
104
CHAPTER FIVE:
Screening Compound
Libraries for TCS Inhibitors
Chapter Five: Screening Compound Libraries for TCS inhibitors
105
5.1 Introduction
The overall aim of this project was to develop a GFP reporter and optimize
conditions under which TCS controlled genes were highly expressedto develop an
assay which identified compounds which inhibit this sort of signal transduction. In
order to test as many compounds as possible, a high throughput method was
employed, whereby thousands of compounds could be tested for their effect on the
expression of these genes. Using a liquid handler, a large number of compounds
could be added to separate wells of a 96 wp and incubated with M. smegmatis cells
to observe changes in fluorescence. In theory a compound affecting any of the
steps in the phospho transfer from a histidine kinase to response regulator and
consequential DNA binding could cause a reduction in fluorescence driven by the
TCS controlled promoter.
There are numerous benefits of using this whole cell approach to target TCS
compared with isolated protein methods, as mentioned in the introductory chapter.
The main advantage is that a compound inhibiting any reaction in the signal
transduction mechanism may be identified, rather than targeting a single protein.
Compounds which inhibit another target, resulting in a decrease in cell growth, will
also display a decrease in fluorescence. By observing the OD of each well we are
able to identify general cell growth inhibitors and eliminate these from the list of
positive findings.
Another important point is the fact that all known TCSi affect the cell membrane in
addition to any signal transduction inhibitory action. Using this screen, the OD of the
cell suspension is taken into account so compounds which act on the cell in some
Chapter Five: Screening Compound Libraries for TCS inhibitors
106
other fashion, such as a detrimental effects on membrane integrity, will not be picked
up.
A number of compound libraries available were tested for an effect on the activation
of the mtrA promoter, including the LOPAC, Spectrum Collection, NIH diversity
collections and a library of natural compounds isolated from marine organisms which
will be known as the NIWA collection. MtrB/ MtrA was selected as it showed high
levels of expression in rich media without the addition of growth inhibitors such as
EDTA. This meant that we could expect a uniform growth rate and limited interaction
between compounds and the chelator. One compound library, the LOPAC library,
was screened against phoA driven expression, but as the results will show, the
difference between phoA-induced expression and promoterless expression of GFP
from pSHigh was too variable in this high throughput format to discern differences in
fluorescence as a result of a compound interaction with the SenX3/ RegX3 TCS. The
oxygen starvation assay, which was described in chapter 4, did not translate well to
a 96 wp format. It was not possible to obtain a high level of fluorescence from the
hspX promoter that was uniform across the plate by increasing the volume of liquid
in each well and creating an airtight seal.
In order to ascertain that there was no inhibition from the solvent used to dissolve the
compound libraries, a negative control was included containing the same volume of
DMSO added to two wells of each plate instead of a compound. As a positive
control, to show the effect of compounds which inhibit cell growth outright, antibiotics
were added to two wells of each plate.
Chapter Five: Screening Compound Libraries for TCS inhibitors
107
5.2 Results
5.2.1 Compound Library Screens against mtrA expression
5.2.1.1 Spectrum Library against mtrA expression
Fluorescence (F) and OD data were plotted on a scatter graph to reveal any
changes in F without a change in OD, shown in figure 5.1. If a compound inhibits
growth of the cells it will also lead to a decrease in F due to the reduction in cell
number per well so we were looking for compounds which act on F alone. For each
library, the median Fand OD readings are shown as the X and Y axes respectively
so that as a rough guide compounds in the top left quarter of each graph could be
considered to have an effect on promoter driven GFP expression levels. It was
hoped that positive control values, displaying no effect on OD or F, would be
presented in the top right quarter and negative controls, affecting OD and F would be
observed in the bottom left corner.
Figure 5.1 shows a high level of variance in F, indicating that a number of
compounds may affect either cell density or mtrA expression. In order to select only
those with an effect on mtrA expression, ten outliers from the group of points were
manually selected for re-testing. These are displayed by a circle on the graph and
named in table 5.1.
There is a large group of compounds centred on the median mark for both F and
OD. They display a lower level of both F and OD than the positive control values in
the top right.
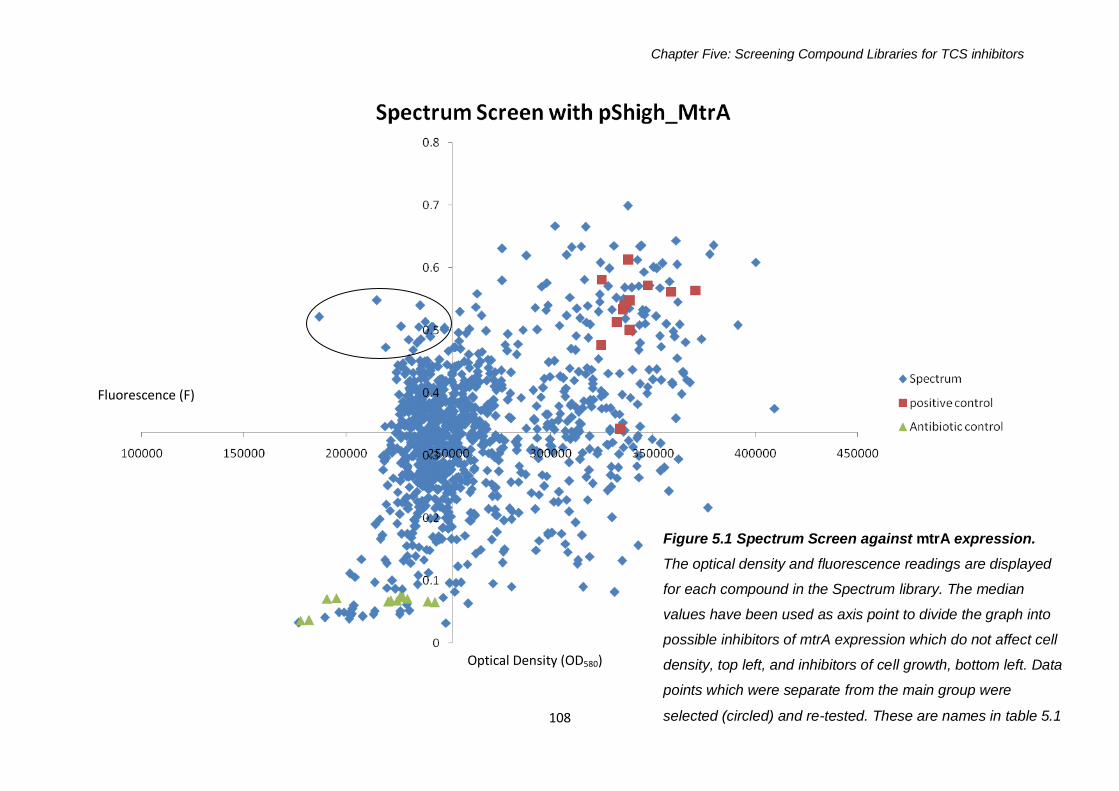
Chapter Five: Screening Compound Libraries for TCS inhibitors
108
Figure 5.1 Spectrum Screen against mtrA expression.
The optical density and fluorescence readings are displayed
for each compound in the Spectrum library. The median
values have been used as axis point to divide the graph into
possible inhibitors of mtrA expression which do not affect cell
density, top left, and inhibitors of cell growth, bottom left. Data
points which were separate from the main group were
selected (circled) and re-tested. These are names in table 5.1
Fluorescence (F)
Optical Density (OD580)

Chapter Five: Screening Compound Libraries for TCS inhibitors
109
Because the mtrA gene target is fairly specific, we assume that not all of these
compounds are affecting the TCS. It is more likely that they affect cell growth in
some other way giving a lower reading of F. The values circled stand out from the
main group in that they do not display a lower OD than the positive control values,
but display a lower F and are not part of the large group of compounds in the median
range. The names, formulae and sources of these compounds are displayed in table
5.1, none of which are known to be signal transduction inhibitors.
NAME Formula Bioactivity Source F OD580
STIGMASTEROL C29H48O soya and calabar beans;
186735 0.521
CITICOLINE C14H26N4O 11P2
cognition enhancer,
cytidine-5'-diphosphocholine
214927 0.547
CARNOSIC ACID C20H28O4 Salvia spp, Rosmarinus officinalis
219330 0.472
TETRAHYDRO
GAMBOGIC ACID C38H48O8 derivative 226869 0.506
PRISTIMEROL C30H42O4 derivative of pristimerin
230552 0.485
7-OXO
CHOLESTERYL
ACETATE
C29H46O3 Cliona copiosa 232658 0.469
RHODOMYRTOXIN
B C24H28O7 Rhodomyrtus
macrocarpa 234508 0.479
AUSTRICINE C15H18O4 Anti inflammatory
Compositae 235476 0.505
BAICALEIN C15H10O5 antiviral (HIV)
Scutellaria baicalensis
236264 0.539
METHOPRENE (S) C19H34O3 Ecto parasiticide
synthetic 236431 0.486
POSITIVE CONTROL 339962 0.528 NEGATIVE CONTROL 214974 0.064
Table 5.1: Spectrum Library Candidates. Names and descriptions of compounds
considered for re-testing from Spectrum collection with their F and OD values from the initial
screen.
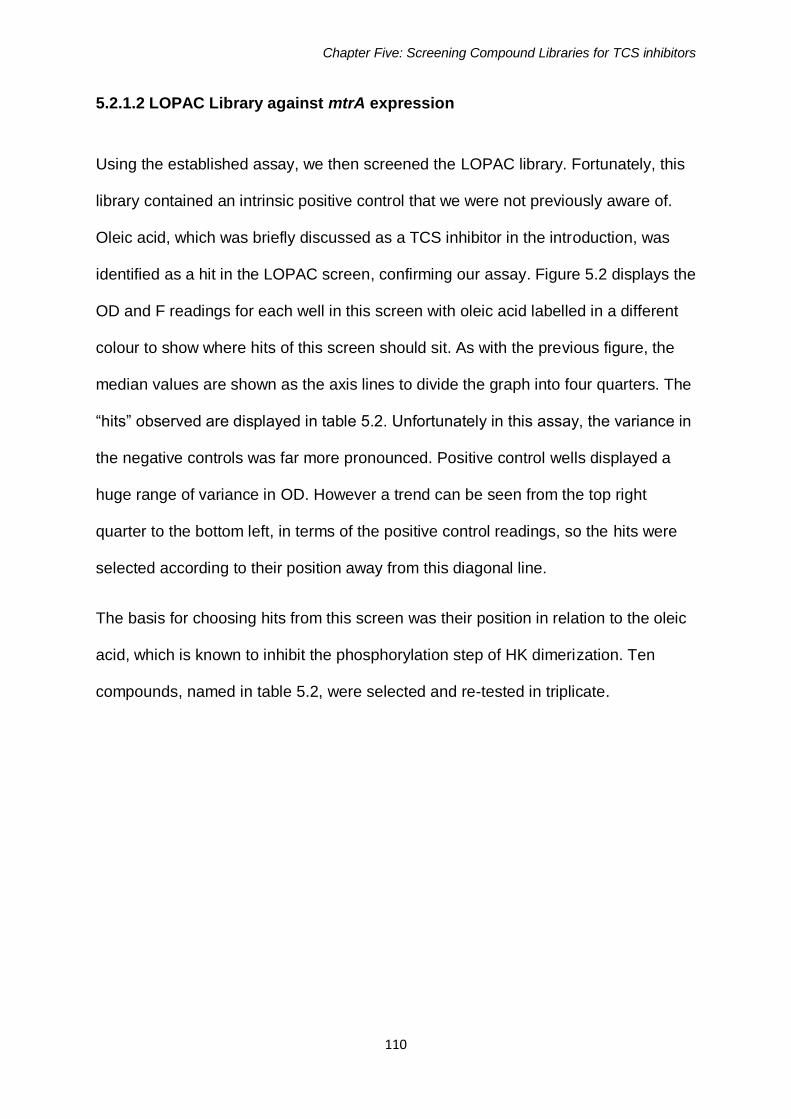
Chapter Five: Screening Compound Libraries for TCS inhibitors
110
5.2.1.2 LOPAC Library against mtrA expression
Using the established assay, we then screened the LOPAC library. Fortunately, this
library contained an intrinsic positive control that we were not previously aware of.
Oleic acid, which was briefly discussed as a TCS inhibitor in the introduction, was
identified as a hit in the LOPAC screen, confirming our assay. Figure 5.2 displays the
OD and F readings for each well in this screen with oleic acid labelled in a different
colour to show where hits of this screen should sit. As with the previous figure, the
median values are shown as the axis lines to divide the graph into four quarters. The
“hits” observed are displayed in table 5.2. Unfortunately in this assay, the variance in
the negative controls was far more pronounced. Positive control wells displayed a
huge range of variance in OD. However a trend can be seen from the top right
quarter to the bottom left, in terms of the positive control readings, so the hits were
selected according to their position away from this diagonal line.
The basis for choosing hits from this screen was their position in relation to the oleic
acid, which is known to inhibit the phosphorylation step of HK dimerization. Ten
compounds, named in table 5.2, were selected and re-tested in triplicate.
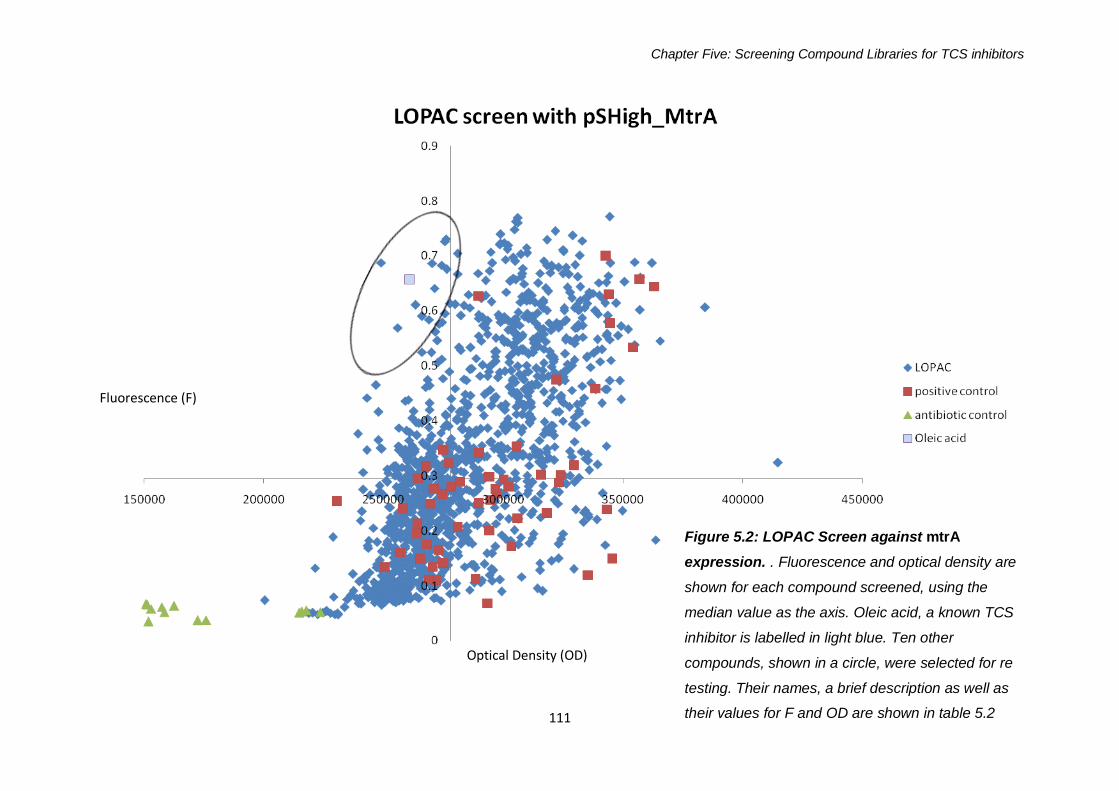
Chapter Five: Screening Compound Libraries for TCS inhibitors
111
Figure 5.2: LOPAC Screen against mtrA
expression. . Fluorescence and optical density are
shown for each compound screened, using the
median value as the axis. Oleic acid, a known TCS
inhibitor is labelled in light blue. Ten other
compounds, shown in a circle, were selected for re
testing. Their names, a brief description as well as
their values for F and OD are shown in table 5.2
Fluorescence (F)
Optical Density (OD)

Chapter Five: Screening Compound Libraries for TCS inhibitors
112
Positive Control 296366 0.290
Negative Control 171356 0.053
Table 5.2 LOPAC Library Candidates. Names and descriptions of compounds considered
for re-testing from LOPAC collection with their F and OD values from the initial screen. This
information was obtained from Sigma.
5.2.1.3 NIH Library against mtrA expression
The NIH screen was the largest compound library tested in this study. This library
has mostly been used to test potential anti-neoplastic agents and can be obtained
from the NIH. It includes a large number of unknown compounds as well as a
number of natural products. Figure 5.3 displays the F and OD of each compound
tested with median values used as the X and Y axis in each case. Positive control
values are mostly isolated to the top right hand corner, while antibiotic control values
are in the bottom left. Hits from the top left hand corner were selected for re-testing.
NAME Class Description F OD
PROTRIPTYLINE
HYDROCHLORIDE Adrenoceptor Norepinephrine reuptake
blocker 243046 0.441
ODQ Cyclic Nucleotides Potent and selective NO-sensitive guanylyl cyclase inhibitor
246851 0.464
N - ACETYLPROCAINAMIDE
HYDROCHLORIDE Na+ Channel Blocks Na+ channels and
appears to have Class III anti-arrhythmic activity; metabolite of Procainamide
247850 0.416
PARGYLINE
HYDROCHLORIDE Neurotransmission MAO inhibitor, relatively
selective for MAO-B 249006 0.687
NILUTAMIDE Hormone Antiandrogen 255868 0.569
OLEIC ACID Phosphorylation Activates protein kinase C in hepatocytes; uncouples oxidative phosphorylation
260912 0.656
XANTHINE AMINE
CONGENER Adenosine A1 Adenosine receptor
antagonist 263300 0.610
L-ARGININE Nitric Oxide Nitric oxide precursor 266069 0.590
OXOTREMORINE
METHIODIDE Cholinergic Nonselective muscarinic
acetylcholine receptor agonist 266106 0.52
S- (P-AZIDOPHENACYL) GLUTATHIONE
Multi-Drug Resistance
Glyoxalase and glutathione S-transferase inhibitor
269002 0.583

Chapter Five: Screening Compound Libraries for TCS inhibitors
113
Table 5.3 shows the names (if known), formula, molecular weight and F and OD
values of those compounds labelled “hits” for this screen. This information was
obtained from the Developmental Therapeutics Programme (DTP) website which
can be found at http://www.dtp.nci.nih.gov/docs/dtp_search.html.
Most of the compounds labelled as hits for this screen have not been named, with
the exception of Antineoplastic-92893 and Buclizine Hydrochloride, as shown in
table 5.3. Consequently, there was little information available about these
compounds other than their structure and formula.
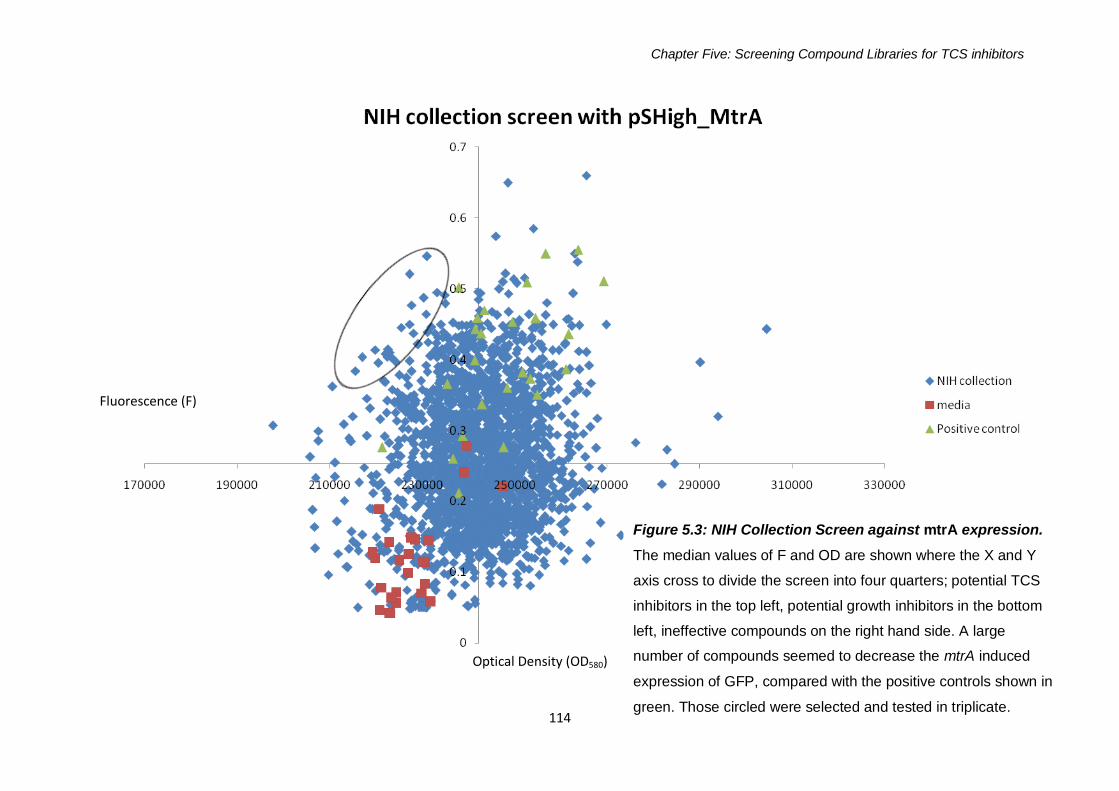
Chapter Five: Screening Compound Libraries for TCS inhibitors
114
Figure 5.3: NIH Collection Screen against mtrA expression.
The median values of F and OD are shown where the X and Y
axis cross to divide the screen into four quarters; potential TCS
inhibitors in the top left, potential growth inhibitors in the bottom
left, ineffective compounds on the right hand side. A large
number of compounds seemed to decrease the mtrA induced
expression of GFP, compared with the positive controls shown in
green. Those circled were selected and tested in triplicate.
Fluorescence (F)
Optical Density (OD580)
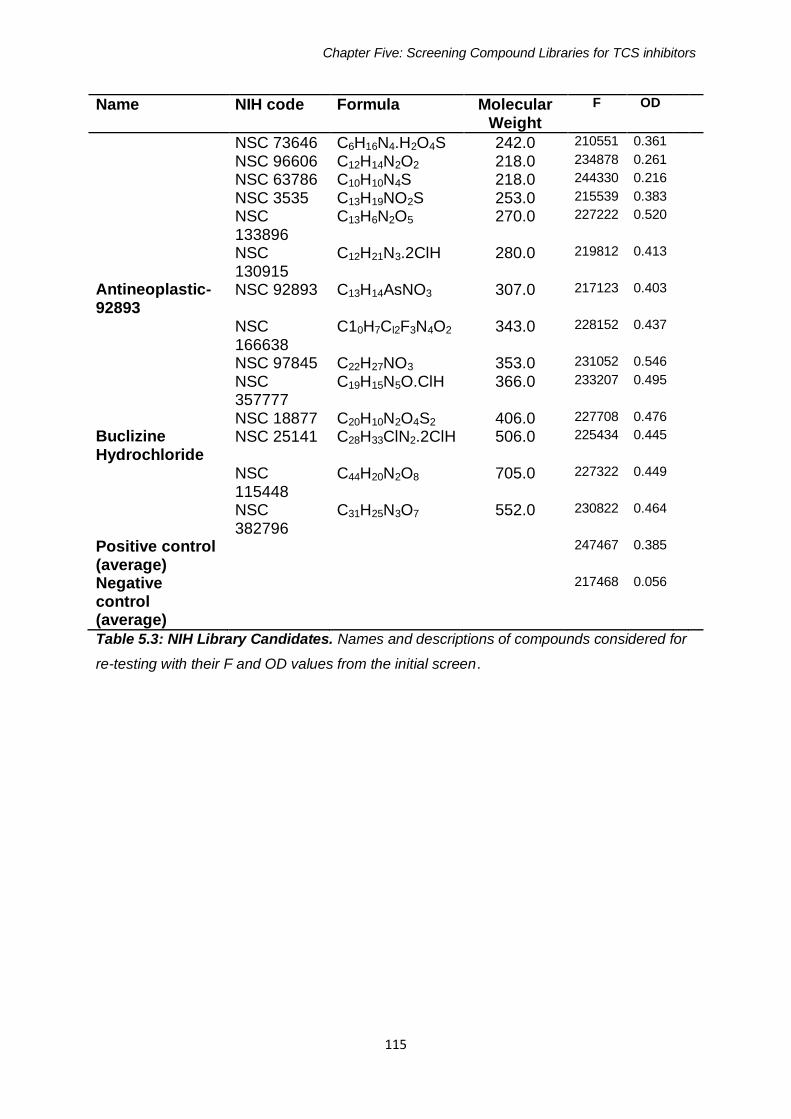
Chapter Five: Screening Compound Libraries for TCS inhibitors
115
Name NIH code Formula Molecular Weight
F OD
NSC 73646 C6H16N4.H2O4S 242.0 210551 0.361 NSC 96606 C12H14N2O2 218.0 234878 0.261 NSC 63786 C10H10N4S 218.0 244330 0.216 NSC 3535 C13H19NO2S 253.0 215539 0.383 NSC
133896 C13H6N2O5 270.0 227222 0.520
NSC 130915
C12H21N3.2ClH 280.0 219812 0.413
Antineoplastic- 92893
NSC 92893 C13H14AsNO3 307.0 217123 0.403
NSC 166638
C10H7Cl2F3N4O2 343.0 228152 0.437
NSC 97845 C22H27NO3 353.0 231052 0.546 NSC
357777 C19H15N5O.ClH 366.0 233207 0.495
NSC 18877 C20H10N2O4S2 406.0 227708 0.476 Buclizine Hydrochloride
NSC 25141 C28H33ClN2.2ClH 506.0 225434 0.445
NSC 115448
C44H20N2O8 705.0 227322 0.449
NSC 382796
C31H25N3O7 552.0 230822 0.464
Positive control (average)
247467 0.385
Negative control (average)
217468 0.056
Table 5.3: NIH Library Candidates. Names and descriptions of compounds considered for
re-testing with their F and OD values from the initial screen.
Chapter Five: Screening Compound Libraries for TCS inhibitors
116
5.2.1.4 NIWA collection against mtrA expression
A collection of marine extracts was also tested against the mtrA promoter. This
collection contained a smaller number of samples than any other library and
displayed no decrease in F while maintaining the OD of the culture compared with
positive controls, as displayed in figure 5.4. The antibiotic controls indicate that a
number of extracts had an effect on the growth of cells. All the other libraries used a
constant concentration of 20 µM for all compounds but the NIWA collection was
composed of crude marine extracts, so the final concentration of active compounds
is unknown.

Chapter Five: Screening Compound Libraries for TCS inhibitors
117
Figure 5.4: NIWA Collection Screen against
mtrA expression. Some extracts displayed
growth inhibition with F and OD values close to
that of the antibiotic controls. No extract seemed
to affect F independent of cell density, since
none show an F value much lower than positive
controls, labelled in red.
Fluorescence (F)
Optical Density (OD580)
Chapter Five: Screening Compound Libraries for TCS inhibitors
118
5.2.2 Drug screens with pSHigh_phoA
The phoA promoter-driven F of GFP is relatively lower than that of MtrA. This
presented a problem, as the variance in F between wells was very high. For library
screens with phoA, an additional negative control was used to indicate F of the
promoterless pSHigh plasmid construct in the same EDTA supplemented media. An
un-induced phoA control was not really practical in this screen, since these cells
would grow at a different rate to the cells grown in EDTA supplemented media.
There were no significant results seen in this screen, as changes in intensity
between positive and negative controls could not be discerned.
5.2.2.1 LOPAC library screen with phoA
Figure 5.5 shows the phoA activation and OD against the LOPAC library. Although
the position of the oleic acid control is in the top left quarter, as expected, a large
number of compounds seem to cause a decrease in F to levels lower than the
promoterless control. This could indicate that the use of EDTA imposes conditions
which make the cells more susceptible to compounds that would not necessarily give
the same result in rich media. This construct was also used to screen against the
NIWA collection with a similar result (this data is not shown).

Chapter Five: Screening Compound Libraries for TCS inhibitors
119
Figure 5.5: LOPAC Screen against phoA expression.
The F and OD values of this screen are displayed, with
median values marking X and Y axis crossing points. The
positive controls displayed a higher level of fluorescence
than the promoterless construct, however most values from
the LOPAC data was also lower than the negative pSHigh
control. Phosphorylation inhibitor oleic acid, shown in light
blue is surrounded by a large number of compounds rather
than as an outlier.
Fluorescence (F)
Optical Density (OD580)

Chapter Five: Screening Compound Libraries for TCS inhibitors
120
5.2.2.2 Comparison of mtrA and phoA LOPAC screens:
Even though the phoA screen was not successful in showing any hits, the oleic acid
control was where we expected it to be; the top left hand quarter of the graph. In
order to determine whether any of the proposed hits from the mtrA LOPAC screen
fell in this quadrant during the phoA screen they have been represented on the same
graph as the previous figure 5.5 in a different colour. If any of the compounds
highlighted in the mtrA screen were not specific to the MtrB/ MtrA TCS and could
inhibit different TCS as well, they might show up in the top left hand corner of the
phoA screen as well. Figure 5.6 shows the same data as figure 5.5, with the hits
from the mtrA screen highlighted in red and oleic acid in black and labelled.
Figure 5.6 phoA and mtrA
LOPAC screen
Figure 5.6: Identification of mtrA hits on LOPAC Screen against phoA. The F and OD
values of this screen are displayed, with median values marking X and Y axis crossing points.
Compounds which gave a lower F reading in the mtrA screen are shown in red. A few values
lie in the bottom left hand corner, indicating they may inhibit growth under the conditions of this
screen, however none lie far to the left of the top corner which would signify that they are non-
specific TCS inhibitors.
Chapter Five: Screening Compound Libraries for TCS inhibitors
121
Only one of the compounds from the LOPAC screens showed inhibition of both mtrA
and phoA driven promoter expression. This indicated that any of the other potential
inhibitors identified during the mtrA screen were specific to this one out of the two
signal relay system tested. It is also likely that this method of extrapolating hits may
inadvertently overlook compounds with TCS inhibitory properties because only a
small number of points were selected from each graph. Another factor is that
compounds which conferred a low F reading, as well as a low OD580 reading are left
out, as it was assumed these compounds are cytotoxic.
5.2.3 Validation of hits from library screens in triplicate
In order to verify that the compounds identified as hits from the library screens
inhibited mtrA activation, selected compounds from each screen (named in tables
5.1 – 5.4) were re-tested in triplicate. For this validation assay the positive control
promoter hsp60 and the promoterless pSHigh plasmids were included. The positive
control would show whether the effect of the compound was a result of a global
decrease of gene expression in the cell, or via an MtrA specific mechanism. Only
one of the compounds tested in triplicate, oleic acid, displayed a reproducible effect
on mtrA expression. They also displayed no change with respect to hsp60
expression, indicating that hits selected from each screen had been false positive
results and not inhibitors of gene expression.
Chapter Five: Screening Compound Libraries for TCS inhibitors
122
5.2.4 Validation of whole cell based screen with oleic acid and palmitoleic acid
dilution series
None of the compounds picked up as hits in the library screens gave a significant
decrease in mtrA expression during a validation screen, where each compound was
tested in triplicate. In order to show that this screen could potentially identify TCSi,
had any been present in the libraries tested, a series of oleic acid and palmitoleic
acid concentrations were tested for modulation of mtrA activation. Figures 5.7 and
5.8 show the mtrA expression in the presence of palmitoleic and oleic respectively at
three different concentrations of the fatty acids. These graphs show that the mtrA
promoter driven GFP expression decreases with the concentration of both oleic and
palmitoleic acid added, while the effect on the hsp60 promoter expression is
unchanged.

Chapter Five: Screening Compound Libraries for TCS inhibitors
123
Figure 5.7: Oleic Acid dilution series against mtrA expression. A) MtrA and B) hsp60
expression under the influence of the oleic acid. The effect of final concentrations of 50, 25
and 12.5 µM of oleic acid on the expression of mtrA is dose dependent as the F of the
reporter decreases with concentration, while hsp60 expression does not change with
concentration. Error bars indicate the standard deviation between triplicate cultures.
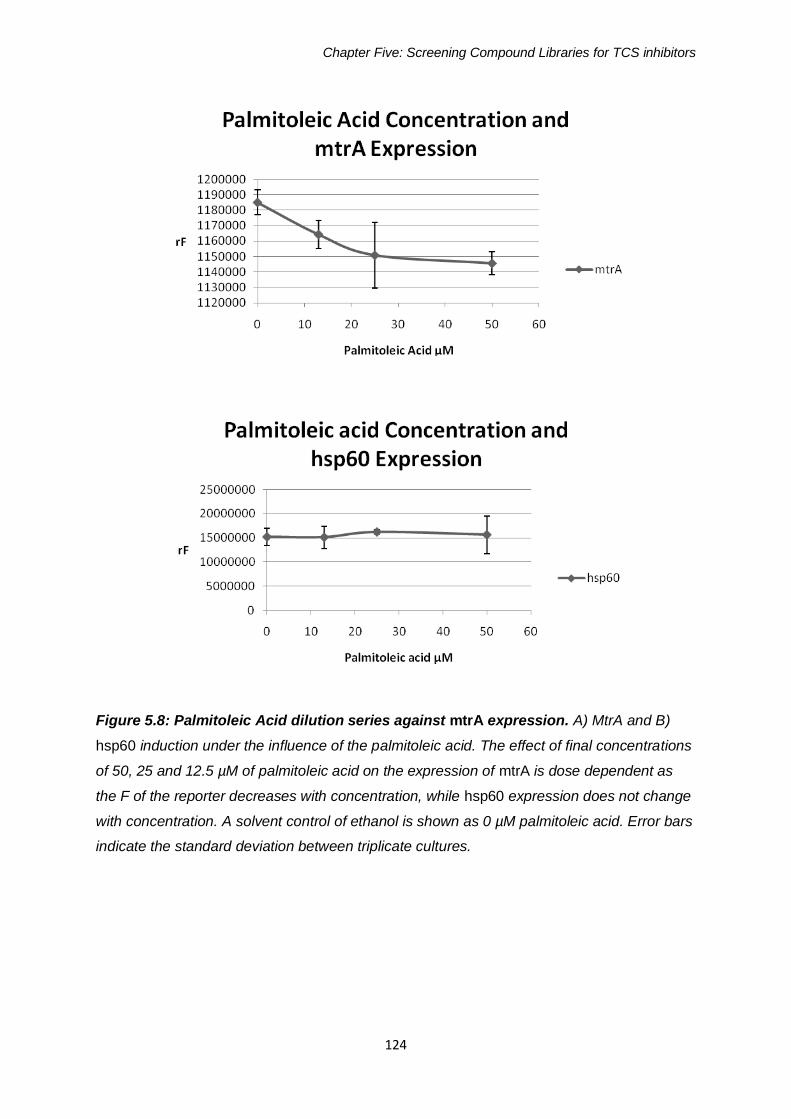
Chapter Five: Screening Compound Libraries for TCS inhibitors
124
Figure 5.8: Palmitoleic Acid dilution series against mtrA expression. A) MtrA and B)
hsp60 induction under the influence of the palmitoleic acid. The effect of final concentrations
of 50, 25 and 12.5 µM of palmitoleic acid on the expression of mtrA is dose dependent as
the F of the reporter decreases with concentration, while hsp60 expression does not change
with concentration. A solvent control of ethanol is shown as 0 µM palmitoleic acid. Error bars
indicate the standard deviation between triplicate cultures.
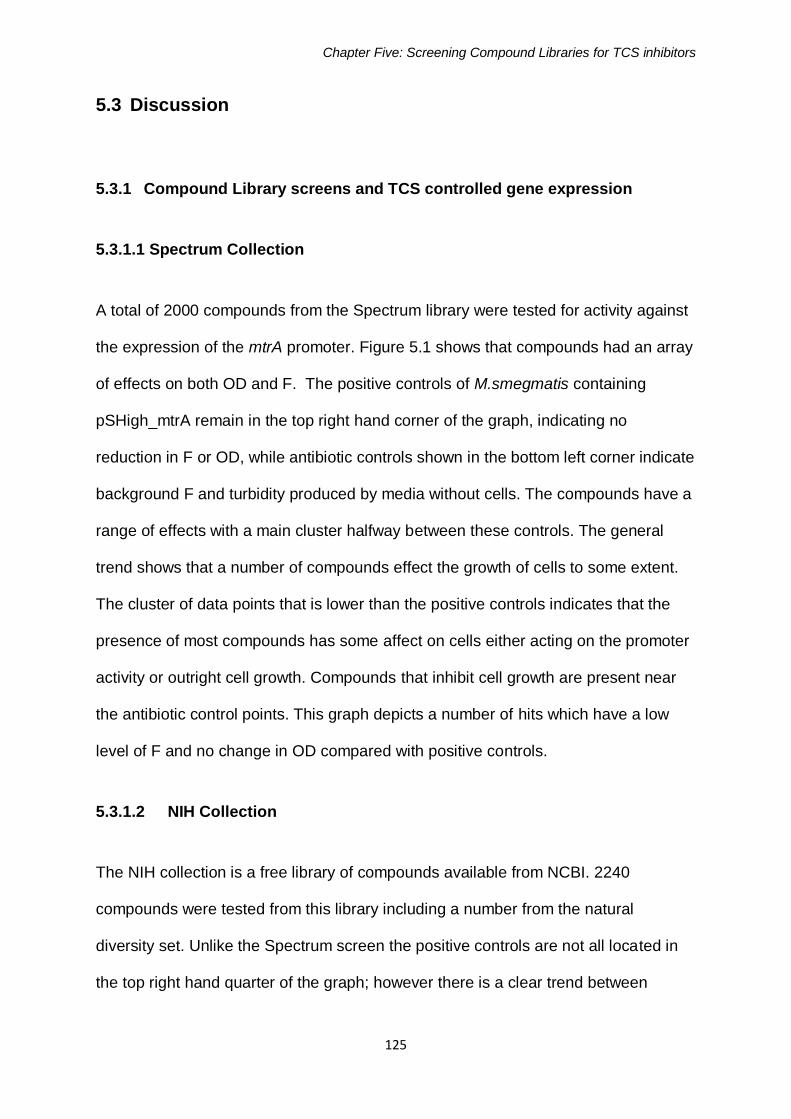
Chapter Five: Screening Compound Libraries for TCS inhibitors
125
5.3 Discussion
5.3.1 Compound Library screens and TCS controlled gene expression
5.3.1.1 Spectrum Collection
A total of 2000 compounds from the Spectrum library were tested for activity against
the expression of the mtrA promoter. Figure 5.1 shows that compounds had an array
of effects on both OD and F. The positive controls of M.smegmatis containing
pSHigh_mtrA remain in the top right hand corner of the graph, indicating no
reduction in F or OD, while antibiotic controls shown in the bottom left corner indicate
background F and turbidity produced by media without cells. The compounds have a
range of effects with a main cluster halfway between these controls. The general
trend shows that a number of compounds effect the growth of cells to some extent.
The cluster of data points that is lower than the positive controls indicates that the
presence of most compounds has some affect on cells either acting on the promoter
activity or outright cell growth. Compounds that inhibit cell growth are present near
the antibiotic control points. This graph depicts a number of hits which have a low
level of F and no change in OD compared with positive controls.
5.3.1.2 NIH Collection
The NIH collection is a free library of compounds available from NCBI. 2240
compounds were tested from this library including a number from the natural
diversity set. Unlike the Spectrum screen the positive controls are not all located in
the top right hand quarter of the graph; however there is a clear trend between
Chapter Five: Screening Compound Libraries for TCS inhibitors
126
positive and negative controls. A total of 15 hits were selected for validation from this
screen.
5.3.1.3 NIWA samples
A selection of marine samples donated by the National Institute of Water and
Atmospheric Research (NIWA) in Wellington were also tested in this manner. This
screen contained 290 samples, none of which gave an F reading lower than the
positive controls. It did produce a number of data points with F and OD inhibition
which will be used to verify future work with this library in a search for anti-
mycobacterial drugs.
5.3.1.4 LOPAC library
The LOPAC collection, Library of Pharmacologically Active Compounds, available
from Sigma Aldrich includes 1280 compounds. This screen was carried out for both
mtrA and phoA driven GFP expression. Ten compounds were selected and retested
with the mtrA construct. A major benefit of this library screen was the presence of a
phosphorylation inhibitor oleic acid, displayed separately on figures 5.5 and 5.6. This
compound was identified as a hit for the mtrA screen, conveniently providing an
intrinsic control to our assay. The phoA screen shows oleic acid in the top left quarter
of the graph but not as a hit as in the mtrA screen.
The phoA screen was less successful in that the difference between EDTA induced
pSHigh_phoA and promoterless pSHigh was not well defined. A majority of the data
points fell below this negative control, indicating there was some other interaction
occurring between compounds and GFP expression.
Chapter Five: Screening Compound Libraries for TCS inhibitors
127
Interestingly none of the mtrA hits identified were common to inhibitors on the phoA
screen, indicating the library search had not successfully unearthed a non-specific
inhibitor of HK to RR phosphotransfer. A recent study has highlighted the
relationship between drug efficacy and the conditions in which cells are grown 142. It
has already been established that an anti-TB drug metronidazole is much more
effective in hypoxic conditions 159. These considerations add a level of complexity to
drug screening as most in vitro drug screening is carried out in a specific media, and
results can vary if these parameters are changed.
5.3.2 Discussion on the Screen
There a number of noteworthy limitations to this screen. Firstly the variance
observed between samples when dealing with a multitude of compounds in this
manner. The presence of outliers in both directions of the graph indicate that there is
a significant chance of error that can come from a number of sources, from human
handling and data processing error to technological errors such as pinning of
compounds or reading of wells, the latter obviously far less likely. False positive
“hits” may arise from a number of scenarios
Contamination of a well in the assay which was not picked up upon
inspection of plate, giving a high OD but no F
If the compound has an effect on the GFP protein processing at any point
a misfolded protein may not give off the same F as positive controls
Coloured compounds can alter the OD reading of its well; a highly
coloured compound may give a reading which indicates high cell viability
when the chemical has in fact inhibited growth
Chapter Five: Screening Compound Libraries for TCS inhibitors
128
This data shows that the best results from the HTP screen did not translate to a
decrease in F when repeated in triplicate. The high level of variance displayed in
control and compound containing wells suggests that there is a loss of uniformity
when working in a 96 wp set up in terms of OD and F. The validation results call into
question the methods used during the HTP screen, and whether adequate
parameters had been set. Given the high level of variance seen in a HTP screen with
such a large number of compounds, the hits listed may either be false positives from
the initial screens or too variable in the validation to be observed.
One concern with using the mtrA promoter in these screens stems from the fact that
mtrA may be essential in M. tuberculosis. It has not been previously described as an
essential gene in M. smegmatis; however it brings to light the concept that an
inhibitor of this system may display an effect on cell growth if it is indeed essential.
However, the data from both LOPAC screens and the oleic and palmitoleic acid
experiments indicate that at a low concentration this inhibitor does not affect the cell
density.
One way that this result may have been improved would have been to use another
expression condition for mtrA; minimal media with EDTA. The decision to use rich
media over minimal media stemmed from an observation that cells grew with much
more uniformity in the former. As observed with the phoA promoter screens, minimal
media gives a lower dynamic range making the difference between induced and
uninduced GFP expression less pronounced.
Figure 6.1 Validation assay: MtrA Figure 6.2 Validation assay: MtrA
Chapter Five: Screening Compound Libraries for TCS inhibitors
129
5.3.3 Validation of the screen with cis fatty acids
Figures 5.7 and 5.8 show a dose dependent decrease in F in the presence of oleic
and palmitoleic acid. This trend is not seen in F which is restricted to the mtrA and
not the hsp60 promoter indicating that their mode of action is not on the GFP
reporter itself or general global gene expression.
Oleic and palmitoleic acids are thought to inhibit phosphorylation of ATP to ADP in
the histidine kinase activation 160. They occur naturally in human, animal and plant
fat and do not inhibit bacterial growth 130. This activity was discovered in a kinase
involved in sporulation named KinA of B. subtilis. The mode of action of cis
unsaturated fatty acids is not known, except that they inhibit KinA –ATP binding in a
non competitive fashion with an IC50 of around 20 µM 160. Oleic acid is a component
of mycobacterial media OADC, and must be broken down by the bacteria as an
energy source, so its inhibitory activity may only act at a certain concentration, or in a
particular arrangement of the fatty acid.
Oleic acid has also been described as an uncoupler of mitochondrial oxidative
phosphorylation and an activator of protein kinase C 161, 162. The full extent of its
activity on phosphorylation reactions in mycobacteria is unknown.
This data shows in principal that using a serial dilution setup with three strains
containing pSHigh_MtrA, pSHigh_hsp60 and pSHigh each in triplicate is a method
which will illuminate TCSi from a library of compounds. The screen in this study
aimed to test as many compounds as possible for activity; in other words, one
compound per well at one concentration. This data clarifies the need for compounds
to be tested in a dilution series and in triplicate. This method is more time consuming
Chapter Five: Screening Compound Libraries for TCS inhibitors
130
and probably reduces the number of compounds which can be tested per screen, but
clearly yields a more reproducible result.
Previous work in HTS for active compounds has developed methods for statistical
validation of primary screening 142, 163. This method determines the validity of hit
selection in an assay based on a number of factors. In our assay only one hit was
validated, indicating that this screen requires a significant amount of optimisation in
order to obtain an acceptable hit rate or z score.

Chapter Six: General Discussion and Future Directions
131
Chapter Six:
General Discussion and
Future Directions

Chapter Six: General Discussion and Future Directions
132
6.1 Summary of Findings
The primary accomplishments of this thesis were the optimisation of a high copy
number plasmid to report gene expression, the application of this methodology to
TCS controlled genes and an analysis of the expression of these genes under
stress. This led to a number of chemical library screens, in search of compounds
which inhibit the TCS signal transduction. In theory, compounds could be potential
TCS inhibitors if they exert a drop-off in TCS controlled gene expression compared
with what is normally expected under particular conditions. Since they change the
eventual outcome of the signalling mechanism i.e., the induction of a particular gene,
these compounds could be affecting any part of the TCS signalling mechanism.
The insertion of the oriM high mycobacterial origin of a replication and the gfpmut2
gene resulted in the successful optimisation of a reporter plasmid. The results in
Chapter Three demonstrate that the presence of the plasmid provides a high level of
F under the influence of the hsp60 promoter without causing any obvious detrimental
effects on M. smegmatis cells. This plasmid was further equipped with alternative
promoters which were selected after a literature search of TCS controlled genes;
namely hspX, phoA and mtrA.
The activation of these genes was explored under a number of stress conditions
including oxygen and nutrient starvation, antibiotic stress, heat shock, cold shock,
SDS and ethanol. Out of all the stress conditions tested, the most noteworthy effect
on the expression of hspX was seen during oxygen starvation.
Chapter Six: General Discussion and Future Directions
133
PhoA activation was observed under phosphate starvation and magnesium
starvation, by chelation with EDTA. The mtrA promoter gave high levels of
expression in rich media as well as under the influence of EDTA. The effect on hspX
during oxygen starvation and phoA during phosphate starvation was expected given
their proposed function. The induction of both phoA and mtrA under the influence of
magnesium starvation lead to a number of new questions about the influence of
magnesium, or at least the chelator EDTA, in relation to the SenX3/ RegX3 and
MtrB/ MtrA systems.
A number of assumptions have been made about the conditions experienced by AFB
within the macrophage and granuloma which cannot be truly replicated in vitro. It is
known that mtrA is induced after macrophage infection in M. tuberculosis and this
result brings to light the possibility that magnesium concentration or some other
effect of the chelating agent on media may be involved in the MtrB sensor kinase
activation.
Chemical library screens were carried out using the mtrA reporter expression as an
indicator of TCS inhibition, as this promoter produced high levels of F in rich media.
A number of compounds decreased the expression of mtrA after the incubation
period of the library screens. Re-testing of these compounds in triplicate did not
confirm a considerable difference in expression. We did, however, unearth a known
TCSi in the LOPAC library which was identified as a hit in this screen. Further
experiments on this compound and palmitoleic acid, another cis fatty acid, indicated
that the F induced by mtrA was reduced in a dose dependent manner in a serial
dilution assay.
Chapter Six: General Discussion and Future Directions
134
Importantly, the screen identified an intrinsic TCSi control, oleic acid, out of
thousands of compounds tested. This compound has not previously been shown to
inhibit any TCS in mycobacteria.
6.2 Critique of the screen
There are a number of benefits to this screen compared with isolated protein
methods. In theory any inhibition of the signal transduction mechanism will be
highlighted by this screen. The method can be carried out in a high through put
manner to test thousands of compounds at a time in one assay.
This method could be adapted to other targets. As well as finding inhibitors of
transcriptional control, the use of GFP translational fusions can be applied to
discover inhibitors of proteins which are controlled by other means.
A significant point here is the ability to test for inhibitors of genes that may be
essential. Few methods can directly target a gene which the organism cannot live
without, but the reduction in mtrA promoter activation observed as a result of oleic
acid showed that changes in gene expression can be observed in this way without
completely inhibiting cell growth. One the other hand, this will depend on the MIC of
the inhibitor in question and the concentration of compounds used in a screen. In all
likelihood a successful candidate drug which inhibits TCS would also decrease the
cell density of a population and thus be missed out in our screen.
However, more potent inhibitors may not have been picked up by our methods. This
situation could be remedied by a more relative measure of F, by recording
information on a single cell basis with FACs. It comes down to a compromise
between high throughput and relativity of gene expression. By using a whole cell
Chapter Six: General Discussion and Future Directions
135
assay thousands more compounds can be screened than in a low throughput single
cell counting method such as FACS.
The use of a reporter of gene expression, however accurate, is essentially an
indirect method of testing two component signal transduction. We do not know how
many other regulators are acting on the genes in this study. Previous work has
shown that all of the selected genes contained RR binding sites within their
promoters, but this does not exclude the possibility of other factors such as universal
sigma factors 100, 108, 150. The mechanisms controlling gene expression are, in all
likelihood, much more complicated than simply one response regulator acting as a
transcription factor on a gene. There are probably multiple levels of regulation for
every gene in an organism’s genome. The constitutively expressed control promoter
is one way of showing if a condition or inhibitor is affecting the expression of a
specific gene; however in practice the control of these important housekeeping
genes could be controlled another way.
Although the TCSi oleic acid was picked up this screen a number of other false
positive results were also picked up using this method. Clearly the level of variance
in terms of both F and OD observed from screens of this size can lead to false
positive results and perhaps screens of this nature should be repeated before
selecting hits to re-test. In order to test as many compounds as possible each library
was only screened once. This meant that there was no way to test the statistical
significance of “hits”. In hindsight, this meant that the screen was not an efficient way
of finding TCS inhibitors. If each library had been tested in triplicate it is likely that the
rate of false positives would have been reduced. Hit selection is an area which
requires significant development in order to obtain an acceptable z score. Our
Chapter Six: General Discussion and Future Directions
136
method for manually selecting compounds based on their position on the scatter plot
did not render an acceptable hit rate as described in other work on HTS analysis 163.
Inevitably, the number of compounds being screened will affect the degree of
accuracy each screen will present, since larger screens give more variable results.
Perhaps the parameters of “hit” selection could be optimised.
One aspect of the screen, which was briefly mentioned earlier, is the relativity of
results in terms of the number of plasmids per cell. As with all plasmid reporter
methods, including xylE expression, one must assume that this remains relatively
constant between strains and conditions. It is generally accepted that using
appropriate controls will balance out any changes in copy number from cell to cell. It
is worth noting here that oriM high increased copy number from 5 to anything
between 32 and 64 copies per cell raises questions about this assumption of
consistency. Large differences in copy number of the plasmid from cell to cell may
be the cause of the variance seen in these screens. The benefits of this new origin of
replication are convincing (Chapter One), but the resulting variance is something that
needs to be considered.
In this study, over 4500 compounds from a number of sources were screened, a fair
few less than the 25,000 compounds tested to discover the first TCS inhibitors 127. A
possible future direction in this area could be the study of fewer compounds after a
more rational method of compound selection. For example, selecting compounds or
classes of compounds identified using an in silico screening approach based on the
protein structure of the target. The current work highlighted the potential of cis fatty
acids, so perhaps this is a class of compounds worth developing.
Chapter Six: General Discussion and Future Directions
137
6.3 Future Direction
The identification of oleic acid in the LOPAC assay and the dose dependent
inhibition displayed by oleic and palmitoleic acids indicate that this methodology
could be applied to study more compound libraries against the reporter system.
Before further libraries are tested, there is a substantial amount of optimisation
required in terms of HTS. A number of statistical tests, for example, would help to
indicate an improved hit rate as a result of a more refined selection criteria. As well
as increasing the number of chemicals tested, there is also the possibility that new
TCS controlled genes could be screened in this manner. Other M. smegmatis, M.
bovis BCG or avirulent M. tuberculosis TCS controlled genes could be investigated
using this method of screening.
The observation that cis fatty acids may inhibit the expression of both mtrA and phoA
is an important finding, as this inhibition has so far only been observed in the Bacillus
subtilis KinA protein. The method of action has not yet been elucidated, except that
fatty acids act in a non competitive manner with respect to ATP during
phosphorylation. It would be interesting to solve the crystal structure of MtrB and
compare it with that of KinA for homologous sites.
The large number of compounds screened was achieved in this study using a fast
growing species of mycobacteria. Slow growers would require lengthy assays, but
could also potentially be screened either with entire libraries or a selection of hits
discovered by assays with fast growers.
Chapter Six: General Discussion and Future Directions
138
Another application of these methods is the study of genes induced within the
macrophage. In particular, mtrA expression, which has been previously shown
during macrophage expression, could induce GFP at a much higher level during
intra-macrophage growth. If the difference between induced and un-induced GFP is
more apparent, the level of variance seen in these screens could be reduced.
As well as TCS, other signalling such as Serine Threonine Protein Kinases and one-
component regulators could be selected and screened for in this manner.
DevS/DevR and other dormancy related targets would be highly appropriate targets
to develop in this sort of screen.
PhoP/ PhoR could also be targeted in this manner by analysing the expression of the
gene under its control. The benefits of inhibiting this system would be plentiful, as it
is so important to the survival and virulence of M. tuberculosis. Its significant role in
cell wall maintenance would make any inhibitor capable of knocking out this
signalling mechanism an excellent drug candidate. Even if it did not inhibit growth
outright, its use in combination with other drugs such as cell wall targets could
significantly reduce the treatment time required for TB.
Other parts of this thesis underline the need for further studies into the conditions of
expression of TCS controlled genes. In particular mtrA; how and why this gene is
expressed and its protein product’s function within the cell are all important
questions, due to its significance as an M. tuberculosis essential gene. This work has
revealed a possible condition of its expression to be magnesium starvation. Further
work to validate this may help to understand its function and potential as a drug
target.
Chapter Six: General Discussion and Future Directions
139
There are generally two ways to go about discovering drug targets for a particular
pathogen. We argue that a targeted approach to significant genes involved in
latency, dormancy and survival within a macrophage cell may be a better way to
prevent TB than exploring any and all compounds which affect the growth rate of the
species. For a number of reasons, M. tuberculosis requires a different approach to
drug discovery, compared with rapidly growing pathogens. The high incidence of
drug resistance, its extended incubation and latency period and its apparent switch
to a reductive metabolism make M. tuberculosis a difficult pathogen to eradicate.
Screening for compounds, and selecting “essential” targets by measuring simply how
they affect the level of growth of the organism in rich media is not the best
representation of what the pathogens really cannot survive without in vivo. The mtrA
gene has been labelled essential, however, its role in macrophage infection has also
been established, making it the sort of target which should be explored further.
Similarly, expression of the hspX reporter plasmid represents the switch to a
reductive metabolism, something which makes the pathogen extremely successful.
As a drug target, or an indicator of the cell dormancy program, this gene is highly
useful in the study of latency. Compounds which affect this and other dormancy
related targets could be worthy candidates in the effort to stop TB.
Chapter Six: General Discussion and Future Directions
140
REFERENCES
1. Myers, J.A., Bearman, J.E. & Botkins, A.C. Natural History of Tuberculosis in the Human Body. Diseases of the Chest 50, 120-132 (1966).
2. Hershkovitz, I. et al. Detection and Molecular Characterization of 9000-Year-Old Mycobacterium tuberculosis from a Neolithic Settlement in the Eastern Mediterranean. PLoS ONE 3, e3426 (2008).
3. Chalke, H.D. The impact of Tuberculosis on History, Literature and Art. Med Hist 6, 301 - 318 (1962).
4. Charles Greenblatt, M.S. Emerging Pathogens:Archaeology, Ecology and Evolution of Infectious Disease. Oxford University Press (2003).
5. Bruford, M.W., Bradley, D.G. & Luikart, G. DNA markers reveal the complexity of livestock domestication. Nat Rev Genet 4, 900-910 (2003).
6. Perkins, D., Jr. Fauna of Catal Huyuk: Evidence for Early Cattle Domestication in Anatolia. Science 164, 177-179 (1969).
7. Diamond, J. Guns, Germs and Steel. Vintage, Random House (1997). 8. Russell, D.G. Who puts the tubercle in tuberculosis? Nat Rev Micro 5, 39-47 (2007). 9. Rothschild, B.A M. et al. Mycobacterium tuberculosis Complex DNA from an Extinct Bison
Dated 17,000 Years before the Present. Clinical Infectious Diseases 33, 305-311 (2001). 10. Gutierrez, M.C. et al. Ancient Origin and Gene Mosaicism of the Progenitor of
Mycobacterium tuberculosis. PLoS Pathog 1, e5 (2005). 11. Myers, J. Eighty Years After the First Glimpse of the Tubercle Bacillus. Diseases of the Chest
51, 500-519 (1967). 12. Tortoli, E. Impact of Genotypic Studies on Mycobacterial Taxonomy: the New Mycobacteria
of the 1990s. Clin. Microbiol. Rev. 16, 319-354 (2003). 13. Basu, S. & Galvani, A. The Evolution of Tuberculosis Virulence. Bulletin of Mathematical
Biology. 14. Reyrat, J.-M. & Kahn, D. Mycobacterium smegmatis: an absurd model for tuberculosis?
Trends in Microbiology 9, 472-473 (2001). 15. Garnier, T. et al. The complete genome sequence of Mycobacterium bovis. Proc Natl Acad
Sci USA 100, 7877 - 7882 (2003). 16. Thompson, D. Mass Immunization in the Control of Infectious Disease. British med J August
427 - 433 (1966). 17. Ducati, R.G., Ruffino-Netto, A., Basso, L.A. & Santos, D.S. The resumption of consumption : a
review on tuberculosis. Memórias do Instituto Oswaldo Cruz 101, 697-714 (2006). 18. Barr RG, M.R. The effect of war on tuberculosis. Results of a tuberculin survey among
displaced persons in El Salvador and a review of the literature. Tuber Lung Dis 75, 251 - 259 (1994).
19. Kent, N. Tuberculosis. British med J September 673 -674 (1979). 20. Malley, G. Evolution of chemotherapy in Tuberculosis. AMA Arch Intern Med 93, 967-976
(1954). 21. Gomez, J.E. & McKinney, J.D. M. tuberculosis persistence, latency, and drug tolerance.
Tuberculosis 84, 29-44 (2004).

References
141
22. Gillespie, S.H. Evolution of Drug Resistance in Mycobacterium tuberculosis: Clinical and Molecular Perspective. Antimicrob. Agents Chemother. 46, 267-274 (2002).
23. WHO Global Tuberculosis Control: Surveillance, Finance and Planing. WHO report World Health Organization Document (2009).
24. Vilcheze, C. & Jacobs, J., William R. The Mechanism of Isoniazid Killing: Clarity Through the Scope of Genetics. Annual Review of Microbiology 61, 35-50 (2007).
25. Waksman, S.A. Streptomycin: Background, isolation, properties, and utilization. Nobel Lecture (1952).
26. Honore, N. & Cole, S.T. Streptomycin resistance in mycobacteria. Antimicrob. Agents Chemother. 38, 238-242 (1994).
27. Abbadi, S.H., Sameaa, G.A., Morlock, G. & Cooksey, R.C. Molecular identification of mutations associated with anti-tuberculosis drug resistance among strains of Mycobacterium tuberculosis. International Journal of Infectious Diseases In Press, Corrected Proof.
28. Guy, E.S. & Mallampalli, A. Review: Managing TB in the 21st century: existing and novel drug therapies. Therapeutic Advances in Respiratory Disease 2, 401-408 (2008).
29. Wade, M.M. & Zhang, Y. Anaerobic incubation conditions enhance pyrazinamide activity against Mycobacterium tuberculosis. J Med Microbiol 53, 769-773 (2004).
30. ESR New Zealand Public Health Surveillance Report December 2008: Covering July - September 2008 December 2008: Covering July - September 2008. New Zealand Public Health Surveillance 6 (2008).
31. Dye, C., Watt, C., Bleed, D., Hosseini, S. & Raviglione, M. Evolution of tuberculosis control and prospects for reducing tuberculosis incidence, prevalence, and deaths globally. JAMA 293, 2767 - 2775 (2005).
32. Dye, C. Doomsday postponed? Preventing and reversing epidemics of drug-resistant tuberculosis. Nat Rev Micro 7, 81-87 (2009).
33. Gilles Gonzalez, M.A., Gonzalez, G., Sousa, E.H.S., Tuckerman, J. & Robert, K.P. in Methods in Enzymology, Vol. Volume 437 173-189 (Academic Press, 2008).
34. Connolly, L.E., Edelstein, P.H. & Ramakrishnan, L. Why Is Long-Term Therapy Required to Cure Tuberculosis? PLoS Medicine 4, e120 (2007).
35. O'Sullivan, D.M., McHugh, T.D. & Gillespie, S.H. The effect of oxidative stress on the mutation rate of Mycobacterium tuberculosis with impaired catalase/peroxidase function. J. Antimicrob. Chemother. 62, 709-712 (2008).
36. Balaban, N.Q., Merrin, J., Chait, R., Kowalik, L. & Leibler, S. Bacterial Persistence as a Phenotypic Switch. Science 305, 1622-1625 (2004).
37. Howie, S. et al. Tuberculosis in New Zealand, 1992-2001: a resurgence. Arch Dis Child 90, 1157-1161 (2005).
38. Cardona, P. & Ruiz-Manzano, J. On the nature of Mycobacterium tuberculosis-latent bacilli. Eur Respir J 24, 1044-1051 (2004).
39. Bishai, W. The Mycobacterium tuberculosis genomic sequence: anatomy of a master adaptor. Trends in Microbiology 6, 464-465 (1998).
40. Bhatt, K. & Salgame, P. Host Innate Immune Response to Mycobacterium tuberculosis. Journal of Clinical Immunology 27, 347-362 (2007).
41. Manabe, Y.C. & Bishai, W.R. Latent Mycobacterium tuberculosis-persistence, patience, and winning by waiting. Nat Med 6, 1327-1329 (2000).
42. Timo Ulrichs, S.H.K. New insights into the function of granulomas in human tuberculosis. The Journal of Pathology 208, 261-269 (2006).
43. Timo Ulrichs, S.K. Mycobacterial persistence and Immunity. Frontiers in Bioscience 7, 458-469 (2002).
44. Cosma, C.L., Sherman, D.R. & Ramakrishnan, L. The Secret Lives of the Pathogenic mycobacteria. Annual Review of Microbiology 57, 641-676 (2003).
References
142
45. Davis, J.M. & Ramakrishnan, L. The Role of the Granuloma in Expansion and Dissemination of Early Tuberculous Infection. Cell 136, 37-49 (2009).
46. Hotter, G. et al. Transposon mutagenesis of Mb0100 at the ppe1-nrp locus in Mycobacterium bovis disrupts phthiocerol dimycocerosate (PDIM) and glycosylphenol-PDIM biosynthesis, producing an avirulent strain with vaccine properties at least equal to those of M. bovis BCG. J Bacteriol 187, 2267 - 2277 (2005).
47. Wayne, L.G. Dormancy of Mycobacterium tuberculosis and latency of disease. European Journal of Clinical Microbiology & Infectious Diseases 13, 908-914 (1994).
48. Boon, C. & Dick, T. Mycobacterium bovis BCG Response Regulator Essential for Hypoxic Dormancy. J. Bacteriol. 184, 6760-6767 (2002).
49. Hernández-Pando, R. et al. Persistence of DNA from Mycobacterium tuberculosis in superficially normal lung tissue during latent infection. The Lancet 356, 2133-2138 (2000).
50. Lillebaek, T. et al. Stability of DNA patterns and evidence of Mycobacterium tuberculosis reactivation occurring decades after the initial infection. J Infect Dis 188, 1032 - 1039 (2003).
51. Keane, J. et al. Tuberculosis Associated with Infliximab, a Tumor Necrosis Factor alpha -Neutralizing Agent. N Engl J Med 345, 1098-1104 (2001).
52. Stein, C.M. et al. Genome Scan of M. tuberculosis Infection and Disease in Ugandans. PLoS ONE 3, e4094 (2008).
53. Smeulders, M.J., Keer, J., Speight, R.A. & Williams, H.D. Adaptation of Mycobacterium smegmatis to Stationary Phase. J. Bacteriol. 181, 270-283 (1999).
54. Woolhiser, L. et al. In Vivo Adaptation of the Wayne Model of Latent Tuberculosis. Infect. Immun. 75, 2621-2625 (2007).
55. Wayne, L.G. Synchronized replication of Mycobacterium tuberculosis. Infect. Immun. 17, 528-530 (1977).
56. Wayne, L.G. & Lin, K.Y. Glyoxylate metabolism and adaptation of Mycobacterium tuberculosis to survival under anaerobic conditions. Infect. Immun. 37, 1042-1049 (1982).
57. Honer Zu Bentrup, K., Miczak, A., Swenson, D.L. & Russell, D.G. Characterization of Activity and Expression of Isocitrate Lyase in Mycobacterium avium and Mycobacterium tuberculosis. J. Bacteriol. 181, 7161-7167 (1999).
58. Demangel, C., Garnier, T., Rosenkrands, I. & Cole, S. Differential effects of prior exposure to environmental mycobacteria on vaccination with Mycobacterium bovis BCG or a recombinant BCG strain expressing RD1 antigens. Infect Immun 73, 2190 - 2196 (2005).
59. Ming C. Tsai, S.C., Guofeng Zhu, Jiayong Xu, Kathryn Tanaka, Cameron Koch, JoAnn Tufariello, JoAnne Flynn, John Chan, Characterization of the tuberculous granuloma in murine and human lungs: cellular composition and relative tissue oxygen tension. Cellular Microbiology 8, 218-232 (2006).
60. Sardiwal, S. et al. A GAF Domain in the Hypoxia/NO-inducible Mycobacterium tuberculosis DosS Protein Binds Haem. Journal of Molecular Biology 353, 929-936 (2005).
61. Saini, D. et al. DevR-DevS is a bona fide two-component system of Mycobacterium tuberculosis that is hypoxia-responsive in the absence of the DNA-binding domain of DevR. Microbiology 150, 865 - 875 (2004).
62. O'Toole, R. et al. A Two-Component Regulator of Universal Stress Protein Expression and Adaptation to Oxygen Starvation in Mycobacterium smegmatis. J. Bacteriol. 185, 1543-1554 (2003).
63. Mayuri, Bagchi, G., Das, T.K. & Tyagi, J.S. Molecular analysis of the dormancy response in Mycobacterium smegmatis: expression analysis of genes encoding the DevR-DevS two-component system, Rv3134c and chaperone [alpha]-crystallin homologues. FEMS Microbiology Letters 211, 231-237 (2002).
64. Starck, J., Kallenius, G., Marklund, B.-I., Andersson, D.I. & Akerlund, T. Comparative proteome analysis of Mycobacterium tuberculosis grown under aerobic and anaerobic conditions. Microbiology 150, 3821-3829 (2004).
References
143
65. Boshoff, H.I. & Barry Iii, C.E. Is the mycobacterial cell wall a hopeless drug target for latent tuberculosis? Drug Discovery Today: Disease Mechanisms 3, 237-245 (2006).
66. Wang, J.Y. & Koshland, D.E., Jr Evidence for protein kinase activities in the prokaryote Salmonella typhimurium. J. Biol. Chem. 253, 7605-7608 (1978).
67. Cashin, P., Goldsack, L., Hall, D. & O'Toole, R. Contrasting signal transduction mechanisms in bacterial and eukaryotic gene transcription. FEMS Microbiology Letters 261, 155-164 (2006).
68. Pohl, E., Holmes, R.K. & Hol, W.G.J. Crystal Structure of the Iron-dependent Regulator (IdeR) from Mycobacterium tuberculosis Shows Both Metal Binding Sites Fully Occupied. Journal of Molecular Biology 285, 1145-1156 (1999).
69. Dussurget, O. et al. Transcriptional Control of the Iron-Responsive fxbA Gene by the Mycobacterial Regulator IdeR. J. Bacteriol. 181, 3402-3408 (1999).
70. Gold, B., Rodriguez, G.M., Marras, S.A.E., Pentecost, M. & Smith, I. The Mycobacterium tuberculosis IdeR is a dual functional regulator that controls transcription of genes involved in iron acquisition, iron storage and survival in macrophages. Molecular Microbiology 42, 851 (2001).
71. Rodriguez, G.M., Voskuil, M.I., Gold, B., Schoolnik, G.K. & Smith, I. ideR, an Essential Gene in Mycobacterium tuberculosis: Role of IdeR in Iron-Dependent Gene Expression, Iron Metabolism, and Oxidative Stress Response. Infect. Immun. 70, 3371-3381 (2002).
72. Ranjan, S. & Ranjan, A. Bioinformatics Study of Iron Dependent Transcriptional Regulator, IdeR, from Mycobacteria. International Journal of Infectious Diseases 12, e479-e479 (2008).
73. Priska Peirs, L.W., Martine Braibant, Kris Huygen, Jean Content, A Serine/Threonine Protein Kinase from Mycobacterium tuberculosis. European Journal of Biochemistry 244, 604-612 (1997).
74. Koul, A. et al. Serine/threonine protein kinases PknF and PknG of Mycobacterium tuberculosis: characterization and localization. Microbiology 147, 2307-2314 (2001).
75. Av-Gay, Y. & Everett, M. The eukaryotic-like Ser/Thr protein kinases of Mycobacterium tuberculosis. Trends in Microbiology 8, 238-244 (2000).
76. Kallipolitis, B. & Ingmer, H. Listeria monocytogenes response regulators important for stress tolerance and pathogenesis. FEMS Microbiol Lett 204, 111 - 115 (2001).
77. Wehenkel, A. et al. Mycobacterial Ser/Thr protein kinases and phosphatases: Physiological roles and therapeutic potential. Biochimica et Biophysica Acta (BBA) - Proteins & Proteomics 1784, 193-202 (2008).
78. Guangchun Bai, D.D.S., Kathleen A. McDonough, cAMP levels within Mycobacterium tuberculosis and Mycobacterium bovis BCG increase upon infection of macrophages. FEMS Immunology & Medical Microbiology 55, 68-73 (2009).
79. Michaela A. Gazdik, G.B., Yan Wu, Kathleen A. McDonough, Rv1675c (cmr) regulates intramacrophage and cyclic AMP-induced gene expression in <i>Mycobacterium tuberculosis</i>-complex mycobacteria. Molecular Microbiology 71, 434-448 (2009).
80. Shpakov, A. & Pertseva, M. Signal transduction systems in prokaryotes. Journal of Evolutionary Biochemistry and Physiology 44, 129-150 (2008).
81. Kundig, W. & Roseman, S. Sugar Transport. I. Isolation of a phosphotransferase system from Escherichia coli. J. Biol. Chem. 246, 1393-1406 (1971).
82. AM, B., LA, A., BR, C. & MI, S. Structure of CheA, a signal-transducing histidine kinase. Cell 96, 131 (1999).
83. Mizuno, T. Compilation of All Genes Encoding Two-component Phosphotransfer Signal Transducers in the Genome of Escherichia coli. DNA Res 4, 161-168 (1997).
84. Mizuno, T. His-Asp Phosphotransfer Signal Transduction. J Biochem 123, 555-563 (1998). 85. Wolanin, P. & Stock, J. Transmembrane signaling and the regulation of histidine kinase
activity In Histidine Kinases in Signal Transduction: abstract. (forthcoming review). 86. J. Tyagi, D.S. Signal transduction systems of mycobacteria with special reference to M.
tuberculosis. Current Science 86, 93-102 (2004).
References
144
87. Esther Pérez, S.S., Yann Bordas, Christophe Guilhot, Brigitte Gicquel, Carlos Martín, An essential role for phoP in Mycobacterium tuberculosis virulence. Molecular Microbiology 41, 179-187 (2001).
88. Friedland, N. et al. Domain Orientation in the Inactive Response Regulator Mycobacterium tuberculosis MtrA Provides a Barrier to Activation. Biochemistry 46, 6733-6743 (2007).
89. Patricia A. Fontan, S.W.a.I.S. Cellular signaling pathways and transcriptional regulation in Mycobacterium tuberculosis: Stress control and virulence. Current Science 88, 122-134 (2004).
90. Rong Gao, Y.T., Ann M. Stock, System-level mapping of Escherichia coli response regulator dimerization with FRET hybrids. Molecular Microbiology 69, 1358-1372 (2008).
91. Laub, M.T. & Goulian, M. Specificity in Two-Component Signal Transduction Pathways. Annual Review of Genetics 41, 121-145 (2007).
92. Dortay, H. et al. Toward an Interaction Map of the Two-Component Signaling Pathway of Arabidopsis thaliana. Journal of Proteome Research 7, 3649-3660 (2008).
93. Rong Gao, Y.T., Ann M. Stock, System-level mapping of Escherichia coli response regulator dimerization with FRET hybrids. Molecular Microbiology 69, 1358-1372 (2008).
94. Amemura, M., Makino, K., Shinagawa, H. & Nakata, A. Cross talk to the phosphate regulon of Escherichia coli by PhoM protein: PhoM is a histidine protein kinase and catalyzes phosphorylation of PhoB and PhoM-open reading frame 2. J. Bacteriol. 172, 6300 (1990).
95. Matsushita, M. & Janda, K.D. Histidine kinases as targets for new antimicrobial agents. Bioorganic & Medicinal Chemistry 10, 855-867 (2002).
96. Stephenson, K. & Hoch, J.A. Virulence- and antibiotic resistance-associated two-component signal transduction systems of Gram-positive pathogenic bacteria as targets for antimicrobial therapy. Pharmacology & Therapeutics 93, 293-305 (2002).
97. Stephenson, K. & Hoch, J. Virulence- and antibiotic resistance-associated two-component signal transduction systems of Gram-positive pathogenic bacteria as targets for antimicrobial therapy. Pharmacol Ther 93, 293 - 305 (2002).
98. Watanabe, T., Okada, A., Gotoh, Y. & Utsumi, R. in Bacterial Signal Transduction: Networks and Drug Targets 229-2362008).
99. R. Curcic, S.D., V. Oeretic, Gene expression in mycobacteria: transcriptional fusions based on xylE and analysis of the promoter region of the response regulator mtrA from Mycobacterium tuberculosis. Molecular Microbiology 13, 1057-1064 (1994).
100. Via, L. et al. Elements of signal transduction in Mycobacterium tuberculosis: in vitro phosphorylation and in vivo expression of the response regulator MtrA. J. Bacteriol. 178, 3314-3321 (1996).
101. Zahrt, T.C. & Deretic, V. An Essential Two-Component Signal Transduction System in Mycobacterium tuberculosis. J. Bacteriol. 182, 3832-3838 (2000).
102. Marek Fol, A.C., Naveen K. Nair, Erin Maloney, Meredith Moomey, Chinnaswamy Jagannath, Murty V. V. S. Madiraju, Malini Rajagopalan, Modulation of <i>Mycobacterium tuberculosis</i> proliferation by MtrA, an essential two-component response regulator. Molecular Microbiology 60, 643-657 (2006).
103. Friedland, N. et al. Domain Orientation in the Inactive Response Regulator Mycobacterium tuberculosis MtrA Provides a Barrier to Activation†,‡. Biochemistry 46, 6733-6743 (2007).
104. M. Marques, M.A., Chitale, S., Brennan, P.J. & Pessolani, M.C.V. Mapping and Identification of the Major Cell Wall-Associated Components of Mycobacterium leprae. Infect. Immun. 66, 2625-2631 (1998).
105. Cangelosi, G.A. et al. The Two-Component Regulatory System mtrAB Is Required for Morphotypic Multidrug Resistance in Mycobacterium avium. Antimicrob. Agents Chemother. 50, 461-468 (2006).
References
145
106. Nina Möker, M.B., Steffen Schaffer, Reinhard Krämer, Susanne Morbach, Michael Bott, Deletion of the genes encoding the MtrA/MtrB two-component system of Corynebacterium glutamicum has a strong influence on cell morphology, antibiotics susceptibility and expression of genes involved in osmoprotection. Molecular Microbiology 54, 420-438 (2004).
107. Wang, W. et al. Molecular and biochemical characterization of a novel two-component signal transduction system, amrA-amkA, involved in rifamycin SV production in Amycolatopsis mediterranei U32. Archives of Microbiology 178, 376-386 (2002).
108. Glover, R.T., Kriakov, J., Garforth, S.J., Baughn, A.D. & Jacobs, W.R., Jr. The Two-Component Regulatory System senX3-regX3 Regulates Phosphate-Dependent Gene Expression in Mycobacterium smegmatis. J. Bacteriol. 189, 5495-5503 (2007).
109. Parish, T. et al. Deletion of two-component regulatory systems increases the virulence of Mycobacterium tuberculosis. Infect Immun 71, 1134 - 1140 (2003).
110. Himpens, S., Locht, C. & Supply, P. Molecular characterization of the mycobacterial SenX3-RegX3 two-component system: evidence for autoregulation. Microbiology 146, 3091-3098 (2000).
111. Kriakov, J., Lee, S.h. & Jacobs, W.R., Jr. Identification of a Regulated Alkaline Phosphatase, a Cell Surface-Associated Lipoprotein, in Mycobacterium smegmatis. J. Bacteriol. 185, 4983-4991 (2003).
112. Haydel, S.E. & Clark-Curtiss, J.E. Global expression analysis of two-component system regulator genes during Mycobacterium tuberculosis growth in human macrophages. FEMS Microbiology Letters 236, 341-347 (2004).
113. Magdalena, J., Supply, P. & Locht, C. Specific Differentiation between Mycobacterium bovis BCG and Virulent Strains of the Mycobacterium tuberculosis Complex. J. Clin. Microbiol. 36, 2471-2476 (1998).
114. Hasan, S., Daugelat, S., Rao, P.S.S. & Schreiber, M. Prioritizing Genomic Drug Targets in Pathogens: Application to Mycobacterium tuberculosis. PLoS Computational Biology 2, e61 (2006).
115. Yukl, E.T., Ioanoviciu, A., Ortiz de Montellano, P.R. & Moenne-Loccoz, P. Interdomain Interactions within the Two-Component Heme-Based Sensor DevS from Mycobacterium tuberculosis. Biochemistry 46, 9728-9736 (2007).
116. Via, L.E. et al. Tuberculous Granulomas Are Hypoxic in Guinea Pigs, Rabbits, and Nonhuman Primates. Infect. Immun. 76, 2333-2340 (2008).
117. Converse, P.J. et al. The role of the dosR/dosS two-component regulatory system in Mycobacterium tuberculosis virulence in three animal models. Infect. Immun., 1117-1108 (2008).
118. O'Toole, R. & Williams, H. Universal stress proteins and Mycobacterium tuberculosis. Res Microbiol 154, 387 - 392 (2003).
119. Lyon, G.J., Mayville, P., Muir, T.W. & Novick, R.P. Rational design of a global inhibitor of the virulence response in Staphylococcus aureus, based in part on localization of the site of inhibition to the receptor-histidine kinase, AgrC. Proceedings of the National Academy of Sciences of the United States of America 97, 13330-13335 (2000).
120. Wang, L., Grau, R., Perego, M. & Hoch, J.A. A novel histidine kinase inhibitor regulating development in Bacillus subtilis. Genes & Development 11, 2569-2579 (1997).
121. Bick, M.J. et al. How to Switch Off a Histidine Kinase: Crystal Structure of Geobacillus stearothermophilus KinB with the inhibitor Sda. Journal of Molecular Biology 386, 163-177 (2009).
122. Stephenson, K., Yamaguchi, Y. & Hoch, J.A. The Mechanism of Action of Inhibitors of Bacterial Two-component Signal Transduction Systems. J. Biol. Chem. 275, 38900-38904 (2000).
References
146
123. Foster, J.E. et al. Kinetic and mechanistic analyses of new classes of inhibitors of two-component signal transduction systems using a coupled assay containing HpkA-DrrA from Thermotoga maritima. Microbiology 150, 885-896 (2004).
124. Hilliard, J.J., Goldschmidt, R.M., Licata, L., Baum, E.Z. & Bush, K. Multiple Mechanisms of Action for Inhibitors of Histidine Protein Kinases from Bacterial Two-Component Systems. Antimicrob. Agents Chemother. 43, 1693-1699 (1999).
125. Hlasta, D.J. et al. Novel inhibitors of bacterial two-component systems with gram positive antibacterial activity: Pharmacophore identification based on the screening hit closantel. Bioorganic & Medicinal Chemistry Letters 8, 1923-1928 (1998).
126. Qin, Z. et al. Structure-based discovery of inhibitors of the YycG histidine kinase: New chemical leads to combat Staphylococcus epidermidis infections. BMC Microbiology 6, 96 (2006).
127. Roychoudhury, S. et al. Inhibitors of two-component signal transduction systems: inhibition of alginate gene activation in Pseudomonas aeruginosa. Proceedings of the National Academy of Sciences of the United States of America 90, 965-969 (1993).
128. Saini, D.K. & Tyagi, J.S. High-Throughput Microplate Phosphorylation Assays Based on DevR-DevS/Rv2027c 2-Component Signal Transduction Pathway to Screen for Novel Antitubercular Compounds. J Biomol Screen 10, 215-224 (2005).
129. Macielag, M. & Goldschmidt, R. Inhibitors of bacterial two-component signalling systems. Expert Opin Investig Drugs 9, 2351 - 2369 (2000).
130. Barrett, J.F. et al. Antibacterial agents that inhibit two-component signal transduction systems. Proceedings of the National Academy of Sciences of the United States of America 95, 5317-5322 (1998).
131. Watanabe, T. et al. Isolation and characterization of inhibitors of the essential histidine kinase, YycG in Bacillus subtilis and Staphylococcus aureus. J Antibiot (Tokyo) 56, 1045 - 1052 (2003).
132. J. Dezz Ropp, C.J.D., David Wolfgang-Kimball, Jeffrey J. Hooley, James Y. W. Chin, Robert A. Hoffman, R. Andrew Cuthbertson, Kenneth D. Bauer, Aequorea green fluorescent protein analysis by flow cytometry. Cytometry 21, 309-317 (1995).
133. Chalfie M, T.Y., Euskirchen G, Ward WW, Prasher DC Green fluorescent protein as a marker for gene expression. Science 11, 802-805 (1994).
134. Blokpoel, M.C.J., O'Toole, R., Smeulders, M.J. & Williams, H.D. Development and application of unstable GFP variants to kinetic studies of mycobacterial gene expression. Journal of Microbiological Methods 54, 203-211 (2003).
135. Laurent Kremer, A.B., Jerome Estaquier, Odile Poulain-Godefroy, Camille Locht. Green fluorescent protein as a new expression marker in mycobacteria. Molecular Microbiology 17, 913-922 (1995).
136. Cormack, B.P., Valdivia, R.H. & Falkow, S. FACS-optimized mutants of the green fluorescent protein (GFP). Gene 173, 33-38 (1996).
137. Kenney, T. & Churchward, G. Genetic analysis of the Mycobacterium smegmatis rpsL promoter. J. Bacteriol. 178, 3564-3571 (1996).
138. Bourn, W.R. et al. Creation and characterisation of a high-copy-number version of the pAL5000 mycobacterial replicon. Tuberculosis 87, 481-488 (2007).
139. O'Toole, R., Von Hofsten, J., Rosqvist, R., Olsson, P.E. & Wolf-Watz, H. Visualisation of zebrafish infection by GFP-labelled Vibrio anguillarum. Microb Pathog 37, 41-46 (2004).
140. Sambrook, R. Molecular Cloning: A Laboratory Manual Cold Spring Harbor Laboratory Press, third edition. (2001).
141. Tanya Parish, N.S. Mycobacteria Protocols, Vol. 101. (Humana Press, 2008). 142. Miller, C.H., Nisa, S., Dempsey, S., Jack, C. & O'Toole, R. Modifying Culture Conditions in
Chemical Library Screening Identifies Alternative Inhibitors of Mycobacteria. Antimicrob. Agents Chemother. 53, 5279-5283 (2009).
References
147
143. Kendall, S.L. et al. The Mycobacterium tuberculosis dosRS two-component system is induced by multiple stresses. Tuberculosis 84, 247-255 (2004).
144. Kamakshi Sureka, S.D., Pratik Datta, Anil Kumar Singh, Arunava Dasgupta, Sébastien Rodrigue, Joyoti Basu, Manikuntala Kundu, Polyphosphate kinase is involved in stress-induced mprAB-sigE-rel signalling in mycobacteria. Molecular Microbiology 65, 261-276 (2007).
145. Zahrt, T.C. & Deretic, V. Mycobacterium tuberculosis signal transduction system required for persistent infections. Proceedings of the National Academy of Sciences of the United States of America 98, 12706-12711 (2001).
146. Walters, S. et al. The Mycobacterium tuberculosis PhoPR two-component system regulates genes essential for virulence and complex lipid biosynthesis. Mol Microbiol 60, 312 - 330 (2006).
147. Ewann, F., Locht, C. & Supply, P. Intracellular autoregulation of the Mycobacterium tuberculosis PrrA response regulator. Microbiology 150, 241-246 (2004).
148. Marek Fol, A.C., Naveen K. Nair, Erin Maloney, Meredith Moomey, Chinnaswamy Jagannath, Murty V. V. S. Madiraju, Malini Rajagopalan, Modulation of Mycobacterium tuberculosis proliferation by MtrA, an essential two-component response regulator. Molecular Microbiology 60, 643-657 (2006).
149. Arun, K.H.S., Kaul, C.L. & Ramarao, P. Green fluorescent proteins in receptor research: An emerging tool for drug discovery. Journal of Pharmacological and Toxicological Methods 51, 1-23 (2005).
150. Chauhan, S. & Tyagi, J.S. Cooperative Binding of Phosphorylated DevR to Upstream Sites Is Necessary and Sufficient for Activation of the Rv3134c-devRS Operon in Mycobacterium tuberculosis: Implication in the Induction of DevR Target Genes. J. Bacteriol. 190, 4301-4312 (2008).
151. Vasudeva-Rao, H.M. & McDonough, K.A. Expression of the Mycobacterium tuberculosis acr-Coregulated Genes from the DevR (DosR) Regulon Is Controlled by Multiple Levels of Regulation. Infect. Immun. 76, 2478-2489 (2008).
152. Kendall, S. et al. The Mycobacterium tuberculosis dosRS two-component system is induced by multiple stresses. Tuberculosis (Edinb ) 84, 247 - 255 (2004).
153. Betts, J., Lukey, P., Robb, L., McAdam, R. & Duncan, K. Evaluation of a nutrient starvation model of Mycobacterium tuberculosis persistence by gene and protein expression profiling. Mol Microbiol 43, 717 - 731 (2002).
154. Kumar, A. et al. Heme Oxygenase-1-derived Carbon Monoxide Induces the Mycobacterium tuberculosis Dormancy Regulon. J. Biol. Chem. 283, 18032-18039 (2008).
155. Kumar, A., Toledo, J.C., Patel, R.P., Lancaster, J.R. & Steyn, A.J.C. Mycobacterium tuberculosis DosS is a redox sensor and DosT is a hypoxia sensor. Proceedings of the National Academy of Sciences 104, 11568-11573 (2007).
156. Voskuil, M.I. et al. Inhibition of Respiration by Nitric Oxide Induces a Mycobacterium tuberculosis Dormancy Program. J. Exp. Med. 198, 705-713 (2003).
157. Ryndak, M., Wang, S. & Smith, I. PhoP, a key player in Mycobacterium tuberculosis virulence. Trends in Microbiology 16, 528-534 (2008).
158. Cappelli, G. et al. Profiling of Mycobacterium tuberculosis gene expression during human macrophage infection: Upregulation of the alternative sigma factor G, a group of transcriptional regulators, and proteins with unknown function. Res Microbiol (2006).
159. Klinkenberg, S., Bishai, Karakousis Metronidazole Lacks Activity against Mycobacterium tuberculosis in an In Vivo Hypoxic Granuloma Model of Latency. The Journal of Infectious Diseases 198, 275-283 (2008).
160. Mark A. Strauch, D.M., James A. Hoch, cis-Unsaturated fatty acids specifically inhibit a signal-transducing protein kinase required for initiation of sporulation in Bacillus subtilis. Molecular Microbiology 6, 2909-2917 (1992).

References
148
161. Murakami, K., Chan, S. & Routtenberg, A. Protein kinase C activation by cis-fatty acid in the absence of Ca2+ and phospholipids. J. Biol. Chem. 261, 15424-15429 (1986).
162. Buelt, M., Shekels, L., Jarvis, B. & Bernlohr, D. In vitro phosphorylation of the adipocyte lipid-binding protein (p15) by the insulin receptor. Effects of fatty acid on receptor kinase and substrate phosphorylation. J. Biol. Chem. 266, 12266-12271 (1991).
163. Zhang, J.-H., Chung, T.D.Y. & Oldenburg, K.R. Confirmation of Primary Active Substances from High Throughput Screening of Chemical and Biological Populations: A Statistical Approach and Practical Considerations. Journal of Combinatorial Chemistry 2, 258-265 (2000).

149
APPENDICES
Appendix 1: PCR reactions
The PCR reactions carried out in this study have been displayed below in A.1.
Generally PCRs were carried in out using one of the three protocols depending on
the desired fragment length and fidelity of PCR required. High Fidelity polymerase
was used to clone promoters, gfpmut2 and oriM high. In the case of screening for
fragment insertion into a plasmid, a regular polymerase was used such as Mastermix
(Bioline). Modifications to annealing temperatures were made depending on
particular primer melting temperatures in some cases.
A.1 PCR reactions in this study
a) High Fidelity PCR: Standard protocol for amplifying promoters and gfpmut2
Temperature Time Cycles
94oC 10 minutes
94oC 1 minute
30 56oC 1 minute
68oC 1 minute
12oC hold
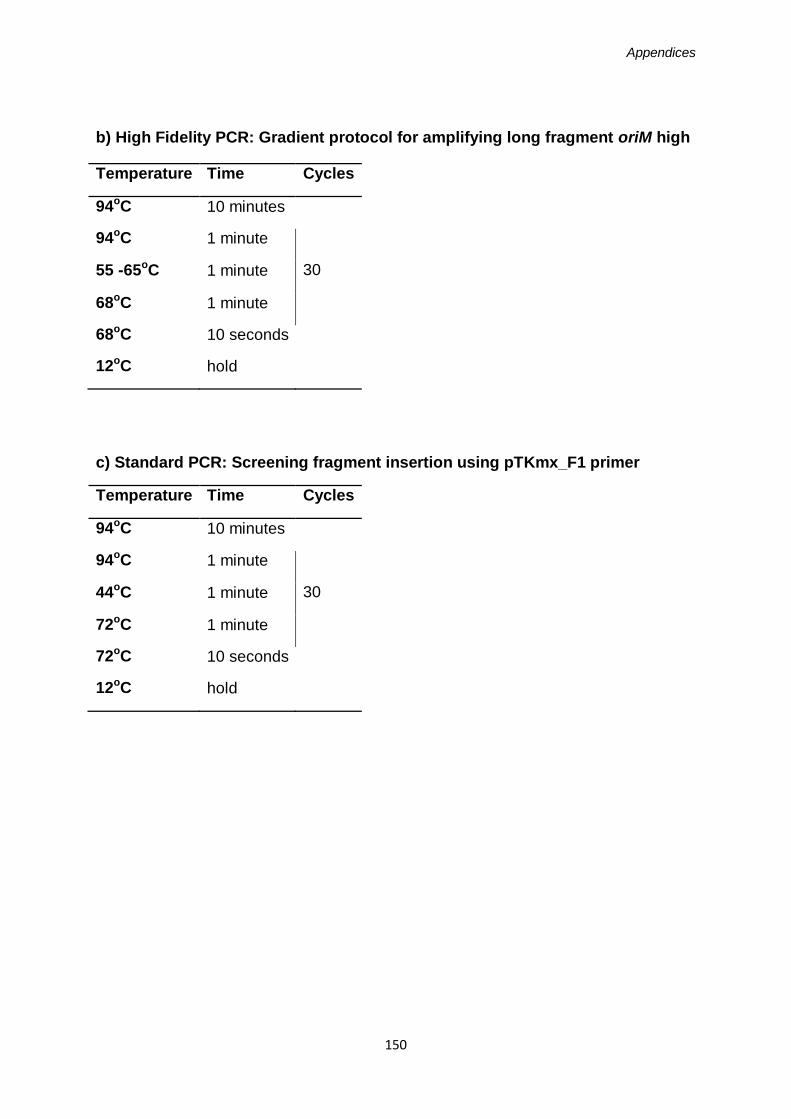
Appendices
150
b) High Fidelity PCR: Gradient protocol for amplifying long fragment oriM high
Temperature Time Cycles
94oC 10 minutes
94oC 1 minute
30 55 -65oC 1 minute
68oC 1 minute
68oC 10 seconds
12oC hold
c) Standard PCR: Screening fragment insertion using pTKmx_F1 primer
Temperature Time Cycles
94oC 10 minutes
94oC 1 minute
30 44oC 1 minute
72oC 1 minute
72oC 10 seconds
12oC hold
Appendices
151
Appendix 2: Ligation Reactions
A number of ligation reactions were carried out in this screen. The method used was
altered depending on whether the reaction involved one or two restriction enzyme
sites. Since the pSHigh plasmid had only one cloning site infront of gfpmut2 the
plasmid was first incubated with CIP to reduce the amount of self ligation occurring in
the reaction. Consequently a larger volume of plasmid was added to these reactions
as the concentration was reduced by the DNA clean up step after CIP incubation.
The volume of fragment added was also increase to give a more efficient reaction by
increase the fragment to plasmid ratio. In addition the efficiency off each reaction
was observed by carrying out a negative control with distilled water, as the number
of colonies on the negative control plate were indicative of self ligation of the
plasmid. The following tables (A.2 a, b and c) describe the stock concentrations and
volumes of reagents used in this study for cloning into a) cloning vectors, b) pOT71
and c) pSHigh.
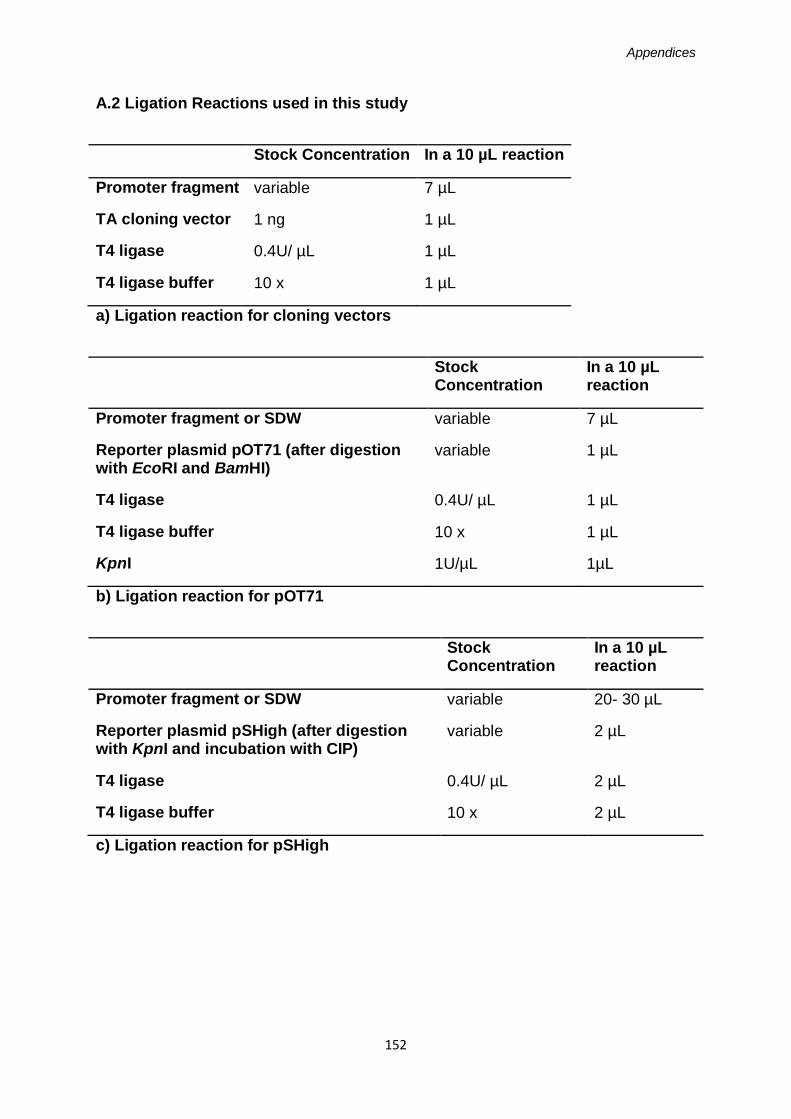
Appendices
152
A.2 Ligation Reactions used in this study
Stock Concentration In a 10 µL reaction
Promoter fragment variable 7 µL
TA cloning vector 1 ng 1 µL
T4 ligase 0.4U/ µL 1 µL
T4 ligase buffer 10 x 1 µL
a) Ligation reaction for cloning vectors
Stock Concentration
In a 10 µL reaction
Promoter fragment or SDW variable 7 µL
Reporter plasmid pOT71 (after digestion with EcoRI and BamHI)
variable 1 µL
T4 ligase 0.4U/ µL 1 µL
T4 ligase buffer 10 x 1 µL
KpnI 1U/µL 1µL
b) Ligation reaction for pOT71
Stock Concentration
In a 10 µL reaction
Promoter fragment or SDW variable 20- 30 µL
Reporter plasmid pSHigh (after digestion with KpnI and incubation with CIP)
variable 2 µL
T4 ligase 0.4U/ µL 2 µL
T4 ligase buffer 10 x 2 µL
c) Ligation reaction for pSHigh
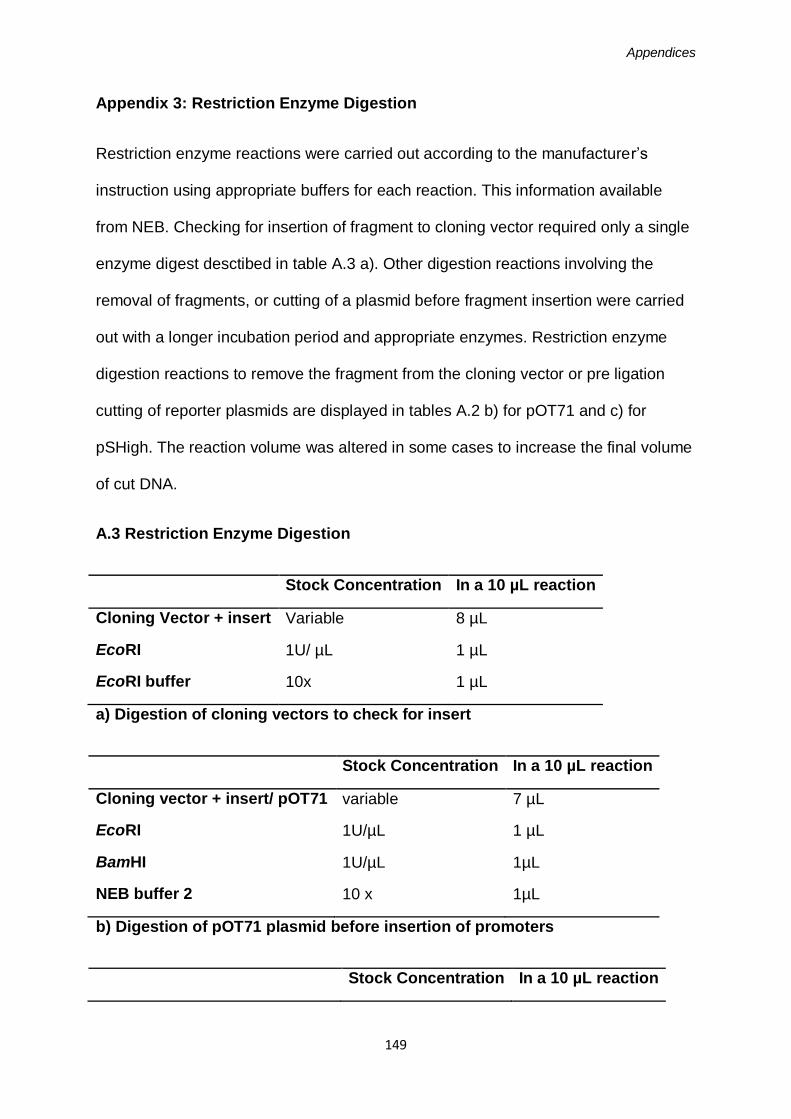
Appendices
149
Appendix 3: Restriction Enzyme Digestion
Restriction enzyme reactions were carried out according to the manufacturer’s
instruction using appropriate buffers for each reaction. This information available
from NEB. Checking for insertion of fragment to cloning vector required only a single
enzyme digest desctibed in table A.3 a). Other digestion reactions involving the
removal of fragments, or cutting of a plasmid before fragment insertion were carried
out with a longer incubation period and appropriate enzymes. Restriction enzyme
digestion reactions to remove the fragment from the cloning vector or pre ligation
cutting of reporter plasmids are displayed in tables A.2 b) for pOT71 and c) for
pSHigh. The reaction volume was altered in some cases to increase the final volume
of cut DNA.
A.3 Restriction Enzyme Digestion
Stock Concentration In a 10 µL reaction
Cloning Vector + insert Variable 8 µL
EcoRI 1U/ µL 1 µL
EcoRI buffer 10x 1 µL
a) Digestion of cloning vectors to check for insert
Stock Concentration In a 10 µL reaction
Cloning vector + insert/ pOT71 variable 7 µL
EcoRI 1U/µL 1 µL
BamHI 1U/µL 1µL
NEB buffer 2 10 x 1µL
b) Digestion of pOT71 plasmid before insertion of promoters
Stock Concentration In a 10 µL reaction
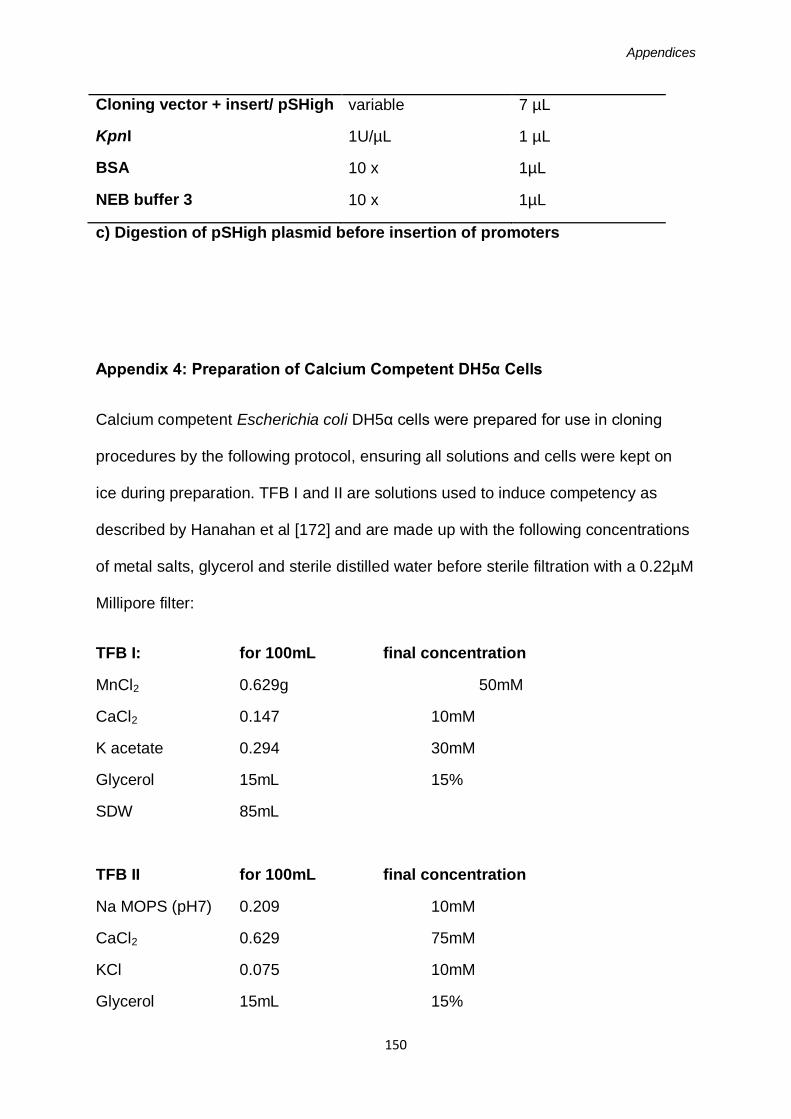
Appendices
150
Cloning vector + insert/ pSHigh variable 7 µL
KpnI 1U/µL 1 µL
BSA 10 x 1µL
NEB buffer 3 10 x 1µL
c) Digestion of pSHigh plasmid before insertion of promoters
Appendix 4: Preparation of Calcium Competent DH5α Cells
Calcium competent Escherichia coli DH5α cells were prepared for use in cloning
procedures by the following protocol, ensuring all solutions and cells were kept on
ice during preparation. TFB I and II are solutions used to induce competency as
described by Hanahan et al [172] and are made up with the following concentrations
of metal salts, glycerol and sterile distilled water before sterile filtration with a 0.22µM
Millipore filter:
TFB I: for 100mL final concentration
MnCl2 0.629g 50mM
CaCl2 0.147 10mM
K acetate 0.294 30mM
Glycerol 15mL 15%
SDW 85mL
TFB II for 100mL final concentration
Na MOPS (pH7) 0.209 10mM
CaCl2 0.629 75mM
KCl 0.075 10mM
Glycerol 15mL 15%
Appendices
151
DH5α cells from a freezer stock were incubated with agitation at 37oC overnight in
3ml liquid cultures of LB with 10mM MgCl2 with a negative media control to ensure
there was no contamination. Cells were then inoculated into four 50mL cultures of
the LB with 10mM MgCl2 in 250mL flasks and grown for around two hours until their
OD600 was between 0.4 and 1.0. Cells were then transferred to 50mL flacon tubes
and stored on ice to inhibit further growth. Cell suspensions were then spun down in
a refrigerated centrifuge at 4 oC for 10 minutes at 5000rpm and resuspended in 40
mLs of competence inducing TFB I solution before further incubation on ice for two
hours. Each culture was then spun down again at 4 oC for 10 minutes at 5000rpm
and resuspended in 4mLs of TFB II solution and kept on ice. Cells suspended in TFB
II were transferred to eppendorf tubes and snap frozen then stored at -80 oC until
required for transformation.
Appendices
152
Appendix 5: Preparation of Electrocompetent Mycobacterium smegmatis
mc2155
Electrocompetent cells were prepared by a method revised from Sambrook and
Russel Volume 1, 1.12-1.14 [157] .
Mycobacterium smegmatis mc2155 cells from an LA plate were incubated with
agitation at 37 oC overnight in 10ml liquid cultures of LB with a negative media
control to ensure there was no contamination. 2 – 3 mLs of this cells culture was
inoculated into 100mLs of LB and grown for around five hours until their OD600 was
between 0.5 and 1.0. Cells were then transferred to two 50 mL falcon tubes and
stored on ice to inhibit further growth for 20 minutes. Cell suspensions were then
spun down in a refrigerated centrifuge at 4 oC for 10 minutes at 5000 rpm and re-
suspended in 50 mL 10% cold glycerol. This incubation and pellet step was repeated
three times before cells were finally re-suspended in 2mLs of cold 10% glycerol
before they were dispensed into eppendorf tubes and stored at -80oC until required
for transformation.

Appendices
153
Appendix 6: Media used in this study for DH5α cells
DH5α cells used for cloning were grown on solid media Luria Agar (LA) or Luria
Broth (LB) both from Sigma. Overnight cultures of TA cloning vector containing cells
were grown in LB supplemented with Ampicillin and Kanamycin when using pCR2.1
or just Ampicillin for pLUG vector. For blue/white colony selection, using β-
galactosidase gene disruption, tranformed cells were grown on LA containg the
same concentration of antibiotics as well as IPTG and Xgal.
Solid Media (LA)
Kanamycin 50 µg/mL
Ampicillin 200 µg/mL
Xgal 40 µg/mL
IPTG 100 µg/mL
Liquid Media (LB)
Kanamycin 50 µg/mL
Ampicillin 200 µg/mL
Appendices
154
Appendix 7: Media used in this study for mc2 155 cells
All plasmids used in this study contained the Kanamycin resistance cassette ophA.
Accordingly, all experiments using mc2 155 were supplemented with Kanamycin on
both solid and liquied media. In order to obtain planktonic growth of liquid cultures,
media was also supplemented with D-arabinose and Tween80. All media was
autoclaved for sterilisation before use.
Solid Media (LA)
Kanamycin 50µg/mL
Liquid Rich Media (LB)
Kanamycin 50µg/mL
D-arabinose 100µg/mL
0.1% Tween80
Nutrient starvation experiments were carried out using Hartman deBonts minimal
media made from a base of metal salts, Tween80 and SDW. Phosphate and Nitrate
sources were added to this base from stock solutions names 100X P and N
respectively, while glycerol was added as a Carbon source.

Appendices
155
Metal Salts (in 1L SDW) final concentration
CaCl2.2H20 0.10 g 1 mM
CoCl2.2H20 0.04 g 240 µM
CuSO4.5H20 0.02 g 80 µM
EDTA 1.00 g 3.4 mM
FeSO4.7H20 0.50 g 1.8 mM
MgCl2.6H20 10.00 g 50 mM
MnCl2.2H20 0.10 g 621 µM
NaMoO4.2H20 0.02 g 90 µM
ZnSO4.7H20 0.20 g 732 µM
100 x Nitrogen
(NH4)2SO4 200 g 1.5 M
100 x Phosphates
K2HPO4 155 g 1 M
NaH2PO4 85 g 700 mM
HdeB base was made using 945 mL of SDW with 10mL metal salts and 5
mLs 10% Tween80. For each sort of media, mimimal, Carbon starvation, Nitrogen
starvation and Phosphate starvation, 960mL of HdeB base was used as well as
nitrogen, carbon and phosphate sources as shown in the table below. For

Appendices
156
nutrient starvation experiments, the 4 levels of starvation were investigated using
a range from 0% -100% as highlighted.
HdeB
Base
(mL)
100x
Nitrogen
(mL)
100x
Phosphates
(mL)
10%
Glycerol
(mL)
SDW
(mL)
5M
NaMOPs
(mL)
Minimal
Media
960 10 10 20 0
Nitrogen
Starvation
960 0.1 - 10 10 20 9.9 – 0.1
Phosphate
starvation
960 10 1 - 10 20 10 - 1
Carbon
Starvation
960 10 10 8 - 20 12 - 0
Table A.3 Alterations to HdeB media for nutrient starvation