deutz company presentation
TRANSCRIPT

DEUTZ Company presentation
April, 2021

2
Disclaimer
Unless stated otherwise, all the figures given in this presentation refer to continuing operations.
The details given in this document are based on the information available at the time it was prepared. This presents the risk that actual figures may differ from forward-looking statements. Such discrepancies may be caused by changes in political, economic, or business conditions, decreases in the technological lead of DEUTZ’s products, changes in competition, the effects of movements in interest rates or exchange rates, the pricing of parts supplied, and other risks and uncertainties not identified at the time this document was prepared.
The forward-looking statements made in this document will not be updated.

3
DEUTZ at a glanceIndependent engine producer focusing on „off-highway“ applications
Technology leader „made in Germany“
Founded 150 years ago
Five manufacturing sites globally
Around 4.600 employees
HQ in Cologne
Digital and AI-based applications
Partner for the transformation of theoff-highway industry
Developing broad range of products fore- and H2-mobility
Active in more than 130 Countries
7% R&D ratio in 2020
Approx. € 1.3 bn sales in 2020
Diesel, LPG/CNG and alternative fuelpowertrains for main „off-highway“ segments

Agenda
4
Strategy
Agenda

5
Downsizing
LPG/CNG
Hybridization
Hydrogen
Efficiency gains
Zero-emissionstarget
Electrification
NOx
E-fuels
Emissionsreduction
Optimization of drive solutions
Sustainability & 'well-to-wheel' view
Noisecancellation
Our challenge: a market environment with many moving parts...
Need for sustainable drive systems, including in off-highway applications

6
…meets a highly diversified customer base
Broad customer base with different power requirements
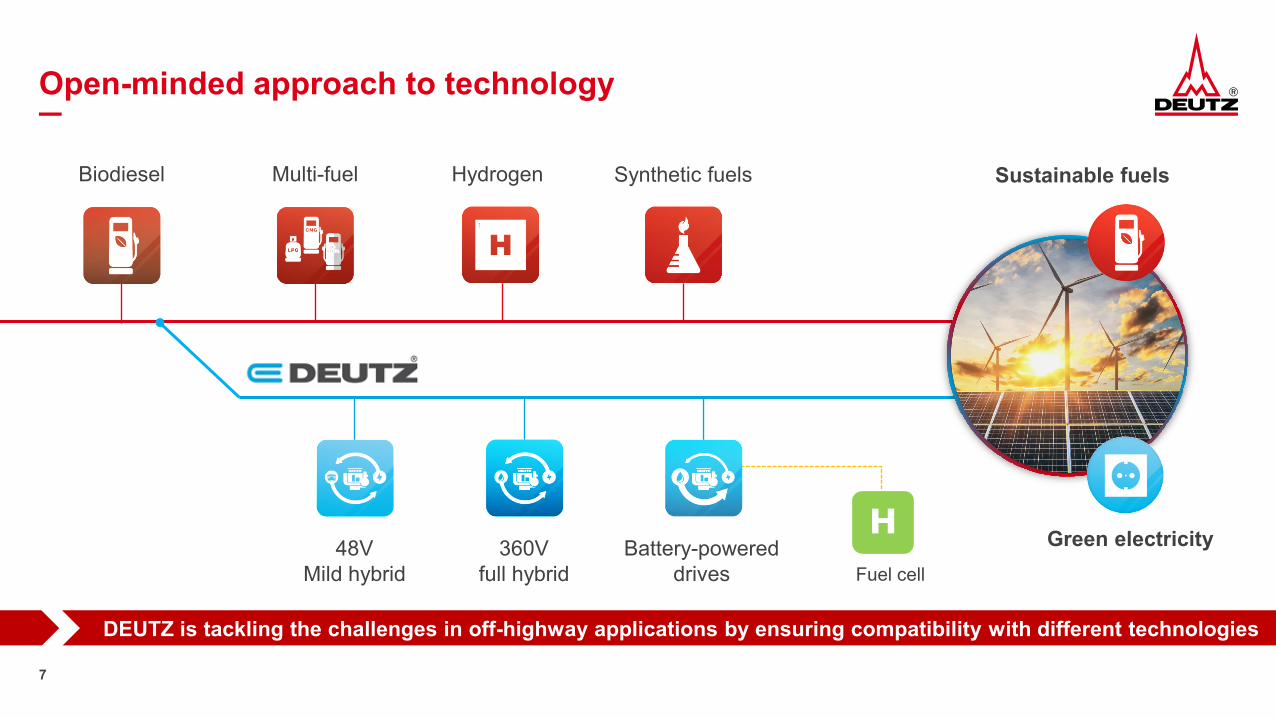
Multi-fuel Hydrogen Synthetic fuelsBiodiesel
7
Battery-powereddrives
360Vfull hybrid
48VMild hybrid
DEUTZ is tackling the challenges in off-highway applications by ensuring compatibility with different technologies
Green electricity
Sustainable fuels
Fuel cell
H
Open-minded approach to technology

8
Freeways, fields,
construction sites
Factory sites,cattle sheds
Energy demand / cyclelow high
Ope
ratin
g ra
nge
/ D
ista
nce
to
ener
gy s
uppl
y
Electric powertrains
Piston engines (Diesel, LPG, CNG, e-fuel, H2)
Hybrid powertrains
Competitive powertrains for all of our current off-highway markets
Our goal: the optimal technology for each application

Agenda
9
Growth drivers
Agenda

10
Americas15%
EMEA29%
Asia-Pacific56%
China 39%
Relevant off-highway market1Units (millions)
Markets relevant to DEUTZ: agriculture, construction, material handling, and stationary equipment
Serviceable addressable market, broken down by region1
1 Source: PSR – Power Systems Research, April 2020.
Focus for growth: China
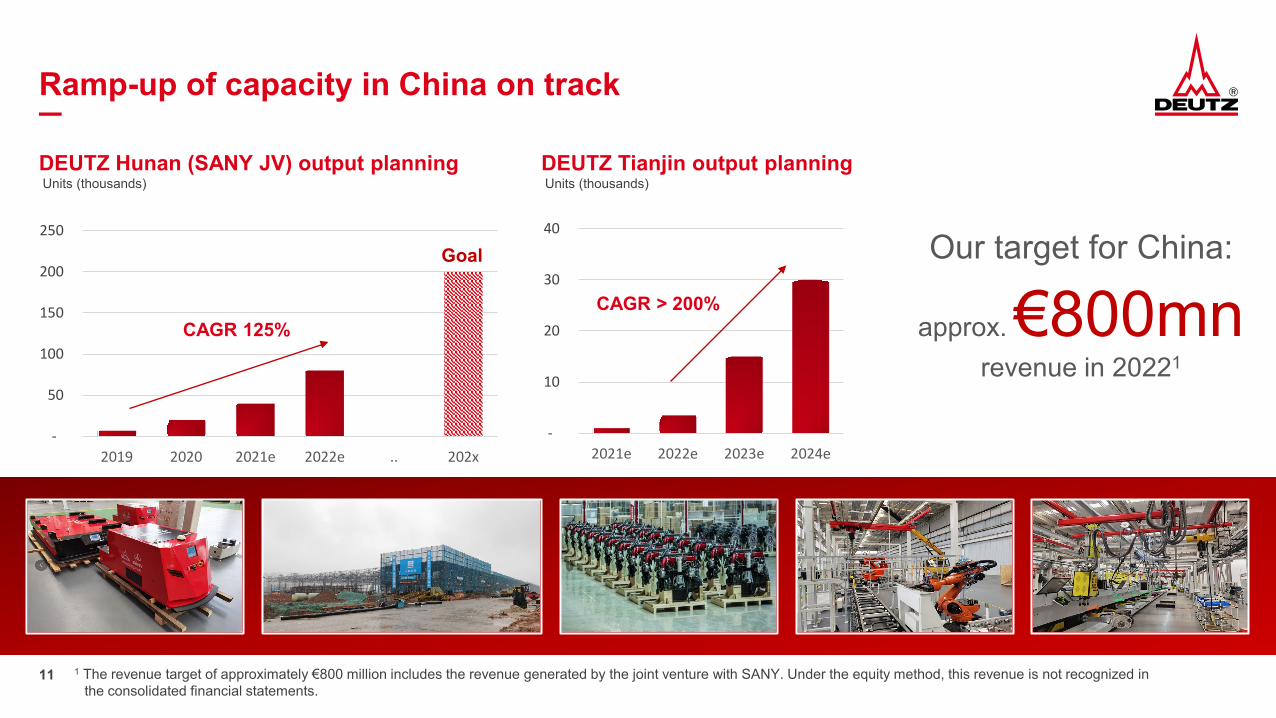
DEUTZ Tianjin output planningUnits (thousands)
11
Ramp-up of capacity in China on track
-
50
100
150
200
250
2019 2020 2021e 2022e .. 202x
CAGR 125%
-
10
20
30
40
2021e 2022e 2023e 2024e
DEUTZ Hunan (SANY JV) output planningUnits (thousands)
CAGR > 200%
Our target for China:
approx. €800mn revenue in 20221
1 The revenue target of approximately €800 million includes the revenue generated by the joint venture with SANY. Under the equity method, this revenue is not recognized in the consolidated financial statements.
Goal

Our service target:
approx. €400mn revenue in 2021
12
Ongoing expansion of the profitable service business
Revenue from the service business€ million
278.4 287.3309.2
329.9
2015 2016 2017 2018 2019 2020
CAGR +4.6%
New distribution channels and expansion of existing network: expansion of our own service centers, acquisition of DEUTZ Austria, Motorcenter Austria, Pro Motor Servis CZ in 2020
Digital services: diagnostics and interpretation of errors, DEUTZ advanced service tool, digital service and repair checklist New 'analog' service concepts and products: expansion of Xchange, mobile service technicians,
servicing and repair of non-DEUTZ engines, parts warranty, E-DEUTZ services
352.4 348.3

Agenda
13
Numbers
Agenda

14
Overview
Sharp decline in sales figures and EBIT before exceptional items in 2020 compared with 2019 due to coronavirus
Noticeable upward trend in the market – significant improvement in business performance in the final quarter of 2020 compared with previous quarters
Successful launch of the Transform for Growth efficiency program – restructuring costs totaling €31.9 million recognized as an exceptional item in 2020
Focused implementation of the growth initiatives despite the coronavirus crisis
Expansion of sustainability efforts
Improved outlook for 2021

15
Sales figures for 2020, yoy
New orders€ million
1,654.3
1,322.5
-20.1%
211,667
150,928
Unit salesUnits
-28.7%
1,840.8
1,295.6
Revenue€ million
-29.6%
2019 2020 2019 2020 2019 2020
20,942 <<<<<<<<<<
thereofTorqeedo
Huge fall in new orders due to the coronavirus crisis and the resulting reluctance to invest, and due to adverse effects relating to the advance production of engines
Torqeedo's unit sales jumped by 43% compared with 2019, mainly due to ramp-up of smaller trolling motors Orders on hand of €269.0 million as at December 31, 2020 (December 31, 2019: €253.3 million)
29,894
Q4 vs Q3: +25.5% Q4 vs Q3: +22.1% Q4 vs Q3: +19.2%
16
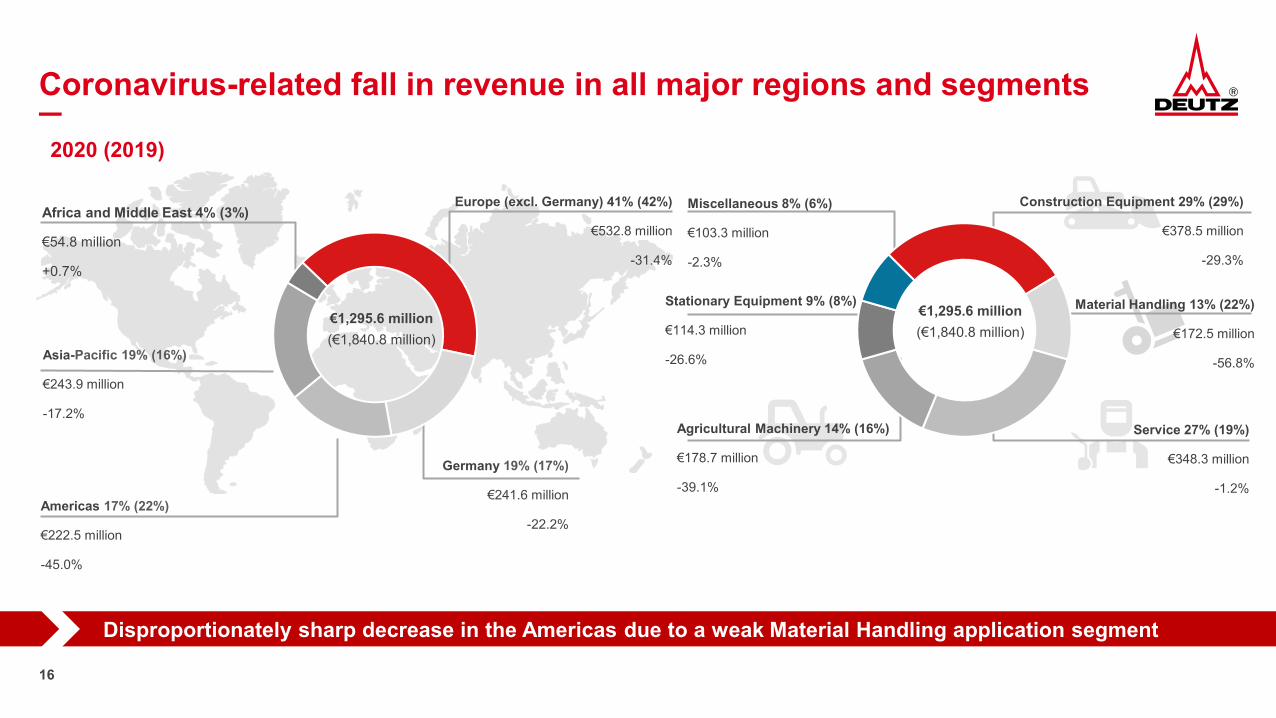
Coronavirus-related fall in revenue in all major regions and segments
2020 (2019)
Germany 19% (17%)
€241.6 million
-22.2%
Asia-Pacific 19% (16%)
€243.9 million
-17.2%
Americas 17% (22%)
€222.5 million
-45.0%
Europe (excl. Germany) 41% (42%)
€532.8 million
-31.4%
Africa and Middle East 4% (3%)
€54.8 million
+0.7%
€1,295.6 million(€1,840.8 million)
Disproportionately sharp decrease in the Americas due to a weak Material Handling application segment
Material Handling 13% (22%)
€172.5 million
-56.8%
Stationary Equipment 9% (8%)
€114.3 million
-26.6%
Miscellaneous 8% (6%)
€103.3 million
-2.3%
Service 27% (19%)
€348.3 million
-1.2%
Construction Equipment 29% (29%)
€378.5 million
-29.3%
Agricultural Machinery 14% (16%)
€178.7 million
-39.1%
€1,295.6 million(€1,840.8 million)

108.2 104.3
17
R&D: spending and capital expenditure
95.881.4
R&D spending (after deducting grants)€ million
Capital expenditure (after deducting grants)2€ million
5.2% 6.3%
R&D ratio1
1 Ratio of net R&D expenditure (after deducting grants) to consolidated revenue. 2 After deducting grants; capital expenditure on property, plant, and equipment (including right-of-use assets for leases) and intangible assets, including capitalization of R&D. 3 Right-of-use assets for leases under IFRS 16.
2019 20202019 2020
-3.6%
<<<<<<<<<<
thereof additions as a result of leases3
10.432.4
Disproportionately strong rise in the R&D ratio caused by sharp fall in revenue Reduction in capital expenditure as a result of cost-cutting measures being implemented
5.9% 8.1%
-15.0%
18
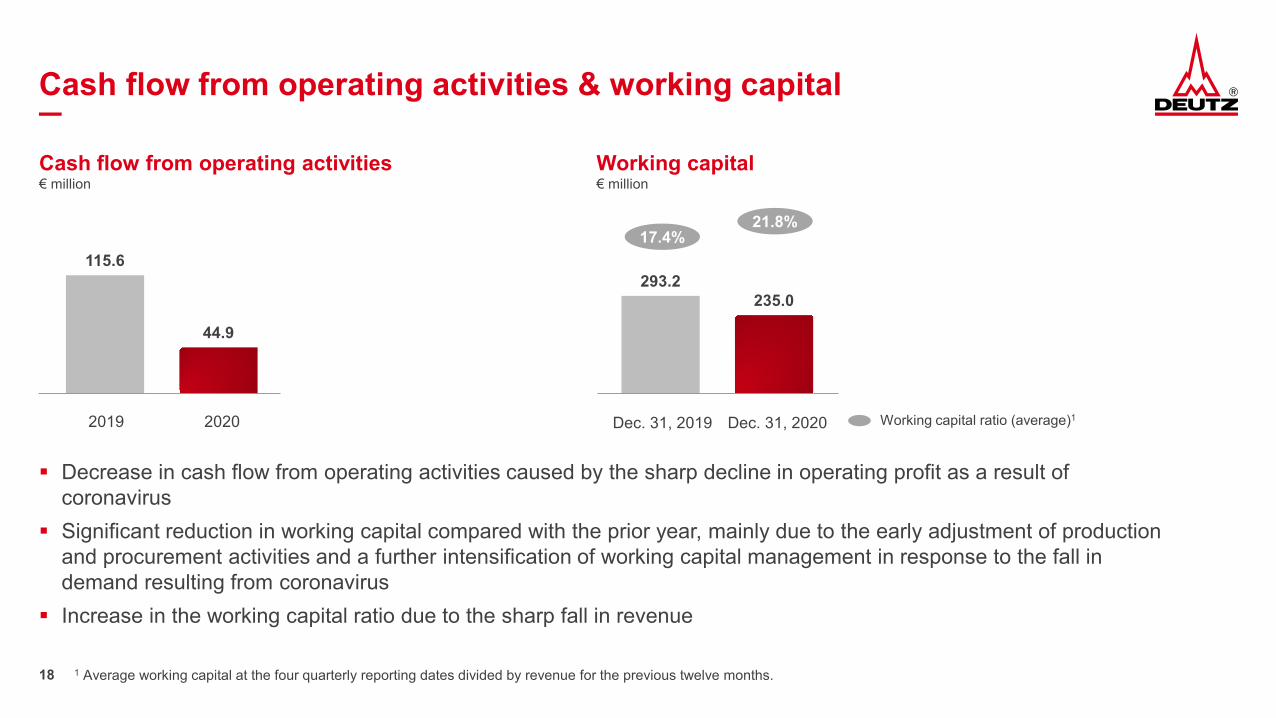
Cash flow from operating activities & working capital
115.6
44.9
Cash flow from operating activities€ million
2019 2020
293.2235.0
Working capital€ million
Dec. 31, 2019 Dec. 31, 2020
17.4%21.8%
Working capital ratio (average)1
Decrease in cash flow from operating activities caused by the sharp decline in operating profit as a result of coronavirus
Significant reduction in working capital compared with the prior year, mainly due to the early adjustment of production and procurement activities and a further intensification of working capital management in response to the fall in demand resulting from coronavirus
Increase in the working capital ratio due to the sharp fall in revenue
1 Average working capital at the four quarterly reporting dates divided by revenue for the previous twelve months.

19
Free cash flow and net financial position
Free cash flow1€ million
-15.2
-83.8
Net financial position€ million
Dec. 31, 2019 Dec. 31, 2020
Proactive management of capital expenditure and working capital clearly helped to offset the coronavirus-related decrease in cash flow from operating activities; reduction in investing activities compared with 2019
In Q4 2020, free cash flow rose sharply to €43.0 million because of the higher volume of business, optimization of working capital, and the first positive effects from the efficiency program
Deterioration in net financial position owing to the impact of the coronavirus crisis and a rise in lease liabilities to €58.0 million (December 31, 2019: €41.9 million)2
1 Cash flow from operating activities and from investing activities less interest expense. 2 Lease liabilities under IFRS 16.
-36.6 -35.8
2019 2020

20
Sufficient medium- and long-term funding options
1,301.2
652.4
1,180.5
535.2
Equity ratio€ million
Funding€ million
Dec. 31, 2019 Dec. 31, 2020
50.1%45.3%
Total assets Equity Equity ratio Repayment profile Term of credit lines
Syndicated credit lines totaling €310 million− €150 million maturing in November 2021, with an extension option (amount drawn down as at December 31, 2020: €0 million)− €160 million maturing in June 2024 (amount drawn down as at December 31, 2020: €65 million)
Long-term bank loans and syndicated credit lines
75.6
13.6
150 160
up to 1 year 1 to 5 years

Agenda
21
Outlook
Agenda

22
Group guidance for 2021
Actual 2020 Guidance for 2021
Unit sales 121,034 engines1 at least 130,000 engines1
Revenue €1,295.6 million at least €1.40 billion
EBIT margin (before exceptional items) -5.8% to at least break even
Free cash flow minus €35.8 million negative low- to mid-double-digit million euro amount2
Difficulties with the supply of some components will have an adverse impact in the first half of the year and possibly longer
Positive exceptional item from payment of the final installment of the purchase price for the sale of the Cologne-Deutz site, which is expected to be made in 20212
1 Excluding electric motors of DEUTZ subsidiary Torqeedo. 2 Depending on the timing of payment of the final installment of the purchase price, the amount and date of which depend on when the development plan for the site is formally approved by the City of Cologne.

> €2 billion revenue
7–8% EBIT margin
before exceptional items
Our targets for 2023/2024:
23
Medium-term targets for 2023/2024
DEUTZ has taken the steps that are needed for sustained profitable growth
Technology-neutral approach to development of the product portfolio and expansion of the high-margin service business
Implementation of regional growth initiatives
Systematic implementation of the Transform for Growth efficiency program, with targeted gross cost savings of €100 million p.a. from the end of 2022
− Adjustment of staff costs and operating costs
− Optimization of the global production network
− Reduction of complexity

24
Thank you for your attention!

25
Financial calendar and contact details
Contact
Christian Ludwig, CFASVP Communications & Investor Relations
+49 (0)221 822 [email protected]
Financial calendar 2021
Annual General Meeting (virtual)
April 29
Quarterly statement for Q1 2021 May 6
Interim report for H1 2021 August 12
Quarterly statement for Q3 2021 November 10
Follow us:
DEUTZ online annual report for 2020Including a KPI tool and interactive features:
https://annualreport.deutz.com/2020