deutsche bahn fixed income roadshow asia 2012 · september 2012. deutsche bahn ag / db mobility...
TRANSCRIPT

“Our future: Sustainably successful!“
Deutsche Bahn Fixed Income Roadshow Asia 2012

September 2012
Deutsche Bahn
AG / DB Mobility Logistics AG
CFO
Robert Strehl
DB2020 -
Our future: Sustainably successful!

3
Intro
Our future
Deutsche Bahn AG Road Show Asia 2012

4
Solid financial position, sustainable profit growth
Key investment highlights
DB Group combines stability with a good position for future growth
Key investment highlights
Strong track record in all key financial figures
Leading market position in all relevant markets
Core competence in managing transport networks
Balanced business mix of growth and value
Megatrends support our future growth potential
Unique geographic position in the heart of Europe
Profitable growth path continued since 2009
Very good ratings from Moody’s (Aa1), S&P (AA) and Fitch (AA)
Deutsche Bahn AG Road Show Asia 2012

5
Integrated Group structure with two holding companies (DB AG and DB ML AG) and 9 business units
DB AG is 100% owned by the Federal Republic of Germany
Privatization threshold: constitutionally mandated Federal majority shareholding in DB AG (“ownership clause”)
Infrastructure business units are directly managed by DB AG
DB ML AG operates as a holding company for DB Group’s mobility and logistics activities
Financing subsidiary DB Finance is 100% owned by DB AG
DB Bahn Long-
Distance
Deutsche Bahn AG
DB Netze Track
DB Netze Stations
DB Netze Energy
DB Bahn Regional DB Arriva
DB Schenker
Rail
DB Schenker Logistics
DB Services
DB Mobility Logistics AG
DB ML Group
DB Group
Structure
Organizational structure
Deutsche Bahn Finance B.V.
(DB Finance)
100%
100%
100%
Federal Republic of Germany
Deutsche Bahn Group Comments
Deutsche Bahn AG Road Show Asia 2012

6
Where do we come from
Turnaround of German railway business was key to success
171 174191
171184 191
388
327
299
261
239221
206194
184 177 173161160155153159159
149145144139140
127135
151154
164
149 154 154 156 157
720
893
1,106
1,247
1,1671,133
1,042
603533
468413
656
328
1,1841,220
820863 860
975
'93 '94 '95 '96 '97 '98 '99 '00 '01 '02 '03 '04 '05 '06 '07 '08 '09 '10 '11
Ptkm (bn) Employees - rail (thd, year average) Productivity
2.3
1.91.7
2.52.4
0.5
1.0
1.4
2.1
-0.4-0.7-0.8
-1.5-1.7
-2.1-2.2
-2.7-3.0
6.1%
5.4%
5.7%7.4%
7.6%
-20.3%
-17.5%
-14.6%-13.3%
-11.1%
-9.8%
-5.0% -4.6%
-2.2%
7.1%
5.4%4.0%
1.6%
1994 1995 1996 1997 1998 1999 2000 2001 2002 2003 2004 2005 2006 2007 2008 2009 2010 2011
EBIT adjusted Adj. EBIT margin
1993-2011:
+272%CAGR:
+7.6%1994-2011:
€
+5.3 bnPer year:
€
+294 mn
Figures until 2004 FY according to German GAAP
Productivity –
rail (thousand ptkm/employee)
EBIT adjusted and adjusted EBIT margin (€
bn or %)
Deutsche Bahn AG Road Show Asia 2012

7
16.616.9
15.015.916.5
19.619.7
2005 2006 2007 2008 2009 2010 2011
15.114.3
13.112.2
11.0
9.2
7.7
2005 2006 2007 2008 2009 2010 2011
Where do we come from
Equity ratio significantly improved, financial debt noticeably decreased
Equity (€
bn) Net financial debt (€
bn)Equity ratio (%)
29.227.527.6
25.2
22.6
19.0
16.3
2005 2006 2007 2008 2009 2010 2011
-15.7%/-€
3.1 bn +96.1%/+€
7.4 bn +12.9 %-points
Deutsche Bahn AG Road Show Asia 2012

8
Where do we come from
Key value management figures significantly improved
ROCE
(%)
7.3
6.05.9
8.98.7
7.5
5.0
'05 '06 '07 '08 '09 '10 '11
20.5
18.119.4
22.521.1
18.6
14.7
'05 '06 '07 '08 '09 '10 '11
256
213
151
131115 118
110
'05 '06 '07 '08 '09 '10 '11
3.2
3.63.4
3.13.2
3.9
4.8
'05 '06 '07 '08 '09 '10 '11
Redemption coverage (%) Gearing
(%) Net debt/EBITDA (multiple)
Target: 10%Target: 30%
Target: 100%
Target: 2.5
Deutsche Bahn AG Road Show Asia 2012

9
InfrastructureNo.1
Rail infrastructure
No.1Operation of railway stations
Passenger Transport
No.1Local rail transport
No.2Long-distance rail transport
No.2Bus transport
Transport & Logistics
No.1Rail freight transport
No.1Land transport No.
Ocean freight
6Contract logistics
No.2Air freight
3No.
Where we are today
We hold leading market positions in Europe and the world
Deutsche Bahn AG Road Show Asia 2012

10
Where we are today
We are operating today in more than 130 countries with more than
2,000 sites
DB world wide
(examples)
Own sites Partners
Transfesa (DB SR)
DB Schenker Spain-Tir (DB SL)
DB Arriva Spain
DB Schenker
Brasil (DB SL)
DB International
DB Schenker China (DB SL)
DB International
Railion Russija Services (DB SR)
DB Schenker Russia (DB SL)
DB International
DB Schenker Australia (DB SL)
ECR (DB SR)
DB Schenker-Joyau
(DB SL)
DB Schenker Rail UK
DB Schenker UK
DB Arriva UK
DB Vertrieb UK
Deutsche Bahn AG Road Show Asia 2012

11
Entrepreneurial approach to business
Integrated
GroupCross-modal solutions
Internationally positioned
Where we are today
Our success is based on four factors
Deutsche Bahn AG Road Show Asia 2012

12
Challenges and opportunities of the future
The megatrends of the future
Deutsche Bahn AG Road Show Asia 2012

13Source: In-house figures as well as Progtrans, BMVBS figures
Ocean freight
Air freight
Land transport
Rail freight transport
Rail passenger transport
Public road/passenger transport
Contract logistics >+100
+80
+60
+35
+35
+10
+5
Market growth 2010 –
2020 % based on volumes (rounded figures)
Challenges and opportunities of the future
Transport markets will expand further in the future
Deutsche Bahn AG Road Show Asia 2012
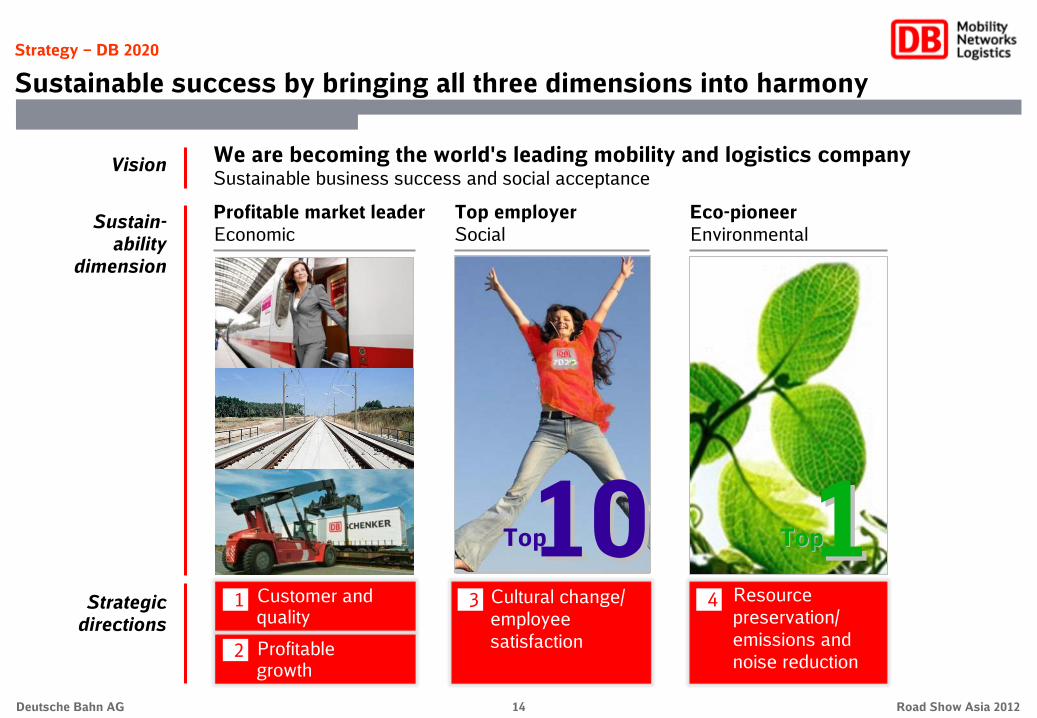
14
Customer and quality
Profitable growth
Strategic directions
Vision We are becoming the world's leading mobility and logistics company
Sustainable business success and social acceptance
1
2
3 4Cultural change/ employee satisfaction
Resource preservation/ emissions and noise reduction
Sustain-
ability
dimension
Profitable market leaderEconomic
Top employerSocial
Eco-pioneerEnvironmental
TopTop TopTopTopTop 11101011
Strategy ‒
DB 2020
Sustainable success by bringing all three dimensions into harmony
Deutsche Bahn AG Road Show Asia 2012

15
Strategy ‒
DB 2020
For people, for markets, for tomorrow
Deutsche Bahn AG Road Show Asia 2012

September 2012
Deutsche Bahn AG / DB Mobility Logistics AG
Group Treasurer, Head of M&A
Wolfgang Reuter
2011 Financial Year, H1 2012, Capital Market Activities and Outlook

17Deutsche Bahn AG Road Show Asia 2012
1.9
2.3
2010
2011 5.1
4.72010
2011 16.6
16.92010
2011 7.3
6.02010
2011
Favorable effects from performance development
Noticeable increase in revenues and adjusted EBIT
First-time full-year inclusion of Arriva
Further decline in net financial debt
Value management figures improved
Highlights
Revenues (€
bn) EBIT adjusted
(€
bn) Net financial debt (as of Dec 31, €
bn)ROCE
(%)
2010
2011
EBITDA adjusted
(€
bn)
2011 financial year –
At a glance
Update on financial results 2011
34.4
37.9
+10.1% +23.7% +10.5% -2.0%

18
Germany again with the strongest economic development in EuropeEconomic momentum slows down noticeablyUncertainties due to sovereign debt crisis are still existingHigh burdens from increasing energy and personnel expenses
H1 2012 –
At a glance
Highlights H1 2012
Positive development in rail passenger transport in Germany In Europe development varying from country to country
Performance decrease in rail freight transportMixed picture in the area of transport and logistics: strong increase in ocean freight, slight increase in European land transport, decrease in
air freight
Train-path demand slightly lowerDemand from non-Group railways increased again, share of total at 21.7%
Business
environment
Passenger
Transport
Transport and
Logistics
Infrastructure
Deutsche Bahn AG Road Show Asia 2012

19
Key figures (€
mn)
EBIT adjusted
Net profit
Net financial debt as of Jun 30, 2012/ Dec 31, 2011
1,321
794
16,954
19,492
19,220
H1 2012 –
At a glance
Favorable development in H1 2012
H1 2012
Revenues
Revenues comparable
+16.6
+22.5
+2.2
+3.3
+1.8
€ %Change
+188
+146
+362
+616
+344
+13.0+349Gross capital expenditures 3,038
+34.2+359Net capital expenditures 1,408
ROCE (%) 8.1 ––
H1 2011
1,133
648
16,592
18,876
18,876
2,689
1,049
7.2
Deutsche Bahn AG Road Show Asia 2012
20
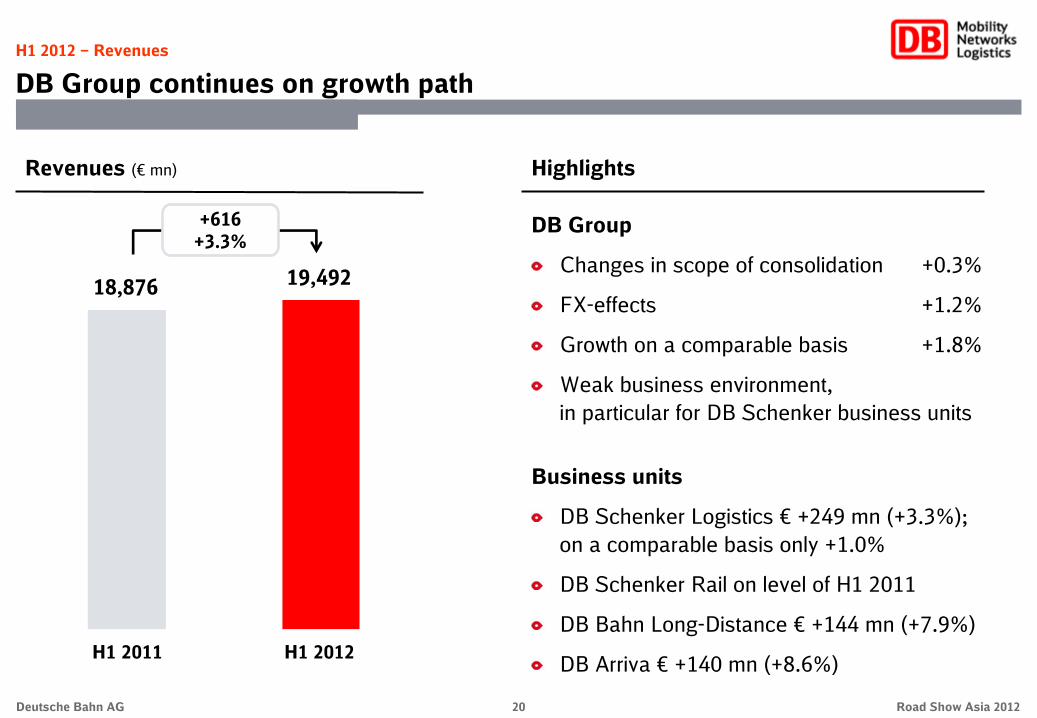
Revenues (€
mn)
H1 2012 –
Revenues
DB Group continues on growth path
H1 2011 H1 2012
18,876 19,492
+616
+3.3%
Highlights
DB Group
Changes in scope of consolidation
+0.3%
FX-effects
+1.2%
Growth on a comparable basis
+1.8%
Weak business environment, in particular for DB Schenker business units
Business units
DB Schenker Logistics €
+249 mn (+3.3%); on a comparable basis only +1.0%
DB Schenker Rail on level of H1 2011
DB Bahn Long-Distance €
+144 mn (+7.9%)
DB Arriva €
+140 mn (+8.6%)H1 2011 H1 2012
Deutsche Bahn AG Road Show Asia 2012

21
H1 2012 –
Revenues
No significant changes in revenue structure
4%7%
1%
58%30%
41%
1% 7%
51%
52% 48%
Revenues by division H1 2012
Germany
Europe (excl. Germany)
North America
Asia/Pacific
Other
Passenger Transport
Transport and Logistics
Infrastructure
(H1 2011)
(52%)
(41%)
(6%)(1%)
Other
(59%)(29%)
(1%)
(5%)(6%)
Revenues by regions H1 2012
(H1 2011)
Revenues by activities H1 2012
Rail Non-rail
(H1 2011)
(48%)(52%)
Deutsche Bahn AG Road Show Asia 2012

22
H1 2012 –
Profits
EBIT development significantly positive
EBIT and EBIT adjusted (€
mn)
EBIT Special items EBIT adjusted
H1 2011 H1 2012
+23.8%
+16.6% +188
EBIT Special itemsEBIT adjusted Reclassifications
1,076 +57 1,133
1,321 -40 +51 1,332
Deutsche Bahn AG Road Show Asia 2012

23
9.8
10.1
1.0
2.6
2.91)
17.1
25.0
3.8
-
6.8
5.3
Margin (%)
H1 2012–
Profits
Mixed EBIT development on business units level
EBIT adjusted (€
mn)
DB Bahn Long-Distance
DB Bahn Regional
DB Schenker Rail
DB Schenker Logistics
DB Services
DB Netze Track
DB Netze Stations
DB Netze Energy
Other/Consolidation
DB Group
DB Arriva
46
477
58
170
80
262
124
24
-179
1,133
71
H1 2011
192
447
24
201
48
398
140
55
-278
1,321
94
H12012
+146 -
-30 -6.3
-34 -58.6
+31 +18.2
-32 -40.0
+136 +51.9
+16 +12.9
+31 +129
-99 +55.3
+188 +16.6
+23 +32.4
€ %Change
2.5
10.9
2.3
2.3
5.11)
11.5
23.1
1.7
-
6.0
4.4
Margin (%)
1)
Based on segment revenuesDeutsche Bahn AG Road Show Asia 2012

24
Dec 31, 2011 Jun 30, 2012
Deutsche Bahn AG Road Show Asia 2012
Balance sheet structure (as of Jun 30, 2012/Dec 31, 2011)
H1 2012 –
Balance sheet
Strong increase of capital expenditures
Equity and liabilitiesAssets
Non-current assets82.5% (85.1%)
Current assets 17.5% (14.9%)
Equity28.7% (29.2%)
Pension prov.3.8% (3.8%)
€ 53.5 bn(€
51.8 bn)Total€
53.5 bn(€
51.8 bn)Total
Financial debt36.7% (35.4%)
Other provisions10.2% (10.8%)
Other20.6% (20.8%)
Capital expenditures (€
mn)
H1 2011 H1 2012
2,689
3,038
Gross:
+349
+13.0%
1,049
1,408
Net: +359
+34.2%
Financial debt (€
mn; as of Dec 31, 2011 / Jun 30, 2012)
18,351
19,639
Net:
16,592Net:
16,954
+362+2.2%
+1,288+7.0%

25Deutsche Bahn AG Road Show Asia 2012
Debt and financing
Expected funding requirements in 2012
Bond issues 2011/12
Redemptions (2012) -2.0
Net liquidity
(as of Jan 1, 2012) +1.7
Net capex / other -4.2
Net liquidity
(as of Dec 31, 2012) +1.7
Anticipated funding requirements 2012 (€
bn)
Operating cash flow +4.8
Dividend for 2011 financial year -0.5
Bond issues (as of June 30, 2012) +1.4
Planned additional bond issues in 2012 +0.5
MaturityCurrency
4.6YNOK 1.72 17
5.5YCHF 2.20 40
12YCHF 3.32 72
13.9YEUR 3.47 85
12YEUR 3.12 71
€ all-in-
costs (%)
Swap spread (BP)Million
750
150
100
98
500
10YGBP 2.82* 71400
2012: 6 transactions / €
1.4 bn
2011: 11 transactions / €
2.1 bn
Including 5 transactions with Asian investors
in HKD, EUR and USD (€
377 mn)
*Not swapped, cost in GBP.

26
Ratings
Very good ratings:
Moody’s:
Aa1/negative S&P: AA/stable
Fitch:
AA/stable
Key rating driver:
Improvements in performance, revenues and profits
Bond issues (€
bn)
Debt and financing
Rating and financing activities
Stable financial profile, sound financing structure and conservative funding strategy
DB guarantees overall mobility in Germany and is Europe‘s largest company providing integrated mobility, transport and logistics services
Federal obligations resulting from Art. 87e German Constitution-
“Infrastructure obligations”: High share in funding of infrastructure capex in Germany,
-
“Public interest obligations”: Funds for ordering local passenger transport services in Germany, amounting to around €
6.9 bn p.a.
-
Privatization threshold: constitutionally mandated Federal majority shareholding (“ownership clause”)
1.4
2.1
2.5
2.2
0.6
1.81.71.7
2.2
1.21.0
00
2000 2001 2002 2003 2004 2005 2006 2007 2008 2009 2010 2011 2012
Total: €
18.4 bn, Ø
p.a.: €
1.4 bn
2012 2013 2014 2015 2016 2017 2018 2019 2020 2021 2022 2023 2024 2025 2026
Maturity profile of financial debt (as of Jun 30, 2012; €
bn; incl. underlying swaps)
Bonds Eurofima EIBBank Federal loans Leasing
1.8
1.41.2
1.1
2.3
1.71.9 1.8
1.7 1.7
1.1
0.2
0.7
0.2
0.6
1.6
Deutsche Bahn AG Road Show Asia 2012

27
(€
mn) 2011
ROCE (%)
>7.5
Revenues adjusted ~40,000
EBIT adjusted >2,600
Outlook 2012 (as of March 2012)
7.3
37,901
2,309
2012 financial year –
Outlook
Outlook for 2012 financial year is still positive
Net financial debt (as of Dec 31)
16,592
Gross capital expenditures
7,501
>7.5
~39,000
>2,600
Outlook 2012 (as of July 2012)
Change
Dampened growth expectations at DB Schenker
Outlook confirmed
Outlook confirmed
Outlook confirmed
Outlook confirmed
Deutsche Bahn AG Road Show Asia 2012

Appendix
29
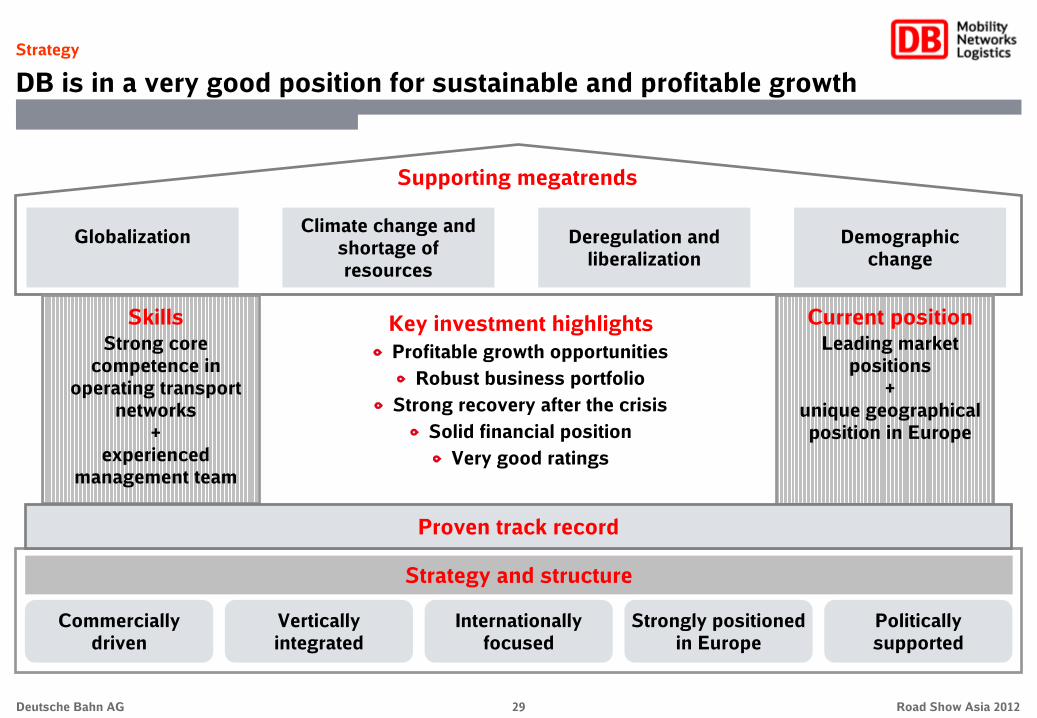
Strategy
DB is in a very good position for sustainable and profitable growth
SkillsStrong core
competence in operating transport
networks +
experienced management team
Supporting megatrends
Globalization Climate change and shortage of resources
Deregulation and liberalization
Demographic change
Key investment highlightsProfitable growth opportunities
Robust business portfolioStrong recovery after the crisis
Solid financial positionVery good ratings
Current positionLeading market
positions
+
unique geographical position in Europe
Strategy and structure
Vertically integrated
Internationally focused
Politically supported
Strongly positioned in Europe
Commercially driven
Proven track record
Deutsche Bahn AG Road Show Asia 2012

30
Leading market position
Revenues (€
bn)
Appropriate returns
ROCE (%)
Financial stability
Redemption coverage (%)
6%
≥10%
18%
≥30%
34.4
70
As
a
profitable
market leader we offer our customers
first-class
mobility and logistics solutions
11TopTop
Strategy –
DB 2020
We want to become the profitable market leader by 2020
Deutsche Bahn AG Road Show Asia 2012

31
Strategy –
DB 2020
We want to improve customer satisfaction
1)
Including €
34 billion DB funds
86Areas for action (selected examples)
Expand customer information and service
Modernization of vehicle fleet
Upgrade and expand infrastructure
Consistent process quality
Link global IT systems together
Modernize and expand passenger stations
Push product and process innovation
Customer and quality
Information and Service
Gross capital expendituresuntil 2020
billion €1)
Deutsche Bahn AG Road Show Asia 2012

32
Acquisitions and
tenders
Expand existing and
new customer business
+100%
34,4
70
Profitable growth Areas for action
(selected examples)
Retain integrated structure and entrepreneurial approachImprove capacity utilization and productivity Develop, optimize and integrate transport networksTake advantage of opportunities arising from liberalization of European passenger transport marketExpand industrial competenceFurther development of cross-modal mobility and logistical
Strategy –
DB 2020
We intend to defend and expand our leading market position
Deutsche Bahn AG Road Show Asia 2012

33
Top 10 in Germany
Top 20 in Germany
…
…
NEW
TopTop
As a top employer
we
win and build loyalty with qualified employees
who work
with enthusiasm for DB and its customers
I’m a proud DB
employee
Strategy –
DB 2020
We want to become one of the top employers
Deutsche Bahn AG Road Show Asia 2012

34
Cultural change/ employee satisfaction
employeesenthusiastically
work
for DB and its customers
Qualified Areas for action (selected examples)
Regional future-focused discussions
Employee satisfaction
Employer attractiveness
Manage demographics
Understanding leadership
Diversity in leadership
Compatibility of career and family
Internationalization
Talent Pools
Career planning
Strategy –
DB 2020
We want to significantly increase employee satisfaction
Deutsche Bahn AG Road Show Asia 2012

35
Cultural change/ employee satisfaction
Strategy –
DB 2020
Our values form the foundation of how we interact with each other
Deutsche Bahn AG Road Show Asia 2012

36
Specific CO2
-
emissions DBShare of renewable energy in the DB Bahn energy mix
-15%TopTop
+75%
Noise emissions –
rail
-50%
20%
35%
Strategy –
DB 2020
By 2020 we’ll be recognized as the pioneer of environmental measures
As an eco-pioneer our products set standards for the efficient use of resources
Deutsche Bahn AG Road Show Asia 2012

37
Resource preservation/ emissions and noise reduction We are a leader in
environmental protection
Areas for action (selected examples)
Use of wind and hydro-
electric energy
Noise abatement
Efficient use of energy
Freight transport using Eco Solutions
CO2
-free offers for passenger transport
Electro-mobility on the road
Efficient usage of materials and resources
Strategy –
DB 2020
We will expand our leading environmental position
Deutsche Bahn AG Road Show Asia 2012

38
Sustained recovery of global economy (GDP world +2.5%)Germany as a driver of economic growth in Europe
(GDP +3.0%)Economic development weakened during the course of the yearPrevailing insecurities as a result of the Euro-/debt crisisHigh cost burdens due to increase in energy, personnel and maintenance expenses
2011 Financial Year –
Overview
Highlights 2011
Positive development of German rail passenger transportFirst-time full-year inclusion of Arriva; major success in tender procedures in Denmark and Sweden
Rail freight transport again with strong growth Varying development in freight forwarding and logistics: strong growth in European land transport, further growth in ocean freight, decline in air freight
Train-path demand reached a new all time high at 1,051 mn train-path kmNon-Group demand showed again double digit growth rates, share of total train-path demand increased to 20.9%
General conditions
Passenger transport
Transport and
logistics
Infrastructure
Deutsche Bahn AG Road Show Asia 2012

39
Key figures (€
mn)
EBIT adjusted
Net profit for the year
Net financial debt as of Dec 31
2,309
1,332
16,592
37,901
35,888
2011 Financial Year –
Overview
Strong development in 2011 financial year
2011
Revenues adjusted
Revenues comparable
+23.7
+25.9
-2.0
+10.1
+4.3
€ %Change
+443
+274
-347
+3,491
+1,481
+8.9+610Gross capital expenditures 7,501
+24.0+497Net capital expenditures 2,569
ROCE (%) 7.3 --
2010
1,866
1,058
16,939
34,410
34,407
6,891
2,072
6.0
Deutsche Bahn AG Road Show Asia 2012
40
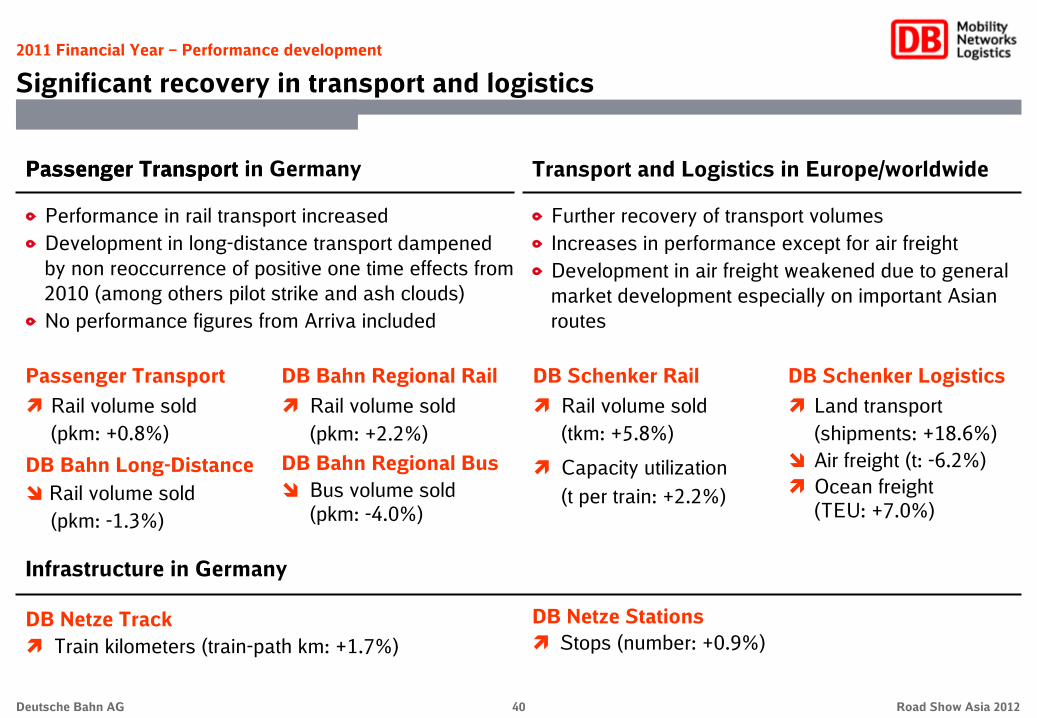
2011 Financial Year –
Performance development
Significant recovery in transport and logistics
Performance in rail transport increasedDevelopment in long-distance transport dampened by non reoccurrence of positive one time effects from 2010 (among others pilot strike and ash clouds)No performance figures from Arriva included
Passenger Transport
DB Netze Track
Train kilometers (train-path km: +1.7%)
Infrastructure in Germany
DB Netze Stations
Stops (number: +0.9%)
Passenger Transport
Rail volume sold (pkm: +0.8%)
DB Bahn Long-Distance
Rail volume sold (pkm: -1.3%)
DB Bahn Regional Rail
Rail volume sold (pkm: +2.2%)
DB Bahn Regional Bus
Bus volume sold (pkm: -4.0%)
Further recovery of transport volumesIncreases in performance except for air freightDevelopment in air freight weakened due to general market development especially on important Asian routes
Transport and Logistics in Europe/worldwide
DB Schenker Rail
Rail volume sold (tkm: +5.8%)
Capacity utilization (t per train: +2.2%)
DB Schenker Logistics
Land transport (shipments: +18.6%)
Air freight (t: -6.2%)
Ocean freight
(TEU: +7.0%)
Passenger Transport in Germany
Deutsche Bahn AG Road Show Asia 2012

41
2011 Financial Year –
Revenues
Further increase in revenues
35,88835,87634,410
37,979 37,901 2,025 1278
Revenues (€
mn)
2010 2011 2011comparable
+10.4%
Changes in scope of
consolidation
+1,478 / +4.3%
FX
effects
2011adjusted
-5.8%-P. -0.0%-P.
Special items
-0.3%-P.
Deutsche Bahn AG Road Show Asia 2012

42
2011 Financial Year –
Revenues
Revenue increases across all business units
DB Group
Total revenues (€
mn)
+1,481 +4.3-2,0222) 12
€ %
Changes
DB Schenker Logistics +542 +3.8-1 -14
DB Netze Track +62 +1.4- -
DB Netze Stations +33 +3.2- -
DB Netze Energy +352 +14.1- -
DB Bahn Long-Distance +56 +1.5-8 -1
DB Bahn Regional +115 +1.3- -
DB Arriva +145 +11.7-2,001 15
DB Services +139 +10.9- -
DB Schenker Rail +340 +7.4-12 12
Other/Consolidation -303 +4.1- -
Consol.1) FX
Changes
35,888
14,852
4,642
1,077
2,853
3,785
8,718
1,381
1,413
4,924
-7,754
34,410
2010
14,310
4,580
1,044
2,501
3,729
8,603
1,236
1,274
4,584
-7,451
37,901
2011
14,867
4,642
1,077
2,853
3,794
8,718
3,367
1,413
4,924
-7,754
2011
comp.
1) Scope of consolidation; 2)
Net amount, including €
3 mn from 2010Deutsche Bahn AG Road Show Asia 2012

43
572,309
1,8661,817
75
49
2,177
2011 Financial Year –
Profits
EBIT development significantly positive
EBIT and EBIT adjusted (€
mn)
EBIT Special items EBIT adjusted
2010 2011
+19.8%
+23.7% +443
EBIT Special itemsEBIT adjusted Reclassifications
Deutsche Bahn AG Road Show Asia 2012

44
2011 Financial Year –
Profit development
Differentiated EBITDA development by business units
Changes
by business units (€
mn)
DB Group
DB Schenker Rail
DB Services
DB Netze Track
DB Netze Stations
DB Bahn Long-Distance
DB Bahn Regional
DB Netze Energy
DB Schenker Logistics
DB Arriva
Other/Consolidation
+23 +4.8
+10 +0.7
+183 +129
+34 +11.3
+94 +19.7
-9 -3.1
+100 +6.6
+8 +2.3
-6 -3.6
+53 -12.6
+490 +10.5
EBITDA adjusted (€
mn)
5,141
336
278
1,624
351
504
1,361
159
572
325
-369
2011
4,651
302
287
1,524
343
481
1,351
165
478
142
-422
2010
Deutsche Bahn AG Road Show Asia 2012
€ %
Changes

45
2011 Financial Year –
Profit development
Reconciliation to the adjusted income statement
Income statement (€
mn)
Com-
pounding/
discounting IFRS
Personnel expenses -
Depreciation -
Operating profit | EBIT adjusted -
Net interest | Operating net interest 98
Revenues -
Inventory changes and internally produced and capitalized assets -
Other operating income -
Other operating expenses -
Cost of materials -
Operating profit after interest 98
Other financial result -98
PPA amortization customer contracts -
Extraordinary result -
Results from at equity investments | investment income -
Profit before taxes -
Net investment
income
-
-
-
-
-
-
-
-
-
-
-1
-
-
1
-
PPA-
amorti-
zation
-
75
75
-
-
-
-
-
-
75
-
-75
-
-
-
Personnel-
related provisions
-
-
-114
-
-
-
-114
-
-
-114
-
-
114
-
-
Restruc-
turing of US domestic business
28
13
118
-
-78
-
-22
70
107
118
-
-
-118
-
-
Decommis-
sioning of GKN I
-
-
46
-
-
-
-
-
46
46
39
-
-85
-
-
Other
-
44
7
-
-
7
-76
-
32
7
-
-
-7
-
-
2011
-13,076
-2,964
2,177
-840
37,979
2,457
3,062
-4,375
-20,906
-
3
-
-
19
1,359
2011
adjusted
-13,048
-2,832
2,309
-742
37,901
2,464
2,850
-4,305
-20,721
1,567
-57
-75
-96
20
1,359
RECLASSIFICATIONS ADJUSTMENT OF SPECIAL ITEMS
Deutsche Bahn AG Road Show Asia 2012

46
2011 Financial Year –
Profit development
Significant improvement in operating profits
Adjusted income statement (€
mn) 2010
-11,583
-2,785
1,866
-752
34,410
2.207
2,636
-3,885
-19,134
1,114
-183
-
-49
18
900
Change
-1,465
-47
+443
+10
+3,491
+257
+214
-420
-1,587
+453
+126
-75
-47
+2
+459
Thereof due to changes in scope
of consolidation
-943
-96
+78
-8
+2,022
+4
+55
-281
-683
+70
+2
-50
-
+2
+24
Thereof due to exchange rate
effects
+6
+1
-20
-2
-12
-
-11
-13
+9
-22
-14
-
-
-
-36
2011
-13,048
-2,832
2,309
-742
37,901
2,464
2,850
-4,305
-20,721
1,567
-57
-75
-96
20
1,359
Personnel expenses
Depreciation
Operating profit | EBIT adjusted
Net interest | Operating net interest
Revenues
Inventory changes and internally produced and capitalized assets
Other operating income
Other operating expenses
Cost of materials
Operating profit after interest
Other financial result
PPA amortization customer contracts
Extraordinary result
Results from at equity investments | investment income
Profit before taxes
Deutsche Bahn AG Road Show Asia 2012

47
2011 Financial Year –
Balance sheet
Development of balance sheet
(€
mn, as of Dec 31)
Equity and liabilities
Assets
+/-
Current assets +259
Cash and cash equivalents +228
Equity +810
Non-current liabilities -524
Current liabilities -498
Non-current assets -471
Total assets -212
AssetsEquity and
liabilities
Non-current assets(85%, 2010: 86%)
Current assets
(15%, 2010: 14%)
Equity (29%, 2010: 28%)
Non-current liabilities(47%, 2010: 48%)
Current liabilities
(24%, 2010: 25%)
Maturity structure (as of Dec 31, 2011)
€
51.8 bnTotal€
51.8 bnTotal
Property, plant and equipment -501
Trade receivables +217
Intangible assets +15
Deferred tax assets -10
Financial debt -27
Financial debt -175
Trade liabilities
2011
7,732
1,703
15,126
24,238
12,427
44,059
51,791
37,372
4,094
4,169
1,461
16,367
1,984
4,312 +26
2010
7,473
1,475
14,316
24,762
12,925
44,530
52,003
37,873
3,877
4,154
1,471
16,394
2,159
4,286
Deutsche Bahn AG Road Show Asia 2012

48
4,399
983
500
2,569
347
Reconciliation of decline in net financial debt (€
mn)
Operatingcash flow
2011 Financial Year –
Net financial debt
Decline in net financial debt
Net capex
Changes in
working
capital/Other
Dividend Surplus of funds
Dec 31, 2009 Dec 31, 2010 Dec 31, 2011
-347
16,592
Net financial debt (€
mn)
15,011
13,966
-1,045
DividendArriva
16,092
16,939-847
Deutsche Bahn AG Road Show Asia 2012

49
Net financial debt
+ Commercial paper
+ Bank borrowings (incl. European Investment Bank (EIB))
+ Finance Lease (present value)
+ Other finance liabilities
Financial debt excl. Federal loans
+ Federal loans (present value)
Bonds
+ EUROFIMA loans
-
Cash and cash equivalents and receivables from financing
Financial debt
-347
+/-
+160
-155
+154
-8
+642
-844
+799
-
+804
+145
-202
Financial debt (€
mn; as of Dec 31)
2011 Financial Year –
Financial debt
Components of financial debt
2011
16,592
202
991
1,270
9
16,259
2,092
12,634
1,153
14,980
1,759
18,351
Dec 31, 2010 Dec 31, 2011
18,553 18,351
Net:
16,939Net:
16,592
-347
2010
16,939
42
1,146
1,424
17
15,617
2,936
11,835
1,153
14,176
1,614
18,553
-202
Deutsche Bahn AG Road Show Asia 2012

50
2010 2011
2011 Financial Year –
Capital expenditures
Significant increase of capital expenditures
By business units (€
mn) 2010Gross capital expenditures (€
mn)€ %
Change
DB Group
DB Schenker Rail
DB Services
DB Netze Track
DB Netze Stations
DB Bahn Long-Distance
DB Bahn Regional
DB Netze Energy
DB Schenker Logistics
DB Arriva
6,891
350
177
4,986
511
48
287
144
189
187
Other/consolidation 12
+610
-90
+70
+157
+36
+91
+106
+63
+57
+113
+7
+8.9
-25.7
+39.5
+3.1
+7.0
-
+36.9
+43.8
+30.2
+60.4
+58.3
6,891
7,501
2,0722,569
Net:
+610 +8.9%
+497 +24.0%
2011
7,501
260
247
5,143
547
139
393
207
246
300
19
Deutsche Bahn AG Road Show Asia 2012

51
H1 2012 –
Revenues
Revenue increase in almost all business units
DB Group
Total revenues (€
mn)
+344 +1.8–53 –219
€ %
Change
DB Schenker Logistics +70 +0.9–28 –151
DB Netze Track +59 +2.6– –
DB Netze Stations +22 +4.1– –
DB Netze Energy –8 –0.6– –
DB Bahn Long-Distance +144 +7.9– 0
DB Bahn Regional +60 +1.4– –
DB Arriva +64 +3.9–14 –62
DB Services +39 +6.0– –
DB Schenker Rail –13 –0.5–11 –6
Other/consolidation –93 +2.5– –
Consol.1) FX
Adjustments
19,220
7,536
2,328
559
1,440
1,969
4,425
1,696
687
2,468
–3,888
18,876
H1 2011
7,466
2,269
537
1,448
1,825
4,365
1,632
648
2,481
–3,795
19,492
H1 2012
7,715
2,328
559
1,440
1,969
4,425
1,772
687
2,485
–3,888
H1 2012
comp.
1) Changes in scope of consolidation.Deutsche Bahn AG Road Show Asia 2012

52
H1 2012 –
Profits
In total positive EBIT development on business unit level
EBIT adjusted (€
mn)
+146DB Bahn Long-Distance –
–30DB Bahn Regional –6.3
–34DB Schenker Rail –58.6
+31DB Schenker Logistics +18.2
–32DB Services –40.0
+136DB Netze Track +51.9
DB Netze Stations +16 +12.9
+31DB Netze Energy +129
–99Other/consolidation +55.3
+188DB Group +16.6
+23DB Arriva +32.4
46
477
58
170
80
262
124
24
–179
1,133
71
2011€ %
Change
17,830
2,875
909
32,479
Capital employed
192
447
24
201
48
398
140
55
–278
1,321
94
2012
9,924
1,237
198
16,954
Net financial debt
Deutsche Bahn AG Road Show Asia 2012

53
Capital expenditures (€
mn)
H1 2011 H1 2012
2,689
3,038
Gross:
+349
+13.0%
Highlights
DB Group
Key gross capex are unchanged:
74% Infrastructure
94% Germany
Gross and net capex increased by about €
350 mn respectively €
360 mn
Still delays in delivery of new vehicles, in particular at DB Bahn Regional
Business units
DB Bahn Regional €
+162 mn
DB Netze Track €
+129 mn
H1 2012 –
Capital expenditures
Significantly higher capital expenditures
1,049
1,408
Net: +359
+34.2%
Deutsche Bahn AG Road Show Asia 2012

54
H1 2012 –
Capital expenditures
Significant higher capital expenditures
By business units (€
mn)H1
2011Capital expenditures (€
mn)€ %
Change
DB Group
DB Schenker Rail
DB Services
DB Netze Track
DB Netze Stations
DB Bahn Long-Distance
DB Bahn Regional
DB Netze Energy
DB Schenker Logistics
DB Arriva
2,689
135
97
1,872
190
40
116
39
89
72
Other/consolidation 39
+349
–16
+28
+129
–1
+17
+162
+21
+9
+20
–20
+13.0
–11.9
+28.9
+6.9
–0.5
+42.5
+140
+53.8
+10.1
+27.8
–51.3
2,689
3,038
1,049
1,408
Net:
+359
+34.2%
H1 2012
3,038
119
125
2,001
189
57
278
60
98
92
19
Gross:
+349
+13.0%
H1 2011 H1 2012
Deutsche Bahn AG Road Show Asia 2012

55
Derivation of change in H1 2012 (€
mn)
OperatingCash
flow
H1 2012 –
Net financial debt
Increase in net financial debt as of Jun 30, 2012
Net capex
Working capital/
other
Dividend Fundingneed
+362
Net financial debt (€
mn)
Arriva
+351
-1,408
2,327
-756
-525
-362
Jun 30,
2011
Jun 30,
2012
Dec 31,
2011
Dec 31,
2010
16,939 17,290 16,592 16,954
-347/-2.0%
Deutsche Bahn AG Road Show Asia 2012

56
9.27.9 8.1
11.610.88.7
Dec 31,2010
Dec 31,2011
Jun 30,2012
Dec 31,2010
Dec 31,2011
Jun 30,2012
53.246.040.8
35.1
32.430.6
Dec 31,2010
Dec 31,2011
Jun 30,2012
H1 2012 –
Order book
Order book in regional transport increased significantly
DB order book* (€
bn)
78.471.4
43.432.3 37.3
23.3
21.421.7
Dec 31,2010
Dec 31,2011
Jun 30,2012
58.754.1
0.80.8
18.916.6
DB Group DB Bahn Regional (rail) DB Bahn Regional (bus) DB Arriva
* Secured and unsecured revenues (mostly farebox revenues).
Secured
Unsecured
Deutsche Bahn AG Road Show Asia 2012
88.3
+9.9 +13%
66.7
+7.0 +9.8% +8.0
+14%+4.6
+8.5%
0.7
-0.1
-14%
-
+1.9 +10%
+2.3 +14%
20.8

57
2011 Financial Year –
Order book
€
46 bn of long-term secured revenues in regional transport
Long-term secured revenues (as of Dec 31, 2011) Remarks
5.7 5.4 4.7 4.1 3.3 2.4 2.1 1.7
10.2
5.9
4.0 3.83.8
3.22.7
1.8 1.6 1.4
6.2
3.8
2012 2013 2014 2015 2016 2017 2018 2019 2020 2021ff
Total:
€
78 bn (€
46 bn secured + €
32 bn unsecured) As of December 31, 2011 the volume of revenues secured by long-term rail transport contracts (concession fees) in the DB Bahn Regional business unit increased by €
5.0 billion. The total of unsecured revenues decreased slightly by €
0.3 bn.
As of December 31, 2011, volume of revenues secured by long-term contracts (concession fees) in the DB Arriva business unit increased by €
0.2 billion. The total of unsecured revenues increased by €
2.1 bn.
secured unsecured
9.7 9.7 9.28.5
7.3
6.0
4.2 3.73.1
16.4
Deutsche Bahn AG Road Show Asia 2012

58
Capex and financing (€
bn)
59
125Total
16
35
2005 2006 2007 2008 2009 2010 2011
Net financial debt (as of Dec 31, €
bn)
19.7 19.6
16.5 15.915.0
16.9
-3.1 / -
15.7%
Proven track record: Capex campaign and deleveraging
Despite high capex volume significant reduction of net financial
debt
16.6
95
14
64
DB funds
133Total
Infra-structure
17
38 37Other
Investment
grants
Interest-free
loans
1994-2011
FinancingCapex
Other grants
DB funds
(71%)
(29%)
Deutsche Bahn AG Road Show Asia 2012

59
Major portfolio changes in DB Group: total M&A transactions (EqV) of €
11 bn
(€
4 bn divestitures and €
7 bn acquisitions)
2001 2002 2005 20062004 2007
Stinnes,Joyau
BAX,StarTrans
RAG Bahn
Brenntag,Interfer,Mitropa
2008
EWS
2009
Transfesa
…
Proven track record: Reshaping the entire DB Group
Expansion of transport networks partly through focused portfolio
measures
2010
PCC
2011
NordCargo
SDS
Rail freight
Logistics
Passenger transport
Divesti-
tures
DSB Gods
Deutsche Eisenbahn-
reklame
Scandlines,Aurelis,
Nuclear Cargo
Linjegods Spain-Tir
Arcor
Arriva
Romtrans
Chiltern,PanBus
RailNon Rail 9%
91%
RailNon Rail
31%
69%
2001 2003
Non Rail
48% 52%
Rail
2006
Non Rail
47% 53%
Rail
2010
Non Rail
47% 53%
Rail
2008
Revenue split
Non Rail
48% 52%
Rail
2011 / H1 2012
2012
COBRA
Jean Heck
GrandCentral
Arriva Germany
Suomen Kiitoautot
Ambuline
TFG Transfracht
Metrans,Polzug
Deutsche Bahn AG Road Show Asia 2012

60
Long-distancetransport
Land transport
Contract
logistics/SCM
Air/ocean freight
Regionaltransport
Rail infrastructure
Rail freighttransport
Skills and current positions
Successfully developed transport networks ensure top market positions
DB
worldwide
No. 2
Air freight
No. 2
Long-distance rail passenger transport
No. 1
Regional rail passenger transport
No. 2
Urban bus transport
No. 1
Rail infrastructure
No. 1
Rail freight
transport
No. 3
Ocean freight
No. 6
Contract logistics/SCM
No. 1
Land transport
Our transport networks DB
in Europe
Deutsche Bahn AG Road Show Asia 2012

61
Contacts
DB road show team
Dr. Richard LutzCFO
Wolfgang ReuterGroup Treasurer, Head of Mergers and Acquisitions
Tel.:
+49 30 297-64300
Address
Deutsche Bahn AG/
DB Mobility Logistics AG
Europaplatz 1
10557 Berlin
Germany
Internet
www.db.de/ir-e
www.db.de/ir-dbml-e
Robert Allen StrehlHead of Investor Relations
Tel.:
+49 30 297-64030
Sascha FriedrichManager Investor Relations
Tel.:
+49 30 297-64032
Hartwig SchneidereitHead of Capital Market Financing
Tel.:
+49 30 297-64010
Marcus MehlingerHead of Equity and Debt Financing
Tel.:
+49 30 297-64006
Ute HaasCapital Market Financing
Tel.:
+49 30 297-64007
Deutsche Bahn AG Road Show Asia 2012

62
Appendix
Disclaimer and photo credits
This information contains forward-looking statements or trend information that are based on current beliefs and estimates of Deutsche Bahn
AG’s/DB Mobility Logistics AG´s
management and involves known and unknown risks and uncertainties. They are not guarantees of future performance. In addition to statements which are forward-looking by reason of context, including without limitation, statements referring to risk limitations, operational profitability, financial strength,
performance targets, profitable growth opportunities, and risk adequate pricing, as well as the words "may, will, should, expects, plans, intends, anticipates, believes, estimates, predicts, or continue", "potential, future, or further", and similar expressions identify forward-looking statements. These forward-looking statements are subject to certain risks and uncertainties that could cause the Company's actual results or performance to be materially different from those expressed or implied by such statements. Many of these risks and uncertainties relate to
factors that are beyond Deutsche Bahn
AG’s/DB Mobility Logistics AG’s ability to control or estimate precisely, e.g. future market and
economic conditions and the behavior of market participants. Deutsche Bahn
AG and DB Mobility Logistics AG do not intend or assume any obligation to update these forward-looking statements. This document represents the Company‘s judgment as on the date of this presentation.
Page 4
–
Jo Kirchherr, Claus Weber
Page 11
–
ClipDealer
(#393325), Max Lautenschläger, Wolfgang Klee, Michael Neuhaus
Page 12
–
Tobias Heyer, ClipDealer
(#218972), ClipDealer
(#132843), Simon Kent, ClipDealer
(#245691)
Page 14
–
Jo Kirchherr, Claus Weber, S. Müller, ClipDealer
(#70420)
Page 30 –
Jo Kirchherr, Claus Weber
Page 31
–
Jochen Manz, Christian Bedeschinski
Page 32
–
Thomas Schwörer
Page 33
– S. Müller
Page 34
–
Heiner Müller-Elsner
Page 35
–
GettyImages
(#88752051)
Page 36
–
ClipDealer
(#70420)
Page 37
–
Bartlomiej
Banaszak
Page 60
–
Günter Jazbec, Ralf Braum, Claus Weber, Stefan Warter, Rainer Garbe, Michael Neuhaus
Page 60
–
Pablo Castagnola, Max Lautenschläger
Disclaimer
Photo credits
Deutsche Bahn AG Road Show Asia 2012