detes internship report 2009-10 -...
TRANSCRIPT

agriculture,forestry & fisheriesDepartment:Agriculture, Forestry and FisheriesREPUBLIC OF SOUTH AFRICA
2009
/10
Annual report on the implementation of Annual report on the implementation of the Experiential Training, Internship and the Experiential Training, Internship and Professional Development ProgrammeProfessional Development Programme

Annual report on the implementation Annual report on the implementation of the Experiential Training, of the Experiential Training, Internship and Professional Internship and Professional Development ProgrammeDevelopment Programme
AUGUST 2010
Directorate Education, Training and Extension Services
DEPARTMENT OF AGRICULTURE, FORESTRY AND FISHERIES

2010
Printed and published by Department of Agriculture, Forestry and Fisheries
Design and layout by Directorate Agricultural Information Services Private Bag X144, Pretoria 0001
ISBN 978-1-86871-318-9

iii
List of tables and graphs iv
Acronyms vi
Defi nition of terms vi
Executive summary 1
1. Background and objectives 2
1.1 Introduction and background 21.2 Objectives of the programme 2
2. Recruitment and selection 3
2.1 Needs analysis 32.2 Advertisement of vacancies 32.3 Shortlisting and interviews 3
3. Arrival of 2009/10 interns/trainees 3
3.1 Arrival 33.2 Orientation and induction programme 33.3 Capacity-building programmes for trainees 4
4. Analytical reports on the implementation of various categories of the Experiential Training, Internship and Professional Development Programme 4
4.1 Conventional 44.2 Agri Industry Development Programme (AIDP) 84.3 Young Professional Development Programme (YPDP) 11
5. Fields of study and placement of young professionals for the 2009 academic year 14
5.1 Fields of study of young professionals for the 2009 academic year 145.2 Period of participation of young professionals in the programme 155.3 Placement of young professionals during the 2009 academic year 16
6. Summary of profi les of all categories of the Experiential Training, Internship and Professional Development Programme 16
7. Monitoring and evaluation 18
7.1 Monthly and quarterly progress reports 187.2 Monthly claim and stipends 197.3 Monitoring visits 197.4 Success indicators of the programme 207.4.1 Employment status 207.4.2 Academic performance of young professionals 217.5 Analysis of exit interview forms 237.6 Analysis of exit interview forms 23
8. Certifi cation ceremony of the 2009/10 interns/trainees and mentors 23
9. Summary of benefi ciaries of the programme from inception 2003 to 2009 24
10. Status of expenditure 24
11. Conclusion and recommendations 25
Annexures 27
Annexure A: Report on the implementation of the Agri Export TechnologistProgramme by PPECB from 2006/07 to 2009/10 27
Annexure B: 2009/10 Implementation of the internship programme by provincial departments of agriculture 30
ContentsContents

iv
List of tables and graphsList of tables and graphsTABLES
Table 1 Breakdown by race, gender and disability of “conventional” interns (n = 118) 5
Table 2 Breakdown according to age of “conventional” interns (n = 118) 5
Table 3 Breakdown according to placement of “conventional” interns (n = 118) 5
Table 4 Analysis of “conventional” interns according to placements within the DAFF line and support functional units (n =118) 6
Table 5 Breakdown according to provinces where “conventional” interns are coming from(n=118) 6
Table 6 Breakdown according to municipalities or districts where “conventional” interns arecoming from (n = 118) 6
Table 7 Breakdown according to number of “conventional” interns per academic institutionwhere they graduated (n = 118) 7
Table 8 Breakdown of level of qualifi cations according to gender and race of “conventional”interns (n = 118) 8
Table 9 Classifi cation of Educational Study Matter (CESM) of “conventional” interns (n = 118) 8
Table 10 Breakdown by race and gender of AIDP interns (n = 30) 9
Table 11 Breakdown according to age of AIDP interns (n = 30) 10
Table 12 Breakdown according to placement of AIDP interns (n = 30) 10
Table 13 Breakdown according to number of AIDP interns per academic institution where they graduated (n = 30) 10
Table 14 Breakdown of level of qualifi cations according to gender and race of AIDP interns (n = 30) 11
Table 15 Classifi cation of Educational Study Matter (CESM) of AIDP interns (n = 30) 11
Table 16 Breakdown according to provinces where AIDP interns come from (n = 30) 11
Table 17 Breakdown according to municipalities where AIDP interns come from (n = 30) 12
Table 18 Breakdown by race, gender and disability of PDP interns/trainees (n = 36) 13
Table 19 Breakdown according to age of PDP interns (n = 36) 13
Table 20 Breakdown of level of qualifi cations according to gender and race of PDP interns (n = 36) 13
Table 21 Breakdown of PDP interns according to provinces where they come from (n = 36) 14
Table 22 A breakdown of PDP interns/trainees according to municipality where they come from(n = 36) 14
Table 23 Breakdown according to number of PDP interns per academic institution where they graduated (n = 36) 15
Table 24 Analysis of fi elds of study of young professionals during the 2009 academic yearaccording to race and gender (n = 34) 15
Table 25 Analysis of academic institutions where PDP interns/trainees registered for furtherstudies in 2009 (n = 34) 16
Table 26 An analysis of the year-level of study for the young professionals (n = 34) 16
Table 27 Breakdown according to placement of young professionals (n = 36) 17
Table 28 Breakdown by race, gender and disability of all interns (n = 184) 18
Table 29 Breakdown according to age of all interns (n = 184) 18
Table 30 Breakdown according to provinces where all interns are coming from (n = 184) 18
Table 31 Breakdown according to municipalities or districts where all interns are comingfrom (n = 184) 19
v
Table 32 Status of employment according to organisation (n = 39) 22
Table 33 Analysis of period of stay before securing employment (n = 39) 22
Table 34 Analysis of levels of employment of interns (n = 39) 23
Table 35 An analysis of the 2009 academic performance of young professionals (n = 34) 23
Table 36 An analysis of young professionals whose performance was satisfactory in 2009 (n = 31) 24
Table 37 An analysis of young professionals whose performance was not satisfactory in2009 (n = 3) 24
Table 38 An analysis of young professionals who completed their studies and graduated in2009 (n = 8) 25
Table 39 An analysis of benefi ciaries of the Experiential Training, Internship andProfessional Development Programme from 2003 to 2009 (n = 947) 26
Table 40 Status of expenditure 27
Table 41 Status of employment of the interns who completed the Agri Export Technologist Programme from 2006/07 to 2009/10 (n = 101) 29
Table 42 Summary of expenditure incurred for the implementation of the Agri Export Technologist Programme from 2006/07 to 2009/10 29
Table 43 Summary of benefi ciaries of the 2009/10 internship implemented by provincialdepartments of agriculture (n = 728) 30
GRAPHS
Graph 1 Analysis of status of employment of conventional and AIDP interns (n = 39) 22
Graph 2 Analysis of status of employment by gender (n = 39) 22

vi
Defi nition of termsDefi nition of termsInternship: A structured workplace experience programme that is agreed to between the intern and
the supervisor/line manager who is delegated this responsibility by a department
Intern: Also called a graduate intern; a person who is contracted with a department to engage in an internship programme
Trainee: Also called student intern; a student who is currently studying towards a higher education qualifi cation and has to undertake work experience in order to fulfi l the requirements of the qualifi cation
Mentor: A person who is trained and appointed to offer advice, knowledge, wisdom and insight that may be useful to the protégé’s professional and personal development
Contract: A legitimate agreement between the department and the intern, describing the conditions of employment
Youth: A person who is between the ages of 18 and 35 years
AcronymsAcronymsAgriSETA Agricultural Sector Education and Training Authority
AMDP Agri Management Development Programme
AIDP Agriculture Industry Development Programme
ASGISA Accelerated and Growth Initiative for South Africa
B.Sc. Bachelor of Science
B.V.Sc. Bachelor of Veterinary Sciences
CASP Comprehensive Agricultural Support Programme
CESM Classifi cation of Education Study Matter
DAFF Department of Agriculture, Forestry and Fisheries
DEXCO Department of Agriculture Executive Committee
DPSA Department of Public Service and Administration
ETES Education, Training and Extension Services
Hons Postgraduate Degree (Honours)
Nat. Dipl. National Diploma
NC National Certifi cate
NGO Non-governmental Organisation
NQF National Qualifi cations Framework
PDP Professional Development Programme
PDI Previously Disadvantaged Individual
Ph.D. Postgraduate Degree (Doctorate)
PoE Portfolio of Evidence
PPECB Perishable Products Export Control Board
PWD People with Disabilities
SAPIP South African Pesticide Initiative Programme
SAQA South African Qualifi cations Authority
USB-ED University of Stellenbosch Business School

1
Executive summaryExecutive summaryThis annual report on the implementation of the Experiential Training, Internship and Professional Development Programme covers the activities relating to the 2009/10 intake of interns/trainees. The report elaborates on implementation procedures which include re-cruitment, selection, placement, monitoring and evaluation as well as the progress achieved against the expected outputs.
The report indicates that 184 interns/trainees participated in the programme during the 2009/10 fi nancial year and were placed under various categories of the programme as follows: 118 (64,1%) as conventional interns, 30 (16,3%) as Agri Industry Development Programme in-terns and 36 (19,6%) as Young Professional Development Programme interns. Of the 184 interns/trainees who participated in the programme, 98 (53,3%) were females and 86 (46,7%) were males. With regard to race, 182 (98,9%) were Africans and two (1,1%) were Coloureds.
As part of monitoring the progress of interns and the overall evaluation of the programme, monthly progress reports of interns were received and analysed, and monitoring visits and mock interviews were conducted. Worth noting from this report is that out of the 184 interns, 39 (21,2%) managed to secure permanent employment during their participation in the pro-gramme and sixteen (16) were appointed by the Department of Agriculture, Forestry and Fisheries (DAFF). The report further indicates that 34 young professionals were registered for further studies during the 2009 academic year and the end-of-year performance of 31 (91,2%) of them was satisfactory while for the other three (8,8%) it was not satisfactory.
This report also contains the 2006/07–2009/10 report on the implementation of the Export Technologist Programme of the Perishable Products Export Control Board as well as the 2009/10 report on the implementation of the internship programme by various provincial de-partments of agriculture. Those reports are attached as annexures to this report. The DAFF contributes an amount of R600 000,00 annually to the PPECB for the training of Export Technologists who are placed in the agricultural export industry for their internship programme.

2
1. BACKGROUND AND OBJECTIVES
1.1 Introduction and background
In 2003, the Department of Public Service and Administration issued “DPSA Circular No. 2003/1”, which calls for all government departments to place as interns in their various func-tional units the number of unemployed graduates with requisite skills equal to 5% of their total staff complement as part of the strategy to combat the rising levels of unemployment among qualifi ed youth (“youth” being defi ned in the National Youth Commission Act of 1996).
Even before the DPSA issued the circular, DAFF had already developed a policy on Experi-ential Training, Internship and Professional Development Programme which was approved by DEXCO in 2003. In developing the policy for the programme, DAFF was guided by legisla-tion and national strategies on skills development such as the Skills Development Act (Act No. 79 of 1998), the Skills Development Levies Act, and the National Human Resources Development Strategy for the Public Service.
Since the inception of the programme, 947 qualifi ed unemployed graduates have participated in the programme. A total of 368 programme benefi ciaries were able to secure permanent employment during their period of participation in the programme. Of this total, DAFF was able to employ 143 interns.
During these seven years of implementation, the programme underwent rigorous restructur-ing and revitalisation in order to respond to new trends in the agricultural sector and eco-nomic value chain. In 2006, entrepreneurial development was introduced as an additional pillar of the programme to help young people with the urge and vision to follow a career in business. As part of efforts to revamp the programme, the Young Professional Development Programme pillar was introduced in 2008/09. This innovative part of the programme targets young graduates in requisite science degrees and sponsors them to study towards Honours, Master’s and Ph.D. degrees. This is viewed as a critical contribution to the agricultural re-search base in the country.
For the 2009/10 fi nancial year, 184 interns have been recruited to undergo rigorous training in order to acquire work-related experience so that their chances for real employment can be enhanced. Interns are allocated an experienced mentor(s) to guide and supervise their struc-tured on-the-job training and the logbook system is used to manage their progress effectively and effi ciently.
1.2 Objectives of the programme
• To contribute to accelerated service delivery by government through the improved intro-duction of skilled personnel in the public service
• To afford learners at tertiary institutions an opportunity to get practical work experience as a requirement for them to obtain their qualifi cations
• To enhance the employability of unemployed agricultural and other graduates
• To develop the skills and capacity of previously disadvantaged people to direct commer-cial viable enterprises and engage effectively with the markets
• To resolve the general shortage of qualifi ed and skilled people in the workforce by encour-aging graduates to equip themselves with the necessary practical experience
• To bridge the gap that exists between school and work by taking stock of skills gaps
• To ensure the long-term sustainability of the agricultural sector in SA by ensuring the meaningful participation of black agricultural graduates
• To actualise the government’s job creation strategy and voluntarism
• To promote the recruitment, development and retention of a sustainable cadre of scien-tists, technologists, technicians and other associated professionals and management sup-port in the DAFF
• To provide the DAFF with highly-skilled people and address the skills gaps within the ag-ricultural sector

3
• To promote linkages with external bodies and strengthen the capabilities of the workforce to contribute toward a prosperous agricultural sector
2. RECRUITMENT AND SELECTION
2.1 Needs analysis
Each year a needs analysis survey is conducted to determine the number and requirements of interns/trainees each directorate or functional unit of the DAFF or agribusiness can accommodate. For 2009/10, a needs analysis questionnaire was sent to all directorates within the DAFF as well as commodity organisations and agribusinesses. The information received was captured and analysed accordingly. Based on the information received on the needs analysis questionnaires, a total of 184 internship opportunities were allocated to various categories of the programme as follows: 118 for the conventional interns, 30 to the Agriculture Industry Development Programme and 36 to the Professional Development Programme.
2.2 Advertisement of internship vacancies
From the needs analysis, an advertisement with internship opportunities for 2009/10 was compiled and fl ashed on 21 September 2008 in three national newspapers, i.e. the Sunday Times, City Press and Daily Sun as well as local print and electronic media. Invariably the advertisement specifi ed the different areas where interns/trainees were required, based on information obtained from the needs analysis questionnaire.
A total of 6 622 applications were received in response to the advertisement from all provinc-es. The applications were screened, captured and sorted according to requirements indicated on the advertisement and preliminary schedules of shortlisted applicants were compiled.
2.3 Shortlisting and interviews
The preliminary schedules of shortlisted candidates together with the applications were for-warded to relevant directorates for further shortlisting in November 2008. A brief guide of how to conduct shortlisting and interviews was also sent with the applications to ensure that di-rectorates execute the process within approved human resources prescripts. Interviews were conducted from November 2008 to January 2009 and the Directorate: Education, Training and Extension Services rendered secretariat services. All successful candidates were issued with appointment letters to resume their training on 1 February 2009.
3. ARRIVAL PROGRAMME OF 2009/10 INTERNS/TRAINEES
3.1 Arrival
Interns/trainees reported at the DAFF premises on 2 February 2009. The fi rst day was dedi-cated to administrative matters. Contracts were signed and all relevant documents like certi-fi ed copies of IDs, Z56 forms for electronic payment of stipends into their banking accounts and workplans from mentors were received. The contents of the forms were explained in order to give them a better understanding of the agreements entered into.
3.2 Orientation and Induction Programme
The orientation and induction session of the new intake was held at the Arcadia Hotel (Pretoria) from 9 to 10 February 2009.The purpose of this session was to give new interns/trainees a broad overview of the programme and the expected outputs. Over and above this, it was also meant to lay a foundation for participants to come to a better understanding of the department, its values and its work ethics.
• Offi cials from various functional units in the DAFF such as Financial Administration, Security Services, Agricultural Information Services, Information and Communication Tech nology, Employee Development, Facilities and Travel Management, Strategic Plan ning, the Trans-

4
formation Unit and Human Resources Management, were invited to make presentations in order to inform interns/trainees in detail about the roles of their units.
• The following issues were covered during the session:
– Landscape of the DAFF Experiential Training, Internship and Professional Development Programme
– Code of conduct and dress code
– Subsistence and travel allowances (domestic and foreign) and claims
– Management of losses
– Security management access cards and theft
– Experiential Training, Internship and Professional Development Programme policy
– Code of conduct and disciplinary procedures
– Grievance procedure and protocol
– The Logbook/Management tool
– Interns’ monthly progress reports, claims and quarterly performance assessments
– Intern monitoring visits
– Internal and external communication, media protocol, telephone and table etiquette, etc.
– Telephone and internet policy
– Health, wellness and employee assistance programmes
– Procedures with regard to government vehicles and accommodation
– Overview of the structure of the DAFF and the DAFF Strategic Plan
3.3 Capacity building programmes for trainees
All conventional and Agriculture Industry Development Programme interns/trainees attended a four-day abridged accredited project management fundamentals course at NQF level 4 pre-sented by Imsimbi Training at the Premier Hotel from 16 March to 9 April 2009.
The objective of the course was to provide learners with a thorough knowledge of the Project Management model and project process groups. The course provided learners with a funda-mental understanding of the project life cycle, parties and documentation involved and the role played by the project management administrator throughout the life cycle of the project. This was intended to enable interns/trainees to plan properly for effective service delivery.
All attendees were expected to submit Portfolios of Evidence as part of the practical as-sessment of the course. Out of the 144 interns who attended the training 139 (96,5%) were deemed competent and fi ve (3,5%) were declared incompetent.
4. ANALYTICAL REPORTS OF THE IMPLEMENTATION OF VARIOUS CATEGORIES OF THE EXPERIENTIAL TRAINING, INTERNSHIP AND PROFESSIONAL DEVELOPMENT
The programme catered for three major categories of interns/trainees in 2009/10:
4.1 Conventional
• Job seekers: targets qualifi ed unemployed graduates who need practical hands-on experi-ence in order to enhance their employability; they constitute the thrust of the programme.
• Experiential training: targets students who need experiential training as a requirement for obtaining formal qualifi cations at an institution of higher learning.
Once recruited, they are placed with relevant functional units or directorates within the DAFF for a period of 12 months for their training. A total of 118 interns/trainees were recruited and recommended for placement as conventional interns; they constituted 64,1% of the 2009/10 total intake. Out of these 118 conventional interns/trainees, six were doing experiential train-ing.
5
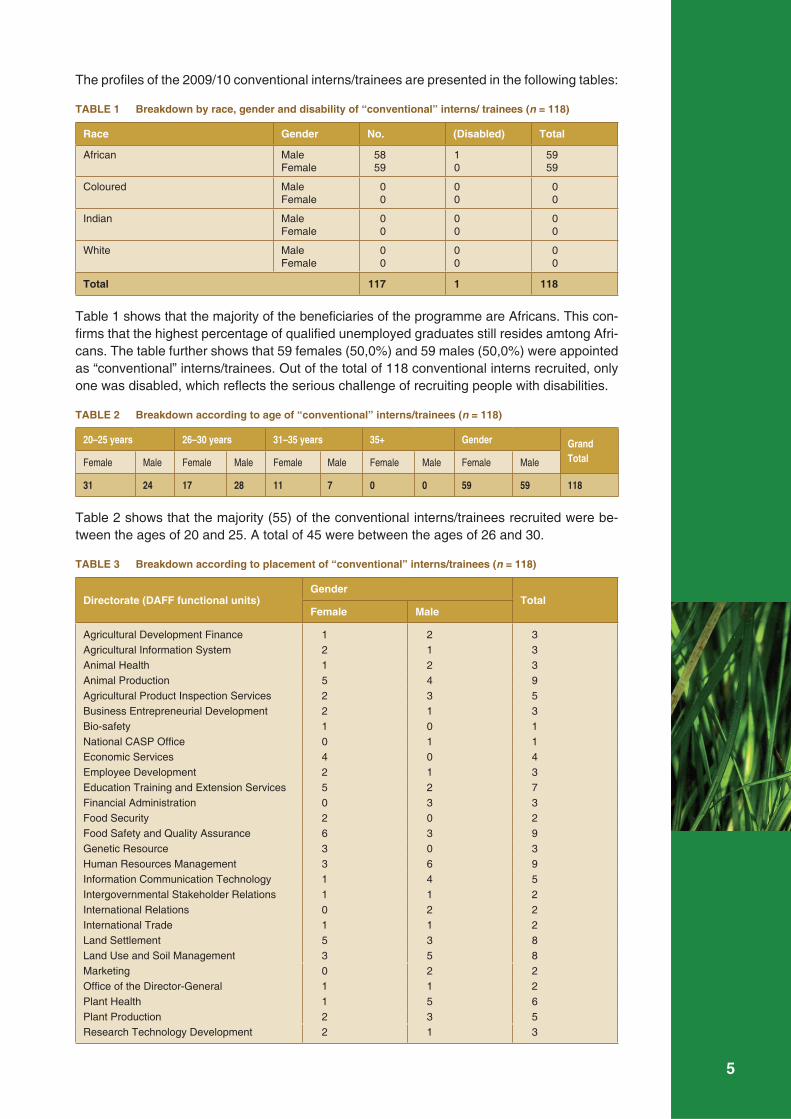
The profi les of the 2009/10 conventional interns/trainees are presented in the following tables:
TABLE 1 Breakdown by race, gender and disability of “conventional” interns/ trainees (n = 118)
Race Gender No. (Disabled) Total
African MaleFemale
5859
10
5959
Coloured MaleFemale
00
00
00
Indian MaleFemale
00
00
00
White MaleFemale
00
00
00
Total 117 1 118
Table 1 shows that the majority of the benefi ciaries of the programme are Africans. This con-fi rms that the highest percentage of qualifi ed unemployed graduates still resides amtong Afri-cans. The table further shows that 59 females (50,0%) and 59 males (50,0%) were appointed as “conventional” interns/trainees. Out of the total of 118 conventional interns recruited, only one was disabled, which refl ects the serious challenge of recruiting people with disabilities.
TABLE 2 Breakdown according to age of “conventional” interns/trainees (n = 118)
20–25 years 26–30 years 31–35 years 35+ Gender Grand TotalFemale Male Female Male Female Male Female Male Female Male
31 24 17 28 11 7 0 0 59 59 118
Table 2 shows that the majority (55) of the conventional interns/trainees recruited were be-tween the ages of 20 and 25. A total of 45 were between the ages of 26 and 30.
TABLE 3 Breakdown according to placement of “conventional” interns/trainees (n = 118)
Directorate (DAFF functional units)Gender
TotalFemale Male
Agricultural Development Finance 1 2 3Agricultural Information System 2 1 3Animal Health 1 2 3Animal Production 5 4 9Agricultural Product Inspection Services 2 3 5Business Entrepreneurial Development 2 1 3Bio-safety 1 0 1National CASP Offi ce 0 1 1Economic Services 4 0 4Employee Development 2 1 3Education Training and Extension Services 5 2 7Financial Administration 0 3 3Food Security 2 0 2Food Safety and Quality Assurance 6 3 9Genetic Resource 3 0 3Human Resources Management 3 6 9Information Communication Technology 1 4 5Intergovernmental Stakeholder Relations 1 1 2International Relations 0 2 2International Trade 1 1 2Land Settlement 5 3 8Land Use and Soil Management 3 5 8Marketing 0 2 2Offi ce of the Director-General 1 1 2Plant Health 1 5 6Plant Production 2 3 5Research Technology Development 2 1 3

6
Directorate (DAFF functional units)Gender
TotalFemale Male
Supply Chain Management 1 1 2Sector Services 1 0 1Strategic Planning 1 1 2
Total 59 59 118
Table 3 shows that the Directorates: Food Safety and Quality Assurance, Human Resources Management and Animal Production accommodated the highest numbers of “conventional” interns/trainees, nine, respectively.
TABLE 4 Breakdown according to placements within functional units of “conventional” interns/trainees (n = 118)
Line function(Core agricultural units)
Support function(Non-core agricultural units)
Total
Females Males Females Males
37 30 22 29 118
Table 4 shows that the majority of the participants (67) were placed within line function direc-torates and 51 were placed within support function directorates of the DAFF.
TABLE 5 Breakdown according to provinces where “conventional” interns/trainees are coming from (n = 118)
ProvincesGender
Total numberMale Female
KwaZulu-Natal 1 5 6Northern Cape 0 0 0Eastern Cape 3 2 5Free State 0 1 1Mpumalanga 5 5 10North West 4 6 10Limpopo 37 31 68Gauteng 8 9 17Western Cape 1 0 1
Total 59 59 118
Table 5 shows that the highest number of “conventional” interns came from Limpopo Province (68), followed by Gauteng with 16.
TABLE 6 Breakdown according to municipalities or districts where “conventional” interns/trainees are coming from (n = 118)
Municipality/districtGender
TotalFemale Male
Bela-Bela 0 2 2Bojanala 0 1 1Bophirima 1 0 1Buffalo City 0 1 1Bushbuckridge 1 1 2Capricorn 7 11 18Delmas 1 0 1Dr J.S. Moroka 2 1 3Ekurhuleni 1 1 2eThekwini 0 1 1Fetakgomo 1 0 1Gert Sibande 0 1 1

7
Municipality/districtGender
TotalFemale Male
Greater Giyani 0 1 1Ilembe 1 0 1Johannesburg Metro 0 4 4Madibeng 3 1 4Makhado 1 1 2Makhudu Thamaga 1 1 2Mangaung 1 0 1Mbombela 0 1 1Mhlathuze 1 1 2Mkhanyakude 1 0 1Mnquma 0 1 1Modiri Molema 1 0 1Mopani 5 6 11Moses Kotane 1 0 1Mpasah 1 0 1Naledi 0 1 1Nkangala 1 1 2Nqutu 1 0 1O.R. Tambo 0 1 1Rustenburg 0 2 2Sekhukhune 3 1 4Thulamela 6 2 8Transkei 1 0 1Tshwane 8 2 10Tygerberg 0 1 1uMgungundlovu 1 0 1Vhembe 7 11 18
Total 59 59 118
Table 6 shows that the majority of the conventional interns/trainees (18) came from Capricorn
and Vhembe districts respectively (Limpopo Province).
TABLE 7 Breakdown according to number of “conventional” interns/trainees per academic institution where they graduated (n = 118)
Name of institution Number of interns/trainees
1. University of the Western Cape 1 2. University of the Free State 1
3. University of Pretoria 64. University of the North West 56. Tshwane University of Technology 387. University of Fort Hare 28. University of Limpopo 269. University of Johannesburg 3
10. University of South Africa 211. University of Venda 2112. University of Zululand 113. Orbit FET College 114. Grootfontein College of Agriculture 115. WITS University 216. Durban University of Technology 117. Central University of Technology 118. Walter Sisulu University 119. Vaal University of Technology 120. Mangosuthu University of Technology 321. Roodepoort College 1
Total 118

8
Table 7 shows that, in terms of the academic institution where the benefi ciaries of the pro-gramme graduated from, Tshwane University of Technology has the highest number at 38, followed by the University of Limpopo and the University of Venda with 26 and 21, respec-tively.
TABLE 8 Breakdown of level of qualifications according to gender and race of “conventional” interns/trainees (n = 118)
Qualifi cations Male Female Total
National Diploma 19 27 46National Certifi cate 0 1 1Bachelor’s Degree 31 26 57Bachelor of Technology 2 2 4Bachelor’s Degree (Hons) 7 2 9Master’s Degree 0 1 1
Total 59 59 118
Table 8 indicates that the majority (57) of the conventional interns/trainees graduated with bachelor degrees. The table further indicates that out of the total of 118 benefi ciaries, 46 graduated with National Diplomas, one with a National Certifi cate and 14 with postgraduate degrees.
TABLE 9 Classification of Educational Study Matter (CESM) of “conventional” interns/trainees (n = 118)
Category No.
Agriculture and Renewable Resources 54Business Commerce 61Humanities 3
Total 118
Table 9 indicates that according to CESM, the majority (61) studied Business Commerce while 54 studied Agriculture and Renewable Resources.
4.2 Agriculture Industry Development Programme (AIDP)
This category targets young people who have an entrepreneurial urge and vision to follow a career in business as one of the Department of Agriculture, Forestry and Fisheries’ AgriBEE initiatives. Once recruited, they are placed with relevant agribusinesses or industries for a period of 12 months for practical exposure and mentorship with regard to business-related activities. A total of 30 Interns/trainees were recruited and recommended for placement as AIDP interns; they constituted 16,3% of the total 2009/10 intake.
In addition to the project management training they received as indicated under capacity de vel opment of interns above, the Agriculture Industry Development Programme interns/trainees further attended an accredited and unit standard-aligned Advanced Management Development course with the University of Stellenbosch Business School (USB-ED). The aim of the course is to equip the interns/trainees with the necessary leadership and entrepreneur-ial skills to enable them to be potential participants in business.
The course is pitched at NQF level 7 and consists of the following modules:
• Introduction to learning • Labour issues and labour practice
• Marketing • Safety, health and risk management
• Business-driven action learning • Leadership and teamwork
• Entrepreneurship and general management • Economics
• Communication and presentation skills • Operations management
• Managing people • Business plan development
• Fundamentals of fi nancial management

9
All attendees were expected to submit an assignment per module as part of their assess-ment. In addition, they had to compile comprehensive business plans which they presented on 20 November 2009 to an evaluation committee consisting of two representatives each from DAFF and the University of Stellenbosch Business School (USB-ED) respectively. The purpose of the business plan presentations was to assess the practicality and viability of their business plans. Out of the total 30 interns/trainees who attended the Advanced Management Development Programme with the University of Stellenbosch Business School, 17 (56,7%) were deemed competent and completed the course while 13 (43,3%) could not complete because they failed one module each. Those who did not complete will have to re-register for the failed module during 2010/11 and pass it in order to be declared competent and be able to graduate.
The profi les of the 2009/10 AIDP interns/trainees are presented in the following tables:
TABLE 10 Breakdown by race and gender of AIDP interns/trainees (n = 30)
Race Gender No. Disabled Total
African MaleFemale
1218
00
1218
Coloured MaleFemale
00
00
00
Indian MaleFemale
00
00
00
White MaleFemale
00
00
00
Total 30 0 30
Table 10 shows that all 30 of the benefi ciaries of the programme were Africans and that there were no people with disabilities. The table further shows that 18 females (60,0%) and 12 males (40,0%) were appointed as AIDP interns/trainees.
TABLE 11 Breakdown according to age of AIDP interns/trainees (n = 30)
20–25 years 26–30 years 31–35 years 35+ Total Grand totalFemale Male Female Male Female Male Female Male Female Male
13 5 4 4 1 3 0 0 18 12 30
Table 11 indicates that the majority (18) of the benefi ciaries were between the ages of 20 and 25 and nine were between the ages of 26 and 30. Only four participants were older than 30 years.
TABLE 12 Breakdown according to placement of AIDP interns/trainees (n = 30)
Agribusiness Female Male Total
Manstrat 6 0 6Citrus Academy 3 1 4NERPO 4 2 6MADSED 2 2 4Heifer International 1 2 3National Wool Growers’ Association 1 1 2MASDT 1 1 2Milk Producers’ Organisation 0 1 2SENWES 0 1 1Mokha Trading 0 1 1
Total 18 12 30
Table 12 shows that the Agribusinesses, Manstrat and Nerpo, accommodated the highest numbers of “conventional” interns/trainees – six, respectively.
10
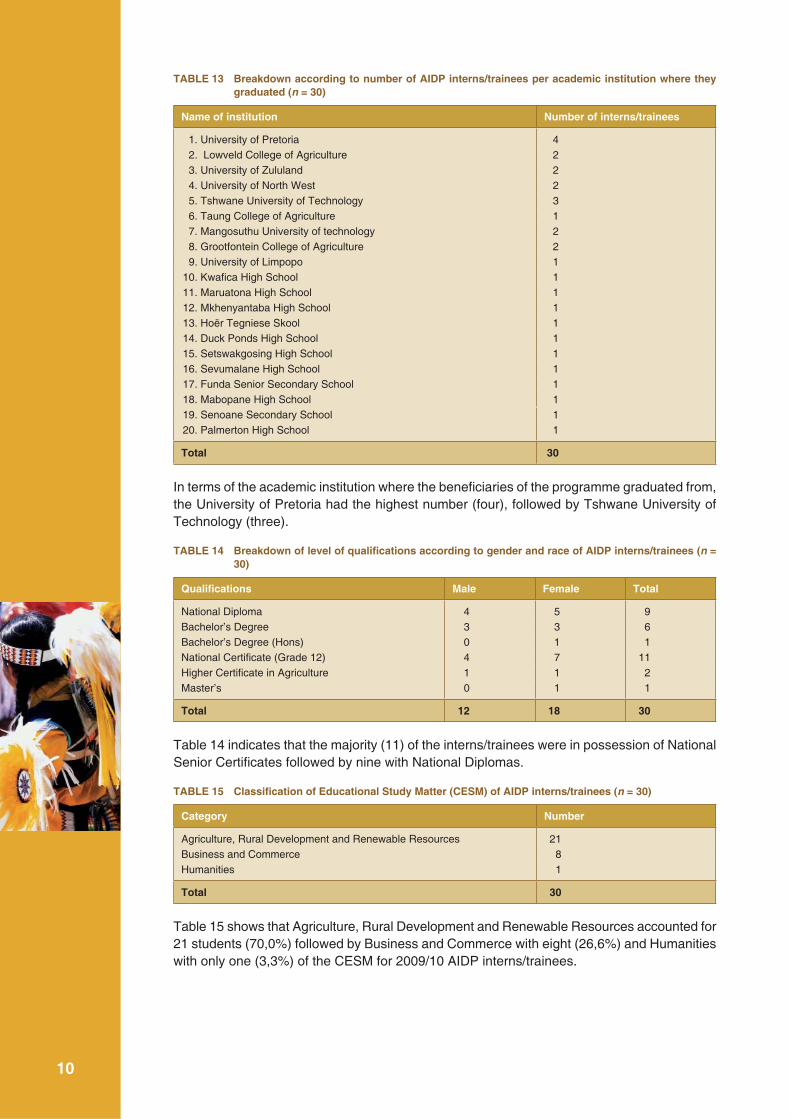
TABLE 13 Breakdown according to number of AIDP interns/trainees per academic institution where they graduated (n = 30)
Name of institution Number of interns/trainees
1. University of Pretoria 42. Lowveld College of Agriculture 23. University of Zululand 24. University of North West 25. Tshwane University of Technology 36. Taung College of Agriculture 17. Mangosuthu University of technology 28. Grootfontein College of Agriculture 29. University of Limpopo 1
10. Kwafi ca High School 111. Maruatona High School 112. Mkhenyantaba High School 113. Hoër Tegniese Skool 114. Duck Ponds High School 115. Setswakgosing High School 116. Sevumalane High School 117. Funda Senior Secondary School 118. Mabopane High School 119. Senoane Secondary School 120. Palmerton High School 1
Total 30
In terms of the academic institution where the benefi ciaries of the programme graduated from, the University of Pretoria had the highest number (four), followed by Tshwane University of Tech nology (three).
TABLE 14 Breakdown of level of qualifications according to gender and race of AIDP interns/trainees (n = 30)
Qualifi cations Male Female Total
National Diploma 4 5 9Bachelor’s Degree 3 3 6Bachelor’s Degree (Hons) 0 1 1National Certifi cate (Grade 12) 4 7 11Higher Certifi cate in Agriculture 1 1 2Master’s 0 1 1
Total 12 18 30
Table 14 indicates that the majority (11) of the interns/trainees were in possession of National Senior Certifi cates followed by nine with National Diplomas.
TABLE 15 Classification of Educational Study Matter (CESM) of AIDP interns/trainees (n = 30)
Category Number
Agriculture, Rural Development and Renewable Resources 21Business and Commerce 8Humanities 1
Total 30
Table 15 shows that Agriculture, Rural Development and Renewable Resources accounted for 21 students (70,0%) followed by Business and Commerce with eight (26,6%) and Humanities with only one (3,3%) of the CESM for 2009/10 AIDP interns/trainees.

11
TABLE 16 Breakdown according to provinces where AIDP interns/trainees come from (n = 30)
ProvinceGender
TotalMale Female
Gauteng 3 9 12North West 1 2 3Limpopo 2 4 6Eastern Cape 2 1 3Northern Cape 0 0 0Mpumalanga 2 1 3Free State 0 0 0KwaZulu-Natal 2 1 3Western Cape 0 0 0
Total 12 18 30
Table 16 shows that the highest number of AIDP interns came from Gauteng Province (12), with six coming from Limpopo.
TABLE 17 Breakdown according to municipalities where AIDP interns/trainees come from (n = 30)
MunicipalitiesGender
TotalMale Female
Odi District 1 0 1Morephele 2 0 2O.R. Tambo 0 2 2Imfuleni 2 0 2Umkhanyakude 1 1 2Vhembe 0 1 1Amajuba 0 1 1Dr Ruth Mompati 0 1 1Nkangala 1 1 2Ekhuruleni 1 1 1Sekhukhune 0 2 2Umzumbe 0 1 1Elias Motsoaledi 0 1 1Nkomazi 1 1 2Tshwane 0 1 1Mopani 0 1 1eThekwini 0 2 2Mangaung 1 0 1Frances Baard 0 1 1Amathole 1 0 1Govan Mbeki 1 0 1
Total 12 18 30
In terms of the municipalities where the AIDP interns come from, Table 17 shows that they were evenly distributed among various municipalities.
4.3 Young Professional Development Programme (YPDP)
The Young Professional Development Programme was introduced by the DAFF for the fi rst time in January 2008 and it is in its second year of implementation. It is a capacity-building programme contributing to a relevant and credible future agricultural scientifi c base for the agricultural sector. It was introduced to address the shortage of skilled agricultural profession-als and technical staff that is one of the handicaps to agricultural development in South Africa. Through this programme, a pool of young scientists, engineers, technologists and technicians from the previously disadvantaged groups will be created.
This category targets young graduates in possession of requisite bachelor’s degrees such as B.Sc., B.Sc. Agriculture, B.Sc. Engineering and B.V.Sc. as well as postgraduate qualifi cations

12
in agriculture or natural science who would like to further their studies at Honours, Master’s and Ph.D. level in the area of research leading to innovation in critical scarce skills in agricul-ture. Successful candidates are taken as interns, placed with a relevant research institution/industry and attached to experienced mentors/supervisors while furthering their studies. They receive a monthly stipend. A total of 36 interns/trainees were recruited and recommended for placement as PDP interns/trainees; they constituted 19,6 % of the total 2009/10 intake.
During the recruitment process as outlined on page 2 (section 2) completing DAFF bur-sary holders were given preference to participate in the Young Professional Development Programme provided that they met the admission requirements of the institution of higher learning in one of the scarce skills in agriculture. In an effort to address the shortage of skilled technicians and professionals at the Grootfontein Agricultural Institute (which is one of DAFF’s directorates), seven of the 36 recruited young professionals were appointed on three-year contracts which commenced on 1 June 2008; they were placed at the institution to carry out research projects for the institution. On 1 July 2009, six of them were appointed permanently by the institution.
The profi les of the 2009/10 PDP benefi ciaries are presented in the following tables and graphs:
TABLE 18 Breakdown by race, gender and disability of PDP interns (n = 36)
Race Gender No. Disabled Total
African MaleFemale
1420
00
1420
Coloured MaleFemale
11
00
11
Indian MaleFemale
00
00
00
White MaleFemale
00
00
00
Total 36 0 36
Table 18 shows that the majority of the young professionals came from the previously disad-vantaged groups, which is in line with the objectives of the programme. However, the major challenge is the recruitment of people with disabilities. Worth noting from the table is that the highest number (21) were female benefi ciaries.
TABLE 19 Breakdown according to age of PDP interns/trainees (n = 36)
20–25 years 26–30 years 31–35 years 35+ Total Grand totalFemale Male Female Male Female Male Female Male Female Male
7 8 8 6 4 1 2 0 21 15 36
Table 19 indicates that 15 benefi ciaries were within the age range of 20 to 25, while 14 were in the range of 26 to 30, fi ve were in the range of 31 to 35 and two were older than 35 years.
TABLE 20 Breakdown of level of qualifications according to gender and race of PDP interns/trainees (n = 36)
Qualifi cations Male Female Total
National Diploma 4 5 9Bachelor’s Degree 11 15 26Bachelor’s Degree (Master’s) 0 1 1
Total 15 21 36
Table 20 shows that out of the 36 recruited young professionals, 26 graduated with bachelor’s degrees in agriculture and nine with National Diplomas.
The table further shows that only one graduated with a master’s degree.

13
TABLE 21 A breakdown of PDP interns/trainees according to provinces where they come from (n = 36)
ProvincesGender
Total numberMale Female
KwaZulu-Natal 3 1 4Northern Cape 0 0 0
Eastern Cape 2 4 6
Free State 0 3 3
Mpumalanga 3 2 5
North West 0 2 2
Limpopo 4 3 7
Gauteng 2 5 7
Western Cape 1 1 2
Total 15 21 36
Table 21 shows that the majority of the young professionals came from the Limpopo, Gauteng and Eastern Cape provinces, respectively.
TABLE 22 A breakdown of PDP interns/trainees according to the municipality where they come from (n = 36)
Municipality/DistrictGender
Total numberMale Female
Moses Kotane 0 1 1Bellville 0 1 1City of Johannesburg 1 2 3Nkobonkobe 0 1 1O.R. Tambo 0 2 2Lepelle Nkumpi 1 1 2Steve Tshwete 1 0 1Tshwane 1 1 2Ramotshere 0 1 1uMhlathuze 3 1 4Motheo 0 3 3Mbizana 1 0 1Nkomazi 1 1 2Greater Tzaneen 0 1 1Bushbuckridge 0 1 1Thulamela 2 0 2Mnquma 1 0 1Msukaligwa 1 0 1Thaba Chweu 0 1 1Amahlathi 0 1 1Makhado 1 0 1Witzenberg 1 0 1Ekurhuleni 0 2 2
Total 15 21 36
Table 22 shows that the majority (four) of the young professionals came from the uMhlathuze Municipality.
TABLE 23 Breakdown according to number of PDP interns/trainees per academic institution where they graduated (n = 36)
Name of institution Total number
1. University of the Western Cape 12. University of the Free State 43. University of Pretoria 34. University of the North West 2

14
Name of institution Total number
5. University of Swaziland 26. Tshwane University of Technology 17. University of Fort Hare 38. University of Limpopo 79. University of Johannesburg 3
10. University of Stellenbosch 211. Rhodes University 112. Grootfontein College of Agriculture 113. Cape Peninsula University of Technology 514. University of Venda 1
Total 36
Table 23 shows that the majority (seven) of the young professionals graduated at the Uni ver-sity of Limpopo.
5. FIELDS OF STUDY AND PLACEMENT OF YOUNG PROFESSIONALS FOR THE 2009 ACADEMIC YEAR
5.1 Fields of study registered by young professionals for 2009 academic year
One of the conditions set for participation in the Young Professional Development Programme is to register for postgraduate studies in one of the identifi ed scarce skills approved by the De partment of Agriculture, Forestry and Fisheries while placed with the relevant industry or re search institution for practical experience. Out of a total of 36 recruited young professionals, only 34 were registered for further studies. Two young professionals attached to the Groot-fontein Agricultural Institute did not register for further studies during the 2009 academic year.
TABLE 24 Analysis of fields of study registered by young professionals during the 2009 academic year ac-cording to race and gender (n = 34)
Field of study
Race Gender
Tota
l
African Coloured Indian White Male Female
No. % No. % No. % No. % No. % No. %
B.Tech. Agricultural Management 1 100,0 0 0,0 0 0,0 0 0,0 0 0,0 1 100,0 1
B.Tech. Food Technology 7 100,0 0 0,0 0 0,0 0 0,0 4 57,1 3 42,9 7
B.Sc. Animal Nutrition (Hons) 1 100,0 0 0,0 0 0,0 0 0,0 1 100,0 0 0,0 1
B.Sc. Environmental Management (Hons)
1 100,0 0 0,0 0 0,0 0 0,0 1 100,0 0 0,0 1
B.Sc. Animal Breeding (Hons) 1 100,0 0 0,0 0 0,0 0 0,0 1 100,0 0 0,0 1
B.Sc. Aquaculture (Hons) 1 100,0 0 0,0 0 0,0 0 0,0 0 0,0 1 100,0 1
B.Sc. Grassland Science (Hons) 1 100,0 0 0,0 0 0,0 0 0,0 0 0,0 1 100,0 1
B.Sc. Statistics (Hons) 3 100,0 0 0,0 0 0,0 0 0,0 1 33,3 2 66,7 3
M.Sc. Agric. Economics 4 100,0 0 0,0 0 0,0 0 0,0 0 0,0 4 100,0 4
M.Sc. Animal Science 1 100,0 0 0,0 0 0,0 0 0,0 0 0,0 1 100,0 1
M.Sc. Animal Production 1 100,0 0 0,0 0 0,0 0 0,0 1 100,0 0 0,0 1
M.Sc. Food Science 2 66,7 1 33,3 0 0,0 0 0,0 3 100,0 0 0,0 3
Master’s in Horticulture 1 100,0 0 0,0 0 0,0 0 0,0 0 0,0 1 100,0 1
M.Sc. Microbiology 1 100,0 0 0,0 0 0,0 0 0,0 0 0,0 1 100,0 1
M.Sc. Ichthyology and Fisheries Science
1 100,0 0 0,0 0 0,0 0 0,0 1 100,0 0 0,0 1
M.Sc. Pasture Science 1 100,0 0 0,0 0 0,0 0 0,0 1 100,0 0 0,0 1
M.Sc. Botany 1 100,0 0 0,0 0 0,0 0 0,0 1 100,0 0 0,0 1
M.Sc. Plant Protection 2 100,0 0 0,0 0 0,0 0 0,0 0 0,0 2 100,0 2
M.Tech. Food Technology 0 0,0 1 100,0 0 0,0 0 0,0 0 0,0 1 100,0 1
Ph.D. Biotechnology 1 100,0 0 0,0 0 0,0 0 0,0 0 0,0 1 100,0 1
Total 32 88,9 2 5,6 0 0,0 0 0,0 15 41,7 19 52,8 34
Table 24 indicates the fi elds of study which the young professionals registered for in 2009. The table shows that of the 34 young professionals, eight registered for B.Sc. (Hons), 16 for M.Sc., eight for B.Tech., one for M.Tech. and one for Ph.D.

15
TABLE 25 Analysis of academic institutions where PDP interns/trainees registered for further studies in 2009 (n = 34)
Name of institution Total number
1. University of the Western Cape 12. University of the Free State 83. University of Pretoria 44. University of Fort Hare 25. University of Limpopo 66. University of Johannesburg 37. University of Stellenbosch 28. Rhodes University 19. University of South Africa 2
10. Cape Peninsula University of Technology 5
Total 34
Table 25 shows that the majority (eight) of the young professionals registered for further stud-ies at the University of the Free State.
5.2 Period of participation of young professionals in the programme
All the recruited young professionals are requested to enter into an agreement with DAFF committing them to serve the department or its entities after completion of the programme and to complete their studies within a prescribed period of participation as outlined below:
• B.Tech. and Honours degree – 2 years
• Master’s degree – 2 years
• Ph.D. – 3 years
TABLE 26 An analysis of the year/level of study for the young professionals (n = 34)
Field of studyYear of study Total
duration1 2 3 Total
B.Tech. Food Technology 6 1 0 7 2B.Tech. Agric. Management 1 0 0 1 1
B.Sc. Animal Breeding (Hons) 1 0 0 1 1
B.Sc. Animal Nutrition (Hons) 1 0 0 1 1
B.Sc. Environmental Management (Hons) 1 0 0 1 1
B.Sc. Grassland Science (Hons) 1 0 0 1 1
B.Sc. Statistics (Hons) 3 0 0 3 1
B.Sc. Aquaculture (Hons) 1 0 0 1 1
B.Sc. Botany (Hons) 1 0 0 1 1
M.Sc. Agricultural Economics 0 4 0 4 2
M.Sc. Agricultural Plant Production 1 1 0 2 2
M.Sc. Animal Production 0 1 0 1 2
M.Sc. Animal Science 0 1 0 1 2
M.Sc. Aquaculture 1 0 0 1 2
M.Sc. Botany 1 0 0 1 2
M.Sc. Food Science 3 0 0 3 2
M.Sc. Microbiology 0 1 0 1 2
M.Sc. Horticulture 0 1 0 1 2
M.Sc. Pasture Science 1 0 0 1 2
Ph.D. Biotechnology 0 0 1 1 2
Total 23 10 1 34
Table 26 shows that the majority of the young professionals were doing the fi rst year of their postgraduate studies.

16
5.3 Placement of young professionals during the 2009 academic year
All young professionals are required to be placed with the relevant institution to be exposed to various research and technological methodologies so that they can be equipped with hands-on experience of the agricultural research and technological environment.
The table below indicates areas where the young professionals were placed to carry out re-search projects relevant to their fi elds of study. Each young professional was assigned to a mentor who worked together with the supervisor at the institution of higher learning in the in-terest of the student’s academic progress. The supervisors of young professionals who were placed in the laboratories of the universities for the projects also served as their mentors.
TABLE 27 Breakdown according to placement of young professionals (n = 36)
Institution of higher learning/Research institution/IndustryGender
TotalFemale Male
Grootfontein Agricultural Development Institute 3 4 7
Agricultural Research Council 1 0 1
SurePure, Cape Town 1 0 1
Dewcrisp 1 0 1
HIK Abalone farm 0 1 1
University of Johannesburg 1 1 2
University of Pretoria 3 0 3
University of Limpopo 5 1 6
University of Fort Hare 1 1 2
Cape Peninsula University of Technology 1 3 4
University of the Free State 3 2 5
University of the Western Cape 1 0 1
University of Stellenbosch 0 2 2
Total 21 15 36
Table 27 shows that the majority (seven) of the young professionals were placed at the Grootfontein Agricultural Development Institute followed by the University of Limpopo with six and the University of the Free State with fi ve.
6. SUMMARY OF PROFILES OF ALL CATEGORIES OF THE EXPERIENTIAL TRAINING, INTERNSHIP AND PROFESSIONAL DEVELOPMENT PROGRAMME
The following table summarises the profi les of all 2009/10 interns:
TABLE 28 Breakdown by race, gender and disability of all interns/trainees (n = 184)
Race Gender No. Disabled Total
African Male
Female
84
97
1
0
85
97
Coloured Male
Female
1
1
0
0
1
1
Asian Male
Female
0
0
0
0
0
0
White Male
Female
0
1
0
0
0
0
Total 183 1 184
Table 28 shows a comprehensive summary according to race and gender of all categories of interns. In summary, the table shows that the majority (182) of the participants were Africans and two were Coloureds. The table further indicates that there were 98 females and 86 males.

17
TABLE 29 Breakdown according to age of all interns/trainees (n = 184)
20–25 years 26–30 years 31–35 years 35+ Total Grand totalFemale Male Female Male Female Male Female Male Female Male
51 37 29 38 16 11 2 0 98 86 184
Table 29 depicts the age ranges of all interns recruited during the 2009/10 fi nancial year. In summary, out of the total intake of 184 interns/trainees, the majority (88) were within the age range 20 to 25, with 67 being 26 to 30 and 27 being 31 to 35 while two females were older than 35 years.
TABLE 30 Breakdown according to provinces where all interns/trainees are coming from (n = 184)
ProvinceGender
TotalMale Female
KwaZulu-Natal 6 7 13
Northern Cape 0 0 0
Eastern Cape 7 7 14
Free State 0 4 4
Mpumalanga 10 8 18
North West 5 10 15
Limpopo 43 38 81
Gauteng 13 23 36
Western Cape 2 1 3
Total 86 98 184
Table 30 depicts the provinces where all interns are coming from. In summary, the majority (81) of the interns come from Limpopo Province.
TABLE 31 Breakdown according to municipalities or districts where all interns/trainees are coming from (n = 184)
Municipality/districtGender
TotalMale Female
Amahlathi 0 1 1
Amajuba 0 1 1
Amathole 1 0 1
Bela-Bela 2 0 2
Bellville 0 1 1
Bojanala 1 0 1
Bophirima 0 1 1
Buffalo City 1 0 1
Bushbuckridge 1 2 3
Capricorn 11 7 18
City of Johannesburg 1 2 3
Delmas 0 1 1
Dr J.S. Moroka 1 2 3
Dr Ruth Mompati 0 1 1
Ekurhuleni 2 4 6
Elias Motsoaledi 0 1 1
eThekwini 1 2 3
Fetakgomo 0 1 1
Frances Baard 0 1 1
Gert Sibande 1 0 1
Govan Mbeki 1 0 1
Greater Giyani 1 0 1
Greater Tzaneen 0 1 1
Emfuleni 2 0 2

18
Municipality/districtGender
TotalMale Female
Johannesburg Metro 4 0 4Lepelle Nkumpi 1 1 2
iLembe 0 1 1Madibeng 1 3 4Makhudu Thamaga 1 1 2Mangaung 1 1 2Mbizana 1 0 1Mbombela 1 0 1Makhado 2 1 3Mkhanyakude 0 1 1Mnguma 2 0 2Modiri Molemo 0 1 1Mopani 6 6 12Morephele 2 0 2Moses Kotane 0 2 2Motheo 0 3 3Mbashe 0 1 1Msukaligwa 1 0 1Naledi 1 0 1Ngutu 0 1 1Nkangala 2 2 4Nkomazi 2 2 4Nkonkobe 0 1 1O.R. Tambo 1 4 5Odi District 1 0 1Ramotshere Moiloa 0 1 1Rustenburg 2 0 2Sekhukhune 1 5 6Steve Tshwete 1 0 1Thaba Chweu 0 1 1Thulamela 4 6 10Transkei 0 1 1Tshwane 3 10 13Tygerberg 1 0 1uMgungundlovu 0 1 1uMhlathuze 4 2 6uMkhanyakude 1 1 2uMzumbe 0 1 1Vhembe 11 8 19Witzenberg 1 0 1
Total 86 98 184
Table 31 show the municipalities where all interns are coming from. In summary, the majority (19) came from the Vhembe district, with 18 from the Capricorn district.
7. MONITORING AND EVALUATION
7.1 Monthly and quarterly progress reports
Monitoring and evaluation of the progress of interns/trainees are crucial to the implementa-tion of the programme. For “conventional” and AIDP interns, a day prior to the beginning of each month, the intern/trainee and the mentor agreed on the learning outcomes and key performance areas for the ensuing month and compiled a monthly workplan. Flowing from the workplan, the interns/trainees recorded all daily activities executed on the basis of the roadmap provided by the workplan.
The compulsory weekly review meetings between mentor and intern/trainee were held to evaluate the progress of interns at that level. At the end of every month, all interns compiled

19
their monthly progress reports on the basis of activities executed during that particular month. Such reports were forwarded to the internship unit for evaluation and assessment. Many interns/trainees struggled to produce quality reports during the fi rst three months of their par-ticipation in the programme. Through the interventions made during monitoring visits of the fi rst quarter, the quality of reports improved signifi cantly.
With regard to the young professionals, quarterly progress reports signed by their supervi-sors/mentors were also received and analysed accordingly.
7.2 Monthly claims and stipends
All interns/trainees, except for the young professionals attached to the Grootfontein Agricultural Development Institute, had to complete claim forms (timesheets) that indicated all the days they worked in a particular month. Mentors and Senior Managers were responsible for man-aging this system at their respective workstations. A few days before the end of each month, reminders were sent to all interns/trainees, mentors and Senior Managers to advise them on how the timesheet should be completed. All completed claim forms, leave forms and progress reports were sent to the Directorate: Education, Training and Extension Services on a month-ly basis for assessment before being forwarded to the Directorate: Financial Administration for further processing. Monthly stipends of interns/trainees were increased from R185,20 to R205,60 per day from 1 July 2009. The young professionals at the Grootfontein Agricultural Development Institute were paid automatically every month end.
7.3 Monitoring visits
Monitoring visits constituted an important monitoring mechanism of the programme. Such vis-its were arranged between the mentors and interns/trainees and were conducted on a quar-terly basis according to a planned schedule and when the need arose. However, because of limited human resources such schedules were not always adhered to. The purpose of the monitoring visits during the fi rst quarter was to establish how the interns/trainees were set-tling in at their workstations and to outline important administration aspects of the programme. Issues encountered during the monitoring visits included insuffi cient offi ce space, especially with regard to directorates located at Agriculture Place, and a lack of preparedness almost every time interns are taken in.
Issues dealt with during other monitoring visits included spot checks on logbooks, leave re-cords and the presentation of quarterly reports by interns/trainees. Mock interviews were also conducted with interns to assess their performance in an interview setup and to give them feedback and advise on how best to respond to questions during the interviews. The mock in-terview exercise was meant to improve the performance of interns during interviews and thus improve their chances of being employed. Interns were given a dummy advert for a position two weeks before the date of the monitoring visit (interview) and they were requested to ap-ply for the advertised post using the Z83 form and to prepare themselves for interviews. The following was established during the interviews held with interns:
• The majority of the interns were nervous and could not express themselves eloquently in response to questions posed to them.
• When responding to questions, the majority of interns struggled to link their experiences with qualifi cations and the requirements and duties of the advertised positions.
• On questions like “Why do think you are the right candidate for the position?” the majority of the interns failed to convince the panel because they were very brief with their answers without explaining their attributes and expertise relevant to the duties of the advertised positions.
• Feedback sessions were held with interns after the interviews to discuss their interview performance.
• During the feedback sessions, interns were given hints on how to respond to questions during interviews.

20
7.4 Success indicators of the programme
7.4.1 Status of employment
The major success indicator of the programme is the number of participants who secure employment or establish their own businesses during their training programme. The interns were expected to be very aggressive in their approach to looking for employment and busi-ness opportunities. Therefore, monitoring employment was an important tool to evaluate the impact of the programme and a comprehensive database to track the employment of these interns was established and continuously updated. The employment database consisted of the following elements:
• Personal details of the interns
• Organisation or directorates where they are placed
• Period of stay in the programme
• Organisation where employment is secured
• Position and salary level
Out of the 184 interns who participated in the programme, 39 (21,2%) secured employment while 145 (78,8%) could not secure employment. This rate of employment of interns during the 2009/10 programme was lower compared to the 68 interns (46,0%) who secured em-ployment during 2008/09. This was due to the impact of the global economic recession that severely affected the availability of jobs worldwide, even in South Africa. The analysis of the status of employment is outlined in the following graphs:
GRAPH 1 Analysis of status of employment (n = 39)
53,8%46,2%Males
Females
Graph 1 shows that 39 trainees/interns (21,2%) secured employment while 145 (78,8%) could not secure permanent employment.
GRAPH 2 Analysis of status of employment by gender (n = 39)
Graph 2 above shows that out of the 39 interns/trainees who secured employment, 18 (46,2%) were females and 21 (53,8%) were males.
Table 32 Status of employment according to organisation (n = 39)
Organisation No. %
DAFF Other government departments Private sector
161211
41,030,828,2
Total 39 100,0
21,2%78,8%Employed
Unemployed

21
Table 32 shows that most interns 28 (71,8%) secured employment within the public service, with 16 (41,0%) being appointed by DAFF. The table further indicates that 11 (28,2%) were employed by the private sector.
TABLE 33 Analysis of period of stay before securing employment (n = 39)
Period of participation Total
1–3 months4–6 months7–9 months9–12 months
04131606
Total 39
Table 33 indicates that the majority of the interns/trainees (16 or 41, 0 %) secured employ-ment during the third quarter (7–9 months) of their participation in the programme.
TABLE 34 Analysis of levels of employment of trainees/interns (n = 39)
Salary level Number of interns/trainees
SL 9 08 SL 8 08 SL 7 07 SL 6 08 SL 5 07 SL 4 01
Total 39
Table 34 indicates the levels at which trainees/interns secured employment during their par-ticipation in the programme. The table shows that the majority of interns (eight) secured em-ployment at salary levels 6, 8 and 9 followed by seven at salary levels 5 and 7. It is worth noting that 16 of them (41,0%) were appointed at middle management level.
7.4.2 Academic performance of young professionals
The other success indicator of this category of the internship programme is the number of participants who successfully complete their postgraduate studies and are absorbed into the mainstream of the economy in the agricultural sector. Out of the total intake of 36 young pro-fessionals, 34 were registered for postgraduate studies as shown in Table 24 above. Their performance is outlined in the following tables.
TABLE 35 An analysis of 2009 academic performance of young professionals (n = 34)
Field of study No. passed
% passed No. failed
% failed Total
B. Tech. Food Technology 5 71,4 2 28,6 7B. Tech. Agric. Management 1 100,0 0 0,0 1B.Sc. Grassland Science (Hons) 0 0,0 1 100,0 1B.Sc. Animal Breeding (Hons) 1 100,0 0 0,0 1B.Sc. Animal Nutrition (Hons) 1 100,0 0 0,0 1B.Sc. Environmental Management (Hons) 1 100,0 0 0,0 1B.Sc. Statistics (Hons) 3 100,0 0 0,0 3B.Sc. Aquaculture (Hons) 1 100,0 0 0,0 1M.Tech. Food Technology 1 100,0 0 0,0 1M.Sc. Agric. Economics 4 100,0 0 0,0 4M.Sc. Plant Protection 2 100,0 0 0,0 2M.Sc. Animal Production 1 100,0 0 0,0 1M.Sc. Animal Science 1 100,0 0 0,0 1M.Sc. Ichthyology and Fisheries Science 1 100,0 0 0,0 1M.Sc. Botany 1 100,0 0 0,0 1M.Sc. Food Science 3 100,0 0 0,0 3M.Sc. Microbiology 1 100,0 0 0,0 1

22
Field of study No. passed
% passed No. failed
% failed Total
Master’s in Horticulture 1 100,0 0 0,0 1M.Sc. Pasture Science 1 100,0 0 0,0 1Ph.D. Biotechnology 1 100,0 0 0,0 1
Total 31 91,2 3 8,8 34
Table 35 shows the academic performance of 34 young professionals who registered for postgraduate studies in 2009. The performance of 31 young professionals (91,2%) was sat-isfactory while that of three (8,8%) was not satisfactory.
TABLE 36 An analysis of young professionals whose performance was satisfactory in 2009 (n = 31)
Field of study
Race Gender
TotalAfrican Coloured Indian White Male Female
No. % No. % No. % No. % No. % No. %
B.Tech. Food Technology 5 100,0 0 0,0 0 0,0 0 0,0 3 60,0 2 40,0 5
B.Tech. Agric. Management 1 100,0 0 0,0 0 0,0 0 0,0 0 0,0 1 100,0 1
B.Sc. Animal Breeding (Hons)
1 100,0 0 0,0 0 0,0 0 0,0 1 100,0 0 0,0 1
B.Sc. Animal Nutrition (Hons)
1 100,0 0 0,0 0 0,0 0 0,0 1 100,0 0 0,0 1
B.Sc. Environmental Manage ment (Hons)
1 100,0 0 0,0 0 0,0 0 0,0 1 100,0 0 0,0 1
B.Sc. Statistics (Hons) 3 100,0 0 0,0 0 0,0 0 0,0 1 33,3 2 66,7 3
B.Sc. Aquaculture (Hons) 1 100,0 0 0,0 0 0,0 0 0,0 0 0,0 1 100,0 1
M. Tech. Food Technology 0 0,0 1 100,0 0 0,0 0 0,0 0 0,0 1 100,0 1
M.Sc. Agricultural Economics
4 100,0 0 0,0 0 0,0 0 0,0 0 0,0 4 100,0 4
M.Sc. Agricultural Plant Pro tection
2 100,0 0 0,0 0 0,0 0 0,0 1 50,0 1 50,0 2
M.Sc. Animal Production 1 100,0 0 0,0 0 0,0 0 0,0 0 0,0 1 100,0 1
M.Sc. Animal Science 1 100,0 0 0,0 0 0,0 0 0,0 0 0,0 1 100,0 1
M.Sc. Ichthyology and Fisheries Science
1 100,0 0 0,0 0 0,0 0 0,0 1 100,0 0 0,0 1
M.Sc. Botany 1 100,0 0 0,0 0 0,0 0 0,0 0 0,0 1 100,0 1
M.Sc. Food Science 2 66,7 1 33,3 0 0,0 0 0,0 3 100,0 0 0,0 3
M.Sc. Microbiology 1 100,0 0 0,0 0 0,0 0 0,0 0 0,0 1 100,0 1
Master’s in Horticulture 1 100,0 0 0,0 0 0,0 0 0,0 0 0,0 1 100,0 1
M.Sc. Pasture Science 1 100,0 0 0,0 0 0,0 0 0,0 1 100,0 0 0,0 1
Ph.D. Biotechnology 1 100,0 0 0,0 0 0,0 0 0,0 0 0,0 1 100,0 1
Total 29 93,5 2 6,5 0 0,0 0 0,0 13 41,9 18 58,1 31
In terms of the data presented in the table above, the performance of 31 young professionals was satisfactory and they would proceed to the next level of study in 2010.
TABLE 37 An analysis of young professionals whose performance was not satisfactory in 2009 (n = 3)
Field of study
Race Gender
TotalAfrican Coloured Indian White Male Female
No. % No. % No. % No. % No. % No. %
B.Tech. Food Technology 2 100,0 0 0,0 0 0,0 0 0,0 1 50,0 1 50,0 2
B.Sc. Grassland Science (Hons)
1 100,0 0 0,0 0 0,0 0 0,0 0 0,0 1 100,0 1
Total 3 100,0 0 0,0 0 0,0 0 0,0 1 33,3 2 66,7 3
In terms of the data presented in Table 37, the performance of three young professionals was unsatisfactory and they were to be suspended from the programme in 2010.

23
TABLE 38 An analysis of young professionals who completed their studies and graduated in 2009 (n = 5)
Field of study
Race Gender
TotalAfrican Coloured Indian White Male Female
No. % No. % No. % No. % No. % No. %
B.Tech. Food Technology 4 100,0 0 0,0 0 0,0 0 0,0 3 75,0 1 25,0 4B.Tech. Agric. Manage-ment
1 100,0 0 0,0 0 0,0 0 0,0 0 0,0 1 100,0 1
B.Sc. (Hons) Statistics 2 100,0 0 0,0 0 0,0 0 0,0 0 0,0 2 100,0 2
B.Sc. (Hons) Aquaculture 1 100,0 0 0,0 0 0,0 0 0,0 0 0,0 1 100,0 1
Total 8 100,0 0 0,0 0 0,0 0 0,0 3 37,5 5 62,5 8
Table 38 shows that eight young professionals completed their studies during the 2009 aca-demic year. The analysis of the fi elds of study of those who completed their courses is as follows: four in B.Tech. Food Technology, one in B.Tech. Agric Management, two in B.Sc. (Hons) Statistics and one in B.Sc. (Hons) Aquaculture.
7.5 Analysis of the whereabouts of the young professionals who completed their studies in 2009
• B.Tech. Food Technology students (four):
– One was appointed permanently at Kalk Bay Foods in Cape Town.– One was appointed at McCain in Johannesburg.– One undertook further studies at Cape Peninsula University of Technology.– One was placed at QK Meats SA (PTY) LTD in Johannesburg under DAFF’s Internship
Programme.
• B.Tech. Agric. Management (one): Appointed permanently as a technician in DAFF at the Directorate: Grootfontein Agricultural Development Institute.
• B.Sc. (Hons) Aquaculture (one): Placed as a DAFF intern at the Directorate: Animal Production.
• B.Sc. (Hons) Statistics (two): Placed as DAFF interns at Manstrat Agribusiness.
7.6 Analysis of exit interview forms
Upon resignation, interns/trainees are required to complete an exit interview form as a tool to evaluate the effectiveness of the programme. The majority of interns/trainees refl ected the following as benefi ts of the programme:
• Relevant exposure thus leading to securing employment
• Exposure to the workplace
• Boosted competence and confi dence
• Access to resources, information and assistance for job searches and interviews
• Skills gained as follows:
– Project Management knowledge– Presentation skills– Policy implementation– Report writing
8. CERTIFICATION CEREMONY OF THE 2009/10 INTERNS/TRAINEES AND MENTORS
The certifi cation ceremony of the 2009/10 mentors and interns was held at the Monument Function and Conference Centre on 29 January 2010. The purpose of the event was to bid farewell to the interns, to congratulate those who have secured employment and to recognise and appreciate the mentors for their dedication and commitment in mentoring the interns. Guests who attended the ceremony included the Honourable Minister of Agriculture, Forestry

24
and Fisheries, Ms Tina Joemat-Pettersson, Chief Directors and Directors within DAFF, men-tors, interns, agribusinesses, representatives from provincial departments of agriculture, rep-resentatives from the University of Stellenbosch Business School, CEOs of both AgriSETA and FoodBev SETA and stakeholders from the agricultural sector.
The following certifi cates were awarded during the ceremony:
• Certifi cates of services to the interns
• Certifi cates of recognition and appreciation to the mentors
• Certifi cates of appreciation to the agribusinesses for hosting the AIDP interns
• Accredited certifi cates of competence to interns who successfully completed their project management training with Imsimbi Training
• Accredited certifi cates of competence to AIDP interns who successfully completed their Agri Management Development course with the University of Stellenbosch Business School
Key speakers of the day included the following:
• Director: Education, Training and Extension Services, who outlined the purpose and ob-jectives of the certifi cation ceremony as well as the profi les of the 2009/10 interns
• Chief Director: Sector Services and Research, who gave an overview of skills develop-ment in the agricultural sector
• Honourable Minister Tina Joemat-Pettersson, who gave the keynote address and empha-sised entrepreneurship among young people
9. SUMMARY OF BENEFICIARIES OF THE PROGRAMME FROM INCEPTION IN 2003 TO 2009
The table below shows the benefi ciaries of the programme from 2003 to 2009 under various categories of the programme. According to the information presented, a total of 947 interns benefi tted from the programme with the highest number of benefi ciaries recorded during the 2009/10 fi nancial year (184). Out of 947 benefi ciaries who participated in the programme, 368secured employment during their participation in the programme.
TABLE 39 An analysis of beneficiaries of the Experiential Training, Internship and Professional Development Programme from 2003 to 2009 (n = 947)
Year
Number of interns/trainees who participated and secured employment during their participation in the Internship Programme
Total partici-pants
Total em-ployed
Conventional Agriculture Industry Development Programme
Young Professional Development Programme
No. par-tic i pants
No.em ployed
No. par-tici pants
No.em ployed
No.own ingbusi ness
No. par-tici pants
No.em ployed
2003/04 96 46 0 0 0 0 0 96 46
2004/05 138 38 24 15 1 0 0 162 53
2006/07 133 66 35 13 9 0 0 168 79
2007/08 140 75 24 8 1 0 0 164 83
2008/09 124 57 24 10 0 25 1 173 68
2009/10 118 28 30 04 2 36 7 184 39
Total 749 310 137 50 13 61 8 947 368
Table 39 indicates that 2009/10 saw the highest number of benefi ciaries as compared to other fi nancial years.
10. STATUS OF EXPENDITURE
Expenditure for the implementation of the programme during this fi nancial year included ven-ues for the orientation programme, certifi cation ceremonies of both mentors and interns, the

25
printing of logbooks, fi les, advertisements, project management training, consultancy fees, the printing of reports, the framing of certifi cates, transport, accommodation and monthly al-lowances for interns/trainees. The total amount spent for the 2009/10 Experiential Training, Internship and Professional Development Programme was R11 652 059,90.
TABLE 40 Status of expenditure
Item description Amount (R)
Personnel
Intern/trainee remuneration 9 514 070,30
Orientation programme 114 810,00
Goods and services
Capturing of applications 195 000,00
Advertisements 135 528,70
Printing and publications 42 793,00
Consultancy services (Kroll) 10 941,70
Training (project management) 528 233,80
Training (Agri Management Development Programme) 1 167 140,70
Exit ceremony 192 276,40
Total 11 652 059,90
Table 40 shows that the total amount spent for the implementation of the programme dur-ing 2009/10 was R11 652 059,90. The highest amount spent was on the remuneration of interns (R9 514 070,30) followed by the Agri Management Development Programme with R1 167 140,70.
11. CONCLUSION AND RECOMMENDATIONS
The 2009/10 report on the implementation of the Experiential Training, Internship and Professional Development Programme indicates both success stories and challenges.
According to the directive from the DPSA, each government department is expected to em-ploy at least 25% of the total number of interns who participated in the internship programme. This means that for 2009/10, DAFF was expected to appoint 46 interns permanently. Only 16 were appointed, which is a serious challenge. In order to meet the employment quota set by the DPSA, it is recommended that interns be targeted for all entry-level positions in the department.
The report shows that 30 young people were recruited to participate in the entrepreneurial category of the DAFF’s internship programme. The students were placed in agribusinesses under the leadership of experienced mentors and further registered with the University of Stellenbosch Business School to acquire skills and expertise with regard to entrepreneur-ship and how to start and manage one’s own business. At the end of the 12 months, these interns are well-equipped with knowledge but getting funding or start-up business packages is a major obstacle which in the end compels the interns to look for any form of employment to alleviate poverty. Based on this challenge, it is recommended that the Directorate: Business and Entrepreneurial Development budget to provide start-up packages for interns who suc-cessfully complete the programme. The funding model of the National Youth Development Agency needs to be reviewed because it does not provide funding for business in agriculture.
The report further indicates that 36 young people were recruited as young professionals and were further awarded bursaries from the DAFF to further their studies in one of the identifi ed scarce and critical skills in agriculture. Eight such students completed their studies but fi nding employment within DAFF is a major challenge and such interns go to the private sector, which is not a good return on investment. It is therefore recommended that human resource plan-

26
ning by various directorates include prioritising the appointment of graduate bursary holders of the department to ensure a good return on investment.

27
AnnexuresAnnexuresANNEXURE A: REPORT ON THE IMPLEMENTATION OF THE AGRI EXPORT TECH-
NOLOGISTS PROGRAMME BY PPECB FROM 2006/07 TO 2009/10
Background
As part of the AgriBEE initiative, DAFF in 2006 supported an incubator programme target-ing Black Export Technologists and implemented by the Perishable Products Export Control Board (PPECB). The Agri Export Technologist Programme is a career development pro-gramme within the agricultural export market designed to expose learners at a theoretical and practical level on the agri export supply chain and to provide them with a headstart in advancing themselves professionally within the thriving export sector. The programme is a partnership between the PPECB, the South African Pesticide Initiative Programme (SAPIP), DAFF and AgriSETA.
This was in response to the National Scarce and Critical Skills List (ASGISA aligned) 2006 document, which highlighted a need for Natural and Physical Science Professionals where a demand of 7 867 professionals was identifi ed in the agricultural sector in 2006/07. This increased to 8 176 in 2007/08.
The PPECB is in a distinctively strong position, with over 80 years’ industry experience and extensive technical knowledge, to offer previously disadvantaged learners who possess a three-year National Diploma in an agricultural fi eld the opportunity to develop skills in the agri export industry. Learners are given the opportunity, at a practical and theoretical level, to par-ticipate in this one-year experiential training programme where PPECB subject matter experts transfer specialist skills and knowledge.
The theoretical training includes the facilitation of the National Certifi cate: Perishable Produce Export Technology, which was developed by PPECB in conjunction with CVS colleges and is registered with SAQA at NQF level 5. On completion of the programme the learners receive a certifi cate of competence that is issued by AgriSeta.
The Department of Agriculture, Forestry and Fisheries initially entered into a contract with PPECB to fund this programme over a three-year period from 2006/07 to 2008/09 for an amount of R600 000 per annum or a total of R1,8 million. Another such contract was entered into for the period June 2009 to June 2012 on the same conditions.
Programme cycle
The life cycle of the programme is as follows:
Recruitment, selection and placement
Applicants are shortlisted against the entry requirement criteria. Shortlisted applicants are then interviewed by PPECB in the various regions and selected on the basis of the interview outcome and capacity within each region. Successful applicants are placed in the region where they live.
Induction
Learners undergo an induction into the company detailing the operational activities of PPECB as well as policies and procedures they are required to adhere to while on the learnership programme with PPECB. The programme objectives and expectations are discussed, giving an opportunity for clarifi cation on any matters not understood by the learners.
Practical training
The level of exposure and training is aligned with that of a Junior Inspector employed at PPECB. Training is conducted on various issues, including product standard requirements for export and inspection methodologies which take place at pack-houses, depots, farms and

28
airports serviced by PPECB. It comprises on-the-job training with knowledgeable inspectors who also conduct ongoing assessment of knowledge and skills gained through written tests, practical evaluations by Harmonisation Specialists and PPECB national questionnaires as well as practical assessments.
Progress reporting
The programme coordinator receives a monthly progress report on each learner from the re-gional inspector responsible for training. Any highlighted issues raised are addressed accord-ingly. Quarterly site visits to each region are also conducted to review the practical progress of each learner as well as to provide any support required.
Central training intervention
The learners are gathered at a central location for a three-week period to complete the theo-retical component comprising the fundamental and core units of the NC: Perishable Produce Export Technology. The fundamental units are facilitated by CVS colleges and the core units by PPECB Subject Matter Experts. Learners have a choice of two product electives to be completed and these are dependent on the region in which the learner is placed as all prod-ucts are not found in all regions. Electives are therefore completed in the region as part of the practical training with support and guidance by the inspector.
Skills training
The training provided for learners is not only of a technical nature but includes soft skills train-ing and ensures a holistic approach to the training provided. This includes issues such as employability workshops, values and attitudes and confl ict management.
Certifi cation and graduation
Assessment and moderation of the completed modules are conducted by CVS colleges and are aligned with SAQA requirements. The moderator’s report is forwarded to AgriSETA for verifi cation of the reports provided and issuing of certifi cates. A ceremony is held for the suc-cessful students who then graduate from the programme.
Status of employment
TABLE 41 Status of employment of the interns who completed the Agri Export Technologist Programme from 2006/07 to 2009/10 (n = 101)
YearIntake
Employed by PPECB
Employed by industry
Resignations UnemployedMale Female
2006/07 19 5 13 11 0 0
2007/08 18 12 27 3 0 0
2008/09 15 10 19 0 3 3
2009/10 14 8 6 0 1 15
Total 66 35 65 14 4 18
The above table indicates that a total of 101 benefi ciaries were trained and PPECB managed to appoint 65 (64,4%) of them permanently. The table further shows that 14 (13,9%) were ap-pointed by the export industry while 18 (17,8%) are still unemployed. The table also indicates that 4 (3,9%) resigned from the programme.
Expenditure summary
Expenditure for the implementation of the programme included the following items:
• Stipend
• Venue for training

29
• Accommodation
• Travel
• Training material
• Facilitation
TABLE 42 Summary of expenditure incurred for the implementation of the Agri Export Technologist Pro-gramme from 2006/07 to 2009/10
Year No. of learners Start date End date Item Cost (R)
2006/07 24 01/10/2006 30/06/2007 Stipend
Venue
Accommodation
Travel
Facilitation
384 000,00
123 047,00
202 442,00
64 586,00
113 933,00
Total expenses incurred 888 008,00
2007/08 30 01/02/2008 30/09/2008 Stipend
Venue
Accommodation
Travel
Material
Facilitation
420 000,00
134 550,00
210 000,00
116 470,00
28 113,00
137 464,00
Total expenses incurred 946 597,00
2008/09 25 04/08/2008 31/10/2009 Stipend
Venue
Accommodation
Travel
Material
Facilitation
700 000,00
76 752,00
582 342,00
124 282,00
7 376,00
168 828,00
Total expenses incurred 1 029 580,00
2009/10 22 01/06/2009 31/01/2010 Stipend
Venue
Accommodation
Travel
Facilitation
308 000,00
16 095,00
56 700,00
65 508,00
33 915,00
Total expenses incurred 480 218,00
The table above indicates cost incurred for implementing the Export Technologist Programme per fi nancial year from 2006/07 to 2009/10. The highest amount spent, R1 029 580, was re-corded in 2008/09. This was followed by R946 597 for 2007/08.
Achievements
• The fact that PPECB has succeeded in training 101 students to date and employed over 60% of them is an achievement in itself.
• The highlight of the programme was the fi rst graduation ceremony held for the fi rst and second intake of students during October 2008.
• It is important to note that this programme is simultaneously addressing the issues of scarce skills (as previously highlighted) and the Economic Active Population (EAP) fi gures in terms of BEE, and focusing on previously disadvantaged individuals (PDIs).
Future plans
The DAFF will continue to contribute to the programme while looking at other areas of hu-man resources development. There is a serious need to review the R600 000 annual budget transferred to PPECB in order to increase the number of benefi ciaries.

30
ANNEXURE B: 2009/10 IMPLEMENTATION OF THE INTERNSHIP PROGRAMME BY PROVINCIAL DEPARTMENTS OF AGRICULTURE
Background
During the 2009/10 fi nancial year, meetings were held between DAFF and HRD managers from provincial departments to harmonise and rationalise the implementation of the internship programme in the agricultural sector. Issues discussed and agreed upon during these meet-ings included common tools to monitor the progress of interns, the recruitment and selection of interns, a common tracking system for interns who secure employment during their partici-pation in the programme as well as the template that provinces should use to report progress to the DAFF with regard to the implementation of their respective internship programmes.
Summary of benefi ciaries of the 2009/10 internship programme implemented by provincial departments of agriculture
Table 43 below is a summary of benefi ciaries who participated in the internship programme implemented by provincial departments of agriculture during the 2009/10 fi nancial year.
The table above shows that 728 benefi ciaries participated in the internship programme imple-mented by provincial departments of agriculture. Of the 728 benefi ciaries, 337 (46,3%) are males and 391 (53,7%) are females. The highest number of benefi ciaries, 251, was recorded by the Limpopo provincial department. The table further shows that in total, 123 interns se-cured permanent employment. No information was received from the KwaZulu-Natal and Northern Cape provincial departments of agriculture.
TABLE 43 Summary of beneficiaries of the 2009/10 internship implemented by provincial departments of agriculture (n = 728)
Province
Number of benefi ciaries
Tot
al b
enefi
cia
ries
Abso
rbed
into
pro
vinc
ial d
epar
tmen
t
Oth
er g
over
nmen
t dep
artm
ents
Priv
ate
sect
or
Ow
n bu
sine
ss
Tota
l em
ploy
ed
Afric
an
Colo
ured
Indi
an
Whi
te
Tota
l
M F M F M F M F M F
Eastern Cape 85 53 0 0 0 0 0 0 85 53 138 42 4 1 0 47
Gauteng 35 60 1 0 0 1 0 2 36 63 99 20 2 3 0 25
KwaZulu-Natal 0 0 0 0 0 0 0 0 0 0 0 0 0 0 0 0
Free State 16 17 0 0 0 0 0 0 0 0 33 0 1 0 0 1
Cape Town 16 19 14 21 0 0 6 4 36 44 80 4 2 3 0 9
Northern Cape 0 0 0 0 0 0 0 0 0 0 0 0 0 0 0 0
Limpopo 113 138 0 0 0 0 0 0 113 138 251 2 11 6 0 19
North West 28 29 0 1 0 0 0 0 28 30 58 0 0 0 0 0
Mpumalanga 39 63 0 0 0 0 0 0 39 63 102 7 10 5 0 22
Total 332 379 15 22 0 1 6 6 337 391 728 75 30 18 0 123

ISBN 978-1-86871-318-9